Full Terms & Conditions of access and use can be found at http://www.tandfonline.com/action/journalInformation?journalCode=wjly20 Download by: [Arizona State University] Date: 30 October 2015, At: 14:22 Journal of LGBT Youth ISSN: 1936-1653 (Print) 1936-1661 (Online) Journal homepage: http://www.tandfonline.com/loi/wjly20 Attitudes Among University Undergraduates Toward LGB and Five Ethnic/Racial Groups Lynn C. Holley , Nancy C. Larson , Madelaine Adelman & Jesús Treviño To cite this article: Lynn C. Holley , Nancy C. Larson , Madelaine Adelman & Jesús Treviño (2008) Attitudes Among University Undergraduates Toward LGB and Five Ethnic/Racial Groups, Journal of LGBT Youth, 5:1, 79-101 To link to this article: http://dx.doi.org/10.1300/J524v05n01_07 Published online: 12 Oct 2008. Submit your article to this journal Article views: 125 View related articles Citing articles: 5 View citing articles

Welcome message from author
This document is posted to help you gain knowledge. Please leave a comment to let me know what you think about it! Share it to your friends and learn new things together.
Transcript
Full Terms & Conditions of access and use can be found athttp://www.tandfonline.com/action/journalInformation?journalCode=wjly20
Download by: [Arizona State University] Date: 30 October 2015, At: 14:22
Journal of LGBT Youth
ISSN: 1936-1653 (Print) 1936-1661 (Online) Journal homepage: http://www.tandfonline.com/loi/wjly20
Attitudes Among University UndergraduatesToward LGB and Five Ethnic/Racial Groups
Lynn C. Holley , Nancy C. Larson , Madelaine Adelman & Jesús Treviño
To cite this article: Lynn C. Holley , Nancy C. Larson , Madelaine Adelman & Jesús Treviño(2008) Attitudes Among University Undergraduates Toward LGB and Five Ethnic/Racial Groups,Journal of LGBT Youth, 5:1, 79-101
To link to this article: http://dx.doi.org/10.1300/J524v05n01_07
Published online: 12 Oct 2008.
Submit your article to this journal
Article views: 125
View related articles
Citing articles: 5 View citing articles
Attitudes Among University UndergraduatesToward LGB and Five Ethnic/Racial Groups
Lynn C. HolleyNancy C. Larson
Madelaine AdelmanJesús Treviño
ABSTRACT. Three hundred twenty-six undergraduates who participatedin a diversity-based course or voluntary intergroup dialogues com-pleted a written questionnaire about their attitudes toward and com-fort with people who are African American, Asian American, First Nation,Latina/o, white, and lesbian, gay, or bisexual (LGB). Secondary analysis ofquantitative items revealed that students were significantly more likelyto report greater discomfort with and more negative attitudes towardLGB individuals than toward the specified ethnic/racial groups. Respon-dents’ gender, ethnic/racial, sexual orientation, and religious differenceswere correlated with attitudes and comfort. [Article copies available for a feefrom The Haworth Document Delivery Service: 1-800-HAWORTH. E-mail address:
Lynn C. Holley is Associate Professor and BSW Program Coordinator in the Schoolof Social Work at Arizona State University (E-mail: [email protected]). She has a PhDin Social Welfare from the University of Washington.
Nancy C. Larson is an Associate Research Social Scientist in the Southwest Insti-tute for Research on Women at the University of Arizona. She has a PhD in Social Wel-fare from the University of Washington.
Madelaine Adelman is Associate Professor in the School of Justice & Social Inquiryat Arizona State University and a co-founder and co-chair of the Phoenix Chapter ofthe Gay, Lesbian & Straight Education Network. She has a PhD in Cultural Anthropol-ogy from Duke University.
Jesús Treviño is the Associate Provost for Multicultural Excellence at the Univer-sity of Denver. He has a PhD in Higher Education from the University of California atLos Angeles.
The authors thank the students who participated in this study; Rudelania Santana,MSW, for her assistance in gathering data; and course instructors and dialogue leadersfor allowing students the option of participating in this study.
Journal of LGBT Youth, Vol. 5(1) 2007Available online at http://jly.haworthpress.com
© 2007 by The Haworth Press. All rights reserved.doi:10.1300/J524v05n01_07 79
Dow
nloa
ded
by [
Ari
zona
Sta
te U
nive
rsity
] at
14:
22 3
0 O
ctob
er 2
015
<[email protected]> Website: <http://www.HaworthPress.com>© 2007 by The Haworth Press. All rights reserved.]
KEYWORDS. Campus climate, heterosexism, higher education, ho-mophobia, intergroup relations, multicultural education, racism, studentattitudes
Ideally, university campuses would allow and encourage studentsfrom diverse social groups–both dominant and subordinated–to interactacross differences. Such positive interactions would create a thrivinglearning community, exposing students to a wide range of perspectives,worldviews, and experiences.
Unfortunately, research demonstrates that cross-group interactionsmay be rare or negative and that students who are lesbian, gay, bisex-ual, or transgender (LGBT1) and/or of color often report hostile cam-pus climates (e.g., Ancis, Sedlacek, & Mohr, 2000; Brown, Clarke,Gortmaker, & Robinson-Kelig, 2004; Rankin, 2003). Understandingvariations in student attitudes toward members of these social groupscan help us develop strategies to confront existing negative attitudesand develop opportunities to improve interactions and the overall cam-pus climate. Most studies in this area, however, have focused on explor-ing the attitudes of students toward groups distinguished by only onetype of diversity (such as racial or ethnic diversity, or sexual orientationdiversity). Understanding variations in attitudes–which subgroups ofstudents hold which attitudes toward which groups–will allow campusleaders to focus limited resources on groups of students who evidentlyare most in need of attitudinal changes in each area.
LITERATURE REVIEW
Ethnic/Racial Campus Climate
Research about the ethnic/racial climate on campus often focuses ontwo areas: students’ perceptions of the racial climate and the extent ofcross-group interactions. During the past two decades, researchers havefound that students of color are more likely than white students to per-ceive their university as non-supportive of students of color or to reporthigher levels of racial tension and discrimination (Ancis, Sedlacek, &
80 JOURNAL OF LGBT YOUTH
Dow
nloa
ded
by [
Ari
zona
Sta
te U
nive
rsity
] at
14:
22 3
0 O
ctob
er 2
015
Mohr, 2000; Hurtado, 1992; McClelland & Auster, 1990), althoughwhite women are more likely than their male counterparts to perceiveracial tension (Hurtado, 1992). One study, however, found no differ-ence between white and Black students’ perceptions about the racialclimate (Cureton, 2003).
Students from different communities of color have been found tohave varying perceptions of the levels of racial tension on campus(Ancis, Sedlacek, & Mohr, 2000; Cabrera & Nora, 1994). For example,African American students reported experiencing more discriminatoryincidents than did Latina/o, Asian, or white students (Suarez-Balcazar,Orellana-Damacela, Portillo, Rowan, & Andrews-Guillen, 2003). Dif-ferences may be due to the effects of ethnicity-specific stereotypes. Forexample, white students have been found to stereotype African Ameri-cans as rebellious and angry, Latinas/os as uneducated and less patri-otic, and Asian Americans as self-disciplined and reserved (Jackson etal., 1996). Others have suggested that variations in perceptions of dis-crimination may be related to the percentage of specific communities ofcolor on the campus (Ancis, Sedlacek, & Mohr, 2000; Hurtado, 1992).That is, as the percentage of students from a particular subordinated eth-nic/racial group increases, students from the larger community of colorperceive increased racial tension.
Research also indicates white students have less comfort than stu-dents of color in interacting with members of other ethnic/racial groups(Ancis, Sedlacek, & Mohr, 2000). They also participate in less cross-ra-cial interaction with their college peers than do students of color(Chang, Astin, & Kim, 2004; Hu & Kuh, 2003; McClelland & Auster,1990). Further, as with perceptions of the racial climate, white students’attitudes about cross-group interactions vary by the ethnic/racial groupsinvolved, with one study finding that white students were willing tohave closer social distance with Asian Americans than with HispanicAmericans or Black Americans (Ancis, Sedlacek, & Mohr, 2000;McClelland & Auster, 1990). In other words, students are neither simi-larly accepting nor rejecting of groups of which they are not members.A search of the literature did not reveal any recent research exploringwhether religion or sexual orientation affect student attitudes towarddifferent ethnic/racial groups.
LGBT Campus Climate
Research on LGBT campus climate centers primarily on LGBTperspectives on the climate and heterosexual student attitudes toward
Holley et al. 81
Dow
nloa
ded
by [
Ari
zona
Sta
te U
nive
rsity
] at
14:
22 3
0 O
ctob
er 2
015
LGBT people. The former indicates a campus climate structured byheterosexism and homophobia. LGBT students describe barriers tohigher education and individual development, including the fear of beingouted, isolation, verbal harassment, and physical violence (Howard &Stevens, 2000). In a survey of 1,669 LGBT-identified students, faculty,and staff/administrators at 14 universities that had LGBT-focused ini-tiatives, 20 percent of all respondents feared for their physical safety be-cause of their sexual orientation or gender identity. Further, one out oftwo concealed their sexual orientation or gender identity to avoid intim-idation, with LGBT people of color more likely than white LGBT peo-ple to do so (Evans & Broido, 2002; Rankin, 2003).
Not surprisingly, LGBT students perceive the campus climate asmore negative than do their heterosexual peers (Brown, Clarke,Gortmaker, & Robinson-Keilig, 2004; Waldo, 1998) while heterosex-ual students express little concern about this aspect of campus life. Onestudy found that students rated being comfortable with “various sexualorientations” in the classroom as being of low importance (Willett,2002). Students in this study also ranked sexual orientation at the bot-tom of their list of important campus concerns.
Researchers have investigated whether gender, ethnicity, and reli-gion affect attitudes toward LGB people. Studies consistently reportthat heterosexual women possess less intense negative attitudes towardLGB people than do heterosexual men (Herek, 2002; Hinrichs &Rosenberg, 2002; Hopwood & Connors, 2002; Johnson, Brems, & Al-ford-Keating, 1997). A study of social work and counseling graduatestudents found that students who identified with conservative Christianreligions held the most negative attitudes toward LGB people and thatwomen, whites, and those who were Jewish or claimed no religiousidentity were more accepting (Newman, Dannenfelser, & Benishek,2002). Herek (2002) found that white heterosexual women had lessnegative attitudes toward LGB people than did white men and womenand men of color. Another study found that undergraduates of colorwere more supportive than their white peers of policies that affirm LGBstudents and were more open than whites to interpersonal contact withLGB students, but that Asian American and international graduate stu-dents were less open than their U.S.-born white peers to personal inter-action with LGB students (Waldo, 1998). This same study found thatChristian and male undergraduates were less open to such contact thannon-Christian and female undergraduates. In sum, researchers haveconsistently found that men and Christians, particularly conservativeChristians or those who score higher on religiosity measures, are likely
82 JOURNAL OF LGBT YOUTH
Dow
nloa
ded
by [
Ari
zona
Sta
te U
nive
rsity
] at
14:
22 3
0 O
ctob
er 2
015

to have more negative attitudes toward LGBT people, while findingsregarding the impact of ethnicity on such attitudes are inconsistent.
Studies About Racism and Heterosexism
Standing at the intersection of these two areas of campus climate re-search are studies that address both ethnic/racial attitudes and sexualorientation attitudes. Data collected from a predominantly white,church-related college suggest that women are more likely than men toaccept both people of color and lesbians and gay men (Qualls, Cox, &Schehr, 1992). This study also found that students who were prejudicedtoward people of color also were likely to accept anti-homosexual state-ments. Because different instruments were used to measure racial andsexual orientation attitudes, this study was not able to directly comparethe levels of attitudes toward people of color and lesbians and gay men.
In another study, over a third of white heterosexual undergraduatenursing students at a major Midwestern university reported that theywould be uncomfortable working with LGB individuals, compared to3 percent to 6 percent who reported discomfort in working with mem-bers of a variety of different ethnic groups (Eliason & Raheim, 2000).This study had the advantage of using identical questionnaire items toassess attitudes toward a range of subordinated groups, but measured at-titudes with only one question rather than with a scale.
Thus, LGBT students and students of color perceive a more hostilecampus environment than do their heterosexual and white peers. Someresearch has found intergroup differences in attitudes, but few haveexamined both sexual orientation and ethnic/racial attitudes. Further,no identified studies have used attitude scales that allow comparisonof attitudes regarding both sexual orientation and ethnicity/race. Thisstudy seeks to address this gap in the literature. What is the relation-ship, if any, between students’ attitudes toward LGB people and towardvarious communities of color and whites?
METHOD
Context
Data were gathered during Spring of 2001 at a large public universityin a metropolitan area in the U.S. Southwest. This institution is situatedwithin a state that is politically conservative, has no statewide civil
Holley et al. 83
Dow
nloa
ded
by [
Ari
zona
Sta
te U
nive
rsity
] at
14:
22 3
0 O
ctob
er 2
015
rights protections for LGBT people, and is the scene of vocal anti-immi-grant sentiment that focuses on Latina/os. Ethnic/racial composition ofstudents during Fall 2001 was approximately 69 percent white, 10 per-cent Latina/o, 4.7 percent Asian American, 3.0 percent African Ameri-can, 2.1 percent First Nations, 7.3 percent “nonresident alien,” and 3.5percent unknown; approximately 53 percent were women. Statistics re-garding the sexual orientation composition of the student body are notavailable.
The campus has multiple diversity initiatives. One of the most visibleprograms is the Center for Positive Intergroup Relations2 (CPIR),which offers a comprehensive, fully-staffed and funded, action-ori-ented center created to work with faculty, staff, and students on improv-ing intergroup relations and the campus climate for diversity. CPIRworks on issues related to ethnicity/race, sexual orientation, gender, na-tionality, disability status, religion, socioeconomic status, and other di-mensions of diversity. Staff works in a number of areas includingintergroup relations training, education, and research.
Sample Recruitment and Procedure
This study took advantage of existing data from a larger researchproject addressing the effectiveness of intergroup relations training on auniversity campus to assess attitudes among university undergraduatestoward diverse groups. The sample consisted of 326 undergraduateswho were engaged either in courses that focused on diversity or aCPIR-sponsored structured intergroup dialogue program. The diver-sity-focused courses fulfilled a general studies requirement and were re-quired for certain majors; participation in the dialogue groups wasvoluntary, with students receiving credit in required or elective coursesfor participating. Study participants completed questionnaires at the be-ginning of the course or dialogue program. All data used in this analysiswere derived from this questionnaire.
One hundred thirty-four (41.1%) students in this sample were in-volved in the CPIR. The remaining 192 (58.9%) students were enrolledin four communication courses or one education course. Participatingstudents received course credit for their involvement in the study. Fol-lowing IRB requirements, students were assured that their instructors ordialogue leaders would not know how they responded to the question-naires. All students in the CPIR program participated in this study; be-cause course enrollment numbers were not available to the researchers,
84 JOURNAL OF LGBT YOUTH
Dow
nloa
ded
by [
Ari
zona
Sta
te U
nive
rsity
] at
14:
22 3
0 O
ctob
er 2
015

the participation rate of students from the courses is not known, thoughit is assumed to be high due to the availability of course credit.
Measures
Demographic Variables. Questionnaire items regarding student gen-der, year in school, religion, sexual orientation, and ethnicity/race wereused for this study. Students chose either female or male for gender.3Year in school options were first year student, sophomore, junior, or se-nior. Students filled in blanks on the questionnaire for religion and sex-ual orientation. Open-ended responses for religion fell into threecategories: Christian, Other Religion (e.g., Jewish, Muslim, Buddhist),and No Religious Affiliation. Dummy coding was completed for the re-gression analysis with No Religious Affiliation as the reference cate-gory. Due to the small number of students identifying as LGB, sexualorientation was coded into two categories: heterosexual and LGB. Het-erosexual was coded as 0 and LGB as 1.
Students were asked to select as many ethnic/racial origin categoriesas applied from a list of seven: Asian/Asian American, Pacific Islander,African American/Black, Latino/Hispanic, Native American/AmericanIndian/Indigenous, White/Euro-American, and Other.4 To create mutu-ally exclusive categories suitable for regression analyses, dummy vari-ables representing each ethnic/racial group were constructed. Whenstudents indicated that they were members of one community of color inaddition to being White, they were included in that category but not inthe White category. Students who indicated that they were members oftwo (n = 5) or more (n = 2) communities of color and those who chosePacific Islander only (n = 3) were included in a category entitled OtherEthnicity. The White group was the reference group for these analyses.
Attitudes Toward and Degree of Comfort with Diverse Groups. Orig-inal scales developed for the larger evaluation study were used to assessstudents’ attitudes toward and degree of comfort with members of sixsocial groups. Eight items were included in each scale (see Appendix 1).To assess comfort, four of the items asked students to indicate howthey would feel when interacting with members of a particular group(e.g. LGB individuals; African Americans; whites) whom they did notknow. The second four items focused on attitudes toward the samegroups. Response choices for both comfort and attitude were on aLikert-type scale of 1 to 5, with a higher score indicating greater dis-comfort and more negative attitudes. Possible scores on each additivescale ranged from 8 to 40, with a higher score indicating more negative
Holley et al. 85
Dow
nloa
ded
by [
Ari
zona
Sta
te U
nive
rsity
] at
14:
22 3
0 O
ctob
er 2
015
attitudes toward and less comfort with members of that group. The va-lidity of these scales in measuring the constructs of interest is notknown, as they have not been used previously in research. Alpha coeffi-cients for the scales ranged from .86 to .89, however, suggesting a highdegree of internal consistency in the scales.
Data Analysis. The data analysis plan was exploratory in nature, de-signed to assess similarities and differences in student responses regard-ing six social groups. Frequencies and distributions of all variables werefirst assessed to test assumptions of normality. Chi-square analyses in-dicated no differences between dialogue students and non-dialogue stu-dents in sexual orientation or religion, but students in the dialoguegroups were more likely than non-dialogue students to be of color (X2 =5.53, df = 1, p < .05) or to be women (X2 = 4.58, df = 1, p < .05). Despitethese two demographic differences, however, t-tests revealed no signif-icant differences between dialogue and non-dialogue students in scoreson the dependent variables and so students from these two groups werecombined for all future analyses. Crosstabs assessing differences be-tween ethnic groups by gender, sexual orientation, and religion were an-alyzed prior to implementing any tests of difference. Paired t-tests thenwere completed to assess differences in mean scores of the sample oneach scale. Correlations between the scores on the scales were analyzedprior to conducting ordinary least squares (OLS) regression for eachscale individually. Statistical Package for the Social Sciences (SPSS)was used for all analyses.
Limitations
Several limitations are important to consider. First, use of a conve-nience sample that was drawn from only one university and included ahigher proportion of women and of whites than does the campus popu-lation prevents generalization. It is possible, though, that the findingsreflect attitudes of other students who are engaged in programs orcourses that focus on ethnic diversity at large, public, predominantlywhite institutions. Second, the study was conducted in one university ina politically conservative southwestern state and may not reflect theattitudes of students in other contexts.
Third, the small number of LGB students prevented analysis of dif-ferences in attitudes and comfort among LGB students who were mem-bers of specific communities of color. That is, we were not able toexamine whether there were different attitudes among LGB studentswho identified as white, Asian American, or African American. Fourth,
86 JOURNAL OF LGBT YOUTH
Dow
nloa
ded
by [
Ari
zona
Sta
te U
nive
rsity
] at
14:
22 3
0 O
ctob
er 2
015

the attitude/comfort scales have not been psychometrically tested, al-though they had high internal consistency.
Lastly, although the questionnaire was anonymous, some studentslikely gave socially desirable responses. If this is the case, then our find-ings do not necessarily mean that students are less racist than they areheterosexist. Instead, it means that acknowledging heterosexism ismore socially acceptable than is acknowledging racism. Further, partic-ipants were in diversity-focused courses that fulfilled a general studiesrequirement or had volunteered for a CPIR-sponsored structured inter-group dialogue program. This characteristic of the sample may have in-tensified participant interest in supplying socially-desirable responsesregarding race/ethnicity which all the more demonstrates the higheracceptability of acknowledging heterosexism.
RESULTS
Sample Description
The majority of the 326 participants were female (n = 217, 67%) (seeTable 1). Nearly all study participants (91%) reported sexual orientationas heterosexual, consistent with multiple studies indicating the proportionof heterosexuals within the larger society. Students were relativelyevenly distributed by year in higher education, although more students re-ported being first year (26%) than seniors (14%). The majority of stu-dents (74%) reported that they were Christian. Almost three-fourths ofthe sample (n = 235, 72.1%) were in the White ethnic/racial category; 29(8.9%) were in the Latina/o, 28 (8.6%) in the Asian American, 15 (4.6%)in the African American, 9 (2.8%) in the First Nations, and 10 (3.1%) inthe Other Ethnicity categories. The sample comprised a higher percent-age of women and of whites than does the campus as a whole.
The crosstab analysis revealed most ethnic/racial groups to be similarwith regard to gender and sexual orientation. Asian Americans, how-ever, were significantly more likely to be male and to identify with anOther Religion (e.g., Buddhism, Islam, Hindu), as opposed to No Reli-gious Affiliation, than whites. They also were significantly less likely toreport being Christian, in comparison to No Religious Affiliation, thanwere whites. Latina/o students were significantly more likely than whitestudents to report Christianity rather than No Religious Affiliation.Other Ethnicity students were more likely to report an Other Religion,rather than No Religious Affiliation, than were whites.
Holley et al. 87
Dow
nloa
ded
by [
Ari
zona
Sta
te U
nive
rsity
] at
14:
22 3
0 O
ctob
er 2
015

88 JOURNAL OF LGBT YOUTH
TABLE 1. Demographic Characteristics of the Sample
Dow
nloa
ded
by [
Ari
zona
Sta
te U
nive
rsity
] at
14:
22 3
0 O
ctob
er 2
015
There also were apparent differences between LGB and heterosexualstudents. The LGB group was closely divided by gender (56% female),whereas the heterosexual group was predominately female (67%). Alarger percentage of the LGB students reported No Religious Affiliation(24% vs. 14%) and a smaller percentage was Christian than the hetero-sexual group (65% vs. 76%). A larger percentage of LGB than hetero-sexual students reported being Asian American (18% vs. 7%) orAfrican American (12% vs. 4%), while a smaller percentage reportedbeing white (71% vs. 95%). There were no reported LGB Latina/o, FirstNations, or Other Ethnicity students in the sample.
Scale Correlations
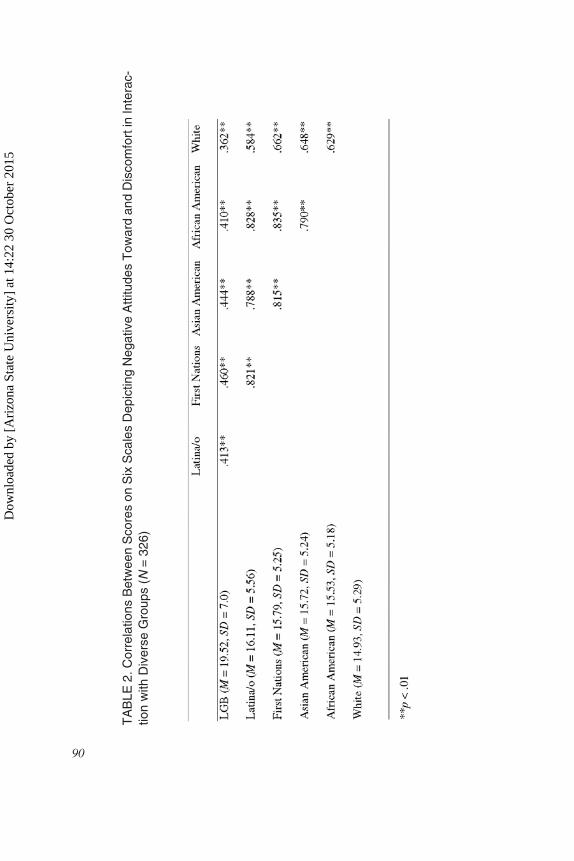
All correlations between scores on the six scales depicting negativeattitudes toward and discomfort in interaction with diverse groups weresignificant (see Table 2). The strength of the relationships betweenscores on the LGB scale and the scales regarding ethnic/racial groups(mean correlation = .418), however, was less than the strength of rela-tionships between the ethnic/racial scales (mean correlation = .740). Achi-square analysis revealed that gender, ethnicity, religion, and sexualorientation all had significant relationships with at least one of the sixscales. Year in school did not have a significant correlation with any ofthe six scales and thus was dropped from further analyses.
Mean Differences on Scales
The mean score on the LGB scale was over three points higher thanthe mean of the other five scales, indicating that the sample as a wholereported more negative attitudes toward and discomfort with LGB indi-viduals than any other identified group (see Table 3). In addition, thestandard deviation on the LGB scale was greater than any other scale:7.0 versus all others between 5.17 and 5.56. Indeed, the range of scoreson the LGB scale was 8-40, with 40 indicating the most negative re-sponses. Other scales had ranges of 8 to 33 (African American), 8 to 32(Latina/o), 8 to 30 (First Nations and white), and 8 to 29 (Asian Ameri-can).
Further, paired t-tests revealed that students reported significantlymore negative attitudes toward and greater discomfort with peoplewho are LGB than any other identified group (see Table 3). Studentsreported greater discomfort with and more negative attitudes towardLatina/os than toward African Americans. Students also reported sig-nificantly less negative attitudes toward and discomfort with whites
Holley et al. 89
Dow
nloa
ded
by [
Ari
zona
Sta
te U
nive
rsity
] at
14:
22 3
0 O
ctob
er 2
015
TA
BLE
2.C
orre
latio
nsB
etw
een
Sco
res
onS
ixS
cale
sD
epic
ting
Neg
ativ
eA
ttitu
des
Tow
ard
and
Dis
com
fort
inIn
tera
c-tio
nw
ithD
iver
seG
roup
s(N
=32
6)
90
Dow
nloa
ded
by [
Ari
zona
Sta
te U
nive
rsity
] at
14:
22 3
0 O
ctob
er 2
015
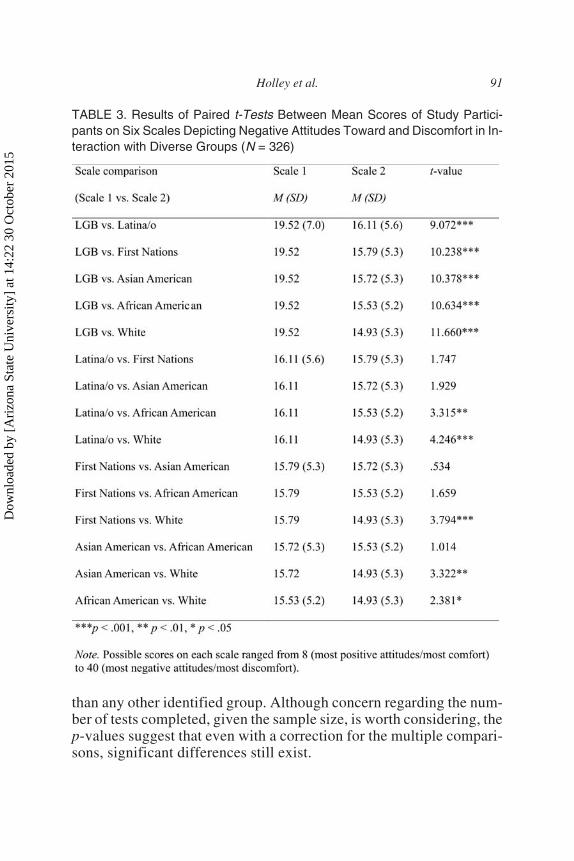
than any other identified group. Although concern regarding the num-ber of tests completed, given the sample size, is worth considering, thep-values suggest that even with a correction for the multiple compari-sons, significant differences still exist.
Holley et al. 91
TABLE 3. Results of Paired t-Tests Between Mean Scores of Study Partici-pants on Six Scales Depicting Negative Attitudes Toward and Discomfort in In-teraction with Diverse Groups (N = 326)
Dow
nloa
ded
by [
Ari
zona
Sta
te U
nive
rsity
] at
14:
22 3
0 O
ctob
er 2
015
Predictors of Attitudes and Comfort
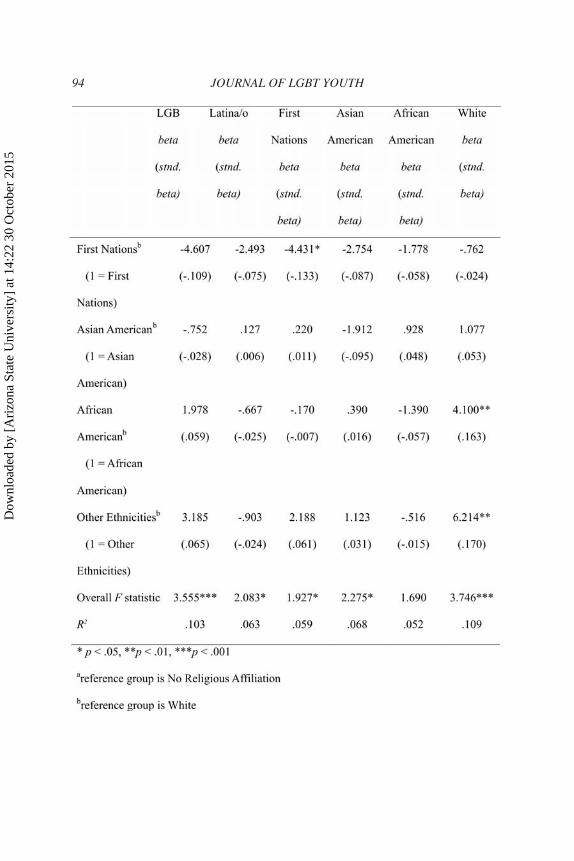
The scores on each of the six scales were regressed onto gender, sex-ual orientation, religion, and ethnicity/race. These four variables wereentered into the OLS regression on the same step (see Table 4). Overallregression models were significant for each scale except for the modelpredicting attitudes/comfort regarding African Americans (F = 1.690,df = 9, p = .09).
LGB Scale. Characteristics associated with an increase in discom-fort with and negative attitudes toward LGB individuals included be-ing male (t = 4.431, p < .000) and being Christian rather thanreporting No Religious Affiliation (t = 2.172, p < .05). The amount ofvariance accounted for by the identified factors in the model as awhole was .103. Identifying as LGB in this sample was not associ-ated with less negative attitudes toward and discomfort with LGB in-dividuals.
Latina/o Scale. Only six percent of the variance on the Latina/o scalewas accounted for by the included variables (R2 = .063). The only sig-nificant predictor was identifying as Latina/o (t = �2.571, p = .01). Com-pared to whites, those who identified as Latina/o had less negativeattitudes toward and discomfort with Latina/os.
First Nations Scale. Little variance was accounted for by the inde-pendent variables (R2 = .059) in predicting scores on this scale. Com-pared to whites, First Nations students had less negative attitudestoward and discomfort with other First Nations individuals (t = �2.278,p < .05). In addition, identifying as LGB in this sample was associatedwith more negative attitudes toward and discomfort with First Nationsindividuals (t = 2.013, p < .05).
Asian American Scale. Seven percent of the variance on this scale (R2 =.068) was accounted for by factors in the equation. Both gender (t =2.098, p < .05) and sexual orientation (t = 2.711, p < .01) were signifi-cant predictors in the model. Being male or LGB was associated withhaving more negative attitudes toward and discomfort with AsianAmericans.
White Scale. Nearly 11 percent of the variance in scores on this scalewas accounted for by the independent variables (R2 = .109). Comparedto whites, African Americans (t = 2.833, p < .01) and Other Ethnicitystudents (t = 2.870, p < .01) had more negative attitudes toward and dis-comfort with whites.
92 JOURNAL OF LGBT YOUTH
Dow
nloa
ded
by [
Ari
zona
Sta
te U
nive
rsity
] at
14:
22 3
0 O
ctob
er 2
015

Holley et al. 93
TABLE 4. Regressions on Six Scales Regarding Negative Attitudes Towardand Degree of Discomfort with Diverse Groups (N = 326)
Dow
nloa
ded
by [
Ari
zona
Sta
te U
nive
rsity
] at
14:
22 3
0 O
ctob
er 2
015
94 JOURNAL OF LGBT YOUTH
Dow
nloa
ded
by [
Ari
zona
Sta
te U
nive
rsity
] at
14:
22 3
0 O
ctob
er 2
015

DISCUSSION
This study found that when comparable scales were used to measureattitudes toward LGB people and toward members of five ethnic/racialgroups, attitudes toward the six specified groups were correlated. Still,students reported significantly higher levels of negative attitudes to-ward and discomfort with LGB individuals than toward any of the spec-ified ethnic/racial groups. In addition, attitudes toward Latinas/os weresignificantly more negative than those toward African Americans. Fur-ther, attitudes toward some groups appear to be influenced by gender,religion, sexual orientation, and ethnicity.
The finding that there were significant correlations among the meanson all six attitude/comfort scales is consistent with that of Qualls, Cox,and Schehr (1992) and suggests the presence of an underlying constructthat leads to comfort with and positive attitudes toward multiple socialgroups. That is, it appears that common factors may contribute to bothracist and heterosexist attitudes.
Results of the t-tests, however, indicate that students are willing to ar-ticulate more oppressive attitudes toward LGB people than toward the eth-nic groups addressed in this study. This finding reinforces that of Eliasonand Raheim (2000) and suggests that in contrast to negative attitudes to-ward communities of color, negative attitudes toward LGB people con-tinue to be evidenced among students in this sample. It is important toconsider that the nature of our sample may have influenced this finding.That is, all courses and most of the intergroup dialogues from which thesample was drawn focused on ethnic issues or interethnic relations. Thus,the sample may have comprised students who had relatively positive atti-tudes and comfort regarding people of color, but not LGB people.
Men and Christians in our sample had more negative attitudes towardand discomfort with LGB people than did women and those with no re-ligious affiliation. This finding is not surprising in light of previouslycited research and widespread socio-cultural-level heterosexist reli-gious and political discourse. Although some studies have found ethnicdifferences in attitudes toward LGB people (Herek, 2002; Newman etal., 2002; Waldo, 1998), we found no such differences.
Attitudes toward and comfort with Latina/os, the largest communityof color on the campus and in the state, were significantly more negativethan those regarding African Americans. This finding may reflect theinfluence of stereotypes (Jackson et al., 1996), indicates that student at-titudes about cross-group interactions vary by the ethnic/racial groupsinvolved (Ancis Sedlacek, & Mohr, 2000; McClelland & Auster, 1990),
Holley et al. 95
Dow
nloa
ded
by [
Ari
zona
Sta
te U
nive
rsity
] at
14:
22 3
0 O
ctob
er 2
015
and lends support to the premise that as a specific community of colorincreases in number, the racial climate becomes more hostile for mem-bers of that ethnic group (Ancis, Sedlacek, & Mohr, 2000; Hurtado,1992). This finding also may indicate the strong socio-cultural impactof the state’s anti-immigrant sentiment, as these attitudes becomegeneralized on this campus to encompass all Latina/os.
Because this sample was almost three-fourths white, the fact thatscores on the White attitude/comfort scale were the most positivesuggests that whites are most comfortable with and have the mostpositive attitudes toward members of their own racial group (Ancis,Sedlacek, & Mohr, 2000). Similarly, other ethnic groups had lessnegative attitudes toward and discomfort with others within theirown ethnic groups. Those who identified as LGB, however, werenot more likely to express less negative attitudes toward and dis-comfort with LGB individuals.
Our finding that African American and Other Ethnicity studentsheld more negative attitudes/comfort regarding whites is particularlyinteresting because being white did not predict more negative atti-tudes toward or discomfort with African Americans. Taken together,these two findings may be interpreted in at least two ways. First, Af-rican American students may not be experiencing a hostile racialcampus climate, but rather are referring to other interactions withwhites. Second, despite their responses in this study, whites may ac-tually behave in racist ways that lead African American and OtherEthnicity students to not trust them. If this latter interpretation is ac-curate, then whites either are unaware of their racist attitudes anddiscomfort or they perceive that it is not socially desirable to ac-knowledge them.
Our finding that mean scores on the LGB scale and on the Whitescale were significantly different from those on each of the other eth-nic/racial scales suggest the presence of a campus climate that is friend-liest for white heterosexual students. Because we do not have datadescribing students’ attitudes upon entry into the university, we cannotknow if their attitudes changed–for better or worse–during their time oncampus. It is clear, however, that the campus reflects a white hetero-normative world view.
Finally, the two findings that (1) Latina/os and First Nations studentshad significantly more positive attitudes/comfort with their own ethnicgroups and (2) scale scores on the Latina/o and First Nations scaleswere the most negative of all ethnic scales may suggest that in the face
96 JOURNAL OF LGBT YOUTH
Dow
nloa
ded
by [
Ari
zona
Sta
te U
nive
rsity
] at
14:
22 3
0 O
ctob
er 2
015
of a hostile campus climate, intragroup interactions are welcomed bythese students.
Implications for Campuses
Because all students must attend classes whether or not they partici-pate in other campus-based activities, the formal curriculum must bebroadened to incorporate issues related to multiple forms of diversityand oppression, including those related to LGBT communities. Coursesfocused on ethnic diversity need to include information about LGBTpeople of color, as do courses on LGBT issues (see Sears, 1995). Suchcontent will allow students to learn about within-group diversity, under-stand the experiences of those who experience both heterosexism andracism, and consider ways to address both of these forms of oppression.Based on our finding that there appears to be an underlying constructthat leads to comfort with and positive attitudes toward a range of socialgroups, courses that address multiple forms of oppression (e.g., thosebased on social class, [dis]ability, nationality, religion) and examine theintersections of oppressions also are needed. Such courses might allowuniversities to use limited resources in ways that address factors thatcontribute to the development and maintenance of prejudice towardmultiple subordinated groups.
It is critical that institutional supports are available for studentsfrom socially subordinated groups. Our findings suggest that on thiscampus affinity groups might be particularly important for LGB,Latina/o, First Nations, African American, and multiethnic students,though such groups also are vital for students from other subordi-nated social groups. Many models of structural-level interventionsthat specifically address LGBT concerns are described in the litera-ture and hold promise for addressing the negative attitudes and com-fort reported among students in this sample (Athanases & Larrabee,2003; Evans, 2002).
In addition, co-curricular programs that provide opportunities forstructured interaction among groups, focusing on relations betweenLGB and heterosexual students, also can address both psychologicaland behavioral dimensions. These intergroup interactions could lead tointergroup coalitions that hold promise for addressing oppression oncampus. Although our data lead us to focus here on programs that mayincrease positive intergroup interactions among students who are ofcolor, white, LGB, and heterosexual, our finding that comfort with andattitudes toward various groups are correlated suggests the need for pro-
Holley et al. 97
Dow
nloa
ded
by [
Ari
zona
Sta
te U
nive
rsity
] at
14:
22 3
0 O
ctob
er 2
015

grams that focus on encouraging intergroup interactions amongstudents who differ across a range of social identities.
Implications for Research
Further research is needed to address limitations of this study andbuild on its findings. First, larger, representative samples that includestudents from different types of campuses, different regions of thecountry, and larger numbers from each ethnic and sexual orientationgroup would allow for examination of the influence of specific intersec-tions of diversity (e.g., gender X ethnicity).
Second, instruments that include items measuring study participants’(1) gender role identity, social class, (dis)ability status, country of ori-gin and generational status, and type and extent of religious participa-tion and that include a Transgender response option for gender; (2)perceptions of peers’ attitudes regarding various groups; and (3) atti-tude/comfort related to people with disabilities, people from diverse so-cial classes, and so forth would expand our understanding about factorsassociated with attitudes and comfort toward social groups.
Studies also are needed to illuminate the relationship between atti-tude/comfort and behavior. Further, in-depth interviews and participantobservation or ethnography might be used to learn about the sources ofmessages about different social groups. Finally, longitudinal studieswill allow us to examine changes in attitudes/comfort over time whileintervention research will help us understand whether certain types offormal and informal intergroup interaction are more effective than oth-ers. Students in this study who chose to enter the dialogue program werenot significantly different on the dependent variables from students whoenrolled in diversity-focused courses. If similar students participate inboth types of interventions, then outcome studies could compare stu-dent changes following participation in these two types of intervention.Findings from such comparative studies can inform approaches to im-proving campus climates.
NOTES
1. The majority of the literature invokes the term “LGBT” but rarely investigatesthe experiences or perceptions of transgender people. Because our data focus on LGBindividuals, we employ the term “LGB” to discuss our own research.
2. The Center for Positive Intergroup Relations is a fictitious name to protect theconfidentiality of the university.
98 JOURNAL OF LGBT YOUTH
Dow
nloa
ded
by [
Ari
zona
Sta
te U
nive
rsity
] at
14:
22 3
0 O
ctob
er 2
015
3. The authors recognize that the configuration of this question precluded adequateresponses for transgender persons.
4. For the sake of simplicity in reporting findings about students who identified asAsian/Asian American, African American/Black, and White/Euro-American, wehenceforth use the terms Asian American, African American, and White when refer-ring to these groups. In recognition of multiple critiques of the terms Hispanic, NativeAmerican, and American Indian (Gutierrez, 1997; Yellow Bird, 1999), we henceforthuse the terms Latina/o and First Nations when referring to these groups.
REFERENCES
Ancis, J., Sedlacek, W., & Mohr, J. (2000). Student perceptions of campus cultural cli-mate by race. Journal of Counseling & Development, 78(2), 180-185.
Athanases, S., & Larrabee, T. (2003). Toward a consistent stance in teaching for eq-uity: Learning to advocate for lesbian- and gay-identified youth. Teaching andTeacher Education, 19(2), 237-261.
Brown, R., Clarke, B., Gortmaker, V., & Robinson-Keilig, R. (2004). Assessing thecampus climate for gay, lesbian, bisexual, and transgender (LGBT) students using amultiple perspectives approach. Journal of College Student Development, 45(1),8-26.
Cabrera, A., & Nora, A. (1994). College students’ perceptions of prejudice and dis-crimination and their feelings of alienation. Review of Education, Pedagogy, andCultural Studies, 16, 387-409.
Chang, M., Astin, A., & Kim, D. (2004). Cross-racial interaction among undergradu-ates: Some consequences, causes, and patterns. Research in Higher Education, 45,529-553.
Cureton, S. (2003). Race-specific college student experiences on a predominantlywhite campus. Journal of Black Studies, 33(3), 295-311.
Eliason, M., & Raheim, S. (2000). Experiences and comfort with culturally diversegroups in undergraduate pre-nursing students. Journal of Nursing Education, 39(4),161-165.
Evans, N. (2002). The impact of an LGBT Safe Zone Project on campus climate. Jour-nal of College Student Development, 43(4), 522-539.
Evans, N., & Broido, E. (2002). The experiences of lesbian and bisexual women in col-lege residence halls: Implications for addressing homophobia and heterosexism.Journal of Lesbian Studies, 6, 29-42.
Gutierrez, D. (1997). Ethnic labels, Latino lives: Identity and the politics of (re)presen-tation in the United States. Journal of American Ethnic History, 17(1), 99-101.
Herek, G. (2002). Heterosexuals’ attitudes toward bisexual men and women in theUnited States. Journal of Sex Research, 39(4), 264-274.
Hinrichs, D., & Rosenberg, P. (2002). Attitudes toward gay, lesbian and bisexual per-sons among heterosexual liberal arts college students. Journal of Homosexuality,43(1), 61-84.
Hopwood, M., & Connors, J. (2002). Heterosexual attitudes to homosexuality: Homo-phobia at a rural Australian university. Journal of Gay and Lesbian Social Services:Issues in Practice, Policy and Research, 14(2), 79-94.
Holley et al. 99
Dow
nloa
ded
by [
Ari
zona
Sta
te U
nive
rsity
] at
14:
22 3
0 O
ctob
er 2
015

Howard, K., & Stevens, A. (Eds.). (2000). Out and about on campus: Personal ac-counts by lesbian, gay, bisexual & transgendered college students. Boston, MA:Alyson.
Hu, S., & Kuh, G. (2003). Diversity experiences and college student learning and per-sonal development. Journal of College Student Development, 44(3), 320-334.
Hurtado, S. (1992). The campus racial climate: Contexts of conflict. Journal of HigherEducation, 63(5), 539-569.
Jackson, L., Hodge, C., Gerard, D., Ingram, J., Ervin, K., & Sheppard, L. (1996). Cog-nition, affect, and behavior in the prediction of group attitudes. Personality and So-cial Psychology Bulletin, 22, 306-316.
Johnson, M., Brems, C., & Alford-Keating, P. (1997). Personality correlates of homo-phobia. Journal of Homosexuality, 34(1), 57-69.
McClelland, K., & Auster, C. (1990). Public platitudes and hidden tensions: Racial cli-mates at a predominantly white liberal arts college. Journal of Higher Education,61(6), 608-642.
Newman, B., Dannenfelser, P., & Benishek, L. (2002). Assessing beginning socialwork and counseling students’ acceptance of lesbians and gay men. Journal of So-cial Work Education, 38(2), 273-288.
Qualls, R., Cox, M., & Schehr, T. (1992). Racial attitudes on campus: Are there genderdifferences? Journal of College Student Development, 33, 524-529.
Rankin, S. (2003). Campus climate for gay, lesbian, bisexual and transgendered peo-ple: A national perspective. Washington, DC: National Gay and Lesbian TaskForce.
Sears, J. (1995). Black-gay or gay-black: Choosing identities and identifying choices.In G. Unks (Ed.) The gay teen: Educational practice and theory for lesbian, gay,and bisexual adolescents (pp. 135-157). New York: Routledge.
Suarez-Balcazar, Y., Orellana-Damacela, L., Portillo, N., Rowan, J., & An-drews-Guillen, C. (2003). Experiences of differential treatment among college stu-dents of color. Journal of Higher Education, 74(4), 428-444.
Waldo, C. (1998). Out on campus: Sexual orientation and academic climate in a uni-versity context. American Journal of Community Psychology, 26(5), 745-774.
Willett, T. (2002). Gavilan college campus diversity climate survey. Retrieved Sep-tember 22, 2004, from http://www.gavilan.edu/research/reports/cc02.pdf
Yellow Bird, M. (1999). What we want to be called: Indigenous Peoples’ perspectiveson racial and ethnic identity labels. American Indian Quarterly, 23(2), 1-21.
RECEIVED: 04/01/05REVISED: 11/05/05
ACCEPTED: 12/29/05
doi:10.1300/J524v05n01_07
100 JOURNAL OF LGBT YOUTH
Dow
nloa
ded
by [
Ari
zona
Sta
te U
nive
rsity
] at
14:
22 3
0 O
ctob
er 2
015
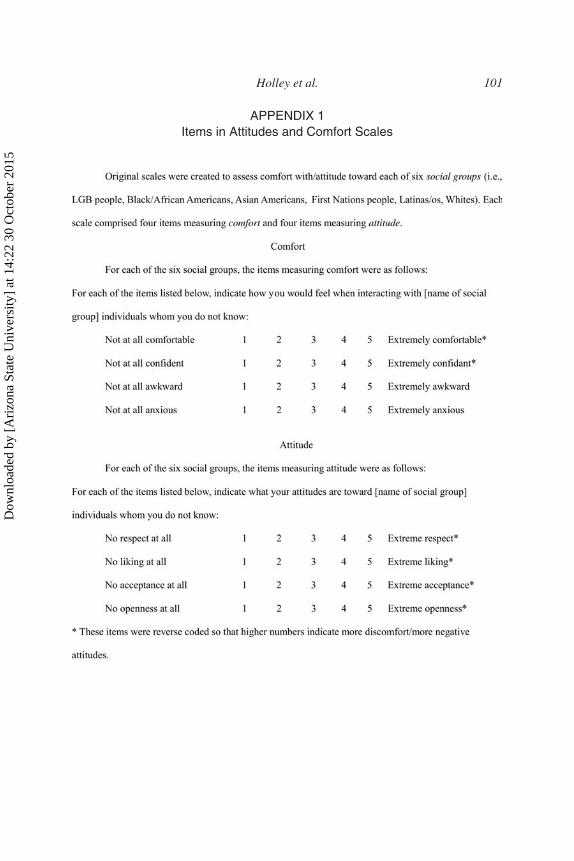
Holley et al. 101
APPENDIX 1Items in Attitudes and Comfort Scales
Dow
nloa
ded
by [
Ari
zona
Sta
te U
nive
rsity
] at
14:
22 3
0 O
ctob
er 2
015
Related Documents


![nf]s ;]jf cfof]u -sfo{ ;~rfng lgb]{lzsf, @)^& - psc.gov.np · nf]s ;]jf cfof]u -sfo{ ;~rfng_ lgb]{lzsf, @)^& lgb]{lzsf nfu' ldlt M @)^&.^.! klxnf] ;+zf]wg ldlt M @)^&.!).@$ bf]>f]](https://static.cupdf.com/doc/110x72/6082d105c887c069e27bd4c5/nfs-jf-cfofu-sfo-rfng-lgblzsf-pscgovnp-nfs-jf-cfofu.jpg)