Attack Monitoring Using ELK @Nullcon Goa 2015 @prajalkulkarni @mehimansu

Attack monitoring using ElasticSearch Logstash and Kibana
Jul 16, 2015
Welcome message from author
This document is posted to help you gain knowledge. Please leave a comment to let me know what you think about it! Share it to your friends and learn new things together.
Transcript

Attack Monitoring Using ELK
@Nullcon Goa 2015
@prajalkulkarni
@mehimansu

About Us
@prajalkulkarni-Security Analyst @flipkart.com-Interested in webapps, mobile, loves scripting in python-Fan of cricket! and a wannabe guitarist!
@mehimansu-Security Analyst @flipkart.com-CTF Player - Team SegFault-Interested in binaries, fuzzing


Today’s workshop agenda
•Overview & Architecture of ELK
•Setting up & configuring ELK
•Logstash forwarder
•Alerting And Attack monitoring

What does the vm contains?
● Extracted ELK Tar files in /opt/
● java version "1.7.0_76"
● Apache installed
● Logstash-forwarder package
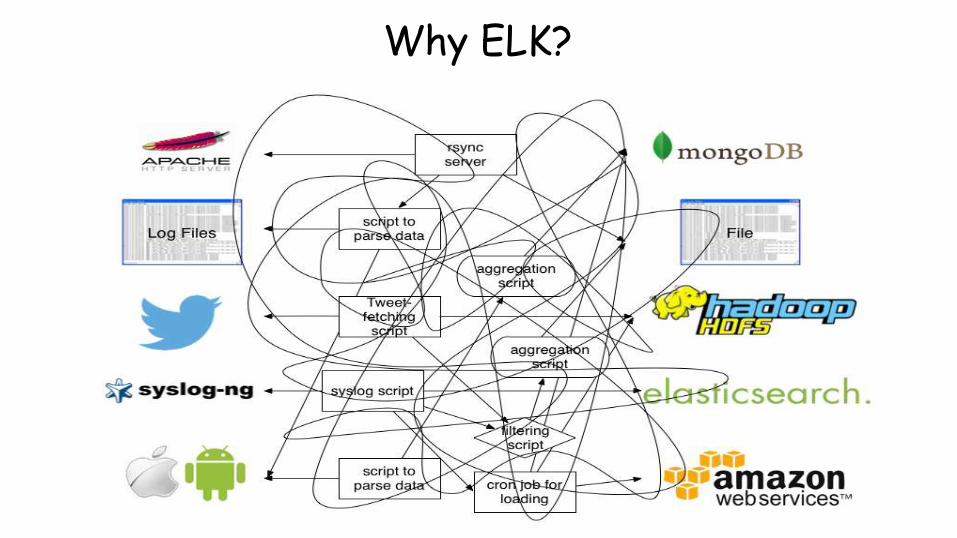
Why ELK?

Why ELK?
Old School● grep/sed/awk/cut/sort
● manually analyze the output
ELK● define endpoints(input/output)
● correlate patterns
● store data(search and visualize)

Other SIEM Market Solutions!
● Symantec Security Information Manager● Splunk● HP/Arcsight● Tripwire● NetIQ● Quest Software● IBM/Q1 Labs● Novell● Enterprise Security Manager

Overview of Elasticsearch
•Open source search server written in Java
•Used to index any kind of heterogeneous data
•Enables real-time ability to search through index
•Has REST API web-interface with JSON output

Overview of Logstash
•Framework for managing logs
•Founded by Jordan Sissel
•Mainly consists of 3 components:● input : passing logs to process them into machine understandable
format(file,lumberjack).
● filters: set of conditionals to perform specific action on a event(grok,geoip).
● output: decision maker for processed event/log(elasticsearch,file)

•Powerful front-end dashboard for visualizing indexed information from elastic cluster.
•Capable to providing historical data in form of graphs,charts,etc.
•Enables real-time search of indexed information.
Overview of Kibana

Basic ELK Setup

Let’s Setup ELK
Make sure about the update/dependencies!
$sudo apt-get update$sudo add-apt-repository -y ppa:webupd8team/java$sudo apt-get update$sudo apt-get -y install oracle-java7-installer$sudo apt-get install apache2

Installing Elasticsearch
$cd /opt
$curl –Ohttps://download.elasticsearch.org/elasticsearch/elasticsearch/elasticsearch-1.4.2.tar.gz
$tar -zxvf elasticsearch-1.4.2.tar.gz
$cd elasticsearch-1.4.2/

edit elasticsearch.yml
$sudo nano /opt/elasticsearch/config/elasticsearch.yml
ctrl+w search for ”cluster.name”
Change the cluster name to elastic_yourname
ctrl+x Y
Now start ElasticSearch sudo ./elasticsearch

Verifying Elasticsearch Installation
$curl –XGET http://localhost:9200
Expected Output:{
"status" : 200,
"name" : "Edwin Jarvis",
"cluster_name" : "elastic_yourname",
"version" : {
"number" : "1.4.2",
"build_hash" : "927caff6f05403e936c20bf4529f144f0c89fd8c",
"build_timestamp" : "2014-12-16T14:11:12Z",
"build_snapshot" : false,
"lucene_version" : "4.10.2"
},
"tagline" : "You Know, for Search"
}

Terminologies of Elastic Search!
Cluster
● A cluster is a collection of one or more nodes (servers) that together holds your entire data and provides federated indexing and search capabilities across all nodes
● A cluster is identified by a unique name which by default is "elasticsearch"
Terminologies of Elastic Search!
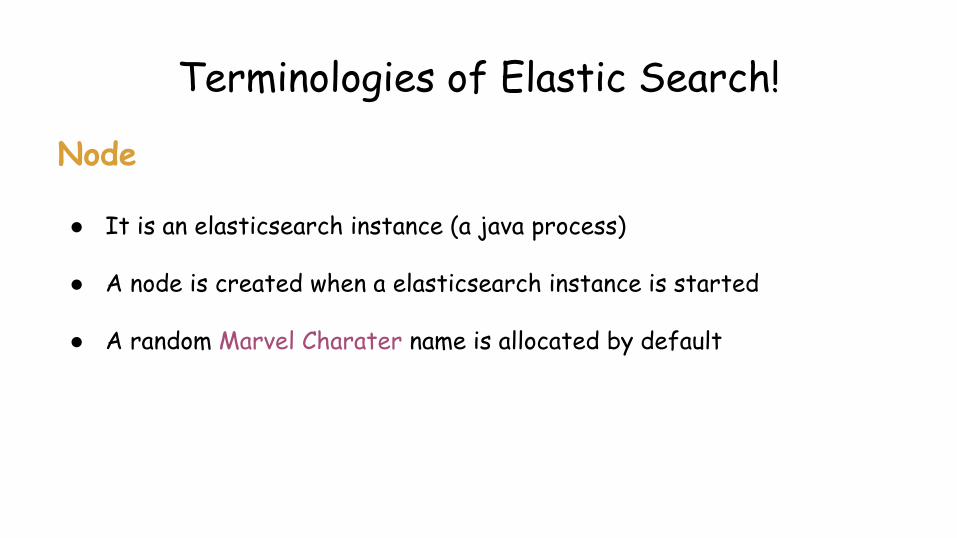
Node
● It is an elasticsearch instance (a java process)
● A node is created when a elasticsearch instance is started
● A random Marvel Charater name is allocated by default
Terminologies of Elastic Search!
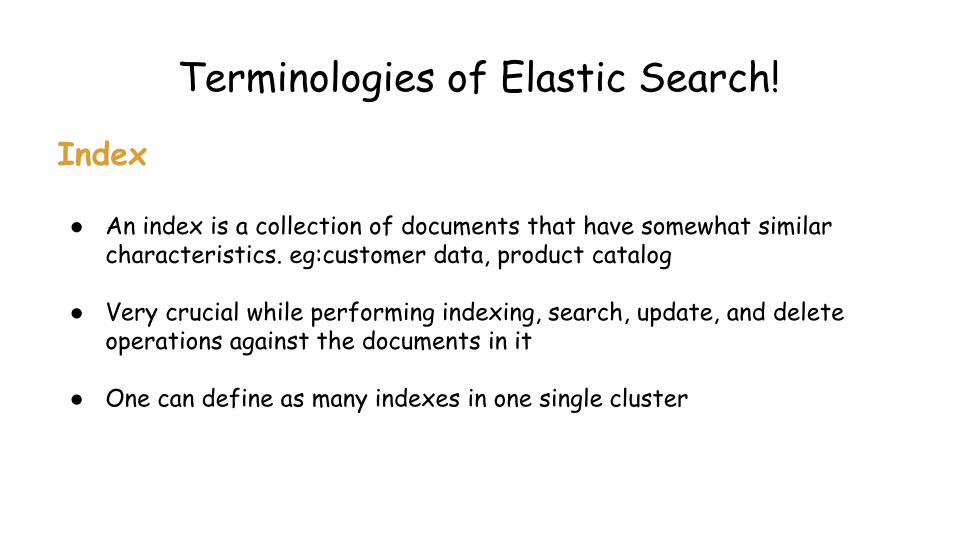
Index
● An index is a collection of documents that have somewhat similar characteristics. eg:customer data, product catalog
● Very crucial while performing indexing, search, update, and delete operations against the documents in it
● One can define as many indexes in one single cluster

Document
● It is the most basic unit of information which can be indexed
● It is expressed in json (key:value) pair. ‘{“user”:”nullcon”}’
● Every Document gets associated with a type and a unique id.
Terminologies of Elastic Search!

Terminologies of Elastic Search!
Shard
● Every index can be split into multiple shards to be able to distribute data.● The shard is the atomic part of an index, which can be distributed over the cluster if you
add more nodes.● By default 5 primary shards and 1 replica shards are created while starting elasticsearch
____ ____ | 1 | | 2 | | 3 | | 4 | | 5 | |____| |____|
● Atleast 2 Nodes are required for replicas to be created


Plugins of Elasticsearch
head./plugin -install mobz/elasticsearch-head
HQ./plugin -install royrusso/elasticsearch-HQ
Bigdesk./plugin -install lukas-vlcek/bigdesk

Restful API’s over http -- !help curlcurl -X<VERB> '<PROTOCOL>://<HOST>/<PATH>?<QUERY_STRING>' -d '<BODY>'
● VERB-The appropriate HTTP method or verb: GET, POST, PUT, HEAD, or DELETE.
● PROTOCOL-Either http or https (if you have an https proxy in front of Elasticsearch.)
● HOST-The hostname of any node in your Elasticsearch cluster, or localhost for a node on your
local machine.
● PORT-The port running the Elasticsearch HTTP service, which defaults to 9200.
● QUERY_STRING-Any optional query-string parameters (for example ?pretty will pretty-print
the JSON response to make it easier to read.)
● BODY-A JSON encoded request body (if the request needs one.)
!help curl
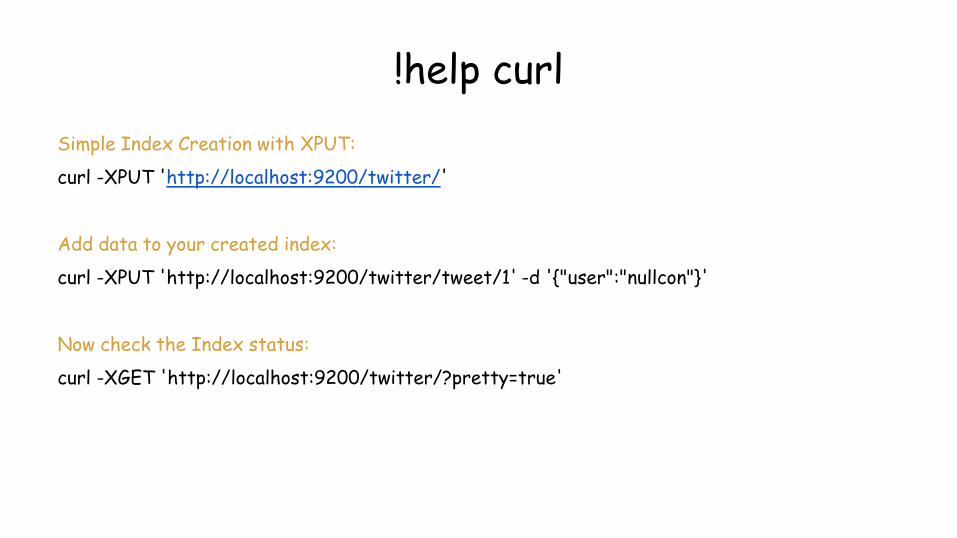
Simple Index Creation with XPUT:
curl -XPUT 'http://localhost:9200/twitter/'
Add data to your created index:
curl -XPUT 'http://localhost:9200/twitter/tweet/1' -d '{"user":"nullcon"}'
Now check the Index status:
curl -XGET 'http://localhost:9200/twitter/?pretty=true'

!help curlAutomatic doc creation in an index with XPOST:
curl -XPOST ‘http://localhost:9200/twitter/tweet/' -d ‘{“user”:”nullcon”}’
Creating a user profile doc:
curl -XPUT 'http://localhost:9200/twitter/tweet/9' -d '{"user”:”admin”, “role”:”tester”, “sex”:"male"}'
Searching a doc in an index:
First create 2 docs:
curl -XPOST 'http://localhost:9200/twitter/tester/' -d '{"user":"abcd", "role":"tester", "sex":"male"}'
curl -XPOST 'http://localhost:9200/twitter/tester/' -d '{"user":"abcd", "role":"admin", "sex":"male"}'
curl -XGET 'http://localhost:9200/twitter/_search?q=user:abcd&pretty=true'

!help curl
Deleting an doc in an index:$curl -XDELETE 'http://localhost:9200/twitter/tweet/1'
Cluster Health: (yellow to green)/ Significance of colours(yellow/green/red)$curl -XGET ‘http://localhost:9200/_cluster/health?pretty=true’
$./elasticsearch -D es.config=../config/elasticsearch2.yml &
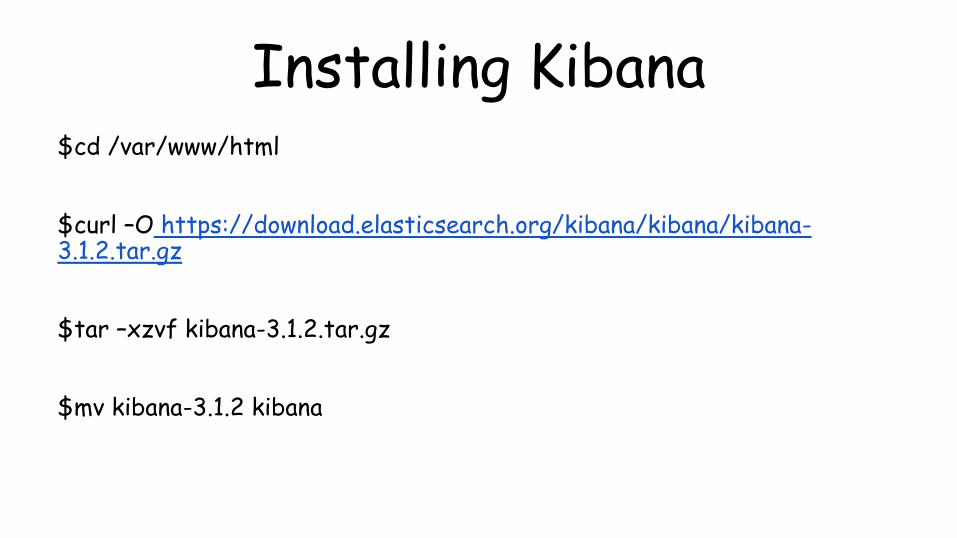
Installing Kibana$cd /var/www/html
$curl –O https://download.elasticsearch.org/kibana/kibana/kibana-3.1.2.tar.gz
$tar –xzvf kibana-3.1.2.tar.gz
$mv kibana-3.1.2 kibana
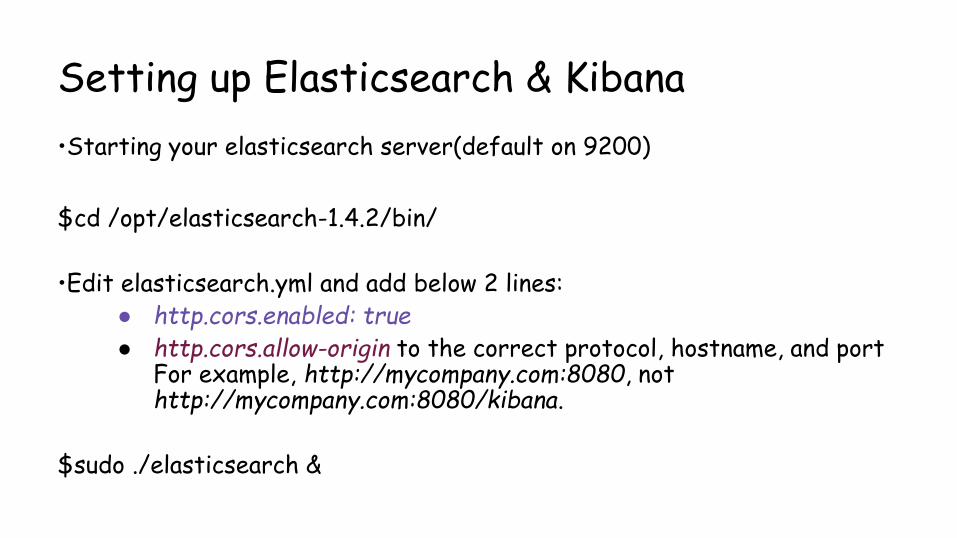
Setting up Elasticsearch & Kibana
•Starting your elasticsearch server(default on 9200)
$cd /opt/elasticsearch-1.4.2/bin/
•Edit elasticsearch.yml and add below 2 lines:● http.cors.enabled: true
● http.cors.allow-origin to the correct protocol, hostname, and port For example, http://mycompany.com:8080, not http://mycompany.com:8080/kibana.
$sudo ./elasticsearch &

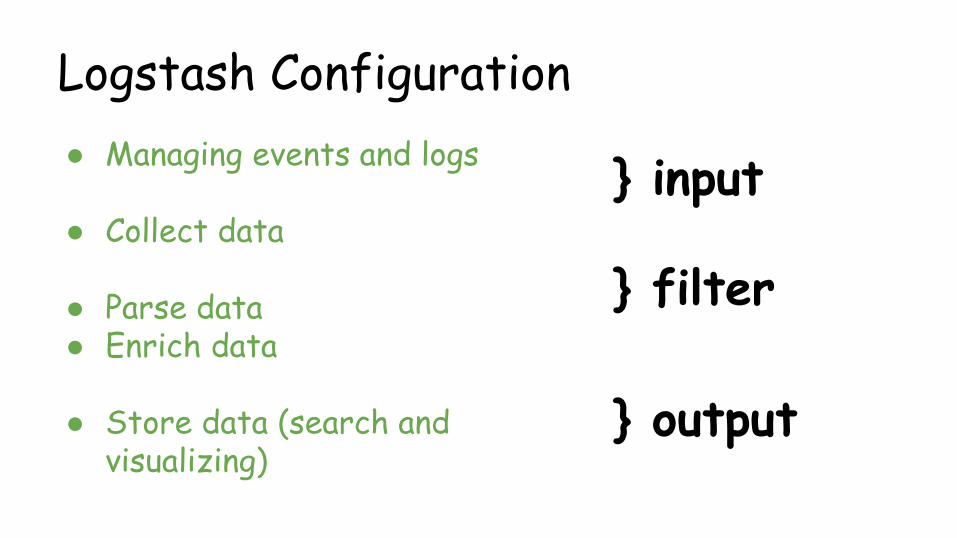
Logstash Configuration
● Managing events and logs
● Collect data
● Parse data● Enrich data
● Store data (search and visualizing)
} input
} filter
} output
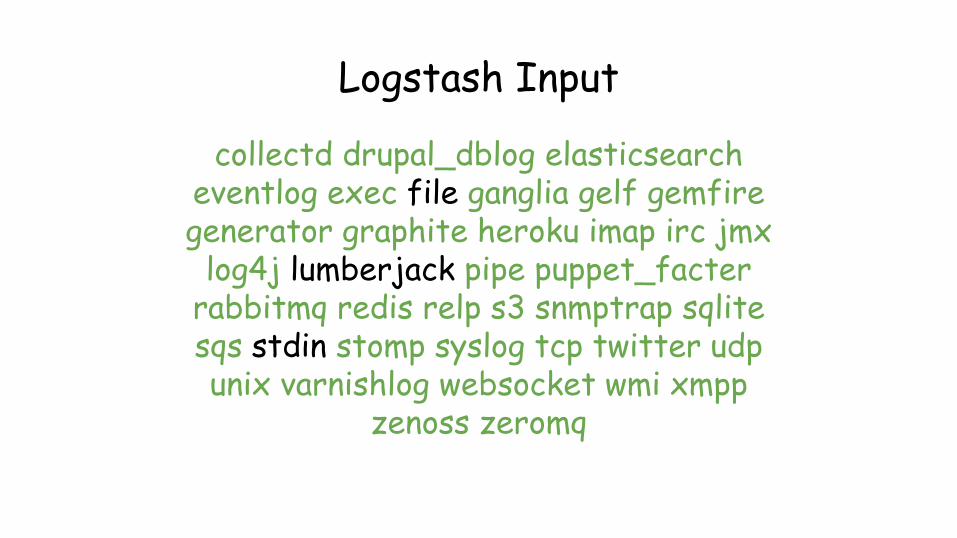
Logstash Input
collectd drupal_dblog elasticsearcheventlog exec file ganglia gelf gemfiregenerator graphite heroku imap irc jmx
log4j lumberjack pipe puppet_facterrabbitmq redis relp s3 snmptrap sqlitesqs stdin stomp syslog tcp twitter udpunix varnishlog websocket wmi xmpp
zenoss zeromq

Logstash output!
boundary circonus cloudwatch csv datadogelasticsearch exec email file ganglia gelf
gemfire google_bigquery google_cloud_storagegraphite graphtastic hipchat http irc jira
juggernaut librato loggly lumberjackmetriccatcher mongodb nagios null opentsdb
pagerduty pipe rabbitmq redis riak riemann s3sns solr_http sqs statsd stdout stomp syslog
tcp udp websocket xmpp zabbix zeromq

Installing & Configuring Logstash
$cd /opt
$curl –Ohttps://download.elasticsearch.org/logstash/logstash/logstash-1.4.2.tar.gz
$tar zxvf logstash-1.4.2.tar.gz

•Starting logstash
$cd /opt/logstash-1.4.2/bin/
•Lets start the most basic setup
… continued

run this!
./logstash -e 'input { stdin { } } output {elasticsearch {host => localhost } }'
Check head pluginhttp://localhost:9200/_plugin/head

...continuedSetup - Apache access.log
input {
file {
path => [ "/var/log/apache2/access.log" ]
}
}
filter {
grok {
pattern => "%{COMBINEDAPACHELOG}"
}
}
output {
elasticsearch {
host => localhost
protocol => http
index => “indexname”
}
}

Now do it for syslog

Understanding Grok
Why grok?
actual regex to parse apache logs

Understanding Grok
•Understanding grok nomenclature.
•The syntax for a grok pattern is %{SYNTAX:SEMANTIC}•SYNTAX is the name of the pattern that will match your text.● E.g 1337 will be matched by the NUMBER pattern, 254.254.254
will be matched by the IP pattern.•SEMANTIC is the identifier you give to the piece of text being matched.● E.g. 1337 could be the count and 254.254.254 could be a client
making a request%{NUMBER:count} %{IP:client}

Playing with grok filters
•GROK Playground: https://grokdebug.herokuapp.com/
•Apache access.log event:
123.249.19.22 - - [01/Feb/2015:14:12:13 +0000] "GET /manager/html HTTP/1.1" 404 448 "-" "Mozilla/3.0 (compatible; Indy Library)"
•Matching grok:
%{IPV4} %{USER:ident} %{USER:auth} \[%{HTTPDATE:timestamp}\] "(?:%{WORD:verb} %{NOTSPACE:request}(?: HTTP/%{NUMBER:httpversion})?)" %{NUMBER:response} (?:%{NUMBER:bytes}|-)
•Things can get even more simpler using grok:%{COMBINEDAPACHELOG}

Log Forwarding using logstash-forwarder
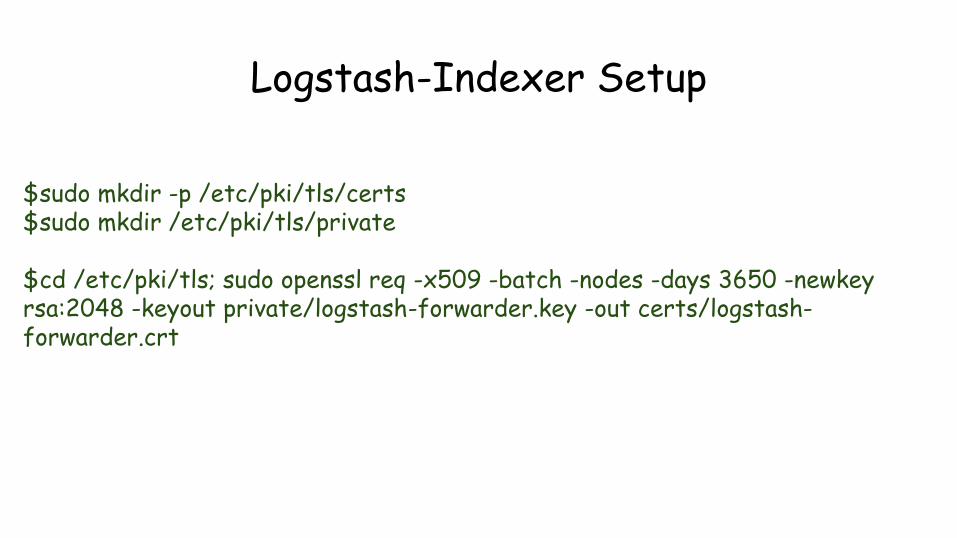
Logstash-Indexer Setup
$sudo mkdir -p /etc/pki/tls/certs$sudo mkdir /etc/pki/tls/private
$cd /etc/pki/tls; sudo openssl req -x509 -batch -nodes -days 3650 -newkey rsa:2048 -keyout private/logstash-forwarder.key -out certs/logstash-forwarder.crt
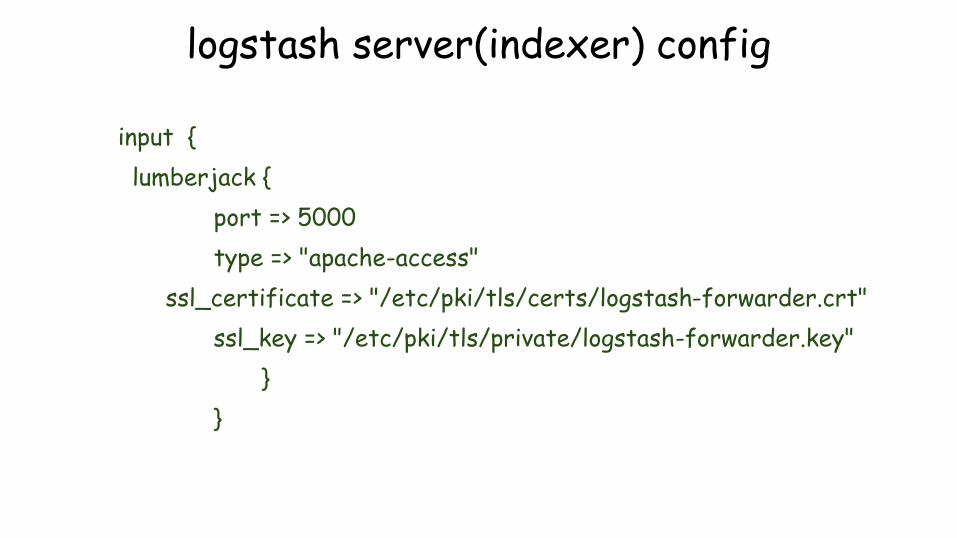
logstash server(indexer) config
input {
lumberjack {
port => 5000
type => "apache-access"
ssl_certificate => "/etc/pki/tls/certs/logstash-forwarder.crt"
ssl_key => "/etc/pki/tls/private/logstash-forwarder.key"
}
}

Logstash-Shipper Setupcp logstash-forwarder.crt /etc/pki/tls/certs/logstash-forwarder.crtlogstash-forwarder.conf
{"network": {"servers": [ "54.149.159.194:5000" ],"timeout": 15,"ssl ca": "/etc/pki/tls/certs/logstash-forwarder.crt"
},"files": [{"paths": [
"/var/log/apache2/access.log"]
}]
}./logstash-forwarder -config logstash-forwarder.conf

How Does your company mitigate DoS?

Logstash Alerting!
When to alert?
Alert based on IP count / UA Count

filter {
grok {
type => "elastic-cluster"
pattern => "%{COMBINEDAPACHELOG}"}
throttle {
before_count => 0
after_count => 5
period => 5
key => "%{clientip}"
add_tag => "throttled"
}
}
output {
if "throttled" in [tags] {
email {
from => "[email protected]"
subject => "Production System Alert"
to => "[email protected]"
via => "sendmail"
body => "Alert on %{host} from path %{path}:\n\n%{message}"
options => { "location" => "/usr/sbin/sendmail" }
}
}
elasticsearch {
host => localhost
} }

More Use cases

modsec_audit.log!!
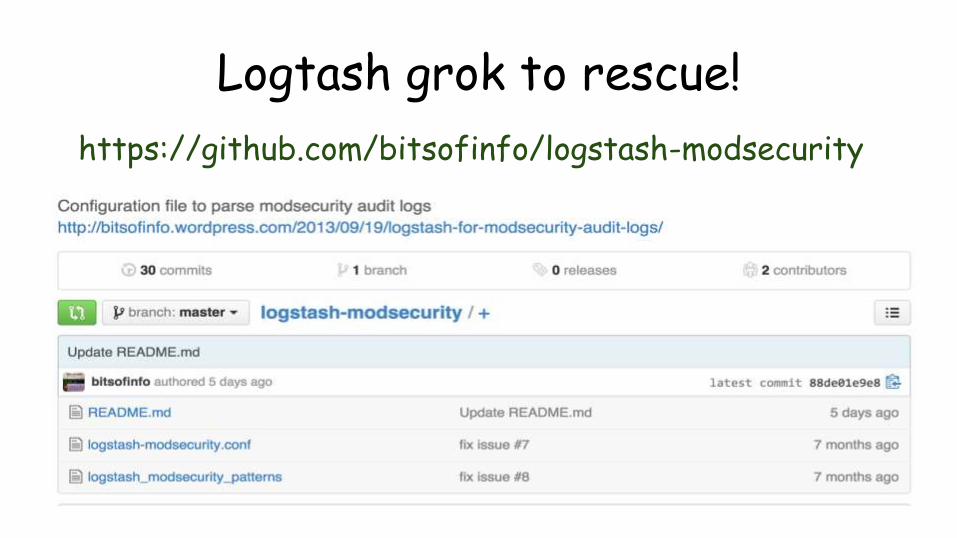
Logtash grok to rescue!
https://github.com/bitsofinfo/logstash-modsecurity

Logstash V/S Fluentd
credits:blog.deimos.fr

fluentd conf file
<source>type tailpath /var/log/nginx/access.logpos_file /var/log/td-agent/kibana.log.pos
format nginxtag nginx.access
</source>
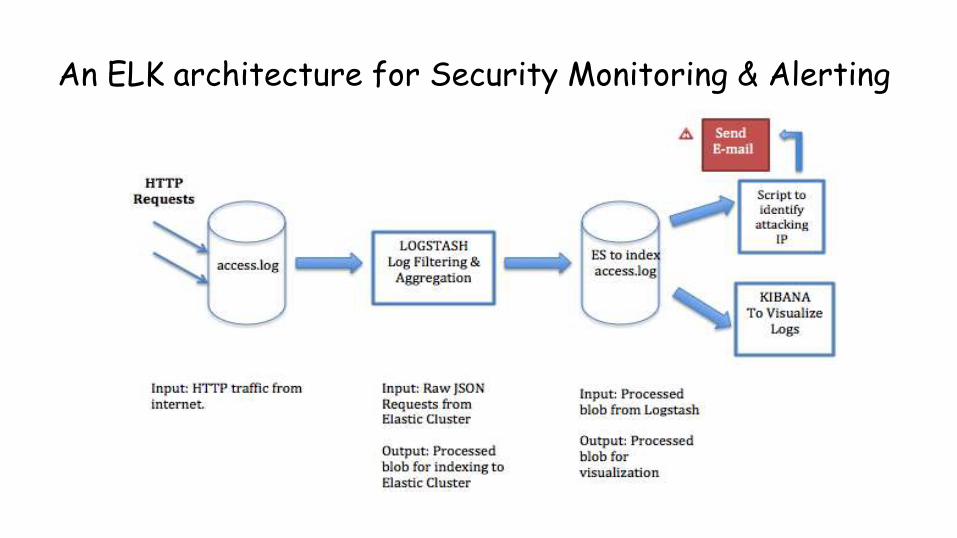
An ELK architecture for Security Monitoring & Alerting
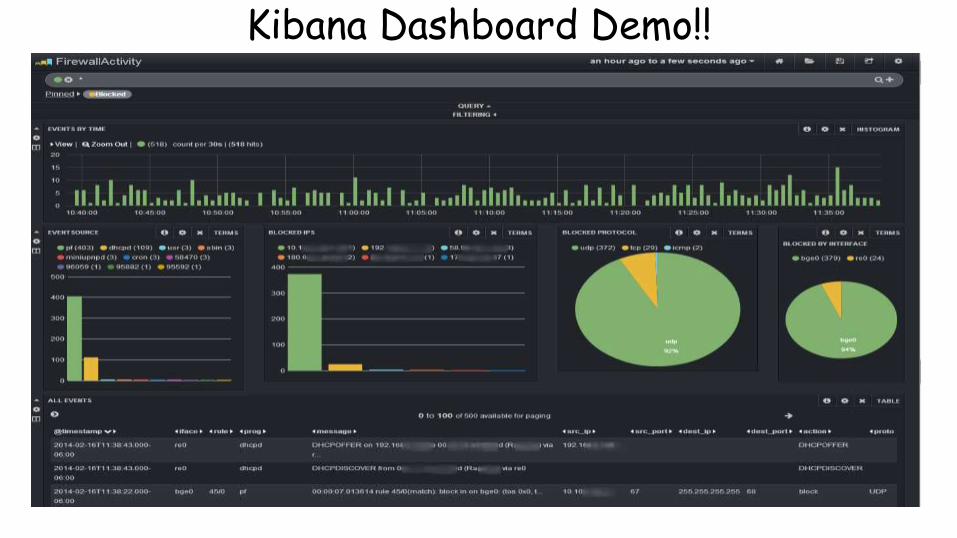
Kibana Dashboard Demo!!

Open monitor.py

Thanks for your time!


Related Documents