PHYSICAL REVIEW B 86, 174114 (2012) Atomic structure relaxation in nanocrystalline NiO studied by EXAFS spectroscopy: Role of nickel vacancies A. Anspoks, * A. Kalinko, † R. Kalendarev, ‡ and A. Kuzmin § Institute of Solid State Physics, University of Latvia, Kengaraga street 8, LV-1063 Riga, Latvia (Received 4 June 2012; published 26 November 2012) Nanocrystalline NiO samples have been studied using the Ni K-edge extended x-ray absorption fine structure (EXAFS) spectroscopy and recently developed modeling technique, combining classical molecular dynamics with ab initio multiple-scattering EXAFS calculations (MD-EXAFS). Conventional analysis of the EXAFS signals from the first two coordination shells of nickel revealed that (i) the second shell average distance R(Ni–Ni 2 ) expands in nanocrystalline NiO compared to microcrystalline NiO, in agreement with overall unit cell volume expansion observed by x-ray diffraction; (ii) on the contrary, the first shell average distance R(Ni–O 1 ) in nanocrystalline NiO shrinks compared to microcrystalline NiO; (iii) the thermal contribution into the mean- square relative displacement σ 2 is close in both microcrystalline and nanocrystalline NiO and can be described by the Debye model; (iv) the static disorder is additionally present in nanocrystalline NiO in both the first Ni–O 1 and second Ni–Ni 2 shells due to nanocrystal structure relaxation. Within the MD-EXAFS method, the force-field potential models have been developed for nanosized NiO using as a criterion the agreement between the experimental and theoretical EXAFS spectra. The best solutions have been obtained for the 3D cubic-shaped nanoparticle models with nonzero Ni vacancy concentration C vac : C vac ≈ 0.4–1.2% for NiO nanoparticles having the cube size of L ≈ 3.6–4.2 nm and C vac ≈ 1.6–2.0% for NiO thin film composed of cubic nanograins with a size of L ≈ 1.3–2.1 nm. Thus our results show that the Ni vacancies in nanosized NiO play important role in its atomic structure relaxation along with the size reduction effect. DOI: 10.1103/PhysRevB.86.174114 PACS number(s): 61.05.cj, 78.70.Dm, 61.72.jd, 61.46.Hk I. INTRODUCTION In the past, significant efforts have been devoted to the preparation of metal oxide functional nanomaterials with tailored properties. 1 Different physical and chemical prepa- ration methods influence on the final product, in particular, its stoichiometry, metal oxidation state, the presence of impurities as well as coexistence of amorphous and crystalline phases. 2 A key requirement for understanding and control of nanomaterial properties is the knowledge of its atomic structure, whose determination is a challenging task. It can be addressed by a complex modeling approach based on an effective combination of the experimental methods and the theory. 3 While different experimental techniques exist to study nanomaterials, 2,4 only two methods, namely total scattering 5 and x-ray absorption spectroscopy (XAS), 6,7 provide with direct access to the structural information. XAS is an excellent tool for this purpose, because it is element selective, sensitive to low element concentration, and scales down to nanoparticles and even molecules. 8–10 The possibility to perform XAS experiments with the spatial resolution at nanoscale has been also demonstrated recently. 11,12 Being a local probe, XAS gives an insight into the atomic structure of a material within about 3–10 ˚ A around the absorbing atom. 10 The structural information is encrypted within the oscillating part of x-ray absorption coefficient, the so-called extended x-ray absorption fine structure (EXAFS), located above the absorption edge of an element. 13,14 Contrary to the total scattering method, 5 which is sensitive to the atomic pair distribution functions (PDFs), the EXAFS includes contributions from many-atom distributions, known as the multiple-scattering (MS) effects, being sensitive not only to the interatomic distances, but also to the bonding angles. 15 This fact makes the EXAFS technique unique in a characterization of nanosized and complex functional materials. The EXAFS theory has been largely improved during the last decades and is rather well developed today. 13,14 However, its application to the analysis of contributions from outer coordination shells into the total EXAFS spectrum is limited by the ability to reliably incorporate thermal disorder and the multiple-scattering effects. This problem is crucial in the case of nanomaterials, where the size reduction effect, leading to the high surface to volume ratio, and its accompanied atomic structure relaxation at the surface and in the bulk of nanoparticles influence strongly the shape of the EXAFS spectrum. 6,7 To deal with this problem, we have developed the MD-EXAFS modeling method combining ab initio EXAFS calculations with classical molecular dynamics (MD) simulations. 16 It allows us to generate from the MD run a set of atomic configurations, which are further employed to compute the configuration-averaged EXAFS spectrum using the full power of modern ab initio multiple-scattering theory. 14 The method has been successfully applied to the interpretation of EXAFS spectra in several crystalline materials as SrTiO 3 , 17 ReO 3 , 18 Ge, 19 and LaCoO 3 . 20 The important advantage of this method is a small number of model parameters, which are used in the force-field potential to describe interactions between atoms in the material. Note that modern MD simulations can deal with very large number of atoms (even millions), 21,22 allowing one to create realistic models of a nanoobject without any significant limitations. In this work, we will demonstrate the potentiality of the MD-EXAFS method for the interpretation of the Ni K -edge EXAFS in nanocrystalline nickel oxide (NiO). NiO represents challenging example of nanomaterial, which finds a broad range of practical applications including but not limited to 174114-1 1098-0121/2012/86(17)/174114(11) ©2012 American Physical Society

Welcome message from author
This document is posted to help you gain knowledge. Please leave a comment to let me know what you think about it! Share it to your friends and learn new things together.
Transcript
PHYSICAL REVIEW B 86, 174114 (2012)
Atomic structure relaxation in nanocrystalline NiO studied by EXAFS spectroscopy:Role of nickel vacancies
A. Anspoks,* A. Kalinko,† R. Kalendarev,‡ and A. Kuzmin§
Institute of Solid State Physics, University of Latvia, Kengaraga street 8, LV-1063 Riga, Latvia(Received 4 June 2012; published 26 November 2012)
Nanocrystalline NiO samples have been studied using the Ni K-edge extended x-ray absorption fine structure(EXAFS) spectroscopy and recently developed modeling technique, combining classical molecular dynamicswith ab initio multiple-scattering EXAFS calculations (MD-EXAFS). Conventional analysis of the EXAFSsignals from the first two coordination shells of nickel revealed that (i) the second shell average distanceR(Ni–Ni2) expands in nanocrystalline NiO compared to microcrystalline NiO, in agreement with overall unit cellvolume expansion observed by x-ray diffraction; (ii) on the contrary, the first shell average distance R(Ni–O1)in nanocrystalline NiO shrinks compared to microcrystalline NiO; (iii) the thermal contribution into the mean-square relative displacement σ 2 is close in both microcrystalline and nanocrystalline NiO and can be describedby the Debye model; (iv) the static disorder is additionally present in nanocrystalline NiO in both the firstNi–O1 and second Ni–Ni2 shells due to nanocrystal structure relaxation. Within the MD-EXAFS method, theforce-field potential models have been developed for nanosized NiO using as a criterion the agreement betweenthe experimental and theoretical EXAFS spectra. The best solutions have been obtained for the 3D cubic-shapednanoparticle models with nonzero Ni vacancy concentration Cvac: Cvac ≈ 0.4–1.2% for NiO nanoparticles havingthe cube size of L ≈ 3.6–4.2 nm and Cvac ≈ 1.6–2.0% for NiO thin film composed of cubic nanograins with asize of L ≈ 1.3–2.1 nm. Thus our results show that the Ni vacancies in nanosized NiO play important role in itsatomic structure relaxation along with the size reduction effect.
DOI: 10.1103/PhysRevB.86.174114 PACS number(s): 61.05.cj, 78.70.Dm, 61.72.jd, 61.46.Hk
I. INTRODUCTION
In the past, significant efforts have been devoted to thepreparation of metal oxide functional nanomaterials withtailored properties.1 Different physical and chemical prepa-ration methods influence on the final product, in particular, itsstoichiometry, metal oxidation state, the presence of impuritiesas well as coexistence of amorphous and crystalline phases.2 Akey requirement for understanding and control of nanomaterialproperties is the knowledge of its atomic structure, whosedetermination is a challenging task. It can be addressed by acomplex modeling approach based on an effective combinationof the experimental methods and the theory.3
While different experimental techniques exist to studynanomaterials,2,4 only two methods, namely total scattering5
and x-ray absorption spectroscopy (XAS),6,7 provide withdirect access to the structural information. XAS is an excellenttool for this purpose, because it is element selective, sensitiveto low element concentration, and scales down to nanoparticlesand even molecules.8–10 The possibility to perform XASexperiments with the spatial resolution at nanoscale has beenalso demonstrated recently.11,12
Being a local probe, XAS gives an insight into the atomicstructure of a material within about 3–10 A around theabsorbing atom.10 The structural information is encryptedwithin the oscillating part of x-ray absorption coefficient, theso-called extended x-ray absorption fine structure (EXAFS),located above the absorption edge of an element.13,14 Contraryto the total scattering method,5 which is sensitive to theatomic pair distribution functions (PDFs), the EXAFS includescontributions from many-atom distributions, known as themultiple-scattering (MS) effects, being sensitive not only to theinteratomic distances, but also to the bonding angles.15 This
fact makes the EXAFS technique unique in a characterizationof nanosized and complex functional materials.
The EXAFS theory has been largely improved duringthe last decades and is rather well developed today.13,14
However, its application to the analysis of contributions fromouter coordination shells into the total EXAFS spectrumis limited by the ability to reliably incorporate thermaldisorder and the multiple-scattering effects. This problem iscrucial in the case of nanomaterials, where the size reductioneffect, leading to the high surface to volume ratio, and itsaccompanied atomic structure relaxation at the surface andin the bulk of nanoparticles influence strongly the shape ofthe EXAFS spectrum.6,7 To deal with this problem, we havedeveloped the MD-EXAFS modeling method combining abinitio EXAFS calculations with classical molecular dynamics(MD) simulations.16 It allows us to generate from the MD runa set of atomic configurations, which are further employed tocompute the configuration-averaged EXAFS spectrum usingthe full power of modern ab initio multiple-scattering theory.14
The method has been successfully applied to the interpretationof EXAFS spectra in several crystalline materials as SrTiO3,17
ReO3,18 Ge,19 and LaCoO3.20 The important advantage of thismethod is a small number of model parameters, which are usedin the force-field potential to describe interactions betweenatoms in the material. Note that modern MD simulations candeal with very large number of atoms (even millions),21,22
allowing one to create realistic models of a nanoobject withoutany significant limitations.
In this work, we will demonstrate the potentiality of theMD-EXAFS method for the interpretation of the Ni K-edgeEXAFS in nanocrystalline nickel oxide (NiO). NiO representschallenging example of nanomaterial, which finds a broadrange of practical applications including but not limited to
174114-11098-0121/2012/86(17)/174114(11) ©2012 American Physical Society
A. ANSPOKS, A. KALINKO, R. KALENDAREV, AND A. KUZMIN PHYSICAL REVIEW B 86, 174114 (2012)
catalysis, electrochromic devices, gas sensors, resistive andmagnetoresistive memory, giant magnetoresistive (GMR) spinvalve structures, rechargeable batteries, and fuel cells.23–29
Note that a performance of all these devices depends largelyon the oxide stoichiometry. NiO is known to be p-typesemiconductor, having usually an oxygen excess due to thepresence of nickel vacancies (VNi).30–32
EXAFS spectroscopy has been used to study nickel oxidefor a long time.33–36 Most works have been dedicated to aninvestigation of NiO thin films. The in-plane and out-of-planestrains have been evaluated in the epitaxial ultrathin NiOlayers on Ag(001) in Refs. 37–39. A decrease of the first shellaverage distance R(Ni–O1) by ∼0.02–0.04 A and an increasesof the mean second shell distance R(Ni–Ni2) by ∼0.01–0.02 Ahave been observed in pure Ni1−xO and vanadium dopedNi1−xVxOy thin films.40,41 Recently, the presence and therole of nickel vacancies have been studied in sputtered NiOfilms.42,43 It was concluded that nickel vacancies, being thedominant point defects, are responsible for the electricalconductivity of the films42 and for the film decompositionunder annealing in vacuum above 400 ◦C.43 At the sametime, very few works exist to our knowledge on the EXAFSstudies of NiO nanoparticles. An elongation of the first shellR(Ni–O1) and second shell R(Ni–Ni2) distances has beenfound in ultra fine NiO particles dispersed on activated carbonfibers.44 In-situ EXAFS study of the initial crystallization stageof NiO nanoparticles from the amorphous precursor has beenperformed in Ref. 45. Finally, the influence of point defectsin NiO nanoparticles has been studied recently in relationto their magnetic properties.46 It has been proposed that adistribution of nickel vacancies in NiO nanoparticles, havingthe size between 10 and 18 nm, can be considered within thecore-shell model.46
Note that most previous EXAFS studies have been limitedto the analysis of the first two coordination shells of nickel,thus excluding large amount of experimental data from theanalysis. A more rigorous approach, based on the MD-EXAFSmethod,16 has been used by us recently to study the structurerelaxation and lattice dynamics in nanocrystalline (13 nm)NiO powder in comparison with microcrystalline oxide.47,48
In our previous works,47,48 only the size reduction effect andrelated atomic structure relaxation have been considered whensimulating nanocrystalline NiO. The developed force-field(FF) potential model allowed us to reproduce well withinthe multiple-scattering approach the Ni K-edge EXAFSspectrum of microcrystalline NiO, taking into account thecontributions from the first six coordination shells (up to∼5.5 A).47,48 However, the same force-field model, appliedto nanocrystalline NiO, predicted opposite direction of therelaxation for the first coordination shell of nickel compared tothe results of conventional EXAFS data analysis based on thebest fitting procedure.47,48 Thus we concluded that the model,developed for microcrystalline NiO, should be improved todescribe correctly the atomic structure of nanocrystalline NiO.
Therefore a more advanced model, additionally taking intoaccount the presence of nickel vacancies, has been developedin the present work, based on the results of temperaturedependent (from 10 to 300 K) Ni K-edge EXAFS experimentsfor microcrystalline, nanocrystalline powder and thin film NiOsamples. As we will show below, the new model predicts
correctly a relaxation of the first and outer coordinationshells in nanocrystalline NiO upon its size reduction givingsimultaneously good agreement between the configuration-averaged and experimental Ni K-edge EXAFS spectra withinthe multiple-scattering approximation. Moreover, the modelallows to estimate an amount of nickel vacancies, beingdirectly responsible for the first shell relaxation in the bulkof nanocrystals.
The paper is organized as follows. In Sec. II, we describe thepreparation of samples, EXAFS experiments and conventionaldata analysis procedure. The details of the MD-EXAFSsimulation method are explained in Sec. III. The obtainedresults, using both conventional and MD-EXAFS approaches,are presented and discussed in Sec. IV.
II. EXPERIMENTAL AND DATA ANALYSIS
In the present work we studied two different nickel oxidenanocrystalline samples (powder and thin film) in compari-son with commercial microcrystalline NiO powder (c-NiO,Aldrich, 99%), having green color. Black color of nanopowderand dark brown color of the thin film indicate the presence ofnickel vacancies.30,49,50
Nanocrystalline Ni1−xO powder (nano-NiO) was producedby the precipitation method,51 based on a reaction of aque-ous solutions of Ni(NO3)2·6H2O and NaOH, followed bysubsequent annealing of the precipitate in air at 250 ◦C.Nanocrystalline Ni1−xO thin film (tf-NiO) was produced usingreactive dc-magnetron sputtering of metallic nickel target inmixed Ar-O2 atmosphere (gas ratio Ar:O2 = 9:1) on polyimidetape. According to the x-ray diffraction data, the Scherrer’smethod and assuming the cubic crystallites shape, the averagesize of nanocrystallites was 6.2 ± 1.8 nm in the nanopowderand 5.9 ± 0.9 nm in the thin film.
The Ni K-edge x-ray absorption spectra were measuredin transmission mode at the HASYLAB/DESY C1 bending-magnet beamline in the temperature range from 6 K to 300 K.The storage ring DORIS III operated at E = 4.44 GeV andImax = 140 mA. The x-ray radiation was monochromatizedby a 40% detuned Si(111) double-crystal monochromator,and the beam intensity was measured using two ionizationchambers filled with argon and krypton gases. To achieve theabsorption Ni K-edge jump value �μ ≈ 1, the proper amountof the NiO powder was deposited on Millipore nitrocellulosemembrane filter and fixed by Scotch tape, whereas a stack ofsimultaneously sputtered thin films was used.
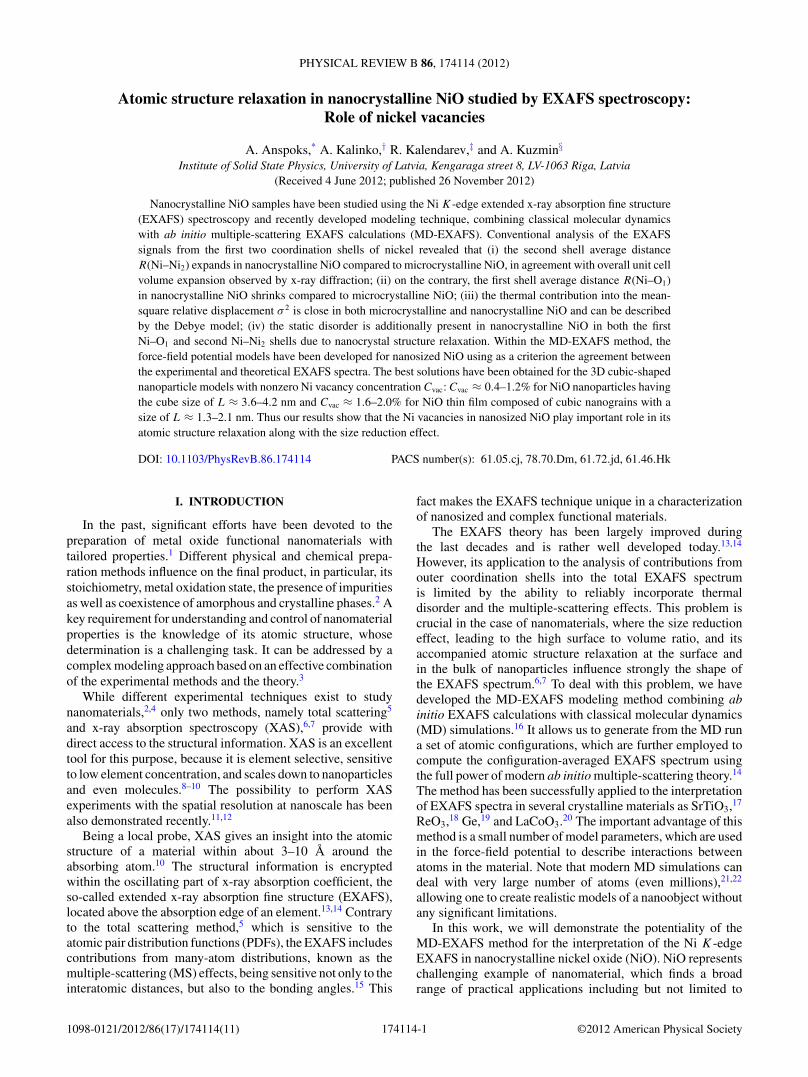
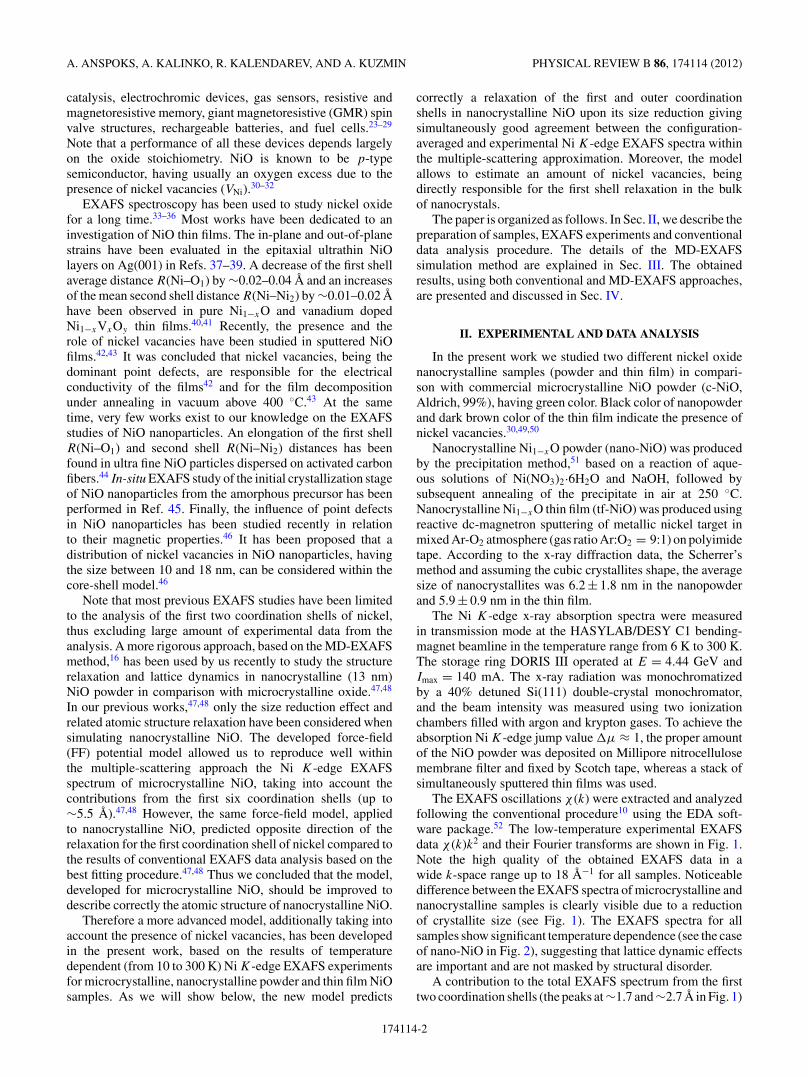
The EXAFS oscillations χ (k) were extracted and analyzedfollowing the conventional procedure10 using the EDA soft-ware package.52 The low-temperature experimental EXAFSdata χ (k)k2 and their Fourier transforms are shown in Fig. 1.Note the high quality of the obtained EXAFS data in awide k-space range up to 18 A−1 for all samples. Noticeabledifference between the EXAFS spectra of microcrystalline andnanocrystalline samples is clearly visible due to a reductionof crystallite size (see Fig. 1). The EXAFS spectra for allsamples show significant temperature dependence (see the caseof nano-NiO in Fig. 2), suggesting that lattice dynamic effectsare important and are not masked by structural disorder.
A contribution to the total EXAFS spectrum from the firsttwo coordination shells (the peaks at ∼1.7 and ∼2.7 A in Fig. 1)
174114-2
ATOMIC STRUCTURE RELAXATION IN . . . PHYSICAL REVIEW B 86, 174114 (2012)
0 2 4 6 8 10 12 14 16 18
-6
-4
-2
0
2
4
Ni K-edgeEX
AF
S χ
(k)k
2Å
-2
Wavenumber k (Å-1)
c-NiO T=6 Knano-NiO T=10 Ktf-NiO T=6 K
0 1 2 3 4 5 6 7 8 9 10-8
-6
-4
-2
0
2
4
6
8
Ni K-edge
c-NiO T=6 Knano-NiO T=10 Ktf-NiO T=6 K
FT
χ(k
)k2
Å-3
Distance R (Å)
FIG. 1. (Color online) Low-temperature Ni K-edge EXAFSspectra χ (k)k2 and their Fourier transforms (FTs) for c-NiO, nano-NiO, and tf-NiO.
can be analyzed in the single-scattering approximation.47,48
Therefore it was isolated by the Fourier filtering procedurein the R-space range of 0.7–3.2 A and best fitted in thek-space range of 2–17 A−1 using the two-component Gaussianmodel.10 The scattering amplitude and phase shift functionsfor the Ni–O1 and Ni–Ni2 atom pairs, used in the fits, wereextracted from the low temperature (T = 6 K) experimentaldata of c-NiO sample, assuming the crystallographic value ofthe lattice parameter a0 = 4.176 A.53 As a result, the temper-ature dependencies of the mean-square relative displacements(MSRDs) σ 2 and interatomic distances R were obtained andare shown in Figs. 3 and 4, respectively. Note that thus
0 2 4 6 8 10 12 14 16 18-6
-4
-2
0
2
4
nano-NiONi K-edge
10 K100 K200 K300 K
EX
AF
S χ
(k)k
2Å
-2
Wavenumber k (Å-1)
FIG. 2. (Color online) The Ni K-edge EXAFS spectra χ (k)k2
for nano-NiO at selected temperatures. Thermal disorder leads to theoscillations damping at high-k values.
0 50 100 150 200 250 300 350
0.000
0.002
0.004
0.006
0.008c-NiO (Ni-O1)
c-NiO (Ni-Ni2)
nano-NiO (Ni-O1)
nano-NiO (Ni-Ni2)
tf-NiO (Ni-O1)
tf-NiO (Ni-Ni2)
ΔσÅ
Temperature (K)
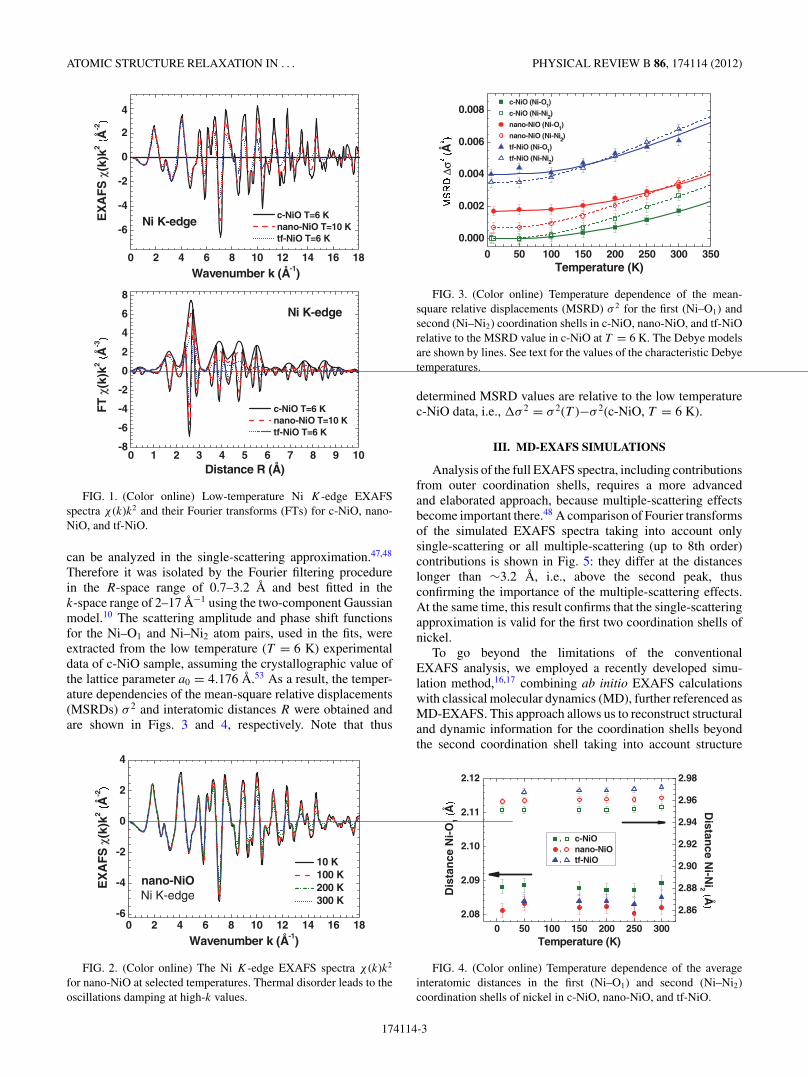
FIG. 3. (Color online) Temperature dependence of the mean-square relative displacements (MSRD) σ 2 for the first (Ni–O1) andsecond (Ni–Ni2) coordination shells in c-NiO, nano-NiO, and tf-NiOrelative to the MSRD value in c-NiO at T = 6 K. The Debye modelsare shown by lines. See text for the values of the characteristic Debyetemperatures.
determined MSRD values are relative to the low temperaturec-NiO data, i.e., �σ 2 = σ 2(T )−σ 2(c-NiO, T = 6 K).
III. MD-EXAFS SIMULATIONS
Analysis of the full EXAFS spectra, including contributionsfrom outer coordination shells, requires a more advancedand elaborated approach, because multiple-scattering effectsbecome important there.48 A comparison of Fourier transformsof the simulated EXAFS spectra taking into account onlysingle-scattering or all multiple-scattering (up to 8th order)contributions is shown in Fig. 5: they differ at the distanceslonger than ∼3.2 A, i.e., above the second peak, thusconfirming the importance of the multiple-scattering effects.At the same time, this result confirms that the single-scatteringapproximation is valid for the first two coordination shells ofnickel.
To go beyond the limitations of the conventionalEXAFS analysis, we employed a recently developed simu-lation method,16,17 combining ab initio EXAFS calculationswith classical molecular dynamics (MD), further referenced asMD-EXAFS. This approach allows us to reconstruct structuraland dynamic information for the coordination shells beyondthe second coordination shell taking into account structure
0 50 100 150 200 250 3002.08
2.09
2.10
2.11
2.12
Distan
ce Ni-N
i2ÅD
ista
nce
Ni-
O1
Å
Temperature (K)
,,,
2.86
2.88
2.90
2.92
2.94
2.96
2.98
c-NiOnano-NiOtf-NiO
FIG. 4. (Color online) Temperature dependence of the averageinteratomic distances in the first (Ni–O1) and second (Ni–Ni2)coordination shells of nickel in c-NiO, nano-NiO, and tf-NiO.
174114-3
A. ANSPOKS, A. KALINKO, R. KALENDAREV, AND A. KUZMIN PHYSICAL REVIEW B 86, 174114 (2012)
0 1 2 3 4 5 6
-4
-2
0
2
4 nano-NiO modelNi K-edge
FT
χ(k
)k2 (
Å-3)
Distance R (Å)
Multiple-scatteringSingle-scattering
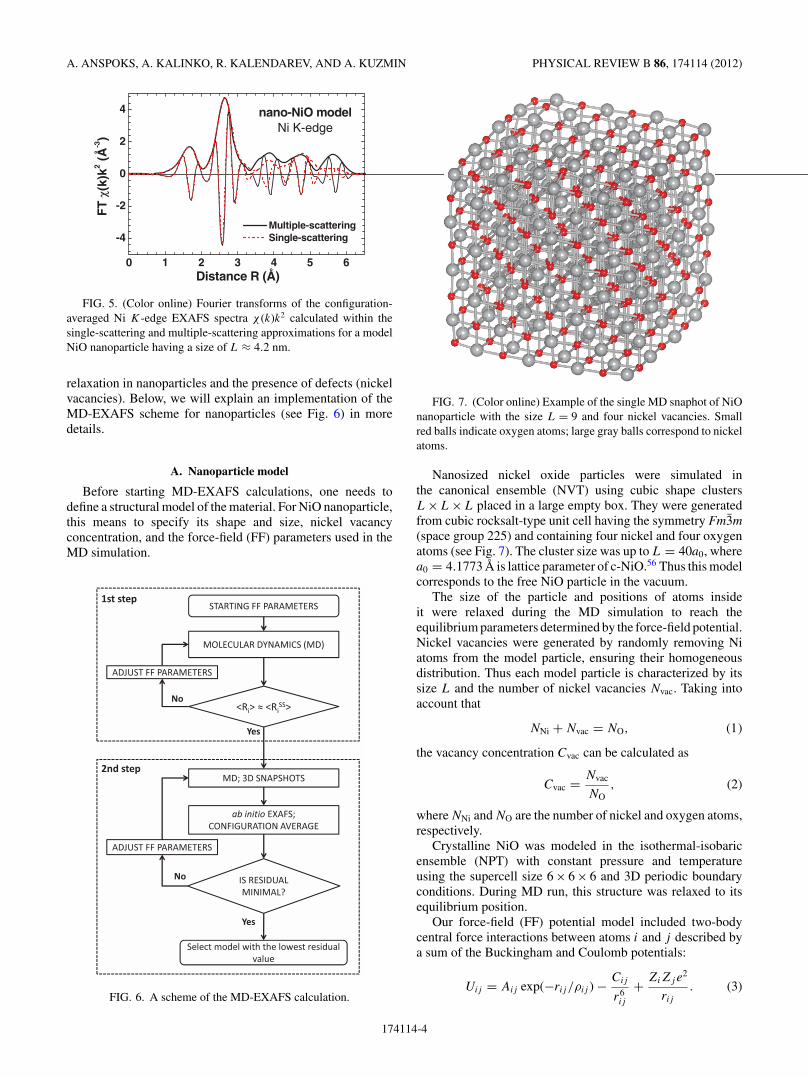
FIG. 5. (Color online) Fourier transforms of the configuration-averaged Ni K-edge EXAFS spectra χ (k)k2 calculated within thesingle-scattering and multiple-scattering approximations for a modelNiO nanoparticle having a size of L ≈ 4.2 nm.
relaxation in nanoparticles and the presence of defects (nickelvacancies). Below, we will explain an implementation of theMD-EXAFS scheme for nanoparticles (see Fig. 6) in moredetails.
A. Nanoparticle model
Before starting MD-EXAFS calculations, one needs todefine a structural model of the material. For NiO nanoparticle,this means to specify its shape and size, nickel vacancyconcentration, and the force-field (FF) parameters used in theMD simulation.
FIG. 6. A scheme of the MD-EXAFS calculation.
FIG. 7. (Color online) Example of the single MD snaphot of NiOnanoparticle with the size L = 9 and four nickel vacancies. Smallred balls indicate oxygen atoms; large gray balls correspond to nickelatoms.
Nanosized nickel oxide particles were simulated inthe canonical ensemble (NVT) using cubic shape clustersL×L×L placed in a large empty box. They were generatedfrom cubic rocksalt-type unit cell having the symmetry Fm3m(space group 225) and containing four nickel and four oxygenatoms (see Fig. 7). The cluster size was up to L = 40a0, wherea0 = 4.1773 A is lattice parameter of c-NiO.56 Thus this modelcorresponds to the free NiO particle in the vacuum.
The size of the particle and positions of atoms insideit were relaxed during the MD simulation to reach theequilibrium parameters determined by the force-field potential.Nickel vacancies were generated by randomly removing Niatoms from the model particle, ensuring their homogeneousdistribution. Thus each model particle is characterized by itssize L and the number of nickel vacancies Nvac. Taking intoaccount that
NNi + Nvac = NO, (1)
the vacancy concentration Cvac can be calculated as
Cvac = Nvac
NO, (2)
where NNi and NO are the number of nickel and oxygen atoms,respectively.
Crystalline NiO was modeled in the isothermal-isobaricensemble (NPT) with constant pressure and temperatureusing the supercell size 6 × 6 × 6 and 3D periodic boundaryconditions. During MD run, this structure was relaxed to itsequilibrium position.
Our force-field (FF) potential model included two-bodycentral force interactions between atoms i and j described bya sum of the Buckingham and Coulomb potentials:
Uij = Aij exp(−rij /ρij ) − Cij
r6ij
+ ZiZje2
rij
. (3)
174114-4
ATOMIC STRUCTURE RELAXATION IN . . . PHYSICAL REVIEW B 86, 174114 (2012)
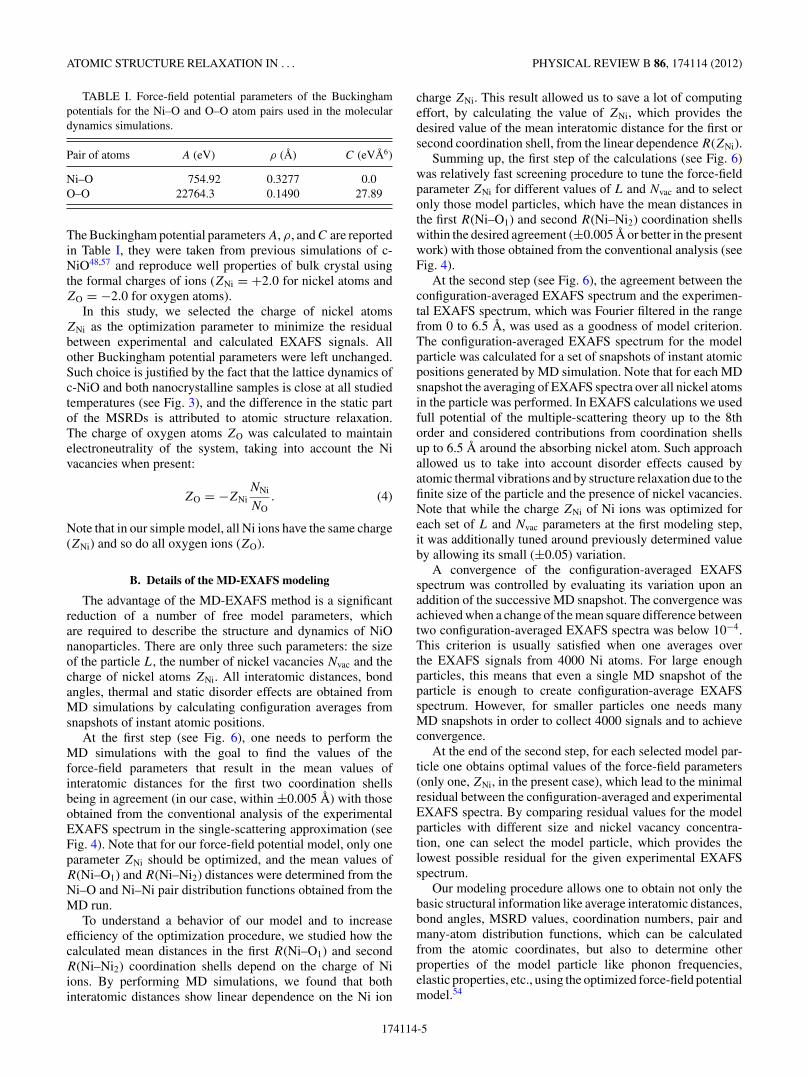
TABLE I. Force-field potential parameters of the Buckinghampotentials for the Ni–O and O–O atom pairs used in the moleculardynamics simulations.
Pair of atoms A (eV) ρ (A) C (eVA6)
Ni–O 754.92 0.3277 0.0O–O 22764.3 0.1490 27.89
The Buckingham potential parameters A, ρ, and C are reportedin Table I, they were taken from previous simulations of c-NiO48,57 and reproduce well properties of bulk crystal usingthe formal charges of ions (ZNi = +2.0 for nickel atoms andZO = −2.0 for oxygen atoms).
In this study, we selected the charge of nickel atomsZNi as the optimization parameter to minimize the residualbetween experimental and calculated EXAFS signals. Allother Buckingham potential parameters were left unchanged.Such choice is justified by the fact that the lattice dynamics ofc-NiO and both nanocrystalline samples is close at all studiedtemperatures (see Fig. 3), and the difference in the static partof the MSRDs is attributed to atomic structure relaxation.The charge of oxygen atoms ZO was calculated to maintainelectroneutrality of the system, taking into account the Nivacancies when present:
ZO = −ZNiNNi
NO. (4)
Note that in our simple model, all Ni ions have the same charge(ZNi) and so do all oxygen ions (ZO).
B. Details of the MD-EXAFS modeling
The advantage of the MD-EXAFS method is a significantreduction of a number of free model parameters, whichare required to describe the structure and dynamics of NiOnanoparticles. There are only three such parameters: the sizeof the particle L, the number of nickel vacancies Nvac and thecharge of nickel atoms ZNi. All interatomic distances, bondangles, thermal and static disorder effects are obtained fromMD simulations by calculating configuration averages fromsnapshots of instant atomic positions.
At the first step (see Fig. 6), one needs to perform theMD simulations with the goal to find the values of theforce-field parameters that result in the mean values ofinteratomic distances for the first two coordination shellsbeing in agreement (in our case, within ±0.005 A) with thoseobtained from the conventional analysis of the experimentalEXAFS spectrum in the single-scattering approximation (seeFig. 4). Note that for our force-field potential model, only oneparameter ZNi should be optimized, and the mean values ofR(Ni–O1) and R(Ni–Ni2) distances were determined from theNi–O and Ni–Ni pair distribution functions obtained from theMD run.
To understand a behavior of our model and to increaseefficiency of the optimization procedure, we studied how thecalculated mean distances in the first R(Ni–O1) and secondR(Ni–Ni2) coordination shells depend on the charge of Niions. By performing MD simulations, we found that bothinteratomic distances show linear dependence on the Ni ion
charge ZNi. This result allowed us to save a lot of computingeffort, by calculating the value of ZNi, which provides thedesired value of the mean interatomic distance for the first orsecond coordination shell, from the linear dependence R(ZNi).
Summing up, the first step of the calculations (see Fig. 6)was relatively fast screening procedure to tune the force-fieldparameter ZNi for different values of L and Nvac and to selectonly those model particles, which have the mean distances inthe first R(Ni–O1) and second R(Ni–Ni2) coordination shellswithin the desired agreement (±0.005 A or better in the presentwork) with those obtained from the conventional analysis (seeFig. 4).
At the second step (see Fig. 6), the agreement between theconfiguration-averaged EXAFS spectrum and the experimen-tal EXAFS spectrum, which was Fourier filtered in the rangefrom 0 to 6.5 A, was used as a goodness of model criterion.The configuration-averaged EXAFS spectrum for the modelparticle was calculated for a set of snapshots of instant atomicpositions generated by MD simulation. Note that for each MDsnapshot the averaging of EXAFS spectra over all nickel atomsin the particle was performed. In EXAFS calculations we usedfull potential of the multiple-scattering theory up to the 8thorder and considered contributions from coordination shellsup to 6.5 A around the absorbing nickel atom. Such approachallowed us to take into account disorder effects caused byatomic thermal vibrations and by structure relaxation due to thefinite size of the particle and the presence of nickel vacancies.Note that while the charge ZNi of Ni ions was optimized foreach set of L and Nvac parameters at the first modeling step,it was additionally tuned around previously determined valueby allowing its small (±0.05) variation.
A convergence of the configuration-averaged EXAFSspectrum was controlled by evaluating its variation upon anaddition of the successive MD snapshot. The convergence wasachieved when a change of the mean square difference betweentwo configuration-averaged EXAFS spectra was below 10−4.This criterion is usually satisfied when one averages overthe EXAFS signals from 4000 Ni atoms. For large enoughparticles, this means that even a single MD snapshot of theparticle is enough to create configuration-average EXAFSspectrum. However, for smaller particles one needs manyMD snapshots in order to collect 4000 signals and to achieveconvergence.
At the end of the second step, for each selected model par-ticle one obtains optimal values of the force-field parameters(only one, ZNi, in the present case), which lead to the minimalresidual between the configuration-averaged and experimentalEXAFS spectra. By comparing residual values for the modelparticles with different size and nickel vacancy concentra-tion, one can select the model particle, which provides thelowest possible residual for the given experimental EXAFSspectrum.
Our modeling procedure allows one to obtain not only thebasic structural information like average interatomic distances,bond angles, MSRD values, coordination numbers, pair andmany-atom distribution functions, which can be calculatedfrom the atomic coordinates, but also to determine otherproperties of the model particle like phonon frequencies,elastic properties, etc., using the optimized force-field potentialmodel.54
174114-5
A. ANSPOKS, A. KALINKO, R. KALENDAREV, AND A. KUZMIN PHYSICAL REVIEW B 86, 174114 (2012)
C. Details of the MD and EXAFS calculations
For classical MD simulations we used DLPOLY4.02 code,55
which is suitable for both crystalline and nanosized materials.The integration of Newton’s equations was performed by theleapfrog Verlet method. In each simulation, the structure wasfirst equilibrated during 75 ps at 300 K and zero pressure,corresponding to conditions of the EXAFS experiments, anda set of instantaneous atomic configurations was accumulatedduring next 20-ps production run with a time step of 0.5–2.0 fs, which is equivalent to the largest allowed change ofthe distance 0.1 A during the single time step. The calculatedsets of instantaneous atomic configurations were also used toevaluate the total and pair distribution functions. These PDFswere further decomposed into a set of Gaussian functions toevaluate the values of coordination numbers CN , interatomicdistances R, and corresponding MSRDs σ 2.
The Ni K-edge EXAFS spectra were calculated foreach instantaneous atomic configuration and for all absorber(nickel) atoms in each of these configurations using theab initio real-space multiple-scattering FEFF8 code.58 Thescattering potentials and partial phase shifts were evaluatedonly once for the average configuration, thus neglecting avariation of the scattering potentials due to a disorder.16
Since we are interested to account for the contributions fromthe outer coordination shells, it is important to take intoaccount the multiple-scattering effects.48 In our calculations,we considered the multiple-scattering contributions up to theeighth order with the half path length up to 6.5 A. To reduce thenumber of scattering paths, they were filtered using the cutoffcriteria (CRITERIA 0.0 1.7) as is implemented in the FEFF8
code.58 This means that all paths with the mean amplitude of1.7% and above of largest path, estimated within the planewave approximation, were kept. The inelastic losses weretaken into account using the complex exchange-correlationHedin-Lundqvist potential.14 The cluster potential was of themuffin-tin (MT) type, and the values of the MT radii wereRMT(Ni) = 1.319 A and RMT(O) = 1.021 A.
IV. RESULTS AND DISCUSSION
Temperature dependencies of the relative MSRDs �σ 2
and the interatomic distances R, obtained using conventionalanalysis10 for the first two coordination shells (O1 and Ni2)of nickel, are shown in Figs. 3 and 4, respectively. Thedifference between temperature dependencies of the MSRDs(see Fig. 3) for nano- and microcrystalline NiO samplesremains nearly constant in the whole range of temperaturesin both the first and second coordination shells. Its origin isdue to the static disorder in nanocrystalline NiO, which isinduced by a relaxation of its atomic structure. At the sametime, the thermal disorder contribution σ 2(T ) into the MSRDis close in all samples but differs for the first and secondcoordination shells, as expected. It can be well described by theDebye model61 with the following characteristic temperatures:θD(Ni–O1) = 680 K and θD(Ni–Ni2) = 425 K for c-NiO;θD(Ni–O1) = 680 K and θD(Ni–Ni2) = 415 K for nano-NiO;and θD(Ni–O1) = 600 K and θD(Ni–Ni2) = 390 K for tf-NiO.These values are consistent with those, θD(O) = 719 K andθD(Ni) = 366 K, derived in Ref. 62 from the bulk thermal
vibration amplitudes of nickel and oxygen atoms, obtainedwithin the simple Debye model by high-resolution 120 keVHe+ ion scattering at room temperature, and also with theresults of heat capacity measurements, θD(O) = 900 K andθD(Ni) = 425 K (see Ref. 63), θD(O) = 762.5 K and θD(Ni) =515.9 K (see Ref. 64).
The average second shell distance R(Ni–Ni2) in nanocrys-talline samples is longer by ∼0.01 A in nano-NiO and by∼0.02 A in tf-NiO than that in microcrystalline c-NiO at alltemperatures (see Fig. 4). This fact is in agreement with theoverall unit cell volume expansion upon a decrease of NiOnanocrystals size observed by diffraction.59,60 On the contraryto the second shell behavior, the average first shell R(Ni–O1)distance in all nanocrystalline samples is shorter comparedwith microcrystalline NiO (see Fig. 4). This interesting resulthas been found by us previously47,48 in nanosized NiOpowder at room temperature and now is confirmed in a widetemperature range for differently prepared NiO nanocrystallinesamples. We explored this controversy in the behavior ofthe first and second shell interatomic distances in details usingthe MD simulations of nanoparticles.
In our previous works,47,48 we have considered the modelof defect-free cubic NiO nanoparticles. Using such model wehave achieved good overall agreement with the experimentalNi K-edge EXAFS data and reproduced the expansion of theunit cell but not the contraction of the first coordination shellradius.
In the defect-free nanoparticles, the only source of thenearest bond Ni–O1 shortening is a relaxation at nanoparticlesurface. The influence of such relaxation on the averageNi–O1 distance increases upon a decrease of nanoparticle size,because of an increase in the ratio between the number of atomslocated at the surface relative to their total number. However,the experimental values of both average distances [R(Ni–O1)and R(Ni–Ni2)] can be reproduced only for unrealisticallysmall defect-free model of nanoparticle with the size L =3a0 ≈ 1.2 nm. Moreover, this model, being too simple, doesnot provide a good fit to the experimental EXAFS spectra. Thusone should search for a more elaborated model to explain theexperimental results.
The black color of our nanocrystalline samples gives strongevidence of the presence of nickel vacancies,30,49,50 thereforean apparent step towards an improvement of the nanoparticlemodel is to introduce the Ni vacancies and to test their influenceon the EXAFS spectra and structural parameters.
As we have noted previously,47 the force-field potentialparameters cannot be directly transformed from crystal tonanoparticles, since they lead to incorrect values of interatomicdistances and to incorrect relaxation. Thus, their additionaloptimization is required for nanoparticles. Previously,47,48
we have varied the ρ(Ni–O) and ρ(O–O) parameters of theBuckingham potential, which determine a position of thepotential minimum. The same results can be achieved bychanging the charge of ions. One should remember that inthe force-field potential model the ion charge is just anotherparameter to simulate the real interaction between atoms. Aswe have noted previously, in this study we have selected thecharge of nickel atoms ZNi as the optimization parameter tominimize the residual between the experimental and calculatedEXAFS signals.
174114-6
ATOMIC STRUCTURE RELAXATION IN . . . PHYSICAL REVIEW B 86, 174114 (2012)
O
Ni
~0.2Å
OO
ONiNi
NiOO
Ni~0.2Å~0.2Å
~0.08Å~0.08Å
~0.08Å~0.08Å
O
Ni
Ni
O ONiNi
~0.2Å
Ni NiOO
O
Ni
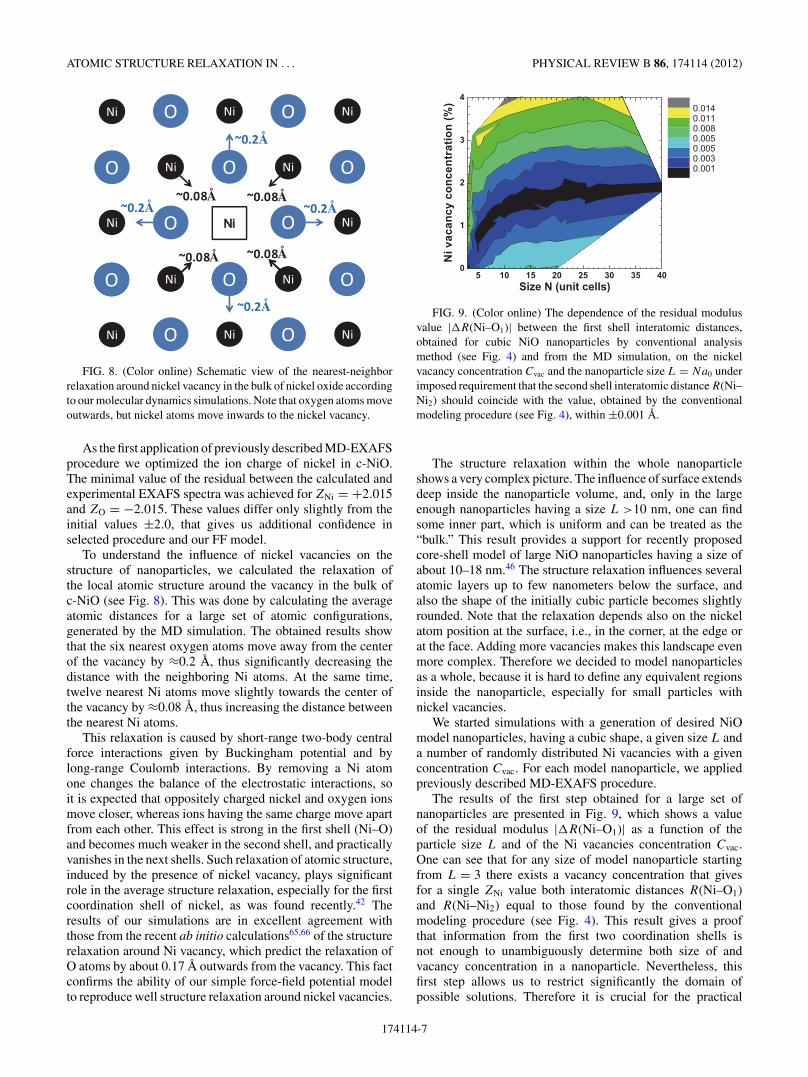
FIG. 8. (Color online) Schematic view of the nearest-neighborrelaxation around nickel vacancy in the bulk of nickel oxide accordingto our molecular dynamics simulations. Note that oxygen atoms moveoutwards, but nickel atoms move inwards to the nickel vacancy.
As the first application of previously described MD-EXAFSprocedure we optimized the ion charge of nickel in c-NiO.The minimal value of the residual between the calculated andexperimental EXAFS spectra was achieved for ZNi = +2.015and ZO = −2.015. These values differ only slightly from theinitial values ±2.0, that gives us additional confidence inselected procedure and our FF model.
To understand the influence of nickel vacancies on thestructure of nanoparticles, we calculated the relaxation ofthe local atomic structure around the vacancy in the bulk ofc-NiO (see Fig. 8). This was done by calculating the averageatomic distances for a large set of atomic configurations,generated by the MD simulation. The obtained results showthat the six nearest oxygen atoms move away from the centerof the vacancy by ≈0.2 A, thus significantly decreasing thedistance with the neighboring Ni atoms. At the same time,twelve nearest Ni atoms move slightly towards the center ofthe vacancy by ≈0.08 A, thus increasing the distance betweenthe nearest Ni atoms.
This relaxation is caused by short-range two-body centralforce interactions given by Buckingham potential and bylong-range Coulomb interactions. By removing a Ni atomone changes the balance of the electrostatic interactions, soit is expected that oppositely charged nickel and oxygen ionsmove closer, whereas ions having the same charge move apartfrom each other. This effect is strong in the first shell (Ni–O)and becomes much weaker in the second shell, and practicallyvanishes in the next shells. Such relaxation of atomic structure,induced by the presence of nickel vacancy, plays significantrole in the average structure relaxation, especially for the firstcoordination shell of nickel, as was found recently.42 Theresults of our simulations are in excellent agreement withthose from the recent ab initio calculations65,66 of the structurerelaxation around Ni vacancy, which predict the relaxation ofO atoms by about 0.17 A outwards from the vacancy. This factconfirms the ability of our simple force-field potential modelto reproduce well structure relaxation around nickel vacancies.
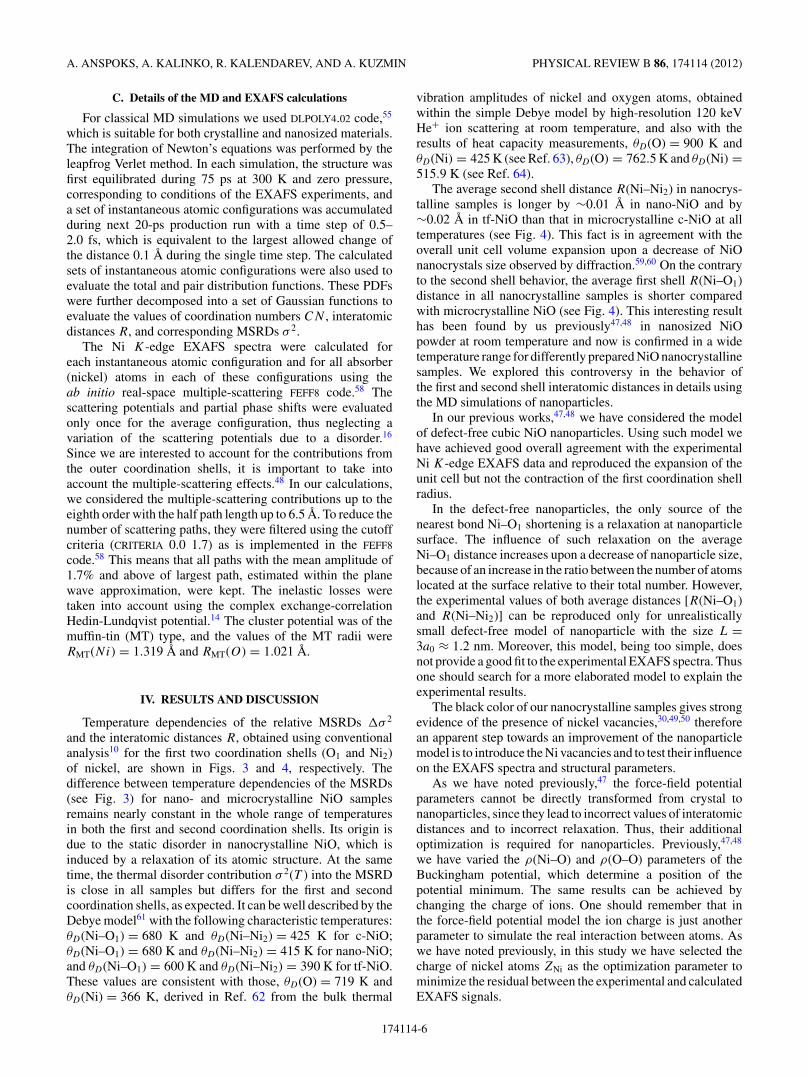
FIG. 9. (Color online) The dependence of the residual modulusvalue |�R(Ni–O1)| between the first shell interatomic distances,obtained for cubic NiO nanoparticles by conventional analysismethod (see Fig. 4) and from the MD simulation, on the nickelvacancy concentration Cvac and the nanoparticle size L = Na0 underimposed requirement that the second shell interatomic distance R(Ni–Ni2) should coincide with the value, obtained by the conventionalmodeling procedure (see Fig. 4), within ±0.001 A.
The structure relaxation within the whole nanoparticleshows a very complex picture. The influence of surface extendsdeep inside the nanoparticle volume, and, only in the largeenough nanoparticles having a size L >10 nm, one can findsome inner part, which is uniform and can be treated as the“bulk.” This result provides a support for recently proposedcore-shell model of large NiO nanoparticles having a size ofabout 10–18 nm.46 The structure relaxation influences severalatomic layers up to few nanometers below the surface, andalso the shape of the initially cubic particle becomes slightlyrounded. Note that the relaxation depends also on the nickelatom position at the surface, i.e., in the corner, at the edge orat the face. Adding more vacancies makes this landscape evenmore complex. Therefore we decided to model nanoparticlesas a whole, because it is hard to define any equivalent regionsinside the nanoparticle, especially for small particles withnickel vacancies.
We started simulations with a generation of desired NiOmodel nanoparticles, having a cubic shape, a given size L anda number of randomly distributed Ni vacancies with a givenconcentration Cvac. For each model nanoparticle, we appliedpreviously described MD-EXAFS procedure.
The results of the first step obtained for a large set ofnanoparticles are presented in Fig. 9, which shows a valueof the residual modulus |�R(Ni–O1)| as a function of theparticle size L and of the Ni vacancies concentration Cvac.One can see that for any size of model nanoparticle startingfrom L = 3 there exists a vacancy concentration that givesfor a single ZNi value both interatomic distances R(Ni–O1)and R(Ni–Ni2) equal to those found by the conventionalmodeling procedure (see Fig. 4). This result gives a proofthat information from the first two coordination shells isnot enough to unambiguously determine both size of andvacancy concentration in a nanoparticle. Nevertheless, thisfirst step allows us to restrict significantly the domain ofpossible solutions. Therefore it is crucial for the practical
174114-7
A. ANSPOKS, A. KALINKO, R. KALENDAREV, AND A. KUZMIN PHYSICAL REVIEW B 86, 174114 (2012)
implementation, since the calculation of the configuration-averaged EXAFS signal is very time consuming, especiallyin the case of nanoparticles having many non-equivalent atomsites.
At the second step we considered only those modelnanoparticles, which have the average distance in the firstR(Ni–O1) and second R(Ni–Ni2) coordination shells withinthe desired accuracy (±0.005 A or better in the present work)compared with the results of the conventional EXAFS analysis(see Sec. II). The configuration-averaged EXAFS spectrumfor each nanoparticle was calculated, taking into account themultiple-scattering effects, and the sum of squares of theresiduals between the experimental and model EXAFS spectrawas evaluated. A small variation of the Ni ions charge ZNi by±0.05 was also allowed to further minimize the residual value.
As a result, we found that there is a clear minimumin the dependence of the residual on the particle size andvacancy concentration, which determines the sought modelnanoparticle. Thus only comparison between the experimentaland configuration-averaged EXAFS spectra, using the fullpotential of the multiple-scattering theory, allowed us to selectthe best nanoparticle model, which also fulfills conditions ofthe first step. The experimental and theoretical EXAFS spectra
0 2 4 6 8 10 12 14 16 18
-3
0
3
Wavenumber k (Å-1)
-3
0
3
EX
AF
S χ
(k)k
2 (Å
-2)
experiment model
nano-NiO
experiment model
tf-NiO
0 1 2 3 4 5 60
2
4nano-NiO experiment
model
FT
χ(k
)k2 (
Å-3)
Distance R (Å)
0
2
4tf-NiO experiment
model
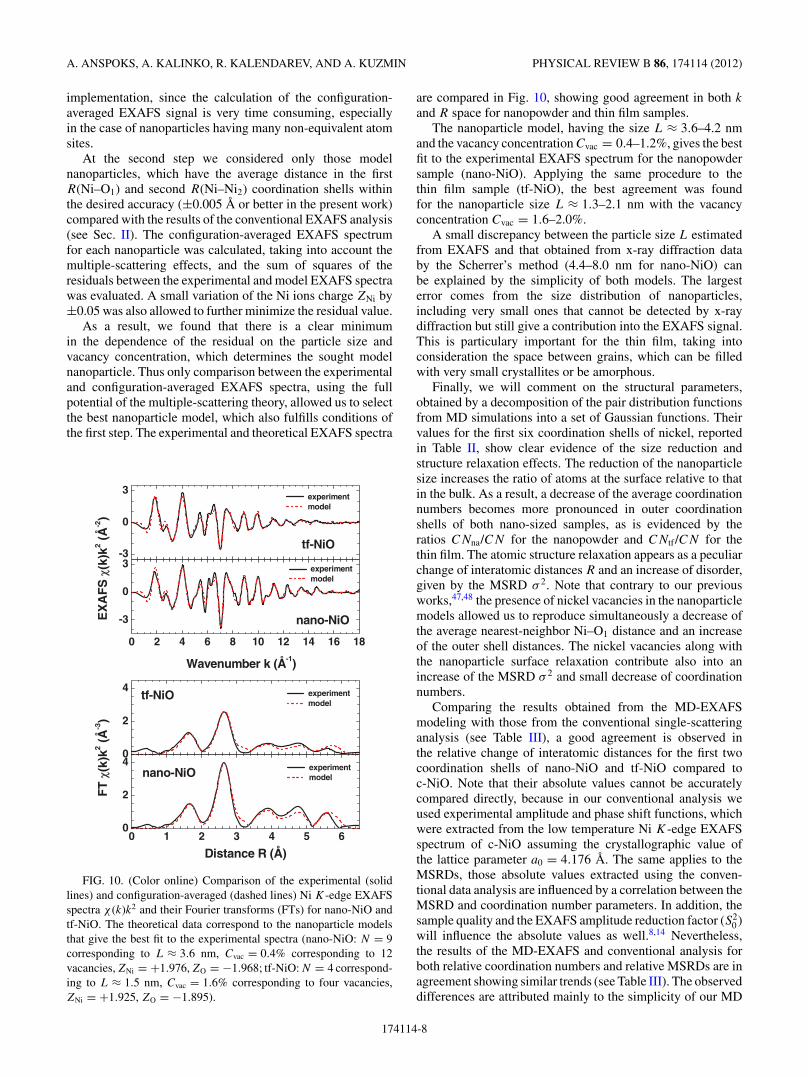
FIG. 10. (Color online) Comparison of the experimental (solidlines) and configuration-averaged (dashed lines) Ni K-edge EXAFSspectra χ (k)k2 and their Fourier transforms (FTs) for nano-NiO andtf-NiO. The theoretical data correspond to the nanoparticle modelsthat give the best fit to the experimental spectra (nano-NiO: N = 9corresponding to L ≈ 3.6 nm, Cvac = 0.4% corresponding to 12vacancies, ZNi = +1.976, ZO = −1.968; tf-NiO: N = 4 correspond-ing to L ≈ 1.5 nm, Cvac = 1.6% corresponding to four vacancies,ZNi = +1.925, ZO = −1.895).
are compared in Fig. 10, showing good agreement in both k
and R space for nanopowder and thin film samples.The nanoparticle model, having the size L ≈ 3.6–4.2 nm
and the vacancy concentration Cvac = 0.4–1.2%, gives the bestfit to the experimental EXAFS spectrum for the nanopowdersample (nano-NiO). Applying the same procedure to thethin film sample (tf-NiO), the best agreement was foundfor the nanoparticle size L ≈ 1.3–2.1 nm with the vacancyconcentration Cvac = 1.6–2.0%.
A small discrepancy between the particle size L estimatedfrom EXAFS and that obtained from x-ray diffraction databy the Scherrer’s method (4.4–8.0 nm for nano-NiO) canbe explained by the simplicity of both models. The largesterror comes from the size distribution of nanoparticles,including very small ones that cannot be detected by x-raydiffraction but still give a contribution into the EXAFS signal.This is particulary important for the thin film, taking intoconsideration the space between grains, which can be filledwith very small crystallites or be amorphous.
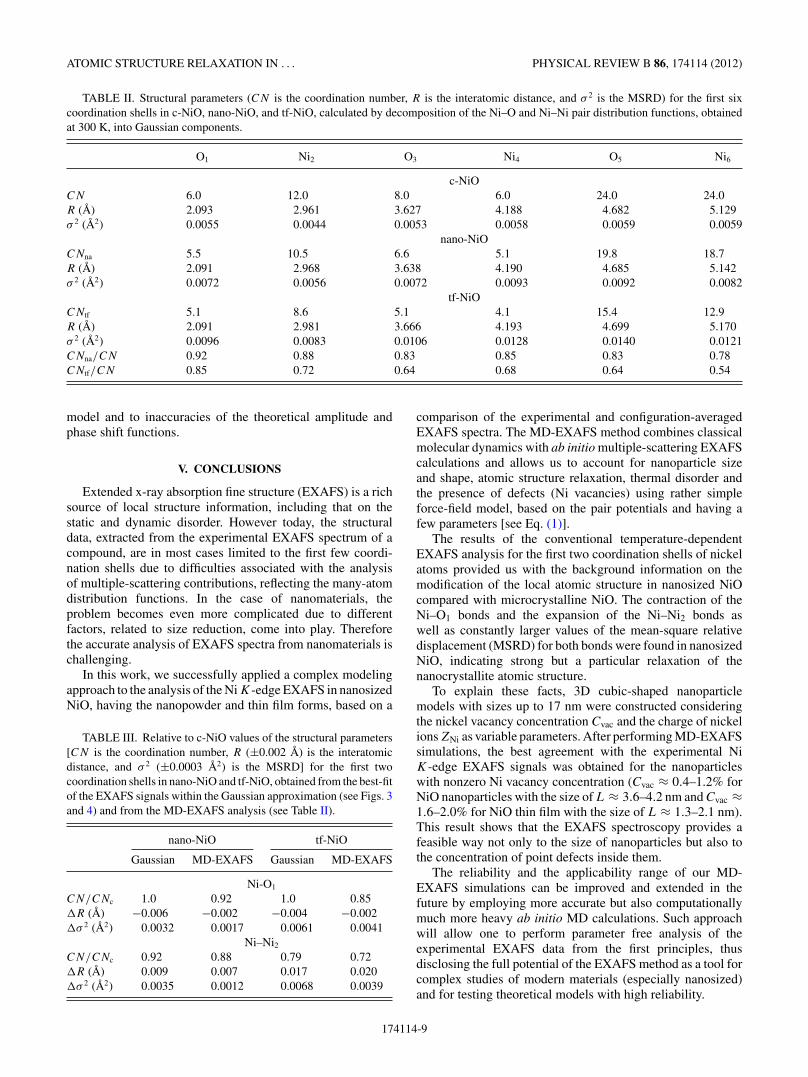
Finally, we will comment on the structural parameters,obtained by a decomposition of the pair distribution functionsfrom MD simulations into a set of Gaussian functions. Theirvalues for the first six coordination shells of nickel, reportedin Table II, show clear evidence of the size reduction andstructure relaxation effects. The reduction of the nanoparticlesize increases the ratio of atoms at the surface relative to thatin the bulk. As a result, a decrease of the average coordinationnumbers becomes more pronounced in outer coordinationshells of both nano-sized samples, as is evidenced by theratios CNna/CN for the nanopowder and CNtf /CN for thethin film. The atomic structure relaxation appears as a peculiarchange of interatomic distances R and an increase of disorder,given by the MSRD σ 2. Note that contrary to our previousworks,47,48 the presence of nickel vacancies in the nanoparticlemodels allowed us to reproduce simultaneously a decrease ofthe average nearest-neighbor Ni–O1 distance and an increaseof the outer shell distances. The nickel vacancies along withthe nanoparticle surface relaxation contribute also into anincrease of the MSRD σ 2 and small decrease of coordinationnumbers.
Comparing the results obtained from the MD-EXAFSmodeling with those from the conventional single-scatteringanalysis (see Table III), a good agreement is observed inthe relative change of interatomic distances for the first twocoordination shells of nano-NiO and tf-NiO compared toc-NiO. Note that their absolute values cannot be accuratelycompared directly, because in our conventional analysis weused experimental amplitude and phase shift functions, whichwere extracted from the low temperature Ni K-edge EXAFSspectrum of c-NiO assuming the crystallographic value ofthe lattice parameter a0 = 4.176 A. The same applies to theMSRDs, those absolute values extracted using the conven-tional data analysis are influenced by a correlation between theMSRD and coordination number parameters. In addition, thesample quality and the EXAFS amplitude reduction factor (S2
0 )will influence the absolute values as well.8,14 Nevertheless,the results of the MD-EXAFS and conventional analysis forboth relative coordination numbers and relative MSRDs are inagreement showing similar trends (see Table III). The observeddifferences are attributed mainly to the simplicity of our MD
174114-8
ATOMIC STRUCTURE RELAXATION IN . . . PHYSICAL REVIEW B 86, 174114 (2012)
TABLE II. Structural parameters (CN is the coordination number, R is the interatomic distance, and σ 2 is the MSRD) for the first sixcoordination shells in c-NiO, nano-NiO, and tf-NiO, calculated by decomposition of the Ni–O and Ni–Ni pair distribution functions, obtainedat 300 K, into Gaussian components.
O1 Ni2 O3 Ni4 O5 Ni6
c-NiOCN 6.0 12.0 8.0 6.0 24.0 24.0R (A) 2.093 2.961 3.627 4.188 4.682 5.129σ 2 (A2) 0.0055 0.0044 0.0053 0.0058 0.0059 0.0059
nano-NiOCNna 5.5 10.5 6.6 5.1 19.8 18.7R (A) 2.091 2.968 3.638 4.190 4.685 5.142σ 2 (A2) 0.0072 0.0056 0.0072 0.0093 0.0092 0.0082
tf-NiOCNtf 5.1 8.6 5.1 4.1 15.4 12.9R (A) 2.091 2.981 3.666 4.193 4.699 5.170σ 2 (A2) 0.0096 0.0083 0.0106 0.0128 0.0140 0.0121CNna/CN 0.92 0.88 0.83 0.85 0.83 0.78CNtf/CN 0.85 0.72 0.64 0.68 0.64 0.54
model and to inaccuracies of the theoretical amplitude andphase shift functions.
V. CONCLUSIONS
Extended x-ray absorption fine structure (EXAFS) is a richsource of local structure information, including that on thestatic and dynamic disorder. However today, the structuraldata, extracted from the experimental EXAFS spectrum of acompound, are in most cases limited to the first few coordi-nation shells due to difficulties associated with the analysisof multiple-scattering contributions, reflecting the many-atomdistribution functions. In the case of nanomaterials, theproblem becomes even more complicated due to differentfactors, related to size reduction, come into play. Thereforethe accurate analysis of EXAFS spectra from nanomaterials ischallenging.
In this work, we successfully applied a complex modelingapproach to the analysis of the Ni K-edge EXAFS in nanosizedNiO, having the nanopowder and thin film forms, based on a
TABLE III. Relative to c-NiO values of the structural parameters[CN is the coordination number, R (±0.002 A) is the interatomicdistance, and σ 2 (±0.0003 A2) is the MSRD] for the first twocoordination shells in nano-NiO and tf-NiO, obtained from the best-fitof the EXAFS signals within the Gaussian approximation (see Figs. 3and 4) and from the MD-EXAFS analysis (see Table II).
nano-NiO tf-NiO
Gaussian MD-EXAFS Gaussian MD-EXAFS
Ni-O1
CN/CNc 1.0 0.92 1.0 0.85�R (A) −0.006 −0.002 −0.004 −0.002�σ 2 (A2) 0.0032 0.0017 0.0061 0.0041
Ni–Ni2
CN/CNc 0.92 0.88 0.79 0.72�R (A) 0.009 0.007 0.017 0.020�σ 2 (A2) 0.0035 0.0012 0.0068 0.0039
comparison of the experimental and configuration-averagedEXAFS spectra. The MD-EXAFS method combines classicalmolecular dynamics with ab initio multiple-scattering EXAFScalculations and allows us to account for nanoparticle sizeand shape, atomic structure relaxation, thermal disorder andthe presence of defects (Ni vacancies) using rather simpleforce-field model, based on the pair potentials and having afew parameters [see Eq. (1)].
The results of the conventional temperature-dependentEXAFS analysis for the first two coordination shells of nickelatoms provided us with the background information on themodification of the local atomic structure in nanosized NiOcompared with microcrystalline NiO. The contraction of theNi–O1 bonds and the expansion of the Ni–Ni2 bonds aswell as constantly larger values of the mean-square relativedisplacement (MSRD) for both bonds were found in nanosizedNiO, indicating strong but a particular relaxation of thenanocrystallite atomic structure.
To explain these facts, 3D cubic-shaped nanoparticlemodels with sizes up to 17 nm were constructed consideringthe nickel vacancy concentration Cvac and the charge of nickelions ZNi as variable parameters. After performing MD-EXAFSsimulations, the best agreement with the experimental NiK-edge EXAFS signals was obtained for the nanoparticleswith nonzero Ni vacancy concentration (Cvac ≈ 0.4–1.2% forNiO nanoparticles with the size of L ≈ 3.6–4.2 nm and Cvac ≈1.6–2.0% for NiO thin film with the size of L ≈ 1.3–2.1 nm).This result shows that the EXAFS spectroscopy provides afeasible way not only to the size of nanoparticles but also tothe concentration of point defects inside them.
The reliability and the applicability range of our MD-EXAFS simulations can be improved and extended in thefuture by employing more accurate but also computationallymuch more heavy ab initio MD calculations. Such approachwill allow one to perform parameter free analysis of theexperimental EXAFS data from the first principles, thusdisclosing the full potential of the EXAFS method as a tool forcomplex studies of modern materials (especially nanosized)and for testing theoretical models with high reliability.
174114-9
A. ANSPOKS, A. KALINKO, R. KALENDAREV, AND A. KUZMIN PHYSICAL REVIEW B 86, 174114 (2012)
ACKNOWLEDGMENTS
The authors are grateful to Dr. Roman Chernikovfor assistance during EXAFS measurements atDESY. This work was supported by ESF Project2009/0202/1DP/1.1.1.2.0/09/APIA/VIAA/141 and Latvian
Government Research Grant No. 09.1518. The EXAFSexperiments at HASYLAB/DESY have been supported fromthe European Community’s Seventh Framework Programme(FP7/2007-2013) under grant agreement No. 226716 (ProjectI-20100110 EC).
*[email protected]†[email protected]‡[email protected]§[email protected]. Burda, X. Chen, R. Narayanan, and M. A. El-Sayed, Chem. Rev.105, 1025 (2005).
2M. Fernandez-Garcıa, A. Martınez-Arias, J. C. Hanson, and J. A.Rodriguez, Chem. Rev. 104, 4063 (2004).
3S. J. L. Billinge and I. Levin, Science 316, 516 (2007).4S. C. Ray, J. W. Chiou, W. F. Pong, and M.-H. Tsai, Crit. Rev. SolidState Mater. Sci. 31, 91 (2006).
5S. J. L. Billinge, J. Solid State Chem. 181, 1695 (2008).6H. Modrow, Appl. Spectroscopy Rev. 39, 183 (2004).7A. I. Frenkel, A. Yevick, C. Cooper, and R. Vasic, Annu. Rev. Anal.Chem. 4, 23 (2011).
8P. A. Lee, P. H. Citrin, P. Eisenberger, and B. M. Kincaid, Rev. Mod.Phys. 53, 769 (1981).
9G. Dalba, P. Fornasini, R. Grisenti, F. Rocca, D. Comedi, andI. Chambouleyron, Appl. Phys. Lett. 74, 281 (1999).
10V. L. Aksenov, M. V. Kovalchuk, A. Yu. Kuzmin, Yu. Purans, andS. I. Tyutyunnikov, Crystallogr. Rep. 51, 908 (2006).
11S. Larcheri, F. Rocca, F. Jandard, D. Pailharey, R. Graziola,A. Kuzmin, and J. Purans, Rev. Sci. Instrum. 79, 013702 (2008).
12P. Guttmann, C. Bittencourt, S. Rehbein, P. Umek, X. Ke, G. VanTendeloo, C. P. Ewels, and G. Schneider, Nat. Photon. 6, 25 (2011).
13C. R. Natoli, M. Benfatto, C. Brouder, M. F. RuizLopez, and D. L.Foulis, Phys. Rev. B 42, 1944 (1990).
14J. J. Rehr and R. C. Albers, Rev. Mod. Phys. 72, 621 (2000).15M. Benfatto, C. R. Natoli, and A. Filipponi, Phys. Rev. B 40, 9626
(1989).16A. Kuzmin and R. A. Evarestov, J. Phys.: Condens. Matter 21,
055401 (2009).17A. Kuzmin and R. A. Evarestov, J. Phys.: Conf. Series 190, 012024
(2009).18A. Kalinko, R. A. Evarestov, A. Kuzmin, and J. Purans, J. Phys.:
Conf. Series 190, 012080 (2009).19J. Timoshenko, A. Kuzmin, and J. Purans, Centr. Eur. J. Phys. 9,
710 (2011).20A. Kuzmin, V. Efimov, E. Efimova, V. Sikolenko, S. Pascarelli, and
I. O. Troyanchuk, Solid State Ionics 188, 21 (2011).21P. Vashishta, R. K. Kalia, and A. Nakano, J. Nanoparticle Res. 5,
119 (2003).22M. L. Klein and W. Shinoda, Science 321, 798 (2008).23K. M. Kim, D. S. Jeong, and C. S. Hwang, Nanotechnology 22,
254002 (2011).24H. Ohta, M. Hirano, K. Nakahara, H. Maruta, T. Tanabe, M. Kamiya,
T. Kamiya, and H. Hosono, Appl. Phys. Lett. 83, 1029 (2003).25T.-G. Seong, J.-S. Kim, K.-H. Cho, M. K. Yang, W. Kim, J.-K. Lee,
J. W. Moon, J. Roh, and S. Nahm, Jpn. J. Appl. Phys. 49, 121103(2010).
26G. A. Niklasson and C. G. Granqvist, J. Mater. Chem. 17, 127(2007).
27S. Seo, M. J. Lee, D. H. Seo, E. J. Jeoung, D. S. Suh, Y. S. Joung,I. K. Yoo, I. R. Hwang, S. H. Kim, I. S. Byun, J.-S. Kim, J. S. Choi,and B. H. Park, Appl. Phys. Lett. 85, 5655 (2004).
28T. Suzuki, Z. Hasan, Y. Funahashi, T. Yamaguchi, Y. Fujishiro, andM. Awano, Science 325, 852 (2009).
29C. G. Granqvist, Sol. Energy Mater. Sol. Cells 91, 1529 (2007).30H. Sato, T. Minami, S. Takata, and T. Yamada, Thin Solid Films
236, 27 (1993).31O. Kohmoto, H. Nakagawa, Y. Isagawa, and A. Chayahara, J. Magn.
Magn. Mater. 226, 1629 (2001).32J. Yu, K. M. Rosso, and S. M. Bruemmer, J. Phys. Chem. C 116,
1948 (2012).33A. G. McKale, G. S. Knapp, and S. K. Chan, Phys. Rev. B 33, 841
(1986).34A. Kuzmin, N. Mironova, J. Purans, and A. Rodionov, J. Phys.:
Condens. Matter 7, 9357 (1995).35R. V. Vedrinskii, V. L. Kraizman, A. A. Novakovich, Sh. M. Elyafi,
S. Bocharov, Th. Kirchner, and G. Drager, Phys. Status Solidi B226, 203 (2001).
36J. A. Rodriguez, J. C. Hanson, A. I. Frenkel, J. Y. Kim, andM. Perez, J. Am. Chem. Soc. 124, 346 (2002).
37P. Luches, E. Groppo, C. Prestipino, C. Lamberti, C. Giovanardi,and F. Boscherini, Nucl. Instrum. Methods Phys. Res., Sect. B 200,371 (2003).
38P. Luches, E. Groppo, S. D’Addato, C. Lamberti, C. Prestipino,S. Valeri, and F. Boscherini, Surf. Sci. 566–568, 84 (2004).
39E. Groppo, C. Prestipino, C. Lamberti, R. Carboni, F. Boscherini,P. Luches, S. Valeri, and S. D’Addato, Phys. Rev. B 70, 165408(2004).
40A. Kuzmin, J. Purans, and A. Rodionov, J. Phys.: Condens. Matter9, 6979 (1997).
41E. Avendano, A. Kuzmin, J. Purans, A. Azens, G. A. Niklasson,and C. G. Granqvist, Phys. Scr., T 115, 464 (2005).
42W.-L. Jang, Y.-M. Lu, W.-S. Hwang, T.-L. Hsiung, and H. P. Wang,Appl. Phys. Lett. 94, 062103 (2009).
43W. L. Jang, Y. M. Lu, W. S. Hwang, C. L. Dong, P. H. Hsieh,C. L. Chen, T. S. Chan, and J. F. Lee, Europhys. Lett. 96, 37009(2011).
44Y. Hattori, T. Konishi, and K. Kaneko, Chem. Phys. Lett. 355, 37(2002).
45C. T. Meneses, W. H. Flores, and J. M. Sasaki, Chem. Mater. 19,1024 (2007).
46S. Mandal, S. Banerjee, and K. S. R. Menon, Phys. Rev. B 80,214420 (2009).
47A. Anspoks, A. Kuzmin, A. Kalinko, and J. Timoshenko, SolidState Commun. 150, 2270 (2010).
48A. Anspoks and A. Kuzmin, J. Non-Cryst. Solids 357, 2604(2011).
174114-10
ATOMIC STRUCTURE RELAXATION IN . . . PHYSICAL REVIEW B 86, 174114 (2012)
49D. Adler and J. Feinleib, Phys. Rev. B 2, 3112(1970).
50P. Lunkenheimer, A. Loidl, C. R. Ottermann, and K. Bange, Phys.Rev. B 44, 5927 (1991).
51S. A. Makhlouf, F. T. Parker, F. E. Spada, and A. E. Berkowitz,J. Appl. Phys. 81, 5561 (1997).
52A. Kuzmin, Physica B 208-209, 175 (1995).53D. Rodic, V. Spasojevic, V. Kusigerski, R. Tellgren, and H. Rundlof,
Phys. Status Solidi B 218, 527 (2000).54J. Purans, A. Kuzmin, E. Cazzanelli, and G. Mariotto, J. Phys.:
Condens. Matter 19, 226206 (2007).55I. T. Todorov, W. Smith, K. Trachenko, and M. T. Dove, J. Mater.
Chem. 16, 1611 (2006).56A. Kuzmin and N. Mironova, J. Phys.: Condens. Matter 10, 7937
(1998).57C. A. J. Fisher, Scr. Mater. 50, 1045 (2004).
58A. L. Ankudinov, B. Ravel, J. J. Rehr, and S. D. Conradson, Phys.Rev. B 58, 7565 (1998).
59L. Li, L. Chen, R. Qihe, and G. Li, Appl. Phys. Lett. 89, 134102(2006).
60S. A. Makhlouf, M. A. Kassem, and M. A. Abdel-Rahim, J. Mater.Sci. 44, 3438 (2009).
61H. X. Gao, L. M. Penga, and J. M. Zuo, Acta Crystallogr. Sect. A55, 1014 (1999).
62T. Okazawa, Y. Nakagawa, and Y. Kido, Phys. Rev. B 69, 125412(2004).
63B. Bergman and J. Agren, J. Am. Ceram. Soc. 68, 444 (1985).64J. A. Hoffmann, A. Paskin, K. J. Tauer, and R. J. Weiss, J. Phys.
Chem. Solids 1, 45 (1956).65A. M. Ferrari and C. Pisani, J. Chem. Phys. 127, 174711 (2007).66S. Park, H.-S. Ahn, C.-K. Lee, H. Kim, H. Jin, H.-S. Lee, S. Seo,
J. Yu, and S. Han, Phys. Rev. B 77, 134103 (2008).
174114-11
Related Documents