Top Banner
Meteorology 311 Atmospheric Stability/Skew-T Diagrams Fall 2012
28

Atmospheric Stability/Skew-T Diagrams 311 Stability Stability describes how air parcels react to an initial vertical push by some external force. Forced to return to its original position:

May 27, 2018

Download

Documents

buianh
Welcome message from author
This document is posted to help you gain knowledge. Please leave a comment to let me know what you think about it! Share it to your friends and learn new things together.
Transcript
Page 1: Atmospheric Stability/Skew-T Diagrams 311 Stability Stability describes how air parcels react to an initial vertical push by some external force. Forced to return to its original position:

Meteorology 311

Atmospheric Stability/Skew-T Diagrams Fall 2012

Page 2: Atmospheric Stability/Skew-T Diagrams 311 Stability Stability describes how air parcels react to an initial vertical push by some external force. Forced to return to its original position:

Meteorology 311

Air Parcel

● Consider a parcel of infinitesimal dimensions that is:

● Thermally isolated from the environment so that its temperature changes adiabatically as it sinks or rises.

● Always at the same pressure as the environmental air at the same level, assumed to be in hydrostatic equilibrium.

● Moving slowly enough that its kinetic energy is a negligible fraction of its total energy.

Page 3: Atmospheric Stability/Skew-T Diagrams 311 Stability Stability describes how air parcels react to an initial vertical push by some external force. Forced to return to its original position:

Meteorology 311

Stability

● Stability describes how air parcels react to an initial vertical push by some external force.

● Forced to return to its original position: stable.

● Continues to accelerate away from its originial position without outside help: unstable.

● Continues to move away from its original position without accelerating: neutral.

Page 4: Atmospheric Stability/Skew-T Diagrams 311 Stability Stability describes how air parcels react to an initial vertical push by some external force. Forced to return to its original position:

Meteorology 311

Stability cont.

● Consider a small disturbance from equilibrium....– Note: Primed values refer to the PARCEL.

● P = P'

● Adiabatic, displacements on small time scales.

Page 5: Atmospheric Stability/Skew-T Diagrams 311 Stability Stability describes how air parcels react to an initial vertical push by some external force. Forced to return to its original position:

Meteorology 311

Lapse Rates● Dry adiabatic lapse rate

– Rate at which “dry” parcel changes temperature if raised or lowered in the atmosphere.

– 10 °C/km● Moist adiabatic lapse rate

– Rate at which “moist” parcel changes temperature if raised or lowered in the atmosphere.

– 6 °C/km● Environmental lapse rate, Γ

– Temperature structure of the environment.

Page 6: Atmospheric Stability/Skew-T Diagrams 311 Stability Stability describes how air parcels react to an initial vertical push by some external force. Forced to return to its original position:

Meteorology 311

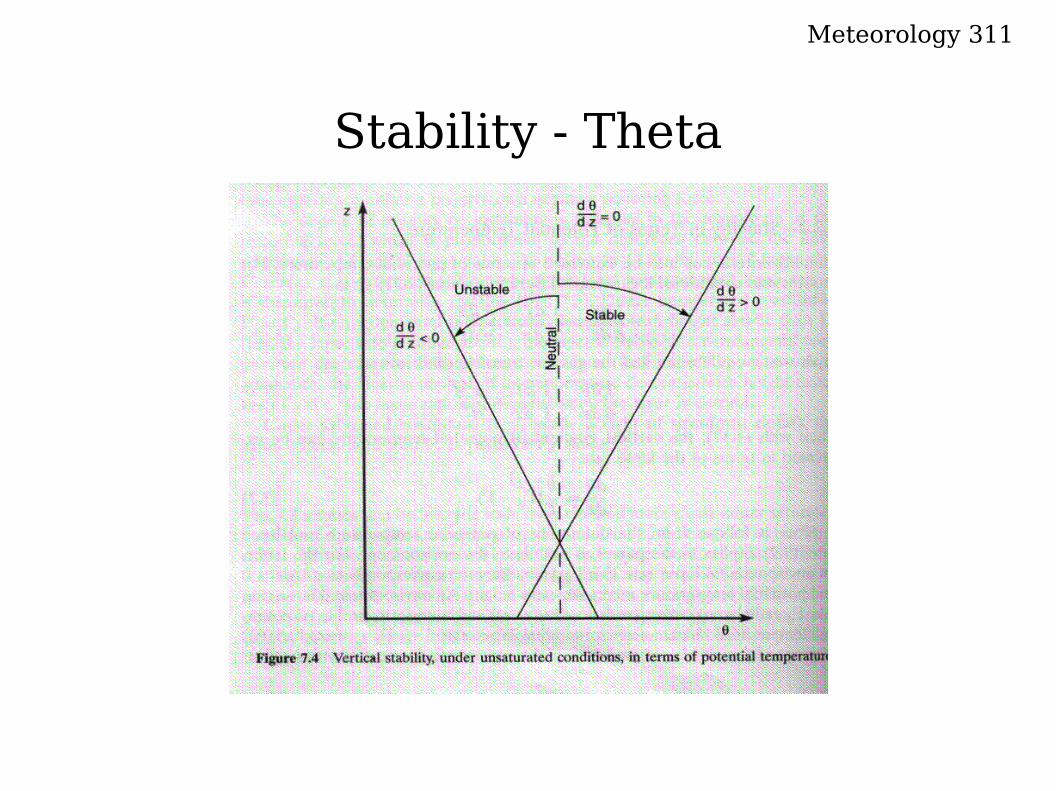
Γ < Parcel Lapse rate

● Buoyant acceleration < 0.

● Buoyant force is opposite the displacement (negatively buoyant).

● Positive restoring force.

● Hydrostatically stable or positive stability.

Page 7: Atmospheric Stability/Skew-T Diagrams 311 Stability Stability describes how air parcels react to an initial vertical push by some external force. Forced to return to its original position:

Meteorology 311

Γ = Parcel Lapse Rate

● Buoyant acceleration = 0.

● No restoring force.

● Displacements are met without opposition.

● Hydrostatically neutral or neutral stability.

Page 8: Atmospheric Stability/Skew-T Diagrams 311 Stability Stability describes how air parcels react to an initial vertical push by some external force. Forced to return to its original position:

Meteorology 311

Γ> Parcel Lapse Rate

● Buoyant acceleration > 0

● Buoyant force in direction of displacement.

● Negative restoring force.

● Hydrostatically unstable or negative stability.

Page 9: Atmospheric Stability/Skew-T Diagrams 311 Stability Stability describes how air parcels react to an initial vertical push by some external force. Forced to return to its original position:

Meteorology 311

Stability - Visually

Page 10: Atmospheric Stability/Skew-T Diagrams 311 Stability Stability describes how air parcels react to an initial vertical push by some external force. Forced to return to its original position:

Meteorology 311

Stability – Visual cont.

Page 11: Atmospheric Stability/Skew-T Diagrams 311 Stability Stability describes how air parcels react to an initial vertical push by some external force. Forced to return to its original position:

Meteorology 311

Stability - Theta

Page 12: Atmospheric Stability/Skew-T Diagrams 311 Stability Stability describes how air parcels react to an initial vertical push by some external force. Forced to return to its original position:

Meteorology 311

Moisture● Γ < Γ

m < Γd

– Absolutely stable.

● Γ > Γd > Γm

– Absolutely unstable.

● Γm< Γ < Γd

– Conditionally unstable.– Stable for unsaturated conditions.– Unstable for saturated conditions.

Page 13: Atmospheric Stability/Skew-T Diagrams 311 Stability Stability describes how air parcels react to an initial vertical push by some external force. Forced to return to its original position:

Meteorology 311

Conditional Stability

Page 14: Atmospheric Stability/Skew-T Diagrams 311 Stability Stability describes how air parcels react to an initial vertical push by some external force. Forced to return to its original position:

Meteorology 311

Vertical Motion

● Stability determines a layers ability to support vertical motion and transfer of heat, momentum, and constituents.

● How do you get vertical motion?– Frontal boundaries (airmass differences)– Topography– Convergence (continuity equation)– Differential heating

Page 15: Atmospheric Stability/Skew-T Diagrams 311 Stability Stability describes how air parcels react to an initial vertical push by some external force. Forced to return to its original position:

Meteorology 311

Changes in Lapse Rate

● Environmental Lapse Rate can change over time.

● Non-adiabatic heating and cooling● Solid advection● Differential advection● Vertical motion

Page 16: Atmospheric Stability/Skew-T Diagrams 311 Stability Stability describes how air parcels react to an initial vertical push by some external force. Forced to return to its original position:

Meteorology 311

Thermodynamic Diagrams

● Let us plot the vertical structure of the atmosphere.

● Tephigram● Stuve Diagram

– Pseudo-adiabatic chart ● Skew-T, log P diagram

– Most used operationally by forecasters.

Page 17: Atmospheric Stability/Skew-T Diagrams 311 Stability Stability describes how air parcels react to an initial vertical push by some external force. Forced to return to its original position:

Meteorology 311

Skew-T Diagram

● Y-Axis is logarithmic in pressure.● Isotherms are “skewed” 45° from lower left to

upper right.● Dry adiabats: slope from upper left to lower

right. Label in degrees Celcius.● Saturation or “moist” adiabats – curved

– (green on official charts)● Mixing ratio lines: dashed and slope a little from

lower left to upper right (g/kg).

Page 18: Atmospheric Stability/Skew-T Diagrams 311 Stability Stability describes how air parcels react to an initial vertical push by some external force. Forced to return to its original position:

Meteorology 311

Movement

● If air is dry (not-saturated), θ is conserved.– Adiabatic, move along a dry adiabat or line of

constant θ.– Mixing ratio does not change.

● If air is saturated, moisture condenses or evaporates, heat released impacts the temperature.– θe and θw keep the same value.

– Mixing ratio changes.

Page 19: Atmospheric Stability/Skew-T Diagrams 311 Stability Stability describes how air parcels react to an initial vertical push by some external force. Forced to return to its original position:

Meteorology 311

Temperatures

● Potential tempertature– Conserved in an adiabatic process– Dry adiabat

● Wet-bulb temperature– Conserved in a moist adiabatic process– Moist adiabat

● Equivalent potential temperature– Raise parcel until all moisture has condensed out and

bring parcel back to 1000mb.– Used to compare parcels with different mositure

contents and temperatures.

Page 20: Atmospheric Stability/Skew-T Diagrams 311 Stability Stability describes how air parcels react to an initial vertical push by some external force. Forced to return to its original position:

Meteorology 311

Important Variables● Mixing ratio (w)

– Use w line through Td.

● Saturated mixing ratio (ws).

– Use w line through T.● RH = 100% (w/ws)

● Vapor pressure (e)– Go from Td up isotherm to 622mb and read off mixing

ratio in mb.● Saturation vapor pressure

– Use T, not Td.

Page 21: Atmospheric Stability/Skew-T Diagrams 311 Stability Stability describes how air parcels react to an initial vertical push by some external force. Forced to return to its original position:

Meteorology 311

More Variables

● Wet-bulb temperature (Tw).

● Wet-bulb potential temperature (θw).

● Equivalent temperature (Te).

● Equivalent potential temperature (θe).

Page 22: Atmospheric Stability/Skew-T Diagrams 311 Stability Stability describes how air parcels react to an initial vertical push by some external force. Forced to return to its original position:

Meteorology 311

Important Levels● LCL – lifting condensation level

– Where lifted air becomes saturated.● LFC – level of free convection

– Where lifted air becomes positively buoyant.● EL – Equilibrium level

– Where lifted air becomes negatively buoyant up high.

● CCL – Convective condensation level.– Height to which a parcel of air would rise

adiabatically to saturation from surface heating.

Page 23: Atmospheric Stability/Skew-T Diagrams 311 Stability Stability describes how air parcels react to an initial vertical push by some external force. Forced to return to its original position:

Meteorology 311

CAPE

● CAPE = Convective Available Potential Energy

● Positive area between parcel path and environmental profile.

● Gives energy available to be converted to kinetic energy and upward motion.

Page 24: Atmospheric Stability/Skew-T Diagrams 311 Stability Stability describes how air parcels react to an initial vertical push by some external force. Forced to return to its original position:

Meteorology 311

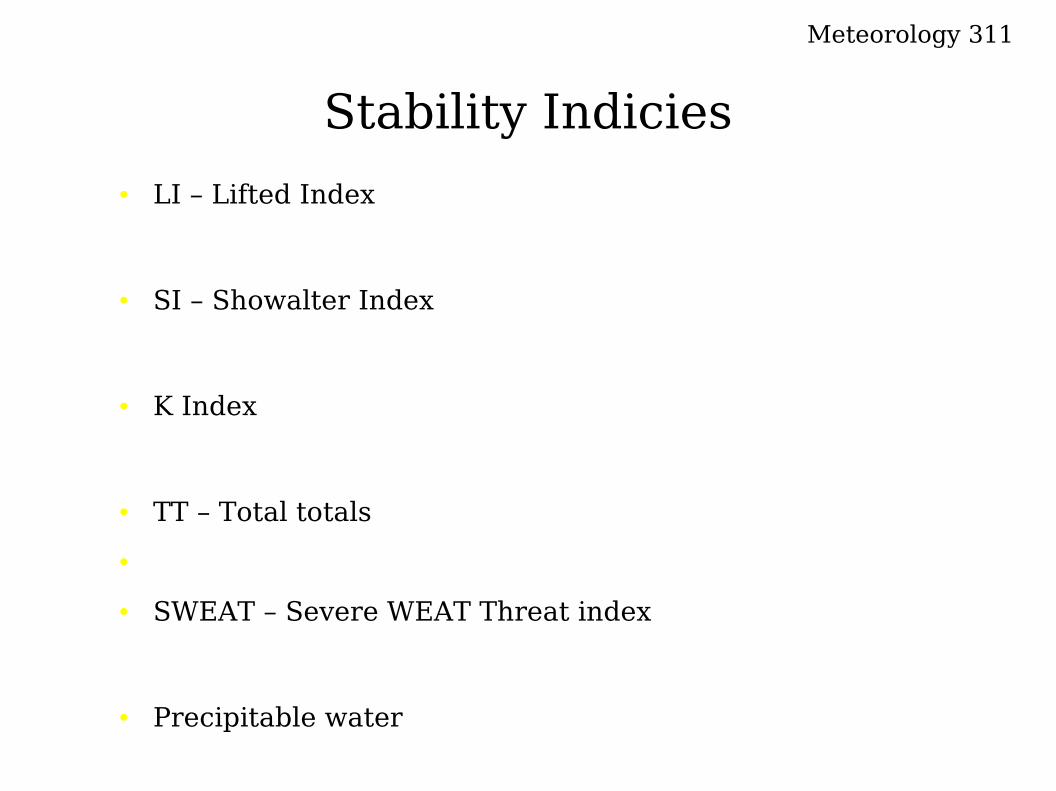
Stability Indicies● LI – Lifted Index

● SI – Showalter Index

● K Index

● TT – Total totals●

● SWEAT – Severe WEAT Threat index

● Precipitable water

Page 25: Atmospheric Stability/Skew-T Diagrams 311 Stability Stability describes how air parcels react to an initial vertical push by some external force. Forced to return to its original position:

Meteorology 311

Example #1

Page 26: Atmospheric Stability/Skew-T Diagrams 311 Stability Stability describes how air parcels react to an initial vertical push by some external force. Forced to return to its original position:

Meteorology 311

Example #2

Page 27: Atmospheric Stability/Skew-T Diagrams 311 Stability Stability describes how air parcels react to an initial vertical push by some external force. Forced to return to its original position:

Meteorology 311

Example #3

Page 28: Atmospheric Stability/Skew-T Diagrams 311 Stability Stability describes how air parcels react to an initial vertical push by some external force. Forced to return to its original position:

Meteorology 311

Example #4