Atmospheric sources and sinks of volcanogenic elements in a basaltic volcano (Etna, Italy) S. Calabrese a,⇑ , A. Aiuppa a,b , P. Allard c , E. Bagnato a , S. Bellomo b , L. Brusca b , W. D’Alessandro b , F. Parello a a Dipartimento di Scienze della Terra e del Mare (DiSTeM), Universita ` di Palermo, via Archirafi 36, 90123 Palermo, Italy b Istituto Nazionale di Geofisica e Vulcanologia, Sezione di Palermo, via La Malfa 153, 90146 Palermo, Italy c Institut de Physique du Globe, Sorbonne Paris Cite, 1 rue Jussieu, 75238 Paris Cedex 05, France Received 28 November 2010; accepted in revised form 14 September 2011 Abstract This study reports on the first quantitative assessment of the geochemical cycling of volcanogenic elements, from their atmospheric release to their deposition back to the ground. Etna’s emissions and atmospheric depositions were characterised for more than 2 years, providing data on major and trace element abundance in both volcanic aerosols and bulk depositions. Volcanic aerosols were collected from 2004 to 2007, at the summit vents by conventional filtration techniques. Precipitation was collected, from 2006 to 2007, in five rain gauges, at various altitudes around the summit craters. Analytical results for volcanic aerosols showed that the dominant anions were S, Cl, and F, and that the most abundant metals were K, Ca, Mg, Al, Fe, and Ti (1.5–50 lgm 3 ). Minor and trace element concentrations ranged from about 0.001 to 1 lgm 3 . From such analysis, we derived an aerosol mass flux ranging from 3000 to 8000 t a 1 . Most analysed elements had higher concen- trations close to the emission vent, confirming the prevailing volcanic contribution to bulk deposition. Calculated deposition rates were integrated over the whole Etna area, to provide a first estimate of the total deposition fluxes for several major and trace elements. These calculated deposition fluxes ranged from 20 to 80 t a 1 (Al, Fe, Si) to 0.01–0.1 t a 1 (Bi, Cs, Sc, Th, Tl, and U). Comparison between volcanic emissions and atmospheric deposition showed that the amount of trace elements scav- enged from the plume in the surrounding of the volcano ranged from 0.1% to 1% for volatile elements such as As, Bi, Cd, Cs, Cu, Tl, and from 1% to 5% for refractory elements such as Al, Ba, Co, Fe, Ti, Th, U, and V. Consequently, more than 90% of volcanogenic trace elements were dispersed further away, and may cause a regional scale impact. Such a large difference between deposition and emission fluxes at Mt. Etna pointed to relatively high stability and long residence time of aerosols in the plume. Ó 2011 Elsevier Ltd. All rights reserved. 1. INTRODUCTION The anthropogenically perturbed biogeochemical cycles of trace elements are contributed by a variety of natural sources, among which volcanic degassing clearly stands out (Nriagu, 1989). It is no doubt that volcanic emissions are important sources of metal-bearing gases and particles into the atmosphere (Cadle, 1980; Nriagu, 1989; Hinkley et al., 1999; Oppenheimer, 2003; Mather et al., 2003), as demonstrated by metal output inventories evaluated for a number of volcanoes, including Kilauea (Cadle et al., 1973; Crowe et al., 1987; Hinkley et al., 1999), Etna (Buat-Me ´nard and Arnold, 1978; Quisefit et al., 1982; Bergametti et al., 1984; Pennisi et al., 1988; Andres et al., 1993; Toutain et al., 1995; Gauthier and Le Cloarec, 1998; Aiuppa et al., 2003; Allen et al., 2006; Bagnato 0016-7037/$ - see front matter Ó 2011 Elsevier Ltd. All rights reserved. doi:10.1016/j.gca.2011.09.040 ⇑ Corresponding author. Tel.: +39 3494266907; fax: +39 0916168376. E-mail addresses: [email protected], sergio. [email protected] (S. Calabrese). www.elsevier.com/locate/gca Available online at www.sciencedirect.com Geochimica et Cosmochimica Acta 75 (2011) 7401–7425

Welcome message from author
This document is posted to help you gain knowledge. Please leave a comment to let me know what you think about it! Share it to your friends and learn new things together.
Transcript

Available online at www.sciencedirect.com
www.elsevier.com/locate/gca
Geochimica et Cosmochimica Acta 75 (2011) 7401–7425
Atmospheric sources and sinks of volcanogenic elementsin a basaltic volcano (Etna, Italy)
S. Calabrese a,⇑, A. Aiuppa a,b, P. Allard c, E. Bagnato a, S. Bellomo b, L. Brusca b,W. D’Alessandro b, F. Parello a
a Dipartimento di Scienze della Terra e del Mare (DiSTeM), Universita di Palermo, via Archirafi 36, 90123 Palermo, Italyb Istituto Nazionale di Geofisica e Vulcanologia, Sezione di Palermo, via La Malfa 153, 90146 Palermo, Italy
c Institut de Physique du Globe, Sorbonne Paris Cite, 1 rue Jussieu, 75238 Paris Cedex 05, France
Received 28 November 2010; accepted in revised form 14 September 2011
Abstract
This study reports on the first quantitative assessment of the geochemical cycling of volcanogenic elements, from theiratmospheric release to their deposition back to the ground. Etna’s emissions and atmospheric depositions were characterisedfor more than 2 years, providing data on major and trace element abundance in both volcanic aerosols and bulk depositions.Volcanic aerosols were collected from 2004 to 2007, at the summit vents by conventional filtration techniques. Precipitationwas collected, from 2006 to 2007, in five rain gauges, at various altitudes around the summit craters. Analytical results forvolcanic aerosols showed that the dominant anions were S, Cl, and F, and that the most abundant metals were K, Ca,Mg, Al, Fe, and Ti (1.5–50 lg m�3). Minor and trace element concentrations ranged from about 0.001 to 1 lg m�3. Fromsuch analysis, we derived an aerosol mass flux ranging from 3000 to 8000 t a�1. Most analysed elements had higher concen-trations close to the emission vent, confirming the prevailing volcanic contribution to bulk deposition. Calculated depositionrates were integrated over the whole Etna area, to provide a first estimate of the total deposition fluxes for several major andtrace elements. These calculated deposition fluxes ranged from 20 to 80 t a�1 (Al, Fe, Si) to 0.01–0.1 t a�1 (Bi, Cs, Sc, Th, Tl,and U). Comparison between volcanic emissions and atmospheric deposition showed that the amount of trace elements scav-enged from the plume in the surrounding of the volcano ranged from 0.1% to 1% for volatile elements such as As, Bi, Cd, Cs,Cu, Tl, and from 1% to 5% for refractory elements such as Al, Ba, Co, Fe, Ti, Th, U, and V. Consequently, more than 90% ofvolcanogenic trace elements were dispersed further away, and may cause a regional scale impact. Such a large differencebetween deposition and emission fluxes at Mt. Etna pointed to relatively high stability and long residence time of aerosolsin the plume.� 2011 Elsevier Ltd. All rights reserved.
1. INTRODUCTION
The anthropogenically perturbed biogeochemical cyclesof trace elements are contributed by a variety of naturalsources, among which volcanic degassing clearly stands
0016-7037/$ - see front matter � 2011 Elsevier Ltd. All rights reserved.
doi:10.1016/j.gca.2011.09.040
⇑ Corresponding author. Tel.: +39 3494266907; fax: +390916168376.
E-mail addresses: [email protected], [email protected] (S. Calabrese).
out (Nriagu, 1989). It is no doubt that volcanic emissionsare important sources of metal-bearing gases and particlesinto the atmosphere (Cadle, 1980; Nriagu, 1989; Hinkleyet al., 1999; Oppenheimer, 2003; Mather et al., 2003), asdemonstrated by metal output inventories evaluated for anumber of volcanoes, including Kilauea (Cadle et al.,1973; Crowe et al., 1987; Hinkley et al., 1999), Etna(Buat-Menard and Arnold, 1978; Quisefit et al., 1982;Bergametti et al., 1984; Pennisi et al., 1988; Andres et al.,1993; Toutain et al., 1995; Gauthier and Le Cloarec,1998; Aiuppa et al., 2003; Allen et al., 2006; Bagnato
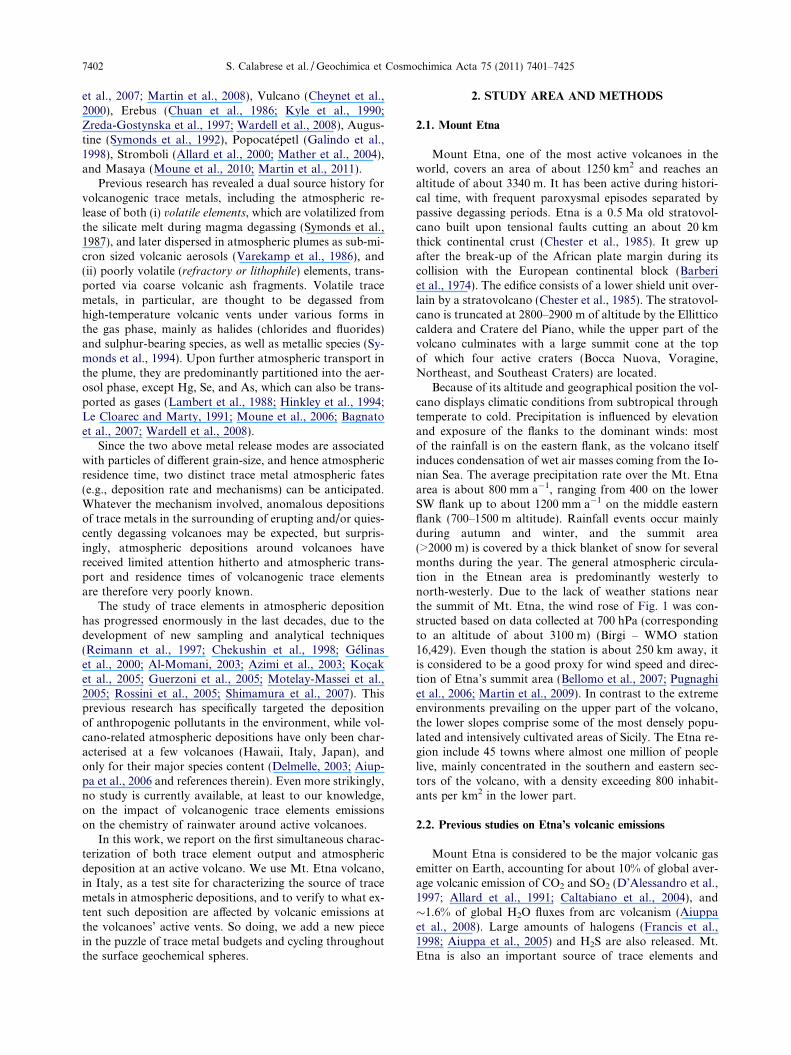
7402 S. Calabrese et al. / Geochimica et Cosmochimica Acta 75 (2011) 7401–7425
et al., 2007; Martin et al., 2008), Vulcano (Cheynet et al.,2000), Erebus (Chuan et al., 1986; Kyle et al., 1990;Zreda-Gostynska et al., 1997; Wardell et al., 2008), Augus-tine (Symonds et al., 1992), Popocatepetl (Galindo et al.,1998), Stromboli (Allard et al., 2000; Mather et al., 2004),and Masaya (Moune et al., 2010; Martin et al., 2011).
Previous research has revealed a dual source history forvolcanogenic trace metals, including the atmospheric re-lease of both (i) volatile elements, which are volatilized fromthe silicate melt during magma degassing (Symonds et al.,1987), and later dispersed in atmospheric plumes as sub-mi-cron sized volcanic aerosols (Varekamp et al., 1986), and(ii) poorly volatile (refractory or lithophile) elements, trans-ported via coarse volcanic ash fragments. Volatile tracemetals, in particular, are thought to be degassed fromhigh-temperature volcanic vents under various forms inthe gas phase, mainly as halides (chlorides and fluorides)and sulphur-bearing species, as well as metallic species (Sy-monds et al., 1994). Upon further atmospheric transport inthe plume, they are predominantly partitioned into the aer-osol phase, except Hg, Se, and As, which can also be trans-ported as gases (Lambert et al., 1988; Hinkley et al., 1994;Le Cloarec and Marty, 1991; Moune et al., 2006; Bagnatoet al., 2007; Wardell et al., 2008).
Since the two above metal release modes are associatedwith particles of different grain-size, and hence atmosphericresidence time, two distinct trace metal atmospheric fates(e.g., deposition rate and mechanisms) can be anticipated.Whatever the mechanism involved, anomalous depositionsof trace metals in the surrounding of erupting and/or quies-cently degassing volcanoes may be expected, but surpris-ingly, atmospheric depositions around volcanoes havereceived limited attention hitherto and atmospheric trans-port and residence times of volcanogenic trace elementsare therefore very poorly known.
The study of trace elements in atmospheric depositionhas progressed enormously in the last decades, due to thedevelopment of new sampling and analytical techniques(Reimann et al., 1997; Chekushin et al., 1998; Gelinaset al., 2000; Al-Momani, 2003; Azimi et al., 2003; Koc�aket al., 2005; Guerzoni et al., 2005; Motelay-Massei et al.,2005; Rossini et al., 2005; Shimamura et al., 2007). Thisprevious research has specifically targeted the depositionof anthropogenic pollutants in the environment, while vol-cano-related atmospheric depositions have only been char-acterised at a few volcanoes (Hawaii, Italy, Japan), andonly for their major species content (Delmelle, 2003; Aiup-pa et al., 2006 and references therein). Even more strikingly,no study is currently available, at least to our knowledge,on the impact of volcanogenic trace elements emissionson the chemistry of rainwater around active volcanoes.
In this work, we report on the first simultaneous charac-terization of both trace element output and atmosphericdeposition at an active volcano. We use Mt. Etna volcano,in Italy, as a test site for characterizing the source of tracemetals in atmospheric depositions, and to verify to what ex-tent such deposition are affected by volcanic emissions atthe volcanoes’ active vents. So doing, we add a new piecein the puzzle of trace metal budgets and cycling throughoutthe surface geochemical spheres.
2. STUDY AREA AND METHODS
2.1. Mount Etna
Mount Etna, one of the most active volcanoes in theworld, covers an area of about 1250 km2 and reaches analtitude of about 3340 m. It has been active during histori-cal time, with frequent paroxysmal episodes separated bypassive degassing periods. Etna is a 0.5 Ma old stratovol-cano built upon tensional faults cutting an about 20 kmthick continental crust (Chester et al., 1985). It grew upafter the break-up of the African plate margin during itscollision with the European continental block (Barberiet al., 1974). The edifice consists of a lower shield unit over-lain by a stratovolcano (Chester et al., 1985). The stratovol-cano is truncated at 2800–2900 m of altitude by the Ellitticocaldera and Cratere del Piano, while the upper part of thevolcano culminates with a large summit cone at the topof which four active craters (Bocca Nuova, Voragine,Northeast, and Southeast Craters) are located.
Because of its altitude and geographical position the vol-cano displays climatic conditions from subtropical throughtemperate to cold. Precipitation is influenced by elevationand exposure of the flanks to the dominant winds: mostof the rainfall is on the eastern flank, as the volcano itselfinduces condensation of wet air masses coming from the Io-nian Sea. The average precipitation rate over the Mt. Etnaarea is about 800 mm a�1, ranging from 400 on the lowerSW flank up to about 1200 mm a�1 on the middle easternflank (700–1500 m altitude). Rainfall events occur mainlyduring autumn and winter, and the summit area(>2000 m) is covered by a thick blanket of snow for severalmonths during the year. The general atmospheric circula-tion in the Etnean area is predominantly westerly tonorth-westerly. Due to the lack of weather stations nearthe summit of Mt. Etna, the wind rose of Fig. 1 was con-structed based on data collected at 700 hPa (correspondingto an altitude of about 3100 m) (Birgi – WMO station16,429). Even though the station is about 250 km away, itis considered to be a good proxy for wind speed and direc-tion of Etna’s summit area (Bellomo et al., 2007; Pugnaghiet al., 2006; Martin et al., 2009). In contrast to the extremeenvironments prevailing on the upper part of the volcano,the lower slopes comprise some of the most densely popu-lated and intensively cultivated areas of Sicily. The Etna re-gion include 45 towns where almost one million of peoplelive, mainly concentrated in the southern and eastern sec-tors of the volcano, with a density exceeding 800 inhabit-ants per km2 in the lower part.
2.2. Previous studies on Etna’s volcanic emissions
Mount Etna is considered to be the major volcanic gasemitter on Earth, accounting for about 10% of global aver-age volcanic emission of CO2 and SO2 (D’Alessandro et al.,1997; Allard et al., 1991; Caltabiano et al., 2004), and�1.6% of global H2O fluxes from arc volcanism (Aiuppaet al., 2008). Large amounts of halogens (Francis et al.,1998; Aiuppa et al., 2005) and H2S are also released. Mt.Etna is also an important source of trace elements and

Fig. 1. Map of Mt. Etna and location of the sampling sites of bulk deposition (black triangles): Torre del Filosofo (TDF), Citelli (CIT), Casadel Vescovo (CDV), and Zafferana (ZAF) are the down-wind sites with respect to the summit craters; Intraleo (INT) is the up-wind site. Mapis subdivided in sectors basing on the axis of plume-dispersion (corresponding to the main direction of the blowing winds). Sectors aresubdivided in down-wind and up-wind with respect to the summit craters. The upper-right inset shows the geographical position of Mt. Etna;the upper-left inset shows the wind rose referring to the altitude of the summit for the period 2006–2007 (data from Birgi station); the lower-left inset shows the summit crater area with the plume sampling points. Digital Elevation Model (DEM) of Mt. Etna modified after Favalliet al. (1999). The box below shows the bulk collector at Torre del Filosofo site (picture was taken on June 2007); in the background, the profileof Southeast cone and Bocca Nuova Crater (SEC and BNC). On the left the scheme of the collector and the filter-system.
Atmospheric sources and sinks of volcanogenic elements at Mt. Etna 7403
many previous studies were focused on quantify the outputof these elements (see the extensive literature in the intro-ductory paragraph). Gauthier and Le Cloarec (1998) esti-mated that Etna’s emissions contribute by approximately16% to the global volcanic budget of heavy metals and by19% to alkali metals during eruptive periods, and 2% and4%, respectively during quiet periods. Recent studies (Pyleand Mather, 2003; Bagnato et al., 2007) pointed out theimportance of mercury emissions from Mt. Etna in the
global atmospheric mercury cycle (�7% of global non-erup-tive Hg emissions from continuously degassing volcanoes,and about 5% of that released in the Mediterranean areafrom industrial activities).
2.3. Recent volcanic activity
The period over which the measurements presented inthis paper were performed (2004–2007) was characterised

7404 S. Calabrese et al. / Geochimica et Cosmochimica Acta 75 (2011) 7401–7425
by passive degassing, mainly from Voragine and Northeastcraters, interrupted by explosive and effusive events (seeperiodic reports by INGV, available at www.ct.ingv.it).On September 2004, after more than 19 months of almostpassive degassing at the summit craters, an effusive eruptionbegan on the upper volcano’s eastern flank. Except for spat-tering activity during the first weeks, the eruption produceddegassed lava (Burton et al., 2005) at low flow rate, about2–3 m3 s�1 (Allard et al., 2006). This eruptive phase per-sisted for about six months, until March 2005, and the vol-ume of lava reached about 40 � 106 m3, covering an area ofabout 2.3 km2 (Neri and Acocella, 2006). A marked changein the morphology of the Southeast cone was observed atthe end of the 2004–2005 eruption, due to the repeatedpit collapse at its eastern base. On July 2006, a new eruptiveevent occurred along the same flank of the Southeast crater,where two new active vents opened, and strombolian activ-ity persisted within the summit crater for about ten days.After this short eruptive phase, at the end of August,strombolian activity resumed at the Southeast crater. Erup-tive activity persisted from 31 August to 15 December withlava effusion and paroxysmal explosions. From December15, 2006 to May 10, 2008, a relatively quiescent activitywas interrupted by several paroxysmal events. The recur-rent explosive events on 2007 produced intense ash falloutin the Mt. Etna area, mainly on the eastern flank. The mostintense paroxysms (29 March and 4–5 September 2007)were associated with two large lava fountain events, pro-ducing eruptive columns reaching more than 2 km altitude,and being dispersed on the eastern flank of the volcano(Andronico et al., 2008).
2.4. Sampling and analytical methods
2.4.1. Volcanic emissions
The techniques for the assessment of the metal outputfrom volcanoes are conventionally based on direct (in-plume) collection of aerosols on filter substrates. Only forhighly volatile trace elements such as Hg, characterisationof the gas phase is also required (Mosher and Duce, 1985;Finnegan et al., 1989; Bagnato et al., 2007). Sampling on fil-ters is a reliable method to estimate the fluxes of volcano-genic species indirectly, but it present at least three mainlimitations: (i) sampling gives a discrete set of measure-ments of a variable and continuous process; (ii) meteorolog-ical conditions that are extremely variable (mainly for windspeed and direction that affect the plume dilution by atmo-spheric air during the sampling), (iii) the collection of thesamples is often complicated and dangerous especially dur-ing eruptive events.
In the study presented in this paper, volcanic emissionswere collected from 2004 to 2007. Gas and aerosols in thevolcanic plume have been sampled from the rims of theNortheast and Voragine craters (NEC and VOR) avoidingplume mixing (Fig. 1). Sampling was performed by pump-ing plume air (a mixture of gases and aerosol) for about2 h through an untreated Whatman filter placed inside aTeflon filter holder (URG-2000-30FG). This allowed solidand liquid particles to be trapped on the filter surface forlater determination. Acid gases (SO2, HCl, and HF) were
simultaneously collected trough three base-treated filtersin series (“filter packs”), previously impregnated with 1 NNaOH (Finnegan et al., 1989; Aiuppa et al., 2002, 2005;Mather et al., 2008). Portable battery-powered pumps wereequipped with flow meters to assure a constant flow rateand to measure the volume of collected air (flow rate:4 l min�1 for filter-packs and 20 l min�1 for aerosols).Thirty aerosol filters and ninety impregnated-filters for acidgases were sampled (mainly during spring and summer).After sampling, filters were sealed in pre-washed plasticbags and stored in a refrigerator until analysis. Acid specieswere extracted from the filters by leaching with double-dis-tilled water and H2O2, and the solution was analyzed forCl� and SO4
2� by ionic chromatography and for F� byion selective electrode (Aiuppa et al., 2002). The concentra-tions of metals in the collected aerosols were measured byInductively-Coupled Plasma Mass and Optical EmissionSpectrometry (ICP-MS and ICP-OES) after total digestionof the filters. The particles trapped on filters were totallydissolved in a mixture of strong ultrapure acids (HNO3,HF, HClO4 – 3:1:1) in a microwave oven. The absolute con-centrations were corrected for filter blanks. All determina-tions were performed by the external standard calibrationmethod, using 115In as internal standards to correct instru-mental drift; analytical errors ranged between 5% and 30%for the analysed elements.
2.4.2. Atmospheric deposition
Atmospheric deposition was monitored at Mt. Etna forabout 2 years, in 2006 and 2007. The adopted samplingand analytical protocols were chosen following guidelinespublished by the main internationals agency involved inthe monitoring of atmospheric precipitation (NILU, 2001;Ulrich et al., 2006). Samples were collected approximatelytwice a month, from March 2006 to December 2007, at fiverain gauges at various altitudes around the summit (Fig. 1).Based on previous work (Aiuppa et al., 2006; Bellomo et al.,2007; Martin et al., 2009), four rain gauges were installed atdifferent distances on the eastern flank, down-wind from thesummit crater under the prevailing plume emissions. The lo-cal atmospheric background was defined by sampling at thefifth rain gauge, installed up-wind on the western flank, in arural area insignificantly affected by volcanic or anthropo-genic emissions (Bellomo et al., 2007). Table 1 summarizesinformation on the sampling sites.
The design and installation of the collectors conformedto EMEP (European Monitoring and Evaluation Pro-gramme) site requirements for precipitation gauges. Therain gauges used were bulk collectors which remained openduring the whole sampling period, thus receiving both wetand dry deposition (Fig. 1). They were composed of a fun-nel and a polypropylene (PP) bottle. The funnel (Buchnertype, Ø 240 mm) can be separated in two pieces for easyand total cleaning. A sheet of filter paper (DP-400–240 –basis weight: 80 ± 3 g m�2; thickness: 0.180–0.190 mm;retention of particles: 35–40 lm) was put inside the funnel,and a HDPE disc was inserted between the filter paper andthe perforated Buchner plate to avoid clogging of the holes.The filter-system (perforated plate, HDPE disc and filterpaper) excluded a prolonged interaction between sampled

Table 1Summary of the sampling sites information.
Site Locality Coordinates UTM WGS84 Altitude m (a.s.l) Distance (km) Exposition Precipitation(mm/a)
(Zone 33S) Craters Ionian Sea
TDF Torre del Filosofo 41,76,659 500,009 2900 1.2 18.5 Down-wind 410a
CIT Citelli 41,80,074 504,769 1750 5.5 14.5 Down-wind 1850CDV Casa del Vescovo 41,72,356 502,202 1700 6.5 15.5 Down-wind 1470ZAF Zafferana 41,73,454 508,202 850 9.9 10.5 Down-wind 1870INT Mt. Intraleo 41,75,104 492,873 1500 7.3 25.5 Up-wind 1030
a Winter precipitation (mainly snow) is not included.
Atmospheric sources and sinks of volcanogenic elements at Mt. Etna 7405
rainwater and coarse particulate, and minimized evapora-tion. All the equipments were washed with a 2% nitric acid(Merck Suprapur) solution, and then rinsed several timeswith de-ionized (MilliQ) water, dried under hood, packedin double clean plastic bags, and zipped until exposure inthe field. Disposable plastic gloves were used wheneverworking with samples and sampling equipment. At theend of the sampling period, the sampling bottle was cappedand transported in the laboratory for analysis. A differentmethodology was adopted only for mercury (Munthe,1996; OSPAR, 1997), because of its high volatility and ex-tremely low concentration in the atmosphere and rainwater(in the order of few ng l�1). The precipitation samplers(funnels and collection bottles) were made of borosilicateglass, and a capillary tube was inserted between the funneland the bottle, in order to minimize the diffusion of gaseousHg0 into the precipitation sample. Because of the difficultyof this methodology, mercury was sampled for only threemonths during the whole atmospheric monitoring period.
All water samples were analyzed for 44 elements at thelaboratories of DiSTeM and INGV-Pa. Ion chromatogra-phy was used for the determination of both major anions(F�, Cl�, SO4
2�, NO3�, and Br�) and major cations
(Na+, K+, Mg2+, and Ca2+), using a Dionex 120 ion chro-matograph and Dionex columns AS14 and CS12, respec-tively. The detection limits (mg l�1) were 0.005 for F, 0.01for Cl and Na, 0.05 for SO4 and K, 0.05 for NO3, Mgand Ca, with precision 63%. Silica concentrations were asmeasured by using a UV–visible spectrophotometer (detec-tion limits 0.03 mg l�1). Trace and ultra-trace elements wereanalysed by ICP-MS, with two different instruments (Per-kin Elmer ELAN 6100 DRC-e and Agilent 7500ce) (testsshowed that the two instruments provided comparable re-sults, typically within ±10%). Analysis of total mercurywas performed on un-filtered water samples acidified withHCl (USEPA, 2002; Parker and Bloom, 2005), by usingCold Vapour Atomic Fluorescence Spectroscopy (CV-AFS) using a Tekran 2600 mercury analyzer, as describedin Bagnato et al. (2007).
The quality assurance and quality control (QA/QC) pro-cedures included: field and analytical blanks, cleaning pro-cedures, field and inter-laboratory comparison. Theanalytical precision of trace element determinations waschecked by analysis of two Certified Reference Material(CRM) specific for analysis of trace elements in fresh water(Table A1). The deviation between certified and measuredvalues (D%) ranged from 0.5% and 27%.
The dataset of rainwater concentrations (log-trans-formed) was processed using the software package Statisticaver. 8.0, with the aim of identifying potential associationsbetween elements. We used the exploratory factor analysis
(varimax rotation method) to extract principal factors.Few elements (Be, Bi, Cs, Hg, and Th) with more than25% of missing values were excluded from analysis.
3. ANALYTICAL RESULTS
Analytical results are summarized by descriptive statisti-cal parameters reported in Table 2 for volcanic aerosols andin Tables 3 and A2) for rainwater. Analytical data both forvolcanic aerosols and atmospheric deposition show a greatvariability for most of the analyzed elements. This variabil-ity is a common feature of environmental data, which arefrequently characterized by exceptionally high values thatdeviate widely from the interquartile range of data(Reimann et al., 2008). This is a particularly distinctive fea-ture of active volcanic areas, where most of the geochemicalparameters can increase by orders of magnitude towardsthe source (e.g., craters, fumaroles, faults, degassing areas).
3.1. Volcanic plume emissions
Absolute concentrations of gases (S, Cl, F) and particu-late metals in Etna’s plume are shown in Fig. 2. No majordifference in geochemical patterns between Northeast andVoragine craters was observed. Only a few elements showedsome slight differences: Cu, Tl, Bi, and Cs were more en-riched in Northeast aerosols, while higher concentrationsof Ca, Fe, Al, La, and Sr were systematically measured inVoragine emissions. In general, results of filter-packanalyses (considering both active vents) showed that thegaseous species decrease in abundance in the order S, Cland F, with concentrations ranging between 0.9 and132 mg m�3, 1.8–35.4 mg m�3 and 0.1–4.7 mg m�3, respec-tively. The most abundant metals in aerosols (about10�2–102 lg m�3) were K, Ca, Fe, Al, Mg, and Ti, all beingmajor constituents of Etnean basalts. High concentrationsof B were also found; B (as well as Rb, Cs) was stronglypartitioned into silicate melts with respect to all commonphenocrysts and mantle phases (Brenan et al., 1998), andits degassing into the plume was likely related to its affinityfor the gaseous phase at high temperature. The lowest metalconcentrations were found for Au, Cs, Th, Ta, and U, withmedian values lower than 10�2 lg m�3. The statistical
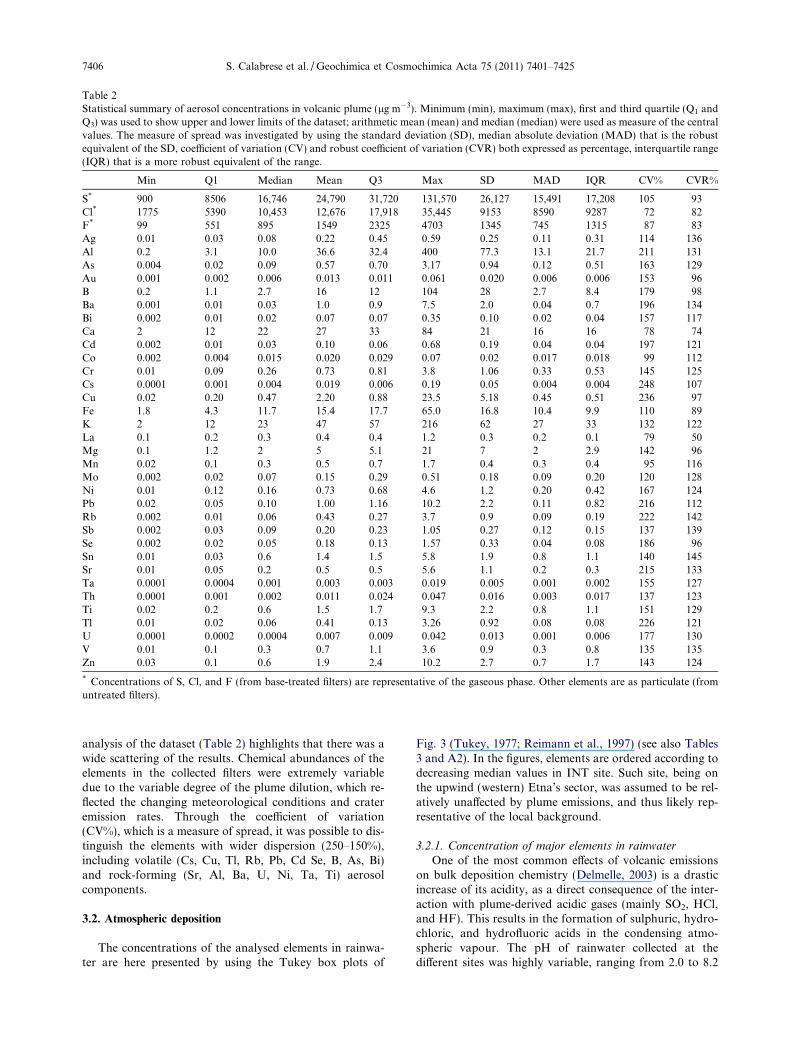
Table 2Statistical summary of aerosol concentrations in volcanic plume (lg m�3). Minimum (min), maximum (max), first and third quartile (Q1 andQ3) was used to show upper and lower limits of the dataset; arithmetic mean (mean) and median (median) were used as measure of the centralvalues. The measure of spread was investigated by using the standard deviation (SD), median absolute deviation (MAD) that is the robustequivalent of the SD, coefficient of variation (CV) and robust coefficient of variation (CVR) both expressed as percentage, interquartile range(IQR) that is a more robust equivalent of the range.
Min Q1 Median Mean Q3 Max SD MAD IQR CV% CVR%
S* 900 8506 16,746 24,790 31,720 131,570 26,127 15,491 17,208 105 93Cl* 1775 5390 10,453 12,676 17,918 35,445 9153 8590 9287 72 82F* 99 551 895 1549 2325 4703 1345 745 1315 87 83Ag 0.01 0.03 0.08 0.22 0.45 0.59 0.25 0.11 0.31 114 136Al 0.2 3.1 10.0 36.6 32.4 400 77.3 13.1 21.7 211 131As 0.004 0.02 0.09 0.57 0.70 3.17 0.94 0.12 0.51 163 129Au 0.001 0.002 0.006 0.013 0.011 0.061 0.020 0.006 0.006 153 96B 0.2 1.1 2.7 16 12 104 28 2.7 8.4 179 98Ba 0.001 0.01 0.03 1.0 0.9 7.5 2.0 0.04 0.7 196 134Bi 0.002 0.01 0.02 0.07 0.07 0.35 0.10 0.02 0.04 157 117Ca 2 12 22 27 33 84 21 16 16 78 74Cd 0.002 0.01 0.03 0.10 0.06 0.68 0.19 0.04 0.04 197 121Co 0.002 0.004 0.015 0.020 0.029 0.07 0.02 0.017 0.018 99 112Cr 0.01 0.09 0.26 0.73 0.81 3.8 1.06 0.33 0.53 145 125Cs 0.0001 0.001 0.004 0.019 0.006 0.19 0.05 0.004 0.004 248 107Cu 0.02 0.20 0.47 2.20 0.88 23.5 5.18 0.45 0.51 236 97Fe 1.8 4.3 11.7 15.4 17.7 65.0 16.8 10.4 9.9 110 89K 2 12 23 47 57 216 62 27 33 132 122La 0.1 0.2 0.3 0.4 0.4 1.2 0.3 0.2 0.1 79 50Mg 0.1 1.2 2 5 5.1 21 7 2 2.9 142 96Mn 0.02 0.1 0.3 0.5 0.7 1.7 0.4 0.3 0.4 95 116Mo 0.002 0.02 0.07 0.15 0.29 0.51 0.18 0.09 0.20 120 128Ni 0.01 0.12 0.16 0.73 0.68 4.6 1.2 0.20 0.42 167 124Pb 0.02 0.05 0.10 1.00 1.16 10.2 2.2 0.11 0.82 216 112Rb 0.002 0.01 0.06 0.43 0.27 3.7 0.9 0.09 0.19 222 142Sb 0.002 0.03 0.09 0.20 0.23 1.05 0.27 0.12 0.15 137 139Se 0.002 0.02 0.05 0.18 0.13 1.57 0.33 0.04 0.08 186 96Sn 0.01 0.03 0.6 1.4 1.5 5.8 1.9 0.8 1.1 140 145Sr 0.01 0.05 0.2 0.5 0.5 5.6 1.1 0.2 0.3 215 133Ta 0.0001 0.0004 0.001 0.003 0.003 0.019 0.005 0.001 0.002 155 127Th 0.0001 0.001 0.002 0.011 0.024 0.047 0.016 0.003 0.017 137 123Ti 0.02 0.2 0.6 1.5 1.7 9.3 2.2 0.8 1.1 151 129Tl 0.01 0.02 0.06 0.41 0.13 3.26 0.92 0.08 0.08 226 121U 0.0001 0.0002 0.0004 0.007 0.009 0.042 0.013 0.001 0.006 177 130V 0.01 0.1 0.3 0.7 1.1 3.6 0.9 0.3 0.8 135 135Zn 0.03 0.1 0.6 1.9 2.4 10.2 2.7 0.7 1.7 143 124
* Concentrations of S, Cl, and F (from base-treated filters) are representative of the gaseous phase. Other elements are as particulate (fromuntreated filters).
7406 S. Calabrese et al. / Geochimica et Cosmochimica Acta 75 (2011) 7401–7425
analysis of the dataset (Table 2) highlights that there was awide scattering of the results. Chemical abundances of theelements in the collected filters were extremely variabledue to the variable degree of the plume dilution, which re-flected the changing meteorological conditions and crateremission rates. Through the coefficient of variation(CV%), which is a measure of spread, it was possible to dis-tinguish the elements with wider dispersion (250–150%),including volatile (Cs, Cu, Tl, Rb, Pb, Cd Se, B, As, Bi)and rock-forming (Sr, Al, Ba, U, Ni, Ta, Ti) aerosolcomponents.
3.2. Atmospheric deposition
The concentrations of the analysed elements in rainwa-ter are here presented by using the Tukey box plots of
Fig. 3 (Tukey, 1977; Reimann et al., 1997) (see also Tables3 and A2). In the figures, elements are ordered according todecreasing median values in INT site. Such site, being onthe upwind (western) Etna’s sector, was assumed to be rel-atively unaffected by plume emissions, and thus likely rep-resentative of the local background.
3.2.1. Concentration of major elements in rainwater
One of the most common effects of volcanic emissionson bulk deposition chemistry (Delmelle, 2003) is a drasticincrease of its acidity, as a direct consequence of the inter-action with plume-derived acidic gases (mainly SO2, HCl,and HF). This results in the formation of sulphuric, hydro-chloric, and hydrofluoric acids in the condensing atmo-spheric vapour. The pH of rainwater collected at thedifferent sites was highly variable, ranging from 2.0 to 8.2

Table 3Statistical summary of rainwater analytical results, for the 2006–2007 period (136 samples). EC is Electrical Conductivity (lS cm�1); TDS isTotal Dissolved Solid (mg l�1); <DL = below detection limit (DL are given in Table A1).
Elements Min Q1 Median Mean Q3 Max SD MAD IQR CV% CVR%
pH 2.0 4.0 5.3 5.1 6.0 8.2 1.3 1.6 1.5 26 31EC 7.3 20.5 48.5 114 94.3 2890 288 45.7 54.7 252 94TDS 7.9 16.3 24.5 49.9 44.7 1278 121 16.1 21.0 243 66
Major ions (mg l�1)
Na+ 0.12 0.84 1.9 4.0 3.6 72 8.6 1.8 2.0 216 97K+ 0.07 0.21 0.46 1.4 0.9 40 4.4 0.43 0.5 317 95Mg2+ 0.04 0.22 0.39 0.9 0.9 22 2.2 0.30 0.5 242 78Ca2+ 0.26 1.2 1.9 4.1 4.2 60 7.2 1.5 2.2 175 79F� <DL 0.05 0.17 1.5 0.4 65 6.9 0.21 0.3 461 126Cl� 0.38 2.1 4.2 11 8.1 414 37 4.3 4.5 344 100NO3
� 0.19 0.89 1.4 3.4 2.5 140 12 1.0 1.2 361 71SO4
2� 1.03 3.3 6.1 16 11 446 45 5.0 5.6 285 82
Minor and Trace elements (lg l�1)
Ag <DL 0.007 0.03 0.08 0.05 0.45 0.15 0.03 0.03 194 113Al 0.8 7.1 28.6 816 112 48,590 4710 38.5 77.6 577 135As 0.01 0.10 0.25 0.89 0.72 23.3 2.35 0.27 0.46 263 109Au <DL 0.02 0.08 0.14 0.14 1.16 0.23 0.09 0.09 159 116B 0.4 1.3 2.0 3.3 3.5 69 6.3 1.6 1.6 190 78Ba 0.2 1.0 1.9 5.4 3.7 133 15 1.7 2.0 283 89Be <DL 0.01 0.02 0.09 0.04 3.6 0.41 0.01 0.02 461 98Bi <DL 0.01 0.01 0.05 0.02 0.4 0.09 0.01 0.01 198 72Cd <DL 0.02 0.07 0.61 0.34 32 2.9 0.09 0.24 470 137Co <DL 0.02 0.05 0.34 0.09 21 1.9 0.04 0.05 558 95Cr <DL 0.03 0.07 0.15 0.14 2.1 0.28 0.06 0.08 191 86Cs <DL 0.01 0.02 0.16 0.06 4.5 0.65 0.03 0.04 407 109Cu 0.2 1.0 2.7 33.4 8.9 1401 159 3.2 5.8 475 118Fe 0.6 6.1 17.5 407 57.3 33,740 2991 21.4 37.9 735 122Hg 0.01 0.03 0.04 0.05 0.06 0.10 0.02 0.03 0.03 50 65La 0.005 0.03 0.05 1.45 0.15 77 7.9 0.06 0.09 546 119Li 0.01 0.06 0.12 0.49 0.26 19 1.90 0.13 0.15 388 100Mn 0.2 1.8 3.8 22.0 7.4 1087 108 3.3 4.2 492 85Mo 0.005 0.02 0.04 0.15 0.08 6.2 0.65 0.04 0.04 445 94Ni 0.01 0.14 0.25 0.52 0.43 13.0 1.23 0.19 0.21 239 77Pb 0.01 0.07 0.21 1.4 1.0 60 5.4 0.26 0.72 397 124Rb 0.01 0.15 0.46 2.8 1.4 162 14.5 0.54 0.95 520 117Sb <DL 0.02 0.06 0.14 0.15 4.6 0.40 0.08 0.10 295 122Sc <DL 0.03 0.04 0.57 0.19 6.3 1.44 0.04 0.12 255 106Se 0.02 0.23 0.46 1.00 0.98 20 2.20 0.43 0.55 220 94Si 7.5 46 84 691 169 59,945 5171 72 91 749 86Sr 1.1 4.1 11.1 31.7 20.5 701 90.6 11.1 12.1 286 100Th <DL 0.01 0.02 0.27 0.04 6.2 1.1 0.01 0.02 398 93Ti 0.02 0.10 0.25 11.8 0.9 814 81.5 0.3 0.6 688 110Tl <DL 0.03 0.12 1.13 0.52 69 6.1 0.16 0.36 534 135U <DL 0.004 0.007 0.07 0.02 3.1 0.4 0.01 0.01 556 82V 0.15 0.44 0.91 2.56 2.24 89 8.15 0.91 1.33 318 100Zn 1.0 5.2 9.4 17.3 17.8 244 27.6 7.1 9.4 160 76
Atmospheric sources and sinks of volcanogenic elements at Mt. Etna 7407
with a median value of 5.3. The frequency distribution ofpH in rainwater samples (Fig. 4) showed that the class withthe highest frequency is in the 5.5–6.0 pH range (with a fre-quency value of about 20%), and revealed two distinct pop-ulations: acidic and circumneutral precipitation samples(Fig. 4). The presence of two groups of rainwater was evenmore evident in the frequency distribution of pH for indi-vidual sites (Fig. 5). Fig. 5 also highlights a clear depen-dence of pH on distance from the summit craters: the sitenearest to summit craters (TDF) was characterised by themost acid water (pH range 2.0–4.5), while the highest pH
values are observed at the background site (INT). This siteshowed a pH median value of about 6.0, and an interquar-tile range from 5.4 to 6.6, close to the value typical forwater in equilibrium with atmospheric CO2 (5.65). Theremaining sites showed intermediate pH values. The mea-sured pH values confirm earlier findings (Aiuppa et al.,2006) that the distance from summit craters and the prevail-ing wind direction play a key-role on the chemical compo-sition of rainwater. pH measurement thus provides clues tothe degree of plume–rainwater interaction, suggesting thatalso during quiet periods Etna’s volcanic emissions had a
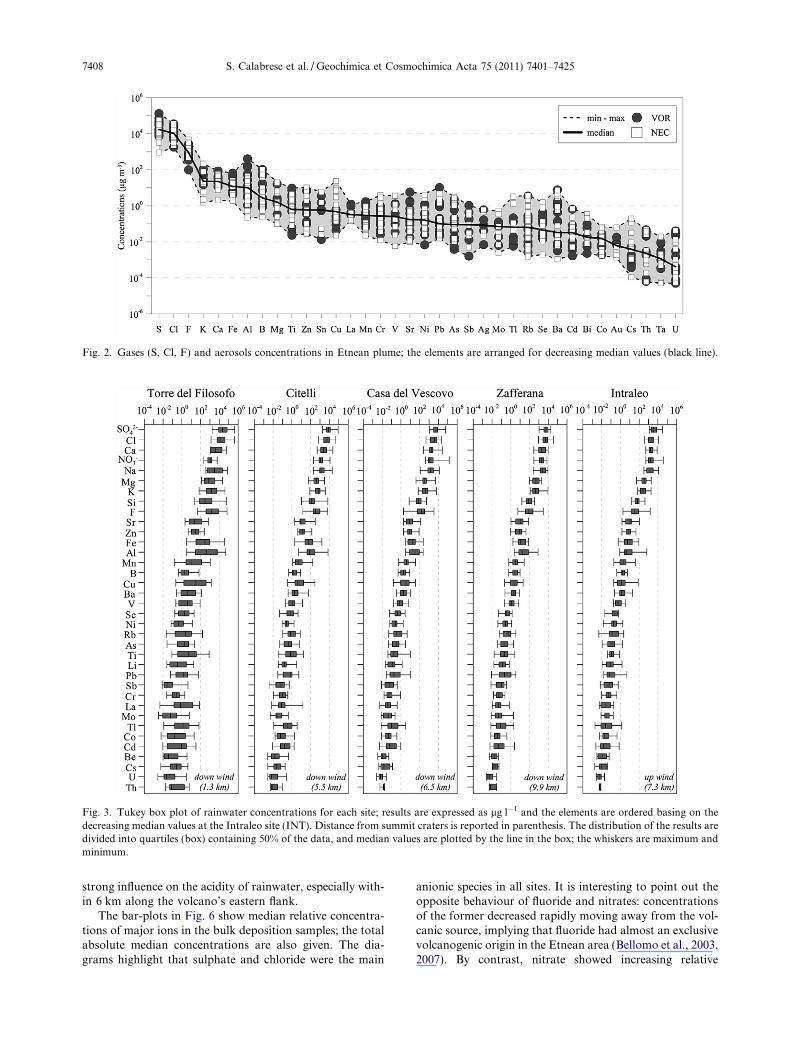
Fig. 2. Gases (S, Cl, F) and aerosols concentrations in Etnean plume; the elements are arranged for decreasing median values (black line).
Fig. 3. Tukey box plot of rainwater concentrations for each site; results are expressed as lg l�1 and the elements are ordered basing on thedecreasing median values at the Intraleo site (INT). Distance from summit craters is reported in parenthesis. The distribution of the results aredivided into quartiles (box) containing 50% of the data, and median values are plotted by the line in the box; the whiskers are maximum andminimum.
7408 S. Calabrese et al. / Geochimica et Cosmochimica Acta 75 (2011) 7401–7425
strong influence on the acidity of rainwater, especially with-in 6 km along the volcano’s eastern flank.
The bar-plots in Fig. 6 show median relative concentra-tions of major ions in the bulk deposition samples; the totalabsolute median concentrations are also given. The dia-grams highlight that sulphate and chloride were the main
anionic species in all sites. It is interesting to point out theopposite behaviour of fluoride and nitrates: concentrationsof the former decreased rapidly moving away from the vol-canic source, implying that fluoride had almost an exclusivevolcanogenic origin in the Etnean area (Bellomo et al., 2003,2007). By contrast, nitrate showed increasing relative

Fig. 4. Frequency distribution of pH for all sampled rainwater(136 cases) on Mt. Etna; vertical dashed line represents the pH ofpure water in equilibrium with atmospheric carbon dioxide at25 �C (pH 5.65).
Atmospheric sources and sinks of volcanogenic elements at Mt. Etna 7409
concentrations in the distal sites, whereas absolute concen-trations were nearly constant. Such behaviour supported aprevalent anthropogenic derivation for nitrate (from Euro-pean NOx emissions). The major cation bar-plot also showsthe exponential decrease of proton concentrations fromTDF site, strongly contributing to the total cation species,to the farthest site (ZAF), where it accounted for only about
Fig. 5. Box plot of pH vs. distance from summit craters; grey squares areFor each site are also showed frequency distribution and median values ofINT = 30).
1% of total cation content. Calcium was the main cation inrainwater. Its origin could be ascribed to several geogenicsources (mostly re-suspended dust either from local volcanicor carbonate rocks; Aiuppa et al., 2006). Other elementssuch as K and Mg had almost constant concentration, whilethe contents of Na, together with Cl, showed an increase to-wards the lower eastern flank of Mt. Etna, highlighting anincreasing contribution of sea salt, more marked for the siteclosest to the Ionian Sea, ZAF.
3.2.2. Concentrations of minor and trace elements
Trace elements concentrations in rainwater are shown inFig. 3. Just a few of the analysed elements (Au, Ag, Be, Bi,Cd, Co, Cs, La, Mo, Sc, Sb, Th, Tl, and U) in rainwaterwere occasionally below analytical detection limit. Thoseelements (Au, Ag, Bi, Sc, and Th) with more than 25% ofthe data below the detection limit were excluded from thediagrams. Such elements were frequently detected only atTDF, and particularly high concentrations were measuredafter the May 20th and 22nd 2007 explosive events at theSoutheast crater (0.3–0.4 lg l�1 for Ag, Au and Bi, and�6 lg l�1 for Sc and Th). Mercury was also excluded fromthe plots because analysed only for a 3 months period (fromOctober to December 2007).
Down-wind sites (TDF, CIT, CDV, and ZAF) exhibitsignificant enrichment in all analyzed elements, relative tothe up-wind site (INT). The enrichment is most evidentfor elements like S, Cl, F, Si, Al, Fe, Cu, As, Se, Cd, andTl. The samples with the highest element concentrationswere collected at TDF, the site closest to the summit craters(about 1.5 km).
outlier values and horizontal line divide acid from neutralized rain.pH (number of cases: TDF = 16; CIT = 29; CDV = 30; ZAF = 31;
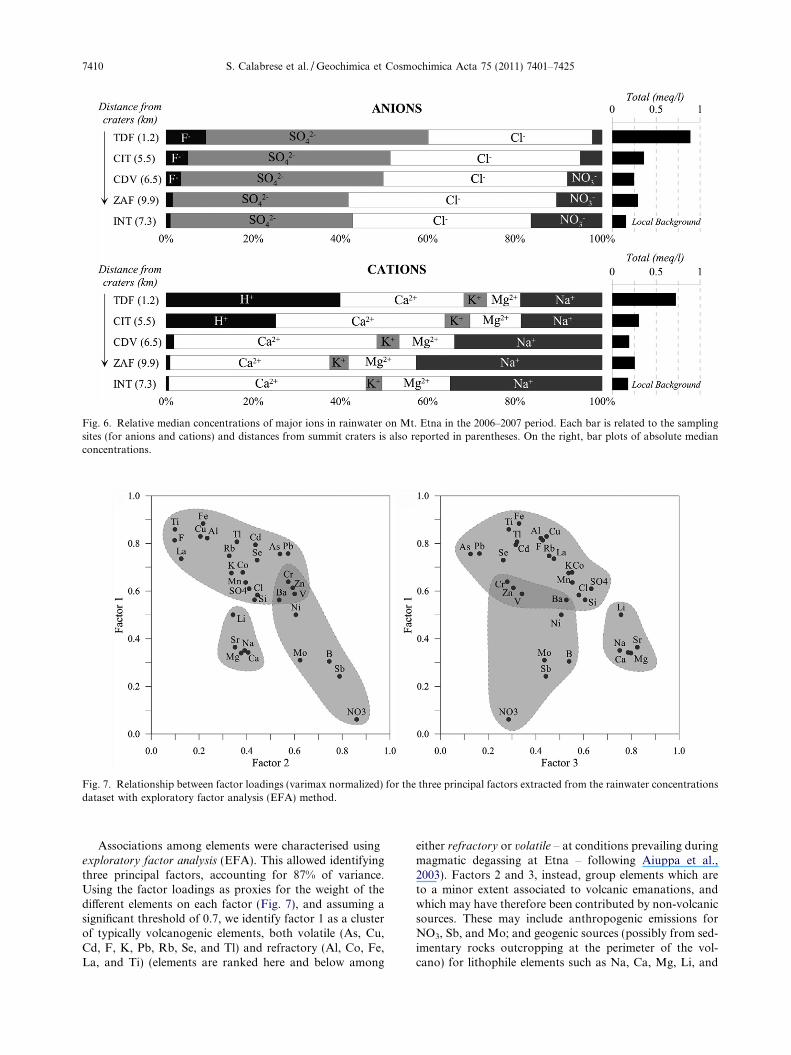
Fig. 6. Relative median concentrations of major ions in rainwater on Mt. Etna in the 2006–2007 period. Each bar is related to the samplingsites (for anions and cations) and distances from summit craters is also reported in parentheses. On the right, bar plots of absolute medianconcentrations.
Fig. 7. Relationship between factor loadings (varimax normalized) for the three principal factors extracted from the rainwater concentrationsdataset with exploratory factor analysis (EFA) method.
7410 S. Calabrese et al. / Geochimica et Cosmochimica Acta 75 (2011) 7401–7425
Associations among elements were characterised usingexploratory factor analysis (EFA). This allowed identifyingthree principal factors, accounting for 87% of variance.Using the factor loadings as proxies for the weight of thedifferent elements on each factor (Fig. 7), and assuming asignificant threshold of 0.7, we identify factor 1 as a clusterof typically volcanogenic elements, both volatile (As, Cu,Cd, F, K, Pb, Rb, Se, and Tl) and refractory (Al, Co, Fe,La, and Ti) (elements are ranked here and below among
either refractory or volatile – at conditions prevailing duringmagmatic degassing at Etna – following Aiuppa et al.,2003). Factors 2 and 3, instead, group elements which areto a minor extent associated to volcanic emanations, andwhich may have therefore been contributed by non-volcanicsources. These may include anthropogenic emissions forNO3, Sb, and Mo; and geogenic sources (possibly from sed-imentary rocks outcropping at the perimeter of the vol-cano) for lithophile elements such as Na, Ca, Mg, Li, and

Table 4Metal/sulphur ratios (� 10�6) of volcanic emissions and total output from Mt. Etna.
Metal/sulphur Averaged fluxes
Min Q1 Median Mean Q3 Max t a�1
Sa 391,000Cla 286,000Fa 53,100Al 16 239 746 3162 1884 53,937 2815K 104 864 1964 4273 6770 19,820 2423Ca 96 835 1563 2634 2961 10,953 1128Fe 119 270 426 1107 875 6623 505B 13 65 226 1040 726 8525 442Mg 30 59 80 350 464 1741 246Cu 1.5 6.8 16 346 115 6188 240Zn 1.7 10 34 183 130 1019 90Cr 0.5 8.3 13 45 42 301 63Ba 0.1 0.6 6.0 85 61 823 41Ti 0.8 15 43 107 110 695 39Tl 0.1 0.5 3.0 71 8.0 859 39Rb 0.1 1.1 3.3 59 21 986 38As 0.1 1.4 6.3 53 20 835 31Pb 1.0 3.2 7.1 69 29 656 31Ni 0.1 6.9 16 45 29 365 30Se 0.1 1.4 2.7 25 7 415 19Mn 2.4 6.9 13 32 30 252 18Cd 0.1 0.3 1.5 7.4 5.6 86 13V 1.3 5.5 16 34 45 170 12Bi 0.05 0.3 0.9 2.5 3.2 11 9.6Sn 0.3 3.5 29 116 46 923 9.2Sr 0.5 3.5 10 49 24 755 9.0Sb 0.2 2.0 3.7 18 11 141 8.9Mo 0.4 1.9 3.0 9.5 13.4 40 8.5La 5.9 9.6 13 20 22 54 8.2Cs 0.02 0.04 0.2 2.8 0.6 50 2.0Co 0.1 0.2 0.6 1.7 2.1 8.4 1.9Ag 0.1 3.2 4.4 4.0 4.9 7.9 1.5Th 0.001 0.1 0.2 0.6 0.9 4.1 0.2Au 0.1 0.2 0.2 0.5 0.7 1.1 0.2U 0.002 0.01 0.05 0.4 0.3 2.1 0.1Ta 0.003 0.02 0.1 0.1 0.2 0.5 0.04
(a) S, Cl, and F are representative of the gaseous phase. Other elements are as particulate.
Fig. 8. Comparison of previous and new estimates of metal fluxes emitted by Mt. Etna.
Atmospheric sources and sinks of volcanogenic elements at Mt. Etna 7411

Fig. 9. Median values of daily deposition rate calculated for each site and for each element. Elements are arranged for decreasing values atINT site. Grey lines (dashed and continuous) represent the increase of deposition rate caused by two explosive events (29th March for CIT 15and 20–22nd May 2007 for TDF 19).
Fig. 10. Median deposition rate of selected elements at downwind sites versus distance from summit craters (black lines are functionsobtained from best fitting).
7412 S. Calabrese et al. / Geochimica et Cosmochimica Acta 75 (2011) 7401–7425
Sr. B and Sr may additionally be contributed by seawaterspry (cfr. 4.3.1). Elements such as Ba, Cl, Cr, K, Mn, Ni,S, Si, V, and Zn displayed low/intermediate loadings forall three factors, supporting a mixed origin (Fig. 7).
4. DISCUSSION
4.1. Etna’s metal output into the atmosphere
Our newly determined compositions for Etna’s plumeoffer the opportunity of re-examining the volcano’s trace
metal contribution to the atmosphere, and making a com-parison with previous assessments.
The volcanic fluxes of metals are conventionally esti-mated using an indirect approach, which involves scalingthe metal/sulphur ratio of volcanic emissions by the simul-taneously derived sulphur flux, or by the flux of a radioac-tive volatile metal, such as 210Po (Lambert et al., 1988;Oppenheimer, 2003). In this study, the elemental fluxes con-tributed by Etna during 2004–2007 were calculated by thefollowing expression:
UX ¼ jX j=jSjUS ð1Þ

Fig. 11. Correlation between selected refractory and volatile elements (Al and Tl) and pH and fluoride; note that the diagrams are plottedwith a logarithmic scale due to the large spread of data. Black, grey, and white triangles represent rainwater collected at the most exposed sites(TDF, CIT, and CDV, respectively); white circles correspond to ZAF site, and white square are the samples from the background site (INT).All concentrations are reported as mg l�1, except for pH. Black lines are the element to element ratios in basaltic rock (Table A4), while greyareas are the same ratios in volcanic plume (dashed line were obtained from the first and the third quartile reported in Table 2).
Fig. 12. Covariation plots of Cl/F vs. S/Cl (a) and Sr/Al vs. B/Al (b). Data from White (1999) for sea water and from Metrich et al. (2004) forvolcanic glass, basaltic rock, and melt inclusions. Black arrows are mixing lines between the sea water end-member and median value ofrainwater.
Atmospheric sources and sinks of volcanogenic elements at Mt. Etna 7413
where UX is the element flux (t d�1), |X|/|S| is the element-to-sulphur mass ratios, and US is the flux of sulphur (t d�1).The total SO2 flux (from all active craters) is measured dailyby INGV, Sezione di Catania (Caltabiano et al., 2004),using traverse-based UV sensing techniques (COSPEC,mini-MAX-DOAS) and, more recently, by a network offive permanent UV scanning spectrometers located aroundthe volcano (FLAME – FLux Automatic MEasurement).In order to estimate trace element fluxes, the element/sul-phur ratios were first calculated (these ranged from 10�2
to 10�8), and then scaled to the total sulphur flux. Whentwo craters (NEC and VOR) were simultaneously sampledin the same survey, we used the mean element/sulphur ratiofor each element (differences in the ratios between the twovents were systematically within error). The results areshown in Table 4. The averaged cumulative mass flux ofparticulate trace metals ranged from 8 to 23 t d�1, whilstthe acidic gas output (sum of SO2, HCl, and HF) rangedfrom 2200 to 3000 t d�1. These measurements are represen-tative of the quiescent degassing activity from the volcano,
7414 S. Calabrese et al. / Geochimica et Cosmochimica Acta 75 (2011) 7401–7425
and do not account for the contribution of eruptive degas-sing. Increased SO2 emission rates were observed during theintense 2006 and 2007 eruptive activity of the Southeastcrater, but aerosols samples have not been collected duringthese periods. From our measurements, we estimate thatthe solid (particulate) phase in the plume accounts for onlyfor 0.04–0.1% of the passive total volatile flux of Etna(TV = H2O + CO2 + SO2 = 21,000 t d�1; Aiuppa et al.,2008).
Fig. 8 demonstrates a general agreement between ele-mental fluxes estimated in this work and previous assess-ments (Buat-Menard and Arnold, 1978; Dedeurwaerderet al., 1982; Quisefit et al., 1982; Bergametti et al., 1984;Martin et al., 1986; Le Guern, 1988; Andres et al., 1993;Gauthier and Le Cloarec, 1998; Aiuppa et al., 2003). Forseveral elements, the 2004–2007 fluxes fall on the lower lim-it of previous estimates; a trend which is consistent with theresults of Gauthier and Le Cloarec (1998), who highlightedgreat differences in emission rates between eruptive andnon-eruptive periods. The relatively low metal fluxes mostlyreflect the lower SO2 degassing rates in 2004–2007 (meanSO2 flux, 62000 t d�1; see periodic reports by INGV sez.Catania, available at www.ct.ingv.it) relative to the 1980–90s (mean SO2 flux, �5000 t d�1; Caltabiano et al., 2004).Low volatile contents (S, Cl, F, and Cu) in 2004–2007 mag-mas were reported in a recent melt inclusion study (Collinset al., 2009).
4.2. Rates of trace element deposition in the Etnean area
Etna’s large metal output (Fig. 8) potentially makes theconditions available for an enhanced deposition of tracemetals on the surroundings of the volcano. In order to ver-ify if (and to which extent) volcanic gas plume emissions af-fect rainwater chemistry in the Etnean area, we firstcalculated the site-to-site variability in deposition rates.This steams on the hypothesis that, if the volcano was tobe the prevalent source of trace metals in the area, then atrend of decreasing depositions with increasing distancefrom the summit vents would be expected (as indeed exper-imentally verified for S, Cl, and F; Aiuppa et al., 2006).
Trace element deposition rates were determined via thefollowing relation:
Ux ¼ ðCx � P ÞT�1 ð2Þ
where Cx is the concentration of each element x in rain (inlg l�1), P is the amount of precipitation (in mm), and T isthe exposition time of the collectors (in days). The averagedeposition rates of inorganic elements during the study per-iod were computed for each site, and the results are given(expressed in the unit lg m�2 d�1) in Fig. 9 (summary ofstatistical analysis are also reported in Table A3).
Fig. 9 highlights that average elemental deposition ratesfor all elements except NO3, B, Sb, and Mo decrease fromTDF to INT, pointing to a substantial volcanic contribu-tion to bulk deposition in the investigated area. The highestdeposition rates were consistently observed at TDF, closeto the active craters (about 1 km). Atmospheric depositionin the most exposed sites (TDF, CIT, and CDV) are 1–3 or-ders of magnitude higher than at the local background site
(INT) for many of the major and trace elements analyzed,including major species (S, F, and Cl), refractory elements(Al, Fe, Ti, La, U, and Th), and volatile elements (Cu,As, Rb, Pb, Cd, Tl, and Cs).
Fig. 10, which plots the median deposition rates of se-lected elements at downwind sites versus their distance fromsummit craters, clearly highlights a clear exponential de-crease of deposition rates for most of the elements (F, Al,and As were taken as representative of prevailingly volca-nogenic elements; cfr. 3.2.2) from 1 to 10 km from thesource. Nitrate, Sb, and Mo show opposite patterns, how-ever (Fig. 10), which further supports (see Fig. 7) the mar-ginal volcanic contribution to their deposition, at leastrelative to other sources. Nitrate may likely originate fromoxidation of anthropogenically released NOx, while Sb andMo depositions may to a large extent be determined byemissions from vehicles (they are often ranked among traf-fic related elements; Gomez et al., 2005; Furuta et al., 2005).
Fig. 9 also shows deposition rates calculated for twosamples, CIT-15 and TDF-19, representative of depositionsoccurring during two relatively short time intervals (14–31March and 16–30 May 2007, respectively). These samplesshowed unusually high depositions relative to the medianvalues at the TDF site, which can be explained as directconsequences of two explosive episodes from the Southeastcrater: the paroxysmal event on the 29th of March, and twomilder but still significant explosions on the 20th and 22ndof May. For both samples most of the elements display aconsiderable increase in the deposition rate (up to two or-ders of magnitude with respect to median values), whichwe relate to leaching of volcanic ash deposited into the plu-viometers during the explosive events. Our observations ofsuch episodic events highlight how explosive activity can in-crease enormously the deposition rate of several chemicalelements, both on the vicinity of the summit craters, andat several kilometres from the active vents.
4.3. Sources of trace metals to rainwater
4.3.1. Volcanic versus non-volcanic contributions
Additional evidence for a prevalent volcanic derivationof trace metals in rainwater comes from Fig. 11a–d, wherewe investigate the correlations between fluorine (a typicallyvolcanogenic major species, with negligible non-volcaniccontributions; Aiuppa et al., 2006; Bellomo et al., 2007)and two selected trace elements, Al and Tl: the former isconsidered representative of refractory elements, whichare not effectively volatiles during magmatic degassingand mostly emitted as components of coarse ash fragments(Aiuppa et al., 2003), while the latter is representative ofvolatile elements, released as S–Cl-bearing gas species,and later entrained in plume as sub-micron volcanic aero-sols (Aiuppa et al., 2003).
Fig. 11a shows that Al (a major component of volcanicash) in rainwater is inversely correlated with pH, and thatlow pH rainwater are almost always accompanied by highcontents of these trace metals. Similar relations are also ob-served for other ash-derived refractory elements such Feand Ti. Rainwater with low pH values (2.0 < pH < 4.5)are frequent in the summit crater area, where metals such

Atmospheric sources and sinks of volcanogenic elements at Mt. Etna 7415
as Al and Fe become a significant fraction of the total dis-solved species with absolute concentrations up to 50 mg l�1.This points to an efficient scavenging of the aerosol phase(volcanic ash and particulate matter) by acid rain. Positivelinear correlations between volcanogenic anions and refrac-tory metals are generally observed, and in particular for Alwith respect to F (Fig. 11b). Such association may suggestan effective plume transport of Al as fluoride species (AlF3)either as soluble salts on the surface of ash particles (Varek-amp et al., 1986; Gislason et al., 2011), and/or as strong ef-fect of dissolved fluorine and HFg on ash dissolution rates(Gislason and Oelkers, 2003; Wolff-Boenisch et al., 2004;Delmelle et al., 2007).
Volatile elements also display significant inverse correla-tion with pH (e.g., Fig. 11c), and fair positive correlationswith the main plume-related anionic species (e.g.,Fig. 11d), supporting that rainwater leaching of soluble saltovergrown on particles within the plume is their most likelysource in solution (Oskarsson, 1980; Varekamp et al.,1986).
While the volcanic contribution to rainwater thus ap-pears dominant in the Mt. Etna area, other non-volcanic in-puts may also affect rainwater chemistry (see Fig. 7 above
Fig. 14. Normalized concentrations of rainwater wi
Fig. 13. Triangular plot Al–Ti–Zn. Data for desert dust fromChester et al. (1996) and Medinets (1996).
and related discussion). Clear evidences of sea-aerosols con-tribution from Ionian Sea are supported by both chlorinecontents in rainwater (Fig. 12a), and from boron and stron-tium (Fig. 12b), two elements whose major atmosphericsource is the marine surface (Medinets, 1996). Another sig-nificant geogenic source of trace elements can be the localre-suspension of soils and long-range transport of desertdust. Desert storm input from the arid regions of Africaoccasionally affects Sicily, thus perturbing the steady-statecondition of regional atmospheric deposition. Some ele-ments (Al, Fe, Ti, Zn) are particularly representative ofscavenging of desert dust (Chester et al., 1996; Medinets,1996), and a “fingerprint” of the crust-dominated Mediter-ranean aerosols in rain water collected at Mt. Etna is dem-onstrated by the Al–Ti–Zn triangular plot (Fig. 13).
One may thus conclude that while the volcanic contribu-tion is dominant for most trace metals and in most condi-tions, other sources may occasionally and locally competewith volcano in determining rainwater chemistry.
4.3.2. Volcanic ash deposition, or rain–aerosol interaction?
Accepting that the volcano is the main source of chem-icals to atmospheric depositions, two main volcanogenicsources of trace metals can be considered significant: (i)the deposition and consequent leaching of coarse silicatefragments (volcanic ash), and (ii) the scavenging of sub-mi-cron sized plume volcanic aerosols (generally enriched involatile elements) by falling rain droplets. Both contribu-tions are likely to be significant on Etna, with their relativesignificance being both time- and site-specific (that is,depending on volcano activity state, distance from vents,etc.).
In the attempt to evaluate which of the two above-men-tioned contributions is largest, the median concentrationsof the investigated elements in rainwater (from the most ex-posed site TDF) were compared to the elemental abun-dances in the Etnean plume and in the Etnean basalticrock, respectively (Fig. 14). The average trace metal concen-trations in Etnean basaltic rocks (Table A4) were obtainedfrom original data and from a compilation of literaturedata (Toutain et al., 1995; Gauthier and Le Cloarec,1998; Aiuppa et al., 2003; Metrich et al., 2004; Viccaroand Cristofolini, 2008; this study).
Fig. 14 was drawn under the hypothesis that, if eitherash or plume aerosols were the key contributing sources
th respect to Etnean plume and basaltic rock.
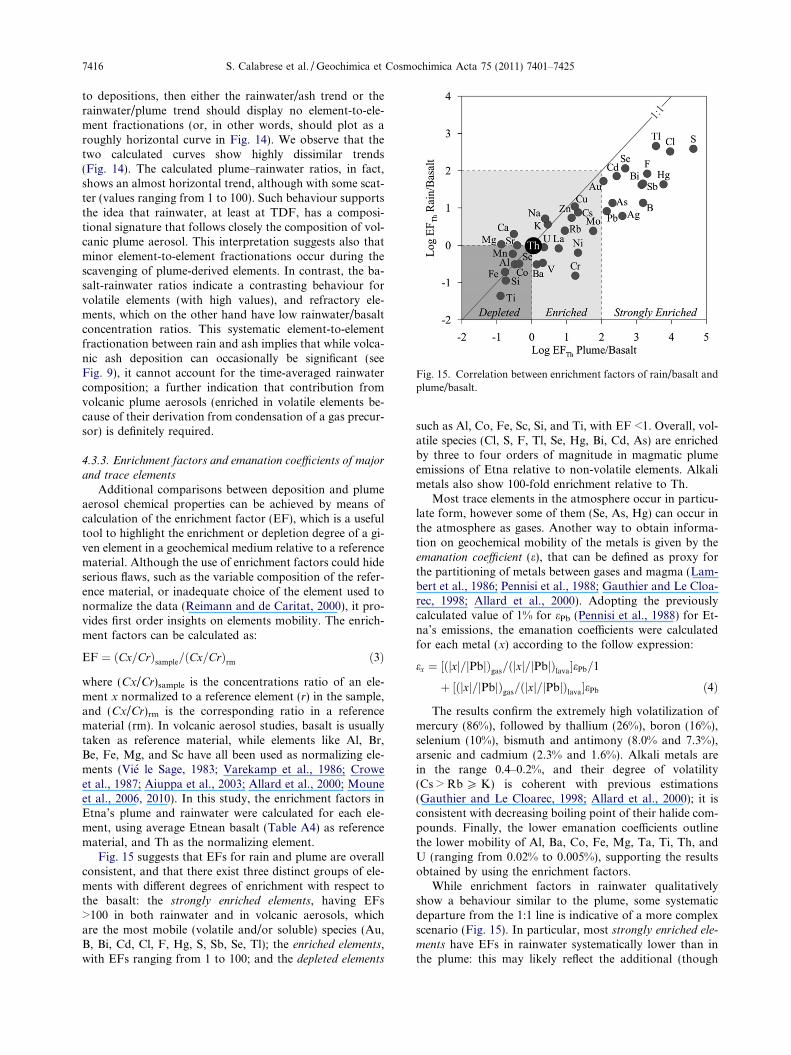
Fig. 15. Correlation between enrichment factors of rain/basalt andplume/basalt.
7416 S. Calabrese et al. / Geochimica et Cosmochimica Acta 75 (2011) 7401–7425
to depositions, then either the rainwater/ash trend or therainwater/plume trend should display no element-to-ele-ment fractionations (or, in other words, should plot as aroughly horizontal curve in Fig. 14). We observe that thetwo calculated curves show highly dissimilar trends(Fig. 14). The calculated plume–rainwater ratios, in fact,shows an almost horizontal trend, although with some scat-ter (values ranging from 1 to 100). Such behaviour supportsthe idea that rainwater, at least at TDF, has a composi-tional signature that follows closely the composition of vol-canic plume aerosol. This interpretation suggests also thatminor element-to-element fractionations occur during thescavenging of plume-derived elements. In contrast, the ba-salt-rainwater ratios indicate a contrasting behaviour forvolatile elements (with high values), and refractory ele-ments, which on the other hand have low rainwater/basaltconcentration ratios. This systematic element-to-elementfractionation between rain and ash implies that while volca-nic ash deposition can occasionally be significant (seeFig. 9), it cannot account for the time-averaged rainwatercomposition; a further indication that contribution fromvolcanic plume aerosols (enriched in volatile elements be-cause of their derivation from condensation of a gas precur-sor) is definitely required.
4.3.3. Enrichment factors and emanation coefficients of major
and trace elements
Additional comparisons between deposition and plumeaerosol chemical properties can be achieved by means ofcalculation of the enrichment factor (EF), which is a usefultool to highlight the enrichment or depletion degree of a gi-ven element in a geochemical medium relative to a referencematerial. Although the use of enrichment factors could hideserious flaws, such as the variable composition of the refer-ence material, or inadequate choice of the element used tonormalize the data (Reimann and de Caritat, 2000), it pro-vides first order insights on elements mobility. The enrich-ment factors can be calculated as:
EF ¼ ðCx=CrÞsample=ðCx=CrÞrm ð3Þ
where (Cx/Cr)sample is the concentrations ratio of an ele-ment x normalized to a reference element (r) in the sample,and (Cx/Cr)rm is the corresponding ratio in a referencematerial (rm). In volcanic aerosol studies, basalt is usuallytaken as reference material, while elements like Al, Br,Be, Fe, Mg, and Sc have all been used as normalizing ele-ments (Vie le Sage, 1983; Varekamp et al., 1986; Croweet al., 1987; Aiuppa et al., 2003; Allard et al., 2000; Mouneet al., 2006, 2010). In this study, the enrichment factors inEtna’s plume and rainwater were calculated for each ele-ment, using average Etnean basalt (Table A4) as referencematerial, and Th as the normalizing element.
Fig. 15 suggests that EFs for rain and plume are overallconsistent, and that there exist three distinct groups of ele-ments with different degrees of enrichment with respect tothe basalt: the strongly enriched elements, having EFs>100 in both rainwater and in volcanic aerosols, whichare the most mobile (volatile and/or soluble) species (Au,B, Bi, Cd, Cl, F, Hg, S, Sb, Se, Tl); the enriched elements,with EFs ranging from 1 to 100; and the depleted elements
such as Al, Co, Fe, Sc, Si, and Ti, with EF <1. Overall, vol-atile species (Cl, S, F, Tl, Se, Hg, Bi, Cd, As) are enrichedby three to four orders of magnitude in magmatic plumeemissions of Etna relative to non-volatile elements. Alkalimetals also show 100-fold enrichment relative to Th.
Most trace elements in the atmosphere occur in particu-late form, however some of them (Se, As, Hg) can occur inthe atmosphere as gases. Another way to obtain informa-tion on geochemical mobility of the metals is given by theemanation coefficient (e), that can be defined as proxy forthe partitioning of metals between gases and magma (Lam-bert et al., 1986; Pennisi et al., 1988; Gauthier and Le Cloa-rec, 1998; Allard et al., 2000). Adopting the previouslycalculated value of 1% for ePb (Pennisi et al., 1988) for Et-na’s emissions, the emanation coefficients were calculatedfor each metal (x) according to the follow expression:
ex ¼ ½ðjxj=jPbjÞgas=ðjxj=jPbjÞlava�ePb=1
þ ½ðjxj=jPbjÞgas=ðjxj=jPbjÞlava�ePb ð4Þ
The results confirm the extremely high volatilization ofmercury (86%), followed by thallium (26%), boron (16%),selenium (10%), bismuth and antimony (8.0% and 7.3%),arsenic and cadmium (2.3% and 1.6%). Alkali metals arein the range 0.4–0.2%, and their degree of volatility(Cs > Rb P K) is coherent with previous estimations(Gauthier and Le Cloarec, 1998; Allard et al., 2000); it isconsistent with decreasing boiling point of their halide com-pounds. Finally, the lower emanation coefficients outlinethe lower mobility of Al, Ba, Co, Fe, Mg, Ta, Ti, Th, andU (ranging from 0.02% to 0.005%), supporting the resultsobtained by using the enrichment factors.
While enrichment factors in rainwater qualitativelyshow a behaviour similar to the plume, some systematicdeparture from the 1:1 line is indicative of a more complexscenario (Fig. 15). In particular, most strongly enriched ele-
ments have EFs in rainwater systematically lower than inthe plume: this may likely reflect the additional (though
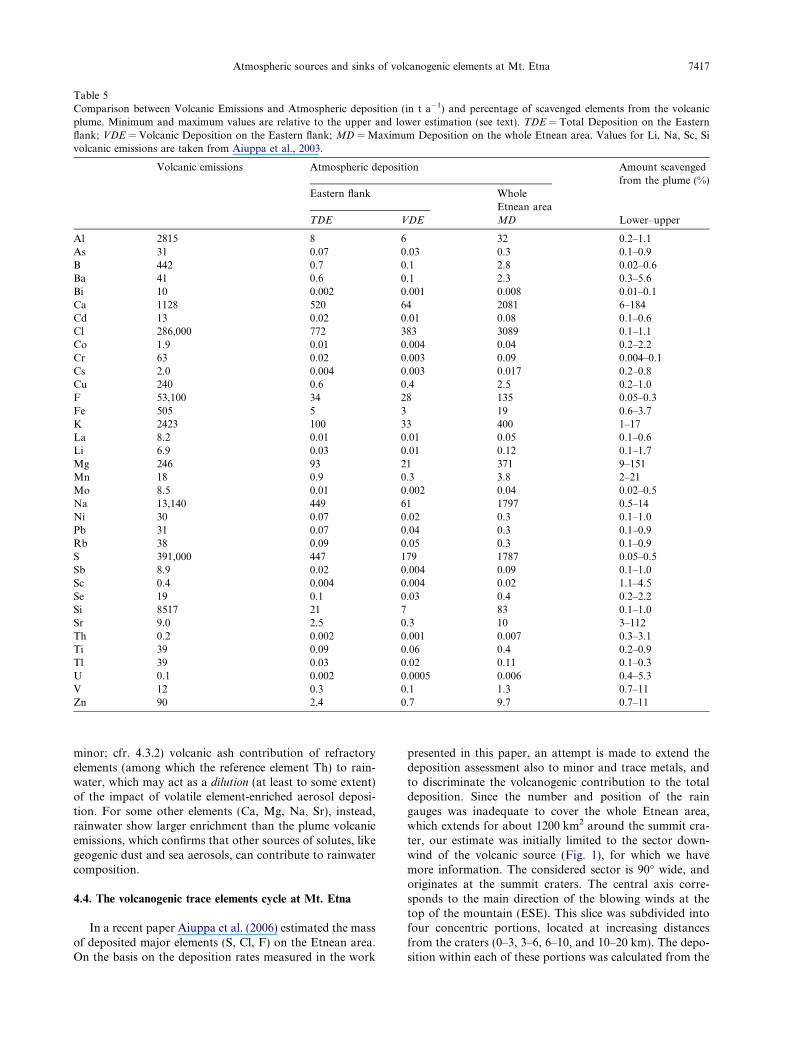
Table 5Comparison between Volcanic Emissions and Atmospheric deposition (in t a�1) and percentage of scavenged elements from the volcanicplume. Minimum and maximum values are relative to the upper and lower estimation (see text). TDE = Total Deposition on the Easternflank; VDE = Volcanic Deposition on the Eastern flank; MD = Maximum Deposition on the whole Etnean area. Values for Li, Na, Sc, Sivolcanic emissions are taken from Aiuppa et al., 2003.
Volcanic emissions Atmospheric deposition Amount scavengedfrom the plume (%)
Eastern flank WholeEtnean area
TDE VDE MD Lower–upper
Al 2815 8 6 32 0.2–1.1As 31 0.07 0.03 0.3 0.1–0.9B 442 0.7 0.1 2.8 0.02–0.6Ba 41 0.6 0.1 2.3 0.3–5.6Bi 10 0.002 0.001 0.008 0.01–0.1Ca 1128 520 64 2081 6–184Cd 13 0.02 0.01 0.08 0.1–0.6Cl 286,000 772 383 3089 0.1–1.1Co 1.9 0.01 0.004 0.04 0.2–2.2Cr 63 0.02 0.003 0.09 0.004–0.1Cs 2.0 0.004 0.003 0.017 0.2–0.8Cu 240 0.6 0.4 2.5 0.2–1.0F 53,100 34 28 135 0.05–0.3Fe 505 5 3 19 0.6–3.7K 2423 100 33 400 1–17La 8.2 0.01 0.01 0.05 0.1–0.6Li 6.9 0.03 0.01 0.12 0.1–1.7Mg 246 93 21 371 9–151Mn 18 0.9 0.3 3.8 2–21Mo 8.5 0.01 0.002 0.04 0.02–0.5Na 13,140 449 61 1797 0.5–14Ni 30 0.07 0.02 0.3 0.1–1.0Pb 31 0.07 0.04 0.3 0.1–0.9Rb 38 0.09 0.05 0.3 0.1–0.9S 391,000 447 179 1787 0.05–0.5Sb 8.9 0.02 0.004 0.09 0.1–1.0Sc 0.4 0.004 0.004 0.02 1.1–4.5Se 19 0.1 0.03 0.4 0.2–2.2Si 8517 21 7 83 0.1–1.0Sr 9.0 2.5 0.3 10 3–112Th 0.2 0.002 0.001 0.007 0.3–3.1Ti 39 0.09 0.06 0.4 0.2–0.9Tl 39 0.03 0.02 0.11 0.1–0.3U 0.1 0.002 0.0005 0.006 0.4–5.3V 12 0.3 0.1 1.3 0.7–11Zn 90 2.4 0.7 9.7 0.7–11
Atmospheric sources and sinks of volcanogenic elements at Mt. Etna 7417
minor; cfr. 4.3.2) volcanic ash contribution of refractoryelements (among which the reference element Th) to rain-water, which may act as a dilution (at least to some extent)of the impact of volatile element-enriched aerosol deposi-tion. For some other elements (Ca, Mg, Na, Sr), instead,rainwater show larger enrichment than the plume volcanicemissions, which confirms that other sources of solutes, likegeogenic dust and sea aerosols, can contribute to rainwatercomposition.
4.4. The volcanogenic trace elements cycle at Mt. Etna
In a recent paper Aiuppa et al. (2006) estimated the massof deposited major elements (S, Cl, F) on the Etnean area.On the basis on the deposition rates measured in the work
presented in this paper, an attempt is made to extend thedeposition assessment also to minor and trace metals, andto discriminate the volcanogenic contribution to the totaldeposition. Since the number and position of the raingauges was inadequate to cover the whole Etnean area,which extends for about 1200 km2 around the summit cra-ter, our estimate was initially limited to the sector down-wind of the volcanic source (Fig. 1), for which we havemore information. The considered sector is 90� wide, andoriginates at the summit craters. The central axis corre-sponds to the main direction of the blowing winds at thetop of the mountain (ESE). This slice was subdivided intofour concentric portions, located at increasing distancesfrom the craters (0–3, 3–6, 6–10, and 10–20 km). The depo-sition within each of these portions was calculated from the

Fig. 16. Cartoon which summarize the cycle of trace elements (for some selected elements) at Mount Etna. The fluxes of elements dischargedby the volcanic aquifer (data taken from Aiuppa et al. (2000)) are also reported for comparison.
7418 S. Calabrese et al. / Geochimica et Cosmochimica Acta 75 (2011) 7401–7425
specific deposition rates measured in the co-located sam-pling site(s) (the arithmetic mean of two rain gauges –CIT and CDV – was considered representative of the sec-ond portion). No deposition information is available forthe distal portion (from 10 to 20 km) of the downwind area,for which we thus base our estimates on deposition ratesmeasured at the local background site (INT). The so-ob-tained total (that is, inclusive of both volcanic and non-vol-canic contributions) deposition fluxes for the downwindsector are summarized in Table 5 (Total Deposition on the
Eastern flank; TDE), and range from 0.002 (Bi, Th, U) to772 (Cl) t a�1. In the attempt to discriminate between thevolcanogenic and non-volcanic inputs, we performed anew calculation in which the deposition values measuredat INT (likely representative of the local background –non-volcanic – contributions) were subtracted from TDE
(thus yielding a Volcanic Deposition on the Eastern flank;
VDE in Table 5). Comparison between TDE and VDE
shows that while several elements can have a prevalentnon-volcanic origin (VDE accounts for only �10–20% oftotal deposition for elements such as B, Cr, Li, Mn, Sb,Sr, Zn), the volcanogenic contribution seems to dominatethe deposition budget of several elements (Bi, Cd, Cu, Cs,Tl). Finally, we consider that the maximum deposition forthe entire Etnean area (Maximum Deposition on the whole
Etnean area; MD in Table 5), cannot exceed by four timesthe value of the downwind sector (this represents about onequarter of the entire volcanic edifice, and is the area wheremost deposition is likely to occur).
We take VDE and MD as representative of lower andupper ranges of possible depositions on the volcano respec-tively, and we compare (in Table 5) these two calculated ex-treme values with our estimated plume emission fluxes(Tables 4 and 5): this comparison provides a first indicationof the fraction of Etna’s atmospheric release which is scav-enged by deposition along the flanks of the volcano (Table
5). In spite of the inherent approximations in our calcula-tions, our results unambiguously demonstrate that a verylow fraction of the summit plume trace element emissionsis deposited in the surroundings of the volcano (Fig. 16).The fraction of trace elements scavenged from the plumeranges from 0.1% to 1% for volatile elements such as As,Bi, Cd, Cs, Cu, Tl, and from 1% to 5% for refractory ele-ments such as Al, Ba, Co, Fe, La, Ti, Th, U, V. Only fora few elements (Ca, K, Mg, Mn, and Sr), deposition fluxesexceed 10% of emissions, possibly confirming the impor-tance of additional (non-volcanic) inputs for these elements.
Overall, our data highlight that more than 90% of volca-nogenic trace elements emitted by Etna are dispersed at re-gional scale. Such a large difference between deposition andemission fluxes points to a relatively high stability and longresidence time of aerosols in the plume (at least during peri-ods characterized by prevailing passive degassing activity),favouring long range transport and relatively minor localdeposition. The low trace elements’ deposition fluxes, ob-tained in this study, could at least partially be explainedby the high altitude of the volcano (more than 3000 ma.s.l.), well above the planetary boundary layer. Would Et-na’s emissions be confined within the boundary layer (as islikely to occur at low altitude volcanoes such as Masaya;Delmelle, 2003), the processes leading to the deposition ofgases and particles released to the atmosphere, and theirconsequent environmental impacts, would probably beamplified (Seinfeld and Pandis, 1998).
5. CONCLUSIONS
Volcanic emissions are important sources of gases andparticles to the atmosphere, and contribute to the naturalgeochemical cycles of many elements. Volcanogenic gasesand aerosols emitted into the atmosphere ultimately fallonto the Earth’s surface as wet or dry deposition, where
Atmospheric sources and sinks of volcanogenic elements at Mt. Etna 7419
they can influence the environment and the ecosystems atlocal and regional scales. In particular, Mt. Etna is animpressive and persistent source of volcanic gases and par-ticles into the lower troposphere. In the attempt to betterunderstand the volcanic cycles and budgets of trace ele-ments in the surrounding of this actively degassing volcano,we made a simultaneous characterisation of its trace ele-ment volcanic emissions and atmospheric depositions. Mea-surements cover a period of more than 2 years, providingoriginal data on major and trace element abundance in vol-canic aerosols and bulk deposition. This new and largedataset allows a refinement of our current knowledge ofthe impact of volcanic emissions, and offers useful startingpoint for future environmental studies.
Etna’s metal output, evaluated here for the 2004–2007period, update earlier estimates of elemental fluxes releasedfrom the volcano, and confirm that the volcano is an impor-tant source of trace metals at the regional and global scale.The average fluxes of metals released from the volcano dur-ing the study period are typical of a quiescent period, andreflect the observed decrease of SO2 fluxes with respect tothe values measured in the 1980–90s.
The chemistry of atmospheric deposition reveals thatmost of the investigated elements (both major and trace ele-ments) have higher concentrations in the vicinity of thesummit craters. This confirms a prevalent volcanic contri-bution to rainwater. The major impact (during quiescentactivity) is confined within about 10 km from the source,
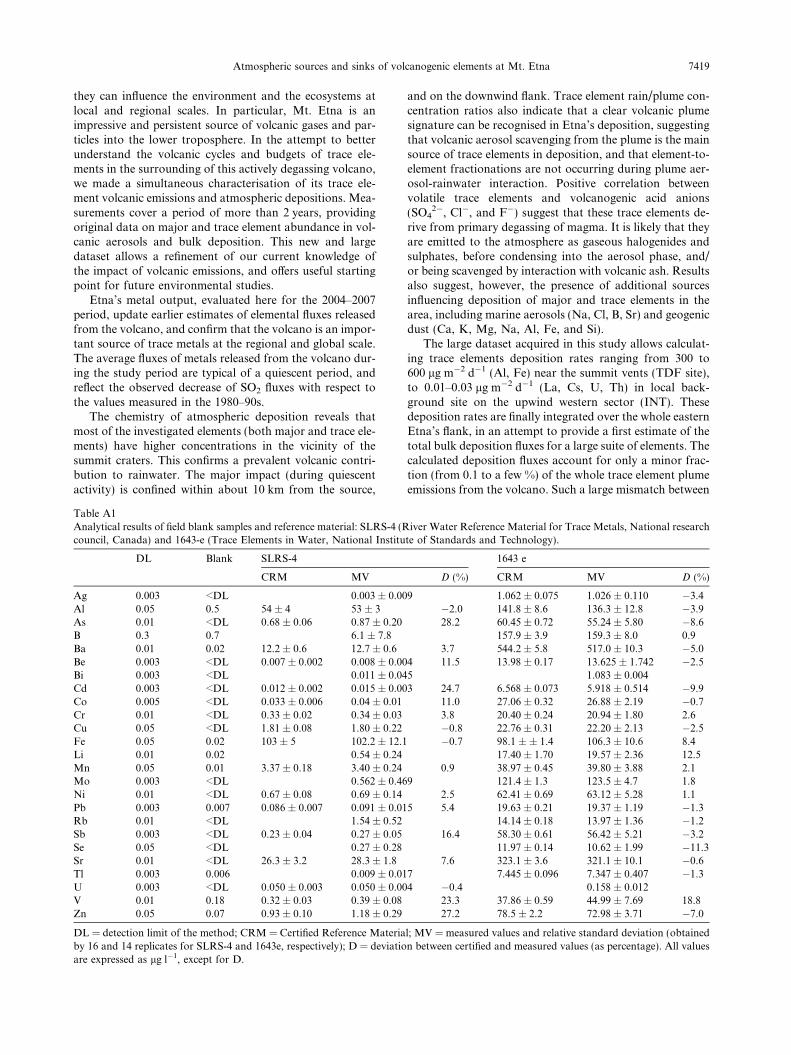
Table A1Analytical results of field blank samples and reference material: SLRS-4 (Rcouncil, Canada) and 1643-e (Trace Elements in Water, National Institu
DL Blank SLRS-4
CRM MV
Ag 0.003 <DL 0.003 ± 0.00Al 0.05 0.5 54 ± 4 53 ± 3As 0.01 <DL 0.68 ± 0.06 0.87 ± 0.20B 0.3 0.7 6.1 ± 7.8Ba 0.01 0.02 12.2 ± 0.6 12.7 ± 0.6Be 0.003 <DL 0.007 ± 0.002 0.008 ± 0.00Bi 0.003 <DL 0.011 ± 0.04Cd 0.003 <DL 0.012 ± 0.002 0.015 ± 0.00Co 0.005 <DL 0.033 ± 0.006 0.04 ± 0.01Cr 0.01 <DL 0.33 ± 0.02 0.34 ± 0.03Cu 0.05 <DL 1.81 ± 0.08 1.80 ± 0.22Fe 0.05 0.02 103 ± 5 102.2 ± 12.1Li 0.01 0.02 0.54 ± 0.24Mn 0.05 0.01 3.37 ± 0.18 3.40 ± 0.24Mo 0.003 <DL 0.562 ± 0.46Ni 0.01 <DL 0.67 ± 0.08 0.69 ± 0.14Pb 0.003 0.007 0.086 ± 0.007 0.091 ± 0.01Rb 0.01 <DL 1.54 ± 0.52Sb 0.003 <DL 0.23 ± 0.04 0.27 ± 0.05Se 0.05 <DL 0.27 ± 0.28Sr 0.01 <DL 26.3 ± 3.2 28.3 ± 1.8Tl 0.003 0.006 0.009 ± 0.01U 0.003 <DL 0.050 ± 0.003 0.050 ± 0.00V 0.01 0.18 0.32 ± 0.03 0.39 ± 0.08Zn 0.05 0.07 0.93 ± 0.10 1.18 ± 0.29
DL = detection limit of the method; CRM = Certified Reference Materiaby 16 and 14 replicates for SLRS-4 and 1643e, respectively); D = deviatioare expressed as lg l�1, except for D.
and on the downwind flank. Trace element rain/plume con-centration ratios also indicate that a clear volcanic plumesignature can be recognised in Etna’s deposition, suggestingthat volcanic aerosol scavenging from the plume is the mainsource of trace elements in deposition, and that element-to-element fractionations are not occurring during plume aer-osol-rainwater interaction. Positive correlation betweenvolatile trace elements and volcanogenic acid anions(SO4
2�, Cl�, and F�) suggest that these trace elements de-rive from primary degassing of magma. It is likely that theyare emitted to the atmosphere as gaseous halogenides andsulphates, before condensing into the aerosol phase, and/or being scavenged by interaction with volcanic ash. Resultsalso suggest, however, the presence of additional sourcesinfluencing deposition of major and trace elements in thearea, including marine aerosols (Na, Cl, B, Sr) and geogenicdust (Ca, K, Mg, Na, Al, Fe, and Si).
The large dataset acquired in this study allows calculat-ing trace elements deposition rates ranging from 300 to600 lg m�2 d�1 (Al, Fe) near the summit vents (TDF site),to 0.01–0.03 lg m�2 d�1 (La, Cs, U, Th) in local back-ground site on the upwind western sector (INT). Thesedeposition rates are finally integrated over the whole easternEtna’s flank, in an attempt to provide a first estimate of thetotal bulk deposition fluxes for a large suite of elements. Thecalculated deposition fluxes account for only a minor frac-tion (from 0.1 to a few %) of the whole trace element plumeemissions from the volcano. Such a large mismatch between
iver Water Reference Material for Trace Metals, National researchte of Standards and Technology).
1643 e
D (%) CRM MV D (%)
9 1.062 ± 0.075 1.026 ± 0.110 �3.4�2.0 141.8 ± 8.6 136.3 ± 12.8 �3.928.2 60.45 ± 0.72 55.24 ± 5.80 �8.6
157.9 ± 3.9 159.3 ± 8.0 0.93.7 544.2 ± 5.8 517.0 ± 10.3 �5.0
4 11.5 13.98 ± 0.17 13.625 ± 1.742 �2.55 1.083 ± 0.0043 24.7 6.568 ± 0.073 5.918 ± 0.514 �9.9
11.0 27.06 ± 0.32 26.88 ± 2.19 �0.73.8 20.40 ± 0.24 20.94 ± 1.80 2.6�0.8 22.76 ± 0.31 22.20 ± 2.13 �2.5�0.7 98.1 ± ± 1.4 106.3 ± 10.6 8.4
17.40 ± 1.70 19.57 ± 2.36 12.50.9 38.97 ± 0.45 39.80 ± 3.88 2.1
9 121.4 ± 1.3 123.5 ± 4.7 1.82.5 62.41 ± 0.69 63.12 ± 5.28 1.1
5 5.4 19.63 ± 0.21 19.37 ± 1.19 �1.314.14 ± 0.18 13.97 ± 1.36 �1.2
16.4 58.30 ± 0.61 56.42 ± 5.21 �3.211.97 ± 0.14 10.62 ± 1.99 �11.3
7.6 323.1 ± 3.6 321.1 ± 10.1 �0.67 7.445 ± 0.096 7.347 ± 0.407 �1.34 �0.4 0.158 ± 0.012
23.3 37.86 ± 0.59 44.99 ± 7.69 18.827.2 78.5 ± 2.2 72.98 ± 3.71 �7.0
l; MV = measured values and relative standard deviation (obtainedn between certified and measured values (as percentage). All values
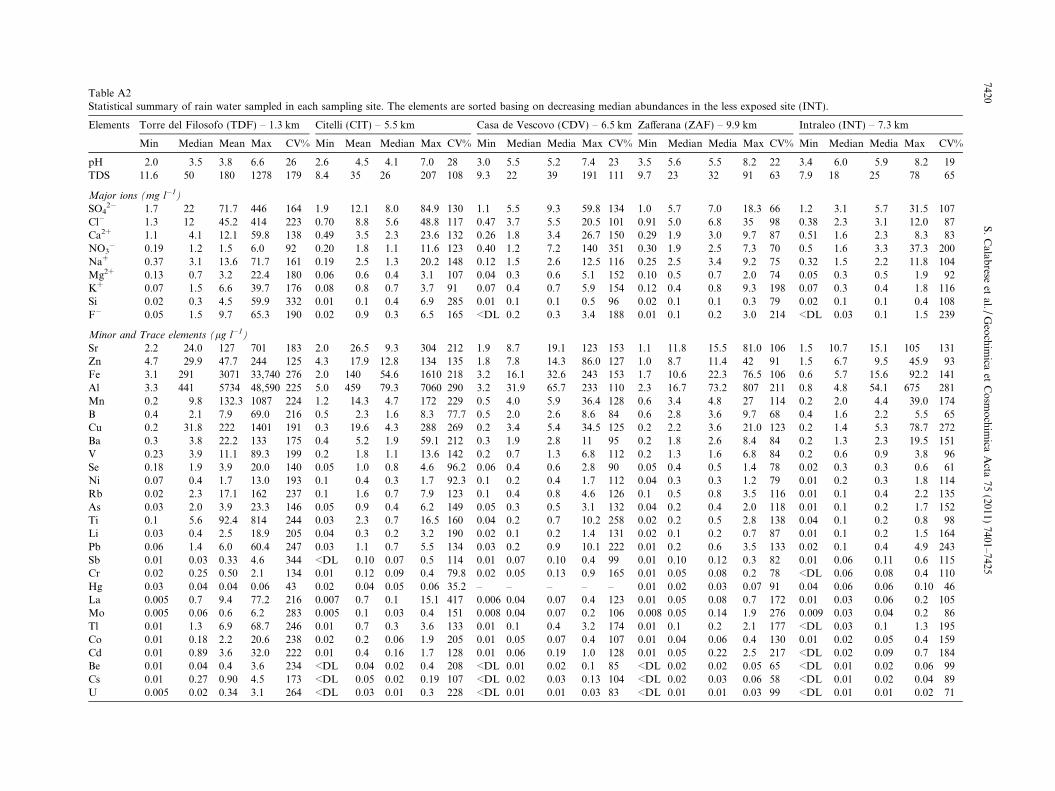
Table A2Statistical summary of rain water sampled in each sampling site. The elements are sorted basing on decreasing median abundances in the less exposed site (INT).
Elements Torre del Filosofo (TDF) – 1.3 km Citelli (CIT) – 5.5 km Casa de Vescovo (CDV) – 6.5 km Zafferana (ZAF) – 9.9 km Intraleo (INT) – 7.3 km
Min Median Mean Max CV% Min Mean Median Max CV% Min Median Media Max CV% Min Median Media Max CV% Min Median Media Max CV%
pH 2.0 3.5 3.8 6.6 26 2.6 4.5 4.1 7.0 28 3.0 5.5 5.2 7.4 23 3.5 5.6 5.5 8.2 22 3.4 6.0 5.9 8.2 19TDS 11.6 50 180 1278 179 8.4 35 26 207 108 9.3 22 39 191 111 9.7 23 32 91 63 7.9 18 25 78 65
Major ions (mg l�1)
SO42� 1.7 22 71.7 446 164 1.9 12.1 8.0 84.9 130 1.1 5.5 9.3 59.8 134 1.0 5.7 7.0 18.3 66 1.2 3.1 5.7 31.5 107
Cl� 1.3 12 45.2 414 223 0.70 8.8 5.6 48.8 117 0.47 3.7 5.5 20.5 101 0.91 5.0 6.8 35 98 0.38 2.3 3.1 12.0 87Ca2+ 1.1 4.1 12.1 59.8 138 0.49 3.5 2.3 23.6 132 0.26 1.8 3.4 26.7 150 0.29 1.9 3.0 9.7 87 0.51 1.6 2.3 8.3 83NO3
� 0.19 1.2 1.5 6.0 92 0.20 1.8 1.1 11.6 123 0.40 1.2 7.2 140 351 0.30 1.9 2.5 7.3 70 0.5 1.6 3.3 37.3 200Na+ 0.37 3.1 13.6 71.7 161 0.19 2.5 1.3 20.2 148 0.12 1.5 2.6 12.5 116 0.25 2.5 3.4 9.2 75 0.32 1.5 2.2 11.8 104Mg2+ 0.13 0.7 3.2 22.4 180 0.06 0.6 0.4 3.1 107 0.04 0.3 0.6 5.1 152 0.10 0.5 0.7 2.0 74 0.05 0.3 0.5 1.9 92K+ 0.07 1.5 6.6 39.7 176 0.08 0.8 0.7 3.7 91 0.07 0.4 0.7 5.9 154 0.12 0.4 0.8 9.3 198 0.07 0.3 0.4 1.8 116Si 0.02 0.3 4.5 59.9 332 0.01 0.1 0.4 6.9 285 0.01 0.1 0.1 0.5 96 0.02 0.1 0.1 0.3 79 0.02 0.1 0.1 0.4 108F� 0.05 1.5 9.7 65.3 190 0.02 0.9 0.3 6.5 165 <DL 0.2 0.3 3.4 188 0.01 0.1 0.2 3.0 214 <DL 0.03 0.1 1.5 239
Minor and Trace elements (lg l�1)
Sr 2.2 24.0 127 701 183 2.0 26.5 9.3 304 212 1.9 8.7 19.1 123 153 1.1 11.8 15.5 81.0 106 1.5 10.7 15.1 105 131Zn 4.7 29.9 47.7 244 125 4.3 17.9 12.8 134 135 1.8 7.8 14.3 86.0 127 1.0 8.7 11.4 42 91 1.5 6.7 9.5 45.9 93Fe 3.1 291 3071 33,740 276 2.0 140 54.6 1610 218 3.2 16.1 32.6 243 153 1.7 10.6 22.3 76.5 106 0.6 5.7 15.6 92.2 141Al 3.3 441 5734 48,590 225 5.0 459 79.3 7060 290 3.2 31.9 65.7 233 110 2.3 16.7 73.2 807 211 0.8 4.8 54.1 675 281Mn 0.2 9.8 132.3 1087 224 1.2 14.3 4.7 172 229 0.5 4.0 5.9 36.4 128 0.6 3.4 4.8 27 114 0.2 2.0 4.4 39.0 174B 0.4 2.1 7.9 69.0 216 0.5 2.3 1.6 8.3 77.7 0.5 2.0 2.6 8.6 84 0.6 2.8 3.6 9.7 68 0.4 1.6 2.2 5.5 65Cu 0.2 31.8 222 1401 191 0.3 19.6 4.3 288 269 0.2 3.4 5.4 34.5 125 0.2 2.2 3.6 21.0 123 0.2 1.4 5.3 78.7 272Ba 0.3 3.8 22.2 133 175 0.4 5.2 1.9 59.1 212 0.3 1.9 2.8 11 95 0.2 1.8 2.6 8.4 84 0.2 1.3 2.3 19.5 151V 0.23 3.9 11.1 89.3 199 0.2 1.8 1.1 13.6 142 0.2 0.7 1.3 6.8 112 0.2 1.3 1.6 6.8 84 0.2 0.6 0.9 3.8 96Se 0.18 1.9 3.9 20.0 140 0.05 1.0 0.8 4.6 96.2 0.06 0.4 0.6 2.8 90 0.05 0.4 0.5 1.4 78 0.02 0.3 0.3 0.6 61Ni 0.07 0.4 1.7 13.0 193 0.1 0.4 0.3 1.7 92.3 0.1 0.2 0.4 1.7 112 0.04 0.3 0.3 1.2 79 0.01 0.2 0.3 1.8 114Rb 0.02 2.3 17.1 162 237 0.1 1.6 0.7 7.9 123 0.1 0.4 0.8 4.6 126 0.1 0.5 0.8 3.5 116 0.01 0.1 0.4 2.2 135As 0.03 2.0 3.9 23.3 146 0.05 0.9 0.4 6.2 149 0.05 0.3 0.5 3.1 132 0.04 0.2 0.4 2.0 118 0.01 0.1 0.2 1.7 152Ti 0.1 5.6 92.4 814 244 0.03 2.3 0.7 16.5 160 0.04 0.2 0.7 10.2 258 0.02 0.2 0.5 2.8 138 0.04 0.1 0.2 0.8 98Li 0.03 0.4 2.5 18.9 205 0.04 0.3 0.2 3.2 190 0.02 0.1 0.2 1.4 131 0.02 0.1 0.2 0.7 87 0.01 0.1 0.2 1.5 164Pb 0.06 1.4 6.0 60.4 247 0.03 1.1 0.7 5.5 134 0.03 0.2 0.9 10.1 222 0.01 0.2 0.6 3.5 133 0.02 0.1 0.4 4.9 243Sb 0.01 0.03 0.33 4.6 344 <DL 0.10 0.07 0.5 114 0.01 0.07 0.10 0.4 99 0.01 0.10 0.12 0.3 82 0.01 0.06 0.11 0.6 115Cr 0.02 0.25 0.50 2.1 134 0.01 0.12 0.09 0.4 79.8 0.02 0.05 0.13 0.9 165 0.01 0.05 0.08 0.2 78 <DL 0.06 0.08 0.4 110Hg 0.03 0.04 0.04 0.06 43 0.02 0.04 0.05 0.06 35.2 – – – – – 0.01 0.02 0.03 0.07 91 0.04 0.06 0.06 0.10 46La 0.005 0.7 9.4 77.2 216 0.007 0.7 0.1 15.1 417 0.006 0.04 0.07 0.4 123 0.01 0.05 0.08 0.7 172 0.01 0.03 0.06 0.2 105Mo 0.005 0.06 0.6 6.2 283 0.005 0.1 0.03 0.4 151 0.008 0.04 0.07 0.2 106 0.008 0.05 0.14 1.9 276 0.009 0.03 0.04 0.2 86Tl 0.01 1.3 6.9 68.7 246 0.01 0.7 0.3 3.6 133 0.01 0.1 0.4 3.2 174 0.01 0.1 0.2 2.1 177 <DL 0.03 0.1 1.3 195Co 0.01 0.18 2.2 20.6 238 0.02 0.2 0.06 1.9 205 0.01 0.05 0.07 0.4 107 0.01 0.04 0.06 0.4 130 0.01 0.02 0.05 0.4 159Cd 0.01 0.89 3.6 32.0 222 0.01 0.4 0.16 1.7 128 0.01 0.06 0.19 1.0 128 0.01 0.05 0.22 2.5 217 <DL 0.02 0.09 0.7 184Be 0.01 0.04 0.4 3.6 234 <DL 0.04 0.02 0.4 208 <DL 0.01 0.02 0.1 85 <DL 0.02 0.02 0.05 65 <DL 0.01 0.02 0.06 99Cs 0.01 0.27 0.90 4.5 173 <DL 0.05 0.02 0.19 107 <DL 0.02 0.03 0.13 104 <DL 0.02 0.03 0.06 58 <DL 0.01 0.02 0.04 89U 0.005 0.02 0.34 3.1 264 <DL 0.03 0.01 0.3 228 <DL 0.01 0.01 0.03 83 <DL 0.01 0.01 0.03 99 <DL 0.01 0.01 0.02 71
7420S
.C
alabrese
etal./
Geo
chim
icaet
Co
smo
chim
icaA
cta75
(2011)7401–7425
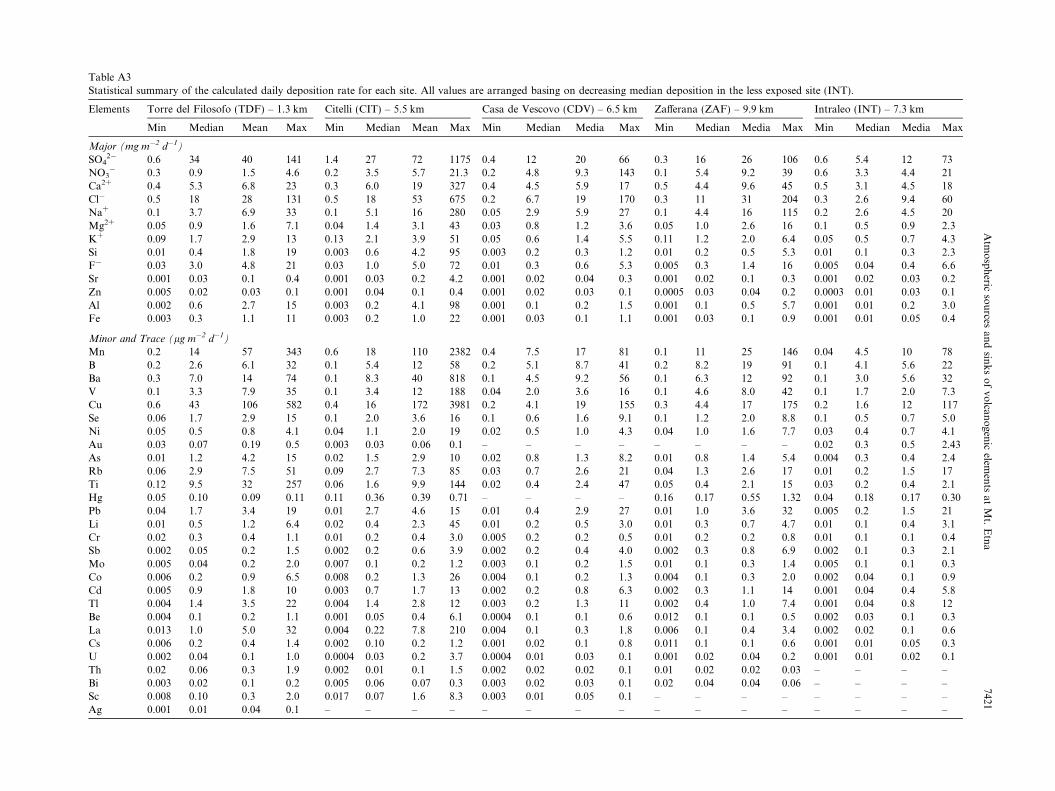
Table A3Statistical summary of the calculated daily deposition rate for each site. All values are arranged basing on decreasing median deposition in the less exposed site (INT).
Elements Torre del Filosofo (TDF) – 1.3 km Citelli (CIT) – 5.5 km Casa de Vescovo (CDV) – 6.5 km Zafferana (ZAF) – 9.9 km Intraleo (INT) – 7.3 km
Min Median Mean Max Min Median Mean Max Min Median Media Max Min Median Media Max Min Median Media Max
Major (mg m�2 d�1)
SO42� 0.6 34 40 141 1.4 27 72 1175 0.4 12 20 66 0.3 16 26 106 0.6 5.4 12 73
NO3� 0.3 0.9 1.5 4.6 0.2 3.5 5.7 21.3 0.2 4.8 9.3 143 0.1 5.4 9.2 39 0.6 3.3 4.4 21
Ca2+ 0.4 5.3 6.8 23 0.3 6.0 19 327 0.4 4.5 5.9 17 0.5 4.4 9.6 45 0.5 3.1 4.5 18Cl� 0.5 18 28 131 0.5 18 53 675 0.2 6.7 19 170 0.3 11 31 204 0.3 2.6 9.4 60Na+ 0.1 3.7 6.9 33 0.1 5.1 16 280 0.05 2.9 5.9 27 0.1 4.4 16 115 0.2 2.6 4.5 20Mg2+ 0.05 0.9 1.6 7.1 0.04 1.4 3.1 43 0.03 0.8 1.2 3.6 0.05 1.0 2.6 16 0.1 0.5 0.9 2.3K+ 0.09 1.7 2.9 13 0.13 2.1 3.9 51 0.05 0.6 1.4 5.5 0.11 1.2 2.0 6.4 0.05 0.5 0.7 4.3Si 0.01 0.4 1.8 19 0.003 0.6 4.2 95 0.003 0.2 0.3 1.2 0.01 0.2 0.5 5.3 0.01 0.1 0.3 2.3F� 0.03 3.0 4.8 21 0.03 1.0 5.0 72 0.01 0.3 0.6 5.3 0.005 0.3 1.4 16 0.005 0.04 0.4 6.6Sr 0.001 0.03 0.1 0.4 0.001 0.03 0.2 4.2 0.001 0.02 0.04 0.3 0.001 0.02 0.1 0.3 0.001 0.02 0.03 0.2Zn 0.005 0.02 0.03 0.1 0.001 0.04 0.1 0.4 0.001 0.02 0.03 0.1 0.0005 0.03 0.04 0.2 0.0003 0.01 0.03 0.1Al 0.002 0.6 2.7 15 0.003 0.2 4.1 98 0.001 0.1 0.2 1.5 0.001 0.1 0.5 5.7 0.001 0.01 0.2 3.0Fe 0.003 0.3 1.1 11 0.003 0.2 1.0 22 0.001 0.03 0.1 1.1 0.001 0.03 0.1 0.9 0.001 0.01 0.05 0.4
Minor and Trace (lg m�2 d�1)
Mn 0.2 14 57 343 0.6 18 110 2382 0.4 7.5 17 81 0.1 11 25 146 0.04 4.5 10 78B 0.2 2.6 6.1 32 0.1 5.4 12 58 0.2 5.1 8.7 41 0.2 8.2 19 91 0.1 4.1 5.6 22Ba 0.3 7.0 14 74 0.1 8.3 40 818 0.1 4.5 9.2 56 0.1 6.3 12 92 0.1 3.0 5.6 32V 0.1 3.3 7.9 35 0.1 3.4 12 188 0.04 2.0 3.6 16 0.1 4.6 8.0 42 0.1 1.7 2.0 7.3Cu 0.6 43 106 582 0.4 16 172 3981 0.2 4.1 19 155 0.3 4.4 17 175 0.2 1.6 12 117Se 0.06 1.7 2.9 15 0.1 2.0 3.6 16 0.1 0.6 1.6 9.1 0.1 1.2 2.0 8.8 0.1 0.5 0.7 5.0Ni 0.05 0.5 0.8 4.1 0.04 1.1 2.0 19 0.02 0.5 1.0 4.3 0.04 1.0 1.6 7.7 0.03 0.4 0.7 4.1Au 0.03 0.07 0.19 0.5 0.003 0.03 0.06 0.1 – – – – – – – – 0.02 0.3 0.5 2.43As 0.01 1.2 4.2 15 0.02 1.5 2.9 10 0.02 0.8 1.3 8.2 0.01 0.8 1.4 5.4 0.004 0.3 0.4 2.4Rb 0.06 2.9 7.5 51 0.09 2.7 7.3 85 0.03 0.7 2.6 21 0.04 1.3 2.6 17 0.01 0.2 1.5 17Ti 0.12 9.5 32 257 0.06 1.6 9.9 144 0.02 0.4 2.4 47 0.05 0.4 2.1 15 0.03 0.2 0.4 2.1Hg 0.05 0.10 0.09 0.11 0.11 0.36 0.39 0.71 – – – – 0.16 0.17 0.55 1.32 0.04 0.18 0.17 0.30Pb 0.04 1.7 3.4 19 0.01 2.7 4.6 15 0.01 0.4 2.9 27 0.01 1.0 3.6 32 0.005 0.2 1.5 21Li 0.01 0.5 1.2 6.4 0.02 0.4 2.3 45 0.01 0.2 0.5 3.0 0.01 0.3 0.7 4.7 0.01 0.1 0.4 3.1Cr 0.02 0.3 0.4 1.1 0.01 0.2 0.4 3.0 0.005 0.2 0.2 0.5 0.01 0.2 0.2 0.8 0.01 0.1 0.1 0.4Sb 0.002 0.05 0.2 1.5 0.002 0.2 0.6 3.9 0.002 0.2 0.4 4.0 0.002 0.3 0.8 6.9 0.002 0.1 0.3 2.1Mo 0.005 0.04 0.2 2.0 0.007 0.1 0.2 1.2 0.003 0.1 0.2 1.5 0.01 0.1 0.3 1.4 0.005 0.1 0.1 0.3Co 0.006 0.2 0.9 6.5 0.008 0.2 1.3 26 0.004 0.1 0.2 1.3 0.004 0.1 0.3 2.0 0.002 0.04 0.1 0.9Cd 0.005 0.9 1.8 10 0.003 0.7 1.7 13 0.002 0.2 0.8 6.3 0.002 0.3 1.1 14 0.001 0.04 0.4 5.8Tl 0.004 1.4 3.5 22 0.004 1.4 2.8 12 0.003 0.2 1.3 11 0.002 0.4 1.0 7.4 0.001 0.04 0.8 12Be 0.004 0.1 0.2 1.1 0.001 0.05 0.4 6.1 0.0004 0.1 0.1 0.6 0.012 0.1 0.1 0.5 0.002 0.03 0.1 0.3La 0.013 1.0 5.0 32 0.004 0.22 7.8 210 0.004 0.1 0.3 1.8 0.006 0.1 0.4 3.4 0.002 0.02 0.1 0.6Cs 0.006 0.2 0.4 1.4 0.002 0.10 0.2 1.2 0.001 0.02 0.1 0.8 0.011 0.1 0.1 0.6 0.001 0.01 0.05 0.3U 0.002 0.04 0.1 1.0 0.0004 0.03 0.2 3.7 0.0004 0.01 0.03 0.1 0.001 0.02 0.04 0.2 0.001 0.01 0.02 0.1Th 0.02 0.06 0.3 1.9 0.002 0.01 0.1 1.5 0.002 0.02 0.02 0.1 0.01 0.02 0.02 0.03 – – – –Bi 0.003 0.02 0.1 0.2 0.005 0.06 0.07 0.3 0.003 0.02 0.03 0.1 0.02 0.04 0.04 0.06 – – – –Sc 0.008 0.10 0.3 2.0 0.017 0.07 1.6 8.3 0.003 0.01 0.05 0.1 – – – – – – – –Ag 0.001 0.01 0.04 0.1 – – – – – – – – – – – – – – – –
Atm
osp
heric
sou
rcesan
dsin
ks
of
volcan
ogen
icelem
ents
atM
t.E
tna
7421
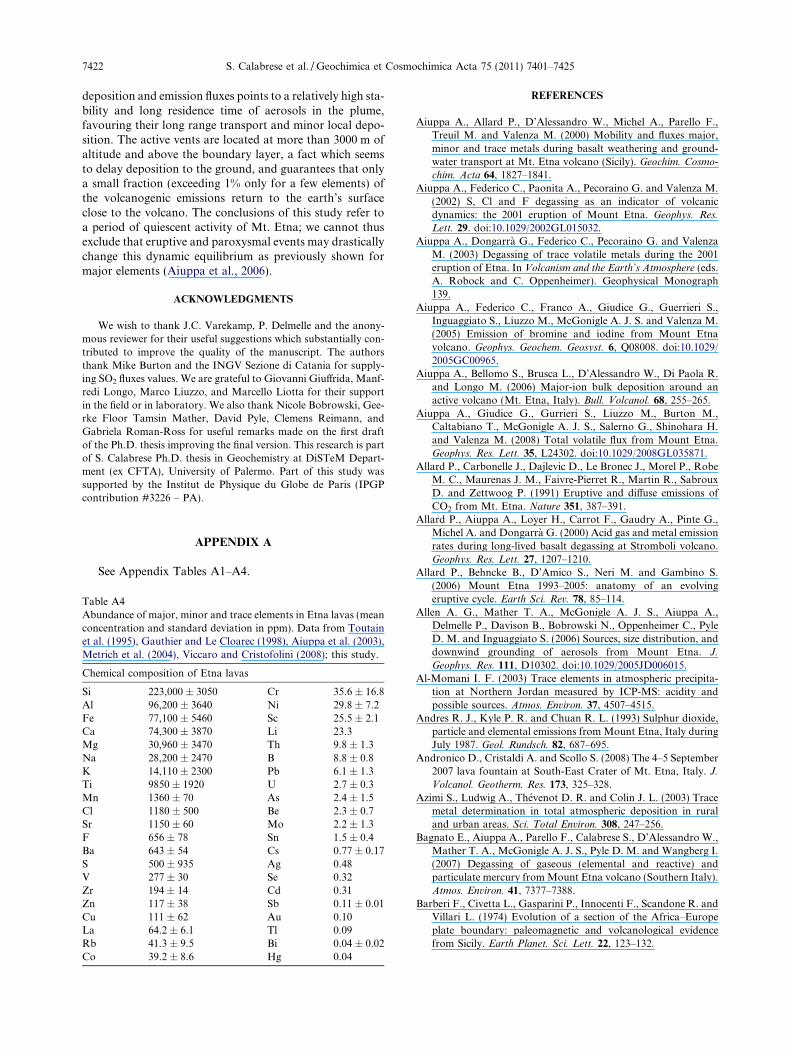
7422 S. Calabrese et al. / Geochimica et Cosmochimica Acta 75 (2011) 7401–7425
deposition and emission fluxes points to a relatively high sta-bility and long residence time of aerosols in the plume,favouring their long range transport and minor local depo-sition. The active vents are located at more than 3000 m ofaltitude and above the boundary layer, a fact which seemsto delay deposition to the ground, and guarantees that onlya small fraction (exceeding 1% only for a few elements) ofthe volcanogenic emissions return to the earth’s surfaceclose to the volcano. The conclusions of this study refer toa period of quiescent activity of Mt. Etna; we cannot thusexclude that eruptive and paroxysmal events may drasticallychange this dynamic equilibrium as previously shown formajor elements (Aiuppa et al., 2006).
ACKNOWLEDGMENTS
We wish to thank J.C. Varekamp, P. Delmelle and the anony-mous reviewer for their useful suggestions which substantially con-tributed to improve the quality of the manuscript. The authorsthank Mike Burton and the INGV Sezione di Catania for supply-ing SO2 fluxes values. We are grateful to Giovanni Giuffrida, Manf-redi Longo, Marco Liuzzo, and Marcello Liotta for their supportin the field or in laboratory. We also thank Nicole Bobrowski, Gee-rke Floor Tamsin Mather, David Pyle, Clemens Reimann, andGabriela Roman-Ross for useful remarks made on the first draftof the Ph.D. thesis improving the final version. This research is partof S. Calabrese Ph.D. thesis in Geochemistry at DiSTeM Depart-ment (ex CFTA), University of Palermo. Part of this study wassupported by the Institut de Physique du Globe de Paris (IPGPcontribution #3226 – PA).
APPENDIX A
See Appendix Tables A1–A4.
Table A4Abundance of major, minor and trace elements in Etna lavas (meanconcentration and standard deviation in ppm). Data from Toutainet al. (1995), Gauthier and Le Cloarec (1998), Aiuppa et al. (2003),Metrich et al. (2004), Viccaro and Cristofolini (2008); this study.
Chemical composition of Etna lavas
Si 223,000 ± 3050 Cr 35.6 ± 16.8Al 96,200 ± 3640 Ni 29.8 ± 7.2Fe 77,100 ± 5460 Sc 25.5 ± 2.1Ca 74,300 ± 3870 Li 23.3Mg 30,960 ± 3470 Th 9.8 ± 1.3Na 28,200 ± 2470 B 8.8 ± 0.8K 14,110 ± 2300 Pb 6.1 ± 1.3Ti 9850 ± 1920 U 2.7 ± 0.3Mn 1360 ± 70 As 2.4 ± 1.5Cl 1180 ± 500 Be 2.3 ± 0.7Sr 1150 ± 60 Mo 2.2 ± 1.3F 656 ± 78 Sn 1.5 ± 0.4Ba 643 ± 54 Cs 0.77 ± 0.17S 500 ± 935 Ag 0.48V 277 ± 30 Se 0.32Zr 194 ± 14 Cd 0.31Zn 117 ± 38 Sb 0.11 ± 0.01Cu 111 ± 62 Au 0.10La 64.2 ± 6.1 Tl 0.09Rb 41.3 ± 9.5 Bi 0.04 ± 0.02Co 39.2 ± 8.6 Hg 0.04
REFERENCES
Aiuppa A., Allard P., D’Alessandro W., Michel A., Parello F.,Treuil M. and Valenza M. (2000) Mobility and fluxes major,minor and trace metals during basalt weathering and ground-water transport at Mt. Etna volcano (Sicily). Geochim. Cosmo-
chim. Acta 64, 1827–1841.
Aiuppa A., Federico C., Paonita A., Pecoraino G. and Valenza M.(2002) S, Cl and F degassing as an indicator of volcanicdynamics: the 2001 eruption of Mount Etna. Geophys. Res.
Lett. 29. doi:10.1029/2002GL015032.
Aiuppa A., Dongarra G., Federico C., Pecoraino G. and ValenzaM. (2003) Degassing of trace volatile metals during the 2001eruption of Etna. In Volcanism and the Earth’s Atmosphere (eds.A. Robock and C. Oppenheimer). Geophysical Monograph139.
Aiuppa A., Federico C., Franco A., Giudice G., Guerrieri S.,Inguaggiato S., Liuzzo M., McGonigle A. J. S. and Valenza M.(2005) Emission of bromine and iodine from Mount Etnavolcano. Geophys. Geochem. Geosyst. 6, Q08008. doi:10.1029/
2005GC00965.
Aiuppa A., Bellomo S., Brusca L., D’Alessandro W., Di Paola R.and Longo M. (2006) Major-ion bulk deposition around anactive volcano (Mt. Etna, Italy). Bull. Volcanol. 68, 255–265.
Aiuppa A., Giudice G., Gurrieri S., Liuzzo M., Burton M.,Caltabiano T., McGonigle A. J. S., Salerno G., Shinohara H.and Valenza M. (2008) Total volatile flux from Mount Etna.Geophys. Res. Lett. 35, L24302. doi:10.1029/2008GL035871.
Allard P., Carbonelle J., Dajlevic D., Le Bronec J., Morel P., RobeM. C., Maurenas J. M., Faivre-Pierret R., Martin R., SabrouxD. and Zettwoog P. (1991) Eruptive and diffuse emissions ofCO2 from Mt. Etna. Nature 351, 387–391.
Allard P., Aiuppa A., Loyer H., Carrot F., Gaudry A., Pinte G.,Michel A. and Dongarra G. (2000) Acid gas and metal emissionrates during long-lived basalt degassing at Stromboli volcano.Geophys. Res. Lett. 27, 1207–1210.
Allard P., Behncke B., D’Amico S., Neri M. and Gambino S.(2006) Mount Etna 1993–2005: anatomy of an evolvingeruptive cycle. Earth Sci. Rev. 78, 85–114.
Allen A. G., Mather T. A., McGonigle A. J. S., Aiuppa A.,Delmelle P., Davison B., Bobrowski N., Oppenheimer C., PyleD. M. and Inguaggiato S. (2006) Sources, size distribution, anddownwind grounding of aerosols from Mount Etna. J.
Geophys. Res. 111, D10302. doi:10.1029/2005JD006015.
Al-Momani I. F. (2003) Trace elements in atmospheric precipita-tion at Northern Jordan measured by ICP-MS: acidity andpossible sources. Atmos. Environ. 37, 4507–4515.
Andres R. J., Kyle P. R. and Chuan R. L. (1993) Sulphur dioxide,particle and elemental emissions from Mount Etna, Italy duringJuly 1987. Geol. Rundsch. 82, 687–695.
Andronico D., Cristaldi A. and Scollo S. (2008) The 4–5 September2007 lava fountain at South-East Crater of Mt. Etna, Italy. J.
Volcanol. Geotherm. Res. 173, 325–328.
Azimi S., Ludwig A., Thevenot D. R. and Colin J. L. (2003) Tracemetal determination in total atmospheric deposition in ruraland urban areas. Sci. Total Environ. 308, 247–256.
Bagnato E., Aiuppa A., Parello F., Calabrese S., D’Alessandro W.,Mather T. A., McGonigle A. J. S., Pyle D. M. and Wangberg I.(2007) Degassing of gaseous (elemental and reactive) andparticulate mercury from Mount Etna volcano (Southern Italy).Atmos. Environ. 41, 7377–7388.
Barberi F., Civetta L., Gasparini P., Innocenti F., Scandone R. andVillari L. (1974) Evolution of a section of the Africa–Europeplate boundary: paleomagnetic and volcanological evidencefrom Sicily. Earth Planet. Sci. Lett. 22, 123–132.
Atmospheric sources and sinks of volcanogenic elements at Mt. Etna 7423
Bellomo S., D’Alessandro W. and Longo M. (2003) Volcanogenicfluorine in rainwater around active degassing volcanoes: Mt.Etna and Stromboli Island, Italy. Sci. Total Environ. 301, 175–
185.
Bellomo S., Aiuppa A., D’Alessandro W. and Parello F. (2007)Environmental impact of magmatic fluorine emission in the Mt.Etna area. J. Volcanol. Geotherm. Res. 165, 87–101.
Bergametti G., Martin D., Carbonelle J., Faivre-Pierret R. and VieLe Sage R. (1984) A mesoscale study of the elementalcomposition of aerosols emitted from Mt. Etna Volcano. Bull.
Volcanol. 47, 1107–1114.
Brenan J. M., Neroda E., Lundstrom C. C., Shaw H. F., RyersonF. J. and Phinney D. L. (1998) Behaviour of boron, beryllium,and lithium during melting and crystallization: constraints frommineral-melt partitioning experiments. Geochim. Cosmochim.
Acta 62, 2129–2141.
Buat-Menard P. and Arnold M. (1978) The heavy metal chemistryof atmospheric particulate matter emitted by Mount Etnavolcano. Geophys. Res. Lett. 5, 245–248.
Burton M. R., Neri M., Andronico D., Branca S., Caltabiano T.,Calvari S., Corsaro R. A., Del Carlo P., Lanzafame G., LodatoL., Miraglia L., Salerno G. and Spampinato L. (2005) Etna2004–2005: an archetype for geodynamically-controlled effusiveeruptions. Geophys. Res. Lett. 32, L09303. doi:10.1029/
2005GL022527.
Cadle R. D. (1980) A comparison of volcanic with other fluxes atatmospheric trace gas constituents. Rev. Geophys. Space Phys.
18, 746–752.
Cadle R. D., Wartburg A. F., Pollok W. H., Gandrud B. W. andShedlovky J. P. (1973) Trace constituents emitted to theatmosphere by Hawaiian volcanoes. Chemosphere 6, 231–234.
Caltabiano T., Burton M., Giammanco S., Allard P., Bruno N.,Mure F. and Romano R. (2004) Volcanic gas emissions fromthe summit craters and flanks of Mt. Etna, 1987–2000. In Mt.
Etna: Volcano Laboratory (eds. A. Bonaccorso, S. Calvari, M.Coltelli, C. Del Negro and S. Falsaperla). AGU Geophys.Monogr. Ser. 143.
Chekushin V. A., Bogatyrev I. V., de Caritat P., Niskavaara H. andReimann C. (1998) Annual atmospheric deposition of 16elements in eight catchments of the central Barents region.Sci. Total Environ. 220, 95–114.
Chester D. K., Duncan A. M., Guest J. E. and Kilbum C. R. J.(1985) Mount Etna: The Anatomy of a Volcano. Chapman &Hall, London.
Chester R., Nimmo M. and Keyse S. (1996) The influence ofSaharan and middle Eastern desert-derived dust on the tracemetal composition of Mediterranean aerosols and rainwater: anoverview. In The Impact of Desert Dust Across the Mediterra-
nean (eds. S. Guerzoni and R. Chester). Kluwer Academic
Publishers, Netherlands, pp. 253–273.
Cheynet B., Dall’Aglio M., Garavelli A., Grasso M. F. and VurroF. (2000) Trace elements from fumaroles at Volcano Island(Italy): rates of transport and a thermochemical model. J.
Volcanol. Geotherm. Res. 95, 273–283.
Chuan R. L., Palais J. M. and Rose W. I. (1986) Fluxes, sizes,morphology and compositions of particles in the Mt. Erebusvolcanic plume. J. Atmos. Chem. 4, 467–477.
Collins S. J., Pyle D. M. and Maclennan J. (2009) Melt inclusionstrack pre-eruption storage and dehydration of magmas at Etna.Geology 37, 571–574. doi:10.1130/G30040A.1.
Crowe B. M., Finnegan D. L., Zoller W. H. and Boyton W. V.(1987) Trace element geochemistry of volcanic gases andparticles from 1983 to 1984 eruptive episodes of Kilaueavolcano. J. Geophys. Res. 92, 13708–13714.
D’Alessandro W., Giammanco S., Parello F. and Valenza M.(1997) CO2 output and d13C(CO2) from Mount Etna as
indicators of degassing of shallow asthenosphere. Bull. Volca-
nol. 58, 455–458.
Dedeurwaerder H., Decadt G. and Baeyens W. (1982) Estimationsof mercury fluxes emitted by Mt. Etna volcano. Bull. Volcanol.
45, 191–196.
Delmelle P. (2003) Environmental impacts of tropospheric volcanicgas plumes. In Volcanic Degassing, vol. 213 (eds. C. Oppenhei-mer, D. M. Pyle and J. Barclay). Geol. Soc. Lond. Spec. Publ.,
pp. 381–399.
Delmelle P., Lambert M., Dufrene Y., Gerin P. and Oskarsson N.(2007) Gas/aerosol–ash interaction in volcanic plumes: newinsights from surface analyses of fine ash particles. Earth
Planet. Sci. Lett. 259, 159–170.
Favalli M., Innocenti F., Pareschi M. T., Pasquare G., MazzariniF., Branca S., Cavarra L. and Tibaldi A. (1999) The DEM ofMt. Etna: geomorphological and structural implications. Geo-
dyn. Acta 12, 279–290.
Finnegan D. L., Kotra J. P., Hermann D. M. and Zoeller W. H.(1989) The use of LiOH-impregnated filters for the collection ofacidic gases and analysis by instrumental neutron activationanalysis. Bull. Volcanol. 51, 83–87.
Francis P., Burton M. R. and Oppenheimer C. (1998) Remotemeasurements of volcanic gas compositions by solar occulta-tion spectroscopy. Nature 396, 567–570.
Furuta N., Iijima A., Kambe A., Sakai K. and Sato K. (2005)Concentrations, enrichment and predominant sources of Sband other trace elements in size classified airborne particulatematter collected in Tokyo from 1995 to 2004. J. Environ. Monit.
7, 1155–1161.
Galindo I., Ivlev L. S., Gonzalez A. and Ayala R. (1998) Airbornemeasurements of particle and gas emissions from the December1994–January 1995 eruption of Popocatepetl volcano (Mexico).J. Volcanol. Geotherm. Res. 83, 197–217.
Gauthier P. J. and Le Cloarec M. F. (1998) Variability of alkali andheavy metal fluxes released by Mt. Etna volcano, Sicily,between 1991 and 1995. J. Volcanol. Geotherm. Res. 81, 311–
326.
Gelinas Y., Lucotte M. and Schmit J. P. (2000) History of theatmospheric deposition of major and trace elements in theindustrialized St. Lawrence Valley, Quebec, Canada. Atmos.
Environ. 34, 1797–1810.
Gislason S. R. and Oelkers E. H. (2003) Mechanism, rates, andconsequences of basaltic glass dissolution: II. An experimentalstudy of the dissolution rates of basaltic glass as a function ofpH and temperature. Geochim. Cosmochim. Acta 67, 3817–
3832.
Gislason S. R., Hassenkam T., Nedel S., Bovet N., Eiriksdottir E.S., Alfredsson H. A., Hem C. P., Balogh Z. I., Dideriksen K.,Oskarsson N., Sigfusson B., Larsen G. and Stipp S. L. S. (2011)Characterization of Eyjafjallajokull volcanic ash particles and aprotocol for rapid risk assessment. Proc. Nat. Acad. Sci. 108,
7307–7312.
Gomez D. R., Fernanda M. G., Sanchez Bellato C. A. andSmichowski P. (2005) Antimony: a traffic-related element in theatmosphere of Buenos Aires, Argentina. J. Environ. Monit. 7,
1162–1168.
Guerzoni S., Rampazzo G., Molinaroli E. and Rossini P. (2005)Atmospheric bulk deposition to the Lagoon of Venice. Part II.Source apportionment analysis near the industrial zone ofPorto Marghera, Italy. Environ. Internat. 31, 975–982.
Hinkley T. K., Le Cloarec M. F. and Lambert G. (1994)Fractionation of families of major, minor, and trace metalsacross the melt–vapor interface in volcanic exhalations. Geo-
chim. Cosmochim. Acta 58, 3255–3263.
Hinkley T. K., Lamothe P. J., Wilson S. A., Finnegan D. L. andGerlach T. M. (1999) Metal emissions from Kilauea, and a

7424 S. Calabrese et al. / Geochimica et Cosmochimica Acta 75 (2011) 7401–7425
suggested revision of the estimated worldwide metal output byquiescent degassing of volcanoes. Earth Planet. Sci. Lett. 170,
315–325.
Koc�ak M., Kubilay N., Herut B. and Nimmo M. (2005) Dryatmospheric fluxes of trace metals (Al, Fe, Mn, Pb, Cd, Zn, Cu)over the Levantine Basin: a refined assessment. Atmos. Environ.
39, 7330–7341.
Kyle P. R., Meeker K. and Finnegan D. (1990) Emission rates ofsulfur dioxide, trace gases and metals from Mount Erebus,Antartica. Geophys. Res. Lett. 17, 2125–2128.
Lambert G., Le Cloarec M. F., Ardouin B. and Le Roulley J. C.(1986) Volcanic emissions of radionuclides and magma dynam-ics. Earth Planet. Sci. Lett. 76, 185–192.
Lambert G., Le Cloarec M. F. and Pennisi M. (1988) Volcanicoutput of SO2 and trace metals: a new approach. Geochim.
Cosmochim. Acta 52, 39–42.
Le Cloarec M. F. and Marty B. (1991) Volatile fluxes fromvolcanoes. Terra Nova 3, 17–27.
Le Guern F. (1988) Ecoulements gazeux reactifs a hautes temper-atures, mesures et modelisation. Ph.D. thesis, Paris VII Univ.
Martin D., Ardouin B., Bergametti G., Carbonnelle J., Faivre-Pierret R., Lambert G., Le Cloarec M. F. and Sennequier(1986) Geochemistry of sulfur in Mount Etna plume. J.
Geophys. Res. 91, 12249–12254.
Martin R. S., Mather T. A., Pyle D. M., Power M., Allen A. G.,Aiuppa A., Horwell C. J. and Ward E. P. W. (2008)Composition-resolved size distributions of volcanic aerosols inthe Mt. Etna plumes. J. Geophys. Res. 113, D17211.
Martin R. S., Mather T. A., Pyle D. M., Watt S. F. L., Day J.,Collins S. J., Wright T. E., Aiuppa A. and Calabrese S. (2009)Sweet chestnut (Castanea sativa) leaves as a bio-indicator ofvolcanic gas, aerosol and ash deposition onto the flanks of Mt.Etna in 2005–2007. J. Volcanol. Geotherm. Res. 179, 107–119.
Martin R. S., Ilyinskaya E., Sawyer G. M., Tsanev V. I. andOppenheimer C. (2011) A re-assessment of aerosol size distri-butions from Masaya volcano (Nicaragua). Atmos. Environ.
45(3), 547–560.
Mather T. A., Pyle D. M. and Oppenheimer C. (2003) Tropo-spheric volcanic aerosol, in volcanism and the Earth’s atmo-sphere. In Volcanism and the Earth’s Atmosphere (eds. A.Robock and C. Oppenheimer). Geophysical Monograph 139.pp. 189–212.
Mather T. A., Oppenheimer C., Allen A. G. and McGonigle A. J.S. (2004) Aerosol chemistry of emissions from three contrastingvolcanoes in Italy. Atmos. Environ. 38, 5637–5649.
Mather T. A., Pyle D. M. and Heaton T. H. E. (2008) Investigationof the use of filter packs to measure the sulphur isotopiccomposition of volcanic sulphur dioxide and the sulphur andoxygen isotopic composition of volcanic sulphate aerosol.Atmos. Environ. 42, 4611–4618.
Medinets V. I. (1996) Shipboard derived concentrations of sulphurand nitrogen compounds and trace metals in the Mediterraneanaerosol. In The Impact of Desert Dust Across the Mediterranean
(eds. S. Guerzoni and R. Chester). Kluwer Academic Publish-
ers, Netherlands, pp. 359–368.
Metrich N., Allard P., Spilliaert N., Andronico D. and Burton M.(2004) 2001 flank eruption of the alkali- and volatile-richprimitive basalt responsible for Mount Etna’s evolution in thelast three decades. Earth Planet. Sci. Lett. 228, 1–17.
doi:10.1016/j.epsl.2004.09.036.
Mosher B. W. and Duce R. A. (1985) Vapour phase and particulateselenium in the marine atmosphere. J. Geophys. Res. 88, 6761–
6768.
Motelay-Massei A., Ollivon D., Tiphagne K. and Garban B. (2005)Atmospheric bulk deposition of trace metals to the Seine river
Basin, France: concentrations, sources and evolution from 1988to 2001 in Paris. Wat. Air Soil Pollut. 164, 119–135.
Moune S., Gauthier P. J., Gislason S. R. and Sigmarsson O. (2006)Trace element degassing and enrichment in the eruptive plumeof the 2000 eruption of Hekla volcano, Iceland. Geochim.
Cosmochim. Acta 70, 461–479.
Moune S., Gauthier P. J. and Delmelle P. (2010) Trace elements inthe particulate phase of the plume of Masaya Volcano,Nicaragua. J. Volcanol. Geotherm. Res. 193, 232–244.
Munthe J. (1996) Guidelines for the sampling and analysis ofmercury in air and precipitation. Gothenburg (IVL-report L 96/204).
Neri M. and Acocella V. (2006) The 2004–2005 Etna eruption:implications for flank deformation and structural behaviour ofthe volcano. J. Volcanol. Geotherm. Res. 158, 195–206.
NILU (2001) EMEP Manual for Sampling and Chemical Analysis.EMEP/CCC Report 1/95 NILU Norwegian Institute for AirResearch, Kjeller, Lillestrøm, Norway.
Nriagu J. O. (1989) A global assessment of natural sources ofatmospheric trace metals. Nature 338, 47–49.
Oppenheimer C. (2003) Volcanic degassing. In Treatise on
Geochemistry, vol. 3 (eds. R. L. Rudnick, H. D. Holland andK. K. Turekian). Elsevier-Pergamon, Oxford, pp. 123–166.
Oskarsson N. (1980) The interaction between volcanic gases andtephra: fluorine adhering to tephra of the 1970 Hekla eruption.J. Volcanol. Geotherm. Res. 8, 251–266.
OSPAR (1997) JAMP Guidelines for the sampling and analysis ofmercury in air and precipitation. OSPAR Commision, Monitorguideline Ref. n. 1997–8. London.
Parker J. L. and Bloom N. S. (2005) Preservation and storagetechniques for low-level aqueous mercury speciation. Sci. Total
Environ. 337, 253–263.
Pennisi M., Le Cloarec M. F., Lambert G. and Le Roulley J. C.(1988) Fractionation of metals in volcanic emissions. Earth
Planet. Sci. Lett. 88, 284–288.
Pugnaghi S., Gangale G., Corradini S. and Buongiorno M. F.(2006) Mt. Etna sulfur dioxide flux monitoring using ASTER-TIR data and atmospheric observations. J. Volcanol. Geotherm.
Res. 152, 74–90.
Pyle D. M. and Mather T. A. (2003) The importance of volcanicemissions for the global atmospheric mercury cycle. Atmos.
Environ. 37, 5115–5121.
Quisefit J. P., Bergametti G., Vie Le Sage R., Martin D., ZettwoogP., Carbonelle J. and Faivre-Pierret R. (1982) Nouvelleevaluation des flux particulaires de l’Etna-1980. C.R. Acad.
Sci. 295, 943–945.
Reimann C. and de Caritat P. (2000) Intrinsic flaws of elementenrichment factors (EFs) in environmental geochemistry. Envi-
ron Sci. Technol. 34, 5084–5091.
Reimann C., de Caritat P., Halleraker J. H., Volden T., Ayras M.,Niskavaaara H., Chekushin V. A. and Pavlov V. A. (1997)Rainwater composition in eight arctic catchments in northernEurope (Finland, Norway and Russia). Atmos. Environ. 31,
159–170.
Reimann C., Filzmoser P., Garrett R. and Dutter R. (2008)Statistical Data Analysis Explained: Applied EnvironmentalStatistics with R. Wiley, Chichester. ISBN: 978-0-470-98581-6.
Rossini P., Guerzoni S., Molinaroli E., Rampazzo G., De LazzariA. and Zancanaro A. (2005) Atmospheric bulk deposition tothe lagoon of Venice. Part I. Fluxes of metals, nutrients andorganic contaminants. Environ. Internat. 31, 959–974.
Seinfeld J. H. and Pandis S. N. (1998) Atmospheric Chemistry and
Physics. Wiley Interscience, New York.Shimamura T., Iwashita M., Iijima S., Shintani M. and Takaku Y.
(2007) Major to ultra trace elements in rainfall collected insuburban Tokyo. Atmos. Environ. 41, 6999–7010.
Atmospheric sources and sinks of volcanogenic elements at Mt. Etna 7425
Symonds R. B., Rose W. I., Reed M. H., Lichte F. E. and FinneganD. L. (1987) Volatilization, transport and sublimation ofmetallic and non-metallic elements in high temperature gasesat Merapi Volcano, Indonesia. Geoch. Cosmoch. Acta. 51,
2083–2101.
Symonds R. B., Reed M. H. and Rose W. I. (1992) Origin,speciation, and fluxes of trace-element gases at Augustinevolcano, Alaska: insights into magma degassing and fumarolicprocesses. Geochim. Cosmochim. Acta 56, 633–657.
Symonds R. B., Rose W. I., Bluth G. J. S. and Gerlach T. M.(1994) Volcanic gas studies: methods, results and applications.In Volatiles in Magmas, vol. 30 (eds. M. R. Carroll and J. R.Holloway). Mineral. Soc. of Am., Rev. Mineral., pp. 1–66.
Toutain J. P., Quisefit J. P., Briole P., Aloupogiannis P., Blanc P.and Robaye G. (1995) Mineralogy and chemistry of solidaerosols emitted from Mount Etna. Geochem. J. 29, 163–173.
Tukey J. W. (1977) Exploratory Data Analysis. Addison-Wesley,Reading, Mass.
Ulrich E., Mosello R., Derome J., Derome K., Clarke N., KonigN., Lovblad G. and Draaijers G.P.J. (2006) Manual onMethods and criteria for harmonized sampling, assessment,monitoring and analysis of the effects of air pollution on forests.Part VI: Sampling and Analysis of Deposition. InternationalCo-operative Programme on Assessment and Monitoring ofAir Pollution Effects on Forests (ICP Manuals).
USEPA (2002) Method 1631, revision E: Mercury in Water byOxidation, Purge and Trap, and Cold Vapor Atomic Fluores-
cence Spectrometry. United States Environmental ProtectionAgency, Office of Water 4303; EPA-821-R-02-019.
Varekamp J. C., Thomas E., Germani M. and Buseck P. R. (1986)Particle geochemistry of volcanic plumes of Etna and Mount St.Helens. J. Geophys. Res. 91, 12233–12248.
Viccaro M. and Cristofolini R. (2008) Nature of mantle heteroge-neity and its role in the short-term geochemical and volcano-logical evolution of Mt. Etna (Italy). Lithos 105, 272–288.
Vie le Sage R. (1983) Chemistry of the volcanic aerosol. InForecasting Volcanic Events (eds. H. Tazieff and J. C. Sabroux).Elsevier, Amsterdam, New York, pp. 445–474.
Wardell L. J., Kyle P. R. and Counce D. (2008) Volcanic emissionsof metals and halogens from White Island (New Zealand) andErebus volcano (Antarctica) determined with chemical traps. J.
Volcanol. Geotherm. Res. 177, 734–742.
White M. V. (1999) Geochemistry (e-book) http://www.imwa.info/geochemistry/.
Wolff-Boenisch D., Gislason S. R. and Oelkers E. H. (2004) Theeffect of fluoride on the dissolution rates of natural glasses atpH 4 and 25 �C. Geochim. Cosmochim. Acta 68, 4571–4582.
Zreda-Gostynska G., Kyle P. R., Finnegan D. and Prestbo K. M.(1997) Volcanic gas emissions from Mount Erebus and theirimpact on the Antarctic environment. J. Geophys. Res. 102,
15039–15055.
Associate editor: Jerome Gaillardet
Related Documents


