QUARTERLY JOURNAL OF THE ROYAL METEOROLOGICAL SOCIETY Q. J. R. Meteorol. Soc. 133: 673–680 (2007) Published online 22 March 2007 in Wiley InterScience (www.interscience.wiley.com) DOI: 10.1002/qj.35 Atmospheric mass-transport inconsistencies in the ERA-40 reanalysis R. G. Graversen,* E. K¨ all´ en, M. Tjernstr¨ om and H. K¨ ornich Department of Meteorology, Stockholm University, 106 91 Stockholm, Sweden ABSTRACT: The ERA-40 reanalysis from the European Centre for Medium-Range Weather Forecasts (ECMWF) is an atmospheric data-set based on a comprehensive collection of observations and a state-of-the-art system for assimilating data. High-quality data, encompassing more than four decades, have successfully been used in a wide range of applications, including climate change studies. However, even though the ERA-40 data-set benefits from improvements in the assimilation procedures since the release of earlier reanalyses, ERA-40 exhibits unrealistic behaviour as regards some atmospheric quantities, including the water budget and the Brewer–Dobson Circulation. In addition, the results presented here show significant mass-budget inconsistencies. Over inter-annual timescales (greater than one year), the vertically-averaged meridional mass transport is unrealistic and cannot be explained on the basis of naturally occurring physical processes. This mass inconsistency also yields spurious signals in meridional fluxes of other atmospheric quantities, such as energy. The total atmospheric mass content, on the other hand, shows a realistic evolution on daily timescales during the satellite era, from about 1979 onwards. Through this period, the variability of the total mass on intra-annual timescales (less than one year) and annual timescales is consistent with differences between evaporation and precipitation. Here it is demonstrated that unrealistic mass fluxes are present in ERA-40 because of inherent properties of the data assimilation process. In assimilating model forecasts, between analysis time-steps, systematic and unrealistic changes of the local surface-pressure field in the assimilating model are encountered. These local mass changes are associated with mass fluxes. During the assimilation procedure, observations reset the surface-pressure field, whereas the mass fluxes are not adjusted properly. This is because surface-pressure observations are plentiful and accurate, in contrast to wind observations. Consequently, the analysed mass fluxes show a spurious development, even though the mass field itself is well captured. A correction method can be applied in order to eliminate the spurious fluxes. For trend calculations it is demonstrated that this method yields more realistic results than those obtained from the original ERA-40 data. Copyright 2007 Royal Meteorological Society KEY WORDS assimilation; energy transport; mass budget; spurious trends Received 24 February 2006; Revised 24 November 2006; Accepted 1 December 2006 1. Introduction A reanalysis is a high-quality, global data-set encom- passing the evolution of a wide range of atmospheric quantities through several decades. Such data-sets have been extensively used for studies of atmospheric cir- culation patterns, as well as climate changes and their associated trends. To ensure consistency, a frozen assim- ilation procedure is used within a reanalysis framework. Nevertheless, differences between the observational sys- tems used at different times yield spurious low-frequency variabilities and trends in the data sets. In the present study it is found that the ERA-40 reanalysis from the European Centre for Medium-Range Weather Forecasts (ECMWF) has meridional mass fluxes that are too large to be explained by naturally-occurring processes. Sig- nals of major changes in the observational systems are * Correspondence to: R. G. Graversen, Department of Meteorology, Stockholm University, 106 91 Stockholm, Sweden. E-mail: [email protected] clearly found in these fluxes. It is suggested here that the assimilation process itself has also contributed to the erroneous part of the fluxes. The incorrect mass fluxes affect the transports of other atmospheric variables, such as energy and momentum. Hence climate-change stud- ies using these quantities based on the ERA-40 data set should be undertaken with great care. Cai and Kalnay (2005) discussed the question whether a reanalysis in general can be trusted with respect to trend estimates, even if the climatology of the model used in the assimilation process differs from that of the real world. They concluded that long-term trends can be captured well, even though the model’s climatology is ‘frozen’ (i.e. has no trends). This is true if, in the assimilation process, sufficient weight is given to the observations (i.e. they are accurate and densely distributed) and if the analysis time-step used in the model is short relative to the timescales of the trends in the observations. It is speculated here that the analysed surface-pressure field fulfils the criteria proposed by Cai and Kalnay (2005) Copyright 2007 Royal Meteorological Society

Welcome message from author
This document is posted to help you gain knowledge. Please leave a comment to let me know what you think about it! Share it to your friends and learn new things together.
Transcript
QUARTERLY JOURNAL OF THE ROYAL METEOROLOGICAL SOCIETYQ. J. R. Meteorol. Soc. 133: 673–680 (2007)Published online 22 March 2007 in Wiley InterScience(www.interscience.wiley.com) DOI: 10.1002/qj.35
Atmospheric mass-transport inconsistencies in the ERA-40reanalysis
R. G. Graversen,* E. Kallen, M. Tjernstrom and H. KornichDepartment of Meteorology, Stockholm University, 106 91 Stockholm, Sweden
ABSTRACT: The ERA-40 reanalysis from the European Centre for Medium-Range Weather Forecasts (ECMWF) is anatmospheric data-set based on a comprehensive collection of observations and a state-of-the-art system for assimilatingdata. High-quality data, encompassing more than four decades, have successfully been used in a wide range of applications,including climate change studies.
However, even though the ERA-40 data-set benefits from improvements in the assimilation procedures since the release ofearlier reanalyses, ERA-40 exhibits unrealistic behaviour as regards some atmospheric quantities, including the water budgetand the Brewer–Dobson Circulation. In addition, the results presented here show significant mass-budget inconsistencies.Over inter-annual timescales (greater than one year), the vertically-averaged meridional mass transport is unrealistic andcannot be explained on the basis of naturally occurring physical processes. This mass inconsistency also yields spurioussignals in meridional fluxes of other atmospheric quantities, such as energy. The total atmospheric mass content, on theother hand, shows a realistic evolution on daily timescales during the satellite era, from about 1979 onwards. Through thisperiod, the variability of the total mass on intra-annual timescales (less than one year) and annual timescales is consistentwith differences between evaporation and precipitation.
Here it is demonstrated that unrealistic mass fluxes are present in ERA-40 because of inherent properties of the dataassimilation process. In assimilating model forecasts, between analysis time-steps, systematic and unrealistic changes of thelocal surface-pressure field in the assimilating model are encountered. These local mass changes are associated with massfluxes. During the assimilation procedure, observations reset the surface-pressure field, whereas the mass fluxes are notadjusted properly. This is because surface-pressure observations are plentiful and accurate, in contrast to wind observations.Consequently, the analysed mass fluxes show a spurious development, even though the mass field itself is well captured.
A correction method can be applied in order to eliminate the spurious fluxes. For trend calculations it is demonstratedthat this method yields more realistic results than those obtained from the original ERA-40 data. Copyright 2007 RoyalMeteorological Society
KEY WORDS assimilation; energy transport; mass budget; spurious trends
Received 24 February 2006; Revised 24 November 2006; Accepted 1 December 2006
1. Introduction
A reanalysis is a high-quality, global data-set encom-passing the evolution of a wide range of atmosphericquantities through several decades. Such data-sets havebeen extensively used for studies of atmospheric cir-culation patterns, as well as climate changes and theirassociated trends. To ensure consistency, a frozen assim-ilation procedure is used within a reanalysis framework.Nevertheless, differences between the observational sys-tems used at different times yield spurious low-frequencyvariabilities and trends in the data sets. In the presentstudy it is found that the ERA-40 reanalysis from theEuropean Centre for Medium-Range Weather Forecasts(ECMWF) has meridional mass fluxes that are too largeto be explained by naturally-occurring processes. Sig-nals of major changes in the observational systems are
* Correspondence to: R. G. Graversen, Department of Meteorology,Stockholm University, 106 91 Stockholm, Sweden.E-mail: [email protected]
clearly found in these fluxes. It is suggested here thatthe assimilation process itself has also contributed to theerroneous part of the fluxes. The incorrect mass fluxesaffect the transports of other atmospheric variables, suchas energy and momentum. Hence climate-change stud-ies using these quantities based on the ERA-40 data setshould be undertaken with great care.
Cai and Kalnay (2005) discussed the question whethera reanalysis in general can be trusted with respect to trendestimates, even if the climatology of the model used in theassimilation process differs from that of the real world.They concluded that long-term trends can be capturedwell, even though the model’s climatology is ‘frozen’(i.e. has no trends). This is true if, in the assimilationprocess, sufficient weight is given to the observations(i.e. they are accurate and densely distributed) and ifthe analysis time-step used in the model is short relativeto the timescales of the trends in the observations. It isspeculated here that the analysed surface-pressure fieldfulfils the criteria proposed by Cai and Kalnay (2005)
Copyright 2007 Royal Meteorological Society
674 R. G. GRAVERSEN ET AL.
whereas the mass fluxes do not: the surface-pressureobservations are numerous and accurate, in contrast tothose of the winds.
ERA-40 has benefited from improvements that havetaken place since the releases of the NCEP reanalysisfrom the National Center for Atmospheric Research(NCAR) (Kalnay et al., 1996) and the ERA-15 reanalysisfrom the ECMWF. For instance, compared to ERA-15,ERA-40 includes improvements to the parametrization ofthe stable boundary layer, as well as to the description andparametrization of the orography (Uppala et al., 2005).These refinements have led to the 2-metre temperaturefield within the ERA-40 framework being more realisticthan that in the ERA-15 data. An improved approachusing screen-level temperature measurements in the dataassimilation process has also been implemented; thiscontributes to a better representation of the surface airtemperature in ERA-40 than in the NCEP reanalysis(Simmons et al., 2004). In addition, a T159 resolutionwas used within the ERA-40 framework, whereas T106and T62 were used for the ERA-15 and NCEP reanalyses,respectively. The ERA-40 model includes 60 verticalhybrid levels, from 10 m in the boundary layer to0.1 hPa in the mesosphere. Correspondingly, the ERA-15model comprises 31 levels, from 33 m to 10 hPa. Otherimprovements are documented by Uppala et al. (2005).
The total mass of the atmosphere is approximately5.148 × 1018 kg (Trenberth and Smith, 2005), andremains almost constant in time. The component thataccounts for the largest variability of the total atmo-spheric mass is water vapour. The summer atmospherecontains more water than the winter atmosphere, andthis difference is larger in the Northern Hemisphere,since this hemisphere has a larger proportion of continen-tal cover, and hence a larger annual temperature cycle,than its southern counterpart. Therefore the total atmo-spheric mass shows an annual cycle with a range of about2 × 1015 kg. Contributions to the total-mass variabilityfrom other sources and sinks, such as those associatedwith anthropogenic emissions and volcanic eruptions, arenegligible compared with evaporation and precipitation.
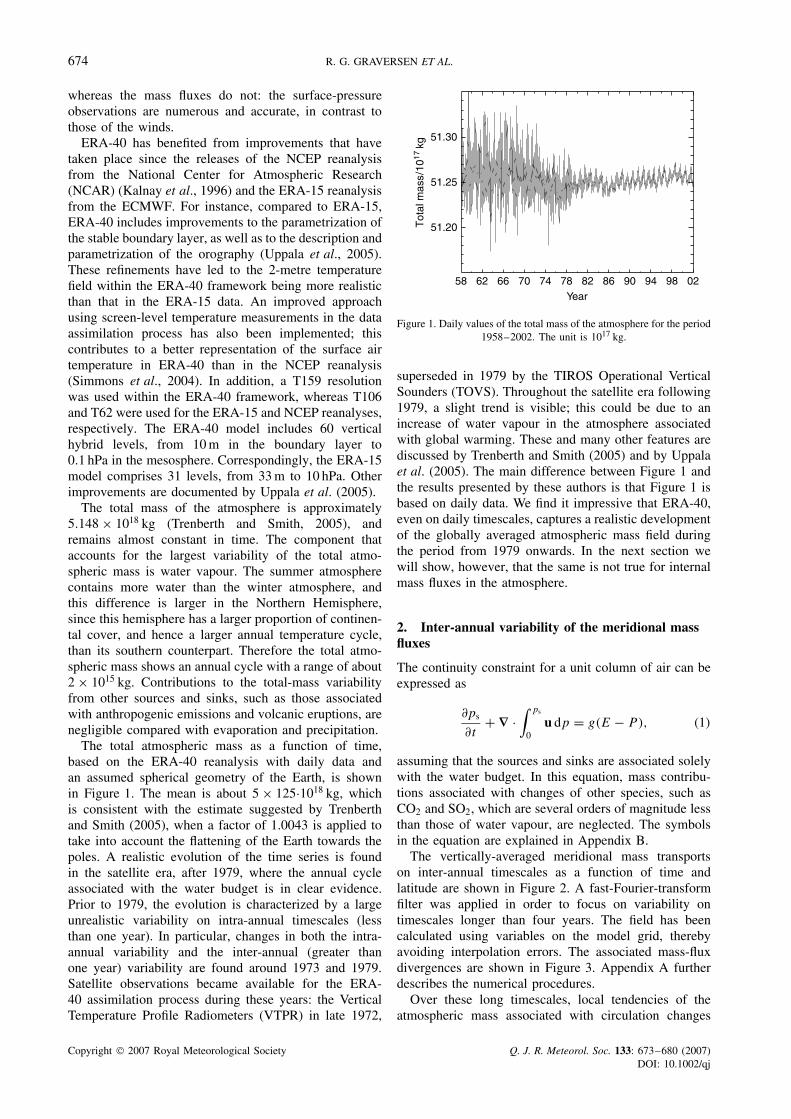
The total atmospheric mass as a function of time,based on the ERA-40 reanalysis with daily data andan assumed spherical geometry of the Earth, is shownin Figure 1. The mean is about 5 × 125·1018 kg, whichis consistent with the estimate suggested by Trenberthand Smith (2005), when a factor of 1.0043 is applied totake into account the flattening of the Earth towards thepoles. A realistic evolution of the time series is foundin the satellite era, after 1979, where the annual cycleassociated with the water budget is in clear evidence.Prior to 1979, the evolution is characterized by a largeunrealistic variability on intra-annual timescales (lessthan one year). In particular, changes in both the intra-annual variability and the inter-annual (greater thanone year) variability are found around 1973 and 1979.Satellite observations became available for the ERA-40 assimilation process during these years: the VerticalTemperature Profile Radiometers (VTPR) in late 1972,
58 62 66 70 74 78 82 86 90 94 0298
Year
51.20
51.25
51.30
Tot
al m
ass/
1017
kg
Figure 1. Daily values of the total mass of the atmosphere for the period1958–2002. The unit is 1017 kg.
superseded in 1979 by the TIROS Operational VerticalSounders (TOVS). Throughout the satellite era following1979, a slight trend is visible; this could be due to anincrease of water vapour in the atmosphere associatedwith global warming. These and many other features arediscussed by Trenberth and Smith (2005) and by Uppalaet al. (2005). The main difference between Figure 1 andthe results presented by these authors is that Figure 1 isbased on daily data. We find it impressive that ERA-40,even on daily timescales, captures a realistic developmentof the globally averaged atmospheric mass field duringthe period from 1979 onwards. In the next section wewill show, however, that the same is not true for internalmass fluxes in the atmosphere.
2. Inter-annual variability of the meridional massfluxes
The continuity constraint for a unit column of air can beexpressed as
∂ps
∂t+ ∇ ·
∫ ps
0u dp = g(E − P), (1)
assuming that the sources and sinks are associated solelywith the water budget. In this equation, mass contribu-tions associated with changes of other species, such asCO2 and SO2, which are several orders of magnitude lessthan those of water vapour, are neglected. The symbolsin the equation are explained in Appendix B.
The vertically-averaged meridional mass transportson inter-annual timescales as a function of time andlatitude are shown in Figure 2. A fast-Fourier-transformfilter was applied in order to focus on variability ontimescales longer than four years. The field has beencalculated using variables on the model grid, therebyavoiding interpolation errors. The associated mass-fluxdivergences are shown in Figure 3. Appendix A furtherdescribes the numerical procedures.
Over these long timescales, local tendencies of theatmospheric mass associated with circulation changes
Copyright 2007 Royal Meteorological Society Q. J. R. Meteorol. Soc. 133: 673–680 (2007)DOI: 10.1002/qj

ERA-40 MASS-TRANSPORT INCONSISTENCIES 675
58 62 66 70 74 78 82 86 90 94 0298
Year
−50
0
50
Latit
ude
0.15
−0.1
5 0.15
0.15
0.15
−0.1
5
−0.1
5
−0.15−0
.15−0.15
−0.15
Figure 2. Vertically-averaged meridional mass fluxes as a function oftime and latitude. The fluxes are computed from daily data from whichvariability at timescales below four years has been removed using afast-Fourier-transform filter. Solid and dotted contours indicate positiveand negative values, respectively. The unit is 1015 kg day−1 and the
contour interval is 0.3.
58 62 66 70 74 78 82 86 90 94 98 02
Year
−50
0
50
Latit
ude
0.15 0.15
0.15
0.15
0.15
−0.15
−0.15
−0.15
−0.15
Figure 3. Divergences (meridional gradients) of the fluxes in Figure 2.A running-mean filter spanning 5° of latitude has been applied.Solid and dotted contours indicate positive and negative values,respectively. The unit is 109 kg m−1 day−1 and the contour intervalis 0.3. (Positive contours indicate divergence and negative contours
indicate convergence.)
should be negligible, and water vapour is by far themost important atmospheric component that is system-atically transported across latitudes (i.e. the second termon the left-hand side of Equation (1) should equal theright-hand side). Evaporation dominates over precipi-tation in the subtropics, whereas the opposite is truefor the equatorial regions and in middle and high lat-itudes (Figure 4(c)); this should be clearly reflected inthe mass-flux divergences (Figure 3). The correspondingmeridional mass transports (Figure 2) are expected to beassociated with water-vapour fluxes between these sourceand sink regions. It should be noted that the water cycleis not included in the continuity equation of the assim-ilating model in ERA-40. (The E − P term is equal tozero in Equation (1).) Given enough observational infor-mation for the assimilation procedure, however, the watercycle should be reflected in the analysed mass fluxes.
Clearly, the patterns in Figures 2 and 3 are not dom-inated by the water budget, but show instead an unre-alistic evolution. For instance, for most of the satelliteera, following 1979, northward fluxes are prevalent inthe Northern Hemisphere subtropics, whereas southwardfluxes dominate in the Southern Hemisphere subtropicsand in the mid-latitudes of the Northern Hemisphere.These fluxes are associated with a divergence at around10 °N and a convergence at around 35 °N. If not balancedby long-term tendencies of the mass field, these diver-gence patterns must be a result of sources and sinks.However, the pattern with sinks at around 35 °N andsources at around 10 °N is almost opposite to what isexpected from the water budget. In addition, the sourcesand sinks associated with the water budget are muchsmaller than those suggested by Figure 3: the waterbudget is associated with vertically-averaged zonal-meanfluxes of the order of 1013 kg day−1 (e.g. Peixoto andOort, 1983), which is an order of magnitude smaller thanthose suggested by Figure 2. Furthermore, accumulated6-hour forecasts of E − P from ERA-40 (Figure 4(c))indicate that the E − P field cannot explain the diver-gence pattern in Figure 3.
Another example of the unrealistic inter-annual devel-opment of the mass-flux time series in Figure 2 is evi-dent in the pre-satellite era (prior to 1973): a zonal-mean southward flux of mass is encountered at prac-tically all latitudes except those south of 60 °S. Forinstance, the time mean of the flux across 30 °S is around−0.5 × 10¹⁵ kg day−1. Had this been real, the area northof 30 °S would have been totally depleted of atmosphericmass during the period 1958–1973.
The inter-annual behaviour of the mass fluxes inFigure 2 provides a hint about the incorporation ofmeasurements from new observational systems in theassimilation process: major jumps are found in thetime series around 1973 and 1979, coinciding with thedeployment of new satellite systems.
The mass-divergence pattern in ERA-40 presented herecan also be estimated from the surface-pressure ten-dencies (using Equation (1), and neglecting the E − P
terms). This derivation provides an independent estimateof the mass divergence. First-guess surface-pressure ten-dencies have not been archived in the ERA-40 data-set. However, forecast surface-pressure tendencies canbe derived from surface pressure in forecasts and inthe analysis (where the analysis is the initial state ofthe forecasts – see Equation (2)). These surface-pressuretendencies are valid at 3-hour-forecast time and so arenot identical to those from the analysis state. Figure 4(a)shows zonal integrals of the mass-tendency term for the3-hour forecast. The mass divergence calculated this wayshows roughly the same pattern as in Figure 3, althoughthe magnitudes are generally smaller and some localextrema, such as the maxima at 50 °S around 1982 and1990 in Figure 3, are not recognized. However, the pat-tern in Figure 4(a) supports the major message fromthe present study that there are inconsistencies in themass budget in ERA-40. The systematic (and unphysical)
Copyright 2007 Royal Meteorological Society Q. J. R. Meteorol. Soc. 133: 673–680 (2007)DOI: 10.1002/qj

676 R. G. GRAVERSEN ET AL.
58 62 66 70 74 78 82 86 90 94 98 02Year
58 62 66 70 74 78 82 86 90 94 98 02Year
58 62 66 70 74 78 82 86 90 94 98 02Year
−50
0
50
Latit
ude
−50
0
50
Latit
ude
−50
0
50
Latit
ude
(a)
(b)
(c)
0.3
0.1
−0.1
0.3
0.1
0.1
−0.1
0.30.1
−0.1
−0.1 −0.1
−0.1
−0.1
0.30.1
0.3 0.3 0.3
0.3−0.1
−0.1
−0.1
−0.1−0.1
0.1
0.1
0.1
0.1
0.1
−0.1
0.05
0.05
0.05
0.05
0.05
0.05−0.05
−0.05
−0.05−0.15−0.05
Figure 4. (a) Mass tendencies in the 3-hour forecast multiplied by −1. (b) The mass difference between the analysis and the model first guess.(c) Evaporation minus precipitation from the accumulated 6-hour forecast. All fields are zonal integrals and functions of time and latitude.They are derived from daily data, and variability faster than four years has been removed using a fast-Fourier-transform filter. A running-meanfilter spanning 5° of latitude has been applied. Solid and dotted contours indicate positive and negative values, respectively. The unit is
109 kg m−1 day−1; the contour interval is 0.2 for (a) and (b) and 0.1 for (c).
tendencies of the surface pressure (Figure 4(a)) suggestthat the model climatology differs from that of the realworld.
It is not surprising that there are differences betweenthe two estimates (Figures 3 and 4(a)). First, the twoestimates are not solely determined by the model, but
are affected by observations in the assimilation process.Even though the model first guess fulfils the requirementof mass continuity, the influence of observations on theanalysis can disturb this balance. Secondly, the estimatein Figure 4(a) is not valid at the time of the analysis, but3 hours later in the model world.
Copyright 2007 Royal Meteorological Society Q. J. R. Meteorol. Soc. 133: 673–680 (2007)DOI: 10.1002/qj

ERA-40 MASS-TRANSPORT INCONSISTENCIES 677
The incorrect mass fluxes in the ERA-40 data-set areassociated with spurious winds, which, in turn, accountfor erroneous advection of other atmospheric quanti-ties, such as energy and momentum. These fluxes – and
especially their trends – should therefore be handled withcare. There are methods to mass-correct such fluxes,and such an approach has been proposed by Trenberth(1991). Figures 5(a) and 5(b) show the monthly-mean
58 62 66 70 74 78 82 86 90 94 98 02
Year
58 62 66 70 74 78 82 86 90 94 98 02Year
58 62 66 70 74 78 82 86 90 94 98 02Year
58 62 66 70 74 78 82 86 90 94 98 02Year
Mas
s tr
ansp
ort/1
010 k
g s−1
2
1
0
−1
−2
Mas
s tr
ansp
ort/1
010 k
g s−1
2
1
0
−1
−2
Ene
rgy
tran
spor
t/1015
W
8
6
4
2
0
−2
−4
Energ
y tr
ansp
ort
/10
15 W
8
6
4
2
0
−2
−4
(a)
(b)
(c)
(d)
Figure 5. (a) Mass flux across 60 °N as it appears in the ERA-40 reanalysis (the unit is 1010 kg s−1). (b) Mass flux as in (a), but after a masscorrection has been applied. (c) Atmospheric total energy transport across 60 °N (in petawatts) as it appears in the ERA-40 reanalysis. (d) Energytransport as in (c), but after a mass correction has been applied. All quantities are zonal and vertical integrals based on monthly mean data from
the period 1958–2001.
Copyright 2007 Royal Meteorological Society Q. J. R. Meteorol. Soc. 133: 673–680 (2007)DOI: 10.1002/qj

678 R. G. GRAVERSEN ET AL.
development of the mass flux across 60 °N as it appearsin the ERA-40 data-set and when a mass correction fol-lowing Trenberth (1991) has been applied. The correctionseems to dampen the variability over all timescales. Inparticular, the variability on the inter-annual timescale,including an overall positive trend persisting from thelate 1970s, is removed. Since evaporation and precipita-tion remain approximately constant in the long run, thecorrected mass flux reflects the fact that the mean pressureon either side of 60 °N is also constant on inter-annualtimescales. The Arctic-Oscillation high-index state whichprevailed through the first half of the 1990s is actuallyassociated with an unusually small total mass contentof the atmosphere north of 60 °N. However, the corre-sponding mass fluxes across 60 °N are of the order of107 kg s−1, which is several orders of magnitude lessthan the variability on intra-annual timescales shown byFigure 5(b).
Corresponding uncorrected and corrected fluxes oftotal energy are shown in Figures 5(c) and 5(d), respec-tively. A definition of the total energy, and a descriptionof the correction method, are given in (Graversen, 2006).The inter-annual development of the energy transportacross 60 °N as it appears in ERA-40 shows a clear signalof the spurious inter-annual mass fluxes, which could leadto erroneous conclusions concerning trends, for example,if the mass inconsistency is not taken into account.
Why are the mass fluxes so wrong, when the totalatmospheric mass shows such a realistic development,at least since 1979? We speculate that the unrealisticfluxes could be caused by discrepancies between theobservations (the real climate) and the model climatol-ogy. Examinations of differences between analysis andthe model first guess support this idea: Figure 4(b) showszonal integrals of surface pressure for such differences;an appropriate scaling has been applied in order to obtaina unit equal to that used for Figures 3 and 4(a) and(c). Considerable systematic differences are encounteredbetween the analysis and the first guess. The pattern canbe interpreted as the amount of mass that is artificiallyput into the atmosphere as a consequence of the assimi-lation process. Figures 4(a) and 4(b) are almost identical:this simply indicates that the systematic modifications ofthe mass field performed by the model since the previousanalysis time-step are reset by the assimilation procedureat the next analysis time-step. The observations ensurethat the analysed pressure field is almost constant in time:this must be true over inter-annual timescales.
Figure 6 should clarify these thoughts concerning theassimilation procedure. In this example it is assumed thatthe analysed surface pressure in a certain area is largerthan that of the model’s surface-pressure climatology.As a result, the model will produce a first guess forthe next assimilation time-step that is too low, since ittends towards the model climatology. The lowering of thepressure by the model will be associated with mass fluxesout of the area. The observations will result in an analysedestimate of the surface pressure that is close to the higher,observed value. The analysed mass fluxes, on the other
n
Pre
ssur
e
n + 1 n + 2
time
n + 3
Model climatology
observations
analyses
first guesses
Figure 6. A schematic illustration of the assimilation process for surfacepressure in a given area, for a sequence of analysis time-steps. Theassumption is that the surface-pressure observations systematicallydeviate from the model climatology. Stars, diamonds and squaresindicate observations, analyses, and model first guesses, respectively.
The dotted line represents the model climatology.
hand, would be close to those derived from the model.Wind observations could contribute towards a realisticadjustment of the fluxes; but wind observations are lessaccurate and less numerous than observations of surfacepressure, so they affect the analysis less than the surface-pressure observations. In particular, the zonally-averagedmeridional wind is essentially unobserved; in addition,it is purely ageostrophic. Given the inaccuracy of thewind observations, this component of the wind field hasa large relative error: typically the wind-observation erroris around 2 m s−1. Given a mean wind speed of around20 m s−1 and the fact that the ageostrophic component isless than 10% of the total wind speed, the ageostrophic-wind error is therefore around 100%. Thus the reanalysismay show a realistic development of the pressure fieldeven though unrealistically large mass fluxes are present.
It should also be noted that in present-days models,the numerical schemes for the continuity equation inthe dynamical core are not locally mass-conservative,since such schemes have been found computationallytoo expensive. However, less expensive schemes haverecently been proposed, for example by Lin (2004) andLauritzen et al. (2006).
3. Conclusions
The present study demonstrates that even though theERA-40 global atmospheric total mass shows a realisticdevelopment, at least since 1979, spurious mass fluxesadd up to considerable errors when zonally and verticallyintegrated quantities are considered. If they are notcorrected for, these errors yield unrealistic inter-annualdevelopments of fluxes of atmospheric quantities such asenergy.
In the model-integration part of the assimilation pro-cess, an unrealistic mass-divergence pattern develops(Figure 4(a)); this is an order of magnitude larger than thedifference between evaporation and precipitation (Figure4(c)). In the analysis step, the first-guess mass divergenceis almost cancelled (compare Figures 4(a) and 4(b)), sothat the total mass field in the reanalysis has small and
Copyright 2007 Royal Meteorological Society Q. J. R. Meteorol. Soc. 133: 673–680 (2007)DOI: 10.1002/qj

ERA-40 MASS-TRANSPORT INCONSISTENCIES 679
realistic inter-annual variability (Figure 1). The unreal-istic mass tendencies in the model are associated withspurious meridional mass fluxes that are not corrected forduring the analysis procedure. This is probably becausenot much observational information about the meridionalwind field is available.
The model’s mass tendencies are presumably a resultof the difference between the climatology of the modeland the real world. In climate model simulations, mass-flux errors similar to those presented here are not tobe expected, since in such simulations the models areleft with their own climatology and not forced byobservations in an assimilation process. However, whenmass-flux correction procedures are applied, or numericalschemes including mass-fixers (Rasch et al., 1995) areused, it is conceivable that erroneous fluxes as discussedhere could be found.
Cai and Kalnay (2005) have concluded that the inter-annual evolution of the real climate can be capturedwell by a reanalysis if short analysis time-steps areused and if enough weight is given to observations inthe assimilating process. This holds true even thoughthe model climatology differs from the real climate’sinter-annual evolution. We find here that for importantvariables such as the meridional wind field, these criteriaare not met; this partly explains the unrealistic inter-annual development of meridional mass fluxes and theassociated fluxes of energy, momentum, humidity, ozone,etc. Cai and Kalnay (2005) did not address anotherdifficult issue that arises when using reanalysis data forclimate-change research: spurious trends are encounteredin the reanalysis data as a consequence of changes in theobservational systems.
Acknowledgement
The authors would like to thank Professor Peter Lundbergfor very useful discussions. Thanks are also given to twoanonymous reviewers, who have been a great help inimproving the paper. The ERA-40 data is kindly providedby ECMWF from their data server.
A. Appendix: Numerical methods
Mass transports are calculated within the ERA-40 frame-work from variables at model levels using the followingrelations:
EMFk =60∑i=1
ui,k
pi+ 1
2 ,k − pi− 1
2 ,k
g,
NMFk =60∑i=1
vi,k
pi+ 1
2 ,k − pi− 1
2 ,k
g,
where i and k are indices for model levels and horizontalspatial points, respectively. EMF is the eastward andNMF the northward mass flux. Pressure values arerepresented at model half-levels.
Figure 2 presents zonal integrals of the northward massflux, which are zonal means multiplied by2πr cos(φj ) (60 × 60 × 24), where j is the latitudeindex. The product in the last parentheses changes theunit from kg s−1 to kg day−1.
The divergence field in Figure 3 is estimated fromaverages of adjacent points:
Div [NMFj ] = [NMFj+1] + [NMFj−1]
�y,
where [ ] indicates the zonal integral and �y is thedistance between the latitudes φj+1 and φj−1.
The 3-hour mass tendencies (∂M/∂t)3 in Figure 4(a)are determined from analysed and forecast values of thelogarithm of surface pressure using the formula
(∂M
∂t
)3
= (ps)3(log ps)6 − (log ps)0
g�t, (2)
where the subscripts 0, 3 and 6 indicate analysis, 3-hourforecast and 6-hour forecast, respectively, �t equals 6hours, and the quantities are functions of latitude andlongitude. Figure 4(a) shows zonal integrals of (∂M/∂t)3
multiplied by −1.The E − P field in Figure 4(c) is estimated from accu-
mulated 6-hour forecasts from four reanalysis products:large-scale precipitation, large-scale snowfall, convectiveprecipitation, and evaporation. We have neglected twoother products which are components of the E − P field:convective snowfall and snow evaporation. These quan-tities are at least one order of magnitude less than thefirst four.
The pattern in Figure 4(b) is derived from analysisminus first guess of surface pressure. Figure 4(b) showszonal means multiplied by 2πr cos(φj )g
−1 × 4. Thefactor 4 changes the unit from kg (6 hour)−1 m−1 to kgday−1 m−1, taking into account that the analysis time-stepis 6 hours.
B. Appendix: List of symbols
E rate of evaporationg gravityp pressureps surface pressureP rate of precipitationr Earth’s radiust timeu zonal windv meridional windu (u, v)
φ latitude
∇(
∂∂x
, ∂∂y
)
References
Cai M, Kalnay E. 2005. Can reanalysis have anthropogenic climatetrends without model forcing. J. Climate 18: 1844–1849.
Copyright 2007 Royal Meteorological Society Q. J. R. Meteorol. Soc. 133: 673–680 (2007)DOI: 10.1002/qj
680 R. G. GRAVERSEN ET AL.
Graversen RG. 2006. Do changes in the mid-latitude circulation haveany impact on the arctic surface air temperature trend? J. Climate19: 5422–5438.
Kalnay E, Kanamitsu M, Kistler R, Collins W, Deaven D, Gandin L,Iredell M, Saha S, White G, Woollen J, Zhu Y, Chelliah M,Ebisuzaki W, Higgins W, Janowiak J, Mo KC, Ropelewski C,Wang J, Leetmaa A, Reynolds R, Jenne R, Joseph D. 1996. TheNCEP/NCAR 40-year reanalysis project. Bull. Am. Meteorol. Soc.77: 437–471.
Lauritzen PH, Kaas E, Machenhauer B. 2006. A mass-conservativesemi-implicit semi-lagrangian limited area shallow water model onthe sphere. Mon. Weather Rev. 134: 1205–1221.
Lin S-J. 2004. A “vertically lagrangian” finite-volume dynamical corefor global models. Mon. Weather Rev. 132: 2293–2307.
Peixoto JP, Oort AH. 1983. The atmospheric branch of thehydrological cycle and climate. In: Street-Perrott A, Beran M,Ratcliffe R (eds.), Variations of the Global Water Budget (Reidel),5–65.
Rasch PJ, Boville BA, Brasseur GP. 1995. A three-dimensionalgeneral circulation model with coupled chemistry for the middleatmosphere. J. Geophys. Res. 100: 9041–9071.
Simmons AJ, Jones PD, Bechtold V da C, Beljaars ACM, KallbergPW, Saarinen S, Uppsala SM, Viterbo P, Wedi N. 2004. Comparisonof trends and low-frequency variability in CRU, ERA-40, andNCEP/NCAR analyses of surface air temperature. J. Geophys. Res.109: D24115, DOI: 10.1029/2004JD005306.
Trenberth KE. 1991. Climate diagnostics from global analysis:conservation of mass in ECMWF analyses. J. Climate 4: 707–721.
Trenberth KE, Smith L. 2005. The mass of the atmosphere: a constrainton global analysis. J. Climate 18: 864–875.
Uppala SM, Kallberg PW, Simmons AJ, Andrae U, Bechtold Vda C, Florino M, Gibson JK, Haseler J, Hernandez A, Kelly GA,Li X, Onogi K, Saarinen S, Sokka N, Allan RP, Andersson E,Arpe K, Balmaseda MA, Beljaars ACM, van de Berg L, Bid-lot J, Bormann N, Caires S, Chevallier F, Dethof A, Dragosavac M,Fisher M, Fuentes M, Hagemann S, Holm E, Hoskins BJ, Isak-sen L, Janssen PAEM, Jenne R, McNally AP, Mahfouf J-F, Mor-crette J-J, Rayner NA, Saunders RW, Simon P, Sterl A, Tren-berth KE, Untch A, Vasiljevic D, Viterbo P, Woolen J. 2005. TheERA-40 re-analysis. Q. J. R. Meteorol. Soc. 131: 2961–3012.
Copyright 2007 Royal Meteorological Society Q. J. R. Meteorol. Soc. 133: 673–680 (2007)DOI: 10.1002/qj
Related Documents