Atmospheric dry deposition to leaf surfaces at a rural site of India Abha Gupta, Ranjit Kumar, K. Maharaj Kumari, S.S. Srivastava * Department of Chemistry, Faculty of Science, Dayalbagh Educational Institute, Dayalbagh, Agra 282 005, India Received 4 March 2003; received in revised form 18 August 2003; accepted 27 August 2003 Importance of this Paper: Dry deposition of atmospheric particle plays significant role in transfer of pollutants from the atmosphere to the earth surface. Vegetation is an important sink as it provides larger surface area. No such study on dry deposition of major ions (F , Cl , NO 3 , SO 2 4 , Na þ ,K þ , Ca 2þ , Mg 2þ and NH þ 4 ) on natural surfaces has been reported from this region. This study will help in understanding the processes of dry deposition and it will provide a data set, which will be helpful in making atmospheric budget, deriving critical loads and in development of model. Abstract Dry deposition flux of major ions (Na þ ,K þ , Ca 2þ , Mg 2þ , NH þ 4 ,F , Cl , NO 3 and SO 2 4 ) to natural surfaces [guava (Psidium guyava) and peepal (Ficus religiosa) leaves] are determined at Rampur, a rural site of semi-arid region of India. Dry deposition flux is the highest for Ca 2þ on guava leaves and for NH þ 4 on peepal leaves. Overall dry deposition flux is higher on guava leaves than of peepal leaves. The variation in deposition flux may be due to surface characteristics (surface roughness) and arrangement of leaves. Peepal leaves are arranged along the axis of the stem, whereas guava leaves are at right angles to the stem. The deposition flux of cations contributes 66% and 76% of dry deposition of all major ions on guava and peepal leaves, respectively as soil is major contributor towards dry deposition flux in tropical regions. ANOVA revealed no significant seasonal difference in deposition, although there is a trend for higher in winter. Deposition velocities of NH þ 4 , NO 3 and SO 2 4 are greater on guava leaves than peepal leaves, which can be attributed to the rougher surface of the guava leaf. Ó 2003 Elsevier Ltd. All rights reserved. Keywords: Dry deposition flux; Deposition velocities; Leaf surfaces; Major ions 1. Introduction Atmospheric deposition is an important mechanism controlling the fate of toxic airborne pollutants and their transfer from the atmosphere to the natural surfaces. Atmospheric deposition of particles to ecosystem takes place via both wet and dry processes. Wet deposition is removal by precipitation scavenging and, to a lesser extent, impaction of fog or cloud droplets on vegetation; and dry deposition includes the uptake of gases at the surface and the settling and impaction of particles. For both gases and particles the dry deposition pro- cess comprises two stages, atmospheric transport and uptake at the surface. It occurs by several processes, such as Brownian motion of particles, sedimentation and impaction (Morselli et al., 1999; Hui-Jung Yun et al., 2002). Deposition of particles containing SO 2 4 , NO 3 and NH þ 4 contribute to potent acidification and eutrophica- tion of ecosystems. Base cation deposition can be important for nutrient cycling in ecosystems and it can also neutralize acid inputs (Ruijgrok et al., 1995). De- spite the importance of this topic dry deposition of * Corresponding author. Tel.: +91-562-212-545; fax: +91- 562-212-226. E-mail address: [email protected] (S.S. Srivastava). 0045-6535/$ - see front matter Ó 2003 Elsevier Ltd. All rights reserved. doi:10.1016/j.chemosphere.2003.08.035 Chemosphere 55 (2004) 1097–1107 www.elsevier.com/locate/chemosphere

Welcome message from author
This document is posted to help you gain knowledge. Please leave a comment to let me know what you think about it! Share it to your friends and learn new things together.
Transcript
Chemosphere 55 (2004) 1097–1107
www.elsevier.com/locate/chemosphere
Atmospheric dry deposition to leaf surfaces ata rural site of India
Abha Gupta, Ranjit Kumar, K. Maharaj Kumari, S.S. Srivastava *
Department of Chemistry, Faculty of Science, Dayalbagh Educational Institute, Dayalbagh, Agra 282 005, India
Received 4 March 2003; received in revised form 18 August 2003; accepted 27 August 2003
Importance of this Paper: Dry deposition of atmospheric particle plays significant role in transfer of pollutants from the
atmosphere to the earth surface. Vegetation is an important sink as it provides larger surface area. No such study on dry
deposition of major ions (F�, Cl�, NO�3 , SO
2�4 , Na
þ, Kþ, Ca2þ, Mg2þ and NHþ4 ) on natural surfaces has been reported
from this region. This study will help in understanding the processes of dry deposition and it will provide a data set, which
will be helpful in making atmospheric budget, deriving critical loads and in development of model.
Abstract
Dry deposition flux of major ions (Naþ, Kþ, Ca2þ, Mg2þ, NHþ4 , F
�, Cl�, NO�3 and SO2�
4 ) to natural surfaces [guava
(Psidium guyava) and peepal (Ficus religiosa) leaves] are determined at Rampur, a rural site of semi-arid region of India.
Dry deposition flux is the highest for Ca2þ on guava leaves and for NHþ4 on peepal leaves. Overall dry deposition flux is
higher on guava leaves than of peepal leaves. The variation in deposition flux may be due to surface characteristics
(surface roughness) and arrangement of leaves. Peepal leaves are arranged along the axis of the stem, whereas guava
leaves are at right angles to the stem. The deposition flux of cations contributes 66% and 76% of dry deposition of all
major ions on guava and peepal leaves, respectively as soil is major contributor towards dry deposition flux in tropical
regions. ANOVA revealed no significant seasonal difference in deposition, although there is a trend for higher in winter.
Deposition velocities of NHþ4 , NO�
3 and SO2�4 are greater on guava leaves than peepal leaves, which can be attributed to
the rougher surface of the guava leaf.
� 2003 Elsevier Ltd. All rights reserved.
Keywords: Dry deposition flux; Deposition velocities; Leaf surfaces; Major ions
1. Introduction
Atmospheric deposition is an important mechanism
controlling the fate of toxic airborne pollutants and their
transfer from the atmosphere to the natural surfaces.
Atmospheric deposition of particles to ecosystem takes
place via both wet and dry processes. Wet deposition is
removal by precipitation scavenging and, to a lesser
extent, impaction of fog or cloud droplets on vegetation;
*Corresponding author. Tel.: +91-562-212-545; fax: +91-
562-212-226.
E-mail address: [email protected] (S.S. Srivastava).
0045-6535/$ - see front matter � 2003 Elsevier Ltd. All rights reserv
doi:10.1016/j.chemosphere.2003.08.035
and dry deposition includes the uptake of gases at
the surface and the settling and impaction of particles.
For both gases and particles the dry deposition pro-
cess comprises two stages, atmospheric transport and
uptake at the surface. It occurs by several processes,
such as Brownian motion of particles, sedimentation
and impaction (Morselli et al., 1999; Hui-Jung Yun
et al., 2002).
Deposition of particles containing SO2�4 , NO�
3 and
NHþ4 contribute to potent acidification and eutrophica-
tion of ecosystems. Base cation deposition can be
important for nutrient cycling in ecosystems and it can
also neutralize acid inputs (Ruijgrok et al., 1995). De-
spite the importance of this topic dry deposition of
ed.
1098 A. Gupta et al. / Chemosphere 55 (2004) 1097–1107
particles has received far less attention. Methods used to
assess or predict rates of dry deposition are extremely
diverse, largely because the types of contaminants and
surfaces vary greatly. However, dry deposition fluxes are
difficult to measure directly and instead are often esti-
mated as the product of dry deposition velocity and
corresponding pollutant concentration.
Several techniques of measuring deposited material
have been reported in the literature. Attempts have been
made to estimate dry deposition by leaf washing tech-
nique, micrometerological method, throughfall method,
and watershed mass balance method and inferential and
surface accumulation methods. Surrogate surfaces allow
better control over exposure times, sample extraction
and other parameters than can be provided by natural
vegetation. As a result a variety of surrogate designs
have been reported in the literature. Examples include
dustfall buckets, filter paper, petri dishes and Teflon
plates (Krey and Toonkel, 1974; Huntzicker et al., 1975;
Volchok and Graveson, 1975; Servant, 1976; Davidson
and Friedlander, 1978; Pierson and Cawse, 1979; Lind-
berg et al., 1982).
Surrogate surfaces provide accurate measurements
for rapidly falling particles (Hales et al., 1987) and also
gain credibility as particle size increases (Davidson et al.,
1985) but the performance of these devices to measure
deposition of small particles, like SO2�4 , which lies in the
submicron range (Altshuller, 1983) is often questioned
(Dasch, 1983; Davidson et al., 1985). One of the major
drawbacks of surrogate surfaces is that they are unable
to realistically simulate the processes of gas exchange
between the atmosphere and biological systems (Hicks
et al., 1980). However, theoretical and practical difficul-
ties have limited the number of direct measurement of
atmospheric dry deposition on natural surfaces, and only
a few measurements have been carried out on natural
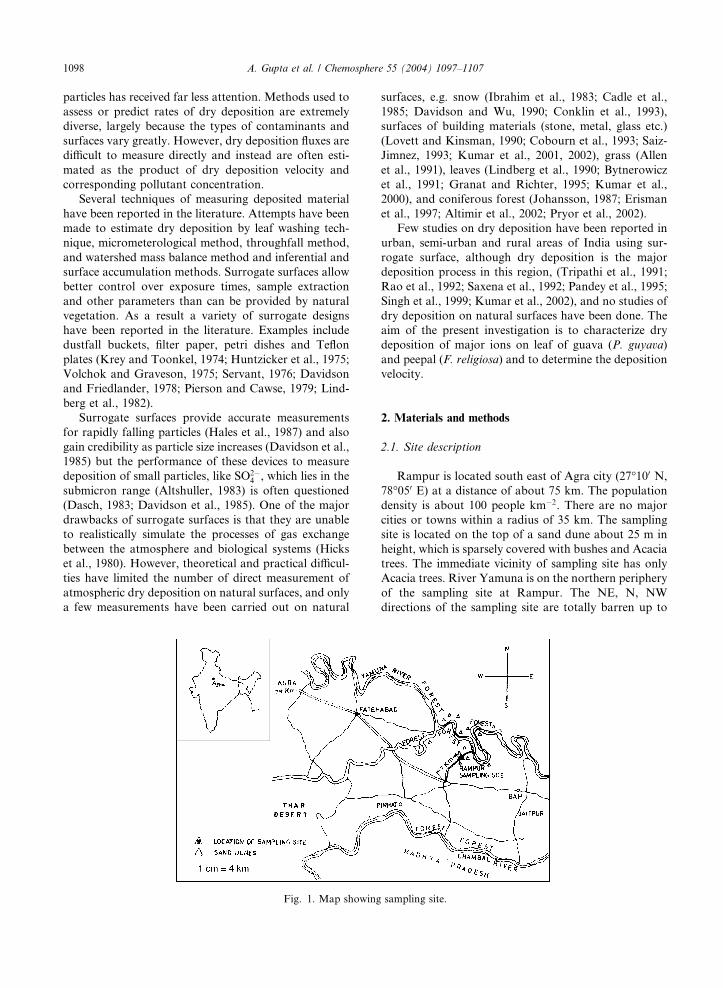
Fig. 1. Map showing
surfaces, e.g. snow (Ibrahim et al., 1983; Cadle et al.,
1985; Davidson and Wu, 1990; Conklin et al., 1993),
surfaces of building materials (stone, metal, glass etc.)
(Lovett and Kinsman, 1990; Cobourn et al., 1993; Saiz-
Jimnez, 1993; Kumar et al., 2001, 2002), grass (Allen
et al., 1991), leaves (Lindberg et al., 1990; Bytnerowicz
et al., 1991; Granat and Richter, 1995; Kumar et al.,
2000), and coniferous forest (Johansson, 1987; Erisman
et al., 1997; Altimir et al., 2002; Pryor et al., 2002).
Few studies on dry deposition have been reported in
urban, semi-urban and rural areas of India using sur-
rogate surface, although dry deposition is the major
deposition process in this region, (Tripathi et al., 1991;
Rao et al., 1992; Saxena et al., 1992; Pandey et al., 1995;
Singh et al., 1999; Kumar et al., 2002), and no studies of
dry deposition on natural surfaces have been done. The
aim of the present investigation is to characterize dry
deposition of major ions on leaf of guava (P. guyava)
and peepal (F. religiosa) and to determine the deposition
velocity.
2. Materials and methods
2.1. Site description
Rampur is located south east of Agra city (27�100 N,
78�050 E) at a distance of about 75 km. The population
density is about 100 people km�2. There are no major
cities or towns within a radius of 35 km. The sampling
site is located on the top of a sand dune about 25 m in
height, which is sparsely covered with bushes and Acacia
trees. The immediate vicinity of sampling site has only
Acacia trees. River Yamuna is on the northern periphery
of the sampling site at Rampur. The NE, N, NW
directions of the sampling site are totally barren up to
sampling site.
Table
1
Data
ofmeteorologicalparametersduringthestudyperiod
Months
Tem
perature
(�C)
Relativehumidity(%
)Solarradiation(W
/m2)
Windspeed(kmh�1)
Wind
direction
Minim
um
Maxim
um
Average
Minim
um
Maxim
um
Average
Minim
um
Maxim
um
Minim
um
Maxim
um
Average
January
7.9
18.1
13.0
68
96
82
1.2
7.5
10
15
12.5
NW,N
February
10.1
22.6
16.3
49
90
69.5
1.5
8.3
10
15
12.5
W,NW
March
15.4
29.4
22.4
39
82
60.5
1.7
9.0
15
20
17.5
W
April
22.5
36.8
29.6
21
58
39.5
1.8
9.1
10
28
19.0
NW
May
28.6
38.5
33.5
29
59
44
2.0
9.7
22
30
26.0
W,NW
June
27.9
34.3
31.1
56
82
69
1.9
9.8
20
30
25.0
NW
July
26.9
31.8
29.4
71
92
81.5
1.6
7.5
15
25
20.0
E,SW
August
26.7
32.4
29.5
66
90
78
1.3
5.3
10
15
12.5
W
September
25.1
33.5
29.3
50
85
67.5
1.4
6.6
15
20
17.5
W
October
20.6
31.7
26.1
44
84
64
1.5
8.4
710
8.5
NW
Novem
ber
14.0
25.8
19.9
47
85
66
1.6
7.0
10
10
10
N,NW
Decem
ber
8.8
20.5
14.7
59
91
75
1.2
6.2
310
6.5
NE,N
A. Gupta et al. / Chemosphere 55 (2004) 1097–1107 1099
15 km distance and agricultural fields are present at a
distance of 2 km in the S, SE and SW directions (Fig. 1).
Table 1 shows the monthly meteorological conditions
during the study period at Rampur.
2.2. Sample collection
2.2.1. Dry deposition collection
Dry deposition samples (n ¼ 85) were collected from
eight leaves of guava (P. guyava) and four leaves of
peepal (F. religiosa). The leaves while attached to living
tree were marked and washed with deionised water using
a sprayer and air dried prior to exposure. The dry
deposition samples were collected after 72 h exposure.
The surface washing method was employed to collect the
dry deposition (Davidson and Wu, 1990), the leaf sur-
face was washed off into polyethylene bottle at the site
and the volume was made up to 100 ml with deionised
water. The collected samples were centrifuged and
supernatant was divided into two parts, one part was
treated with chloroform and preserved for anions and
ammonium analysis while other part was preserved with
1% nitric acid (v/v) for the cations analysis. All the
samples were stored in the refrigerator till analysis.
2.2.2. Aerosol and gas phase collection
Aerosol samples were collected using SKC, PCXR8
battery operated universal pump with programmable
start/stop timer while gaseous SO2, NH3 and HNO3
samples were collected using SKC Anasorbent sampling
tubes, details of which can be found elsewhere (Gupta
et al., 2003). The size of collected aerosol particles was
0.95 lm.
2.3. Chemical analysis
A dionex DX-500 ion chromatograph system equip-
ped with guard column (AS 11A), separator column
(AS11 ASC), self regenerating suppressor (SRS) and
conductivity detector (CD-20) was used for the analysis
of major anions (F�, Cl�, NO�3 and SO2�
4 ) using 10 mM
NaOH as eluent at flow rate of 1.0 mlmin�1. NHþ4 was
analyzed by UV–VIS Spectrophotometer (Shimadzu
Model-1601) using the indophenol blue method (Harri-
son and Perry, 1986). The major cations (Naþ, Kþ, Ca2þ
and Mg2þ) were analyzed by double beam atomic
absorption spectrophotometer (Perkin Elmer-2380) with
an air acetylene flame. Naþ and Kþ were measured in
the emission mode while Ca2þ and Mg2þ were measured
in the absorption mode.
The ion chromatograph was calibrated daily with a
standard solution of 2 mg l�1 prepared daily from 1000
mg l�1 stock standard solutions of F�, Cl�, NO�3 and
SO2�4 . Variation in standard peak heights and peak areas
was found to be less than 5% between calibrations which
were carried out after every five samples. Field blanks
1100 A. Gupta et al. / Chemosphere 55 (2004) 1097–1107
were collected by sampling for 1 min. The concentra-
tions of ions in blanks were below detection limits.
3. Results and discussion
3.1. Dry deposition
Arithmetic mean and standard deviation of dry
deposition flux of major ions on the surfaces of both leaf
types were presented in Table 2. The deposition flux was
highest for Ca2þ and it decreased in the order of
Kþ > NHþ4 > Mg2þ > SO2�
4 > Naþ > Cl� > NO�3 > F�
on guava leaves. In the case of peepal leaves the highest
deposition flux was for NHþ4 and decreased in the order
of Kþ > Ca2þ > Naþ > Mg2þ > SO2�4 > Cl� > F� >
Table 2
Annual (N ¼ 85) dry deposition flux (mgm�2 d�1) on natural
surfaces
Species Guava leaf Peepal leaf
AM±SD AM±SD
F� 0.7± 0.4 0.3 ± 0.2
Cl� 1.2± 1.1 0.3 ± 0.2
NO�3 0.7± 0.6 0.2 ± 0.1
SO2�4 1.5± 0.9 0.5 ± 0.2
Naþ 1.2± 0.8 0.8 ± 0.5
Kþ 1.9± 1.1 0.9 ± 0.5
Ca2þ 1.9± 1.1 0.9 ± 0.5
Mg2þ 1.6± 0.9 0.5 ± 0.4
NHþ4 1.7± 1.2 1.0 ± 0.6
Note: AM¼ arithmetic mean, SD¼ standard deviation.
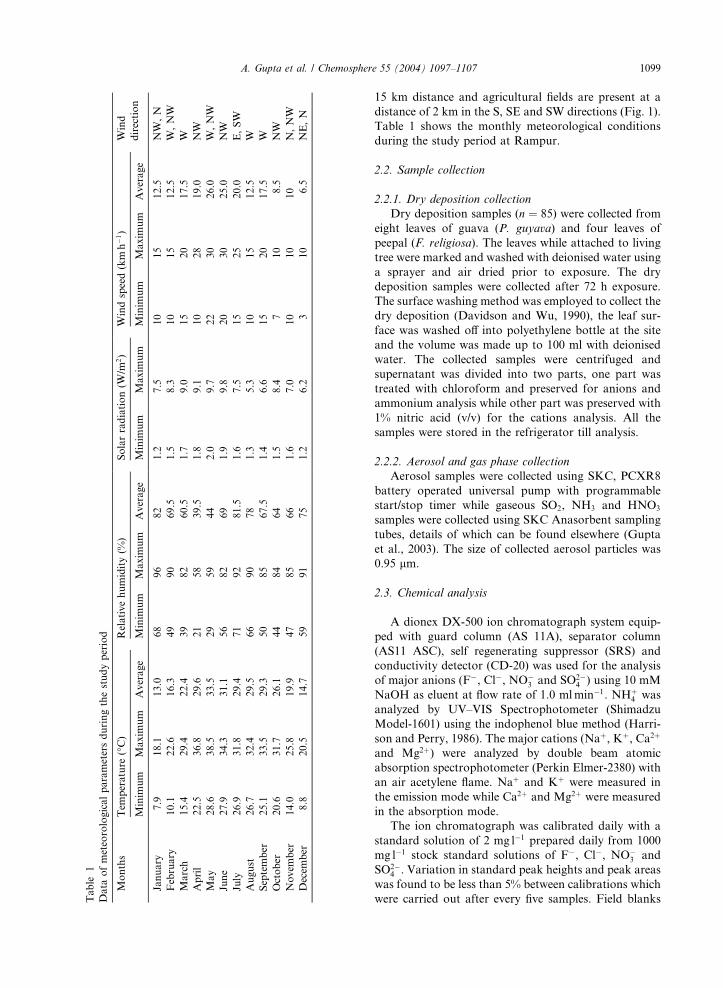
Fig. 2. Percentage contribution of each ion towards total dry
deposition on guava leaves.
NO�3 . Overall dry deposition fluxes were higher on
guava leaves. This may be due to surface characteristics
(surface roughness) and arrangement of leaves. Peepal
leaves are arranged along the axis of the stem, whereas
guava leaves are at right angles to the stem. This results
in higher deposition of coarser particles on guava leaves
in comparison to peepal leaves. In addition, deposition
on peepal leaves may be inhibited because of its waxy
surface and metabolic characteristics (transpiration
and guttation) (Haberlandt and Drummond, 1928).
ANOVA revealed no significant variation in deposition
flux of each ion, however numerical values were different
on both leaves.
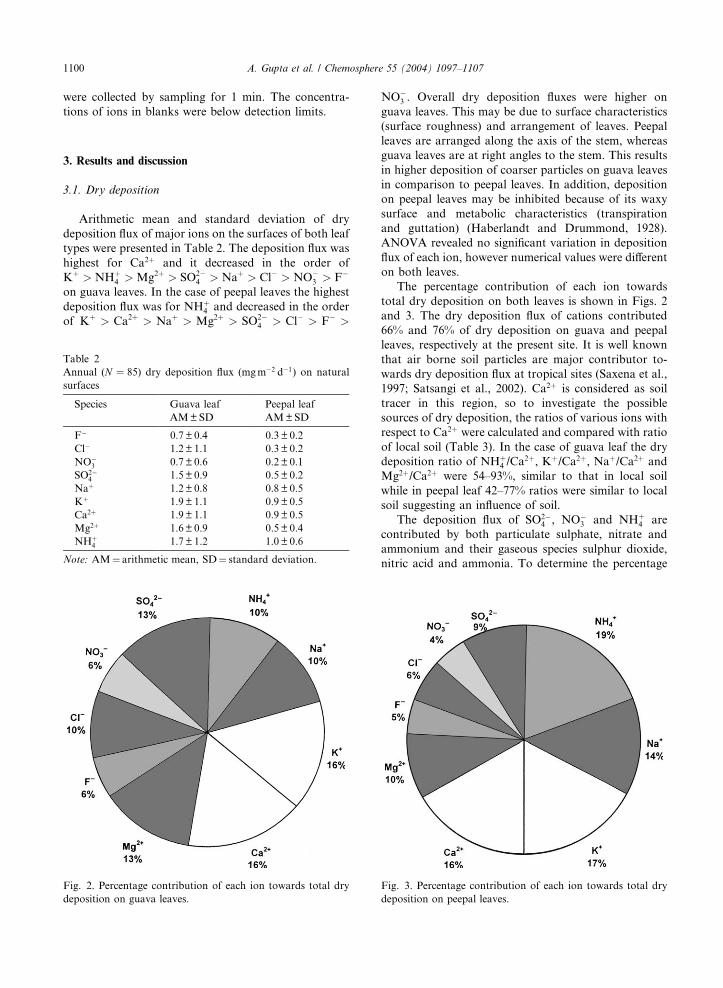
The percentage contribution of each ion towards
total dry deposition on both leaves is shown in Figs. 2
and 3. The dry deposition flux of cations contributed
66% and 76% of dry deposition on guava and peepal
leaves, respectively at the present site. It is well known
that air borne soil particles are major contributor to-
wards dry deposition flux at tropical sites (Saxena et al.,
1997; Satsangi et al., 2002). Ca2þ is considered as soil
tracer in this region, so to investigate the possible
sources of dry deposition, the ratios of various ions with
respect to Ca2þ were calculated and compared with ratio
of local soil (Table 3). In the case of guava leaf the dry
deposition ratio of NHþ4 /Ca
2þ, Kþ/Ca2þ, Naþ/Ca2þ and
Mg2þ/Ca2þ were 54–93%, similar to that in local soil
while in peepal leaf 42–77% ratios were similar to local
soil suggesting an influence of soil.
The deposition flux of SO2�4 , NO�
3 and NHþ4 are
contributed by both particulate sulphate, nitrate and
ammonium and their gaseous species sulphur dioxide,
nitric acid and ammonia. To determine the percentage
Fig. 3. Percentage contribution of each ion towards total dry
deposition on peepal leaves.
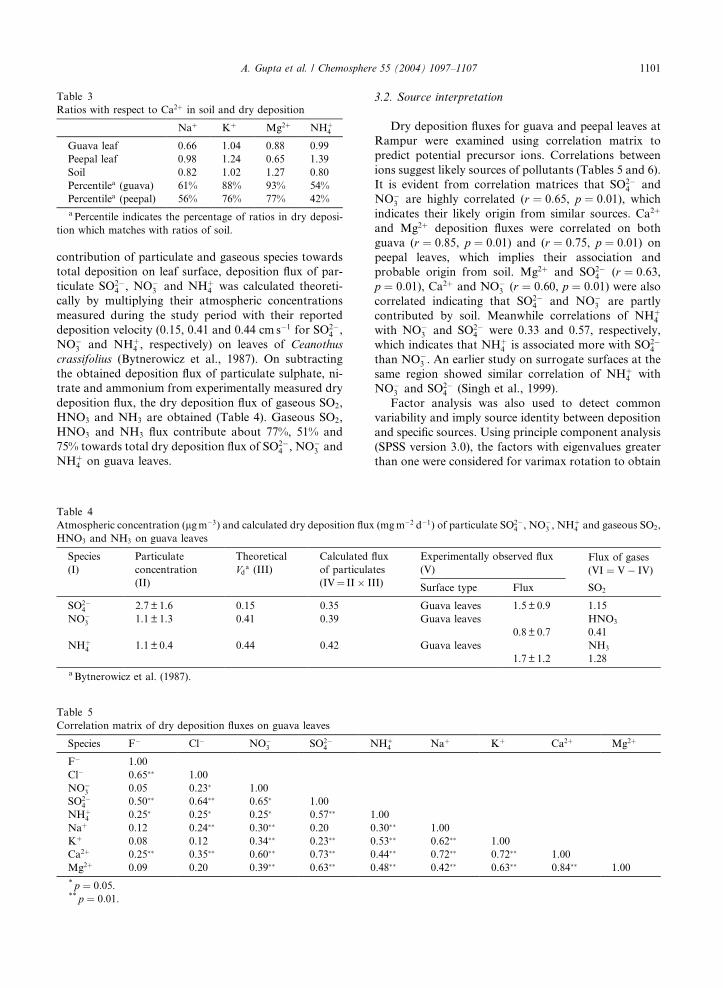
Table 3
Ratios with respect to Ca2þ in soil and dry deposition
Naþ Kþ Mg2þ NHþ4
Guava leaf 0.66 1.04 0.88 0.99
Peepal leaf 0.98 1.24 0.65 1.39
Soil 0.82 1.02 1.27 0.80
Percentilea (guava) 61% 88% 93% 54%
Percentilea (peepal) 56% 76% 77% 42%
aPercentile indicates the percentage of ratios in dry deposi-
tion which matches with ratios of soil.
A. Gupta et al. / Chemosphere 55 (2004) 1097–1107 1101
contribution of particulate and gaseous species towards
total deposition on leaf surface, deposition flux of par-
ticulate SO2�4 , NO�
3 and NHþ4 was calculated theoreti-
cally by multiplying their atmospheric concentrations
measured during the study period with their reported
deposition velocity (0.15, 0.41 and 0.44 cm s�1 for SO2�4 ,
NO�3 and NHþ
4 , respectively) on leaves of Ceanothus
crassifolius (Bytnerowicz et al., 1987). On subtracting
the obtained deposition flux of particulate sulphate, ni-
trate and ammonium from experimentally measured dry
deposition flux, the dry deposition flux of gaseous SO2,
HNO3 and NH3 are obtained (Table 4). Gaseous SO2,
HNO3 and NH3 flux contribute about 77%, 51% and
75% towards total dry deposition flux of SO2�4 , NO�
3 and
NHþ4 on guava leaves.
Table 4
Atmospheric concentration (lgm�3) and calculated dry deposition flux
HNO3 and NH3 on guava leaves
Species
(I)
Particulate
concentration
(II)
Theoretical
Vda (III)
Calculated
of particula
(IV¼ II� I
SO2�4 2.7 ± 1.6 0.15 0.35
NO�3 1.1 ± 1.3 0.41 0.39
NHþ4 1.1 ± 0.4 0.44 0.42
a Bytnerowicz et al. (1987).
Table 5
Correlation matrix of dry deposition fluxes on guava leaves
Species F� Cl� NO�3 SO2�
4 N
F� 1.00
Cl� 0.65�� 1.00
NO�3 0.05 0.23� 1.00
SO2�4 0.50�� 0.64�� 0.65� 1.00
NHþ4 0.25� 0.25� 0.25� 0.57�� 1
Naþ 0.12 0.24�� 0.30�� 0.20 0
Kþ 0.08 0.12 0.34�� 0.23�� 0
Ca2þ 0.25�� 0.35�� 0.60�� 0.73�� 0
Mg2þ 0.09 0.20 0.39�� 0.63�� 0
* p ¼ 0:05.** p ¼ 0:01.
3.2. Source interpretation
Dry deposition fluxes for guava and peepal leaves at
Rampur were examined using correlation matrix to
predict potential precursor ions. Correlations between
ions suggest likely sources of pollutants (Tables 5 and 6).
It is evident from correlation matrices that SO2�4 and
NO�3 are highly correlated (r ¼ 0:65, p ¼ 0:01), which
indicates their likely origin from similar sources. Ca2þ
and Mg2þ deposition fluxes were correlated on both
guava (r ¼ 0:85, p ¼ 0:01) and (r ¼ 0:75, p ¼ 0:01) on
peepal leaves, which implies their association and
probable origin from soil. Mg2þ and SO2�4 (r ¼ 0:63,
p ¼ 0:01), Ca2þ and NO�3 (r ¼ 0:60, p ¼ 0:01) were also
correlated indicating that SO2�4 and NO�
3 are partly
contributed by soil. Meanwhile correlations of NHþ4
with NO�3 and SO2�
4 were 0.33 and 0.57, respectively,
which indicates that NHþ4 is associated more with SO2�
4
than NO�3 . An earlier study on surrogate surfaces at the
same region showed similar correlation of NHþ4 with
NO�3 and SO2�
4 (Singh et al., 1999).
Factor analysis was also used to detect common
variability and imply source identity between deposition
and specific sources. Using principle component analysis
(SPSS version 3.0), the factors with eigenvalues greater
than one were considered for varimax rotation to obtain
(mgm�2 d�1) of particulate SO2�4 , NO�
3 , NHþ4 and gaseous SO2,
flux
tes
II)
Experimentally observed flux
(V)Flux of gases
(VI ¼ V� IV)
Surface type Flux SO2
Guava leaves 1.5± 0.9 1.15
Guava leaves HNO3
0.8± 0.7 0.41
Guava leaves NH3
1.7± 1.2 1.28
Hþ4 Naþ Kþ Ca2þ Mg2þ
.00
.30�� 1.00
.53�� 0.62�� 1.00
.44�� 0.72�� 0.72�� 1.00
.48�� 0.42�� 0.63�� 0.84�� 1.00
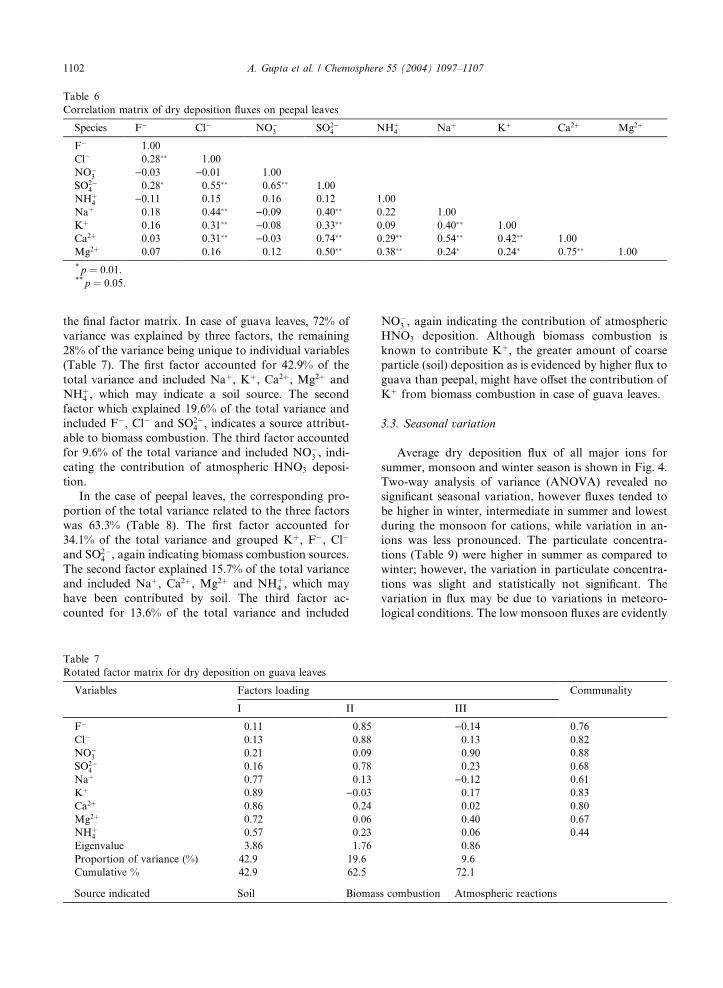
Table 6
Correlation matrix of dry deposition fluxes on peepal leaves
Species F� Cl� NO�3 SO2�
4 NHþ4 Naþ Kþ Ca2þ Mg2þ
F� 1.00
Cl� 0.28�� 1.00
NO�3 )0.03 )0.01 1.00
SO2�4 0.28� 0.55�� 0.65�� 1.00
NHþ4 )0.11 0.15 0.16 0.12 1.00
Naþ 0.18 0.44�� )0.09 0.40�� 0.22 1.00
Kþ 0.16 0.31�� )0.08 0.33�� 0.09 0.40�� 1.00
Ca2þ 0.03 0.31�� )0.03 0.74�� 0.29�� 0.54�� 0.42�� 1.00
Mg2þ 0.07 0.16 0.12 0.50�� 0.38�� 0.24� 0.24� 0.75�� 1.00
* p ¼ 0:01.** p ¼ 0:05.
1102 A. Gupta et al. / Chemosphere 55 (2004) 1097–1107
the final factor matrix. In case of guava leaves, 72% of
variance was explained by three factors, the remaining
28% of the variance being unique to individual variables
(Table 7). The first factor accounted for 42.9% of the
total variance and included Naþ, Kþ, Ca2þ, Mg2þ and
NHþ4 , which may indicate a soil source. The second
factor which explained 19.6% of the total variance and
included F�, Cl� and SO2�4 , indicates a source attribut-
able to biomass combustion. The third factor accounted
for 9.6% of the total variance and included NO�3 , indi-
cating the contribution of atmospheric HNO3 deposi-
tion.
In the case of peepal leaves, the corresponding pro-
portion of the total variance related to the three factors
was 63.3% (Table 8). The first factor accounted for
34.1% of the total variance and grouped Kþ, F�, Cl�
and SO2�4 , again indicating biomass combustion sources.
The second factor explained 15.7% of the total variance
and included Naþ, Ca2þ, Mg2þ and NHþ4 , which may
have been contributed by soil. The third factor ac-
counted for 13.6% of the total variance and included
Table 7
Rotated factor matrix for dry deposition on guava leaves
Variables Factors loading
I II
F� 0.11 0.85
Cl� 0.13 0.88
NO�3 0.21 0.09
SO2�4 0.16 0.78
Naþ 0.77 0.13
Kþ 0.89 )0.03Ca2þ 0.86 0.24
Mg2þ 0.72 0.06
NHþ4 0.57 0.23
Eigenvalue 3.86 1.76
Proportion of variance (%) 42.9 19.6
Cumulative % 42.9 62.5
Source indicated Soil Biomas
NO�3 , again indicating the contribution of atmospheric
HNO3 deposition. Although biomass combustion is
known to contribute Kþ, the greater amount of coarse
particle (soil) deposition as is evidenced by higher flux to
guava than peepal, might have offset the contribution of
Kþ from biomass combustion in case of guava leaves.
3.3. Seasonal variation
Average dry deposition flux of all major ions for
summer, monsoon and winter season is shown in Fig. 4.
Two-way analysis of variance (ANOVA) revealed no
significant seasonal variation, however fluxes tended to
be higher in winter, intermediate in summer and lowest
during the monsoon for cations, while variation in an-
ions was less pronounced. The particulate concentra-
tions (Table 9) were higher in summer as compared to
winter; however, the variation in particulate concentra-
tions was slight and statistically not significant. The
variation in flux may be due to variations in meteoro-
logical conditions. The low monsoon fluxes are evidently
Communality
III
)0.14 0.76
0.13 0.82
0.90 0.88
0.23 0.68
)0.12 0.61
0.17 0.83
0.02 0.80
0.40 0.67
0.06 0.44
0.86
9.6
72.1
s combustion Atmospheric reactions
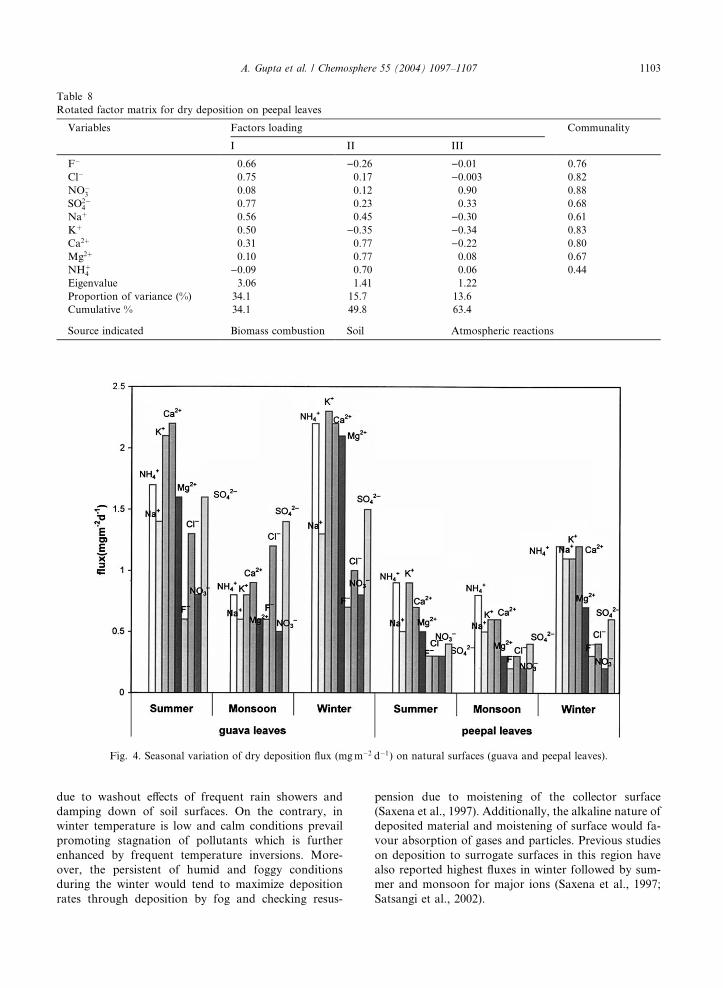
Table 8
Rotated factor matrix for dry deposition on peepal leaves
Variables Factors loading Communality
I II III
F� 0.66 )0.26 )0.01 0.76
Cl� 0.75 0.17 )0.003 0.82
NO�3 0.08 0.12 0.90 0.88
SO2�4 0.77 0.23 0.33 0.68
Naþ 0.56 0.45 )0.30 0.61
Kþ 0.50 )0.35 )0.34 0.83
Ca2þ 0.31 0.77 )0.22 0.80
Mg2þ 0.10 0.77 0.08 0.67
NHþ4 )0.09 0.70 0.06 0.44
Eigenvalue 3.06 1.41 1.22
Proportion of variance (%) 34.1 15.7 13.6
Cumulative % 34.1 49.8 63.4
Source indicated Biomass combustion Soil Atmospheric reactions
Fig. 4. Seasonal variation of dry deposition flux (mgm�2 d�1) on natural surfaces (guava and peepal leaves).
A. Gupta et al. / Chemosphere 55 (2004) 1097–1107 1103
due to washout effects of frequent rain showers and
damping down of soil surfaces. On the contrary, in
winter temperature is low and calm conditions prevail
promoting stagnation of pollutants which is further
enhanced by frequent temperature inversions. More-
over, the persistent of humid and foggy conditions
during the winter would tend to maximize deposition
rates through deposition by fog and checking resus-
pension due to moistening of the collector surface
(Saxena et al., 1997). Additionally, the alkaline nature of
deposited material and moistening of surface would fa-
vour absorption of gases and particles. Previous studies
on deposition to surrogate surfaces in this region have
also reported highest fluxes in winter followed by sum-
mer and monsoon for major ions (Saxena et al., 1997;
Satsangi et al., 2002).
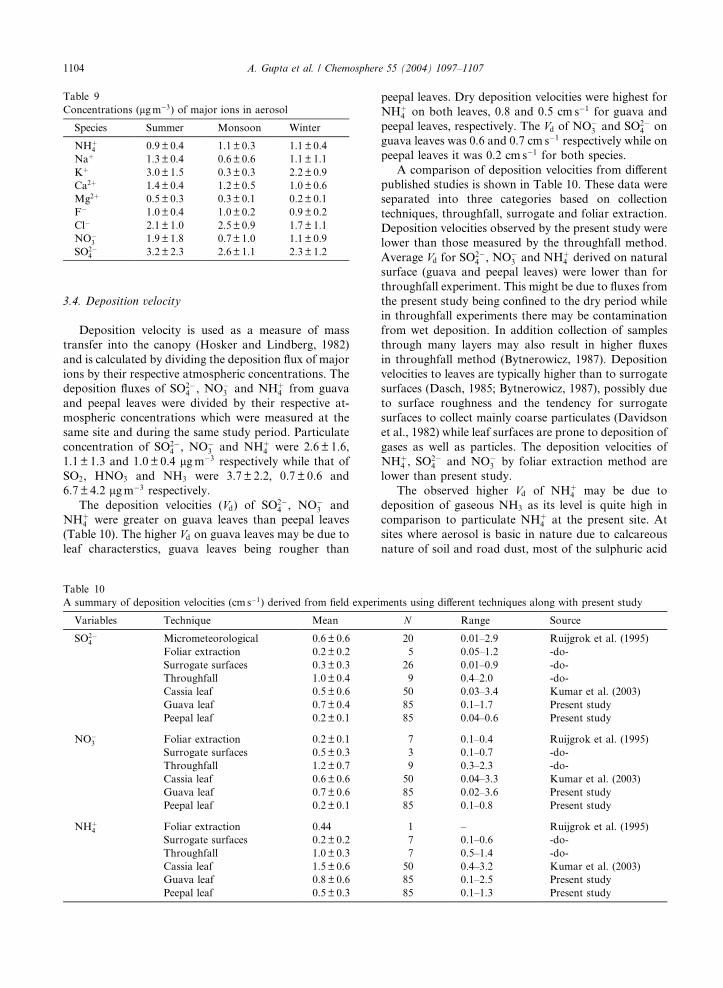
Table 9
Concentrations (lgm�3) of major ions in aerosol
Species Summer Monsoon Winter
NHþ4 0.9± 0.4 1.1± 0.3 1.1 ± 0.4
Naþ 1.3± 0.4 0.6± 0.6 1.1 ± 1.1
Kþ 3.0± 1.5 0.3± 0.3 2.2 ± 0.9
Ca2þ 1.4± 0.4 1.2± 0.5 1.0 ± 0.6
Mg2þ 0.5± 0.3 0.3± 0.1 0.2 ± 0.1
F� 1.0± 0.4 1.0± 0.2 0.9 ± 0.2
Cl� 2.1± 1.0 2.5± 0.9 1.7 ± 1.1
NO�3 1.9± 1.8 0.7± 1.0 1.1 ± 0.9
SO2�4 3.2± 2.3 2.6± 1.1 2.3 ± 1.2
1104 A. Gupta et al. / Chemosphere 55 (2004) 1097–1107
3.4. Deposition velocity
Deposition velocity is used as a measure of mass
transfer into the canopy (Hosker and Lindberg, 1982)
and is calculated by dividing the deposition flux of major
ions by their respective atmospheric concentrations. The
deposition fluxes of SO2�4 , NO�
3 and NHþ4 from guava
and peepal leaves were divided by their respective at-
mospheric concentrations which were measured at the
same site and during the same study period. Particulate
concentration of SO2�4 , NO�
3 and NHþ4 were 2.6 ± 1.6,
1.1 ± 1.3 and 1.0 ± 0.4 lgm�3 respectively while that of
SO2, HNO3 and NH3 were 3.7 ± 2.2, 0.7 ± 0.6 and
6.7± 4.2 lgm�3 respectively.
The deposition velocities (Vd) of SO2�4 , NO�
3 and
NHþ4 were greater on guava leaves than peepal leaves
(Table 10). The higher Vd on guava leaves may be due to
leaf characterstics, guava leaves being rougher than
Table 10
A summary of deposition velocities (cm s�1) derived from field experi
Variables Technique Mean
SO2�4 Micrometeorological 0.6 ± 0.6
Foliar extraction 0.2 ± 0.2
Surrogate surfaces 0.3 ± 0.3
Throughfall 1.0 ± 0.4
Cassia leaf 0.5 ± 0.6
Guava leaf 0.7 ± 0.4
Peepal leaf 0.2 ± 0.1
NO�3 Foliar extraction 0.2 ± 0.1
Surrogate surfaces 0.5 ± 0.3
Throughfall 1.2 ± 0.7
Cassia leaf 0.6 ± 0.6
Guava leaf 0.7 ± 0.6
Peepal leaf 0.2 ± 0.1
NHþ4 Foliar extraction 0.44
Surrogate surfaces 0.2 ± 0.2
Throughfall 1.0 ± 0.3
Cassia leaf 1.5 ± 0.6
Guava leaf 0.8 ± 0.6
Peepal leaf 0.5 ± 0.3
peepal leaves. Dry deposition velocities were highest for
NHþ4 on both leaves, 0.8 and 0.5 cm s�1 for guava and
peepal leaves, respectively. The Vd of NO�3 and SO2�
4 on
guava leaves was 0.6 and 0.7 cm s�1 respectively while on
peepal leaves it was 0.2 cm s�1 for both species.
A comparison of deposition velocities from different
published studies is shown in Table 10. These data were
separated into three categories based on collection
techniques, throughfall, surrogate and foliar extraction.
Deposition velocities observed by the present study were
lower than those measured by the throughfall method.
Average Vd for SO2�4 , NO�
3 and NHþ4 derived on natural
surface (guava and peepal leaves) were lower than for
throughfall experiment. This might be due to fluxes from
the present study being confined to the dry period while
in throughfall experiments there may be contamination
from wet deposition. In addition collection of samples
through many layers may also result in higher fluxes
in throughfall method (Bytnerowicz, 1987). Deposition
velocities to leaves are typically higher than to surrogate
surfaces (Dasch, 1985; Bytnerowicz, 1987), possibly due
to surface roughness and the tendency for surrogate
surfaces to collect mainly coarse particulates (Davidson
et al., 1982) while leaf surfaces are prone to deposition of
gases as well as particles. The deposition velocities of
NHþ4 , SO
2�4 and NO�
3 by foliar extraction method are
lower than present study.
The observed higher Vd of NHþ4 may be due to
deposition of gaseous NH3 as its level is quite high in
comparison to particulate NHþ4 at the present site. At
sites where aerosol is basic in nature due to calcareous
nature of soil and road dust, most of the sulphuric acid
ments using different techniques along with present study
N Range Source
20 0.01–2.9 Ruijgrok et al. (1995)
5 0.05–1.2 -do-
26 0.01–0.9 -do-
9 0.4–2.0 -do-
50 0.03–3.4 Kumar et al. (2003)
85 0.1–1.7 Present study
85 0.04–0.6 Present study
7 0.1–0.4 Ruijgrok et al. (1995)
3 0.1–0.7 -do-
9 0.3–2.3 -do-
50 0.04–3.3 Kumar et al. (2003)
85 0.02–3.6 Present study
85 0.1–0.8 Present study
1 – Ruijgrok et al. (1995)
7 0.1–0.6 -do-
7 0.5–1.4 -do-
50 0.4–3.2 Kumar et al. (2003)
85 0.1–2.5 Present study
85 0.1–1.3 Present study
A. Gupta et al. / Chemosphere 55 (2004) 1097–1107 1105
and nitric acid preferentially react with these aerosol
particles or SO2�4 and NO�
3 are formed after adsorption
of SO2 and NO2 on these calcareous particles. Hence
transformation of gaseous NH3 into particulate NHþ4 is
less (Gupta et al., 2003). Size segregated study from this
region shows unimodal distribution for NHþ4 and bi-
modal for SO2�4 (Kulshrestha et al., 1998). This indicates
that in addition to anthropogenic sources SO2�4 is also
contributed by terrigenous sources which may also be
the reason for different Vd of SO2�4 and NO�
3 .
4. Conclusion
Dry deposition was collected on natural surfaces
[guava (P. guyava) and peepal (F. religiosa) leaves] at
Rampur, a rural site of semi-arid region. Dry deposition
flux was the highest for Ca2þ and it decreased in the
order of Kþ > NHþ4 > Mg2þ > SO2�
4 > Naþ > Cl� >NO�
3 > F� on guava leaves. In the case of peepal leaves
the deposition flux was highest for NHþ4 and it decreased
in the order of Kþ > Ca2þ > Naþ > Mg2þ > SO2�4 >
Cl� > F� > NO�3 . Overall dry deposition flux was
higher on guava leaves than of peepal leaves, which may
be due to surface characteristics (surface roughness) and
arrangement of leaves. Peepal leaves are arranged along
the axis of the stem, whereas guava leaves are at right
angles to the stem. The deposition flux of cations con-
tribute 66% and 76% of dry deposition on guava and
peepal leaves, respectively as soil is major contributor
towards dry deposition flux at tropical region. The high
correlation between SO2�4 and NO�
3 indicates their likely
origin from similar sources. Ca2þ and Mg2þ are signifi-
cantly correlated on both guava and peepal leaves,
which implies their association and probable origin from
soil. Factor analysis revealed three likely sources, I in-
cludes Naþ, Kþ, Ca2þ, Mg2þ and NHþ4 , which may be
contributed by soil. II includes F�, Cl� and SO2�4 , which
may be attributed to biomass combustion, III includes
NO�3 , which indicates the contribution of atmospheric
HNO3 deposition. ANOVA revealed no significant
seasonal difference in deposition. The deposition veloc-
ities of NHþ4 , NO�
3 and SO2�4 were greater on guava than
peepal leaves, which were attributed to leaf character-
istics, in particular the rougher surface of guava com-
pared to peepal leaves.
Acknowledgements
We wish to thank Prof. Satya Prakash, Head, and
Department of Chemistry of this Institute for providing
necessary facilities. Sampling assistance by Mr. Dayal
Saran is greatly appreciated. Financial assistance from
DST (ESS/63/166/98) is gratefully acknowledged. One of
the authors (RK) acknowledges CSIR, New Delhi for
SRF.
References
Allen, A.G., Harrison, R.M., Nicholson, K.W., 1991. Dry
deposition of fine aerosol to a short grass surface. Atmo-
spheric Environment 25A, 2671–2676.
Altimir, N., Vesala, T., Keronen, P., Kulmala, M., Hari, P.,
2002. Methodology for direct field measurements of ozone
flux to foliage with shoot chambers. Atmospheric Environ-
ment 36, 19–29.
Altshuller, A.P., 1983. The acidic deposition phenomenon and
its effects. Critical assessment review papers. Chapter A-5,
EPA, Report Number EPA-600 8-83-016A.
Bytnerowicz, A., Miller, P.R., Olszyk, D.M., 1987. Dry
deposition of nitrate, ammonium and sulphate to a Ceano-
thus crossifolius canopy and surrogate surfaces. Atmo-
spheric Environment 21 (8), 1749–1757.
Bytnerowicz, A., Dawson, P.J., Morrison, C.L., Poe, M.P.,
1991. Deposition of atmospheric ions to pine branches and
surrogate surfaces in the vicinity of Emerald lake watershed.
Sequoia national park. Atmospheric Environment 25A,
2203–2210.
Cadle, S.H., Dasch, J.M., Mulawa, P.A., 1985. Atmos-
pheric concentrations and the deposition velocity to
snow of nitric acid, sulphur dioxide and various particu-
late species. Atmospheric Environment 19 (11), 1819–
1827.
Cobourn, W.G., Gauri, K.L., Tambe, S., Suhan, L., Saltik, E.,
1993. Laboratory measurements of sulphur dioxide velocity
on marble and dolomite stone surfaces. Atmospheric Envi-
ronment 27B (2), 193–201.
Conklin, M.H., Sommerfeld, R.A., Laird, S.K., Villinski, J.E.,
1993. Sulphur dioxide reactions on ice surfaces: implications
for dry deposition to snow. Atmospheric Environment 27A
(2), 159–166.
Dasch, J.M., 1983. A comparison of surrogate surfaces for dry
deposition collection. In: Pruppacher, H.R., Semonin, R.G.,
Slinn, W.G.N. (Eds.), Precipitation Scavenging, Dry Depo-
sition and Resuspension, Vol. 2. Elsevier, Amsterdam,
pp. 883–902.
Dasch, J.M., 1985. Direct measurement of dry deposition to a
polyethylene bucket and various surrogate surfaces. Envi-
ronmental Science and Technology 19, 721–725.
Davidson, C.I., Friedlander, S.K., 1978. A filtration model for
aerosol dry deposition: application to trace metal deposition
from the atmospheres. Journal of Geophysical Research 83,
2343–2352.
Davidson, C.I., Miller, J.M., Pleskow, M.A., 1982. The
influence of surface structure on predicted particle dry
deposition natural grass canopies. Water, Air and Soil
Pollution 18, 25–43.
Davidson, C.I., Wu, Y.L., 1990. In: Dry deposition of particles
and vaporsLindberg, S.E., Page, A.L., Norton, S.A. (Eds.),
Acidic Precipitation vs 3 Sources, Deposition and Canopy
Interactions, vol. 3. Springer Verlag, New York, pp. 103–
216.
Davidson, C.I., Lindberg, S.E., Schmidt, Cartwright, L.G.,
Landis, L.R., 1985. Dry deposition of sulphate onto
1106 A. Gupta et al. / Chemosphere 55 (2004) 1097–1107
surrogate surfaces. Journal of Geophysical Research 90
(D1), 2123–2130.
Erisman, J.W., Draaijers, G., Duyzer, J., Hofschreuder, P., van
Leeuwen, N., Romer, F., Ruijgrok, W., Wyers, P., Galla-
gher, M., 1997. Particle deposition to forest-summary of
results and application. Atmospheric Environment 31 (3),
321–332.
Granat, L., Richter, A., 1995. Dry deposition to pine of sulphur
dioxide and ozone at low concentration. Atmospheric
Environment 29 (14), 1677–1683.
Gupta, A., Kumar, R., Kumari, K.M., Srivastava, S.S., 2003.
Measurement of NO2, HNO3, NH3 and SO2 and related
particulate matter at a rural site of India. Atmospheric
Environment 37, 4837–4846.
Haberlandt, G., Drummond, M., 1928. Physiological plant
anatomy. Macmillan and Co. Limited, London. p. 497.
Hales, J.M., Hicks, B.B., Miller, J.M., 1987. The role of
research measurement networks as contributes to federal
assessments of acid deposition. Bulletin of American Mete-
orological Society 68, 216.
Harrison, R.M., Perry, R., 1986. Handbook of Air Pollution
Analysis, second ed. Chapman Hall, New York.
Hicks, B.B., Wesely, M.L., Durham, J., 1980. Critique of
methods to measure dry deposition. EPA report 600/9-80-
050.
Hosker Jr., R.P., Lindberg, S.E., 1982. Atmospheric deposition
and plant assimilation of gases and particles. Atmospheric
Environment 16 (5), 889–910, Review.
Huntzicker, J.J., Friedlander, S.K., Davidson, C.I., 1975.
Material balance for automobile-emitted lead in Los Ange-
les Basin. Environmental Science and Technology 9, 448–
457.
Ibrahim, M., Barrie, L.A., Fanaki, F., 1983. An experimental
and theoretical investigation of the dry deposition of
particles to snow, pine trees and artificial collectors.
Atmospheric Environment 17, 781–788.
Johansson, C., 1987. Pine forest: a negligible sink for atmo-
spheric NOx in rural Sweden. Tellus 39B, 426–438.
Krey, P.W., Toonkel, L.E., 1974. Scavenging ratios, Precipita-
tion scavenging. Symp. Ser. 41, 61, U.S. Energy Research
and Development Administration, Washington, DC.
Kulshrestha, U.C., Saxena, A., Kumar, N., Kumari, K.M.,
Srivastava, S.S., 1998. Chemical composition association of
size differentiated aerosols at a suburban site in a semi arid
tract of India. Journal of Atmospheric Chemistry 29, 109–
118.
Kumar, R., Rani, A., Singh, S.P., Satsangi, G.S., Kumari,
K.M., Srivastava, S.S., 2000. Dry deposition of major ions
on natural surfaces. Proceedings of the Pollution in Urban
Environment, Ninth National Symposium on Environment,
pp. 261–264.
Kumar, R., Rani, A., Singh, S.P., Kumari, K.M., Srivastava,
S.S., 2001. Measurements of dry deposition of gaseous and
particulate nitrate on marble at sub urban site of semiarid
region. Journal of Environmental Studies and Policy 4 (1),
45–51.
Kumar, R., Rani, A., Singh, S.P., Kumari, K.M., Srivastava,
S.S., 2002. Measurement of dry deposition of gaseous and
particulate S to marble at a semiarid region of India. Indian
Journal of Radio and Space Physics 31, 88–92.
Kumar, R., Rani, A., Kumari, K.M., Srivastava, S.S., 2003.
Direct measurement of atmospheric dry deposition to
natural surfaces in a semiarid region of North Central
India. Journal of Geophysical Research, in press.
Lindberg, S.E., Bredemeir, M., Schaefer, D.A., Qi, L., 1990.
Atmospheric concentration and deposition of nitrogen and
major ions in conifer forests in the United States and
Federal Republic of Germany. Atmospheric Environment
24A, 2207–2220.
Lindberg, S.E., Harriss, R.C., Turner, R.R., 1982. Atmospheric
deposition of metals to forest vegetation. Science 215, 1609–
1611.
Lovett, G.M., Kinsman, J.D., 1990. Atmospheric pollutant
deposition to high-elevation ecosystems. Atmospheric Envi-
ronment 24A (11), 2767–2786.
Morselli, L., Cecchini, M., Grandi, E., Iannuccilli, A., Barilli,
L., Olivieri, P., 1999. Heavy metals in atmospheric surrogate
dry deposition. Chemosphere 38 (4), 899–907.
Pandey, P.K., Mathur, R.P., Pandey, P.K., Godbole, P.N.,
1995. Dry deposition at an urban location. Indian Journal
of Environmental Health 37 (2), 95–98.
Pierson, D.H., Cawse, P.A., 1979. Trace elements in the
atmosphere. Philosophical Transactions of the Royal Soci-
ety of London Series B 288, 41–49.
Pryor, S.C., Barthelmie, R.J., Jensen, B., Jenson, N.O.,
Sorensen, L.L., 2002. HNO3 fluxes to a deciduous forest
derived using gradient and REA methods. Atmospheric
Environment 36, 5993–5999.
Rao, P.S.P., Khemani, L.T., Momin, G.A., Safai, P.D., Pillai,
A.G., 1992. Measurements of wet and dry deposition at an
urban location in India. Atmospheric Environment 26, 73–
78.
Ruijgrok, W., Davidson, C.I., Nicholson, K.W., 1995. Dry
deposition of particles. Tellus 47B, 587–601.
Saiz-Jimnez, C., 1993. Deposition of airborne organic pollu-
tants on historic buildings. Atmospheric Environment 27B
(1), 77–85.
Satsangi, G.S., Lakhani, A., Khare, P., Singh, S.P., Kumari,
K.M., Srivastava, S.S., 2002. Measurements of major ion
concentration in settled coarse particles and aerosols at a
semiarid rural site in India. Environment International 27,
1–7.
Saxena, A., Kulshrestha, U.C., Kumar, N., Kumari, K.M.,
Prakash, S., Srivastava, S.S., 1992. Dry deposition of nitrate
and sulphate on surrogate surfaces. Environment Interna-
tional 18, 509–513.
Saxena, A., Kulshrestha, U.C., Kumar, N., Kumari, K.M.,
Prakash, S., Srivastava, S.S., 1997. Dry deposition of
sulphate and nitrate to polypropylene surfaces in a semi-
arid area of India. Atmospheric Environment 31 (15), 2361–
2366.
Servant, J., 1976. Deposition of atmospheric lead particles to
natural surfaces in field experiments. Atmosphere-Surface
Exchange of Particulate and Gaseous Pollutants. Symp. Ser.
38, U.S. Energy Research and Development Administra-
tion, Washington, D.C., pp. 87–95.
Singh, S.P., Satsangi, G.S., Khare, P., Lakhani, A., Kumari,
K.M., Srivastava, S.S., 1999. Dry deposition in a rural site
of north India. Journal of Environmental Studies and Policy
2 (2).

A. Gupta et al. / Chemosphere 55 (2004) 1097–1107 1107
Tripathi, B.D., Tripathi, A., Mishra, K., 1991. Atmospheric
dust fall deposits in Varanasi city. Atmospheric Environ-
ment 25 (1), 109–112.
Volchok, H.L., Graveson, R.T., 1975. Wet/dry fallout collec-
tion. Proceedings of Second Federal Conference on the
Great Lakes, Interagency Comm. Mar. Sci. Eng., Argonne
Nat. Lab., Argonne III, pp. 259–264.
Yun, H.J., Yi, S.M., Kim, Y.P., 2002. Dry deposition fluxes of
ambient particulate heavy metals in a small city, Korea.
Atmospheric Environment 36, 5449–5458.
Related Documents


