
Welcome message from author
This document is posted to help you gain knowledge. Please leave a comment to let me know what you think about it! Share it to your friends and learn new things together.
Transcript
Citation: Cook, D. C., Van Orden, A. C., Reyes, J., Oh, S. J., Balasubramanian, R., Carpio, J. J., and Townsend, H. E., “AtmosphericCorrosion in Marine Environments along the Gulf of México,” Marine Corrosion in Tropical Environments, ASTM STP 1399, S. W.Dean, G. Hernandez-Duque Delgadillo, and J. B. Bushman, Eds., American Society for Testing and Materials, West Conshohocken, PA,2000. pp. 75 - 97. ISBN: 0-8031-2873-8.
1Professors and Graduate Research Assistant, Physics Department, Old DominionUniversity, Norfolk, VA 23529.
2Graduate Research Assistant and Professor, Programa de Corrosion del Golfo de México,Autonomous University of Campeche, Campeche 24030 México.
3Postdoctoral Fellow, Materials Science and Engineering Department, Pohang University ofScience and Technology, Pohang, Kyungbuk 790-784 Korea.
4Senior Research Consultant, Bethlehem Steel Corporation, Bethlehem, PA 18016.
75
Desmond C. Cook,1 Ann C. Van Orden (dec.),1 Javier Reyes,2 Sei J. Oh,3 RamaBalasubramanian,1 Juan J. Carpio,2 and Herbert E. Townsend4
Atmospheric Corrosion in Marine Environments along the Gulf of México
Reference: Cook, D. C., Van Orden, A. C., Reyes, J., Oh, S. J., Balasubramanian, R.,Carpio, J. J., and Townsend, H. E., “Atmospheric Corrosion in Marine Environmentsalong the Gulf of México,” Marine Corrosion in Tropical Environments, ASTM STP 1399,S. W. Dean, G. Hernandez-Duque Delgadillo, and J. B. Bushman, Eds., American Societyfor Testing and Materials, West Conshohocken, PA, 2000.
Abstract: Atmospheric corrosion in México is creating significant structural problems in thetropical marine regions of the Gulf of México. This is especially true along the southern Gulfcoast where increasing petrochemical pollution is present with the extremely high chlorideconcentrations resulting from strong onshore winds, and the ever-present high time-of-wetness. The climatic and environmental parameters have been measured, between 1993 and1998, at 12 coupon exposure sites at marine locations around the Gulf of México. Corrosionclassifications for iron, aluminum, copper and zinc have been calculated for each site usingmean values of the time-of-wetness, chloride and sulfur dioxide concentrations. Thetheoretically predicted corrosion rates have been determined from the site classification data,and compared to the 12-month corrosion rates measured by coupon mass loss for the fourmetals exposed at the same sites. The data show that all sites have at least a C4 classificationwith most having C5 even though many are located over 1 km from the shoreline. Themeasured corrosion rates of different metals are often not in good agreement with thosepredicted using the environmental parameters, providing evidence that other climatic factorssuch as frequency of precipitation can modify the corrosion rates and distort the correlationwith theoretical corrosion predictions and models. Spectroscopic analysis of corrosionproducts from exposed carbon steel coupons shows that large fractions of akaganeite formin high chloride environments, along with lepidocrocite and goethite. The oxides form indistinct layers on the steel surface. The amount of akaganeite formed is related to some extentby the precipitation frequency which controls if pollutants are regularly flushed from the steelsurfaces.
Keywords: marine corrosion, corrosivity, México, Mössbauer spectroscopy

76
Introduction
Corrosion research in Latin America is an expanding field of scientific and engineeringstudy due mainly to the increasing demand to understand the performance of structuralmaterials in some of the world’s most adversely corrosive regions. The quest for corrosiondata, models and prediction of materials performance is being driven by significant rural andindustrial development in this the world’s largest accessible tropical location. It is well knownthat structural materials presently used in many of the locations, have severely reducedserviceable lifetimes, particularly in the marine environment. This is especially true indeveloping regions in México, along the Caribbean coastline and around the Gulf of Méxicowhere industry and urban expansion are exposing building materials to prolonged humid,marine environments, as well as to high concentrations of industrial pollutants. In order toevaluate some of the corrosion problems, Méxican research groups in Mérida, Campeche andMéxico City, have made important contributions to the understanding of the corrosionsources by measurement of environmental conditions and determination of the corrosivityindex and the corrosion rates of different metals in many of the commercially important areasalong the Gulf of México and Caribbean coastline. Researchers from Old DominionUniversity, in collaboration with the Méxican corrosion groups, have subsequently exposedstructural steels produced in the United States, México and Japan at several locations, andare undertaking a spectroscopic investigation of the corrosion products to identify the ironoxides which form and transform as a function of exposure time and environmentalconditions. The locations of the oxides within the corrosion product layers are also beingmapped in order to understand the mechanism by which some rust layers are adherent andprotective against further corrosion, particularly for the High-Strength Low-Alloy, HSLA,structural steels. One basic scientific advantage of performing such research in the tropicalregions of the Gulf of México, is the availability of exposure sites with a large range ofenvironmental pollutants and annually high mean temperatures and humidity, which produceshigh time-of-wetness for the exposed metals.
México is located between the latitudes 15° and 30° N and the longitudes 86° and 116°.Two thirds of the country is located in the tropics, including 90% of the coastal regions onthe Gulf of México. The geographical characteristics of México are varied, from the largesouthwest coastline bordering the Pacific Ocean, the dry, hot regions in the north, the highcentral mountainous region, including México City, to the flat, heavily vegetated regions ofthe southern and eastern coast of the Gulf of México. The most easterly section of Méxicoincludes the Yucatan Peninsula, a flat limestone tableland which is rich in Mayan culture andtradition. Its west coast, bordering the Gulf of México, is a region of agriculture and fishing,where the inhabitants have maintained their traditional living style, in contrast to the morepopularly known tourist resorts on the east coast along the Caribbean Sea from Cancun andCozumel in the north to Chetumal 400 km to the south. The four main climatic zones inMéxico are shown in Figure 1 along with the location of cities in which atmospheric exposuresites are located. The region along the Gulf of México is classified as Humid Tropical, [1],having a mean annual relative humidity greater than 75% and mean precipitation greater thanabout 1500 mm/yr. The mean annual temperature is greater than 26 oC which is about thesame temperature as the Gulf waters in this region. One interesting exception to thisclassification is the north-west corner of the Yucatan Peninsula which is

77
Figure 1 - Map of México showing the four main climatic zones and the mean annualrelative humidity for each zone.
classified as Arid. This region contains the important shipping port of Progreso which has amean rainfall less than 400 mm/yr, but with the high relative humidity and temperature of asub-tropical location.
Throughout México there are over 380 National Meteorological Stations, (SMN), mostof which have been recording daily weather conditions for over 50 years [2]. This data isincluded in a comprehensive set of maps available from the National University of México,(UNAM) in México City. Table 1 lists a summary of the main weather conditions at the citiesshown on Figure 1 where atmospheric exposure sites are located. Important features in theGulf region include the coastal cities of Veracruz and Coatzacoalcos which have very highrainfall and very strong year-round winds which blow predominantly from the north andnortheast off the Gulf of México. This makes both regions severe marine environments withhigh chloride concentrations. Some data for the marine exposure site at Kure Beach, NC arealso included for comparison. Detailed descriptions of the regional weather conditions andtheir daily changes for each season are beyond the scope of this article. They are containedin the recent work by Reyes [3, 4]. In general however, the data of Table 1 would allow theprediction of high rates of atmospheric corrosion in the region of the Gulf of México.
The region surrounding the Gulf of México has been the location of significanteconomic development with the building of structures, ranging from industrial sites such asrefineries and petrochemical processing plants, to homes and schools, and infrastructuresincluding roads and bridges. This is particularly true in the cities of Coatzacoalcos, Minatitlanand Cd. Del Carmen, and is primarily due to the oil discoveries in the Gulf of

78
Table 1 - Weather conditions at the Méxican exposure sites.
CityCode
City AnnualPrecip.,mm/yr
MeanAnnualTemp.
oC
AnnualRelativeHumidity
%
AnnualSolar
Radiationhr
WindEnergy,W/m2
AverageWindSpeed,
m/s
Prev.Wind
Direction
CP Campeche 800-1200 >26 >75 2600 40-80 6.0 SE
DC Cd. Del Carmen 1500-2000 >26 >75 2400 40-60
CZMT
CoatzacoalcosMinatitlan
2000-2500 22-26 >75 2200 80-160 9.0 N
VC Veracruz 1500-2000 >26 >75 2400 >160 11.0 NE
XP Xalapa 1200-1500 12-18 >75 <1800 10-20 3.0 SE
OZ Orizaba 800-1200 12-18 65-75 <1800 0-10 3.0 E
ME Merida 800-1200 >26 >75 3000 0-10 5.0 SE
PG Progreso 125-400 22-26 65-75 2600 20-40 NE
PM Puerto Morelos 1500-2000 >26 >75 3000 10-20 5.0 SE
MH Majahual 1200-1500 >26 >75 3000 0-10 5.0 SE
MC México City 400-600 12-18 55-60 2400 0-10 4.0 All
LP San Luis Potosi 125-400 12-18 65-70 2200 10-20 5.5 E
AP Acapulco 1200-1500 >26 65-75 2800 10-20 5.5 SW
KB Kure Beach NC 1200-1500 18 79 3.4 NE
México off the coast of Cd. Del Carmen in the 1970s, see OIL1 on Figure 1. Three oilrefineries have since been built by PEMEX-petrochemical at Pajaritos, Cangrejera andMorelos near Coatzacoalcos. Accompanying the refineries has been the emergence of a largenumber of support and petrochemical related facilities producing plastics, detergents,fertilizers and rubber. All have led to the growing urban development in Coatzacoalcos andMinatitlan. They have also led to the increase in atmospheric contamination in this region aswell as in the regions to the south and west including Veracruz which are severely affectedby the wind-carried pollutants from the oil rigs to the northeast. In the period 1984 to 1991,the pH of the rain in Veracruz has decreased from 5.75 to 4.32, and the ozone level is up to8.58 ppm [5, 6]. It has been reported that a typical PEMEX petrochemical plant has annualemissions of 52.2 tons of oxides of sulfur, 23.4 tons of particulates, 14 tons of carbonmonoxide and 7 tons of hydrocarbons [6].
The increasing occurrence of acid rain in the tropical environments whose relativehumidity regularly exceeds 80%, accompanied with the high marine chloride concentrations,has resulted in extremely high corrosion rates of structural materials along the southern coastof the Gulf of México [4]. In reported cases, structural failures due to atmospheric corrosionin the area of Coatzacoalcos-Minatitlan, have resulted in very serious accidents with loss of
79
life and economic loss [3, 7]. There is also serious concern about possible damage to thelimestone structures at the Mayan cultural areas as a result of increased acid rain in regionsto the northeast along the Yucatan Peninsula. Recently, rainwater pH levels in Campechehave been measured between 4.2 and 8.2, throughout the year [3, 8].
Marine Corrosion México
Two well-established corrosion research groups exist in México in the area of theYucatan Peninsula. In Mérida, the Corrosion Research Group is located in the Departmentof Applied Physics at Centro de Investigacion y de Estudios Avanzados del InstitutoPolitecnico Nacional, Unidad Mérida (CINVESTAV-IPN, Mérida). This group has anoutstanding reputation and is involved in research on a wide range of corrosion problems inMéxico including the performance of structural and stainless steels in developing regionsalong the Caribbean Sea. It maintains at least 5 atmospheric exposure sites from the northwestcorner of the Yucatan Peninsula between Mérida and Progreso, to the east towards Cancunand Puerto Morelos and south along the Caribbean coastline to Majahual. In Campeche,Programa de Corrosión del Golfo de México (PCGM), is located at the UniversidadAutónoma de Campeche. PCGM works specifically with corrosion-related problems inconcrete and structural steels in regions of the Gulf of México from Campeche south toVeracruz, (600 km). The program set up more than 13 atmospheric exposure sites in 1993between Campeche and Veracruz as well as on oil rigs off Cd. Del Carmen.
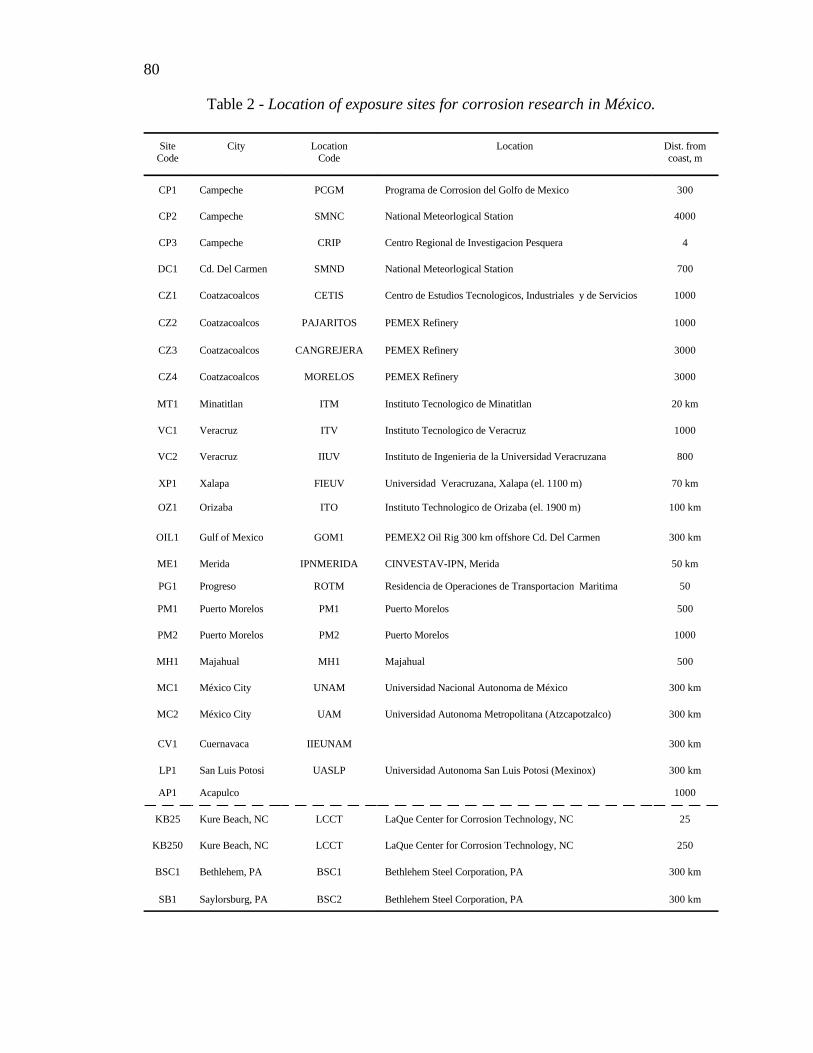
The sites used by both programs are all located in large cities in the Humid Tropicregion shown in Figure 1. Several sites are often located in the same city whose localenvironmental conditions are known to vary geographically. All sites are located at sea levelexcept for Xalapa and Orizaba which are 1100 and 1900 m in altitude respectively. Table 2lists coupon exposure sites along the Gulf of México and Caribbean Sea and the distance ofeach from the shoreline. Also listed are five sites located in the other three climatic zones andfor which corrosivity data have been published. Four US exposure sites are included asreference. The groups at Mérida and Campeche collaborate with researchers at Old DominionUniversity for the spectroscopic analysis of exposed coupons. A detailed description of mostsites, including photographs, can be found at www.physics.odu.edu/~cmmp/mx [4].
Until recently, very little research had been performed to determine the corrosivity ofvarious regions in México. In 1988 work began to characterize the atmosphericaggressiveness in 14 Latin American countries through the project known as Ibero-AmericanMap of Atmospheric Corrosividad (MICAT). In México, four stations at Acapulco,Cuernavaca, México City and San Luis Potosí were used to produce the first map ofatmospheric corrosivity in México [9-11]. Following that, the Mérida group began to adddata for its Carribean sites [12].
In 1993, PCGM began a five-year study of the atmospheric corrosion at 12 sites alongthe Gulf of México between Campeche and Xalapa. The research monitored the climatic andenvironmental parameters to determine site corrosivity classification and to permit theoreticalcorrosion rates to be calculated. Coupons of Méxican produced carbon steel, aluminum,copper and zinc were also exposed at many sites to determine the measured
80
Table 2 - Location of exposure sites for corrosion research in México.
SiteCode
City LocationCode
Location Dist. fromcoast, m
CP1 Campeche PCGM Programa de Corrosion del Golfo de Mexico 300
CP2 Campeche SMNC National Meteorlogical Station 4000
CP3 Campeche CRIP Centro Regional de Investigacion Pesquera 4
DC1 Cd. Del Carmen SMND National Meteorlogical Station 700
CZ1 Coatzacoalcos CETIS Centro de Estudios Tecnologicos, Industriales y de Servicios 1000
CZ2 Coatzacoalcos PAJARITOS PEMEX Refinery 1000
CZ3 Coatzacoalcos CANGREJERA PEMEX Refinery 3000
CZ4 Coatzacoalcos MORELOS PEMEX Refinery 3000
MT1 Minatitlan ITM Instituto Tecnologico de Minatitlan 20 km
VC1 Veracruz ITV Instituto Tecnologico de Veracruz 1000
VC2 Veracruz IIUV Instituto de Ingenieria de la Universidad Veracruzana 800
XP1 Xalapa FIEUV Universidad Veracruzana, Xalapa (el. 1100 m) 70 km
OZ1 Orizaba ITO Instituto Technologico de Orizaba (el. 1900 m) 100 km
OIL1 Gulf of Mexico GOM1 PEMEX2 Oil Rig 300 km offshore Cd. Del Carmen 300 km
ME1 Merida IPNMERIDA CINVESTAV-IPN, Merida 50 km
PG1 Progreso ROTM Residencia de Operaciones de Transportacion Maritima 50
PM1 Puerto Morelos PM1 Puerto Morelos 500
PM2 Puerto Morelos PM2 Puerto Morelos 1000
MH1 Majahual MH1 Majahual 500
MC1 México City UNAM Universidad Nacional Autonoma de México 300 km
MC2 México City UAM Universidad Autonoma Metropolitana (Atzcapotzalco) 300 km
CV1 Cuernavaca IIEUNAM 300 km
LP1 San Luis Potosi UASLP Universidad Autonoma San Luis Potosi (Mexinox) 300 km
AP1 Acapulco 1000
KB25 Kure Beach, NC LCCT LaQue Center for Corrosion Technology, NC 25
KB250 Kure Beach, NC LCCT LaQue Center for Corrosion Technology, NC 250
BSC1 Bethlehem, PA BSC1 Bethlehem Steel Corporation, PA 300 km
SB1 Saylorsburg, PA BSC2 Bethlehem Steel Corporation, PA 300 km
81
corrosion rates by mass loss. At several sites, coupons were first placed on the racks at 4different times during the year in order to measure the corrosion rates as a function of theinitial exposure season. Coupons were normally exposed for 1, 2, 3, 6, 9 and 12 months.Researchers at PCGM undertook the corrosion related calculations in order to determine themain factors controlling the atmospheric corrosion at each site. Researchers at Old DominionUniversity performed the spectroscopic analysis and microscopic mapping of the corrosionproducts on the carbon steel coupons, in order to correlate the type and amount of each ironoxide formed with the exposure conditions. The exposure program is continuing using newUS produced high strength structural steels and coated steels.
Corrosivity Classifications and Corrosion Rates in México
Most of the exposure sites in México are located within 1 km of the Gulf or Caribbeanshorelines and it could be anticipated that the atmospheric marine corrosion in this tropicalregion will be high and due mainly to large amounts of chlorides and high time-of-wetness.However, it could also be anticipated that the chloride concentrations at different regionsalong the Gulf shoreline will vary as a result of different predominant wind directions, andtherefore different site corrosivity classifications will result from geographical influences eventhough proximities to the shoreline are similar. In order to correlate the Méxican corrosivitydata with other international studies, the standard exposure and environmental monitoringtechniques and parameters measured, were as recommended by the MICAT project. A fulllist of all environmental parameters measured has been reported by Reyes [3, 4]. Thecontinuous measurements included air temperature, relative humidity, wind speed anddirection, precipitation, evaporation, time and energy of solar radiation. This data wasstatistically processed to determine for each parameter, its monthly and annual mean valuesover 5 years. The airborne chloride and SO2 concentrations were measured monthly. Exposedmaterials were in the form of 0.10 m x 0.15 m rectangular coupons of thickness 0.003 m forcarbon steel, (type A36), and 0.001 m for aluminum, copper and zinc. Helical test coils, 0.l0m long and 0.024 m diameter, of carbon steel, aluminum and copper were wound from 1 mlong and 0.003 m diameter wires. All materials were cleaned and weighed prior to exposureusing #400 and #600 abrasive paper to remove oxide scale, and chemically cleaned with eitherdilute hydrochloric and/or sulfuric acids and acetone. Samples were exposed between 1 and1.5 m above the ground on insulated racks angled at 45o. The coupons faced the water inmarine environments and north in non-coastal locations in accordance with ISO 8565 -General Requirements for Field Tests. Each exposure rack contained protected chloridecandles and sulfation plates for monthly pollution measurement in accordance with ISO 9225- Measurement of Pollution. Following exposure the corrosion products were chemicallyremoved from the coupons according to ISO DIS 8467 - Determination of Weight Loss.Average mass loss was determined from triplicate coupons exposed for twelve months.
The corrosion classifications for iron, aluminum, copper and zinc at each site weredetermined according to ISO 9223 - Corrosivity of Atmospheres - Classification, followingmeasurement of the time-of-wetness, and airborne chloride and SO2 concentrations. Table 3shows the data and classifications from the 12 sites used in the PCGM project. Also includedare data from 4 sites characterized by the Mérida group and the 4 sites used for the MICATproject. Again the data from 4 US sites are included as reference. It can be seen that the time-
82
of-wetness at all marine sites around the Gulf of México is significantly higher than at KureBeach, due mainly to the higher mean annual temperature in the tropics. Chlorideconcentrations are significantly varied along the coastline due mainly to the predominant winddirection, average wind speed and also distance from the shoreline. For example, thepredominant wind direction in Mérida and Campeche is SE, (offshore), thereby keeping thechloride concentrations relatively low. This is also true at site CP3 which is located just 4 mfrom the shoreline at Campeche [4]. However, along the southern Gulf and the Caribbeancoasts, as well as at Progreso, the predominant winds are onshore, which result in highchloride concentrations up to 1 km inland. Industrial pollutants from the petrochemicalrefineries in the Coatzacoalcos-Minatitlan area are seen to be high especially within thePemex-Pajaritos grounds, site CZ2. Also in Veracruz which contains very little heavyindustry, the SO2 concentrations are high due to windblown pollutants originating from theoil-rigs off the coast of Cd. Del Carmen.
The corrosion classifications show that every marine site has at least a C4 rating for oneof the metals, with most sites having a C5 classification, even though they are locatedgenerally 1 km or more inland. In general the high time-of-wetness in the tropical regions setsthe stage for high corrosivity in the presence of even small amounts of pollutants.
The 12-month corrosion rate of each metal, as predicted theoretically from the sitecorrosivity, is shown in Table 4 along with the measured corrosion rate using the 12 monthmass loss of exposed coupons. In general there is fair correlation between prediction andmeasured corrosion rates for sites having corrosivity classification of C4 or less. Even thenthere are anomalies, for examples site CP1 which measures low for steel and high for copperand zinc, and site VC1 which measures very high for steel, copper and zinc. Very highcorrosion rates were measured in the marine locations having predominantly onshore windsincreasing the chloride concentrations. The extremely high corrosion rates at thepetrochemical site CZ2 is in part due to other locally emitted gases such as ammonia whichadd to the continuous acid rain/humid environment inside the plant. Just outside the plant atsite CZ1, the corrosion rates are lowered towards those observed at the Kure Beach 25 m lot.The high corrosion rates at Veracruz are also effected by the high mean wind velocity and theweekly sandstorms that the city experiences. The measured corrosion rates at the C5 sitesshows a very broad range of values, and it is misleading to evaluate many of the locations bycorrosion classifications and predicted corrosion rates alone. In the case of the tropical marineenvironments, observing corrosion rates 2-4 times greater than the lower limit for theclassification, can result in severely reduced serviceable lifetimes and increased maintenancecosts if the structure is designed according to predicted data. For example, at the Universityof Veracruzana, site VC2, each of the four metals has a corrosion rate at least twice the lowerpredicted value. Clearly the model for predicting site corrosivities needs to be improved byperhaps including additional parameters, or more likely by initially improving measurementof the pollutants and time-of-wetness at the surface of the exposed metal.
In order to make a general prediction of the corrosion rates of steel, aluminum, copperand zinc in tropical marine environments, which may contain some industrial influence, theexperimental data of Table 4 were statistically analyzed to correlate the corrosion with time-of-wetness, chloride and sulfur dioxide concentrations in the air. Table 5 shows the resultswith an estimated error of about 5%. It should be noted that aluminum, copper and zinc werenot exposed at all sites particularly at several of those with higher SO2 concentrations at

83
Table 3 - Corrosion classifications for the Méxican exposure sites determined from themeasured time-of-wetness and atmospheric pollutants.
SiteCode
Time ofWetness,
hr/yr
Pollutants, mg/m2 day Corrosion classification
Cl- SO2 Iron Aluminum Copper Zinc
CP1 4894 τ470.5 S2 2.61 P0 C4 C3-C4 C4 C4
CP2 4576 τ417.0 S1 2.64 P0 C3 C3-C4 C3 C3
CP3 4572 τ476.2 S2 5.35 P0 C4 C3-C4 C4 C4
DC1 4950 τ417.6 S1 3.33 P0 C3 C3-C4 C3 C4
CZ1 6617 τ5174.8 S2 13.00 P1 C5 C5 C5 C5
CZ2 6250 τ5180.9 S2 24.67 P1 C5 C5 C5 C5
CZ3 6250 τ546.2 S1 9.84 P0 C4 C5 C4 C4
CZ4 6250 τ590.2 S2 9.10 P0 C5 C5 C5 C5
MT1 6617 τ519.6 S1 10.72 P1 C4 C5 C4 C4
VC1 5439 τ4242.2 S2 6.67 P0 C4 C3-C4 C4 C4
VC2 4922 τ4384.3 S3 15.83 P1 C5 C5 C5 C5
XP1 3828 τ46.4 S1 1.13 P0 C3 C3-C4 C3 C3
ME1 τ411 S1 3.8 P0 C3 C3-C4 C3 C3
PG1 τ4430 S3 12.2 P1 C5 C5 C5 C5
PM1 τ4360 S3 3.1 P0 C5 C5 C5 C5
MH1 τ4405 S3 3.7 P0 C5 C5 C5 C5
MC1 τ3S0 P1 C3 C3 C3 C3
CV1 τ3S0 P0 C2 C3 C3 C3
LP1 τ3S0 P1 C3 C3 C3 C3
AP1 τ4S1 P0 C3 C3-C4 C3 C3
KB25 4290 τ4311 S3 0 P0 C5 C5 C5 C5
KB250 4290 τ4110 S2 0 P0 C4 C3-C4 C4 C4
BSC1 τ45 S0 26 P1 C3 C3 C3 C3
SB1 τ45 S0 17 P1 C3 C3 C3 C3

84
Table 4 - Predicted and measured corrosion rates in México, determined from sitecorrosivity and 12-month coupon exposure, respectively. Data from four US sites are
included. Some sites did not include all four metals. Corrosion Rate, mg/m2 yr
µm/yr
carbon steel aluminum copper zinc Site Predicted Measured Predicted Measured Predicted Measured Predicted MeasuredCP1 400-650
50-80183.523.3
0.6-50.25-2
12-251.3-2.8
58.30.66
15-302.1-4.2
44.56.24
CP2 200-40025-50
100.712.8
0.6-50.25-2
1.890.70
5-120.6-1.3
11.91.33
5-150.7-2.1
23.73.32
CP3 400-65050-80
585.574.4
0.6-50.25-2
5.191.92
12-251.3-2.8
46.65.23
15-302.1-4.2
32.64.57
DC1 200-40025-50
167.121.2
0.6-50.25-2
2.590.96
5-120.6-1.3
35.84.02
15-302.1-4.2
10.81.51
CZ1 >650>80
1497.3190.3
>5>2
1.290.48
>25>2.8
49.25.53
>30>4.2
CZ2 >650>80
2347.1298.2
>5>2
>25>2.8
>30>4.2
CZ3 400-65050-80
576.873.3
>5>2
12-251.3-2.8
15-302.1-4.2
CZ4 >650>80
363.546.2
>5>2
>25>2.8
>30>4.2
MT1 400-65050-80
683.886.9
>5>2
0.700.26
12-251.3-2.8
26.93.02
15-302.1-4.2
VC1 400-65050-80
1621.8173.0
0.6-50.25-2
4.091.51
12-251.3-2.8
45.15.07
15-302.1-4.2
72.910.2
VC2 >650>80
1654.9210.3
>5>2
9.023.33
>25>2.8
52.95.94
>30>4.2
105.614.8
XP1 200-40025-50
145.018.4
0.6-50.25-2
0.710.26
5-120.6-1.3
6.780.76
5-150.7-2.1
6.360.89
KB25 >650>80
1291164
>5>2
>25>2.8
>30>4.2
365
KB250 400-65050-80
36246
0.6-50.25-2
12-251.3-2.8
15-302.1-4.2
142
BSC1 200-40025-50
59876
0.6-20.25-0.8
5-120.6-1.3
5-150.7-2.1
141.9
SB1 200-40025-50
26033
0.6-20.25-0.8
5-120.6-1.3
5-150.7-2.1
111.6
85
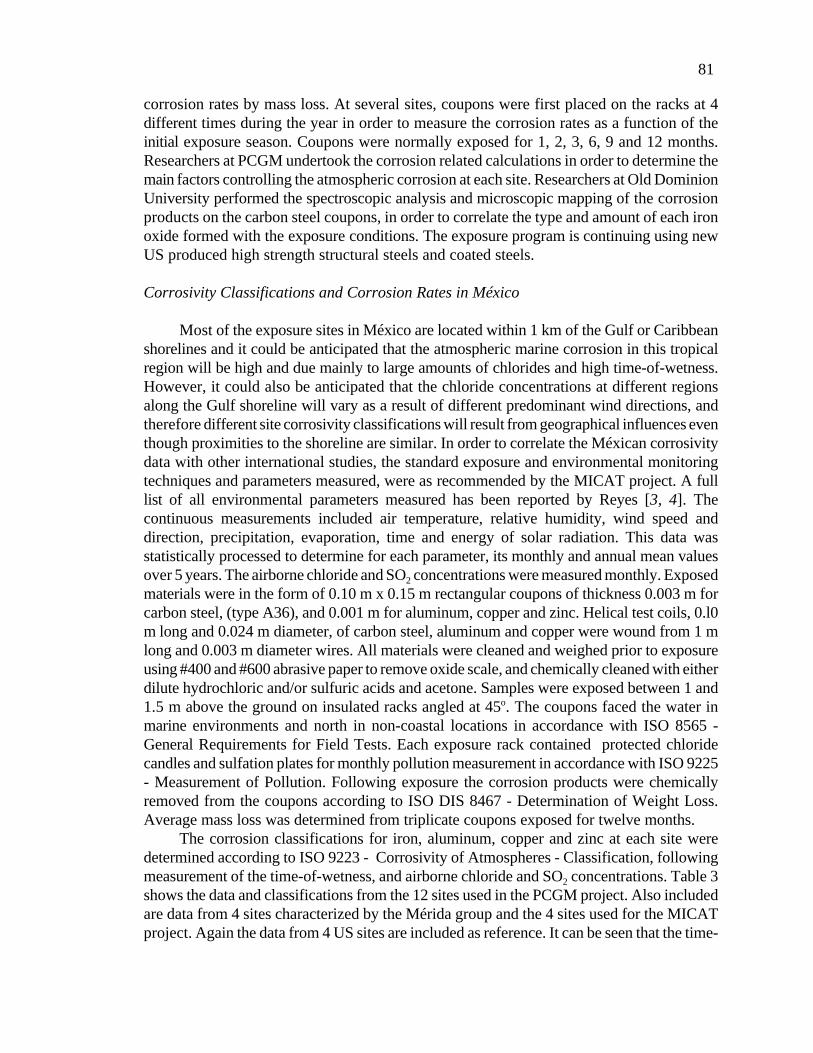
Coatzacoalcos. The corrosion rate, mg/m2 yr, has been constrained to linear correlationswith the chloride and sulfur dioxide concentrations, mg/m2 day and the time-of-wetness,TOW, hr/yr. It can be seen that the TOW is the dominant parameter controlling the corrosionrates for each metal except for the case of copper and aluminum in very high chlorideenvironments.
Table 5 - Corrosion rates predicted by linearly correlating the mass loss data with themeasured environmental parameters. The corrosion rate, mg/m2 yr is generally
dominated by the time-of-wetness, TOW, hr/yr, except in high chloride concentrations,mg/m2 day, for the case of aluminum and copper.
Material Corrosion rate, mg/m2 yr
Carbon steel
CCS = 0.228TOW + 0.290[Cl-] + 0.410[SO2]
Aluminum CAL = 0.042TOW + 0.497[Cl-] + 0.490[SO2]
Copper CCU = 0.078TOW + 0.318[Cl-]+ 0.616[SO2]
Zinc CZN = 0.327TOW + 0.756[Cl-] - 0.04[SO2]
Corrosion Product Analysis
To understand how the various atmospheric conditions control the formation ofcorrosion products and the role some of these oxides in protecting the steel through increasedcorrosion resistance, a full analysis of the chemical and phase composition of the coatings isrequired. The analytical capabilities of Mössbauer spectroscopy, Micro-Raman spectrometry,X-ray diffraction and Infrared spectrometry are important for complete oxide identificationincluding measurement of the fraction of each phase present. Corrosion coating impuritycontent and morphology require the use of Electron Probe Micro-analysis (EPMA), EnergyDispersive X-ray analysis (EDS) and Scanning Electron Microscopy (SEM).
Mössbauer spectroscopy alone is able to identify each oxide phase, but spectra need tobe recorded at 300K, 77K and often down to 4K. Liquid nitrogen temperatures are requiredto separately identify akaganeite, β-FeOOH, and lepidocrocite, γ-FeOOH. Even then, theidentification of superparamagnetic maghemite, γ-Fe2O3, and goethite, α-FeOOH, is difficultdue to magnetic relaxation effects [13]. Analysis down to 4K, and perhaps in appliedmagnetic fields, is often required for accurate identification, depending on the fraction ofnanophase oxides present in the corrosion coating. The oxide identification should thereforebe supported by other techniques. X-ray diffraction is able to identify akaganeite, but cannoteasily distinguish between maghemite and magnetite, Fe3O4. Infrared spectrometry easilyidentifies goethite and lepidocrocite but gives broad patterns for akaganeite and magnetite.

86
Raman spectrometry is able to identify most of the oxide phases but until recently wassusceptible to transforming the oxyhydroxide phases through laser heating, resulting inincorrect phase determination, especially hematite, α-Fe2O3. However, high quality micro-Raman spectrometers have now become an important, and perhaps necessary, analyticaltechnique for detailed analysis and mapping of the oxide layers that exist in the corrosioncoatings. The newer spectrometers have significantly reduced the data acquisition times toonly several seconds per sampling point. This allows the oxides to be mapped to spatialresolution less than 1 µm, in less than one hour. Additionally the location of each oxide,whether it formed as single or mixed phase layers or in clusters, can be mapped in three-dimensions, across the surface of the corrosion coating and in depth profile through thethickness of the coating.
The Micro-Raman and Mössbauer techniques together provide complete, in-situ, non-destructive, three-dimensional identification of corrosion products. Mössbauer spectroscopyis the only technique able to accurately measure the fraction of each oxide in a corrosioncoating. In corrosion research, this data is essential for monitoring oxide growth and phasetransformations under different exposure conditions.
Experimental Procedure
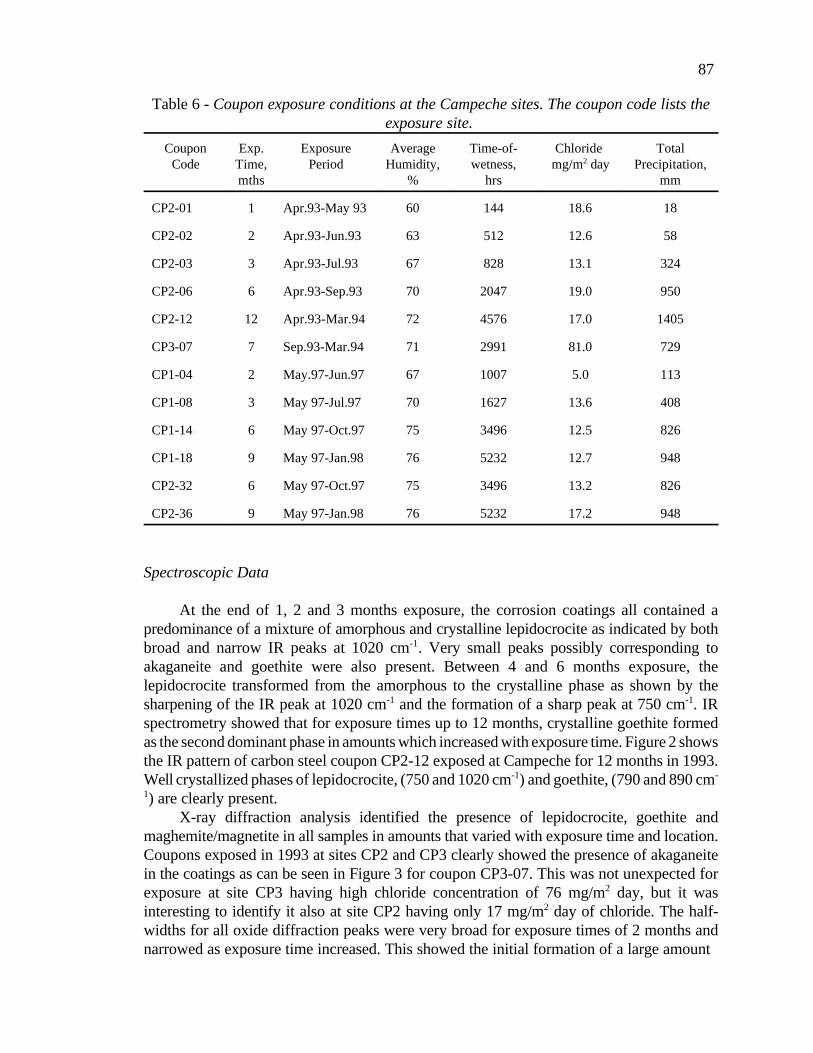
Coupons of type A36 low carbon mild steel were exposed at the three Campeche sitesfor times up to 12 months. Several sets of coupons exposed between April 1993-March 1994and May 1997-April 1998 were analyzed for consistency of corrosion product compositionfor each exposure year. The data was compared with carbon steel coupons previouslyexposed for 16 years at the US sites of Kure Beach (250 m lot), Bethlehem and Saylorsburg[14]. Table 6 summarizes the coupon coding and exposure conditions.
The corrosion products were initially studied in-situ, still attached to their steelsubstrates, using scattering Mössbauer spectroscopy, by detecting the re-emitted Gammaradiation, (GMS) and the Conversion Electrons, (CEMS). The corrosion products were alsoremoved from the steel by scraping, and analyzed by transmission Mössbauer spectroscopy,(TMS) at 4K, 77K and 300K. CEMS spectra were also recorded of the material that remainedon the steel substrates following coating removal. Infrared spectra of the corrosion productswere recorded with an FTIR spectrometer, using the diffused reflectance technique, in therange of 400 - 4000 cm-1. Raman spectrometry was used to study metallographic cross-sections of the corroded steel coupons over the range 200 - 800 cm-1 using a 25 mW He-Nelaser which was de-powered to 6 mW and focused to 2 µm spot diameter. The cross-sectionswere polished with silicon carbide papers and finally 0.25 µm diamond paste. X-ray powderdiffraction analysis was performed on the intact corrosion coatings using Cu Kα radiation ofwavelength 1.54056 Å. X-ray diffraction has only limited application in corrosion productidentification. It cannot easily distinguish between maghemite, γ- Fe2O3 and magnetite, Fe3O4
because of their similar crystal structure and lattice parameters. X-ray diffraction cannotidentify the nano-phase oxides of particle size less than about 20 nm. This is predominantlybecause the diffraction peaks are broad, overlapping, and masked behind the multiple highintensity peaks of the large particle oxides. However, X-ray diffraction can easily identify thepresence of akaganeite, β-FeOOH, through the presence of the (521) peak, (d=1.6361 Å, Cu-Kα 2θ=56.3625o), which is well resolved from the diffraction peaks of all other iron oxides.
87
Table 6 - Coupon exposure conditions at the Campeche sites. The coupon code lists theexposure site.
CouponCode
Exp.Time,mths
ExposurePeriod
AverageHumidity,
%
Time-of-wetness,
hrs
Chloride mg/m2 day
TotalPrecipitation,
mm
CP2-01 1 Apr.93-May 93 60 144 18.6 18
CP2-02 2 Apr.93-Jun.93 63 512 12.6 58
CP2-03 3 Apr.93-Jul.93 67 828 13.1 324
CP2-06 6 Apr.93-Sep.93 70 2047 19.0 950
CP2-12 12 Apr.93-Mar.94 72 4576 17.0 1405
CP3-07 7 Sep.93-Mar.94 71 2991 81.0 729
CP1-04 2 May.97-Jun.97 67 1007 5.0 113
CP1-08 3 May 97-Jul.97 70 1627 13.6 408
CP1-14 6 May 97-Oct.97 75 3496 12.5 826
CP1-18 9 May 97-Jan.98 76 5232 12.7 948
CP2-32 6 May 97-Oct.97 75 3496 13.2 826
CP2-36 9 May 97-Jan.98 76 5232 17.2 948
Spectroscopic Data
At the end of 1, 2 and 3 months exposure, the corrosion coatings all contained apredominance of a mixture of amorphous and crystalline lepidocrocite as indicated by bothbroad and narrow IR peaks at 1020 cm-1. Very small peaks possibly corresponding toakaganeite and goethite were also present. Between 4 and 6 months exposure, thelepidocrocite transformed from the amorphous to the crystalline phase as shown by thesharpening of the IR peak at 1020 cm-1 and the formation of a sharp peak at 750 cm-1. IRspectrometry showed that for exposure times up to 12 months, crystalline goethite formedas the second dominant phase in amounts which increased with exposure time. Figure 2 showsthe IR pattern of carbon steel coupon CP2-12 exposed at Campeche for 12 months in 1993.Well crystallized phases of lepidocrocite, (750 and 1020 cm-1) and goethite, (790 and 890 cm-
1) are clearly present.X-ray diffraction analysis identified the presence of lepidocrocite, goethite and
maghemite/magnetite in all samples in amounts that varied with exposure time and location.Coupons exposed in 1993 at sites CP2 and CP3 clearly showed the presence of akaganeitein the coatings as can be seen in Figure 3 for coupon CP3-07. This was not unexpected forexposure at site CP3 having high chloride concentration of 76 mg/m2 day, but it wasinteresting to identify it also at site CP2 having only 17 mg/m2 day of chloride. The half-widths for all oxide diffraction peaks were very broad for exposure times of 2 months andnarrowed as exposure time increased. This showed the initial formation of a large amount

88
Figure 2 - Infrared spectrum of the corrosion products on carbon steel coupon CP2-12exposed in Campeche, México for 12 months. Lepidocrocite and goethite are the two
main iron oxides identified.
of nano-phase material of low crystallinity, and the development towards larger morecrystalline particles as exposure time increased. Analysis of the particle size of each oxidephase by X-ray diffraction and Mössbauer spectroscopy is presently being performed todetermine the fractions of each nanophase oxide in the corrosion coatings [15]. After 12months exposure, the peaks were still broader than those obtained for crystalline high purityiron oxide standards [16], and were superimposed on much narrower peaks at the samediffraction angle, showing a mixture of large, > 50 nm, and small particle sizes of the sameoxide phase. The coupons exposed in 1997 again contained lepidocrocite, goethite andmaghemite/ magnetite but no akaganeite was identified from either the CP1 or CP2 exposuresites.
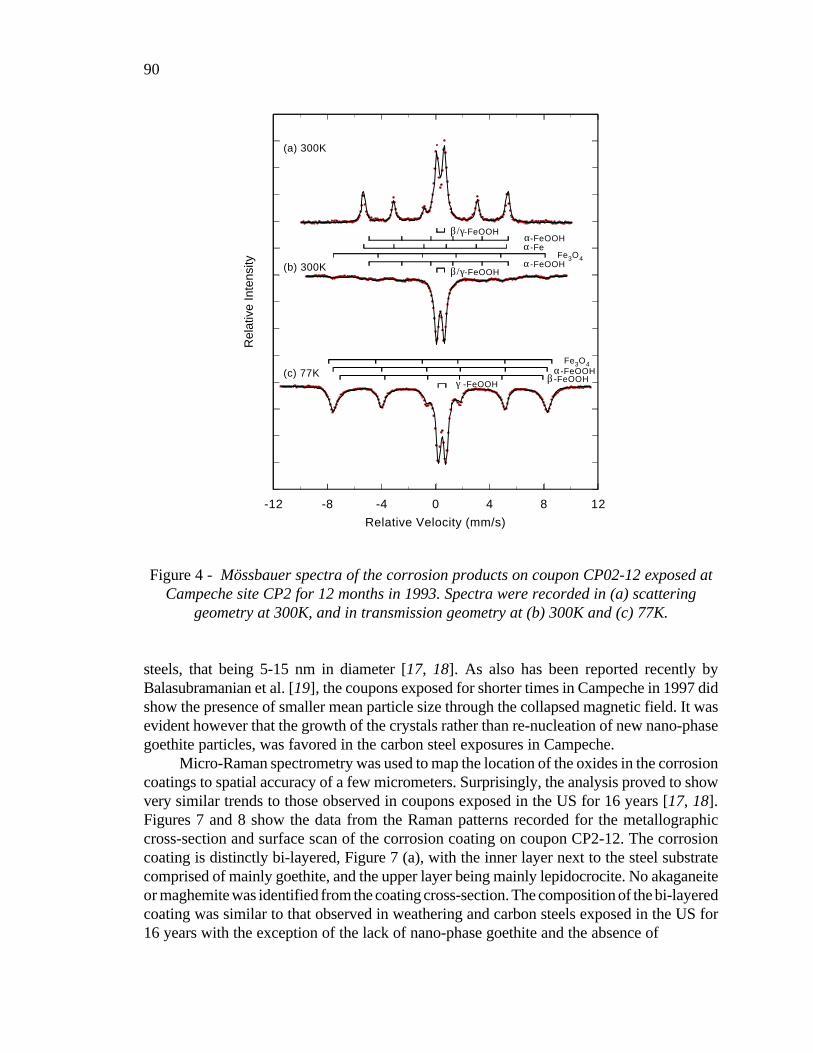
Mössbauer analysis was performed to complete the identification of the oxides and tomeasure the fraction of each in the corrosion coating of each carbon steel coupon. Thespectra of coupons CP2-12, CP3-07 exposed in 1993 and coupon CP2-36 exposed for 9months in 1997 are shown in Figures 4-6 respectively. The scattering Mössbauer spectrashow a large magnetic sextet due to the steel substrate which was being probed through thecorrosion coating. However magnetic and non-magnetic oxides are present in the coatings.From the transmission spectra recorded at room temperature, significant differences can beseen between the coupons exposed in 1993 and 1997. The earlier exposed coupons contain

89
Rel
ativ
e In
tens
ity
Figure 3 - X-ray diffraction pattern of the corrosion products on carbon steel couponCP3-07 exposed at Campeche in 1993.
the magnetic sextet of goethite at 300K , Figures 4(b) and 5(b), indicating the particle size atleast 40 nm. The coupons exposed in 1997 showed only a non-magnetic doublet, Figure 6(a),indicating that if goethite was present, its was exhibiting superparamagnetism and had particlesize < 40 nm.
For spectra recorded at 77K, a full computer analysis showed that all samples containedlepidocrocite, goethite and maghemite. However the coupons exposed in 1993 also containedakaganeite, confirming the X-ray diffraction identification. No akaganeite was identified inany coupons exposed in 1997. Table 7 summarizes the fraction of each oxide identified byMössbauer spectroscopy. Lepidocrocite was the most abundant oxide, 43%, to form after 12months at site CP2 in 1993. Nearly equal fractions of goethite and akaganeite was alsopresent. However in the same year and in the presence of higher chloride concentrations atsite CP3, the coupon exposed for just 7 months contained 43% akaganeite and nearly equalfractions of lepidocrocite and goethite. The magnetic field for the goethite in these couponswas measured to be about 50 T confirming that the goethite particle size was > 40 nm. Thelow temperature spectrum for the coupon exposed at CP2 in 1997 confirmed the presence ofgoethite, but with a reduced magnetic field of 43 T. This indicated that goethite was presentwith reduced particle size, in the order of 20 nm. It should be noted that this particle size isstill larger than that of the goethite formed in the inner protective layer of HSLA
90
-12 -8 -4 0 4 8 12
Relative Velocity (mm/s)
Rel
ativ
e In
tens
ity
(a) 300K
(b) 300K
(c) 77K
α
α
-FeOOH
-FeOOH
β/γ-FeOOH
β/γ-FeOOH
α-FeOOHFe3O4
β -FeOOHγ -FeOOH
Fe3O4
α-Fe
Figure 4 - Mössbauer spectra of the corrosion products on coupon CP02-12 exposed atCampeche site CP2 for 12 months in 1993. Spectra were recorded in (a) scattering
geometry at 300K, and in transmission geometry at (b) 300K and (c) 77K.
steels, that being 5-15 nm in diameter [17, 18]. As also has been reported recently byBalasubramanian et al. [19], the coupons exposed for shorter times in Campeche in 1997 didshow the presence of smaller mean particle size through the collapsed magnetic field. It wasevident however that the growth of the crystals rather than re-nucleation of new nano-phasegoethite particles, was favored in the carbon steel exposures in Campeche.
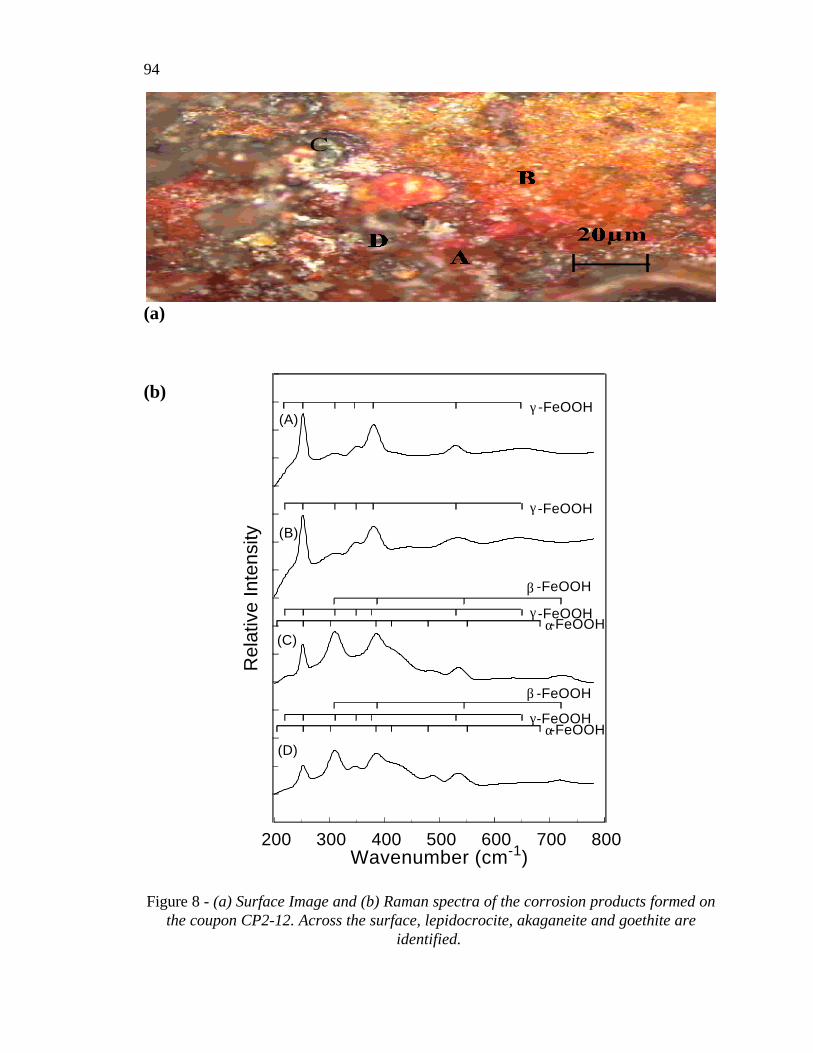
Micro-Raman spectrometry was used to map the location of the oxides in the corrosioncoatings to spatial accuracy of a few micrometers. Surprisingly, the analysis proved to showvery similar trends to those observed in coupons exposed in the US for 16 years [17, 18].Figures 7 and 8 show the data from the Raman patterns recorded for the metallographiccross-section and surface scan of the corrosion coating on coupon CP2-12. The corrosioncoating is distinctly bi-layered, Figure 7 (a), with the inner layer next to the steel substratecomprised of mainly goethite, and the upper layer being mainly lepidocrocite. No akaganeiteor maghemite was identified from the coating cross-section. The composition of the bi-layeredcoating was similar to that observed in weathering and carbon steels exposed in the US for16 years with the exception of the lack of nano-phase goethite and the absence of

91
-12 -8 -4 0 4 8 12Relative Velocity (mm/s)
Rel
ativ
e In
tens
ity
(a) 300K
(b) 300K
(c) 77K
α
α
-FeOOH
-FeOOH
β/γ-FeOOH
β/γ-FeOOH
α-FeOOHFe3O4
β -FeOOHγ -FeOOH
Fe3O4
α-Fe
Figure 5 - Mössbauer spectra of the corrosion products on coupon CP03-07 exposed atCampeche site CP3 for 7 months in 1993. Spectra were recorded in (a) scattering
geometry at 300K, and in transmission geometry at (b) 300K and (c) 77K.
Table 7 - Percentage of each iron oxide phase in the corrosion coatings of some of thecarbon steel coupons exposed at the three sites in Campeche, México in 1993 and 1997.
Oxide Phase
Site CP1 Site CP2 Site CP3
CP1-18 CP2-12 CP2-36 CP3-07
α-FeOOH 54 28 43 23
β-FeOOH 0 24 0 42
γ-FeOOH 38 43 49 27
Fe3O4/γ-Fe2O3 8 5 8 8

92
- 1 2 - 8 -4 0 4 8 1 2
(b) 7 7 K
( a ) 3 0 0 K
Rel
ativ
e In
tens
ity
R e la tive Ve loc i ty (mm /s)
Figure 6 - Mössbauer spectra of the corrosion products on coupon CP02-36 exposed atCampeche site CP2 for 9 months in 1997.
the maghemite identified in carbon steel exposed at Kure Beach [17]. The surface scan,shown in Figure 8, identified islands of akaganeite, lepidocrocite and goethite across the topof the corrosion coating. At the present time it is not possible to measure the fraction of eachoxide by Raman spectrometry. However it was apparent that the amount of akaganeitemeasured by Mössbauer spectroscopy was not detected by Raman spectrometry. Ramananalysis of the coupons exposed in 1997 showed a similar bi-layered structure having thesame basic composition to that described above. For these coupons however, maghemite wasdetected in the inner layer close to the steel substrate. In a recent publication byBalasubramanian et al. [19], it was shown that the broadened spectral lines indicated thepossibility that the maghemite and goethite in the inner layer were nanophase, 5-15 nm,similar to that identified in the 16 year exposures in the US.
Discussion
Detailed spectroscopic analysis of the corrosion products on all coupons exposed inCampeche has shown that the oxides, predominantly lepidocrocite and goethite, formed at

93
200 300 400 500 600 700 800Wavenumber (cm-1)
Rel
ativ
e In
tens
ity
γ-FeOOH
α-FeOOH
(B)
(A)
(a)
(b)
Figure 7 - (a) Metallographic cross-section, and (b) Raman spectra of the layeredcorrosion products formed on the coupon CP2-12. The (A) inner layer is mainly goethite
and the (B) outer layer consists of lepidocrocite.
94
200 300 400 500 600 700 800Wavenumber (cm-1)
Rel
ativ
e In
tens
ity
γ -FeOOH
β
(B)
(C)
(A)
-FeOOH
γ-FeOOH
(D)
-FeOOHγ
-FeOOHγ-FeOOHα
-FeOOHβ
-FeOOHα
(a)
(b)
Figure 8 - (a) Surface Image and (b) Raman spectra of the corrosion products formed onthe coupon CP2-12. Across the surface, lepidocrocite, akaganeite and goethite are
identified.

95
low exposure times are the same as identified in long-term exposures. The exception was thepresence of akaganeite in the 1993 exposures in contrast to the lack of this phase in the 1997exposures, and also in any of the coupons exposed in the US for 16 years. The distinct oxidelayering seen in long term exposures was already present after a just a few months and itwould be of interest to monitor the development of these layers during longer exposures upto say five years. Such a project is being designed for México and the United States usingcarbon and weathering steels. Information is being sought on the development of thenanophase oxides which appear to be more abundant in the HSLA steels and are believed tobe important in the formation of the adhesive protective layer on these steels.
The presence of large amounts of akaganeite on the coupons exposed at CP2 and CP3in 1993 is not surprising since akaganeite is known to form in chloride containingenvironments. It is believed however that a critical concentration of chloride is required toform the akaganeite, although this has not been confirmed numerically. Certainly twice asmuch akaganeite formed at CP3 due to the high mean chloride concentration of 81 mg/m2dayduring the 7 months exposure, and most likely helped by occasional Gulf storms whichsaturated the coupons with seawater.
It is difficult to predict if akaganeite should form at site CP2 having a low mean chlorideconcentration of 17 mg/m2 day. It was observed on the coupons in 1993 but not in 1997. Thisshows the need to study monthly climatic conditions during the actual exposure periods ratherthan working with mean values. For example, the coupons exposed in 1993 and 1997 at siteCP2 were in fact subjected to different monthly chloride concentrations even though the meanvalues of all exposure conditions, shown in Table 6, are very similar. In 1993, the CP2coupons were exposed to higher chloride concentrations in the first few months when therainfall was very low. In 1997, the coupons were exposed to the opposite criteria, lowchlorides and high rainfall in the first few months of exposure. This was also true for thecoupons exposed at site CP1 in 1997 and in which akaganeite was not detected.
These data show the possible intervention of another important climatic parameter,rainfall and its frequency of occurrence relative to months of high pollutant deposition.Precipitation is commonly associated with increased time-of-wetness, but in the very humidtropical environments, this is not significant. Alternatively, rainfall is able to wash pollutantsoff the surfaces of exposed materials, thereby decreasing the corrosion rates. It should alsobe noted that the chloride candles are to some extent protected from the rain by a metalliccover as specified by ISO 9225. Therefore the measured chloride concentrations, and otherpollutants, are probably higher that at the coupon surface during months of higherprecipitation. Again this is justification for a much improved surface pollution monitor.
Conclusions
The establishment of many coupon exposure sites in México, and the detailedmeasurement of the climatic and environmental parameters around the Gulf of México, hasprovided valuable information concerning the varied corrosion rates in developing regions.The research has also shown that the effects of industrial pollutants, especially in adversemarine environments can double the local exposure rates, and that measured rather thantheoretically predicted corrosion rates are required for regions of highest corrosionclassification. The measured corrosion rates of different metals are often not in good
96
agreement with those predicted using the environmental parameters, leading to a conclusionthat pollutant measurements at the actual material’s surface should be a future goal toachieve. There is strong evidence that other climatic factors such as frequency of precipitationcan modify the corrosion rates and distort the correlation with theoretical corrosionpredictions and models.
From the viewpoint of correlating corrosion product formation with exposureparameters, it is clear that chlorides control the formation of akaganeite and that predictingits formation from measurement of airborne chloride concentration is difficult. Indeed thepresent data indicates that locally high chloride concentrations must be present on the steelsurface for some period of time for appreciable quantities of akaganeite to form.Spectroscopic analysis of the coupons exposed in Campeche continues to build the data-baseof information concerning the formation of nanophase oxides, particularly goethite, ondifferent steels. The present data support the findings of exposure programs in the UnitedStates that only small fractions of nanophase goethite form on atmospherically exposedcarbon steels, possibly resulting in the exfoliation of the corrosion coating and subsequentexposure of the bare metal to the environment.
Acknowledgment and Disclaimer
Some of the material is based upon work supported by the National ResearchFoundation under Grant No. 9602990. Any opinions, findings, and conclusions expressed inthis material are those of the authors and do not necessarily reflect the views of the NationalScience Foundation.
References
[1] Climates, National Maps of México, Map IV.4.7, (1992), Institute of Geography, University of México, México City, Mx.
[2] National Meteorological Stations, National Maps of México, Map IV.4.2, (1992), Institute of Geography, University of México, México City, Mx.
[3] Reyes, J., “Influences of the main climatic factors and the quality of the air on the atmospheric corrosion of metals in the southeast coast of the Gulf of México.” MS Thesis, University of Veracruzana, July 1999.
[4] Condensed Matter and Materials Physics Web Site, Old Dominion University, www.physics.odu.edu/~cmmp/mx.
[5] Kanuga, K. K., “Atmospheric Pollution Potential in the Republic of México,” Department of Physics, University of Veracruzana, Xalapa, Ver, Mx. 1984.
[6] Bravo, A. H. and Torres, J. P., “Gulf of México: Contamination and Environmental Impact,” University of Campeche, EPOMEX Scientific Series Vol. 5, 1996.
[7] PEMEX-Petrochemical, “Preliminary Design for the Study of the Effects of the Contamination in the Deterioration of the Metals in the Petrochemical Complexes ofthe Industrial area of Coatzacoalcos,” 1994.
[8] Reyes, J. and Perez, T., “Study of the Influence of the Seasonal Variations in the Rate of Atmospheric Corrosion of the Steel in the City of Campeche,” Corrosion Program
97
of the Gulf of México, Autonomous University of Campeche. Campeche, Camp. México, 1998.
[9] Genescá, J. and Rodriguez, C., “Calibration of the Atmospheric Aggressiveness,” First International Workshop of Metallic Corrosion. CONACYT-CINVESTAV (Mérida), Mérida, Yuc. México, 1990.
[10] Felliú, S., Morcillo, M., and Felliu, S. Jr., “The Prediction of Atmospheric Corrosion from Meteorological and Pollution Parameters-I. Annual Corrosión.” Corrosion Science. Vol. 34, No. 3, pp. 403-414, 1993.
[11] Felliú, S. and Morcillo, M., “Corrosion and Protection of Metals in the Atmosphere.” Ed. Bellaterra S.A., Barcelona, Spain, 1982.
[12] Pereyra, D. Natividad, M. A., Sosa, I., and Reyes, J., “Statistical Model to Estimate the Concentration of NaCl and SO2, of Atmospheric Corrosion in Xalapa Veracruz,” Méxican Geophysical Union, D.F., 1996.
[13] Morup, S., Dumesic, J. A., and Topsoe, H., Applications of Mössbauer Spectroscopy, Vol II, R. L. Cohen, Ed., Academic Press, New York, 1980.
[14] Oh, S. J., Cook, D. C., and Townsend, H. E., “Atmospheric Corrosion of Different Steels in Marine, Rural and Industrial Environments.” Corrosion Science, Vol. 41, No. 9, 1999, pp. 1687-1702.
[15] Balasubramanian, R., Old Dominion University, personal communication, 1999.[16] Oh, S. J., Cook, D. C., and Townsend, H. E., “Characterization of Iron Oxides
Commonly Formed as Corrosion Products on Steel.” Hyperfine Interactions, Vol. 112, 1998, pp. 59-65.
[17] Cook, D, C., Oh, S. J., and Townsend, H. E., “The Protective Layer Formed on Steels after 16 Years of Atmospheric Exposure,” Corrosion/98, paper 343, 1998, NACE International, Houston, TX.
[18] Cook, D. C., Oh, S. J., Balasubramanian, R., and Yamashita, M., “The Role of Goethite in the Formation of the Protective Corrosion Layers on Steels,” Hyperfine Interactions, Vol. 122, 1999, pp.59-70.
[19] Balasubramanian, R., Cook, D. C., Perez, T., and Reyes, J., “Development of Nano- phase Iron Oxides from Short-term Atmospheric Corrosion of Carbon Steel,” Corrosion/2000, paper 453, 2000, NACE International, Houston, TX.
Related Documents


![Ao Atmospheric Corrosion - [DePa] Departamento de ...depa.fquim.unam.mx/labcorr/publicaciones/AtmosphericCorrosion.pdf · Ao Atmospheric Corrosion M. TULLMIN ... Atmospheric corrosion](https://static.cupdf.com/doc/110x72/5b78a8f87f8b9a331e8c0cd9/ao-atmospheric-corrosion-depa-departamento-de-depafquimunammxlabcorrpublicaciones.jpg)
