Atmospheric Environment 39 (2005) 2309–2322 Atmospheric concentrations and deposition of organochlorine pesticides in the US Mid-Atlantic region Rosalinda Gioia a, , John H. Offenberg a , Cari L. Gigliotti b , Lisa A. Totten a , Songyan Du a , Steven J. Eisenreich c a Department of Environmental Sciences, Rutgers, The State University of New Jersey, 14 College Farm Road, New Brunswick, NJ 08901, USA b Department of Chemistry, Brookdale College, 765 Newman Spring Road, Lincroft, NJ 07738, USA c Joint Research Centre: Inland and Marine Waters, TP 290, Ispra, Varese I-21020, Italy Received 1 September 2004; accepted 7 December 2004 Abstract Organochlorine pesticides (OCPs) were measured in the atmosphere over the period January 2000–May 2001 at six locations as part of New Jersey Atmospheric Deposition Network (NJADN). Gas phase, particle phase and precipitation concentrations of 22 OCP species, including chlordanes, DDTs, HCHs, endosulfan I and II, aldrin and diedrin, were measured. OCPs are found predominantly in the gas phase in all seasons, representing over 95% of the total air concentrations. Most of the pesticides measured display highest concentrations at urban sites (Camden and New Brunswick), although in many cases the differences in geometric mean concentrations are not statistically significant. The relationship of gas-phase partial pressure with temperature was examined using the Clausius–Clapeyron equation; significant temperature dependencies were found for all OCPs, except aldrin. Atmospheric depositional fluxes (gas absorption into water+dry particle deposition+wet deposition) to the New York–New Jersey Harbor Estuary of selected OCPs were estimated at NJADN sites. Atmospheric concentrations of dieldrin, aldrin and the HCHs are similar to those measured by the Integrated Atmospheric Deposition Network (IADN) in the Great Lake Region. In contrast, concentrations of DDTs, chlordanes and heptachlor are higher in the Mid-Atlantic compared to the Great Lakes, suggesting that the New York–New Jersey Harbor Estuary receives higher fluxes of these chemicals than the Great Lakes. r 2005 Elsevier Ltd. All rights reserved. Keywords: Organochlorine pesticides; Atmospheric deposition; Volatilization; Clausius–Clapeyron equation; Enthalpy of the environment 1. Introduction Organochlorine pesticides (OCPs) were widely used in North America until the 1970s when many were banned. Information on the global distribution of these com- pounds has increased during the last 20 years, due to their persistence in the environment, which allows them to be transported over great distances. As a result, OCPs ARTICLE IN PRESS www.elsevier.com/locate/atmosenv 1352-2310/$ - see front matter r 2005 Elsevier Ltd. All rights reserved. doi:10.1016/j.atmosenv.2004.12.028 Corresponding author. Current address: Department of Environmental Science, Institute of Environmental and Natural Science, Lancaster University, Lancaster LA1 4YQ, UK. Tel.: +44 1524 593974; fax: +44 1524 593985. E-mail address: [email protected] (R. Gioia).

Welcome message from author
This document is posted to help you gain knowledge. Please leave a comment to let me know what you think about it! Share it to your friends and learn new things together.
Transcript

ARTICLE IN PRESS
1352-2310/$ - se
doi:10.1016/j.at
�CorrespondEnvironmental
Science, Lanca
Tel.: +441524
E-mail addr
Atmospheric Environment 39 (2005) 2309–2322
www.elsevier.com/locate/atmosenv
Atmospheric concentrations and deposition of organochlorinepesticides in the US Mid-Atlantic region
Rosalinda Gioiaa,�, John H. Offenberga, Cari L. Gigliottib, Lisa A. Tottena,Songyan Dua, Steven J. Eisenreichc
aDepartment of Environmental Sciences, Rutgers, The State University of New Jersey, 14 College Farm Road,
New Brunswick, NJ 08901, USAbDepartment of Chemistry, Brookdale College, 765 Newman Spring Road, Lincroft, NJ 07738, USA
cJoint Research Centre: Inland and Marine Waters, TP 290, Ispra, Varese I-21020, Italy
Received 1 September 2004; accepted 7 December 2004
Abstract
Organochlorine pesticides (OCPs) were measured in the atmosphere over the period January 2000–May 2001 at six
locations as part of New Jersey Atmospheric Deposition Network (NJADN). Gas phase, particle phase and
precipitation concentrations of 22 OCP species, including chlordanes, DDTs, HCHs, endosulfan I and II, aldrin and
diedrin, were measured. OCPs are found predominantly in the gas phase in all seasons, representing over 95% of the
total air concentrations. Most of the pesticides measured display highest concentrations at urban sites (Camden and
New Brunswick), although in many cases the differences in geometric mean concentrations are not statistically
significant. The relationship of gas-phase partial pressure with temperature was examined using the Clausius–Clapeyron
equation; significant temperature dependencies were found for all OCPs, except aldrin. Atmospheric depositional fluxes
(gas absorption into water+dry particle deposition+wet deposition) to the New York–New Jersey Harbor Estuary of
selected OCPs were estimated at NJADN sites. Atmospheric concentrations of dieldrin, aldrin and the HCHs are
similar to those measured by the Integrated Atmospheric Deposition Network (IADN) in the Great Lake Region. In
contrast, concentrations of DDTs, chlordanes and heptachlor are higher in the Mid-Atlantic compared to the Great
Lakes, suggesting that the New York–New Jersey Harbor Estuary receives higher fluxes of these chemicals than the
Great Lakes.
r 2005 Elsevier Ltd. All rights reserved.
Keywords: Organochlorine pesticides; Atmospheric deposition; Volatilization; Clausius–Clapeyron equation; Enthalpy of the
environment
e front matter r 2005 Elsevier Ltd. All rights reserve
mosenv.2004.12.028
ing author. Current address: Department of
Science, Institute of Environmental and Natural
ster University, Lancaster LA1 4YQ, UK.
593974; fax: +44 1524 593985.
ess: [email protected] (R. Gioia).
1. Introduction
Organochlorine pesticides (OCPs) were widely used in
North America until the 1970s when many were banned.
Information on the global distribution of these com-
pounds has increased during the last 20 years, due to
their persistence in the environment, which allows them
to be transported over great distances. As a result, OCPs
d.

ARTICLE IN PRESSR. Gioia et al. / Atmospheric Environment 39 (2005) 2309–23222310
have also been found in the Artic (Bidleman et al., 2002;
Hung et al., 2002) and have been shown to bioaccumu-
late and biomagnify in animals of higher trophic levels
such as whales, seals, polar bears and humans (Halsal et
al., 1998; Kucklick and Baker, 1998; Muir et al., 1996).
Although the use of these compounds has been
eliminated in most western industrialized countries,
many of them are still in use in Africa and South and
Central America (Alegria et al., 2000; Janunten et al.,
2000). Several long-term studies have shown that the
concentration of OCPs in the atmosphere of the
Northern Hemisphere has diminished over the last 10
years (Cortes et al., 1998, 1999). However, 20 years after
they were banned, OCPs remain ubiquitous in the
environment. Therefore, transport from countries south
of the USA border and re-emission from soils due to
Fig. 1. Sites of the NJADN. OCP concentrations are reported for Jer
Delaware Bay.
past usage support measurable levels of these com-
pounds in the Northern Hemisphere (Hoff et al.,
1992a, b; Janunten et al., 2000).
The New Jersey Department of Environmental
Protection (NJDEP) conducted an historical review of
OCP use in New Jersey in order to provide insight into
the type and the possible geographical extent of
potential residual pesticide contamination (NJDEP,
1999). DDT (including DDD and DDE), aldrin and
dieldrin were considered ‘‘pesticides of concern’’ because
these groups are among the most widely used pesticides
over the last century. Heptachlor (HEPT), chlordanes
and endosulfan (I and II) were also included in this
study (NJDEP, 1999).
Atmospheric concentrations of OCPs have been
measured in Alabama and South Carolina, where the
sey City, New Brunswick, Sandy Hook, Pinelands, Camden and

ARTICLE IN PRESSR. Gioia et al. / Atmospheric Environment 39 (2005) 2309–2322 2311
past usage of these compounds was widespread, and in
the Great Lakes Region, where the atmosphere can
serve as a pathway for the delivery of these pollutants to
water and terrestrial surfaces (Bidleman et al., 1998a, b;
Cortes et al.,1998; Harner et al., 1999; Hillery et al.,
1998; Janunten et al., 2000; Leone et al., 2001;
McConnell et al., 1996).
However, little research has been conducted on
chlorinated pesticides in the air of the Mid-Atlantic
region of the United States. A research and monitoring
network, NJADN (New Jersey Atmospheric Deposition
Network), was established in 1997 in order to assess the
fate and transport of persistent organic pollutants,
including PAHs (polycyclic aromatic hydrocarbons),
PCBs (polychlorinated biphenyls) and OCPs, in coastal,
urban, suburban and rural locations in the Mid-Atlantic
area (Brunciak et al., 2001; Gigliotti et al., 2000, 2002;
Van Ry et al., 2002; Offenberg et al., 2004; Totten et al.,
2004).
This work will use data from NJADN (i) to assess the
occurrence and spatial variability of OCP concentra-
tions, (ii) to investigate the seasonality associated with
the OCP concentrations, (iii) to estimate atmospheric
deposition fluxes (wet+dry+gas absorption) of selected
OCPs to the New York–New Jersey Harbor Estuary
(Fig. 1).
2. Methodology
2.1. Sampling and site characterization
Air samples were collected at six different locations in
New Jersey representing different land-use regimes:
suburban (New Brunswick), coastal/marine (Sandy
Hook and Delaware Bay), urban/industrial (Jersey City
and Camden) and rural/forested (Pinelands). Detailed
descriptions of these sites can be found in Brunciak et al.
(2001), Gigliotti et al. (2000, 2002), Van Ry et al. (2002),
Offenberg et al. (2004) and Totten et al. (2004).
Twenty-four hour integrated air samples were col-
lected every 12 days over the period January 2000–May
2001. At each site, modified Tisch Environmental High
volume air samplers operated at a calibrated air flow
rate of �500Lmin�1 in order to collect both particulate
and gas phase of SOCs including PCBs, PAHs and
OCPs.
2.2. Sample processing
Details of the analysis can be found in Gioia (2004)
and the publications above. The particulate phase was
captured on pre-combusted quartz fiber filters (QFF)
and the gas phase was captured on polyurethane foam
(PUF). QFFs were pre- and post-weighed under
temperature and humidity control to determine total
suspended particulates (TSP).
All samples were spiked with a surrogate standard
containing d10-anthracene, d10-fluoranthene and d12-
benzo[e]pyrene for PAHs and PCB14, PCB23, PCB65
and PCB166 for PCBs. Each was extracted in Soxhlet
apparatus for 24 h, the PUFs in petroleum ether and
QFFs with dichloromethane. The extracts were concen-
trated using rotoevaporation and nitrogen evaporation.
Wet-only precipitation collectors were employed
(MIC, Ontario) to collect precipitation in 0.212m2
stainless-steel funnels that drained through a column
containing XAD-2 resin. The volume of filtered rain was
measured at the end of each 24-day sampling period and
varied from 2.7 to 20L. XAD rain samples were
extracted in acetone:hexane (1:1 by volume) in Soxhlet
apparatus for 24 h after the addition of surrogates to
gauge analytical recoveries. The extracts were liquid–li-
quid extracted with 60mL deionized water. The aqueous
fractions were back-extracted with 3� 50mL hexane in
separatory funnels containing 1 g sodium chloride. The
samples were then concentrated by rotoevaporation and
treated in the same manner as air and water samples.
Each sample was eluted on a 3% water-deactivated
alumina column. Fraction 1, which contains PCBs and
some chlorinated pesticides (o,p0-DDE, HEPT, aldrin,
p,p0-DDE, o,p0-DDT), was eluted with 13mL hexane.
Fraction 2, which contains PAHs and some chlorinated
pesticides (trans- and cis-chlordanes (TC and CC), trans-
and cis-nonachlors (TN and CN), dieldrin, p,p0-DDT,
o,p0-DDT), was eluted with 15mL 2:1 dichlorometha-
ne:hexane. Fractions were reduced in volume to
�0.5mL under N2 gas. Both fractions were spiked with
internal standard consisting of PCB30 and PCB204,
while Fraction 2 was also spiked with internal standard
consisting of d10-phenanthrene, d10-pyrene, and d12-
benzo[a]pyrene. Both fractions were analyzed for OCPs.
PCB204 was used as the internal standard for OCPs
analysis. Surrogate recoveries were calculated for Frac-
tion 1 by using PCB166 and ranged from 90% to 105%;
however, it was not possible to calculate surrogate
recoveries for the F2 fractions due to the poor response
of PAHs in NCI mode. However, surrogate recoveries
for PAHs ranged from 70% to 98% when analyzed in
the gas chromatography/mass spectrometry/electron
impact (GC/MS/EI) mode. Due to the high surrogate
recoveries, analyte amount were not corrected for
surrogate extraction efficiencies.
The OCPs were analyzed using gas chromatography/
mass spectrometry in negative chemical ionization (GC/
MS-NCI) operating in selective ion monitoring mode
using a Hewlett Packard 6890 GC coupled to a Hewlett
Packard 5973 Mass Selective Detector and a
30m� 0.25mm i.d., J&W Scientific 122-5062 DB-5
(5% diphenyl-dimethylpolysiloxane) capillary column
with a film thickness of 0.25mm. The ratio of the

ARTICLE IN PRESSR. Gioia et al. / Atmospheric Environment 39 (2005) 2309–23222312
primary ion to the secondary ion in samples was taken
as 720% of the ratio that was in the calibration
standard. The mass of each OCP was determined and
quantified based on relative response factor, which was
calculated from five standards of varying concentration
(1 –100 ngml�1).
2.3. Quality assurance/quality control
Field blanks, laboratory blanks and matrix spikes
were included at a rate of 15%, 10% and 5%,
respectively. No OCPs were detectable in the laboratory
and field blanks at the MDLs. Therefore, instrumental
detection limits were calculated for each analyte using a
series of seven dilutions of the lowest (1 ngml�1)
calibration standard; the series of dilutions were
analyzed seven times and the MDL was taken as t
value� standard deviation of the data set of the
solution where the response of the instrument is no
longer linear. MDLs ranged from 1.2 pg for o,p0-DDT
to 78 pg for p,p0-DDD. At a typical sample volume of
600m3, instrumental detection limits would be 0.002–
0.13 pgm�3 for o,p0-DDT and p,p0-DDD, respectively.
Recovery for target analyte (HEPT, p,p0-DDT, p,p0-
DDE and o,p0-DDT) spike samples (matrix spike) range
from about 70% for p,p0-DDT and 112% for HEPT.
Replicates of samples were also analyzed at the end of
each run in order to calculate precision. The precision
was calculated as the square root of the sum of variance
of all replicates divided by the mean concentrations of
pesticides and was 10–15% for all compounds. Split
PUFs were used to quantify breakthrough of gas-phase
OC pesticides. The bottom half accounted for 1575%(n ¼ 4) of the total mass with the greatest breakthrough
occurring for a-HCH (40–50%). Breakthrough was
lower for other pesticides: 3–25% for g-HCH and
1–2% for chlordanes. Since a-HCH breakthrough was
found to be relatively high, a-HCH concentrations
reported in this study are minimum estimates.
2.4. Framework for deposition calculations
High volume air samplers employed in this study
collected a bulk dry atmospheric particle sample. The
dry deposition flux is calculated by applying a single
deposition velocity (Vd) to the bulk particle phase
Fdry ¼ VdCpart, (1)
where Fdry is the flux (ngm�2 day�1) and Cpart is the
average particle concentration of the chemical (ngm�3).
We selected a value for the Vd of 0.5 cm s�1 that
represents the disproportionate influence that large
particles have on atmospheric deposition, especially in
urbanized and industrialized regions (Franz et al., 1998;
Pirrone et al., 1995a, b) Some Great Lake studies
employed a deposition velocity of 0.2 cm s�1 (Hillery
et al., 1998; Miller et al., 2001). Thus, the choice of Vdrepresents the largest source of error in the calculation
of dry deposition flux. Moreover, Vd may differ between
sites due to changes in particle characteristics. The error
in the dry deposition fluxes is therefore conservatively
estimated to be about 760%.Wet deposition fluxes (Fwet) are estimated as follows:
Fwet ¼ CWVMP, (2)
where CWVM is the volume-weighted mean concentra-
tion of the chemical in precipitation and P is the
precipitation intensity (m yr�1). The standard error of
the volume-weighted mean concentration (see below)
dominates the error in Fwet.
The air–water exchange flux was estimated using the
modified two-layer resistance model developed by
Withman (1923), which assumes that the rate of transfer
is controlled by the compound’s ability to diffuse across
two thin stagnant films at the air–water interface, the
water film and the air film.
The overall flux calculation is defined by
F ¼ vawðCw � Ca=KawÞ, (3)
where F is the flux (ngm�2 day�1), vaw (mday�1) is the
overall mass transfer coefficient and (Cw�Ca/Kaw)
describes the concentration gradient (ngm�3). Cw(ngm�3) is the dissolved phase concentration of the
compound in water. Ca (ngm�3) is the gas-phase
concentration of the compound in air which is divided
by the dimensionless Henry’s Law Constant, Kaw. The
net flux is divided into volatilization (Fgas, vol) and
absorption (Fgas, abs) term as follows:
Fgas; vol ¼ vawCw, (4)
Fgas; abs ¼ vawCa=Kaw. (5)
Only the absorptive gas flux (Eq. (5)) is calculated in
this study, using the gas-phase OCP concentrations
measured at the land-based sites, because Cw was not
available. Fgas, abs was calculated separately for each day
of sample collection, and the results are averaged to
yield an annual average of Fgas, abs. For all pesticides, the
wind speed was assumed to be constant at 5m s�1
(Totten et al., 2004). Salinity is assumed to be zero, but
an increase in Kaw due to salinity will decrease the gas
absorption flux. The error in the Fgas, abs (Eq. (5))
depends on the uncertainty in Vaw, which is about
740% (Nelson et al., 1998; Bamford et al., 1999, 2001),
and the uncertainty in Ca, which is about 725%. Thepropagated error in Fgas, abs is thus 47%. This figure does
not encompass the error in Kaw because it is assumed to
be a systematic, not random, error (Nelson et al., 1998;
Bamford et al., 1999, 2001). Henry’s Law Constants
were taken from Mackay et al. (1999) and Iwata et al.
ARTICLE IN PRESSR. Gioia et al. / Atmospheric Environment 39 (2005) 2309–2322 2313
(1995) for chlordanes, DDTs and aldrin/dieldrin, from
Suntio et al. (1988) for endosulfans, and from Sahsuvar
et al. (2003) for HCHs. Enthalpies of vaporization for all
compounds except HCH came from Hinckley et al.
(1990); enthalpies of vaporization for HCHs came from
Sahsuvar et al. (2003).
3. Results and discussion
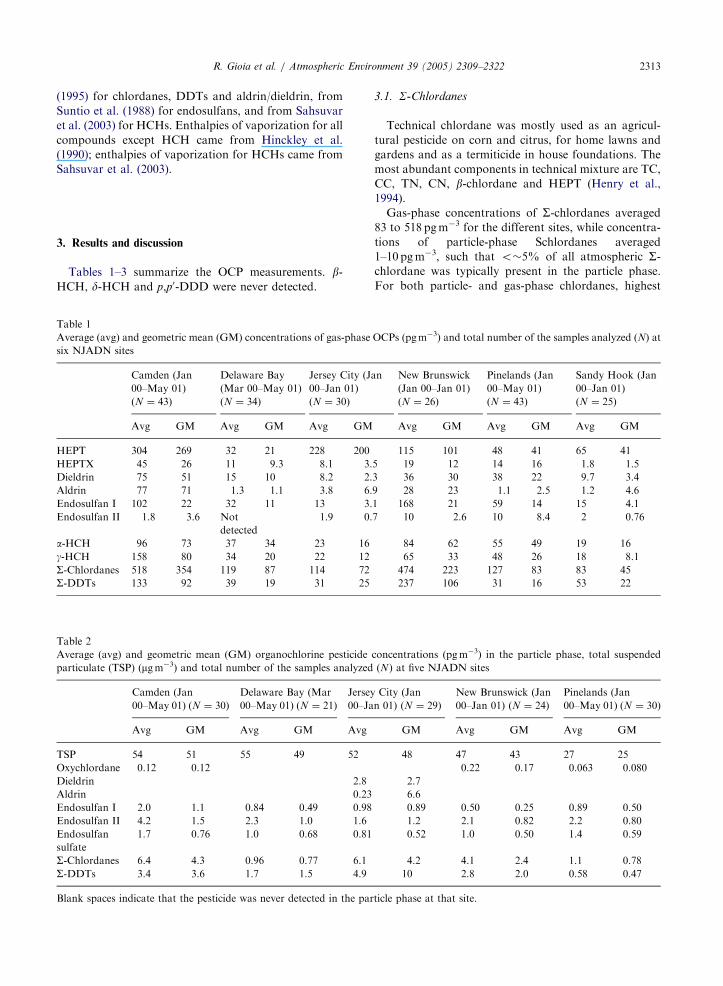
Tables 1–3 summarize the OCP measurements. b-HCH, d-HCH and p,p0-DDD were never detected.
Table 1
Average (avg) and geometric mean (GM) concentrations of gas-phase
six NJADN sites
Camden (Jan
00–May 01)
(N ¼ 43)
Delaware Bay
(Mar 00–May 01)
(N ¼ 34)
Jersey City (Ja
00–Jan 01)
(N ¼ 30)
Avg GM Avg GM Avg GM
HEPT 304 269 32 21 228 200
HEPTX 45 26 11 9.3 8.1 3.
Dieldrin 75 51 15 10 8.2 2.
Aldrin 77 71 1.3 1.1 3.8 6.
Endosulfan I 102 22 32 11 13 3.
Endosulfan II 1.8 3.6 Not
detected
1.9 0.
a-HCH 96 73 37 34 23 16
g-HCH 158 80 34 20 22 12
S-Chlordanes 518 354 119 87 114 72
S-DDTs 133 92 39 19 31 25
Table 2
Average (avg) and geometric mean (GM) organochlorine pesticide
particulate (TSP) (mgm�3) and total number of the samples analyzed
Camden (Jan
00–May 01) (N ¼ 30)
Delaware Bay (Mar
00–May 01) (N ¼ 21)
Jersey
00–Ja
Avg GM Avg GM Avg
TSP 54 51 55 49 52
Oxychlordane 0.12 0.12
Dieldrin 2.8
Aldrin 0.23
Endosulfan I 2.0 1.1 0.84 0.49 0.98
Endosulfan II 4.2 1.5 2.3 1.0 1.6
Endosulfan
sulfate
1.7 0.76 1.0 0.68 0.81
S-Chlordanes 6.4 4.3 0.96 0.77 6.1
S-DDTs 3.4 3.6 1.7 1.5 4.9
Blank spaces indicate that the pesticide was never detected in the par
3.1. S-Chlordanes
Technical chlordane was mostly used as an agricul-
tural pesticide on corn and citrus, for home lawns and
gardens and as a termiticide in house foundations. The
most abundant components in technical mixture are TC,
CC, TN, CN, b-chlordane and HEPT (Henry et al.,
1994).
Gas-phase concentrations of S-chlordanes averaged83 to 518 pgm�3 for the different sites, while concentra-
tions of particle-phase Schlordanes averaged
1–10 pgm�3, such that o�5% of all atmospheric S-chlordane was typically present in the particle phase.
For both particle- and gas-phase chlordanes, highest
OCPs (pgm�3) and total number of the samples analyzed (N) at
n New Brunswick
(Jan 00–Jan 01)
(N ¼ 26)
Pinelands (Jan
00–May 01)
(N ¼ 43)
Sandy Hook (Jan
00–Jan 01)
(N ¼ 25)
Avg GM Avg GM Avg GM
115 101 48 41 65 41
5 19 12 14 16 1.8 1.5
3 36 30 38 22 9.7 3.4
9 28 23 1.1 2.5 1.2 4.6
1 168 21 59 14 15 4.1
7 10 2.6 10 8.4 2 0.76
84 62 55 49 19 16
65 33 48 26 18 8.1
474 223 127 83 83 45
237 106 31 16 53 22
concentrations (pgm�3) in the particle phase, total suspended
(N) at five NJADN sites
City (Jan
n 01) (N ¼ 29)
New Brunswick (Jan
00–Jan 01) (N ¼ 24)
Pinelands (Jan
00–May 01) (N ¼ 30)
GM Avg GM Avg GM
48 47 43 27 25
0.22 0.17 0.063 0.080
2.7
6.6
0.89 0.50 0.25 0.89 0.50
1.2 2.1 0.82 2.2 0.80
0.52 1.0 0.50 1.4 0.59
4.2 4.1 2.4 1.1 0.78
10 2.8 2.0 0.58 0.47
ticle phase at that site.

ARTICLE IN PRESS
Table 3
Volume-weighted mean concentrations (VWM, pgL�1), standard error of the mean (SEM, pgL�1) for pesticides in precipitation
samples and total number of the samples analyzed at NJADN sites
Camden (Jan 00–May 01)
(N ¼ 12)
Jersey City (Jan 00–Jan 01)
(N ¼ 13)
Pinelands (Jan 00–May 01)
(N ¼ 30)
VWM SEM VWM SEM VWM SEM
Endosulfan I 154 57 46 21 153 82
Endosulfan II 788 327 293 130 283 80
Endosulfan sulfate 444 140 219 70 378 68
Oxychlordane 3.2 1.2 3.3 1.6 8.3 5.9
S-DDTsa 190 75 367 184 58 19
S-Chlordanes 173 40 182 55 66 8.3
a4,40-DDT was the only DDT compound detected in precipitation samples.
R. Gioia et al. / Atmospheric Environment 39 (2005) 2309–23222314
concentrations were typically observed at Camden and
New Brunswick, while Delaware Bay displays the lowest
S-chlordane concentrations. Particle-phase S-chlordaneconcentrations were also high at Jersey City. In the
precipitation phase, VWM concentrations were lowest
at Pinelands and significantly higher at Jersey City and
Camden.
High atmospheric S-chlordanes levels are likely to beassociated with past pesticide use. High S-chlordanelevels at New Brunswick are therefore not surprising, as
this site is located nearby fields used in agricultural
research. High OCP levels observed in Camden may be
due to its location downwind of rich agricultural areas in
eastern Pennsylvania, and to use and storage in the
urban area. Similarly, Harner et al. (2004) and Eitzer
et al. (2003) reported high air concentration of chlordane
in urban areas, possibly resulting from previous usage of
chlordane in house foundations.
Gas-phase S-chlordanes at most of the New Jersey
sites were similar to concentrations measured in Toronto
over the period July–October 2000 (about 90 pgm�3)
(Harner et al., 2004), in Alabama during 1996–1997
(98 pgm�3) (Janunten et al., 2000) and in South
Carolina during 1994–1995 (180 pgm�3) (Bidleman
et al., 1998a, b). In contrast, concentrations of S-chlordanes were generally lower (averagingo40 pgm�3)
at remote sites around the Great Lakes during
1996–1998 (Buehler et al., 2001), in the Cornbelt region
of the US during 1996–1997 (56 pgm�3) (Leone et al.,
2001) and around Lake Baikal in Russia during June
1991 (5 pgm�3) (McConnell et al., 1996). S-Chlordanesare higher in the Mid-Atlantic region than in the Great
Lakes area, suggesting that the New York–New Jersey
Harbor Estuary receives higher inputs of these chemicals
per unit area than the Great Lakes (Table 4).
Atmospheric deposition of chlordanes is dominated
by gas absorption, with dry and wet deposition
comprising o10% of the total inputs. Given the
estimated 47% uncertainty in the gas absorption fluxes,
significant differences in fluxes are apparent. Although
differences in gas absorption between the sites may not
be statistically significant, it is reasonable to assume that
higher atmospheric concentrations will lead to higher
deposition fluxes (although differences in particle size
distributions, wind speeds and salinity of receiving
waters can shift spatial deposition patterns).
3.2. HEPT and heptachlor epoxides (HEPTX)
HEPT is an organochlorine cyclodiene insecticide,
first isolated from technical chlordane in 1946. During
the 1960s and 1970s, it was used primarily in termite, ant
and soil insect control in seed grains and on crops, as
well as well as in the home. An important metabolite of
HEPT is HEPTX, which is an oxidation product formed
in many plant and animal species (Duerksen-Hughen
et al., 1993). HEPT is a moderately toxic compound in
EPA toxicity class II. Phase out of HEPT use began in
1978 and all but one use was cancelled in the US in 1988.
The only commercial use still permitted is for fire ant
control in power transformers. HEPT is still available
outside the US; HEPT is transformed in the environ-
ment by several pathways. Photolysis yields photohep-
tachlor and HEPTX, both of which are persistent,
bioaccumulative and toxic (Bidleman et al., 1998a, b).
Neither HEPT nor HEPTX were detected in the
particle phase. As with the chlordanes, HEPT and
HEPTX gas-phase concentrations were generally higher
at Camden and New Brunswick (Fig. 2a, Table 1),
although in contrast to the chlordanes, HEPT and
HEPTX levels were high at Jersey City as well. The
highest concentration at the urban sites Camden and
Jersey City may be associated with current use of HEPT.
These concentrations are well above the averages of 1.2
and 7.4 pgm�3 of HEPT and HEPTX, respectively,
measured by Integrated Atmospheric Deposition Net-
work (IADN) near Lake Superior in 1996 and 1997
(Buehler et al., 2001). Leone et al. (2001) measured an

ARTICLE IN PRESS
Table 4
Mean (geometric mean) atmospheric concentrations (pgm�3) of organochlorine pesticides in the Southern US, in New Jersey and
Great Lakes Regions
S-HCHs S-Chlordanes Dieldrin S-DDTs
NJADN 2000
Camden 254 518 75 133
Delaware Bay 71 119 15 39
Jersey City 44 111 8.2 25
New Brunswick 149 474 36 237
Pinelands 103 127 38 31
Sandy Hook 36 79 9.3 42
IADN 1996–1998a
Chicago 130 130 130 71
Sturgeon Point 82 38 19 31
Sleeping Bear Dunes 99 14 15 11
Brule River 89 7.8 8.4 2.9
Eagle Harbor 96 8.6 8.8 4.4
Alabamab 142 98 38 10
South Carolinac 180
Lake Baikal Russiad 594 4.9 21
Combelt Region, USe 56 3.1 6.3
Indianaf 200
Arkansasf 160
Toronto (Gage)g 107 90 36 109
Egbert (rural/agricultural area near Toronto)g 102 51 76 305
a1996–1998 (Buehler et al., 2001).bJanuary–October 1996 and May 1997 (Janunten et al., 2000).c1994–1995 (Bidleman et al., 1998a, b).dJune 1991 (McConnell et al., 1996).eFall of 1996, spring/fall of 1997 (Leone et al., 2001).f2002–2003 (Hoh and Hites, 2004).gJuly–October 2000 (Harner et al., 2004).
R. Gioia et al. / Atmospheric Environment 39 (2005) 2309–2322 2315
average of 9.3 pgm�3 HEPT in the Cornbelt region of
the US during 1996 and 1997.
Gas absorption was significantly higher at Camden
and New Brunswick and lower at the Delaware Bay site.
Gas absorption of HEPTX was not calculated because a
reliable Kaw for this compound could not be found.
Because HEPT was below detection limit in all particle
and precipitation samples, dry and wet deposition
fluxes were not calculated and assumed to be negligible
(Table 5).
3.3. DDTs
DDT was first used to control disease-spreading
insects and then as a multipurpose insecticide. The peak
of production of DDT in the US was 82 million kg in
1962, and it was deregistered in 1972, except for public
health emergencies. (Faroon et al., 2002).
DDT compounds (p,p0-DDT p,p0-DDE p,p0-DDD
o,p0-DDT o,p0-DDE o,p0-DDD) were detected in most
of the air samples with the exception of p,p0-DDD,
which was consistently below the limits of detection. As
with the chlordanes, gas-phase S-DDT concentrationswere generally highest at New Brunswick and Camden
(Fig. 2a, Table 1). As for the chlordanes, high levels of
S-DDT in New Brunswick are not surprising because ofprobable past usage of OCP pesticides at this location. It
should, however, be noted that DDT was manufactured
at a plant on the Delaware River just south of
Philadelphia, which might explain the high DDT levels
measured in Camden. At the other four sites, the
geometric mean concentration of S-DDTs was about20 pgm�3. The levels of DDTs measured at the New
Jersey sites are similar to those reported for the Great
Lakes by IADN (Table 4) at Chicago and Sturgeon
Point, but higher than levels at the other IADN sites
(Buehler et al., 2001), with the exemption of Camden
and New Brunswick. In contrast, DDT concentrations
at these two sites are in the same range than those
measured in Toronto (Harner et al., 2004). Only p,p0-
DDT was detected in the particle and precipitation
phases (Tables 2 and 3), except at Jersey City, where all

ARTICLE IN PRESS
Aldrin
0
100
200
300
400
500
Dieldrin
0
100
200
300
400
Endosulfan I + II
0
400
800
1200
Heptachlor
Gas
-pha
se c
once
ntra
tion
(pg
m-3
)
0
300
600
ΣChlordanes
0
500
1000
1500
2000
ΣDDTs
0
200
400
600
ΣHCHs
CC DB JC NB PL SH
0
(a)
300
600
900
CC DB JC NB PL
0
15
30
45
Part
icle
-pha
se c
once
ntra
tion
(in
pg/m
3 )
5
20
35
0
15
30
45
(b)
ΣChlordanes
Endosulfan I + II
ΣDDTs
(c) CC JC PL
0
2000
4000
6000
8000
10000
12000
Prec
ipita
tion
conc
entr
atio
n (p
g/L
)
1000
3000
5000
7000
500
1500
2500
3500Endosulfan I + II
ΣChlordanes
ΣDDTs
Fig. 2. (a) Box and whisker plot of (a) gas-phase, (b) particle-phase and (c) precipitation OCP concentrations; upper dot, upper error
bar, upper edge of box, lower edge of box, lower error bar and lower dot represent 95th, 90th, 75th, 25th, 10th and 5th percentile
concentrations, respectively. Within each box, mean and median concentrations are shown as dashed and solid lines, respectively.
R. Gioia et al. / Atmospheric Environment 39 (2005) 2309–23222316
of the DDT compounds were detected in the particle
phase. The fraction of the total atmospheric concentra-
tion of p,p0-DDT that was in the particle phase was
typically about 10%, although at Jersey City the fraction
averaged 58%.
The average DDT/DDE ratio is o1 at all sites,indicating that the relative lack of new sources of DDT
in the atmosphere at the five locations. The average
DDT/DDE ratio ranged from 0.4770.23 at Pinelands
to 0.1870.08 at New Brunswick. By comparison, ratiosof p,p0-DDT/p,p0-DDE are 0.2–0.8 at the Great Lakes
and 0.3–0.8 in the Canadian Artic (Alegria et al., 2000;
Cortes et al., 1998), and 0.17–1.45 in urban and rural
sites in Toronto areas (Harner et al., 2004).
Atmospheric deposition of DDTs is dominated by gas
absorption at most sites. As with chlordanes and HEPT,
high gas-phase concentration levels yield high gas
absorption. Wet+dry deposition constituted o10% of

ARTICLE IN PRESS
Table 5
Atmospheric deposition fluxes (ngm�2 day�1) of select OCPs at NJADN sites
Gas absorption Dry particle deposition Wet deposition
CC DB JC NB PL SH CC DB JC NB PL CC JC PL
a-HCH 47 19 11 43 26 9.7
g-HCH 78 17 11 34 22 9.1
S-HCHs 125 36 23 77 48 19
HEPT 12 0.63 9 5.1 1.74 1.6
Dieldrin 31 6.3 3.5 15 15.0 4.2 1.2
Aldrin 10.8 0.0097 0.61 2.6 0.19 0.20 0.10
Endosulfan I 41 13 5.3 75 21 6.0 0.87 0.36 0.42 0.22 0.39 0.46 0.14 0.46
Endosulfan II 6.5 0 0.80 4.4 3.3 0.80 1.8 1.0 0.70 0.90 0.94 2.4 0.88 0.85
Endosulfan sulfate 0.72 0.44 0.35 0.43 0.60 1.3 0.66 1.1
Oxychlordane 0.052 0.097 0.027 0.0095 0.010 0.025
S-Chlordanes 172 38 38 147 39 27 2.8 0.42 2.7 1.8 0.46 0.52 0.55 0.20
S-DDTs 37 8.3 9.1 62 8.0 14 1.5 0.71 2.1 1.2 0.25 0.57 1.1 0.17
Blank spaces indicate that the pesticide was never detected in that phase at that site.
R. Gioia et al. / Atmospheric Environment 39 (2005) 2309–2322 2317
the total (gas+wet+dry) deposition (Table 5). At
Delaware Bay and Jersey City, dry particle and wet
deposition were significant, together comprising as much
as 34% of the total. S-DDTs fluxes are higher at Mid-Atlantic sites than at IADN sites, suggesting that the
New York–New Jersey Harbor Estuary receives higher
inputs of these chemicals per unit area than the Great
Lakes.
3.4. Aldrin/diedrin
Aldrin and diedrin were used extensively from the
1950s to the 1970s to fight insects on corn, cotton and
citrus crops, and also used as a termiticides. Aldrin is
rapidly metabolized to dieldrin in the environment. In
1972, however, the EPA approved aldrin and dieldrin
for killing termites. Use of aldrin and dieldrin continued
until 1987, when the manufacturer voluntarily cancelled
the registration of aldrin and dieldrin for killing termites
(Hanley et al., 2002).
Gas-phase aldrin concentrations were typically high-
est at Camden and New Brunswick (Fig. 2a, Table 1),
and lower at the other four sites. In contrast, gas-phase
dieldrin concentrations were more evenly distributed
throughout the state and were generally higher than
those of aldrin, consistent with the 1987 final ban of
aldrin use and the conversion of aldrin to dieldrin in the
environment. This suggests that aldrin is declining in the
atmosphere and being metabolized to dieldrin. Dieldrin
levels measured by NJADN were very similar to those
measured in the Cornbelt region of the US (Hoff et al.,
1992a), and by IADN at background sites around the
Great Lakes from 1996 to 1998 (Kallenborn, et al.,
1998) (Table 4). The lowest average concentrations
reported for both networks are about 8–9 pgm�3,
suggesting that this level may represent a regional
(northeastern US) background. Interestingly, this back-
ground concentration was observed at Jersey City, a
heavily urban and industrial area. Aldrin and dieldrin
were not detected in precipitation, and were detected in
the particle phase only at Jersey City (Table 3), where
the particle phase comprised 6% and 25% of the total
atmospheric concentrations of aldrin and dieldrin,
respectively.
Atmospheric deposition of both aldrin and dieldrin is
dominated by gas absorption (Table 5) at all sites, except
Jersey City, where dry deposition comprised about
20–30% of the total.
3.5. a and g-Hexachlorocyclohexanes
Technical HCH is a mixture of a-HCH (60–70%), b-HCH (2–12%) and g-HCH (10–15%) and several otherminor isomers (Iwata et al., 1993).
This technical mixture was used in the US until 1978.
Afterwards, it was substituted by the purified g-HCHisomer (lindane). Lindane has not been manufactured in
the US since 1977, but it is still imported into the
country. Its usage has been restricted by the US EPA to
certified individuals. Lindane is still used for seed
treatments (Walker et al., 1999).
Due to breakthrough of the HCHs during sampling,
the gas-phase concentrations presented here are mini-
mum estimates. Again, gas-phase concentrations of S-HCH (a-HCH+g-HCH) are generally highest at NewBrunswick and Camden (Fig. 2a, Table 1), although
differences between the sites are not statistically
significant. The HCHs were not detected in the particle
or precipitation phases at any of the sites. Average
concentrations of S-HCH measured by IADN (Buehler

ARTICLE IN PRESSR. Gioia et al. / Atmospheric Environment 39 (2005) 2309–23222318
et al., 2001) (Table 4) were similar to levels reported
here. S-HCH concentrations were lower at Jersey City
and Sandy Hook than at the more remote IADN sites,
but this may be an artifact of the breakthrough of a-HCH, which lowered measured gas-phase concentra-
tions in the present study.
Technical HCH mixture typically has a ratio of with
a-HCH/g-HCH ranging from 4 to 7 (Karlsson et al.,
2000). The average a-HCH/g-HCH ratio ranges from
1.371 in Camden to 2.771.8 at the coastal SandyHook. These values are in the same range of those
reported for the NE Atlantic (0.3–4.6) and also for the
Artic (0.9–4.7) (Kelly et al., 1994; Schreitmuller and
Ballschmiter, 1995), indicating that fresh sources of
lindane in New Jersey are unlikely. There is a consistent
seasonal pattern in the a-HCH/g-HCH across New
Jersey. The ratio is o1 during the summer months andincreases to 41 during the winter. The higher concen-tration of lindane observed during the summer probably
arises from differences in the enthalpy of air–surface
exchange between the two compounds (see section on
‘‘Seasonal trends and Relationship with temperature’’
below) or from current usage of lindane. Since g-HCHhas a higher vapor pressure than that of a-HCH, highatmospheric temperature values may accelerate the
volatilization of lindane from surfaces contributing to
higher g-HCH gas-phase concentration in summer.
Because HCHs were not detected in the particle and
precipitation phases, their wet and dry particle deposi-
tion fluxes were not calculated and assumed to be
negligible. As with S-chlordane, S-DDT and aldrin/
dieldrin, the gas absorption was the highest at Camden
and at New Brunswick (42 and 43 ngm�2 day�1,
respectively) as well as the gas-phase atmospheric
concentrations. Again, due to breakthrough of alpha,
the deposition calculations are minimum estimates.
3.6. Endosulfan I and II
Endosulfan is a chlorinated hydrocarbon insecticide
and acaricide of the cyclodiene subgroup, which acts as
a poison to a wide variety of insects and mites on
contact. Endosulfan is a highly toxic pesticide in EPA
toxicity class I. It is a restricted use pesticide (Rama-
narayan and Allen, 2000).
Endosulfan I is the most abundant component in the
mixture and its concentration is always higher than
endosulfan II over all sites in New Jersey. As with many
of the other pesticides, gas-phase concentrations of
endosulfan I were generally highest at Camden and New
Brunswick (Fig. 2a, Table 1). Both endosulfans were
detected in the particle phase at some sites (Table 2),
with the particle phase typically comprising 2–8% and
17–70% of the total atmospheric burdens of endosulfan
I and II, respectively. Both endosulfans were detected in
precipitation (Table 3).
Gas absorption constitutes 490% of the total atmo-
spheric deposition of endosulfan I. Dry and wet
deposition constitute a larger fraction of the total
deposition for endosulfan II because 17–70% of all
atmospheric endosulfan II measured was in the particle
phase, vs. o8% for endosulfan I.
3.7. Dependence of gas-phase OCP concentrations on
temperature
Gas-phase concentrations of most OCPs in New
Jersey were generally higher in summer than winter ,with
the exception of HEPT, which shows a relatively
constant concentration throughout the year. DDT
concentrations were higher between April (mid-spring)
and October (mid-fall) at all sites, with a large
spike of o,p0-DDT in June at the urban Jersey
City site.
The Clausius–Clapeyron equation describes the rela-
tionship between ambient temperature and the gas-
phase partial pressure of semi-volatile organic com-
pounds (Hoff et al., 1992b; Wania et al., 1998)
ln p ¼ �DHenv
RTþ c, (6)
where p is the partial pressure of the compound (Pa),
Henv is a characteristic environmental phase-transition
energy of the compound (kJmol�1), R is the gas
constant (8.314 Pam3mol�1 ¼ kJmol�1) and T is the
temperature (Kelvin). The Clausius–Clapeyron relation-
ship can be expressed graphically as a plot of ln p vs.
1=T : A negative slope was found in all cases where theregression was statistically significant. Aldrin displays
no significant correlation between the gas-phase con-
centration and the 1=T at any of the sites, possibly due
to the small number of samples in which Aldrin was
detected. The negative slopes found for all other
pesticides indicate that the gas-phase concentration
increased with increasing temperature. An increase in
temperature can also affect other environmental
processes that can yield an increase or decrease in
atmospheric gas-phase concentrations of pesticides
such as air/water exchange and volatilization from
terrestrial surfaces. As a result, Henv is useful to
understand the environmental behavior of these com-
pounds. In Table 6Henv for each OCP is compared to its
enthalpies of vaporization (Hvap) and octanol–air
partitioning (Hoa).
All Henv are lower than Hvap and Hoa, which means
that these compounds volatilize more easily from soil
than pure octanol or the pure liquid itself. Gas-phase
concentration of TC, CC, TN, CN, oxychlordane and
HEPTX were significantly correlated with 1=T
(Po0:001) among all sites in New Jersey, with the
exception of Sandy Hook, with the r2 values ranging
from 0.68 to 0.7 in Camden, from 0.3 to 0.6 in Jersey

ARTICLE IN PRESS
Table 6
Phase transition energies (DHenv795% confidence limits) in kJmol�1 vs. DHvap in kJmol�1 from Hinckley et al. (1990) and DHoa in
kJmol�1 from Shoeib and Harner (2002)
Compound Delaware Bay
DHenv
Camden
DHenv
Jersey City
DHenvNew Brunswick
DHenv
Pinelands
DHenv
Sandy Hook
DHenv DHvap DHoa
a-HCH 23712 2977 3879 1974 2675 2079 68.5 61.8
g-HCH 60722 8679 57712 4779 7376 49714 70.5 65.3
HEPT 58720 1676 NS NS 1675 NS 76.5 66.1
HEPTX 38715 8379 112723 5579 3779 NS
Oxychlordane 44717 6878 58721 8277 5379 NS
TC 49717 6078 48711 47710 5979 41713 80.7 96.3
CC 54716 6577 61711 6078 6478 44714 82.0 98.0
TN 56716 6878 61711 6678 68710 47714 85.5 105.2
CN 108748 86710 58719 6576 57712 43717 83.8
Endosulfan I 132734 175712 127721 136712 112722 89725 80.4
Endosulfan II 158716 66722 94710 51734 86730 82.4
4,40-DDE 92719 6277 3576 7279 6679 58717 87.2 97.8
2,40-DDE 51730 7176 3378 5378 NS NS
4,40 DDT 142758 73714 49725 7379 NS NS 93.2 88.0
2,40 DDT 6277 76727 35715 NS NS 88.6 87.8
Dieldrin 68722 68712 116732 68716 64715 49722 82.5 72.5
NS ¼ not statistically significant.
R. Gioia et al. / Atmospheric Environment 39 (2005) 2309–2322 2319
City, from 0.5 to 0.86 in New Brunswick and from 0.42
to 0.6 in Pinelands. Slopes are highest at Camden and
lowest at Sandy Hook (Table 6). The average Henv
values determined for TC, CC, TN and CN are
significantly lower (Po0:001) at the Sandy Hook siteas compared with the land locked urban and suburban
locations. Sandy Hook is coastal marine site and the
presence of the large water mass may decrease the
influence of temperature on the S-chlordane concentra-tions (Cortes et al., 1998). The ocean water can act as a
sink or a source for these compounds and, in general,
temperature has a smaller effect on the volatilization
and deposition from water bodies than on volatilization
from terrestrial surfaces (Cortes et al., 1998, 1999). The
average Henv at the Sandy Hook for S-chlordanes issimilar to those measured for S-chlordane on the GreatLakes in 1994 (48–44 kJmol�1) (Cortes et al., 1998).
Whereas, Henv measured at Camden and New Bruns-
wick are in the same range of those measured in
Michigan and Arkansas (73 and 71 kJmol�1) (Hoh and
Hites, 2004). HEPT is the only chlordane that does not
display a seasonal pattern. Other investigators have
similarly noted no correlation between the gas-phase
HEPT concentration and 1=T including Hoff et al.
(1992a ,b) in southern Ontario and Janunten et al. (2000)
in Alabama. Table 6 indicates that gas-phase concentra-
tions of g-HCH display stronger temperature dependen-cies (Po0:001) than those of a-HCH. The differences inslopes suggest that a-HCH levels may be governed
primarily by transport, whereas the g-HCH levels are
driven by temperature changes via evaporation from
nearby terrestrial surfaces. Many studies have shown
that a steep slope indicates that the air concentrations
are controlled by re-volatilization from surfaces, while a
flatter slope indicates that advection of air is governing
atmospheric concentration levels (Bidleman et al., 1999;
Cope et al., 1995; Cortes et al., 1999; Yeo et al., 2003).
However, increased breakthrough during warmer peri-
ods may be partially responsible for the steeper slope for
a-HCH.Correlations between ln p vs. 1=T for the DDTs were
statistically significant at Camden, Jersey City and New
Brunswick (Po0:001). Henv estimated for DDTs at
Camden and Jersey City were statistically similar (6277to 73714 kJmol�1). Results of regressions for the NewBrunswick location show a flatter slope than the
Camden site with Henv ranging from 35715 to
7379 kJmol�1. Values found for Henv in Camden are
higher than those estimated in the Great lakes for p,p0-
DDE and p,p0-DDT (between 30 and 57 kJmol�1)
(Cortes et al., 1998), whereas Henv values estimated at
the New Brunswick location are in that range. Correla-
tion with temperature for p,p0-DDE was statistically
significant over all sites in New Jersey (Po0:001). Thestrong relationship between temperature and gas-phase
concentration and the higher Henv in Camden and New
Brunswick suggests a partitioning between the surfaces,
and this can be related to the generally higher
OCP concentrations at Camden and New Brunswick,
suggesting that these two sites are near the atmospheric

ARTICLE IN PRESSR. Gioia et al. / Atmospheric Environment 39 (2005) 2309–23222320
sources of OCPs, whereas a weak correlation with
temperature for DDTs among the other sites is
indicative of processes that have an opposite weak
correlation with temperature such as long-range trans-
port and direction of local winds. Endosulfan I and II
show the highest r2 and highest Henv values of all the
OCPs.
4. Conclusions
Most of the pesticides measured in this work display
their highest concentrations at the urban/industrial
centers of Camden and New Brunswick, although in
many cases the differences in geometric mean concen-
trations are not statistically significant. High atmo-
spheric OCP levels are likely to be associated with past
or present pesticide use (i.e., agricultural areas). The
data in this study reveal no significant correlation
between urbanization and pesticide concentrations.
However, this study involves only six sites; data from
additional locations and data from chiral analysis of
some of these pesticides would be necessary to confirm
this conclusion.
If so, OCP concentrations would be significantly
higher at Jersey City. The absence of a correlation
between urbanization and high atmospheric OCP levels
suggests that urban sources such as landfills and
brownfields are not important sources of atmospheric
OCPs. Were landfills significant sources of OCPs to the
atmosphere, the presence of more than 10 current or
former landfills in the New Jersey meadowlands would
almost certainly lead to high OCP concentrations at
Jersey City. However, additional data from chiral
analyses of these pesticides should be obtained to clarify
the source. These data represent the first measurements
of OCPs in New Jersey air, and has allowed the first
estimates of atmospheric deposition of such pesticides to
the important coastal zone of the New York–New Jersey
Harbor and Bight. Seasonal variations in gas-phase
concentrations of OCPs can be attributed to ambient
temperature fluctuations. Significant temperature (i.e.,
1=T) dependencies were found for all OCPs at every site,
with the exception of aldrin and HEPT (Table 6).
Acknowledgments
The authors wish to acknowledge T. Glenn IV, D.
Van Ry, I. Koelliker and D.Visco for assistance in
laboratory and fieldwork. This research was supported
by the New Jersey Department of Environmental
Protection and New Jersey Agricultural Experiment
Station of Rutgers University.
References
Alegria, H.A., Bidleman, T.F., Shaw, T.J., 2000. Organochlor-
ine pesticides in ambient air of Belize, Central America.
Environmental Science and Technology 34, 1953–1958.
Bamford, H.A., Offenberg, J.H., Larsen, R.K., Ko, F.C.,
Baker, J.E., 1999. Diffusive exchange of polycyclic aromatic
hydrocarbons across the air–water interface of the Patapsco
River, an urbanized subestuary of the Chesapeake Bay.
Environmental Science and Technology 33, 2138–2144.
Bamford, H.A., Ko, F.C., Baker, J.E., 2001. Seasonal and
annual air–water exchange of polychlorinated biphenyls
across Baltimore Harbor and the Northern Chesapeake
Bay. Environmental Science and Technology 36, 4245–4252.
Bidleman, T.F., Alegria, H., Ngabe, B., Green, C., 1998a.
Trends of chlordane and toxaphene in ambient air of
Columbia, South Carolina. Atmospheric Environment 32,
1849–1856.
Bidleman, T.F., Janunten, M.M., Wiberg, K., Harner, T.,
Brice, K.A., Su, K., Falconer, R.L., Leone, A.D., Aigner,
E.J., Parkhurst, W.J., 1998b. Soil as a source of atmospheric
heptachlor epoxide. Environmental Science and Technology
32, 1546–1548.
Bidleman, T.F., Patton, G.W., Hinckley, D.A., Walla, M.D.,
Cotham, W.E., Hargrave, B.T., 1999. Chlorinated pesticides
and polychlorinated biphenyls in the atmosphere of the
Canadian Artic. In: Kurtz, D. (Ed.), Long-Range Transport
of Pesticides. Lewis Publisher, Chelsea, MI.
Bidleman, T.F., Jantunen, L.M.M., Helm, P.A., Brorstrom-
Lunden, E., Juntto, S., 2002. Chlordane enantiomers and
temporal trends of chlordane isomers in Arctic air.
Environmental Science and Technology 36, 539–544.
Brunciak, P.A., Dachs, J., Gigliotti, C.L., Nelson, E.D.,
Eisenreich, S.J., 2001. Atmospheric polychlorinated biphe-
nyl concentrations and apparent degradation in coastal
New Jersey. Atmospheric Environment 35, 3325–3339.
Buehler, S.S., Basu, I., Hites, R.A.A., 2001. Comparison of
PAH, PCB, and pesticide concentrations in air at two rural
sites on Lake Superior. Environmental Science and Tech-
nology 35, 2417–2422.
Cope, R.H., Manning, M.A., Foremann, W.T., Goolsby, D.A.,
Majewski, M.S., 1995. Occurrence of pesticides in rain and
air in urban and agricultural area of Mississippi, April–-
September. The Science of the Total Environment 248,
227–240.
Cortes, D.R., Basu, I., Sweet, C.W., Brice, K.A., Hoff, R.M.,
Hites, R.A., 1998. Temporal trend in gas-phase concentra-
tions of chlorinated pesticides measured at the shores of the
Great Lakes. Environmental Science and Technology 32,
1920–1927.
Cortes, D.R., Hoff, R.M., Brice, K.A., Hites, R.A., 1999.
Evidence of current pesticide use from temporal and
Clausius–Clapeyron plots: a case study from integrated
atmospheric deposition network. Environmental Science
and Technology 33, 2145–2150.
Duerksen-Hughen, P., Patricia, R.-T., Sanjivani, D., Robin, L.,
1993. US Department of Health and Human Services.
Public Health Service, Agency for Toxic Substances and
Disease Registry April.
Eitzer, B.D., Iannucci-Berger, W., Mattina, I.M., 2003.
Volatilization of weathered chiral and achiral chlordane

ARTICLE IN PRESSR. Gioia et al. / Atmospheric Environment 39 (2005) 2309–2322 2321
residues from soil. Environmental Science and Technology
37, 4887–4893.
Faroon, O., Olivia, H., Fernando, L., Steven, S., Gloria, S.,
Mario, C., Daniell, G., 2002. US Department of Health and
Human Services. Public Health Service, Agency for Toxic
Substances and Disease Registry September.
Franz, T.P., Eisenreich, S.J., Holsen, T.M., 1998. Dry deposi-
tion of particulate polychlorinated biphenyls and polycyclic
aromatic hydrocarbons to Lake Michigan. Environmental
Science and Technology 32, 3681–3688.
Gigliotti, C.L., Dachs, J., Nelson, E.D., Brunciak, P.A.,
Eisenreich, S.J., 2000. Polycyclic aromatic hydrocarbons in
the New Jersey coastal atmosphere. Environmental Science
and Technology 34, 3547–3554.
Gigliotti, C.L., Brunciak, P.A., Dachs, J., Glenn, T.R., Nelson,
E.D., Totten, L.A., Eisenreich, S.J., 2002. Air–water
exchange of polycyclic aromatic hydrocarbons in the New
York–New Jersey, USA, Harbor Estuary. Environmental
Toxicology and Chemistry 21 (2), 235–244.
Gioia, R., 2004. Organic carbon and elemental carbon
associated with the PM2.5 mass and organochlorine
pesticides in New Jersey air. Thesis submitted for the degree
of Master of Science at Rutgers University, New Jersey, US.
Halsal, C.J., Bailey, R., Stern, G.A., Barrie, L.A., Fellin, P.,
Muir, D.C.G., Rosenberg, B., Rovinsky, F.Ya., Kononov,
E.Ya., Pastukhov, B., 1998. Multi-year observations of
organohalogen pesticides in the Arctic atmosphere. Envir-
onmental Pollution 102, 51–62.
Hanley, D., Beblo, D.A., David, W., Armando, A., Stephen, B.,
Daniel, P., 2002. US Department of Health and Human
Services. Public Health Service, Agency for Toxic Sub-
stances and Disease Registry September.
Harner, T., Wideman, J.L., Jantunen, L.M.M., Bidleman, T.F.,
Parkhurst, M.J., 1999. Residues of organochlorine pesti-
cides in Alabama soils. Environmental Pollution 106,
323–332.
Harner, T., Shoeib, M., Diamond, M., Stern, G., Rosenberg,
B., 2004. Using passive air samplers to assess urban-rural
trends for persistent organic pollutants. 1. Polychlorinated
biphenyls and organochlorine pesticides. Environmental
Science and Technology 38, 4474–4483.
Henry, G.A., Ronald, B., Paul, F.G., 1994. US Department of
Health and Human Services. Public Health Service, Agency
for Toxic Substances and Disease Registry.
Hillery, B.R., Simcik, M.F., Basu, I., Hoff, R.M., Strachan,
W.J.M., Burniston, D., Chan, C.H., Brice, K.A., Sweet,
C.W., Hites, R.A., 1998. Atmospheric depeosition of toxic
pollutants to the Great Lakes as measured by integrated
atmospheric deposition network. Environmental Science
and Technology 32, 2216–2221.
Hinckley, D.A., Bidlemann, T.F., Foreman, W.T., Tuschall,
J.R., 1990. Determination of vapor pressures for nonpolar
and semipolar organic compounds from gas chromato-
grahic retention data. Journal of Chemical Engineering
Data 35, 232–237.
Hoff, R.M., Muir, D.C.G., Grift, N.P., 1992a. Annual cycle of
polychlorinated biphenyls and organohalogen pesticides in
air in southern Ontario. 1. Air concentration data.
Environmental Science and Technology 26, 266–275.
Hoff, R.M., Muir, D.C.G., Grift, N.P., 1992b. Annual cycle of
polychlorinated biphenyls and organohalogen pesticides in
air in southern Ontario. 2. Atmospheric transport and
sources. Environmental Science and Technology 26,
276–283.
Hoh, E., Hites, A.R., 2004. Sources of toxaphene and other
organochlorine pesticides in North America as determined
by air measurements and potential sources contribution
function analysis. Environmental Science and Technology
38, 4187–4194.
Hung, H., Halsall, C.J., Blanchard, P., Li, H.H., Fellin, P.,
Stern, G., Rosenberg, B., 2002. Temporal trend of organo-
chlorine pesticides in the Canadian Artic atmosphere.
Environmental Science and Technology 36, 862–868.
Iwata, H., Tanabe, S., Sakai, N., Tatsukawa, R., 1993.
Distribution of persistent organochlorines in the oceanic
air and surface seawater and the role of ocean on their
global transport and fate. Environmental Science and
Technology 27, 1080–1098.
Iwata, H., Tanabe, S., Ueda, K., Tatsukawa, R., 1995.
Persistent organochlorine residues in air, water, sediments,
and soils from the Lake Baikal Region, Russia. Environ-
mental Science and Technology 29, 792–801.
Janunten, L.M., Bidleman, T.F., Harner, T., Parkhurst, W.J.,
2000. Toxaphene, chlordane and other organochlorine
pesticides in Alabama air. Environmental Science and
Technology 34, 5097–5105.
Kallenborn, R., Oehme, M., Wynn-Williams, D.D., Schlab,
ach, Harris, J., 1998. Ambient air levels and atmospheric
long range transport of persistent organochlorines to Signy
Island, Antarctica. Science of the Total Environment 220,
167–180.
Karlsson, H., Derek, C., Muir, G., Teixiera, C.F., Burniston,
D.A., Strachan, W.M.J., Hecky, R.E., Mwita, J., Bootsma,
H.A., Grift, N.P., Kidd, K.A., Rosenberg, B., 2000.
Persistent chlorinated pesticides in air, water and precipita-
tion from the Lake Malawi Area, Southern Africa.
Environmental Science and Technology 34, 4490–4495.
Kelly, T.J., Mukund, R., Spicer, C.W., Pollack, A.J., 1994.
Concentrations and transformation of hazardous air
pollutants. Environmental Science and Technology 28,
378–387.
Kucklick, J.R., Baker, J.E., 1998. Organochlorines in Lake
Superior’s Food Web. Environmental Science and Technol-
ogy 32, 1192–1198.
Leone, A.D., Amato, S., Falconer, R.L., 2001. Emission of
chiral organochlorine pesticides from agricultural soils in
the Combelt Region of the US. Environmental Science and
Technology 35, 4591–4596.
Mackay, B., Shiu, W.-Y., Ma, K.-C., 1999. Physical–Chemical
Properties and Environmental Fate Handbook. Chapman &
Hall, London.
McConnell, L.L., Kuclick, J.R., Bidleman, T.F., Ivanov, G.P.,
Chernyak, S.M., 1996. Air–water gas exchange of organo-
chlorine X+compounds on Lake Baikal, Russia. Environ-
mental Science and Technology 36, 2975–2983.
Miller, S.M., Green, M.L., DePinto, J.V., Hornbuckle, K.C.,
2001. Results from the Lake Michigan Mass Balance Study:
concentrations and fluxes of atmospheric polychlorinated
biphenyls and trans-nonachlor. Environmental Science and
Technology 35, 278–285.
Muir, D.C.G., Ford, C.A., Rosenberg, B., Norstrom, R.J.,
Simon, M., Beland, P., 1996. ‘‘Persistent organochlorines in
ARTICLE IN PRESSR. Gioia et al. / Atmospheric Environment 39 (2005) 2309–23222322
beluga whales (Delphinapterus leucas) from the St. Lawrence
River estuary—I. Concentrations and patterns of specific
PCBs, chlorinated pesticides and polychlorinated dibenzo-p-
dioxins and dibenzofurans. Environmental Pollution 93,
219–234.
Nelson, E.D., Mc Connel, L.L., Baker, J.E., 1998. Diffusive
exchange of gaseous polycyclic aromatic hydrocarbons and
polychlorinated biphenyls across the air–water interface of
the Chesapeake Bay. Environmental Science and Technol-
ogy 32, 912–919.
NJDEP, 1999. Findings & recommendations for the remedia-
tion of historic pesticide contamination. Final Report,
March.
Offenberg, J.H., Nelson, E.D., Gigliotti, C.L., Eisenreich, S.J.,
2004. Chlordanes in New Jersey Air: 1997–1999. Environ-
mental Science and Technology 38, 3488–3497.
Pirrone, N., Keeler, G.J., Holsen, T.M., 1995. Dry deposition
of semivolatile organic compounds to Lake Michigan.
Environmental Science and Technology 29, 2123–2132.
Pirrone, N., Keeler, G.J., Holsen, T.M., 1995. Dry deposition
of trace elements to Lake Michigan: a hybrid-receptor
deposition modeling approach. Environmental Science and
Technology 29, 2112–2122.
Ramanarayan, T., Allen, R., 2000. EPA registration report,
July 2000.
Sahsuvar, L., Helm, P.A., Jantunen, L.M., Bidleman, T.F.,
2003. Henry’s Law Constants for alpha-, beta-, and gamma-
hexachlorocyclohexanes (HCHs) as a function of tempera-
ture and revised estimates of gas exchange in Arctic regions.
Atmospheric Environment 37, 983–992.
Schreitmuller, J., Ballschmiter, K., 1995. Air–water equilibrium
of hexachlorocyclohexanes and chloromethoxybenzenes in
the North and South Atlantic. Environmental Science and
Technology 29, 207–215.
Shoeib, M., Harner, T., 2002. Using measured octanol–air
partition coefficients to explain environmental partitioning
of organochlorine pesticides. Environmental Toxicology
and Chemistry 21, 984–990.
Suntio, L.R., Shiu, W.Y., MacKay, D., Seiber, J.N., Glotfelty,
D., 1988. Critical review of Henry’s Law Constants for
pesticides. Reviews of Environmental Contamination And
Toxicology 103, 1 Tharacad Ramanaraynan, Richard Allen;
EPA Registration Report, July 2000.
Totten, L.A., Gigliotti, C.L., Van Ry, D.A., Offenberg, J.H.,
Nelson, E.D., Dachs, J., Reinfelder, J.R., Eisenreich, S.J.,
2004. Atmospheric concentrations and deposition of poly-
chorinated biphenyls to the Hudson River Estuary.
Environmental Science and Technology 38, 2568–2573.
Van Ry, D.A., Gigliotti, C.L., Glenn, T.R., Nelson, E.D.,
Totten, L.A., Eisenreich, S.J., 2002. Wet deposition of
polychlorinated biphenyls in urban and background areas
of the Mid-Atlantic states. Environmental Science and
Technology 36, 3201–3209.
Walker, K., Vallero, D.A., Lewis, R.G., 1999. Factors
influencing the distribution of lindane and other hexachlor-
ocyclohexanes in the environment. Environmental Science
and Technology 33, 4373–4378.
Wania, F., Haugen, J.-E., Lei, Y.D., Mackay, D., 1998.
Temperature dependence of atmospheric concentration of
semi-volatile organic compounds. Critical Reviews In
Environmental Science and Technology 32 (8).
Withman, W.G., 1923. The two film theory of gas-absorption.
Chemical and Metallurgical Engineering 29, 146–148.
Yeo, H.-G., Choi, M., Chun, M.-Y., Sunwoo, Y., 2003.
Concentration distribution of polychlorinated biphenyls
and organochlorine pesticides and their relationship with
temperature in rural air of Korea. Atmospheric Environ-
ment 37, 3831–3839.
Further Reading
Glassmeyer, S.T., Brice, K.A., Hites, R.A.J., 1999. Atmo-
spheric concentrations of toxaphene on the coast of the
Lake Superior. Journal of Great Lakes Research 25 (3),
492–499.
Hargrave, B.T., Barrie, L.A., Bidleman, T.F., Welch, H.E.,
1997. Seasonality in exchange of organochlorines between
Arctic air and seawater. Environmental Science and
Technology 31, 3258–3266.
Mader, B.T., Pankow, J., 2001. Gas/solid partitioning of
semivolatile organic compounds (SOCs) to air filters. 3.
An analysis of gas adsorption artifacts in measurements of
atmospheric SOCs and organic carbon (OC) when using
Teflon membrane filters and quartz fiber filters. Environ-
mental Science and Technology 35 (17), 3422–3432.
Related Documents