61 AIR, SOIL AND WATER RESEARCH 2014:7 Open Access: Full open access to this and thousands of other papers at http://www.la-press.com. Air, Soil and Water Research Atmospheric CO 2 Variations in Two Contrasting Environmental Sites Over India Neerja Sharma 1 , V.K. Dadhwal 1 , Y. Kant 2 , P. Mahesh 1 , K. Mallikarjun 1 , Harish Gadavi 3 , Anand Sharma 4 and M.M. Ali 1 1 National Remote Sensing Centre, Hyderabad, India. 2 Indian Institute of Remote Sensing, Dehradun, India. 3 National Atmospheric Research Laboratory, Gadanki, India. 4 India Meteorological Department, Dehradun, India. ABSTRACT: We analyzed the influence of environmental parameters on the temporal variation of atmospheric carbon dioxide (CO 2 ) mixing ratios in two environmentally contrasting Indian sites, Dehradun (30.1°N, 77.4°E, humid subtropical station) and Gadanki (13.5°N, 79.18°E, dry tropical station), from October 2010 to September 2011. e annual range of mixing ratios is low in Gadanki as compared to those of Dehradun because of relatively less monthly variation in temperature and relative humidity (RH) at Gadanki. At both the stations, the minimum mixing ratios are present during the high ecosystem productivity seasons in the afternoon hours. e maximum values are in the early morning hours. However, low wind speed conditions control the unexpected afternoon high mixing ratios in Gadanki during the pre-monsoon season. e early morning maximum is high during monsoon and post- monsoon seasons in Dehradun and Gadanki, respectively, whereas morning inflexion occurred earlier in Gadanki compared with Dehradun. e effect of cloudiness on the CO 2 uptake depends on the canopy cover. KEYWORDS: atmospheric carbon dioxide, water vapour correction, diurnal variation, cloudiness impact CITATION: Sharma et al. Atmospheric CO 2 Variations in Two Contrasting Environmental Sites Over India. Air, Soil and Water Research 2014:7 61–68 doi:10.4137/ASWR.S13987. RECEIVED: December 22, 2013. RESUBMITTED: February 10, 2014. ACCEPTED FOR PUBLICATION: February 18, 2014. ACADEMIC EDITOR: Carlos Alberto Martinez-Huitle, Editor in Chief TYPE: Original Research FUNDING: Authors disclose no funding sources. COMPETING INTERESTS: Authors disclose no potential conflicts of interest. COPYRIGHT: © the authors, publisher and licensee Libertas Academica Limited. This is an open-access article distributed under the terms of the Creative Commons CC-BY-NC 3.0 License. CORRESPONDENCE: [email protected] 1. Introduction Carbon dioxide (CO 2 ) is the most important anthropogenic greenhouse gas present in the atmosphere. is gas contributes about 64% of the total radiative force created by the long-lived greenhouse gases. 1 CO 2 concentrations have increased by 40% since pre-industrial times, primarily from fossil fuel emissions and secondarily from net land use change emissions. 2 Atmo- spheric CO 2 measurements are very important tools for under- standing the carbon cycle because CO 2 mixing ratios in the atmosphere are strongly affected by photosynthesis, respiration, oxidation of organic matter, biomass and fossil fuel burning, and air–sea exchange process. 3 Local temperature and moisture con- ditions also affect the diurnal cycle and seasonal variations in atmospheric CO 2 . CO 2 mixing ratio measurements from World Meteorological Organisation (WMO) Global Atmosphere Watch (GAW) program are important to understand the fluxes using atmospheric inversion models, 4 whereas flux measure- ments using fast response sensors in eddy covariance method are critical for monitoring global and regional CO 2 mixing ratios. 5 Near-surface CO 2 mixing ratios have been documented in sev- eral cities across the world (Vancouver, Canada; Kuwait City, Kuwait; Mexico City, Mexico; Basel, Switzerland; Nottingham, UK; Phoenix, USA) to evaluate the dynamics of atmospheric CO 2 over short periods of time. 6,7 In India, long-term analysis of atmospheric CO 2 using the flask sample measurement technique at Cape Rama is given in Refs. 8–10 e continuous measurements of CO 2 at Hanle and Pondicherry are carried out by Center for Mathematical Modeling and Computer Simmulation (C-MMACS) group Banglore. 11 Flux measurements over agricultural site using Moderate Resolution Imaging Spectroradiometer (MODIS)- based vegetation indices and land surface temperature

Welcome message from author
This document is posted to help you gain knowledge. Please leave a comment to let me know what you think about it! Share it to your friends and learn new things together.
Transcript
61Air, Soil And WAter reSeArch 2014:7
Open Access: Full open access to this and thousands of other papers at http://www.la-press.com.
Air, Soil and Water Research
Atmospheric CO2 Variations in Two Contrasting Environmental Sites Over India
neerja Sharma1, V.K. dadhwal1, Y. Kant2, P. Mahesh1, K. Mallikarjun1, harish Gadavi3, Anand Sharma4 and M.M. Ali11National Remote Sensing Centre, Hyderabad, India. 2Indian Institute of Remote Sensing, Dehradun, India. 3National Atmospheric Research Laboratory, Gadanki, India. 4India Meteorological Department, Dehradun, India.
ABSTR ACT: We analyzed the influence of environmental parameters on the temporal variation of atmospheric carbon dioxide (CO2) mixing ratios in two environmentally contrasting Indian sites, Dehradun (30.1°N, 77.4°E, humid subtropical station) and Gadanki (13.5°N, 79.18°E, dry tropical station), from October 2010 to September 2011. The annual range of mixing ratios is low in Gadanki as compared to those of Dehradun because of relatively less monthly variation in temperature and relative humidity (RH) at Gadanki. At both the stations, the minimum mixing ratios are present during the high ecosystem productivity seasons in the afternoon hours. The maximum values are in the early morning hours. However, low wind speed conditions control the unexpected afternoon high mixing ratios in Gadanki during the pre-monsoon season. The early morning maximum is high during monsoon and post-monsoon seasons in Dehradun and Gadanki, respectively, whereas morning inflexion occurred earlier in Gadanki compared with Dehradun. The effect of cloudiness on the CO2 uptake depends on the canopy cover.
KEY WORDS: atmospheric carbon dioxide, water vapour correction, diurnal variation, cloudiness impact
CITATION: Sharma et al. Atmospheric co2 Variations in two contrasting environmental Sites over india. Air, Soil and Water Research 2014:7 61–68 doi:10.4137/ASWr.S13987.
RECEIVED: december 22, 2013. RESUBMITTED: February 10, 2014. ACCEPTED FOR PUBLICATION: February 18, 2014.
ACADEMIC EDITOR: carlos Alberto Martinez-huitle, editor in chief
TYPE: original research
FUNDING: Authors disclose no funding sources.
COMPETING INTERESTS: Authors disclose no potential conflicts of interest.
COPYRIGHT: © the authors, publisher and licensee libertas Academica limited. this is an open-access article distributed under the terms of the creative commons cc-BY-nc 3.0 license.
CORRESPONDENCE: [email protected]
1. IntroductionCarbon dioxide (CO2) is the most important anthropogenic greenhouse gas present in the atmosphere. This gas contributes about 64% of the total radiative force created by the long-lived greenhouse gases.1 CO2 concentrations have increased by 40% since pre-industrial times, primarily from fossil fuel emissions and secondarily from net land use change emissions.2 Atmo-spheric CO2 measurements are very important tools for under-standing the carbon cycle because CO2 mixing ratios in the atmosphere are strongly affected by photosynthesis, respiration, oxidation of organic matter, biomass and fossil fuel burning, and air–sea exchange process.3 Local temperature and moisture con-ditions also affect the diurnal cycle and seasonal variations in atmospheric CO2. CO2 mixing ratio measurements from World Meteorological Organisation (WMO) Global Atmosphere Watch (GAW) program are important to understand the fluxes
using atmospheric inversion models,4 whereas flux measure-ments using fast response sensors in eddy covariance method are critical for monitoring global and regional CO2 mixing ratios.5 Near-surface CO2 mixing ratios have been documented in sev-eral cities across the world (Vancouver, Canada; Kuwait City, Kuwait; Mexico City, Mexico; Basel, Switzerland; Nottingham, UK; Phoenix, USA) to evaluate the dynamics of atmospheric CO2 over short periods of time.6,7
In India, long-term analysis of atmospheric CO2 using the flask sample measurement technique at Cape Rama is given in Refs.8–10 The continuous measurements of CO2 at Hanle and Pondicherry are carried out by Center for Mathematical Modeling and Computer Simmulation (C-MMACS) group Banglore.11 Flux measurements over agricultural site using Moderate Resolution Imaging Spectroradiometer (MODIS)-based vegetation indices and land surface temperature
Sharma et al
62 Air, Soil And WAter reSeArch 2014:7
information are carried out by Patel et al,12 whereas analysis of CO2, water vapor, and energy fluxes over mixed deciduous forest is reported by Jha et al.13
The large diversity of climatic resources, like vegeta-tion; land use changes; densely populated regions with high anthropogenic sources; and energy hot spots of CO2 emission (thermal plants, fossil fuel combustion) results in CO2 source and sink spatial and temporal variability. Such variability has not been characterized in developing an understanding of net carbon balance of the country.
As a part of the program of Indian Space Research Organisation (ISRO)—Geosphere Biosphere Programme (GBP)—an integrated study of the carbon cycle has been initi-ated. These CO2 mixing ratio measurements at multisites will be integrated with forest and soil carbon pool for quantify-ing national carbon balance. Recently, Sharma et al14 reported the influence of the environmental factors and biospheric processes on the temporal variations of atmospheric CO2 in Dehradun. Here, we report an analysis of continuous measure-ments of CO2 mixing ratios at two environmental contrasting sites of India, which are separated by ~17° in latitude. One is Dehradun (30.1°N, 77.4°E) in Uttrakhand with a subtropical humid climate, and the other is Gadanki (13.5°N, 79.18°E) in Andhra Pradesh with a tropical dry climate.
The structure of the paper is organized as follows: Section 2 introduces the site and instrument used for the measurements. Sections 3 and 4 describe the data and methodology applied
to the analysis, respectively. Impact of environmental param-eters is discussed in Section 5 and summary of the results in Section 6.
2. Instrument and Site2.1. Instrument. CO2 observations at both the stations
are recorded using a Vaisala GMP-343 probe through a data logger.15 The instrument is of diffusion type and based on non- dispersive infrared (NDIR) technology (detail working principle of the sensor is given by Rigby et al.)16 It provides an acceptable compromise between size, response time, accuracy, and stabil-ity.14,16 Studies show reliable results using this sensor in atmo-spheric, limnology, and oceanographic investigations.14,16–18
2.2. Site. Dehradun is in a valley located at a mean altitude of 700 m with a humid subtropical climate. This city has a large area covered under vegetation and trees. On the other hand, Gadanki is a tropical semi-arid station located near Tirupati in the Chittoor district of Andhra Pradesh. It is a complex hilly terrain surrounded by dense forest and a very irregular mix of agriculture, and has small-scale rural population.
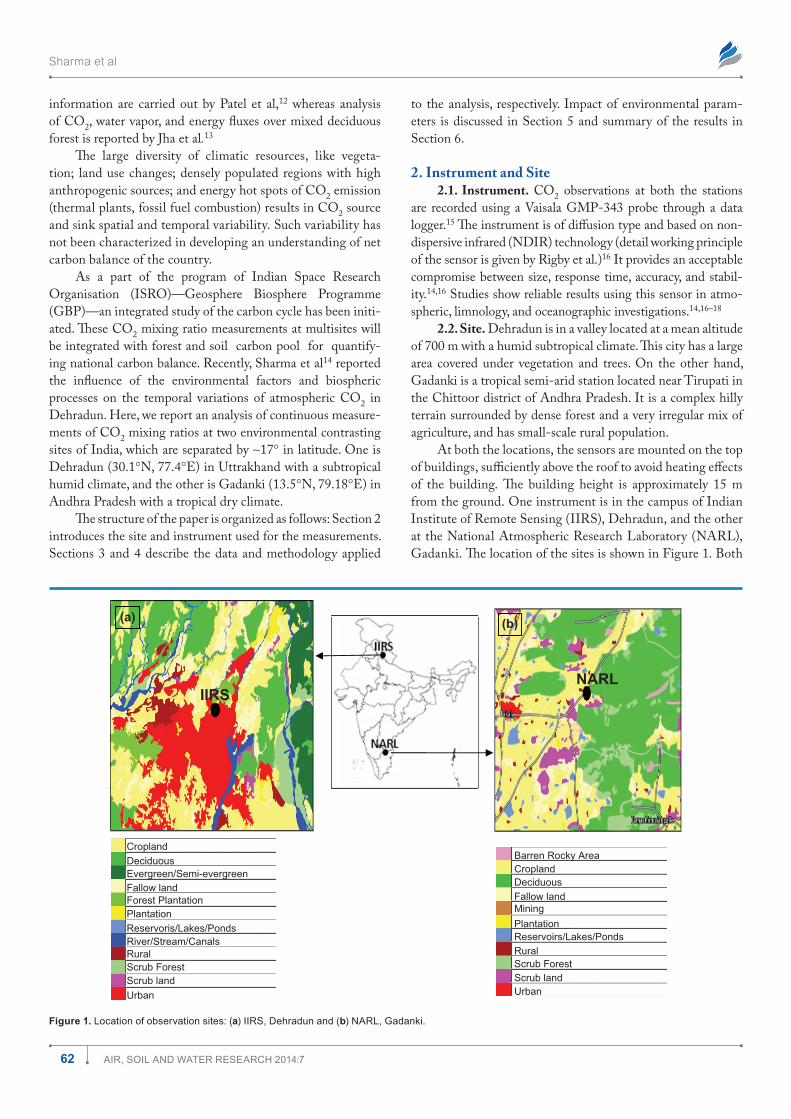
At both the locations, the sensors are mounted on the top of buildings, sufficiently above the roof to avoid heating effects of the building. The building height is approximately 15 m from the ground. One instrument is in the campus of Indian Institute of Remote Sensing (IIRS), Dehradun, and the other at the National Atmospheric Research Laboratory (NARL), Gadanki. The location of the sites is shown in Figure 1. Both
NARLIIRS
Barren Rocky AreaCroplandDeciduousFallow landMiningPlantationReservoirs/Lakes/PondsRuralScrub ForestScrub landUrban
CroplandDeciduousEvergreen/Semi-evergreenFallow landForest Plantation PlantationReservoris/Lakes/PondsRiver/Stream/CanalsRural
Scrub landScrub Forest
Urban
(a) (b)
Figure 1. location of observation sites: (a) iirS, dehradun and (b) nArl, Gadanki.
Atmospheric CO2 variations in two contrasting environmental sites over India
63Air, Soil And WAter reSeArch 2014:7
the institutes are significantly away from the main traffic, and hence the impact of public vehicular pollution is expected to be negligible on CO2 measurements.
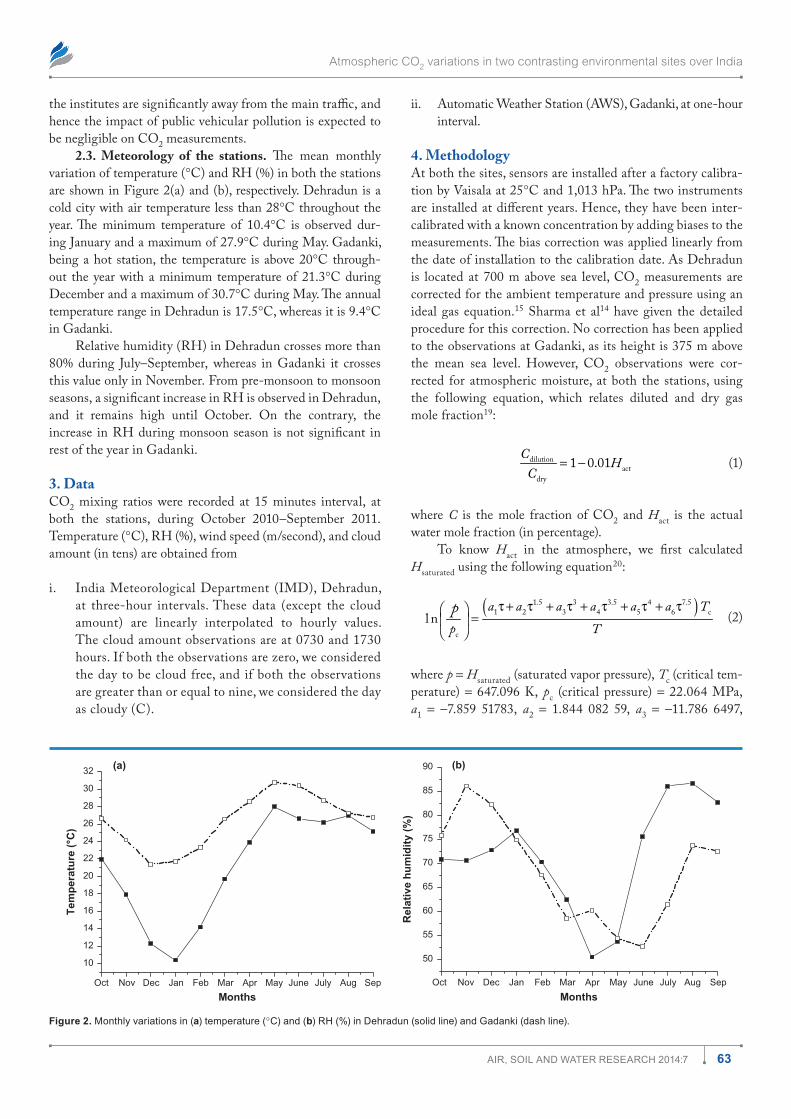
2.3. Meteorology of the stations. The mean monthly variation of temperature (°C) and RH (%) in both the stations are shown in Figure 2(a) and (b), respectively. Dehradun is a cold city with air temperature less than 28°C throughout the year. The minimum temperature of 10.4°C is observed dur-ing January and a maximum of 27.9°C during May. Gadanki, being a hot station, the temperature is above 20°C through-out the year with a minimum temperature of 21.3°C during December and a maximum of 30.7°C during May. The annual temperature range in Dehradun is 17.5°C, whereas it is 9.4°C in Gadanki.
Relative humidity (RH) in Dehradun crosses more than 80% during July–September, whereas in Gadanki it crosses this value only in November. From pre-monsoon to monsoon seasons, a significant increase in RH is observed in Dehradun, and it remains high until October. On the contrary, the increase in RH during monsoon season is not significant in rest of the year in Gadanki.
3. DataCO2 mixing ratios were recorded at 15 minutes interval, at both the stations, during October 2010–September 2011. Temperature (°C), RH (%), wind speed (m/second), and cloud amount (in tens) are obtained from
i. India Meteorological Department (IMD), Dehradun, at three-hour intervals. These data (except the cloud amount) are linearly interpolated to hourly values. The cloud amount observations are at 0730 and 1730 hours. If both the observations are zero, we considered the day to be cloud free, and if both the observations are greater than or equal to nine, we considered the day as cloudy (C).
ii. Automatic Weather Station (AWS), Gadanki, at one-hour interval.
4. MethodologyAt both the sites, sensors are installed after a factory calibra-tion by Vaisala at 25°C and 1,013 hPa. The two instruments are installed at different years. Hence, they have been inter-calibrated with a known concentration by adding biases to the measurements. The bias correction was applied linearly from the date of installation to the calibration date. As Dehradun is located at 700 m above sea level, CO2 measurements are corrected for the ambient temperature and pressure using an ideal gas equation.15 Sharma et al14 have given the detailed procedure for this correction. No correction has been applied to the observations at Gadanki, as its height is 375 m above the mean sea level. However, CO2 observations were cor-rected for atmospheric moisture, at both the stations, using the following equation, which relates diluted and dry gas mole fraction19:
dilutionact
dry
1 0.01C
HC
= −
(1)
where C is the mole fraction of CO2 and Hact is the actual water mole fraction (in percentage).
To know Hact in the atmosphere, we first calculated Hsaturated using the following equation20:
( )1.5 3 3.5 4 7.51 2 3 4 5 6 c
c
l na a a a a a T
p Tp τ + τ + τ + τ + τ + τ
=
(2)
where p = Hsaturated (saturated vapor pressure), Tc (critical tem-perature) = 647.096 K, pc (critical pressure) = 22.064 MPa, a1 = −7.859 51783, a2 = 1.844 082 59, a3 = −11.786 6497,
10
12
14
16
18
20
22
24
26
28
30
32
Tem
pera
ture
(°C
)
Months
(a)
Oct Nov Dec Jan Feb Mar Apr May June July Aug Sep
50
55
60
65
70
75
80
85
90
Rel
ativ
e hu
mid
ity (%
)
Months
(b)
Oct Nov Dec Jan Feb Mar Apr May June July Aug Sep
Figure 2. Monthly variations in (a) temperature (°c) and (b) rh (%) in dehradun (solid line) and Gadanki (dash line).
Sharma et al
64 Air, Soil And WAter reSeArch 2014:7
a4 = 22.680 7411, a5 = −15.961 8719, a6 = 1.801 225 02, and t = 1−(T + 273.15)/Tc.
With known RH and calculated Hsaturated, Hact is calcu-lated using the following equation:
act
saturated
RH 100H
H
= ×
(3)
Then average hourly mixing ratios were calculated using the 15-minute observations at both the stations from which monthly means were computed. Similarly, monthly means of meteorological observations are also computed.
5. ResultsImpact of water vapor correction on the dry concentrations of CO2 at the two environmentally contrasting stations is discussed here. Diurnal variation of CO2 with respect to the meteorological parameters such as wind speed and cloudiness is also discussed.
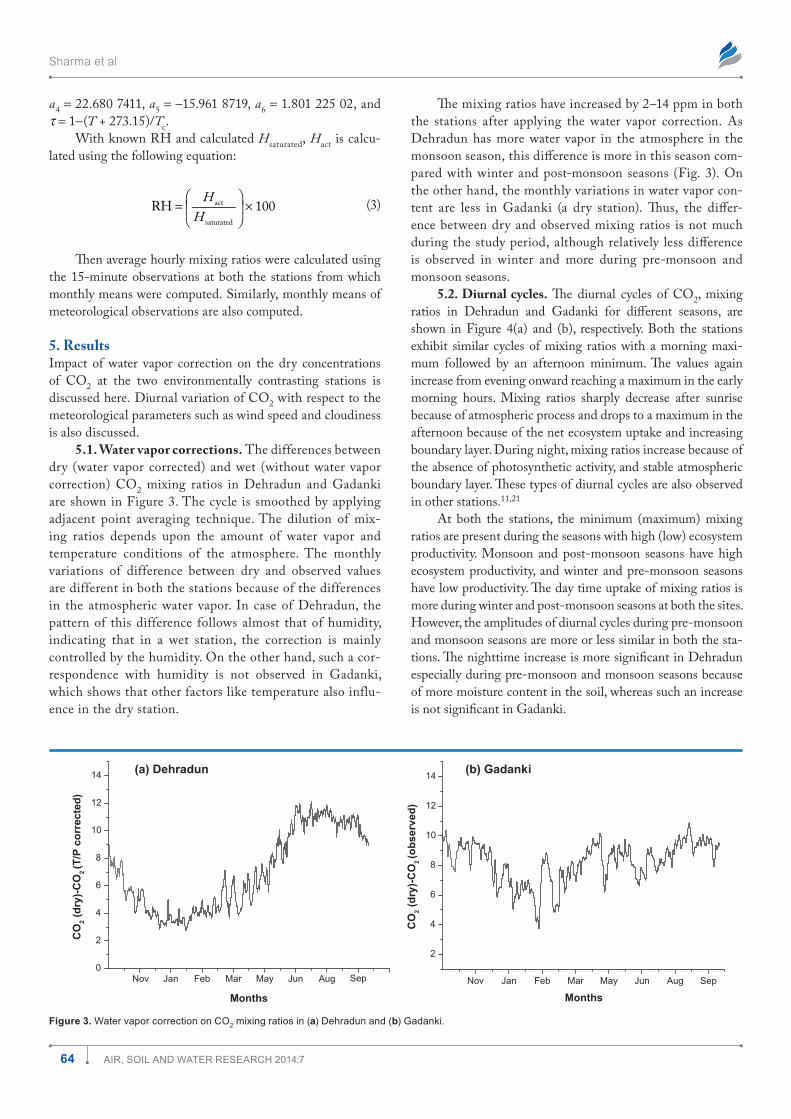
5.1. Water vapor corrections. The differences between dry (water vapor corrected) and wet (without water vapor correction) CO2 mixing ratios in Dehradun and Gadanki are shown in Figure 3. The cycle is smoothed by applying adjacent point averaging technique. The dilution of mix-ing ratios depends upon the amount of water vapor and temperature conditions of the atmosphere. The monthly variations of difference between dry and observed values are different in both the stations because of the differences in the atmospheric water vapor. In case of Dehradun, the pattern of this difference follows almost that of humidity, indicating that in a wet station, the correction is mainly controlled by the humidity. On the other hand, such a cor-respondence with humidity is not observed in Gadanki, which shows that other factors like temperature also influ-ence in the dry station.
The mixing ratios have increased by 2–14 ppm in both the stations after applying the water vapor correction. As Dehradun has more water vapor in the atmosphere in the monsoon season, this difference is more in this season com-pared with winter and post-monsoon seasons (Fig. 3). On the other hand, the monthly variations in water vapor con-tent are less in Gadanki (a dry station). Thus, the differ-ence between dry and observed mixing ratios is not much during the study period, although relatively less difference is observed in winter and more during pre-monsoon and monsoon seasons.
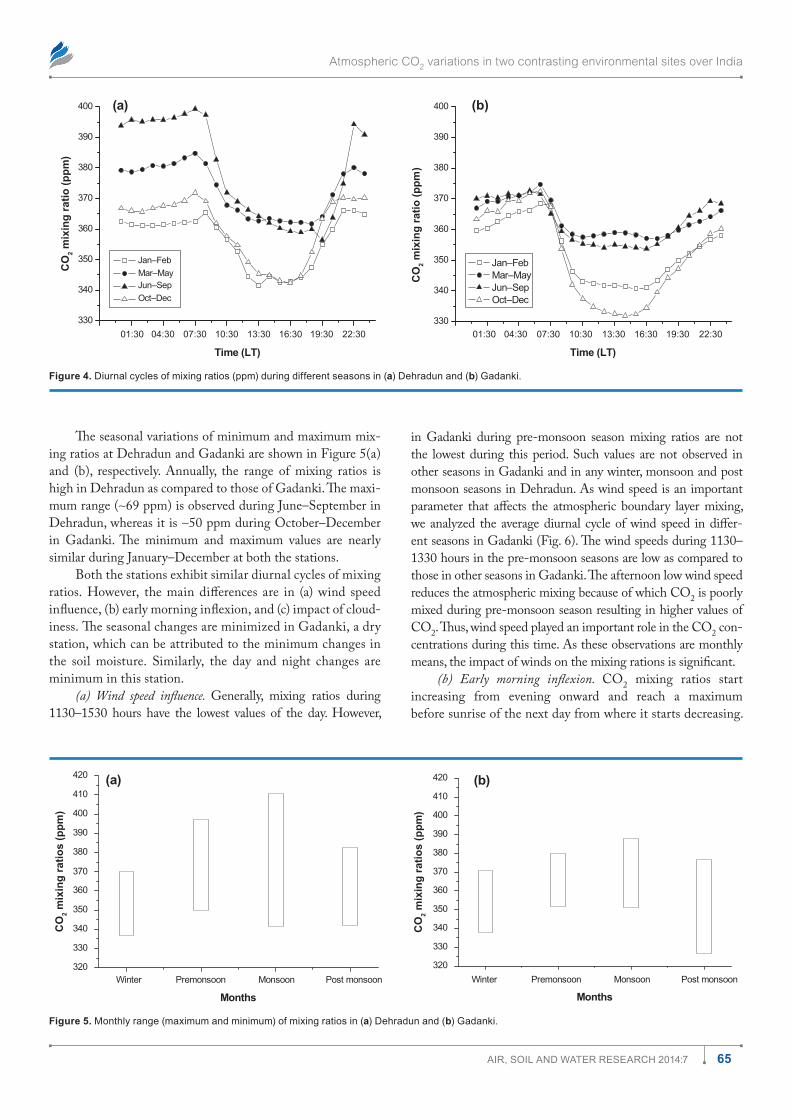
5.2. Diurnal cycles. The diurnal cycles of CO2, mixing ratios in Dehradun and Gadanki for different seasons, are shown in Figure 4(a) and (b), respectively. Both the stations exhibit similar cycles of mixing ratios with a morning maxi-mum followed by an afternoon minimum. The values again increase from evening onward reaching a maximum in the early morning hours. Mixing ratios sharply decrease after sunrise because of atmospheric process and drops to a maximum in the afternoon because of the net ecosystem uptake and increasing boundary layer. During night, mixing ratios increase because of the absence of photosynthetic activity, and stable atmospheric boundary layer. These types of diurnal cycles are also observed in other stations.11,21
At both the stations, the minimum (maximum) mixing ratios are present during the seasons with high (low) ecosystem productivity. Monsoon and post-monsoon seasons have high ecosystem productivity, and winter and pre-monsoon seasons have low productivity. The day time uptake of mixing ratios is more during winter and post-monsoon seasons at both the sites. However, the amplitudes of diurnal cycles during pre-monsoon and monsoon seasons are more or less similar in both the sta-tions. The nighttime increase is more significant in Dehradun especially during pre-monsoon and monsoon seasons because of more moisture content in the soil, whereas such an increase is not significant in Gadanki.
Nov Jan Feb Mar May Jun Aug Sep0
2
4
6
8
10
12
14
CO
2 (dr
y)-C
O2 (T
/P c
orre
cted
)
Months
(a) Dehradun
2
4
6
8
10
12
14
Months
(b) Gadanki
CO
2 (dr
y)-C
O2 (o
bser
ved)
Nov Jan Feb Mar May Jun Aug Sep
Figure 3. Water vapor correction on co2 mixing ratios in (a) dehradun and (b) Gadanki.
Atmospheric CO2 variations in two contrasting environmental sites over India
65Air, Soil And WAter reSeArch 2014:7
The seasonal variations of minimum and maximum mix-ing ratios at Dehradun and Gadanki are shown in Figure 5(a) and (b), respectively. Annually, the range of mixing ratios is high in Dehradun as compared to those of Gadanki. The maxi-mum range (~69 ppm) is observed during June–September in Dehradun, whereas it is ~50 ppm during October–December in Gadanki. The minimum and maximum values are nearly similar during January–December at both the stations.
Both the stations exhibit similar diurnal cycles of mixing ratios. However, the main differences are in (a) wind speed influence, (b) early morning inflexion, and (c) impact of cloud-iness. The seasonal changes are minimized in Gadanki, a dry station, which can be attributed to the minimum changes in the soil moisture. Similarly, the day and night changes are minimum in this station.
(a) Wind speed influence. Generally, mixing ratios during 1130–1530 hours have the lowest values of the day. However,
in Gadanki during pre-monsoon season mixing ratios are not the lowest during this period. Such values are not observed in other seasons in Gadanki and in any winter, monsoon and post monsoon seasons in Dehradun. As wind speed is an important parameter that affects the atmospheric boundary layer mixing, we analyzed the average diurnal cycle of wind speed in differ-ent seasons in Gadanki (Fig. 6). The wind speeds during 1130–1330 hours in the pre-monsoon seasons are low as compared to those in other seasons in Gadanki. The afternoon low wind speed reduces the atmospheric mixing because of which CO2 is poorly mixed during pre-monsoon season resulting in higher values of CO2. Thus, wind speed played an important role in the CO2 con-centrations during this time. As these observations are monthly means, the impact of winds on the mixing rations is significant.
(b) Early morning inflexion. CO2 mixing ratios start increasing from evening onward and reach a maximum before sunrise of the next day from where it starts decreasing.
330
340
350
360
370
380
390
400
CO
2 mix
ing
ratio
(ppm
)
Time (LT)
Jan–Feb Mar–May Jun–Sep Oct–Dec
(a)
01:30 04:30 07:30 10:30 13:30 16:30 19:30 22:30330
340
350
360
370
380
390
400
CO
2 mix
ing
ratio
(ppm
)
Time (LT)
Jan–Feb Mar–May Jun–Sep Oct–Dec
(b)
01:30 04:30 07:30 10:30 13:30 16:30 19:30 22:30
Figure 4. diurnal cycles of mixing ratios (ppm) during different seasons in (a) dehradun and (b) Gadanki.
320
330
340
350
360
370
380
390
400
410
420
CO
2 mix
ing
ratio
s (p
pm)
Months
(a)
Winter Premonsoon Monsoon Post monsoon320
330
340
350
360
370
380
390
400
410
420
CO
2 mix
ing
ratio
s (p
pm)
Months
(b)
Winter Premonsoon Monsoon Post monsoon
Figure 5. Monthly range (maximum and minimum) of mixing ratios in (a) dehradun and (b) Gadanki.
Sharma et al
66 Air, Soil And WAter reSeArch 2014:7
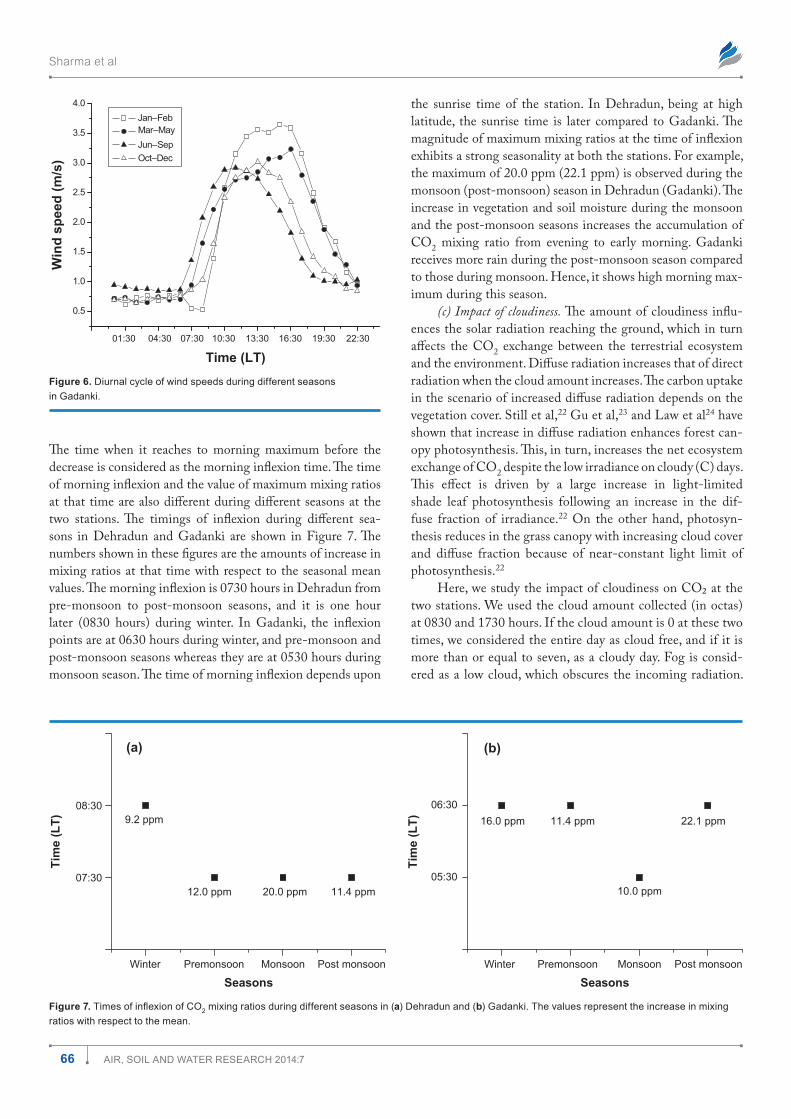
The time when it reaches to morning maximum before the decrease is considered as the morning inflexion time. The time of morning inflexion and the value of maximum mixing ratios at that time are also different during different seasons at the two stations. The timings of inflexion during different sea-sons in Dehradun and Gadanki are shown in Figure 7. The numbers shown in these figures are the amounts of increase in mixing ratios at that time with respect to the seasonal mean values. The morning inflexion is 0730 hours in Dehradun from pre-monsoon to post-monsoon seasons, and it is one hour later (0830 hours) during winter. In Gadanki, the inflexion points are at 0630 hours during winter, and pre-monsoon and post- monsoon seasons whereas they are at 0530 hours during monsoon season. The time of morning inflexion depends upon
the sunrise time of the station. In Dehradun, being at high latitude, the sunrise time is later compared to Gadanki. The magnitude of maximum mixing ratios at the time of inflexion exhibits a strong seasonality at both the stations. For example, the maximum of 20.0 ppm (22.1 ppm) is observed during the monsoon (post-monsoon) season in Dehradun (Gadanki). The increase in vegetation and soil moisture during the monsoon and the post-monsoon seasons increases the accumulation of CO2 mixing ratio from evening to early morning. Gadanki receives more rain during the post-monsoon season compared to those during monsoon. Hence, it shows high morning max-imum during this season.
(c) Impact of cloudiness. The amount of cloudiness influ-ences the solar radiation reaching the ground, which in turn affects the CO2 exchange between the terrestrial ecosystem and the environment. Diffuse radiation increases that of direct radiation when the cloud amount increases. The carbon uptake in the scenario of increased diffuse radiation depends on the vegetation cover. Still et al,22 Gu et al,23 and Law et al24 have shown that increase in diffuse radiation enhances forest can-opy photosynthesis. This, in turn, increases the net ecosystem exchange of CO2 despite the low irradiance on cloudy (C) days. This effect is driven by a large increase in light-limited shade leaf photosynthesis following an increase in the dif-fuse fraction of irradiance.22 On the other hand, photosyn-thesis reduces in the grass canopy with increasing cloud cover and diffuse fraction because of near-constant light limit of photosynthesis.22
Here, we study the impact of cloudiness on CO₂ at the two stations. We used the cloud amount collected (in octas) at 0830 and 1730 hours. If the cloud amount is 0 at these two times, we considered the entire day as cloud free, and if it is more than or equal to seven, as a cloudy day. Fog is consid-ered as a low cloud, which obscures the incoming radiation.
0.5
1.0
1.5
2.0
2.5
3.0
3.5
4.0
Win
d sp
eed
(m/s
)
Time (LT)
Jan–Feb Mar–May Jun–Sep Oct–Dec
04:3001:30 07:30 10:30 13:30 16:30 19:30 22:30
Figure 6. diurnal cycle of wind speeds during different seasons in Gadanki.
05:30
06:3022.1 ppm
10.0 ppm
11.4 ppm16.0 ppm
SeasonsSeasons
Tim
e (L
T)
(b)
07:30
08:30
11.4 ppm20.0 ppm12.0 ppm
Tim
e (L
T)
(a)
9.2 ppm
Winter Premonsoon Monsoon Post monsoon Winter Premonsoon Monsoon Post monsoon
Figure 7. Times of inflexion of CO2 mixing ratios during different seasons in (a) dehradun and (b) Gadanki. the values represent the increase in mixing ratios with respect to the mean.
Atmospheric CO2 variations in two contrasting environmental sites over India
67Air, Soil And WAter reSeArch 2014:7
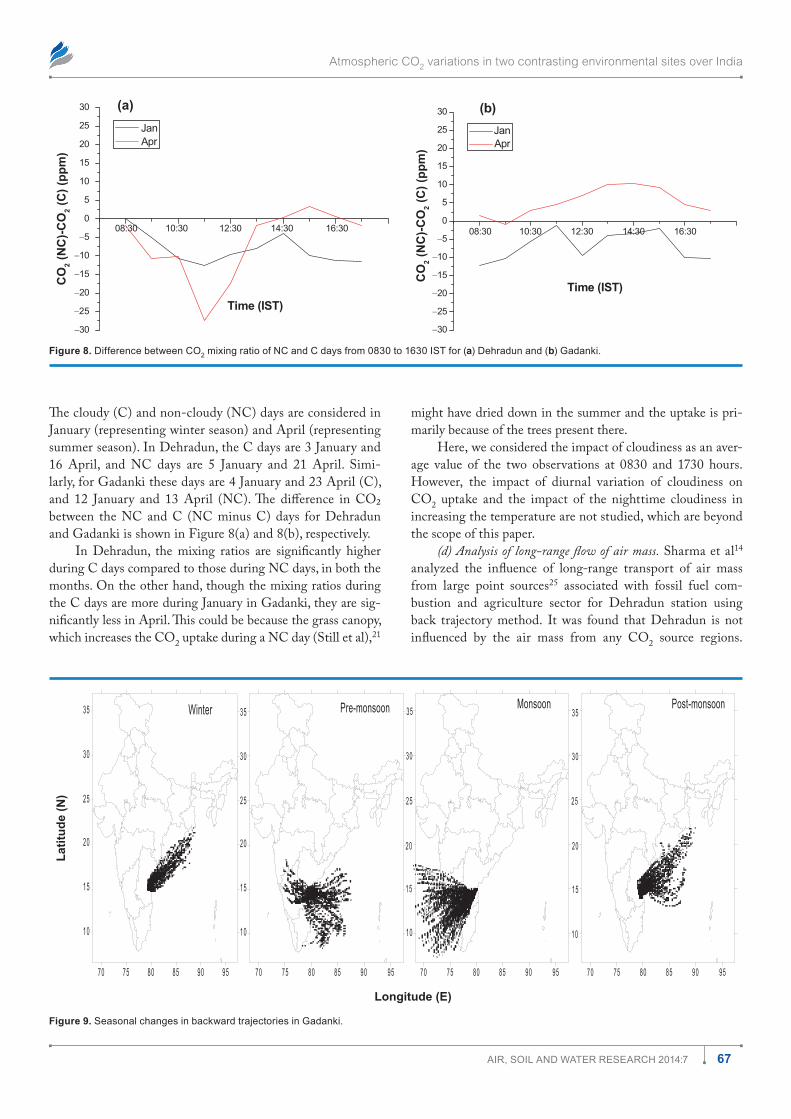
The cloudy (C) and non-cloudy (NC) days are considered in January (representing winter season) and April (representing summer season). In Dehradun, the C days are 3 January and 16 April, and NC days are 5 January and 21 April. Simi-larly, for Gadanki these days are 4 January and 23 April (C), and 12 January and 13 April (NC). The difference in CO₂ between the NC and C (NC minus C) days for Dehradun and Gadanki is shown in Figure 8(a) and 8(b), respectively.
In Dehradun, the mixing ratios are significantly higher during C days compared to those during NC days, in both the months. On the other hand, though the mixing ratios during the C days are more during January in Gadanki, they are sig-nificantly less in April. This could be because the grass canopy, which increases the CO2 uptake during a NC day (Still et al),21
−30
−25
−20
−15
−10
−5
0
5
10
15
20
25
30
CO
2 (N
C)-C
O2 (
C) (
ppm
)
Time (IST)
Jan Apr
(b)
08:30 10:30 12:30 14:30 16:30
−30
−25
−20
−15
08:30 10:30 12:30 14:30 16:30
−10
−5
0
5
10
15
20
25
30
CO
2 (N
C)-C
O2 (
C) (
ppm
)
Time (IST)
Jan Apr
(a)
Figure 8. difference between co2 mixing ratio of nc and c days from 0830 to 1630 iSt for (a) dehradun and (b) Gadanki.
might have dried down in the summer and the uptake is pri-marily because of the trees present there.
Here, we considered the impact of cloudiness as an aver-age value of the two observations at 0830 and 1730 hours. However, the impact of diurnal variation of cloudiness on CO2 uptake and the impact of the nighttime cloudiness in increasing the temperature are not studied, which are beyond the scope of this paper.
(d) Analysis of long-range flow of air mass. Sharma et al14 analyzed the influence of long-range transport of air mass from large point sources25 associated with fossil fuel com-bustion and agriculture sector for Dehradun station using back trajectory method. It was found that Dehradun is not influenced by the air mass from any CO2 source regions.
10
15
20
25
30
35
10
15
20
25
30
35
10
15
20
25
30
35
10
15
20
25
30
35Winter Pre-monsoon Monsoon Post-monsoon
Latit
ude
(N)
Longitude (E)
70 75 80 85 90 95 70 75 80 85 90 95 70 75 80 85 90 95 70 75 80 85 90 95
Figure 9. Seasonal changes in backward trajectories in Gadanki.
Sharma et al
68 Air, Soil And WAter reSeArch 2014:7
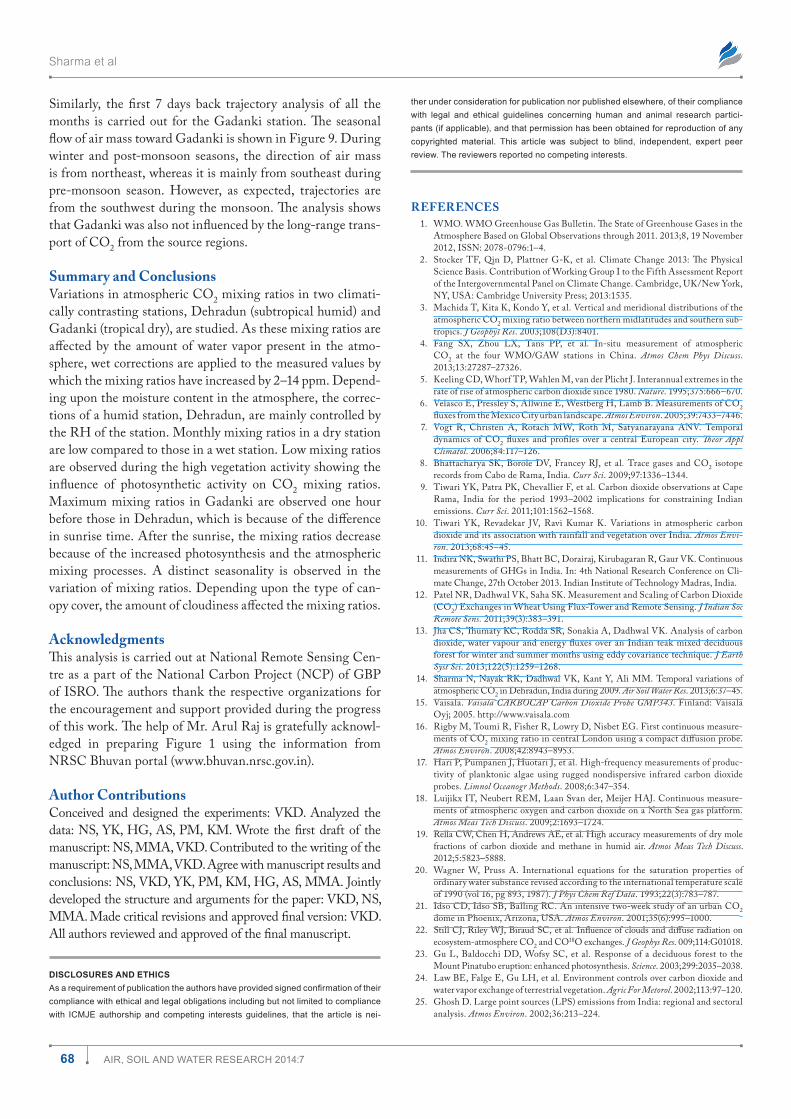
Similarly, the first 7 days back trajectory analysis of all the months is carried out for the Gadanki station. The seasonal flow of air mass toward Gadanki is shown in Figure 9. During winter and post-monsoon seasons, the direction of air mass is from northeast, whereas it is mainly from southeast during pre-monsoon season. However, as expected, trajectories are from the southwest during the monsoon. The analysis shows that Gadanki was also not influenced by the long-range trans-port of CO2 from the source regions.
Summary and ConclusionsVariations in atmospheric CO2 mixing ratios in two climati-cally contrasting stations, Dehradun (subtropical humid) and Gadanki (tropical dry), are studied. As these mixing ratios are affected by the amount of water vapor present in the atmo-sphere, wet corrections are applied to the measured values by which the mixing ratios have increased by 2–14 ppm. Depend-ing upon the moisture content in the atmosphere, the correc-tions of a humid station, Dehradun, are mainly controlled by the RH of the station. Monthly mixing ratios in a dry station are low compared to those in a wet station. Low mixing ratios are observed during the high vegetation activity showing the influence of photosynthetic activity on CO2 mixing ratios. Maximum mixing ratios in Gadanki are observed one hour before those in Dehradun, which is because of the difference in sunrise time. After the sunrise, the mixing ratios decrease because of the increased photosynthesis and the atmospheric mixing processes. A distinct seasonality is observed in the variation of mixing ratios. Depending upon the type of can-opy cover, the amount of cloudiness affected the mixing ratios.
AcknowledgmentsThis analysis is carried out at National Remote Sensing Cen-tre as a part of the National Carbon Project (NCP) of GBP of ISRO. The authors thank the respective organizations for the encouragement and support provided during the progress of this work. The help of Mr. Arul Raj is gratefully acknowl-edged in preparing Figure 1 using the information from NRSC Bhuvan portal (www.bhuvan.nrsc.gov.in).
Author ContributionsConceived and designed the experiments: VKD. Analyzed the data: NS, YK, HG, AS, PM, KM. Wrote the first draft of the manuscript: NS, MMA, VKD. Contributed to the writing of the manuscript: NS, MMA, VKD. Agree with manuscript results and conclusions: NS, VKD, YK, PM, KM, HG, AS, MMA. Jointly developed the structure and arguments for the paper: VKD, NS, MMA. Made critical revisions and approved final version: VKD. All authors reviewed and approved of the final manuscript.
DISCLOSURES AND ETHICSAs a requirement of publication the authors have provided signed confirmation of their compliance with ethical and legal obligations including but not limited to compliance with icMJe authorship and competing interests guidelines, that the article is nei-
ther under consideration for publication nor published elsewhere, of their compliance with legal and ethical guidelines concerning human and animal research partici-pants (if applicable), and that permission has been obtained for reproduction of any copyrighted material. this article was subject to blind, independent, expert peer review. the reviewers reported no competing interests.
REFERENCES 1. WMO. WMO Greenhouse Gas Bulletin. The State of Greenhouse Gases in the
Atmosphere Based on Global Observations through 2011. 2013;8, 19 November 2012, ISSN: 2078-0796:1–4.
2. Stocker TF, Qin D, Plattner G-K, et al. Climate Change 2013: The Physical Science Basis. Contribution of Working Group I to the Fifth Assessment Report of the Intergovernmental Panel on Climate Change. Cambridge, UK/New York, NY, USA: Cambridge University Press; 2013:1535.
3. Machida T, Kita K, Kondo Y, et al. Vertical and meridional distributions of the atmospheric CO2 mixing ratio between northern midlatitudes and southern sub-tropics. J Geophys Res. 2003;108(D3):8401.
4. Fang SX, Zhou LX, Tans PP, et al. In-situ measurement of atmospheric CO2 at the four WMO/GAW stations in China. Atmos Chem Phys Discuss. 2013;13:27287–27326.
5. Keeling CD, Whorf TP, Wahlen M, van der Plicht J. Interannual extremes in the rate of rise of atmospheric carbon dioxide since 1980. Nature. 1995;375:666–670.
6. Velasco E, Pressley S, Allwine E, Westberg H, Lamb B. Measurements of CO2 fluxes from the Mexico City urban landscape. Atmos Environ. 2005;39:7433–7446.
7. Vogt R, Christen A, Rotach MW, Roth M, Satyanarayana ANV. Temporal dynamics of CO2 fluxes and profiles over a central European city. Theor Appl Climatol. 2006;84:117–126.
8. Bhattacharya SK, Borole DV, Francey RJ, et al. Trace gases and CO2 isotope records from Cabo de Rama, India. Curr Sci. 2009;97:1336–1344.
9. Tiwari YK, Patra PK, Chevallier F, et al. Carbon dioxide observations at Cape Rama, India for the period 1993–2002 implications for constraining Indian emissions. Curr Sci. 2011;101:1562–1568.
10. Tiwari YK, Revadekar JV, Ravi Kumar K. Variations in atmospheric carbon dioxide and its association with rainfall and vegetation over India. Atmos Envi-ron. 2013;68:45–45.
11. Indira NK, Swathi PS, Bhatt BC, Dorairaj, Kirubagaran R, Gaur VK. Continuous measurements of GHGs in India. In: 4th National Research Conference on Cli-mate Change, 27th October 2013. Indian Institute of Technology Madras, India.
12. Patel NR, Dadhwal VK, Saha SK. Measurement and Scaling of Carbon Dioxide (CO2) Exchanges in Wheat Using Flux-Tower and Remote Sensing. J Indian Soc Remote Sens. 2011;39(3):383–391.
13. Jha CS, Thumaty KC, Rodda SR, Sonakia A, Dadhwal VK. Analysis of carbon dioxide, water vapour and energy fluxes over an Indian teak mixed deciduous forest for winter and summer months using eddy covariance technique. J Earth Syst Sci. 2013;122(5):1259–1268.
14. Sharma N, Nayak RK, Dadhwal VK, Kant Y, Ali MM. Temporal variations of atmospheric CO2 in Dehradun, India during 2009. Air Soil Water Res. 2013;6:37–45.
15. Vaisala. Vaisala CARBOCAP Carbon Dioxide Probe GMP343. Finland: Vaisala Oyj; 2005. http://www.vaisala.com
16. Rigby M, Toumi R, Fisher R, Lowry D, Nisbet EG. First continuous measure-ments of CO2 mixing ratio in central London using a compact diffusion probe. Atmos Environ. 2008;42:8943–8953.
17. Hari P, Pumpanen J, Huotari J, et al. High-frequency measurements of produc-tivity of planktonic algae using rugged nondispersive infrared carbon dioxide probes. Limnol Oceanogr Methods. 2008;6:347–354.
18. Luijikx IT, Neubert REM, Laan Svan der, Meijer HAJ. Continuous measure-ments of atmospheric oxygen and carbon dioxide on a North Sea gas platform. Atmos Meas Tech Discuss. 2009;2:1693–1724.
19. Rella CW, Chen H, Andrews AE, et al. High accuracy measurements of dry mole fractions of carbon dioxide and methane in humid air. Atmos Meas Tech Discuss. 2012;5:5823–5888.
20. Wagner W, Pruss A. International equations for the saturation properties of ordinary water substance revised according to the international temperature scale of 1990 (vol 16, pg 893, 1987). J Phys Chem Ref Data. 1993;22(3):783–787.
21. Idso CD, Idso SB, Balling RC. An intensive two-week study of an urban CO2 dome in Phoenix, Arizona, USA. Atmos Environ. 2001;35(6):995–1000.
22. Still CJ, Riley WJ, Biraud SC, et al. Influence of clouds and diffuse radiation on ecosystem-atmosphere CO2 and CO18O exchanges. J Geophys Res. 009;114:G01018.
23. Gu L, Baldocchi DD, Wofsy SC, et al. Response of a deciduous forest to the Mount Pinatubo eruption: enhanced photosynthesis. Science. 2003;299:2035–2038.
24. Law BE, Falge E, Gu LH, et al. Environment controls over carbon dioxide and water vapor exchange of terrestrial vegetation. Agric For Metorol. 2002;113:97–120.
25. Ghosh D. Large point sources (LPS) emissions from India: regional and sectoral analysis. Atmos Environ. 2002;36:213–224.
Related Documents