1

Welcome message from author
This document is posted to help you gain knowledge. Please leave a comment to let me know what you think about it! Share it to your friends and learn new things together.
Transcript

1
NOTICEMedicine is an ever-changing science. As new research and clinical experience broadenour knowledge, changes in treatment and drug therapy are required. The authors and thepublisher of this work have checked with sources believed to be reliable in their effortsto provide information that is complete and generally in accord with the standardsaccepted at the time of publication. However, in view of the possibility of human erroror changes in medical sciences, neither the authors nor the publisher nor any other partywho has been involved in the preparation or publication of this work warrants that theinformation contained herein is in every respect accurate or complete, and they disclaimall responsibility for any errors or omissions or for the results obtained from use of theinformation contained in this work. Readers are encouraged to confirm the informationcontained herein with other sources. For example and in particular, readers are advisedto check the product information sheet included in the package of each drug they plan toadminister to be certain that the information contained in this work is accurate and thatchanges have not been made in the recommended dose or in the contraindications foradministration. This recommendation is of particular importance in connection with thenew or infrequently used drugs.
2

3

Copyright © 2018 by McGraw-Hill Education. All rights reserved. Printed in the UnitedStates of America. Except as permitted under the United States Copyright Act of 1976, nopart of this publication may be reproduced or distributed in any form or by any means, orstored in a data base or retrieval system, without the prior written permission of the publisher.
ISBN: 978-0-07-178935-6MHID: 0-07-178935-9
The material in this eBook also appears in the print version of this title: ISBN: 978-0-07-178934-9, MHID: 0-07-178934-0.
eBook conversion by codeMantraVersion 1.0
All trademarks are trademarks of their respective owners. Rather than put a trademark symbolafter every occurrence of a trademarked name, we use names in an editorial fashion only, andto the benefit of the trademark owner, with no intention of infringement of the trademark.Where such designations appear in this book, they have been printed with initial caps.
McGraw-Hill Education eBooks are available at special quantity discounts to use aspremiums and sales promotions or for use in corporate training programs. To contact arepresentative, please visit the Contact Us page at www.mhprofessional.com.
TERMS OF USE
This is a copyrighted work and The McGraw-Hill Companies, Inc. (“McGraw-Hill”) and itslicensors reserve all rights in and to the work. Use of this work is subject to these terms.Except as permitted under the Copyright Act of 1976 and the right to store and retrieve onecopy of the work, you may not decompile, disassemble, reverse engineer, reproduce, modify,create derivative works based upon, transmit, distribute, disseminate, sell, publish orsublicense the work or any part of it without McGraw-Hill’s prior consent. You may use thework for your own noncommercial and personal use; any other use of the work is strictlyprohibited. Your right to use the work may be terminated if you fail to comply with theseterms.
THE WORK IS PROVIDED “AS IS.” McGRAW-HILL AND ITS LICENSORS MAKE NOGUARANTEES OR WARRANTIES AS TO THE ACCURACY, ADEQUACY ORCOMPLETENESS OF OR RESULTS TO BE OBTAINED FROM USING THE WORK,INCLUDING ANY INFORMATION THAT CAN BE ACCESSED THROUGH THEWORK VIA HYPERLINK OR OTHERWISE, AND EXPRESSLY DISCLAIM ANYWARRANTY, EXPRESS OR IMPLIED, INCLUDING BUT NOT LIMITED TO IMPLIEDWARRANTIES OF MERCHANTABILITY OR FITNESS FOR A PARTICULARPURPOSE. McGraw-Hill and its licensors do not warrant or guarantee that the functionscontained in the work will meet your requirements or that its operation will be uninterruptedor error free. Neither McGraw-Hill nor its licensors shall be liable to you or anyone else forany inaccuracy, error or omission, regardless of cause, in the work or for any damagesresulting therefrom. McGraw-Hill has no responsibility for the content of any informationaccessed through the work. Under no circumstances shall McGraw-Hill and/or its licensorsbe liable for any indirect, incidental, special, punitive, consequential or similar damages thatresult from the use of or inability to use the work, even if any of them has been advised of thepossibility of such damages. This limitation of liability shall apply to any claim or cause
4

whatsoever whether such claim or cause arises in contract, tort or otherwise.
5
CONTENTS
PrefaceAcknowledgments
1. Basics of Musculoskeletal and Doppler Ultrasound Imaging for RegionalAnesthesia and Pain Medicine
2. Sonoanatomy Relevant for Ultrasound-Guided Upper Extremity Nerve Blocks3. Sonoanatomy Relevant for Ultrasound-Guided Lower Extremity Nerve Blocks4. Sonoanatomy Relevant for Ultrasound-Guided Abdominal Wall Nerve Blocks5. Ultrasound Imaging of the Spine: Basic Considerations6. Sonoanatomy Relevant for Ultrasound-Guided Injections of the Cervical Spine7. Ultrasound of the Thoracic Spine for Thoracic Epidural Injections8. Ultrasound Imaging of the Lumbar Spine for Central Neuraxial Blocks9. Ultrasound Imaging of Sacrum and Lumbosacral Junction for Central Neuraxial
Blocks10. Sonoanatomy Relevant for Thoracic Interfascial Nerve Blocks: Pectoral Nerve
Block and Serratus Plane Block11. Sonoanatomy Relevant for Ultrasound-Guided Thoracic Paravertebral Block12. Sonoanatomy Relevant for Ultrasound-Guided Lumbar Plexus Block
Index
6
PREFACE
This Atlas is intended to illustrate the aspects of sonoanatomy that are important in theperformance of ultrasound guided nerve blocks for acute and chronic pain medicine. The useof ultrasound has increased exponentially in the area of regional anesthesia and pain medicinein the last decade. During this time of evolution, learning sonoanatomy was hampered withthe need to refer to various resources for the technical aspects of machine optimization,correlating sonoanatomy with gross anatomy and other imaging modalities and discoveringthe ergonomic aspects of imaging and intervention.
For regional anesthesia, transitioning from landmark based techniques for nerve blocks toreal time ultrasound image guided nerve blocks required the development of the ability tovisualize and understand the cross sectional anatomy of the area of interest outside thetraditional transverse, sagittal and coronal axis views presented by current modalities such ascomputed tomography and magnetic resonance imaging.
For pain medicine, transitioning from fluoroscopy guided interventions to real timeultrasound image guided or assisted interventions required the development of new points ofreference for interventions and a move away from traditional fluoroscopic guided endpointsfor intervention.
This book is divided into chapters that present the sonoanatomy specific for interventionsin the area of interest. With a total of 768 illustrations this book is designed to be thecomplete resource for gross anatomy, CT, MR and sonoanatomy of the specific area ofinterest for easy cross-reference between gross anatomy and the various modalities allowingusers to better understand the sonoanatomy. These cross-referenced images are presentedwith the relevant anatomy in the same cross sectional plane of the ultrasound image. Withineach area of interest, users are guided to acquire the ideal ultrasound image for targetedintervention with attention to the required ergonomics for operator safety and comfort.
Each approach to the relevant sonoanatomy is accompanied by clinical pearls to aidreaders acquire ultrasound images of the area of interest with ease, provide guidance forsuccessful intervention and avoid pitfalls.
This Atlas has been written both as an introduction for new users to ultrasonography andas a review and instruction aid for users familiar with the subject. It is our sincere hope thatthe users of this book will develop an appreciation of the ease and usefulness ofultrasonography and the beauty of sonoanatomy.
7

ACKNOWLEDGMENTS
We would like to express our deepest gratitude to Philips Medical for their assistance, withspecial appreciation to – Inainee binte Abu Bakar, Lynette Barss, Cheong Yew Keong, DoxieDavis, Nicolaas Delfos, Cellinjit Kaur, William Kok, Nah Lee Tang and Wayne Spittle. And,of course, our families for their support and encouragement.
The anatomic images are courtesy of the Visible Human Server at Ecole PolytechniqueFédérale de Lausanne, Visible Human Visualization Software (http://visiblehuman.epfl.ch),and Gold Standard Multimedia www.gsm.org. All figures and illustrations in this book arereproduced with the kind permission from www.aic.cuhk.edu.hk/usgraweb of the Departmentof Anesthesia and Intensive care of The Chinese University of Hong Kong.
Manoj K. Karmakar, MD, FRCA, DA(UK), FHKCA, FHKAMEdmund Soh, MDVictor Chee, MD
Kenneth Sheah, MD
8

CHAPTER 1
Basics of Musculoskeletal and Doppler UltrasoundImaging for Regional Anesthesia and Pain Medicine
A sound knowledge of the basic concepts of musculoskeletal ultrasound is essential to obtainoptimal images during ultrasound-guided regional anesthesia (USGRA). This chapter brieflysummarizes the ultrasound principles that the operator should be aware of when performingUSGRA.
Ultrasound Transducer FrequencySpatial resolution is the ability to distinguish two closely situated objects as separate. Spatialresolution includes axial resolution (the ability to distinguish two objects at different depthsalong the path of the ultrasound beam) and lateral resolution (the ability to distinguish twoobjects that are side by side perpendicular to the ultrasound beam). Higher transducerfrequencies increase spatial resolution but penetrate poorly into the tissues. Lower transducerfrequencies penetrate deeper into the tissues at the expense of lower spatial resolution. Spatialresolution and beam penetration have to be balanced when choosing the transducerfrequency.
Examples: A high-frequency (6–13 MHz) ultrasound transducer is used to imagesuperficial structures such as the brachial plexus in the interscalene groove or supraclavicularfossa. A lower-frequency transducer (5–10 MHz) is suitable for slightly deeper structuressuch as the brachial plexus in the infraclavicular fossa, and a low-frequency transducer (2–5MHz) is used to image deep structures such as the lumbar paravertebral region or the sciaticnerve. High-frequency (6–13 MHz) linear transducers with a small footprint (25–26 mm) areparticularly suited for regional blocks in young children.
Scanning PlaneScans can be performed in the transverse (axial) or longitudinal plane. During a transversescan, the transducer is oriented at right angles to the long axis of the target, producing across-sectional display of the structures (Fig. 1-1A). During a longitudinal (sagittal) scan, thetransducer is oriented parallel to the long axis of the target (eg, a blood vessel or nerve) (Fig.1-1B). During USGRA, ultrasound scans are most commonly performed in the transverseplane in order to easily visualize the nerves, the adjacent structures, and the circumferentialspread of the local anesthetic.
9

FIGURE 1-1 Axis of scan.
Transducer and Image OrientationThe ultrasound image must be correctly oriented in order to accurately identify theanatomical relationships of the various structures on the display monitor. Ultrasoundtransducers have an orientation marker (eg, a groove or a ridge) on one side of the transducer,which corresponds to a marker on the monitor (eg, a dot or logo) (Fig. 1-2). There are noaccepted standards on how to orient a transducer, but it is common to have the orientationmarker on the transducer directed cephalad when performing a longitudinal scan, anddirected towards the right side of the patient when performing a transverse scan (Fig. 1-3). Inthis way, the monitor “marker” should be at the upper-left corner of the screen representingthe cephalad end during a longitudinal scan, or the right side of the patient during a transversescan (Fig. 1-3). The top of the monitor represents superficial structures, and the bottom of themonitor deep structures.
10

FIGURE 1-2 Transducer orientation. Note the orientation marker varies between differentproviders of ultrasound systems. L, longitudinal, T, transverse and C, coronal.
FIGURE 1-3 Image orientation – transverse scan.
Image OptimizationThe image should be optimized by adjusting the depth, focal zone, and gain. Imaging depthaffects temporal resolution (the ability to accurately depict moving structures) and should bereduced to the smallest field of view (FOV) that is practical. The focal zone should bepositioned at the region of interest to increase lateral resolution at that site. Reducing the totalnumber of focal zones also improves temporal resolution. Finally, the time gaincompensation (TGC) and overall gain should be adjusted to produce an image withappropriate brightness. The TGC is usually adjusted with the near field gain turned down andthe far field gain turned up in steady progression to adjust for beam attenuation with depth.
11

EchogenicityCertain terms are frequently used to describe the sonographic appearance of musculoskeletalstructures (Fig. 1-4):
FIGURE 1-4 Echogenicity of tissues.
Isoechoic: The structure is of the same brightness or echogenicity as the surrounding tissues.Hyperechoic: The structure is bright.Hypoechoic: The structure is dark but not completely black.Anechoic: The structure has no echoes and appears completely black.
Contrast resolution is the ability to distinguish subtle differences in echogenicity betweentwo adjacent structures.
Axis of InterventionDuring USGRA, the block needle can be visualized in its short axis (out-of-plane approach)(Fig. 1-5) or long axis (in-plane approach) (Fig. 1-6). In the out-of-plane approach, the needleis initially outside the plane of imaging and therefore not visible. The needle only becomesvisible when it crosses the plane of imaging and is seen as an echogenic dot on the monitor(Fig. 1-5). It is important to note that this echogenic dot may not represent the tip of theneedle because it is a short-axis view. In the in-plane approach the needle is inserted alongthe plane of imaging and therefore both the shaft and tip of the needle are visible on themonitor (Fig. 1-6).
12
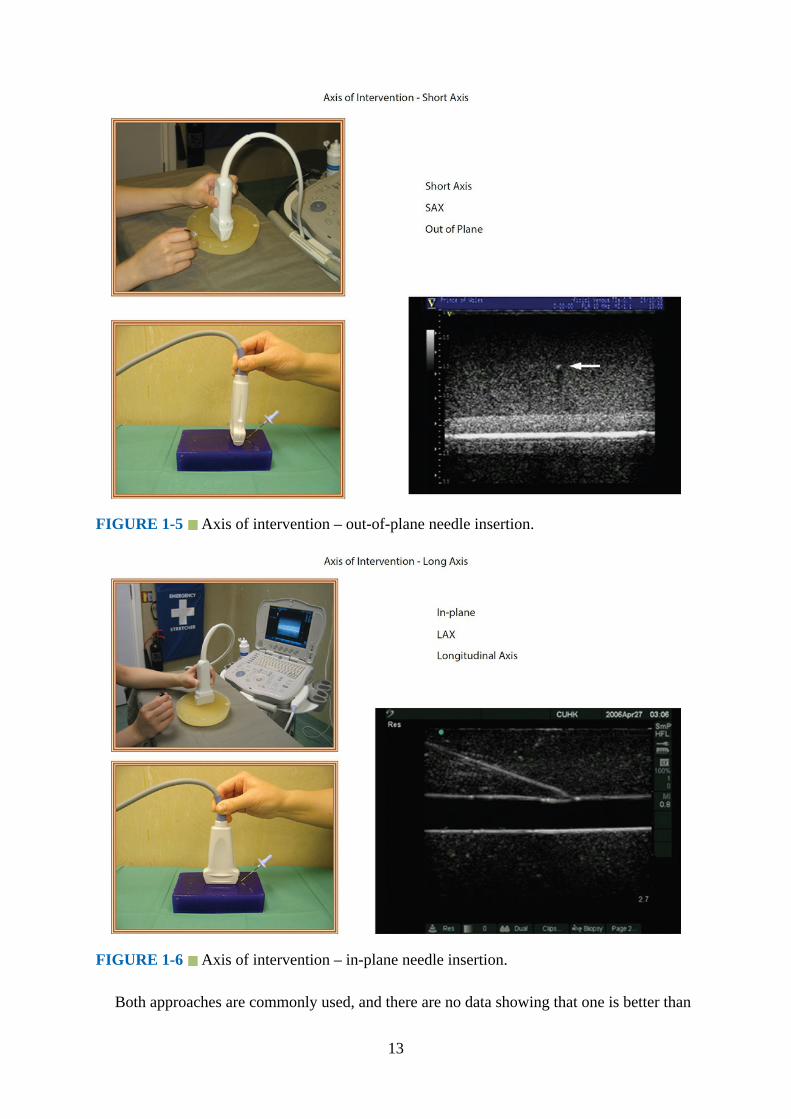
FIGURE 1-5 Axis of intervention – out-of-plane needle insertion.
FIGURE 1-6 Axis of intervention – in-plane needle insertion.
Both approaches are commonly used, and there are no data showing that one is better than
13

the other. Pros and cons for both methods have been debated. Proponents of the out-of-planeapproach have had great success with this method and claim that it causes less needle-relatedtrauma and pain because the needle is advanced through a shorter distance to the target.However, critics of the out-of-plane approach express concerns that the inability to reliablyvisualize the needle and using tissue movement as a surrogate marker to locate the needle tipduring a procedure can lead to complications. The needle is better visualized in the in-planeapproach, but this requires good hand–eye coordination, and reverberation artifacts from theshaft of the needle can be problematic. Moreover, there are claims that the in-plane approachalso causes more discomfort in awake patients because longer needle insertion paths arerequired.
Field of View and Needle VisibilityHaving an adequate FOV during USGRA is important because it not only allows one tovisualize the “target,” but also the neighboring structures (eg, blood vessel, pleura, etc.) thatone wishes to avoid injury to. Linear array transducers have a narrow FOV, whereas curvedarray transducers have a divergent ultrasound beam resulting in a wider FOV (Fig. 1-7).
FIGURE 1-7 Comparative field of view of the infraclavicular fossa with linear and curvedarray transducers.
Needles are best visualized when imaged perpendicular to the ultrasound beam. Needles atsteep angles required for deep blocks may not be easily visualized with linear arraytransducers. Linear array transducers are best suited for superficial blocks (eg, axillary orinterscalene brachial plexus block, femoral nerve block). Curved array transducers are moresuitable for deep blocks (eg, sciatic nerve block, lumbar plexus block, and central neuraxialblocks). However, curved array transducers have reduced lateral resolution at depth due tothe diverging ultrasound beam.
Other factors can also influence needle visibility. The needle is better visualized in its longaxis than in its short axis, and its visibility decreases linearly with smaller needle diameters.The needle tip is better visualized when in its long axis for shallow angles of insertion (lessthan 30 degrees), and in its short axis when the angle of insertion is steep (greater than 60degrees). This is also true when the needle is inserted with its bevel facing the ultrasound
14
transducer. To overcome the effect of angle on needle visibility, some high-end ultrasoundmachines allow the operator to steer the ultrasound beam (beam steering) towards the needleduring steep insertions. However, this requires experience, and decreases in needle visibilitycan still occur. Needle visibility is also enhanced in the presence of a medium-sized guidewire. Priming a needle with saline or air, insulating it, or inserting a stylet prior to insertiondoes not improve visibility.
We believe that the anesthesiologist’s skill in aligning the needle along the plane ofimaging is by far the most important variable influencing needle visibility because minordeviations of even a few millimeters from this plane can result in an inability to visualize theneedle. Even with experience, needle tip visibility is a problem when performing blocks atdepth, in areas that are rich in fatty tissue, and in the elderly. Under such circumstancesgently jiggling (rapid in-and-out movement) the needle and observing tissue movement orperforming a test injection of saline or 5% dextrose (1–2 mL) and observing tissue distentioncan help locate the position of the needle tip. The preference is for 5% dextrose for the latterwhen nerve stimulation is used because it does not increase the electric current required toelicit a motor response.
AnisotropyAnisotropy, or angular dependence, is a term used to describe the change in echogenicity of astructure with a change in the angle of insonation of the incident ultrasound beam (Fig. 1-8).It is frequently observed during scanning of nerves, muscles, and tendons. This occursbecause the amplitude of the echoes returning to the transducer varies with the angle ofinsonation. Nerves are best visualized when the incident beam is at right angles; smallchanges in the angle away from the perpendicular can significantly reduce their echogenicity.Therefore, during USGRA the transducer should be tilted from side to side to minimizeanisotropy and optimize visualization of the nerve. Although poorly understood, differentnerves also exhibit differences in anisotropy; this may be related to the internal architectureof the nerve.
15

FIGURE 1-8 Anisotropy – effect of angulation of the transducer on the echogenicity of themedian nerve (white arrow) in the forearm. The median nerve appears hypoechoic in theimage on the right.
Identification of Normal StructuresNerve
Peripheral nerves consist of hypoechoic nerve fascicles surrounded by hyperechoicconnective tissue and have a “honeycomb” appearance in the transverse axis (Fig. 1-9). Theyhave a fibrillar appearance in the longitudinal axis with fine parallel hyperechoic linesseparated by fine hypoechoic lines. Generally, nerves appear hyperechoic, but the appearancecan vary depending on the surrounding structures. For example, nerves appear hyperechoicwhen surrounded by hypoechoic muscle, but can appear hypoechoic when surrounded byhyperechoic fat. The echogenicity of a nerve may also vary depending on the location whereit is scanned; for example, the brachial plexus nerves appear hypoechoic at the interscalenegroove, but are hyperechoic at the infraclavicular fossa and axilla. The exact reason for this isnot clear, but may be related to the relative proportion of neural and connective tissue withinthe nerve. The ratio of neural to non-neural tissue content within the epineurium of the nerveincreases from 1:1 in the interscalene/supraclavicular fossa to 1:2 in the mid-infraclavicular/paracoracoid regions. Nerve motion can also be demonstrated on dynamicultrasound imaging.
16
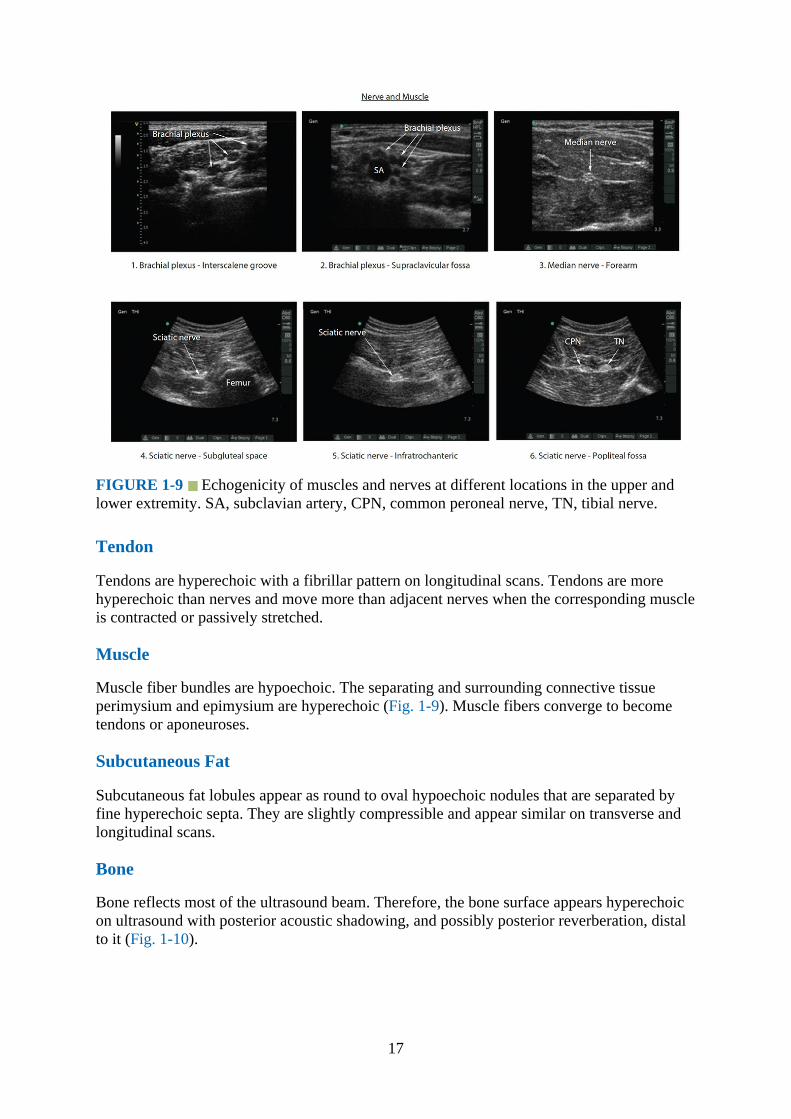
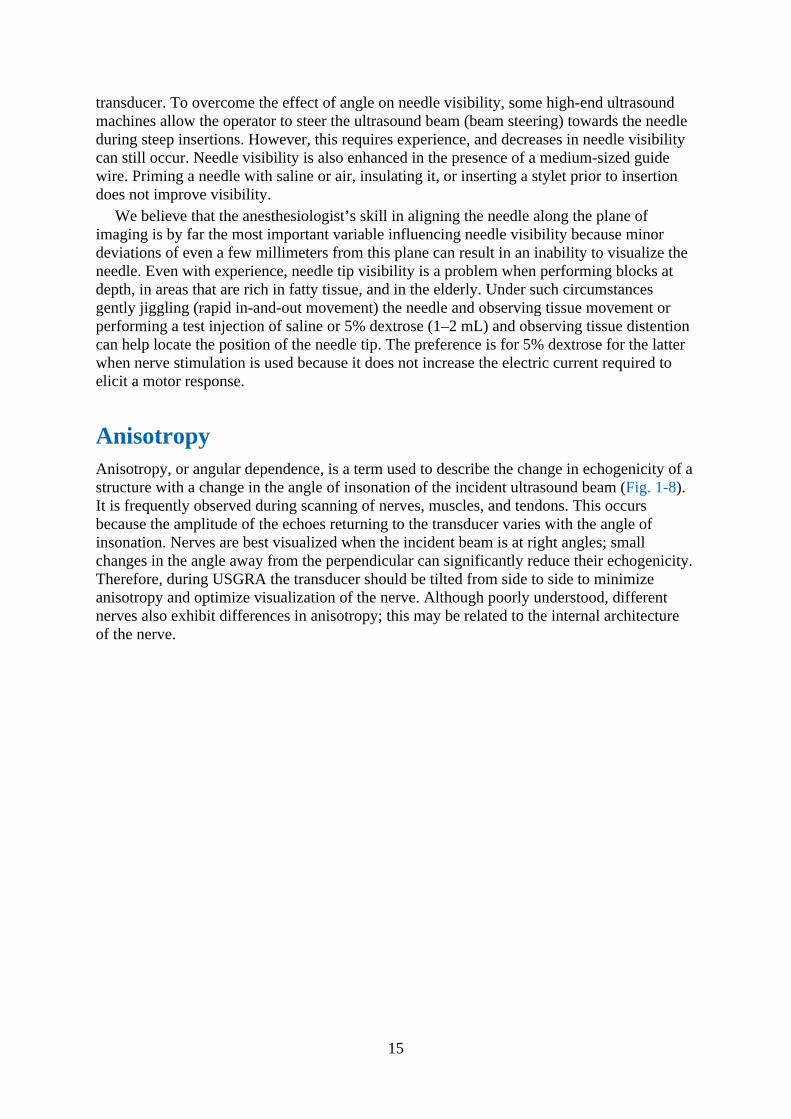
FIGURE 1-9 Echogenicity of muscles and nerves at different locations in the upper andlower extremity. SA, subclavian artery, CPN, common peroneal nerve, TN, tibial nerve.
Tendon
Tendons are hyperechoic with a fibrillar pattern on longitudinal scans. Tendons are morehyperechoic than nerves and move more than adjacent nerves when the corresponding muscleis contracted or passively stretched.
Muscle
Muscle fiber bundles are hypoechoic. The separating and surrounding connective tissueperimysium and epimysium are hyperechoic (Fig. 1-9). Muscle fibers converge to becometendons or aponeuroses.
Subcutaneous Fat
Subcutaneous fat lobules appear as round to oval hypoechoic nodules that are separated byfine hyperechoic septa. They are slightly compressible and appear similar on transverse andlongitudinal scans.
Bone
Bone reflects most of the ultrasound beam. Therefore, the bone surface appears hyperechoicon ultrasound with posterior acoustic shadowing, and possibly posterior reverberation, distalto it (Fig. 1-10).
17
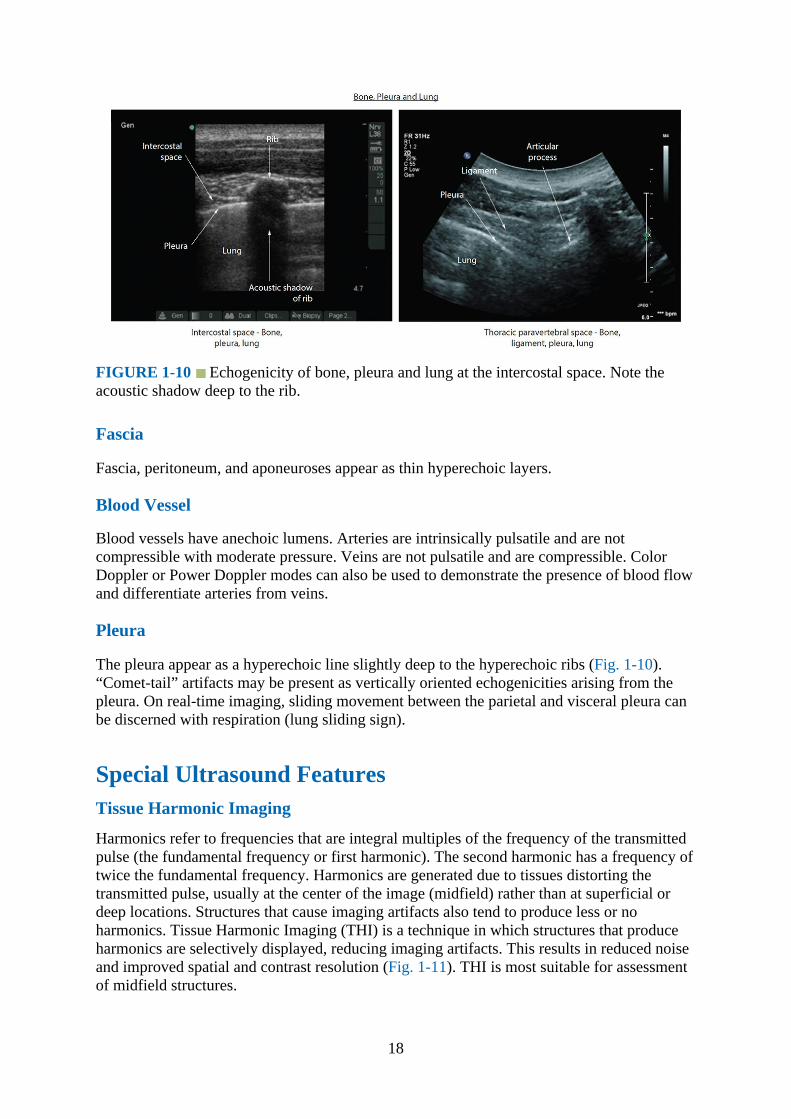
FIGURE 1-10 Echogenicity of bone, pleura and lung at the intercostal space. Note theacoustic shadow deep to the rib.
Fascia
Fascia, peritoneum, and aponeuroses appear as thin hyperechoic layers.
Blood Vessel
Blood vessels have anechoic lumens. Arteries are intrinsically pulsatile and are notcompressible with moderate pressure. Veins are not pulsatile and are compressible. ColorDoppler or Power Doppler modes can also be used to demonstrate the presence of blood flowand differentiate arteries from veins.
Pleura
The pleura appear as a hyperechoic line slightly deep to the hyperechoic ribs (Fig. 1-10).“Comet-tail” artifacts may be present as vertically oriented echogenicities arising from thepleura. On real-time imaging, sliding movement between the parietal and visceral pleura canbe discerned with respiration (lung sliding sign).
Special Ultrasound FeaturesTissue Harmonic Imaging
Harmonics refer to frequencies that are integral multiples of the frequency of the transmittedpulse (the fundamental frequency or first harmonic). The second harmonic has a frequency oftwice the fundamental frequency. Harmonics are generated due to tissues distorting thetransmitted pulse, usually at the center of the image (midfield) rather than at superficial ordeep locations. Structures that cause imaging artifacts also tend to produce less or noharmonics. Tissue Harmonic Imaging (THI) is a technique in which structures that produceharmonics are selectively displayed, reducing imaging artifacts. This results in reduced noiseand improved spatial and contrast resolution (Fig. 1-11). THI is most suitable for assessmentof midfield structures.
18
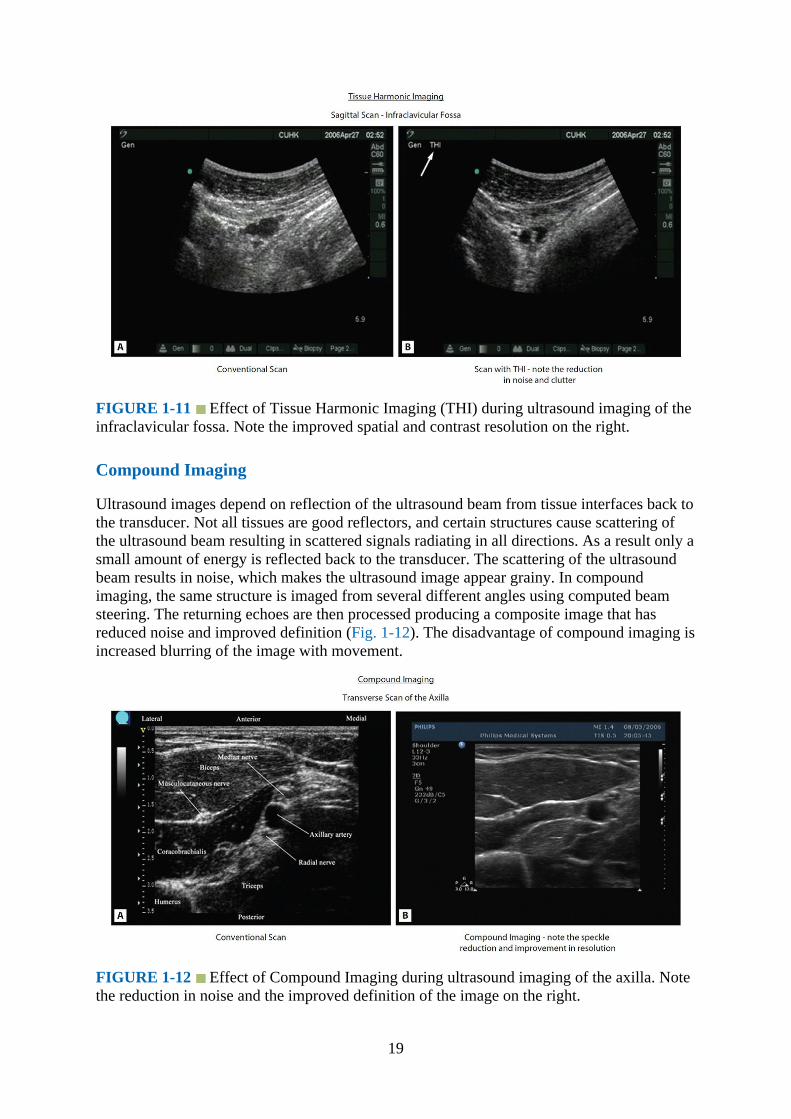
FIGURE 1-11 Effect of Tissue Harmonic Imaging (THI) during ultrasound imaging of theinfraclavicular fossa. Note the improved spatial and contrast resolution on the right.
Compound Imaging
Ultrasound images depend on reflection of the ultrasound beam from tissue interfaces back tothe transducer. Not all tissues are good reflectors, and certain structures cause scattering ofthe ultrasound beam resulting in scattered signals radiating in all directions. As a result only asmall amount of energy is reflected back to the transducer. The scattering of the ultrasoundbeam results in noise, which makes the ultrasound image appear grainy. In compoundimaging, the same structure is imaged from several different angles using computed beamsteering. The returning echoes are then processed producing a composite image that hasreduced noise and improved definition (Fig. 1-12). The disadvantage of compound imaging isincreased blurring of the image with movement.
FIGURE 1-12 Effect of Compound Imaging during ultrasound imaging of the axilla. Notethe reduction in noise and the improved definition of the image on the right.
19

Panoramic Imaging
Conventional 2-D ultrasound has a limited FOV and allows visualization of only a smallportion of any large structure. Panoramic imaging, as the name implies, is a technique used toextend the FOV so that larger structures can be visualized in their entirety. During apanoramic scan, the operator slowly slides the transducer across a region of interest. Imageinformation obtained during this motion is accumulated and then combined to form thecomposite panoramic image (Fig. 1-13). Although useful for annotation, documentation,teaching, and research, it is rarely used during USGRA at present.
FIGURE 1-13 Panoramic transverse sonogram of the midforearm. FDS, flexor digitorumsuperficialis; FDP, flexor digitorum profundus; FPL, flexor pollicis longus; FCU, flexor carpiulnaris.
Three-Dimensional Ultrasound
Three-dimensional ultrasound acquires data as a volume and allows reconstruction at anyimaging plane without needing to move the transducer (Figs. 1-14 and 1-15). This canimprove spatial awareness at the region of interest, visualization of the block needle, anddistribution of the local anesthetic. Potential advantages include reduced needle-associatedcomplications and increased block success with smaller volumes of local anesthetic. Inaddition, the volume data can be stored and retrospectively analyzed for teaching or research.The main challenges with 3-D ultrasound at present include lack of availability of ergonomicprobes that can operate at high frequencies to assess superficial structures, slow screenrefresh rates, and reduced temporal resolution when performing real-time interventions.
20

FIGURE 1-14 A multiplanar 3-D ultrasound image of the sciatic nerve at the midthighwith the reference marker (green crosshair) placed over the sciatic nerve.
FIGURE 1-15 A rendered 3-D ultrasound image of the sciatic nerve at the midthigh. Thefront and right surfaces of the 3-D volume are displayed. Note the hypoechoic perineuralspace posterior to the sciatic nerve in this image.
21
ArtifactsAn ultrasound artifact is information that is visible in the ultrasound image that does notcorrelate with any anatomical structure. The ultrasound machine makes several assumptionswhen generating an image:
1.The ultrasound beam travels in a straight line with a constant rate of attenuation.2.The speed of sound through body tissue is 1540 meters/second.3.The ultrasound beam is infinitely thin with all echoes originating from its central axis.4.The depth of a reflector is directly related to the round-trip time of the ultrasound signal.
Artifacts arise when there is deviation from these assumptions. Some artifacts areundesirable and interfere with interpretation, whereas others help identify certain structures.It is essential to recognize them in order to avoid misinterpretation. Therefore, whenever astructure appears abnormal on ultrasound, it must be examined at different angles andorientations to avoid making a wrong interpretation. Real anatomical structures are visible inall planes of imaging, whereas artifacts are generally only visible in one plane.
Artifacts that are frequently encountered during USGRA include:
1.Contact artifactThis is the most common artifact that occurs whenever there is a loss of acoustic couplingbetween the skin and the transducer. This could simply occur because the transducer isnot touching the skin, but more frequently it is due to air bubbles that are trapped betweenthe skin and the transducer. Therefore, it is prudent to apply liberal amounts of ultrasoundgel to exclude air from the skin–transducer interface.
2.Reverberation artifactReverberation artifacts, also known as “repetitive echoes,” occur whenever there isrepeated reflection of the ultrasound beam between two highly reflective surfaces. Someof the ultrasound signals returning to the transducer are reflected back, which then strikethe original interface and are reflected back towards the transducer a second time. As aresult the first reverberation artifact is twice as far from the skin surface as the originalinterface. One may also see a second or third reverberation artifact (Fig. 1-16). Due toattenuation, the intensity of the artifacts decreases with increasing distance from thetransducer. Reverberation artifacts are frequently seen during ultrasound-guided axillarybrachial plexus blocks, particularly when the needle is viewed in its long axis (Fig. 1-17).They are reduced if the needle is less perpendicular to the transducer, but this may alsoreduce needle visibility.
22

FIGURE 1-16 Schematic diagram illustrating how a reverberation artifact is produced.
FIGURE 1-17 Reverberation artifact induced by the block needle during an ultrasound-guided axillary brachial plexus block. AA, axillary artery; MCN, musculocutaneous nerve.
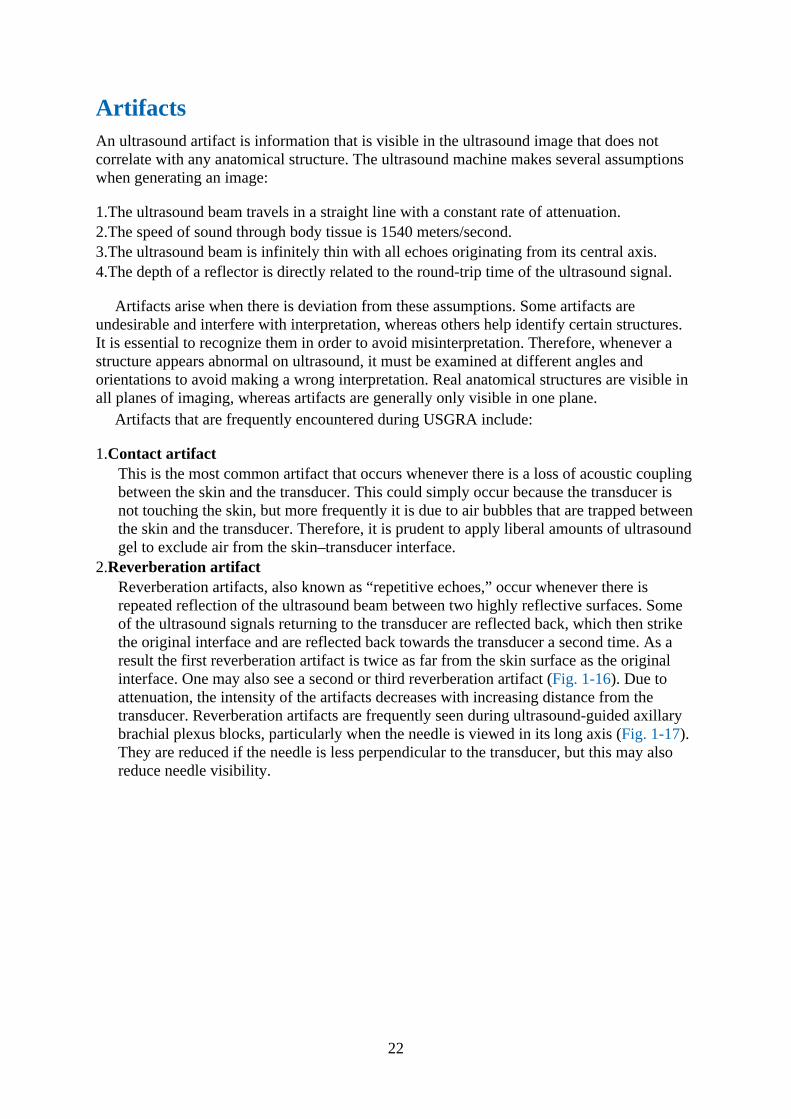
3.Mirror image artifactMirror image artifact is a type of reverberation artifact that occurs at highly reflectiveinterfaces. The first image is displayed in the correct position, and a false image isproduced on the other side of the reflector due to its mirrorlike effect (Fig. 1-18).
23
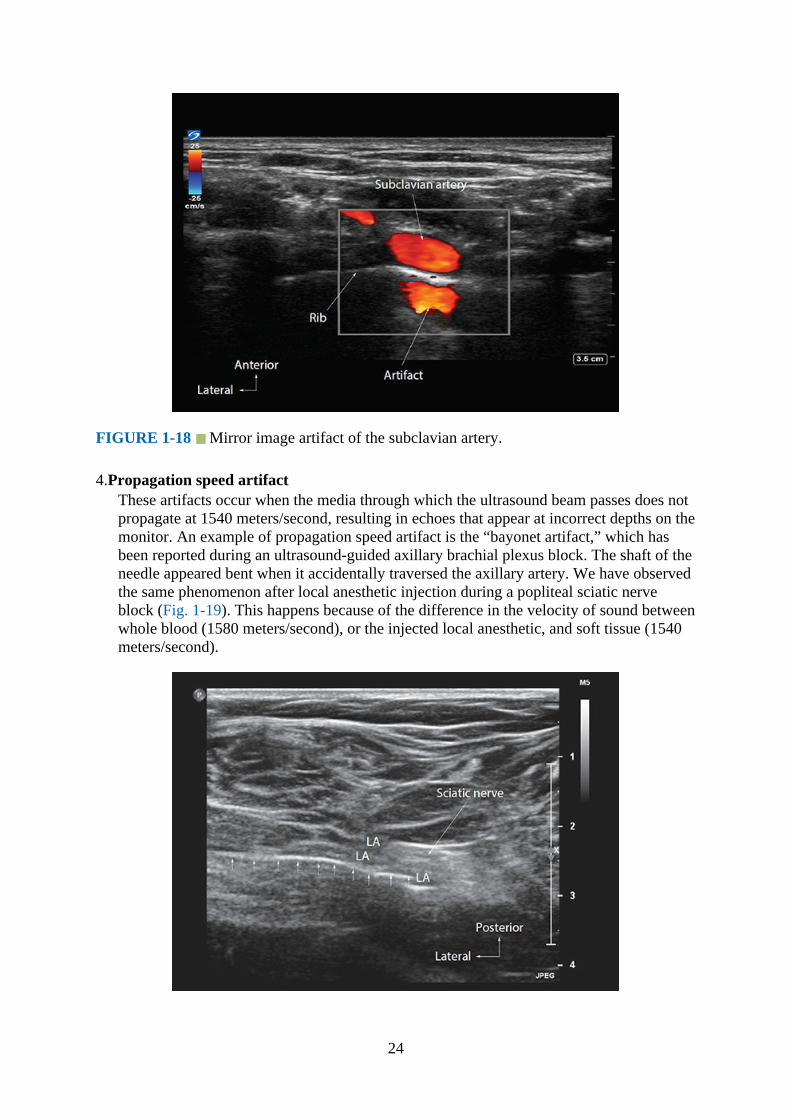
FIGURE 1-18 Mirror image artifact of the subclavian artery.
4.Propagation speed artifactThese artifacts occur when the media through which the ultrasound beam passes does notpropagate at 1540 meters/second, resulting in echoes that appear at incorrect depths on themonitor. An example of propagation speed artifact is the “bayonet artifact,” which hasbeen reported during an ultrasound-guided axillary brachial plexus block. The shaft of theneedle appeared bent when it accidentally traversed the axillary artery. We have observedthe same phenomenon after local anesthetic injection during a popliteal sciatic nerveblock (Fig. 1-19). This happens because of the difference in the velocity of sound betweenwhole blood (1580 meters/second), or the injected local anesthetic, and soft tissue (1540meters/second).
24

FIGURE 1-19 Bayonet artifact induced by the local anesthetic injection during anultrasound guided popliteal sciatic nerve block. Note the shaft of the needle appears bentclose to the area occupied by the local anesthetic.
5.Acoustic shadowingAn acoustic shadow is a hypoechoic or anechoic region deep to surfaces that are highlyreflective or attenuating such as bone (Fig. 1-10) or metallic implants. The implication forregional anesthesia is that tissues in the region of the shadow cannot be visualized. Onebenefit of this artifact is that the acoustic shadow of the block needle helps in identifyingits location.
6.Acoustic enhancementAcoustic enhancement results when the ultrasound beam passes through a low-attenuatingstructure resulting in brighter echoes from the deeper tissues. It is commonly seen deep tofluid-filled structures such as blood vessels. The increased brightness may saturate thedisplay and make it difficult to identify nerves posterior to large blood vessels. A commonexample is when one visualizes the posterior cord of the brachial plexus at theparacoracoid (lateral infraclavicular fossa) location. The bright echoes posterior to theaxillary artery (second part) and deep to the pectoralis major and minor muscles may beconfused as the posterior cord (Fig. 1-20).
FIGURE 1-20 Acoustic enhancement seen posterior to the axillary artery and vein duringan ultrasound guided infraclavicular brachial plexus block. The bright echoes posterior theaxillary artery may be confused as the posterior cord.
Imaging the Challenging PatientThe Elderly Patient
Muscle fibers become hyperechoic with age (Fig. 1-21) due to muscle atrophy and infiltrationby fat and connective tissue. The hyperechoic muscle is more likely to reflect the ultrasoundbeam and reduce penetration of deeper structures. Reduced contrast resolution between the
25
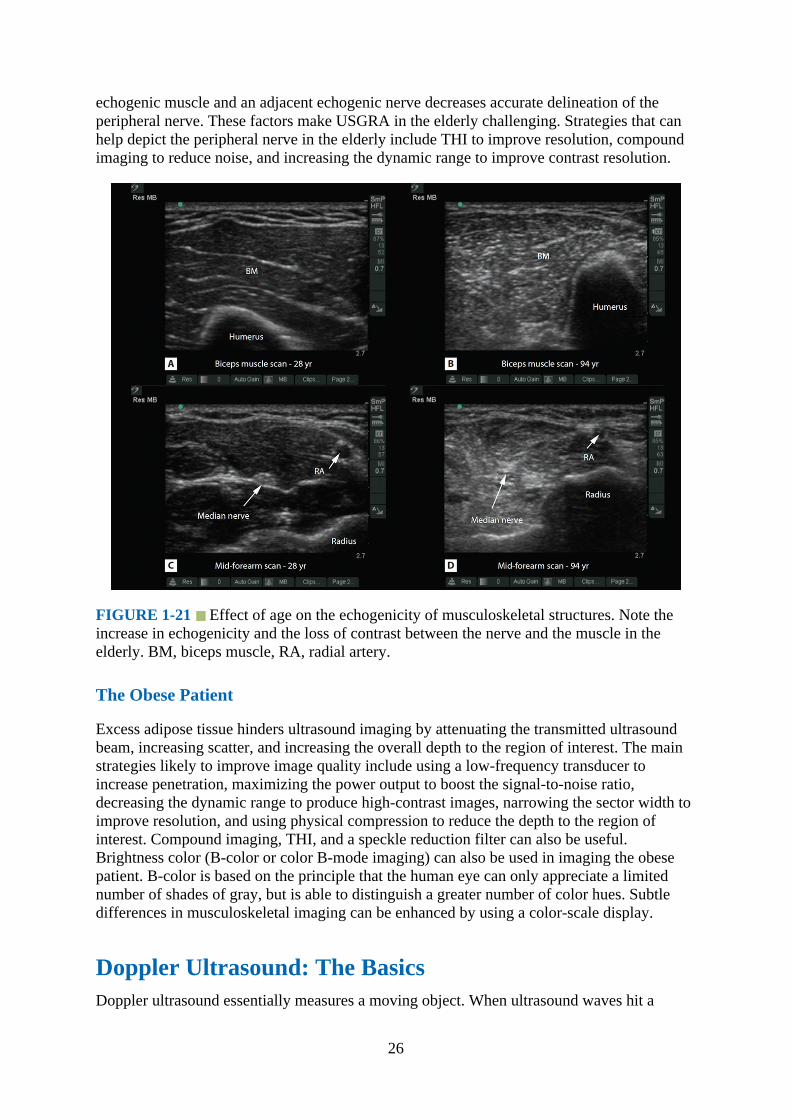
echogenic muscle and an adjacent echogenic nerve decreases accurate delineation of theperipheral nerve. These factors make USGRA in the elderly challenging. Strategies that canhelp depict the peripheral nerve in the elderly include THI to improve resolution, compoundimaging to reduce noise, and increasing the dynamic range to improve contrast resolution.
FIGURE 1-21 Effect of age on the echogenicity of musculoskeletal structures. Note theincrease in echogenicity and the loss of contrast between the nerve and the muscle in theelderly. BM, biceps muscle, RA, radial artery.
The Obese Patient
Excess adipose tissue hinders ultrasound imaging by attenuating the transmitted ultrasoundbeam, increasing scatter, and increasing the overall depth to the region of interest. The mainstrategies likely to improve image quality include using a low-frequency transducer toincrease penetration, maximizing the power output to boost the signal-to-noise ratio,decreasing the dynamic range to produce high-contrast images, narrowing the sector width toimprove resolution, and using physical compression to reduce the depth to the region ofinterest. Compound imaging, THI, and a speckle reduction filter can also be useful.Brightness color (B-color or color B-mode imaging) can also be used in imaging the obesepatient. B-color is based on the principle that the human eye can only appreciate a limitednumber of shades of gray, but is able to distinguish a greater number of color hues. Subtledifferences in musculoskeletal imaging can be enhanced by using a color-scale display.
Doppler Ultrasound: The BasicsDoppler ultrasound essentially measures a moving object. When ultrasound waves hit a
26
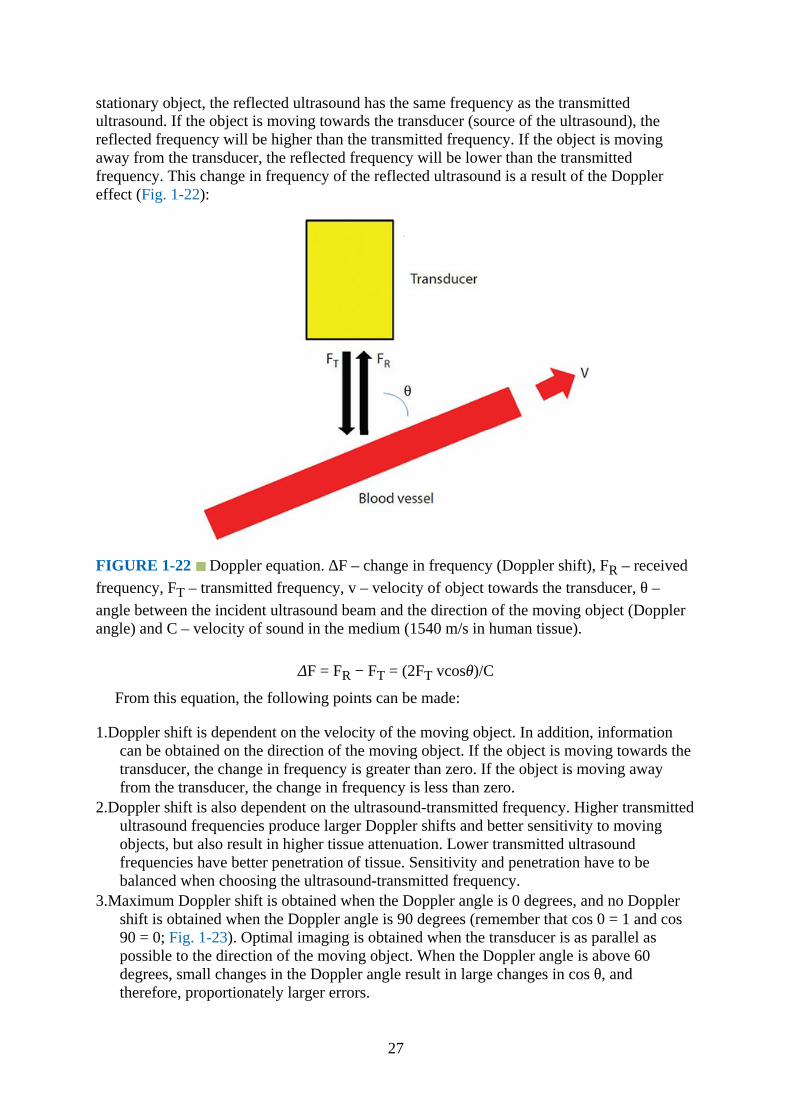
stationary object, the reflected ultrasound has the same frequency as the transmittedultrasound. If the object is moving towards the transducer (source of the ultrasound), thereflected frequency will be higher than the transmitted frequency. If the object is movingaway from the transducer, the reflected frequency will be lower than the transmittedfrequency. This change in frequency of the reflected ultrasound is a result of the Dopplereffect (Fig. 1-22):
FIGURE 1-22 Doppler equation. ∆F – change in frequency (Doppler shift), FR – receivedfrequency, FT – transmitted frequency, v – velocity of object towards the transducer, θ –angle between the incident ultrasound beam and the direction of the moving object (Dopplerangle) and C – velocity of sound in the medium (1540 m/s in human tissue).
ΔF = FR − FT = (2FT vcosθ)/C
From this equation, the following points can be made:
1.Doppler shift is dependent on the velocity of the moving object. In addition, informationcan be obtained on the direction of the moving object. If the object is moving towards thetransducer, the change in frequency is greater than zero. If the object is moving awayfrom the transducer, the change in frequency is less than zero.
2.Doppler shift is also dependent on the ultrasound-transmitted frequency. Higher transmittedultrasound frequencies produce larger Doppler shifts and better sensitivity to movingobjects, but also result in higher tissue attenuation. Lower transmitted ultrasoundfrequencies have better penetration of tissue. Sensitivity and penetration have to bebalanced when choosing the ultrasound-transmitted frequency.
3.Maximum Doppler shift is obtained when the Doppler angle is 0 degrees, and no Dopplershift is obtained when the Doppler angle is 90 degrees (remember that cos 0 = 1 and cos90 = 0; Fig. 1-23). Optimal imaging is obtained when the transducer is as parallel aspossible to the direction of the moving object. When the Doppler angle is above 60degrees, small changes in the Doppler angle result in large changes in cos θ, andtherefore, proportionately larger errors.
27
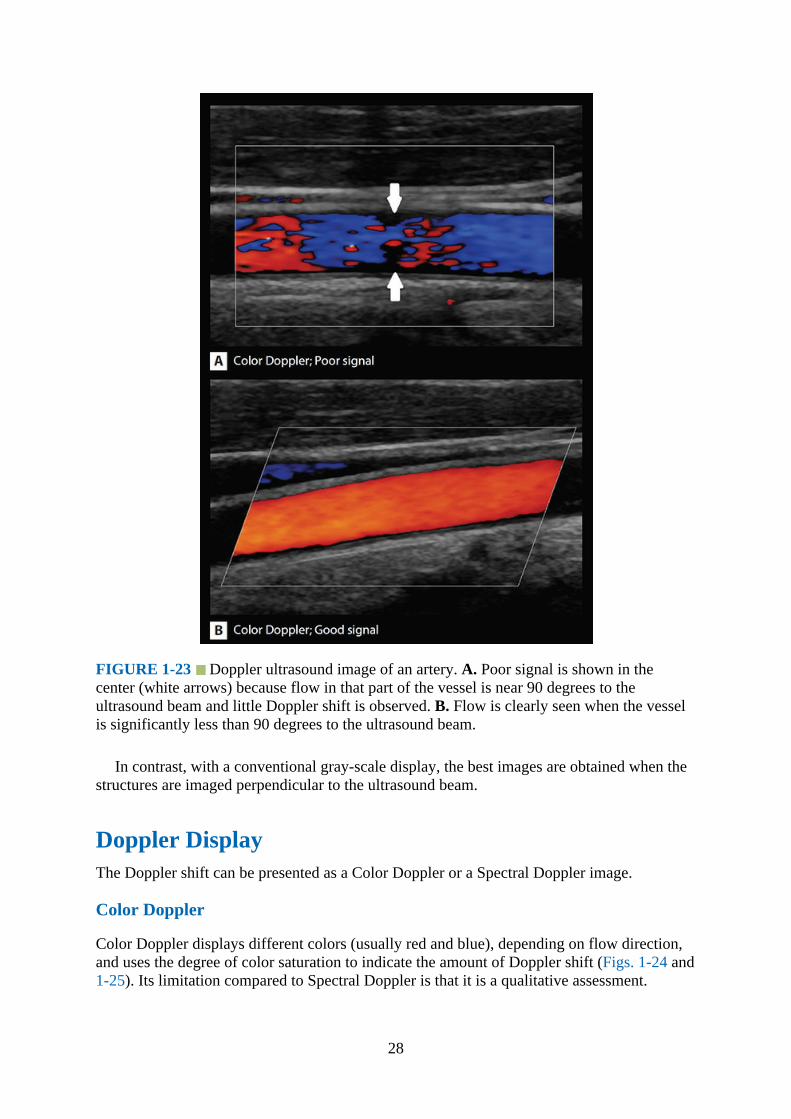
FIGURE 1-23 Doppler ultrasound image of an artery. A. Poor signal is shown in thecenter (white arrows) because flow in that part of the vessel is near 90 degrees to theultrasound beam and little Doppler shift is observed. B. Flow is clearly seen when the vesselis significantly less than 90 degrees to the ultrasound beam.
In contrast, with a conventional gray-scale display, the best images are obtained when thestructures are imaged perpendicular to the ultrasound beam.
Doppler DisplayThe Doppler shift can be presented as a Color Doppler or a Spectral Doppler image.
Color Doppler
Color Doppler displays different colors (usually red and blue), depending on flow direction,and uses the degree of color saturation to indicate the amount of Doppler shift (Figs. 1-24 and1-25). Its limitation compared to Spectral Doppler is that it is a qualitative assessment.
28
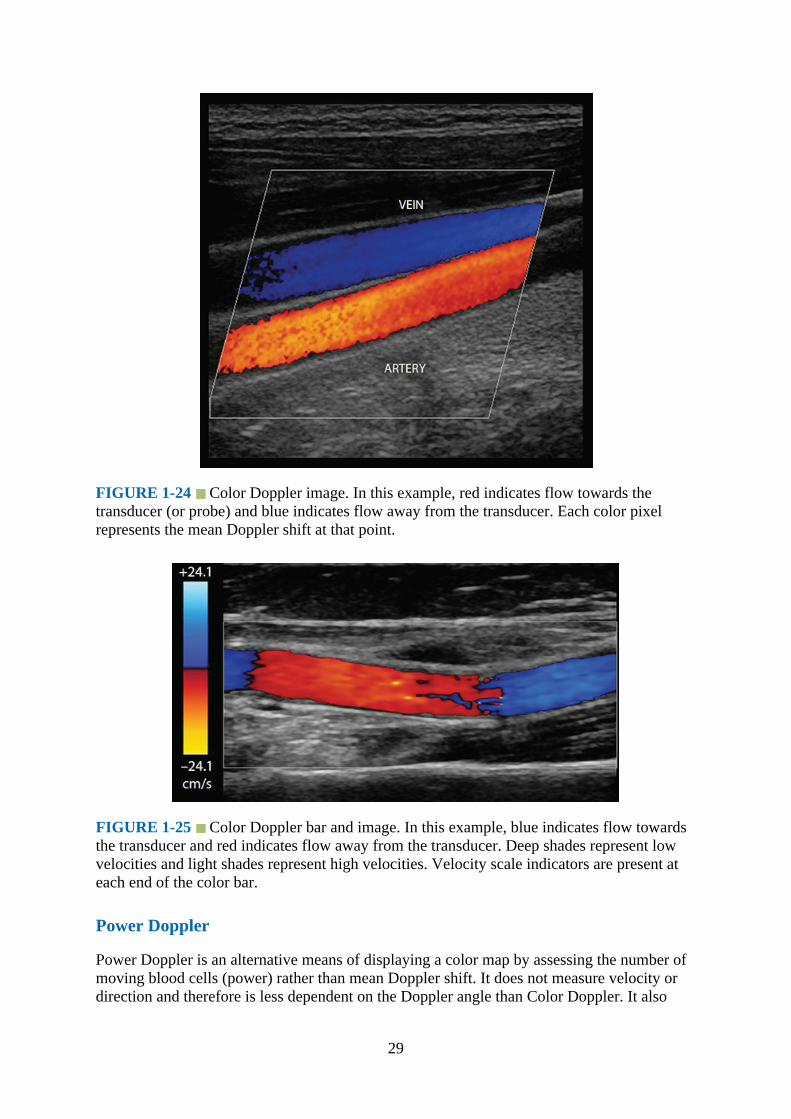
FIGURE 1-24 Color Doppler image. In this example, red indicates flow towards thetransducer (or probe) and blue indicates flow away from the transducer. Each color pixelrepresents the mean Doppler shift at that point.
FIGURE 1-25 Color Doppler bar and image. In this example, blue indicates flow towardsthe transducer and red indicates flow away from the transducer. Deep shades represent lowvelocities and light shades represent high velocities. Velocity scale indicators are present ateach end of the color bar.
Power Doppler
Power Doppler is an alternative means of displaying a color map by assessing the number ofmoving blood cells (power) rather than mean Doppler shift. It does not measure velocity ordirection and therefore is less dependent on the Doppler angle than Color Doppler. It also
29
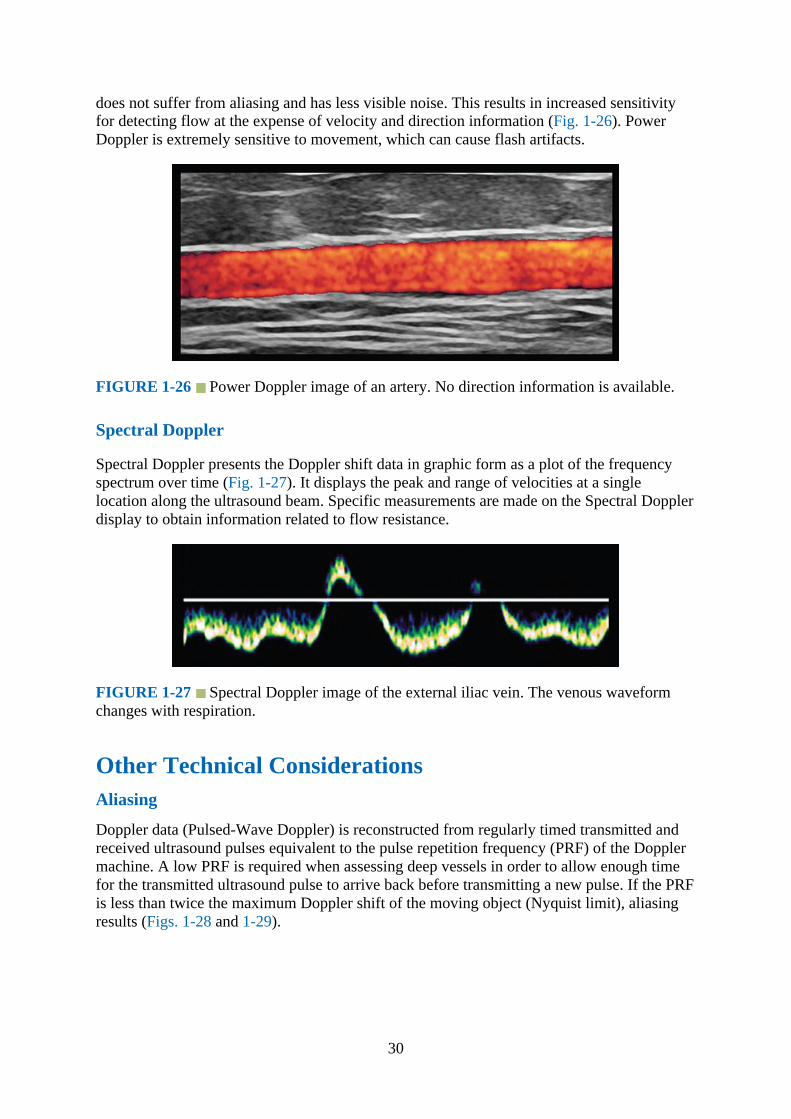
does not suffer from aliasing and has less visible noise. This results in increased sensitivityfor detecting flow at the expense of velocity and direction information (Fig. 1-26). PowerDoppler is extremely sensitive to movement, which can cause flash artifacts.
FIGURE 1-26 Power Doppler image of an artery. No direction information is available.
Spectral Doppler
Spectral Doppler presents the Doppler shift data in graphic form as a plot of the frequencyspectrum over time (Fig. 1-27). It displays the peak and range of velocities at a singlelocation along the ultrasound beam. Specific measurements are made on the Spectral Dopplerdisplay to obtain information related to flow resistance.
FIGURE 1-27 Spectral Doppler image of the external iliac vein. The venous waveformchanges with respiration.
Other Technical ConsiderationsAliasing
Doppler data (Pulsed-Wave Doppler) is reconstructed from regularly timed transmitted andreceived ultrasound pulses equivalent to the pulse repetition frequency (PRF) of the Dopplermachine. A low PRF is required when assessing deep vessels in order to allow enough timefor the transmitted ultrasound pulse to arrive back before transmitting a new pulse. If the PRFis less than twice the maximum Doppler shift of the moving object (Nyquist limit), aliasingresults (Figs. 1-28 and 1-29).
30
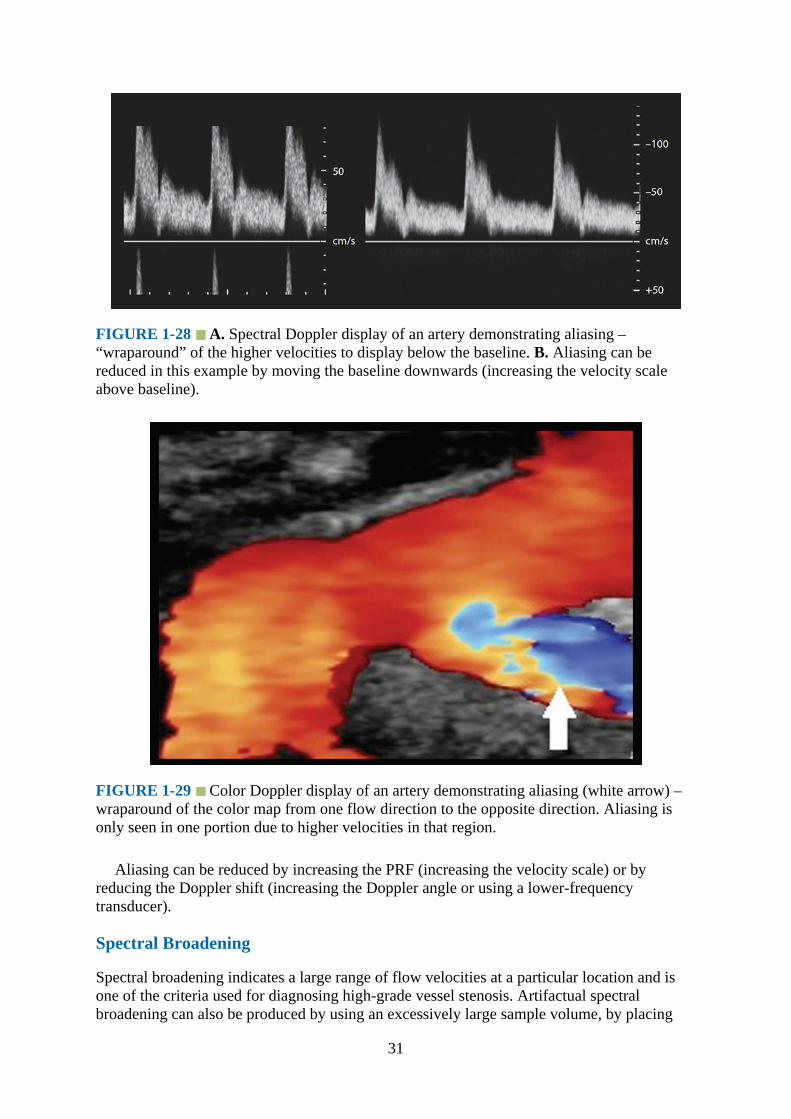
FIGURE 1-28 A. Spectral Doppler display of an artery demonstrating aliasing –“wraparound” of the higher velocities to display below the baseline. B. Aliasing can bereduced in this example by moving the baseline downwards (increasing the velocity scaleabove baseline).
FIGURE 1-29 Color Doppler display of an artery demonstrating aliasing (white arrow) –wraparound of the color map from one flow direction to the opposite direction. Aliasing isonly seen in one portion due to higher velocities in that region.
Aliasing can be reduced by increasing the PRF (increasing the velocity scale) or byreducing the Doppler shift (increasing the Doppler angle or using a lower-frequencytransducer).
Spectral Broadening
Spectral broadening indicates a large range of flow velocities at a particular location and isone of the criteria used for diagnosing high-grade vessel stenosis. Artifactual spectralbroadening can also be produced by using an excessively large sample volume, by placing
31
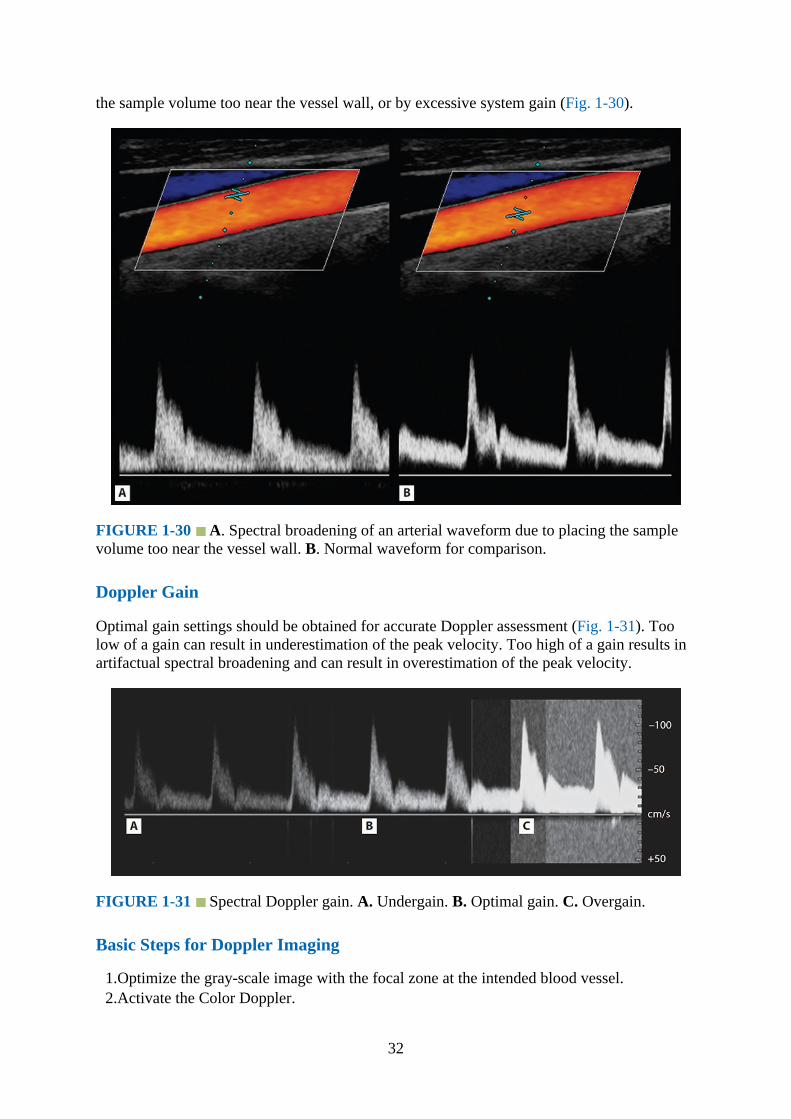
the sample volume too near the vessel wall, or by excessive system gain (Fig. 1-30).
FIGURE 1-30 A. Spectral broadening of an arterial waveform due to placing the samplevolume too near the vessel wall. B. Normal waveform for comparison.
Doppler Gain
Optimal gain settings should be obtained for accurate Doppler assessment (Fig. 1-31). Toolow of a gain can result in underestimation of the peak velocity. Too high of a gain results inartifactual spectral broadening and can result in overestimation of the peak velocity.
FIGURE 1-31 Spectral Doppler gain. A. Undergain. B. Optimal gain. C. Overgain.
Basic Steps for Doppler Imaging
1.Optimize the gray-scale image with the focal zone at the intended blood vessel.2.Activate the Color Doppler.
32
3.Position the color box over the vessel (keep the box size as small as reasonably possible).4.Steer the color box to align with blood flow.5.Choose the appropriate velocity scale.6.Optimize the Color Doppler gain.7.Place the Pulsed-Wave Doppler cursor within the vessel lumen, and adjust the sample
volume as required (try to avoid the vessel walls).8.Align the angle-correction cursor with the blood flow. If the Doppler angle is more than
60 degrees, reposition the transducer to obtain a smaller Doppler angle.9.Activate the Pulsed-Wave Doppler for the Spectral Doppler display.
10.Optimize the Spectral Doppler velocity scale, baseline, and gain.
Suggested Reading1.Hedrik WR, Hykes DL, Starchman DE, eds. Ultrasound Physics and Intrumentation. 4th
ed. Philadelphia, PA: Elsevier Mosby; 2005.2.Rumack CM, Wilson SR, Charboneau JW, Levine D, eds. Diagnostic Ultrasound. 4th ed.
Philadelphia, PA: Elsevier Mosby; 2011.3.Allan P, Dubbins PA, McDicken WN, Pozniak MA, eds. Clinical Doppler Ultrasound.
2nd ed. Philadelphia, PA: Elsevier Churchill Livingstone; 2006.4.Sites BD, Brull R, Chan VW, et al. Artifacts and pitfall errors associated with ultrasound-
guided regional anesthesia. Part I: understanding the basic principles of ultrasoundphysics and machine operations. Reg Anesth Pain Med. 2007;32:412–418.
5.Sites BD, Brull R, Chan VW, et al. Artifacts and pitfall errors associated with ultrasound-guided regional anesthesia. Part II: a pictorial approach to understanding and avoidance.Reg Anesth Pain Med. 2007;32:419–433.
6.Schafhalter-Zoppoth I, McCulloch CE, Gray AT. Ultrasound visibility of needles used forregional nerve block: an in vitro study. Reg Anesth Pain Med. 2004;29(5):480–488.
7.Tsui BC, Kropelin B, Ganapathy S, Finucane B. Dextrose 5% in water: fluid medium formaintaining electrical stimulation of peripheral nerves during stimulating catheterplacement. Acta Anaesthesiol Scand. 2005 November;49(10):1562–1565.
8.Moayeri N, Bigeleisen PE, Groen GJ. Quantitative architecture of the brachial plexus andsurrounding compartments, and their possible significance for plexus blocks.Anesthesiology. 2008;108(2):299–304.
9.Lichtenstein DA, Menu Y. A bedside ultrasound sign ruling out pneumothorax in thecritically ill. Lung sliding. Chest. 1995;108(5):1345–1348.
10.Karmakar M, Li X, Li J, Sala-Blanch X, Hadzic A, Gin T. Three-dimensional/four-dimensional volumetric ultrasound imaging of the sciatic nerve. Reg Anesth Pain Med.2012 January-February;37(1):60–66.
11.Karmakar MK, Li X, Li J, Hadzic A. Volumetric 3D ultrasound imaging of the anatomyrelevant for thoracic paravertebral block. Anesth Analg. 2012;115(5):1246–1250.
12.Foxall GL, Hardman JG, Bedforth NM. Three-dimensional, multiplanar, ultrasound-guided, radial nerve block. Reg Anesth Pain Med. 2007;32(6):516–521.
13.Li X, Karmakar MK, Lee A, Kwok WH, Critchley LAH, Gin T. Quantitative evaluation ofthe echo-intensity of the median nerve and flexor muscles of the forearm in the youngand the elderly. Br J Radiol. 2012;85:e140–e145.
14.Sofka CM, Lin D, Adler RS. Advantages of color B-mode imaging with contrastoptimization in sonography of low-contrast musculoskeletal lesions and structures in thefoot and ankle. J Ultrasound Med. 2005;24:215–218.
33

34

CHAPTER 2
Sonoanatomy Relevant for Ultrasound-Guided UpperExtremity Nerve Blocks
IntroductionThe neural innervations of the upper extremity provide unique opportunities for a wideselection of neural blockade options that can be tailored to the desired outcome needed foranesthesia or analgesia of the extremity.
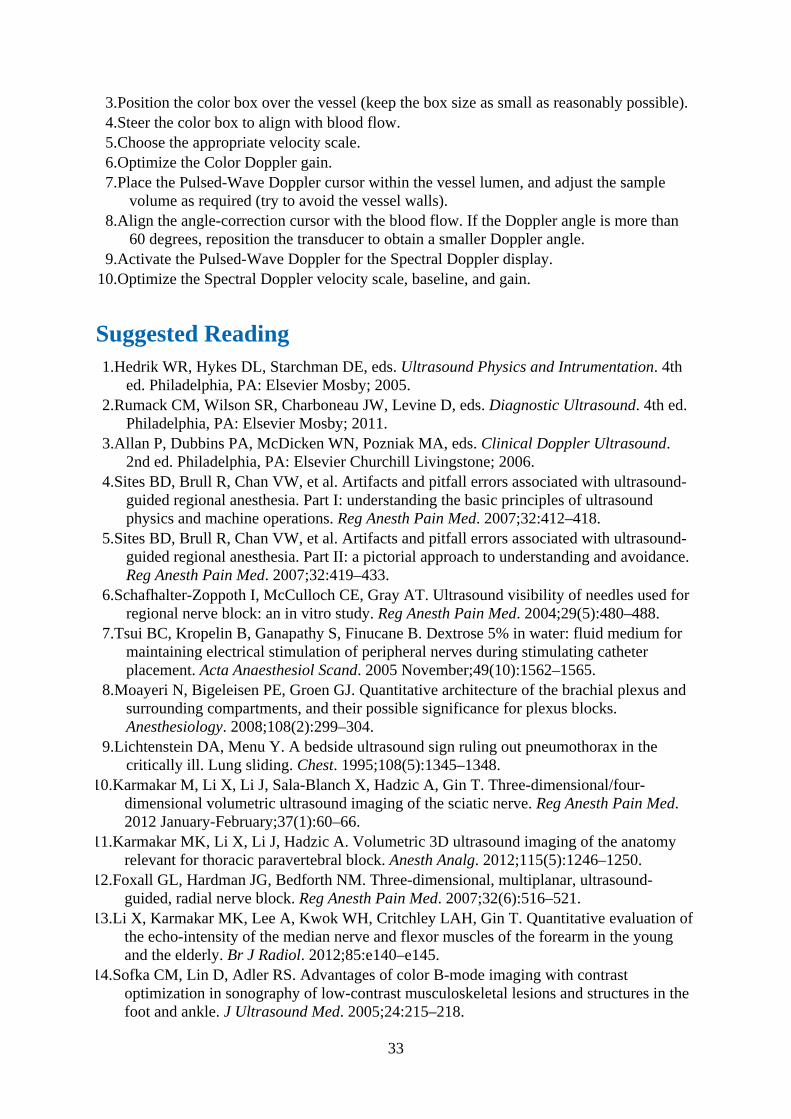
Gross AnatomyThe brachial plexus traverses the posterior triangle of the neck and the axilla. It providescomplete innervation to the upper extremity. Proximally, the brachial plexus originates fromthe ventral primary rami of the cervical spinal nerves (C5–T1) (Figs. 2-1 and 2-2) andextends from the cervical spinal roots in the neck to its terminal nerves in the axilla (Fig. 2-3). The C5 and C6 rami unite to form the superior trunk, the C7 rami forms the middle trunk,and the C8 and T1 rami unite to form the inferior trunk (Fig. 2-4). The trunks of the brachialplexus are located in the interscalene groove between the scalenus anterior and the scalenusmedius muscles, at the level of the cricoid cartilage (approximate C6 vertebral body level)and deep to the sternocleidomastoid muscle (Fig. 2-5). The anterior tubercle of the C6vertebra is the most prominent of all the vertebrae (Chassaignac’s tubercle), and the C7transverse process lacks the anterior tubercle. This feature can be used to sonographicallyidentify the C7 nerve root. At the root level, the plexus gives off the dorsal scapular nerveand the long thoracic nerve (Fig. 2-4).
35
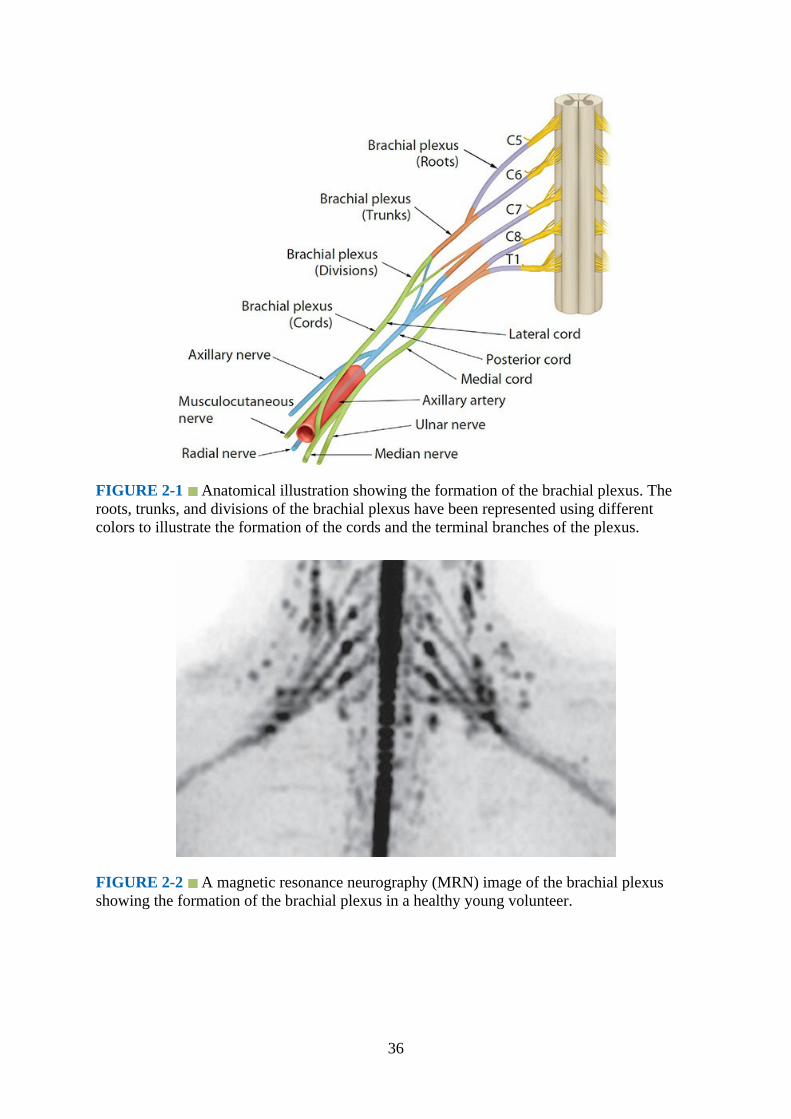
FIGURE 2-1 Anatomical illustration showing the formation of the brachial plexus. Theroots, trunks, and divisions of the brachial plexus have been represented using differentcolors to illustrate the formation of the cords and the terminal branches of the plexus.
FIGURE 2-2 A magnetic resonance neurography (MRN) image of the brachial plexusshowing the formation of the brachial plexus in a healthy young volunteer.
36

FIGURE 2-3 Brachial plexus. Note the formation of the plexus and the relation of thenerve roots to the transverse process of the cervical vertebra.
37

FIGURE 2-4 The brachial plexus and relation of its components to the subclavian andaxillary artery.
38

FIGURE 2-5 Brachial plexus and its relation to the scalene muscles. Note how the brachialplexus is sandwiched between the anterior and middle scalene muscles.
At the supraclavicular fossa, the trunks of the brachial plexus are superficial and divideinto their anterior and posterior divisions and reunite as the cords distal to the clavicle. Thetrunks and divisions lie above the first rib between the scalenus anterior and scalenus mediusmuscles (Fig. 2-6). The subclavian artery crosses over the top of the first rib at this point as itexits the thoracic inlet and travels in the fascial plane between the scalenus anterior and thescalenus medius and is anteromedial to the trunks and divisions of the brachial plexus at thislevel (Fig. 2-6). The subclavian vein crosses the first rib lying anteriorly to the insertion ofthe scalenus anterior (Fig. 2-7). The pleura lies immediately deep to the first rib. At the trunklevel, the plexus gives off the nerve to the subclavius and suprascapular nerve.
39
FIGURE 2-6 Anatomy of the brachial plexus at the interscalene groove andsupraclavicular fossa. Note the relation of the suprascapular and transverse cervical artery tothe brachial plexus. SA, subclavian artery; SV, subclavian vein; IJV, internal jugular vein.
FIGURE 2-7 Brachial plexus at the supraclavicular fossa. Note the relation of the trunks ofthe brachial plexus to the first rib, subclavian artery, and the scalene muscles. The trunks anddivisions of the brachial plexus are located posterolateral to the subclavian artery. SA,subclavian artery; SV, subclavian vein.
Lateral to the first rib the six divisions of the brachial plexus regroup to form the threecords of the brachial plexus. The posterior cord is formed from the three posterior divisions(C5–C8 and T1), the lateral cord from the anterior division of the upper and middle trunk(C5–C7), and the medial cord is a continuation of the anterior division of the lower trunk (C8and T1). The cords then enters the “costoclavicular space” (CCS, Fig. 2-8), which is locateddeep and posterior to the middle-third of the clavicle.1,2 Within the CCS the cords are
40

clustered together lateral to the axillary artery and between the clavicular head of thepectoralis major muscle and the subclavius muscle anteriorly, and the serratus muscleoverlying the second rib posteriorly (Figs. 2-8 and 2-9).1,2 The topography of the cordsrelative to the axillary artery and to one another is consistent at the CCS (Figs. 2-9 to 2-11).The lateral cord is the most superficial of the three cords and always lies anterior to both themedial and posterior cords (Figs. 2-9 to 2-11).3 The medial cord is directly posterior to thelateral cord but medial to the posterior cord (Fig. 2-9 to 2-11).3 The posterior cord is the mostlateral of the three cords at the CCS, and it is immediately lateral to the medial cord butposterolateral to the lateral cord (Figs. 2-9 to 2-11).3 The cords then descend to the lateralinfraclavicular fossa, deep to the pectoralis minor muscle, where they occupy their respectiveposition relative to the second part of the axillary artery (Fig. 2-12). The posterior cord islocated posterior to the artery, the lateral cord lies in the superolateral aspect of the artery,and the medial cord lies in the inferomedial aspect of the artery.4 Position of the cords at thelateral infraclavicular fossa is variable4 and affected by the position (abduction) of the arm.5The lateral cord gives off the lateral pectoral nerve, musculocutaneous nerve and lateral rootof median nerve; the posterior cord gives off the upper and lower subscapular nerves, thethoracodorsal nerve, radial nerve, and axillary nerve; the medial cord gives off the medialpectoral nerve, the medial cutaneous nerve of the arm, medial cutaneous nerve of theforearm, ulnar nerve, and medial root of the median nerve.
FIGURE 2-8 Sagittal anatomic section through the midpoint of the clavicle showing thecostoclavicular space between the pectoral head of the pectoralis major and subclaviusmuscle anteriorly and the upper slips of the serratus anterior muscle overlying the second ribposteriorly. Note how the cords of the brachial plexus are clustered together and lie cranial tothe first part of the axillary artery. AA, axillary artery; AV, axillary vein.
41
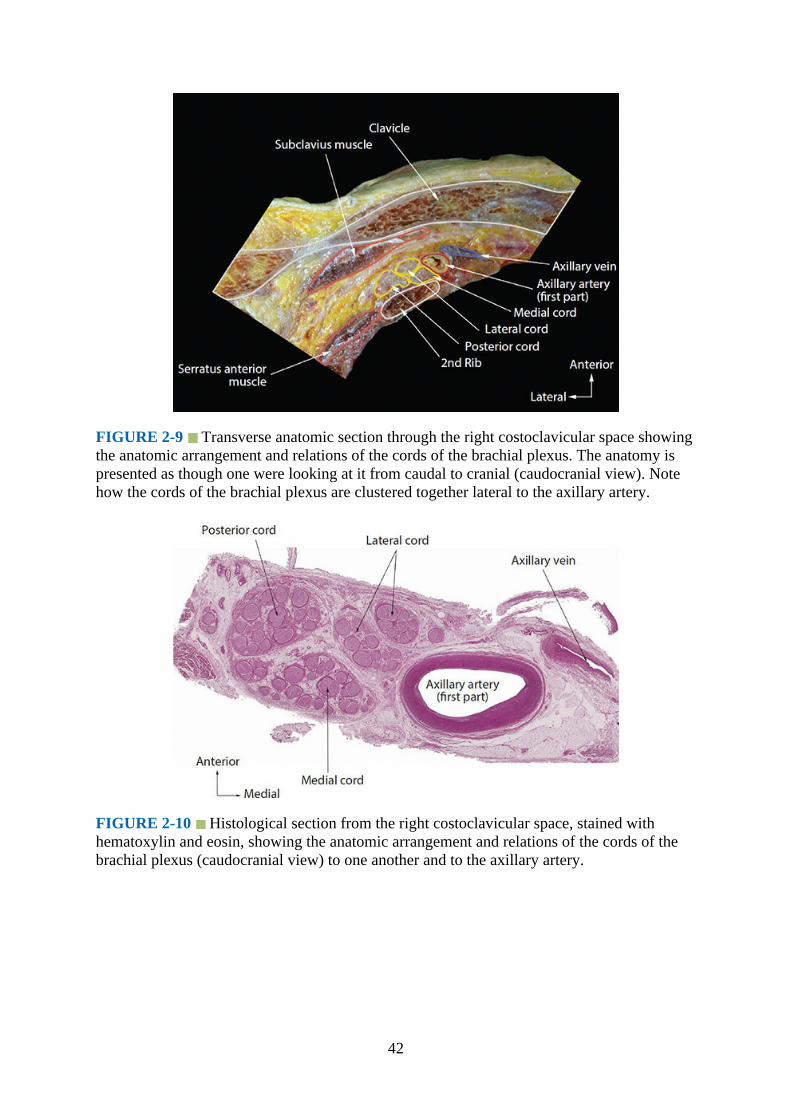
FIGURE 2-9 Transverse anatomic section through the right costoclavicular space showingthe anatomic arrangement and relations of the cords of the brachial plexus. The anatomy ispresented as though one were looking at it from caudal to cranial (caudocranial view). Notehow the cords of the brachial plexus are clustered together lateral to the axillary artery.
FIGURE 2-10 Histological section from the right costoclavicular space, stained withhematoxylin and eosin, showing the anatomic arrangement and relations of the cords of thebrachial plexus (caudocranial view) to one another and to the axillary artery.
42
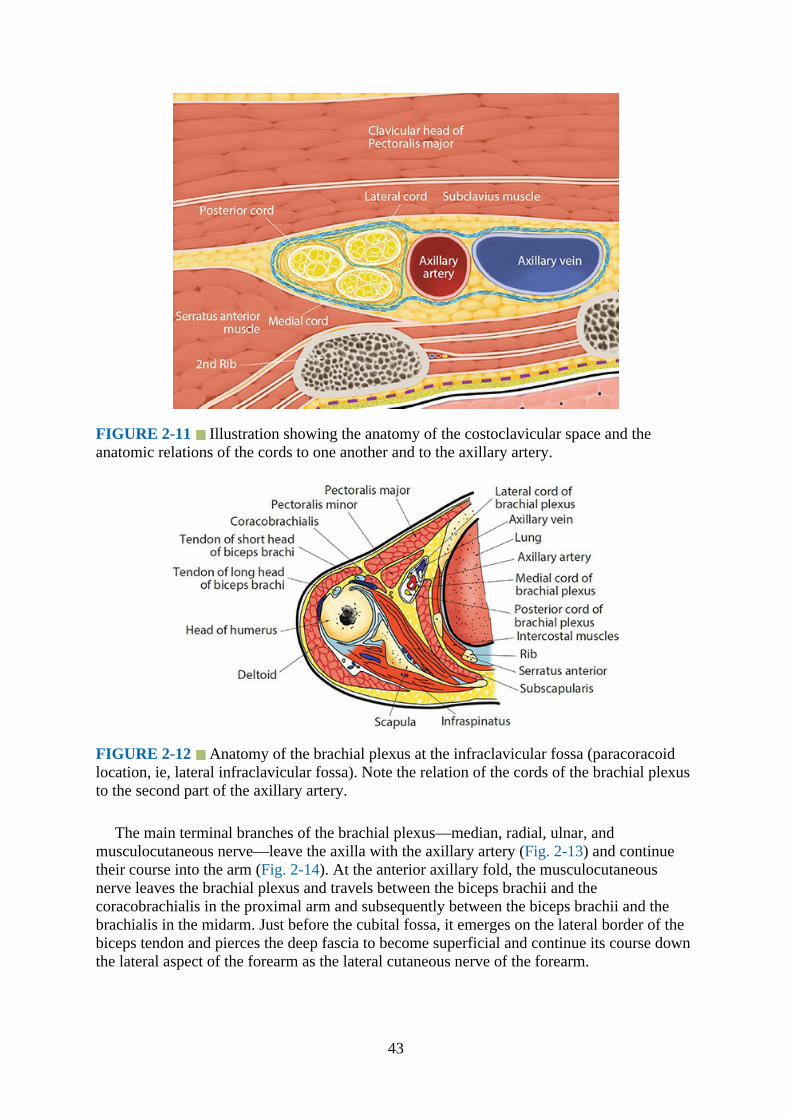
FIGURE 2-11 Illustration showing the anatomy of the costoclavicular space and theanatomic relations of the cords to one another and to the axillary artery.
FIGURE 2-12 Anatomy of the brachial plexus at the infraclavicular fossa (paracoracoidlocation, ie, lateral infraclavicular fossa). Note the relation of the cords of the brachial plexusto the second part of the axillary artery.
The main terminal branches of the brachial plexus—median, radial, ulnar, andmusculocutaneous nerve—leave the axilla with the axillary artery (Fig. 2-13) and continuetheir course into the arm (Fig. 2-14). At the anterior axillary fold, the musculocutaneousnerve leaves the brachial plexus and travels between the biceps brachii and thecoracobrachialis in the proximal arm and subsequently between the biceps brachii and thebrachialis in the midarm. Just before the cubital fossa, it emerges on the lateral border of thebiceps tendon and pierces the deep fascia to become superficial and continue its course downthe lateral aspect of the forearm as the lateral cutaneous nerve of the forearm.
43
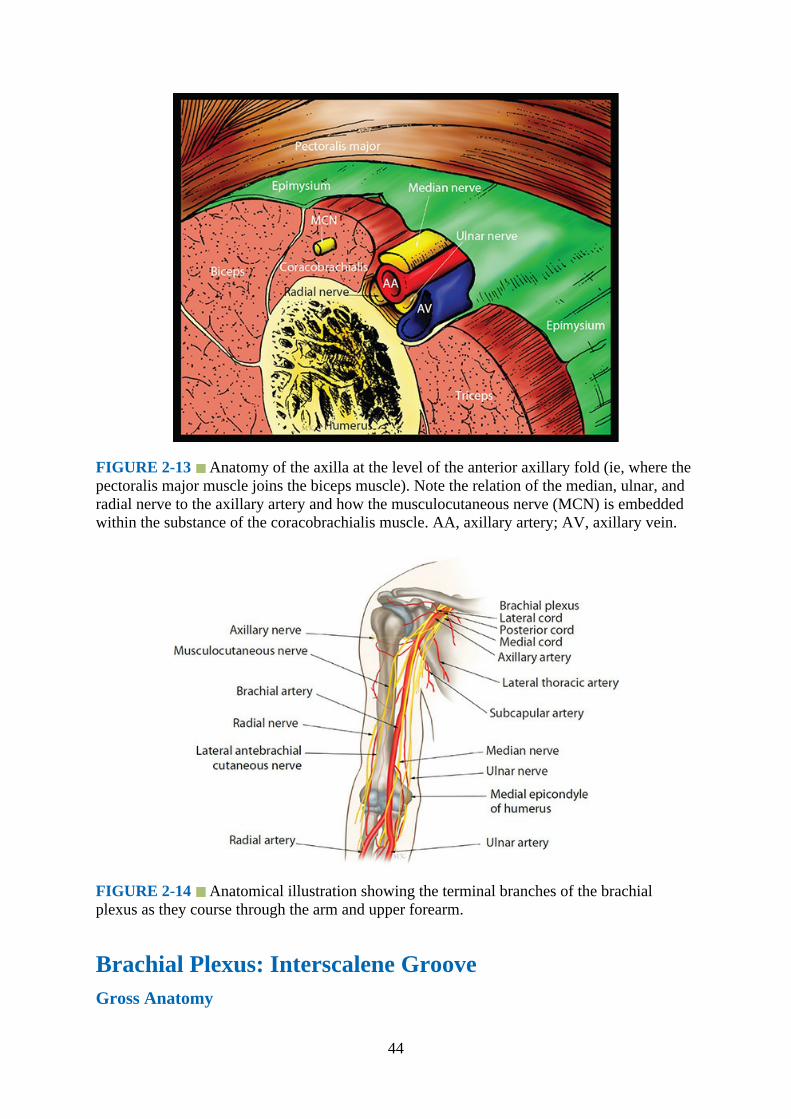
FIGURE 2-13 Anatomy of the axilla at the level of the anterior axillary fold (ie, where thepectoralis major muscle joins the biceps muscle). Note the relation of the median, ulnar, andradial nerve to the axillary artery and how the musculocutaneous nerve (MCN) is embeddedwithin the substance of the coracobrachialis muscle. AA, axillary artery; AV, axillary vein.
FIGURE 2-14 Anatomical illustration showing the terminal branches of the brachialplexus as they course through the arm and upper forearm.
Brachial Plexus: Interscalene GrooveGross Anatomy
44

In the posterior triangle, the roots and trunks of the brachial plexus lie between scalenusanterior and medius muscles (Figs. 2-15 and 2-16). As the cervical nerve root (C3–C6) exitsfrom the intervertebral foramen, it travels between the anterior and posterior tubercle of thecorresponding cervical vertebra (Figs. 2-17 and 2-18). This unique feature can be easilydemonstrated using ultrasound. Deep to the cervical nerve root, the vertebral artery travels inthe foramen transversarium (Fig. 2-17) of the C6 to C1 vertebrae and ascends cranially.
FIGURE 2-15 Coronal anatomical section showing the roots, trunks, divisions, and cordsof the brachial plexus. SCM, sternocleidomastoid muscle; VA, vertebral artery; SA,subclavian artery.
FIGURE 2-16 Transverse anatomical section of the neck showing the brachial plexussandwiched between the scalenus anterior and scalenus medius muscles in the interscalenegroove. SCM, sternocleidomastoid muscle; IJV, internal jugular vein; CA, carotid artery.
45

FIGURE 2-17 Transverse anatomical section of the neck through the C6 vertebral bodyshowing the anterior and posterior tubercle of the C6 transverse process. Note how the C6nerve root exits the intervertebral foramen and the location of the vertebral artery in theforamen transversarium.
FIGURE 2-18 Transverse anatomical section of the neck through the C7 vertebral bodyshowing the C7 transverse process with only one (posterior) tubercle. The anterior tubercle ismissing.
Computed Tomography Anatomy of the Neck and Interscalene Region
Figs. 2-19 and 2-20
46

FIGURE 2-19 CT image of the cervical region at the level of C6. Note the C6 nerve rootas it exits the intervertebral foramen and lies between the anterior and posterior tubercle ofthe C6 transverse process before it enters the interscalene groove. Also note the vertebralartery in the foramen transversarium of C6 vertebra. SCM, sternocleidomastoid muscle; IJV,internal jugular vein; NR, nerve root; VB, vertebral body; VA, vertebral artery.
FIGURE 2-20 CT image of the cervical region at the level of C7. Note the vertebral arteryin close proximity to the C7 nerve root before it enters the foramen transversarium of C6.VA, vertebral artery; NR, nerve root; ScA, scalenus anterior; ScM, scalenus medius; ISG,interscalene groove; TP, transverse process; SCM, sternocleidomastoid; IJV, internal jugularvein.
Magnetic Resonance Imaging Anatomy of the Neck and Interscalene Region
47

Figs. 2-21 and 2-22
FIGURE 2-21 MRI image of the neck at the level of C6 vertebra. Note the C6 nerve root(NR) between the anterior and posterior tubercle of the C6 transverse process and the C5nerve root in the interscalene groove between the scalenus anterior (ScA) and scalenusmedius (ScM) muscle. The vertebral artery (VA) is seen in the foramen transversarium of theC6 transverse process. VB, vertebral body; CA, carotid artery; SCM, sternocleidomastoid;IJV, internal jugular vein.
FIGURE 2-22 MRI image of the neck at the level of C7 vertebra. Note the vertebral arteryin close proximity of the C7 nerve root before it enters the foramen transversarium of C6vertebra. The nerve roots (C6 and C7) of the brachial plexus are seen in the interscalenegroove (ISG) between the scalenus anterior (ScA) and the scalenus medius (ScM) muscle.VA, vertebral artery; NR, nerve root; SCM, sternocleidomastoid; IJV, internal jugular vein;
48
CE, cervical esophagus; CA, carotid artery; TP, transverse process.
Technique of Ultrasound Imaging of the Brachial Plexus at the InterscaleneGroove
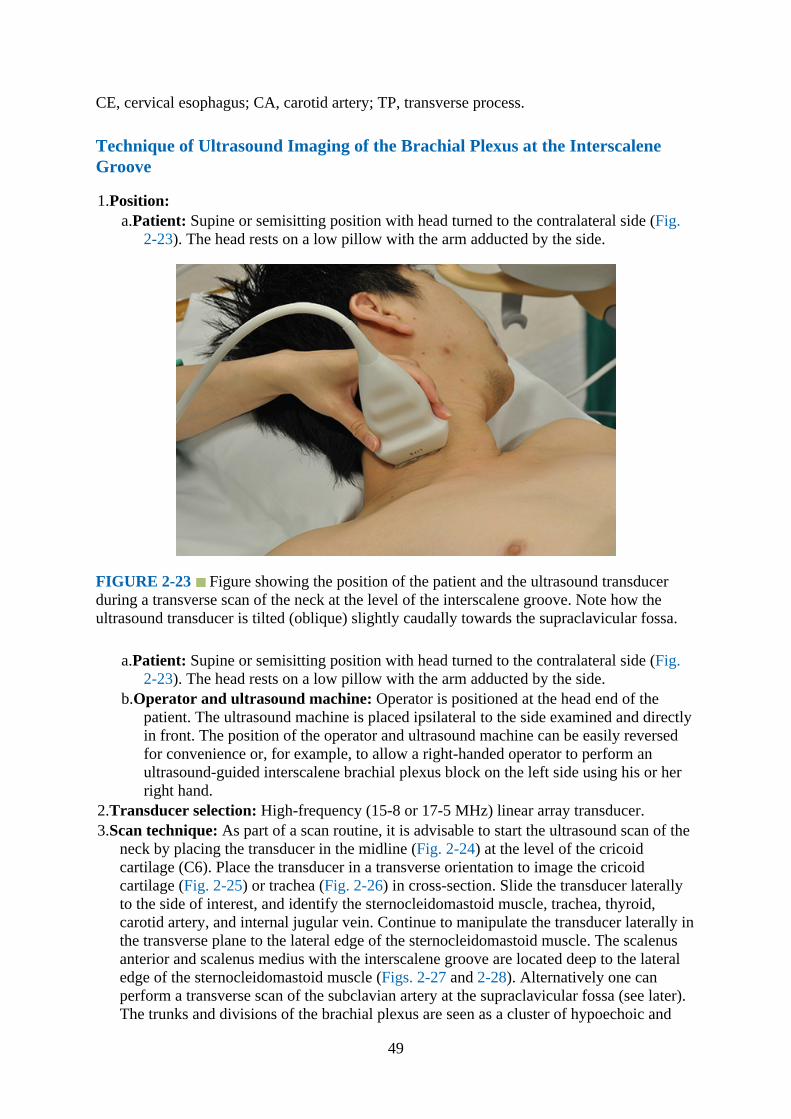
1.Position:a.Patient: Supine or semisitting position with head turned to the contralateral side (Fig.
2-23). The head rests on a low pillow with the arm adducted by the side.
FIGURE 2-23 Figure showing the position of the patient and the ultrasound transducerduring a transverse scan of the neck at the level of the interscalene groove. Note how theultrasound transducer is tilted (oblique) slightly caudally towards the supraclavicular fossa.
a.Patient: Supine or semisitting position with head turned to the contralateral side (Fig.2-23). The head rests on a low pillow with the arm adducted by the side.
b.Operator and ultrasound machine: Operator is positioned at the head end of thepatient. The ultrasound machine is placed ipsilateral to the side examined and directlyin front. The position of the operator and ultrasound machine can be easily reversedfor convenience or, for example, to allow a right-handed operator to perform anultrasound-guided interscalene brachial plexus block on the left side using his or herright hand.
2.Transducer selection: High-frequency (15-8 or 17-5 MHz) linear array transducer.3.Scan technique: As part of a scan routine, it is advisable to start the ultrasound scan of the
neck by placing the transducer in the midline (Fig. 2-24) at the level of the cricoidcartilage (C6). Place the transducer in a transverse orientation to image the cricoidcartilage (Fig. 2-25) or trachea (Fig. 2-26) in cross-section. Slide the transducer laterallyto the side of interest, and identify the sternocleidomastoid muscle, trachea, thyroid,carotid artery, and internal jugular vein. Continue to manipulate the transducer laterally inthe transverse plane to the lateral edge of the sternocleidomastoid muscle. The scalenusanterior and scalenus medius with the interscalene groove are located deep to the lateraledge of the sternocleidomastoid muscle (Figs. 2-27 and 2-28). Alternatively one canperform a transverse scan of the subclavian artery at the supraclavicular fossa (see later).The trunks and divisions of the brachial plexus are seen as a cluster of hypoechoic and
49

rounded nodules on the posterolateral aspect of the subclavian artery, like a “bunch ofgrapes,” and between the scalenus anterior and scalenus medius muscles. Now slowlyslide the transducer cephalad with a sweeping action when the roots and/or trunks of thebrachial plexus are clearly delineated in the interscalene groove.
FIGURE 2-24 Figure showing the position of the patient and the ultrasound transducerduring a transverse scan of the neck in the midline at the level of the cricoid cartilage.
FIGURE 2-25 Transverse sonogram of the neck at the level of the cricoid cartilage (CC).The CC is seen as an “inverted-U” or arched shaped structure. The inner surface of theanterior wall of the CC is lined by the bright air-mucosal interface (AMI), and the two lobesof the thyroid gland are seen as uniformly hyperechoic structures lateral to the CC. Theposterior wall of the CC is obscured by an air column and reverberation artifacts, but one canidentify the cricothyroid junction (CTJ) as a hypoechoic gap in the posterolateral wall of theCC. SM, strap muscles; CA, carotid artery.
50
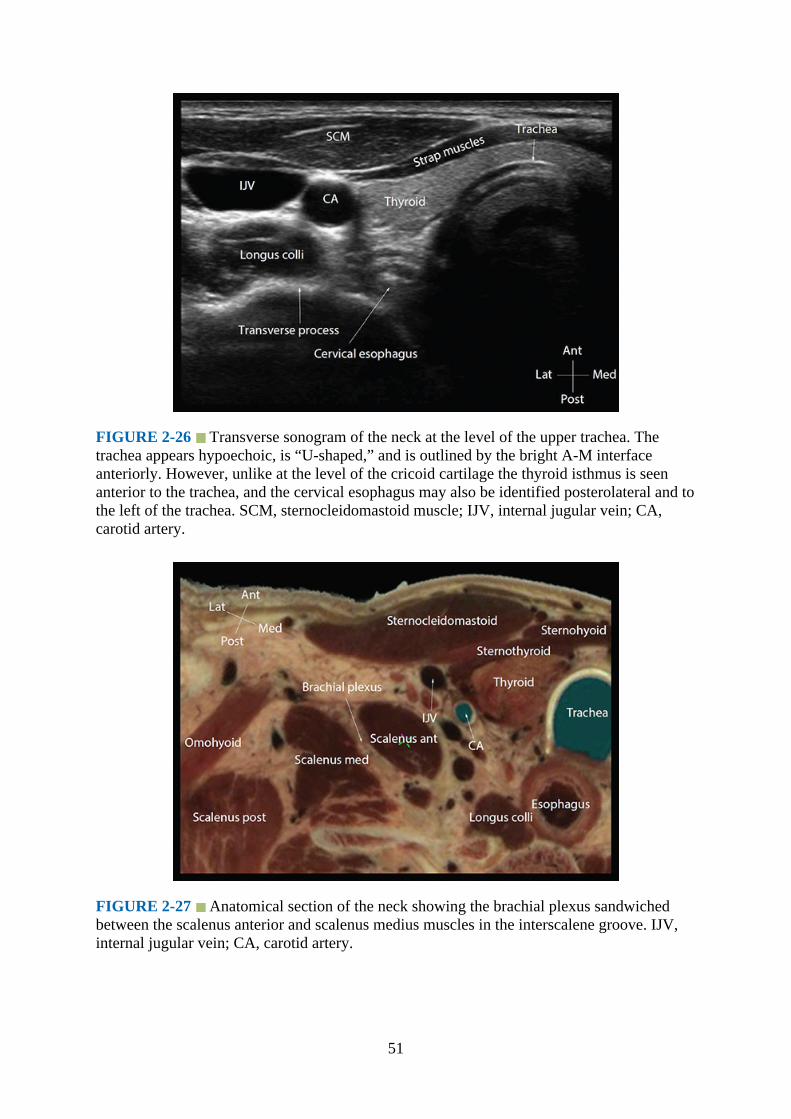
FIGURE 2-26 Transverse sonogram of the neck at the level of the upper trachea. Thetrachea appears hypoechoic, is “U-shaped,” and is outlined by the bright A-M interfaceanteriorly. However, unlike at the level of the cricoid cartilage the thyroid isthmus is seenanterior to the trachea, and the cervical esophagus may also be identified posterolateral and tothe left of the trachea. SCM, sternocleidomastoid muscle; IJV, internal jugular vein; CA,carotid artery.
FIGURE 2-27 Anatomical section of the neck showing the brachial plexus sandwichedbetween the scalenus anterior and scalenus medius muscles in the interscalene groove. IJV,internal jugular vein; CA, carotid artery.
51
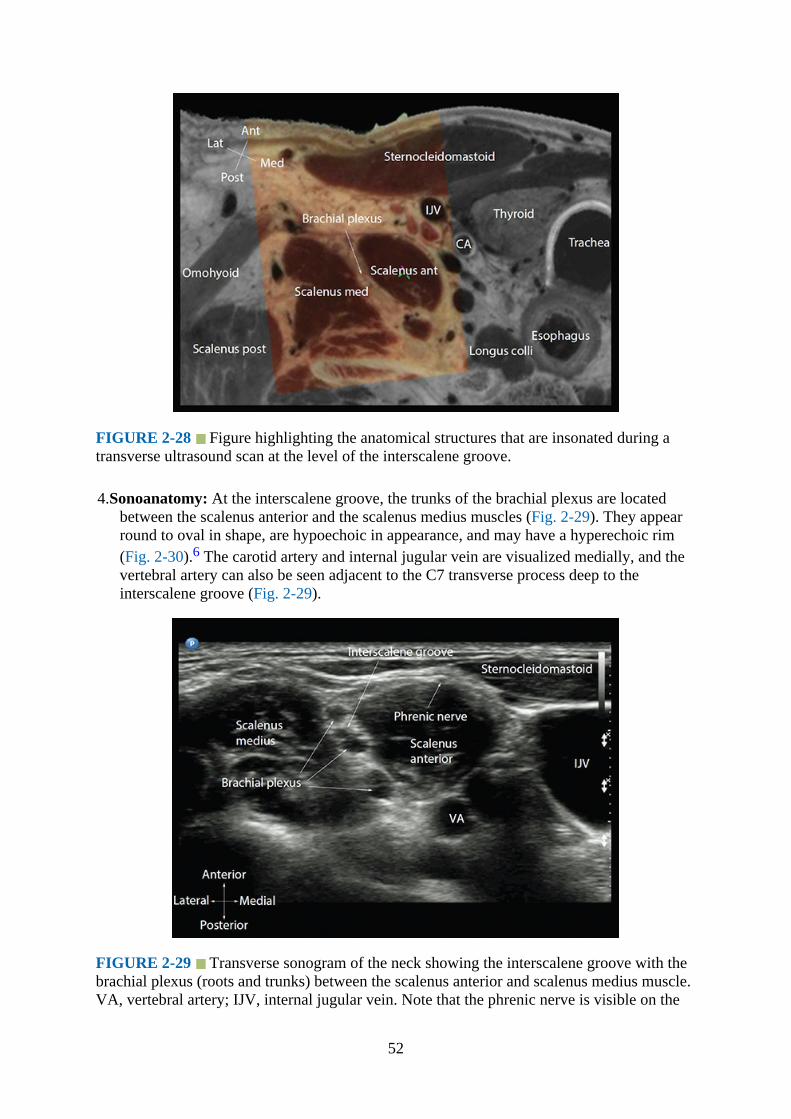
FIGURE 2-28 Figure highlighting the anatomical structures that are insonated during atransverse ultrasound scan at the level of the interscalene groove.
4.Sonoanatomy: At the interscalene groove, the trunks of the brachial plexus are locatedbetween the scalenus anterior and the scalenus medius muscles (Fig. 2-29). They appearround to oval in shape, are hypoechoic in appearance, and may have a hyperechoic rim(Fig. 2-30).6 The carotid artery and internal jugular vein are visualized medially, and thevertebral artery can also be seen adjacent to the C7 transverse process deep to theinterscalene groove (Fig. 2-29).
FIGURE 2-29 Transverse sonogram of the neck showing the interscalene groove with thebrachial plexus (roots and trunks) between the scalenus anterior and scalenus medius muscle.VA, vertebral artery; IJV, internal jugular vein. Note that the phrenic nerve is visible on the
52
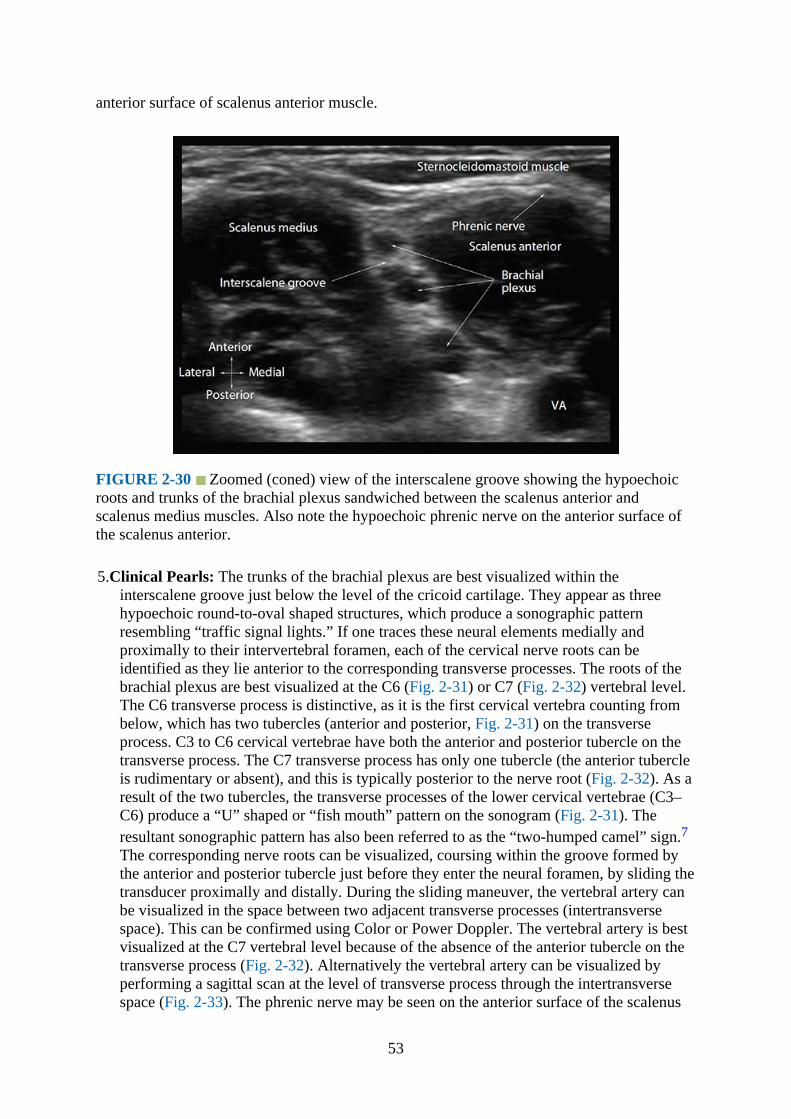
anterior surface of scalenus anterior muscle.
FIGURE 2-30 Zoomed (coned) view of the interscalene groove showing the hypoechoicroots and trunks of the brachial plexus sandwiched between the scalenus anterior andscalenus medius muscles. Also note the hypoechoic phrenic nerve on the anterior surface ofthe scalenus anterior.
5.Clinical Pearls: The trunks of the brachial plexus are best visualized within theinterscalene groove just below the level of the cricoid cartilage. They appear as threehypoechoic round-to-oval shaped structures, which produce a sonographic patternresembling “traffic signal lights.” If one traces these neural elements medially andproximally to their intervertebral foramen, each of the cervical nerve roots can beidentified as they lie anterior to the corresponding transverse processes. The roots of thebrachial plexus are best visualized at the C6 (Fig. 2-31) or C7 (Fig. 2-32) vertebral level.The C6 transverse process is distinctive, as it is the first cervical vertebra counting frombelow, which has two tubercles (anterior and posterior, Fig. 2-31) on the transverseprocess. C3 to C6 cervical vertebrae have both the anterior and posterior tubercle on thetransverse process. The C7 transverse process has only one tubercle (the anterior tubercleis rudimentary or absent), and this is typically posterior to the nerve root (Fig. 2-32). As aresult of the two tubercles, the transverse processes of the lower cervical vertebrae (C3–C6) produce a “U” shaped or “fish mouth” pattern on the sonogram (Fig. 2-31). Theresultant sonographic pattern has also been referred to as the “two-humped camel” sign.7The corresponding nerve roots can be visualized, coursing within the groove formed bythe anterior and posterior tubercle just before they enter the neural foramen, by sliding thetransducer proximally and distally. During the sliding maneuver, the vertebral artery canbe visualized in the space between two adjacent transverse processes (intertransversespace). This can be confirmed using Color or Power Doppler. The vertebral artery is bestvisualized at the C7 vertebral level because of the absence of the anterior tubercle on thetransverse process (Fig. 2-32). Alternatively the vertebral artery can be visualized byperforming a sagittal scan at the level of transverse process through the intertransversespace (Fig. 2-33). The phrenic nerve may be seen on the anterior surface of the scalenus
53

anterior (Figs. 2-29 and 2-30) as a small hypoechoic structure, and its identity can beconfirmed by tracing the nerve proximally and distally along its course,8 also referred toas the “trace back technique.”9 It is also common to visualize vascular structures at thebase of the posterior triangle of the neck. These may be the inferior thyroid artery,vertebral artery, suprascapular artery (see later), or the transverse cervical artery (Fig. 2-34). Verifying their course and origin allows one to confirm the identity of the artery. Thesuperficial cervical plexus may also be visualized as a small collection of hypoechoicnerves deep to or lateral to the sternocleidomastoid muscle.
FIGURE 2-31 Transverse sonogram of the neck at the level of the C6 transverse process.Note the anterior and posterior tubercles of the C6 transverse process and the roots of thehypoechoic C5 and C6 nerve root. The outlines of the anterior and posterior tubercles of theC6 transverse have been highlighted in the sonogram. Also note the location of the vertebralartery (VA) relative to the transverse process. IJV, internal jugular vein; CA, carotid artery;VA, vertebral artery; NR, nerve root.
54
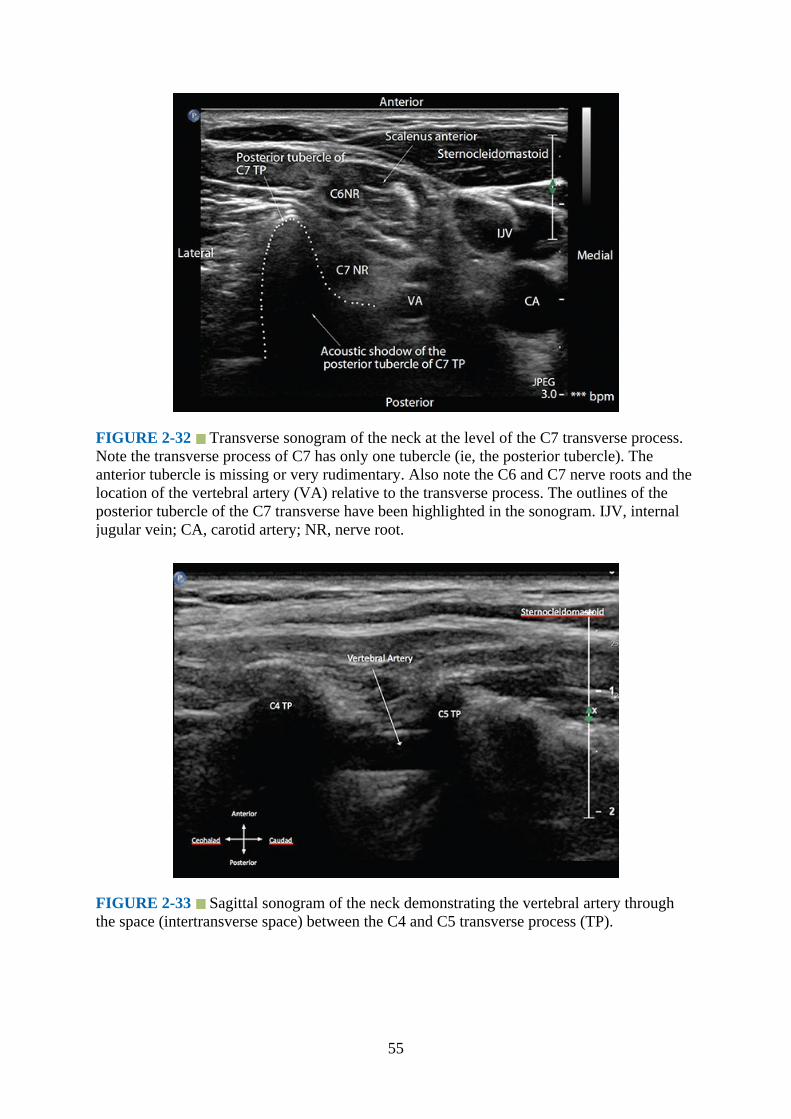
FIGURE 2-32 Transverse sonogram of the neck at the level of the C7 transverse process.Note the transverse process of C7 has only one tubercle (ie, the posterior tubercle). Theanterior tubercle is missing or very rudimentary. Also note the C6 and C7 nerve roots and thelocation of the vertebral artery (VA) relative to the transverse process. The outlines of theposterior tubercle of the C7 transverse have been highlighted in the sonogram. IJV, internaljugular vein; CA, carotid artery; NR, nerve root.
FIGURE 2-33 Sagittal sonogram of the neck demonstrating the vertebral artery throughthe space (intertransverse space) between the C4 and C5 transverse process (TP).
55

FIGURE 2-34 Transverse sonogram of the neck at the level of the interscalene groove (A,without and B, with Color Doppler) showing the transverse cervical artery, which is a branchof the thyrocervical trunk. It crosses the neck from a medial to lateral direction lying anteriorto the scalene muscles and in front or in between the divisions of the brachial plexus.
Assessment of Diaphragm Excursions
Ultrasound imaging is a safe, simple, and accurate method of evaluating diaphragmaticfunction (excursion) in patients with diaphragmatic paresis or paralysis.10 In regionalanesthesia ultrasound imaging can be used to evaluate phrenic nerve involvement byassessing diaphragmatic excursion after an interscalene brachial plexus block.11 A 5-2 MHzcurved array transducer is used, and a B-mode ultrasound scan is initially performed with thepatient in the supine position. A transverse scan of the subcostal region is performed with theultrasound transducer placed between the midclavicular and midaxillary line. The liver orspleen (on the left side) provides the acoustic window for the ultrasound scan. For optimalimaging the ultrasound transducer is also directed cranially, posteriorly, and medially toimage the posterior third of the diaphragm. Once an optimal B-mode image is obtained, theM-mode function is activated, with the M-mode line passing through the diaphragm (Fig. 2-35). Resting or forced diaphragmatic excursion after the “sniff test” (rapid nasal inspirationwith the mouth closed) can then be assessed.
56

FIGURE 2-35 Figure showing the use of M-mode ultrasound to evaluate diaphragmaticexcursion. Note the M-mode line passes through the right lobe of the liver, diaphragm, andpart of the lung posteriorly in the B-mode image. The M-mode trace (below) shows theexcursion of the liver, diaphragm (hyperechoic line), and lung toward the transducer alongthis line with time.
Brachial Plexus: Supraclavicular FossaGross Anatomy
At the supraclavicular fossa, the brachial plexus is relatively superficial and lies beneath thesubcutaneous tissue and the inferior belly of the omohyoid. The trunks and division of thebrachial plexus are seen as a cluster of nerves on the posterolateral aspect (Figs. 2-6, 2-7, 2-15, and 2-36) of the subclavian artery (Figs. 2-4 to 2-7). The subclavian artery lies on top ofthe first rib (Fig. 2-36), and the subclavian vein is anterior to the scalenus anterior muscle(Figs. 2-6 and 2-7).
57
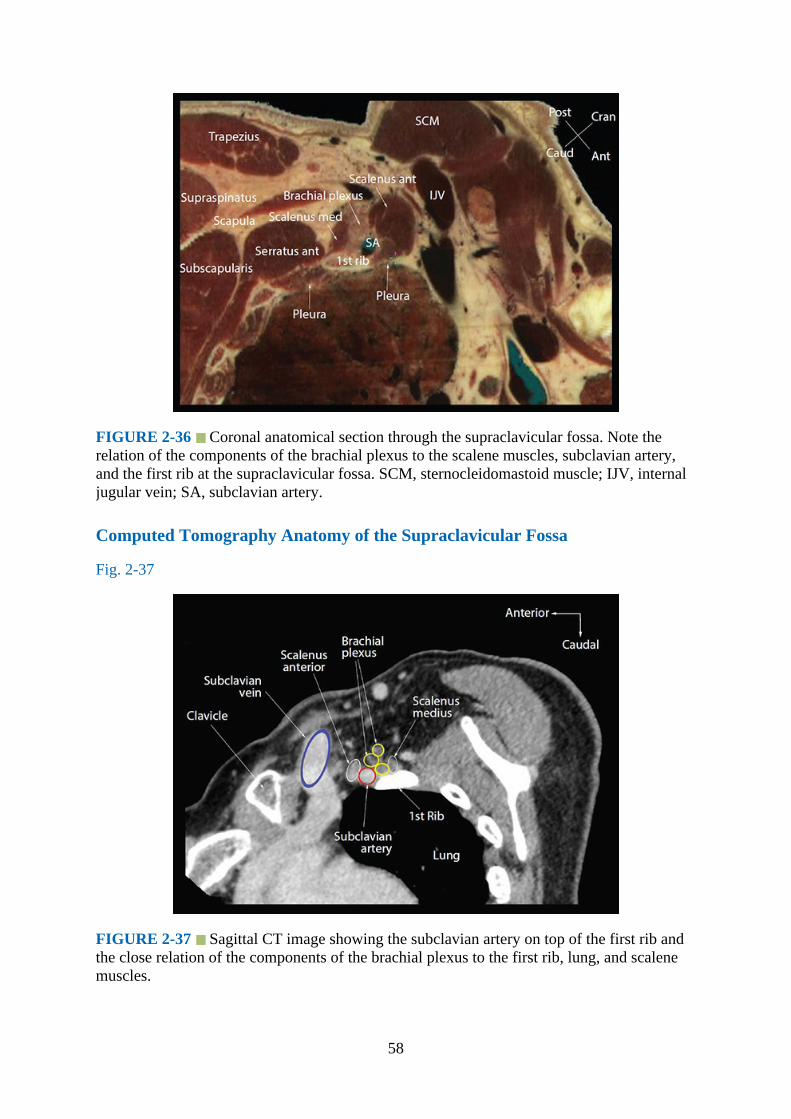
FIGURE 2-36 Coronal anatomical section through the supraclavicular fossa. Note therelation of the components of the brachial plexus to the scalene muscles, subclavian artery,and the first rib at the supraclavicular fossa. SCM, sternocleidomastoid muscle; IJV, internaljugular vein; SA, subclavian artery.
Computed Tomography Anatomy of the Supraclavicular Fossa
Fig. 2-37
FIGURE 2-37 Sagittal CT image showing the subclavian artery on top of the first rib andthe close relation of the components of the brachial plexus to the first rib, lung, and scalenemuscles.
58
Magnetic Resonance Imaging Anatomy of the Supraclavicular Fossa
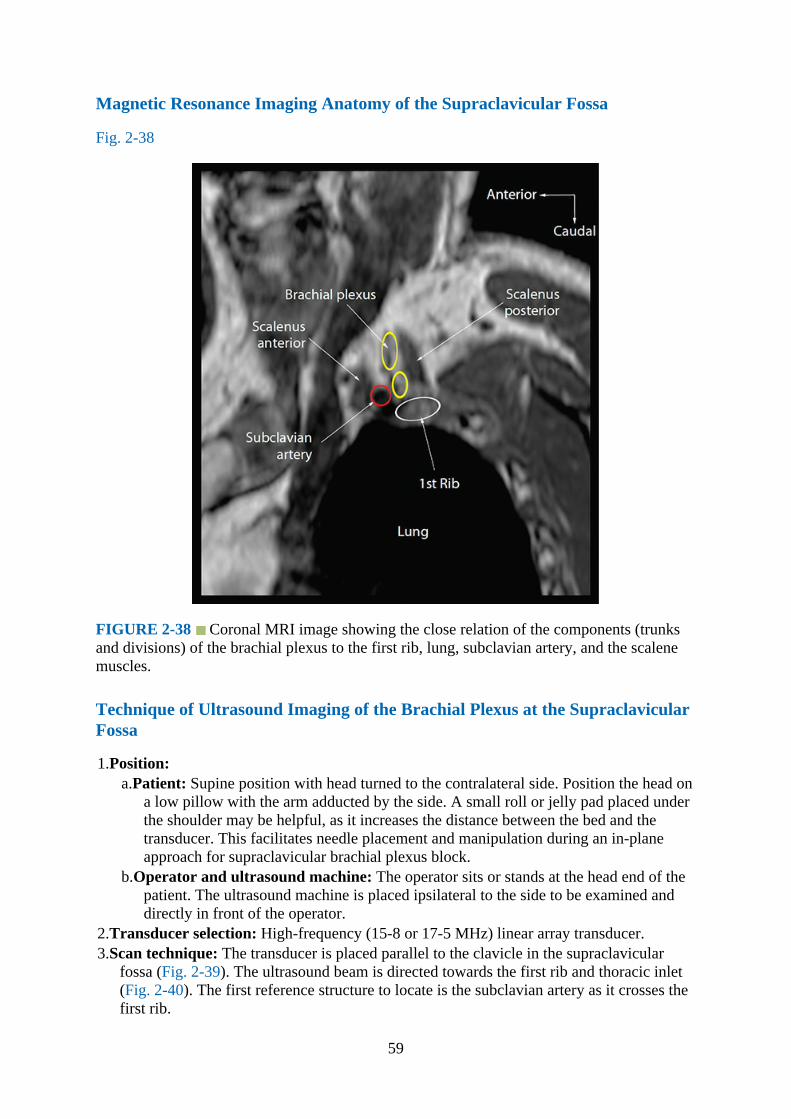
Fig. 2-38
FIGURE 2-38 Coronal MRI image showing the close relation of the components (trunksand divisions) of the brachial plexus to the first rib, lung, subclavian artery, and the scalenemuscles.
Technique of Ultrasound Imaging of the Brachial Plexus at the SupraclavicularFossa
1.Position:a.Patient: Supine position with head turned to the contralateral side. Position the head on
a low pillow with the arm adducted by the side. A small roll or jelly pad placed underthe shoulder may be helpful, as it increases the distance between the bed and thetransducer. This facilitates needle placement and manipulation during an in-planeapproach for supraclavicular brachial plexus block.
b.Operator and ultrasound machine: The operator sits or stands at the head end of thepatient. The ultrasound machine is placed ipsilateral to the side to be examined anddirectly in front of the operator.
2.Transducer selection: High-frequency (15-8 or 17-5 MHz) linear array transducer.3.Scan technique: The transducer is placed parallel to the clavicle in the supraclavicular
fossa (Fig. 2-39). The ultrasound beam is directed towards the first rib and thoracic inlet(Fig. 2-40). The first reference structure to locate is the subclavian artery as it crosses thefirst rib.
59

FIGURE 2-39 Figure showing the position and orientation of the ultrasound transducerduring a transverse scan for the brachial plexus at the supraclavicular fossa.
FIGURE 2-40 Figure highlighting the anatomical structures that are insonated during anultrasound scan for the brachial plexus at the supraclavicular fossa. SCM,sternocleidomastoid muscle; IJV, internal jugular vein; SA, subclavian artery.
4.Sonoanatomy: At the supraclavicular fossa the trunks and divisions of the brachial plexusappear as a cluster of hypoechoic nodules,12 each with a hyperechoic rim (Fig. 2-41).Collectively, they appear as a “bunch of grapes” on the posterolateral aspect of thesubclavian artery. Variations in this relationship have been described with the brachialplexus located farther laterally in relation to the subclavian artery.13 The subclavianartery is pulsatile, can be demonstrated using Color Doppler, and is seen on top of thefirst rib. The first rib appears hyperechoic and is associated with an acoustic shadow (Fig.
60

2-41). The pleura is hyperechoic, deep to or on either side of the first rib, and exhibits thetypical “lung sliding” sign.14
FIGURE 2-41 Transverse sonogram of the supraclavicular fossa. The trunks and divisionsof the brachial plexus are visualized like a “bunch of grapes” on the posterolateral aspect ofthe subclavian artery. SA, subclavian artery; IJV, internal jugular vein.
5.Clinical Pearls: With the transducer placed as described earlier and the subclavian arteryvisualized, optimization of the image to best visualize the brachial plexus is achieved withthe tilting maneuver. The subclavian vein can often be seen lying on top of the pleuramedially. It is also common to visualize one or more small arteries in this area. These arethe suprascapular artery (Fig. 2-42) and the transverse cervical artery (Figs. 2-6 and 2-34).15
61
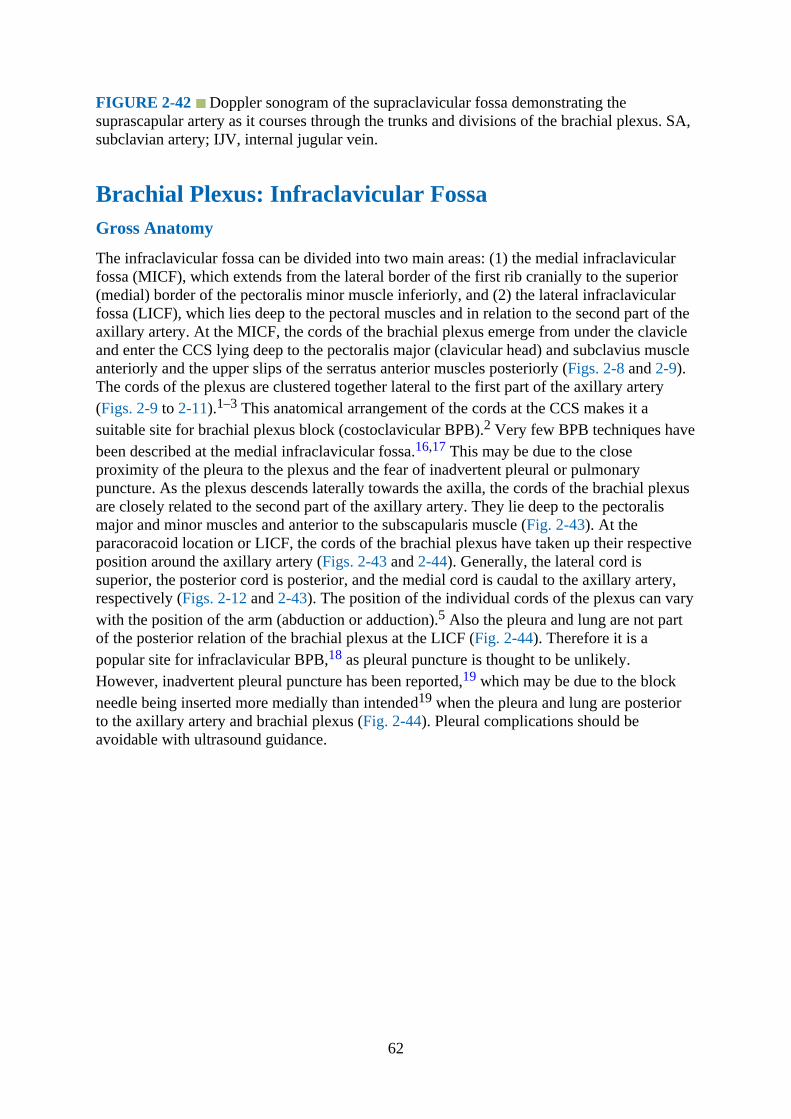
FIGURE 2-42 Doppler sonogram of the supraclavicular fossa demonstrating thesuprascapular artery as it courses through the trunks and divisions of the brachial plexus. SA,subclavian artery; IJV, internal jugular vein.
Brachial Plexus: Infraclavicular FossaGross Anatomy
The infraclavicular fossa can be divided into two main areas: (1) the medial infraclavicularfossa (MICF), which extends from the lateral border of the first rib cranially to the superior(medial) border of the pectoralis minor muscle inferiorly, and (2) the lateral infraclavicularfossa (LICF), which lies deep to the pectoral muscles and in relation to the second part of theaxillary artery. At the MICF, the cords of the brachial plexus emerge from under the clavicleand enter the CCS lying deep to the pectoralis major (clavicular head) and subclavius muscleanteriorly and the upper slips of the serratus anterior muscles posteriorly (Figs. 2-8 and 2-9).The cords of the plexus are clustered together lateral to the first part of the axillary artery(Figs. 2-9 to 2-11).1–3 This anatomical arrangement of the cords at the CCS makes it asuitable site for brachial plexus block (costoclavicular BPB).2 Very few BPB techniques havebeen described at the medial infraclavicular fossa.16,17 This may be due to the closeproximity of the pleura to the plexus and the fear of inadvertent pleural or pulmonarypuncture. As the plexus descends laterally towards the axilla, the cords of the brachial plexusare closely related to the second part of the axillary artery. They lie deep to the pectoralismajor and minor muscles and anterior to the subscapularis muscle (Fig. 2-43). At theparacoracoid location or LICF, the cords of the brachial plexus have taken up their respectiveposition around the axillary artery (Figs. 2-43 and 2-44). Generally, the lateral cord issuperior, the posterior cord is posterior, and the medial cord is caudal to the axillary artery,respectively (Figs. 2-12 and 2-43). The position of the individual cords of the plexus can varywith the position of the arm (abduction or adduction).5 Also the pleura and lung are not partof the posterior relation of the brachial plexus at the LICF (Fig. 2-44). Therefore it is apopular site for infraclavicular BPB,18 as pleural puncture is thought to be unlikely.However, inadvertent pleural puncture has been reported,19 which may be due to the blockneedle being inserted more medially than intended19 when the pleura and lung are posteriorto the axillary artery and brachial plexus (Fig. 2-44). Pleural complications should beavoidable with ultrasound guidance.
62
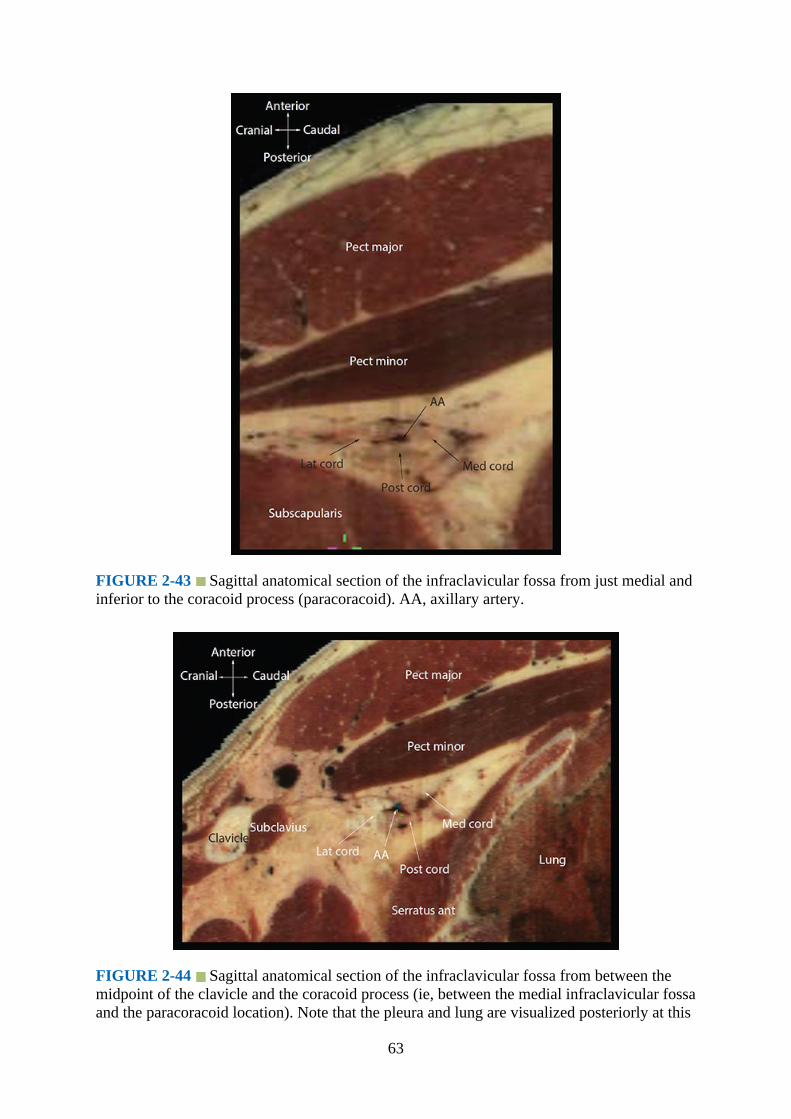
FIGURE 2-43 Sagittal anatomical section of the infraclavicular fossa from just medial andinferior to the coracoid process (paracoracoid). AA, axillary artery.
FIGURE 2-44 Sagittal anatomical section of the infraclavicular fossa from between themidpoint of the clavicle and the coracoid process (ie, between the medial infraclavicular fossaand the paracoracoid location). Note that the pleura and lung are visualized posteriorly at this
63
location.
Computed Tomography Anatomy of the Infraclavicular Fossa
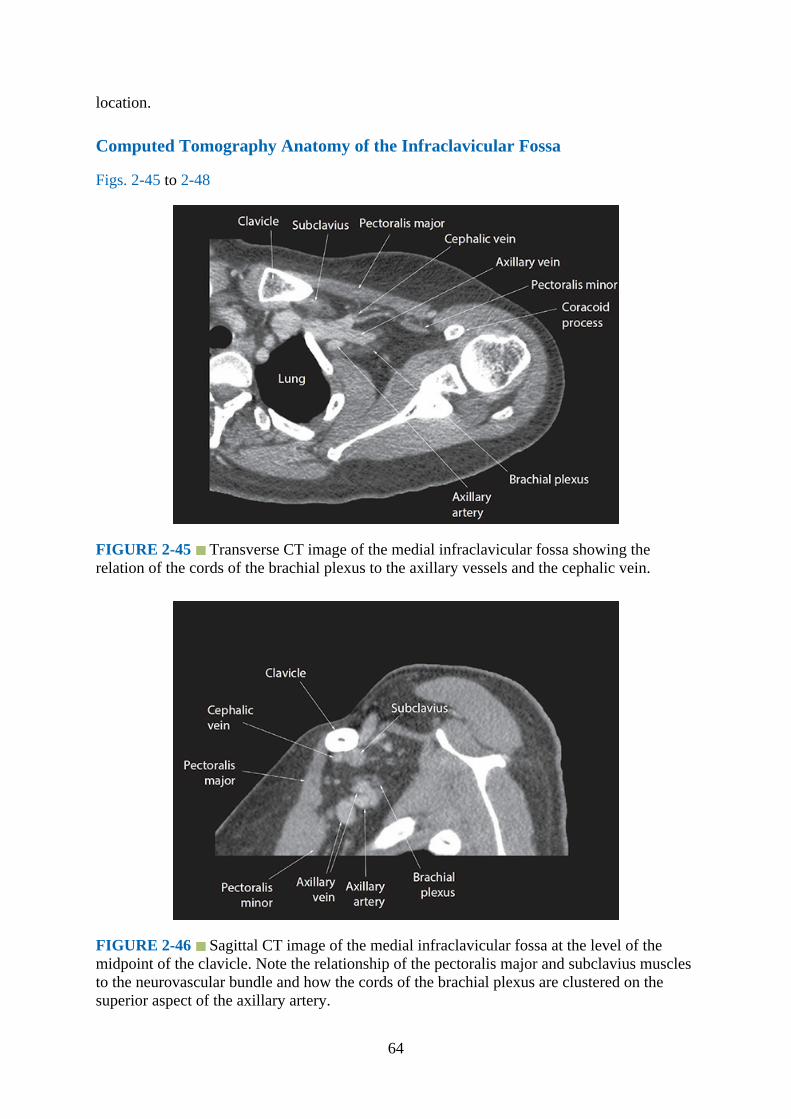
Figs. 2-45 to 2-48
FIGURE 2-45 Transverse CT image of the medial infraclavicular fossa showing therelation of the cords of the brachial plexus to the axillary vessels and the cephalic vein.
FIGURE 2-46 Sagittal CT image of the medial infraclavicular fossa at the level of themidpoint of the clavicle. Note the relationship of the pectoralis major and subclavius musclesto the neurovascular bundle and how the cords of the brachial plexus are clustered on thesuperior aspect of the axillary artery.
64
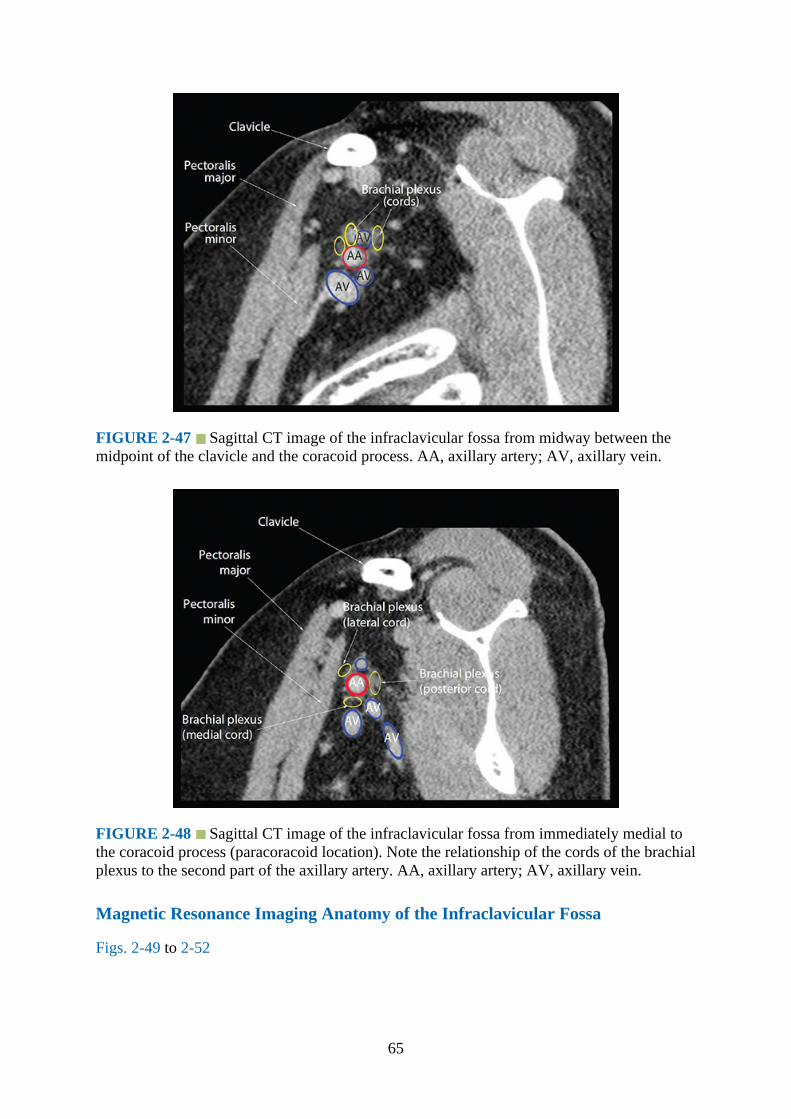
FIGURE 2-47 Sagittal CT image of the infraclavicular fossa from midway between themidpoint of the clavicle and the coracoid process. AA, axillary artery; AV, axillary vein.
FIGURE 2-48 Sagittal CT image of the infraclavicular fossa from immediately medial tothe coracoid process (paracoracoid location). Note the relationship of the cords of the brachialplexus to the second part of the axillary artery. AA, axillary artery; AV, axillary vein.
Magnetic Resonance Imaging Anatomy of the Infraclavicular Fossa
Figs. 2-49 to 2-52
65

FIGURE 2-49 Transverse (axial) MRI image of the medial infraclavicular fossa.
FIGURE 2-50 Sagittal MRI image of the brachial plexus at the medial infraclavicularfossa. AA, axillary artery; AV, axillary vein.
66
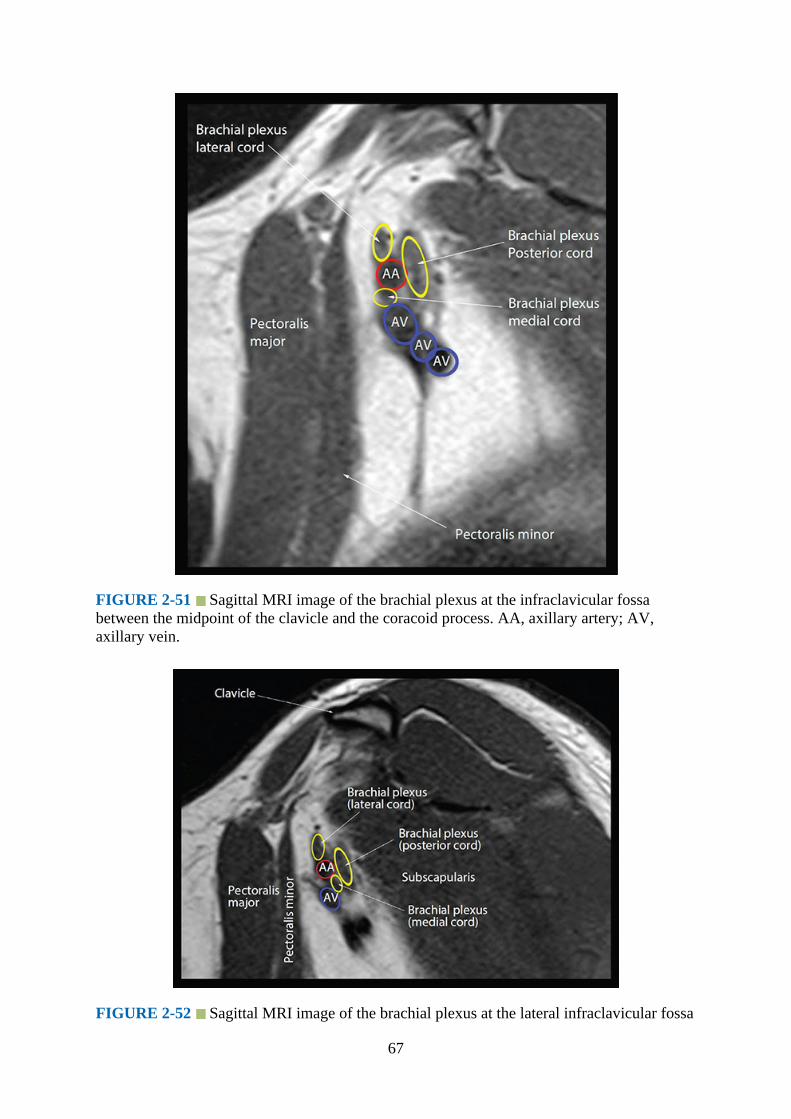
FIGURE 2-51 Sagittal MRI image of the brachial plexus at the infraclavicular fossabetween the midpoint of the clavicle and the coracoid process. AA, axillary artery; AV,axillary vein.
FIGURE 2-52 Sagittal MRI image of the brachial plexus at the lateral infraclavicular fossa
67
immediately medial and lateral to the coracoid process. AA, axillary artery; AV, axillaryvein.
Technique of Ultrasound Imaging of the Brachial Plexus at the MedialInfraclavicular Fossa
1.Position:a.Patient: Supine with the ipsilateral arm abducted (90 degrees) and the head turned
slightly to the contralateral side.b.Operator and ultrasound machine: The operator is positioned at the head end of the
patient. The ultrasound machine is placed on the ipsilateral side to be examined anddirectly in front.
2.Transducer selection: High-frequency linear array transducer (12-5 or 15-8 MHz).3.Scan technique:
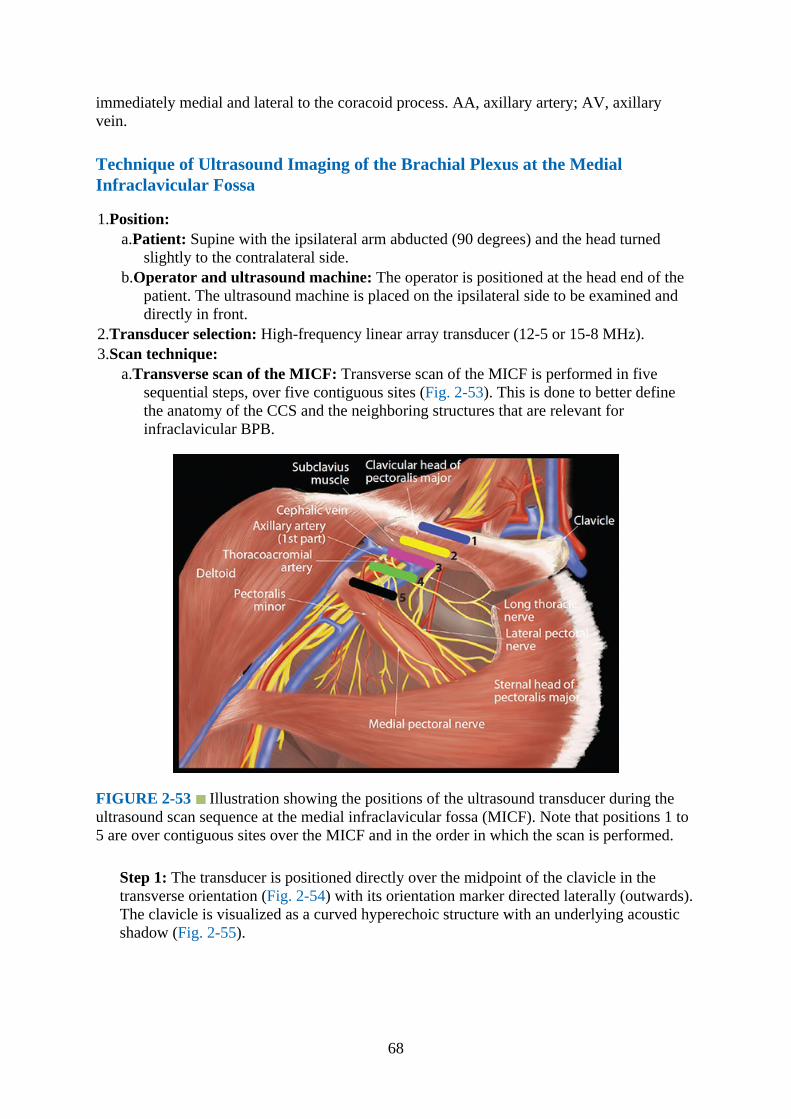
a.Transverse scan of the MICF: Transverse scan of the MICF is performed in fivesequential steps, over five contiguous sites (Fig. 2-53). This is done to better definethe anatomy of the CCS and the neighboring structures that are relevant forinfraclavicular BPB.
FIGURE 2-53 Illustration showing the positions of the ultrasound transducer during theultrasound scan sequence at the medial infraclavicular fossa (MICF). Note that positions 1 to5 are over contiguous sites over the MICF and in the order in which the scan is performed.
Step 1: The transducer is positioned directly over the midpoint of the clavicle in thetransverse orientation (Fig. 2-54) with its orientation marker directed laterally (outwards).The clavicle is visualized as a curved hyperechoic structure with an underlying acousticshadow (Fig. 2-55).
68
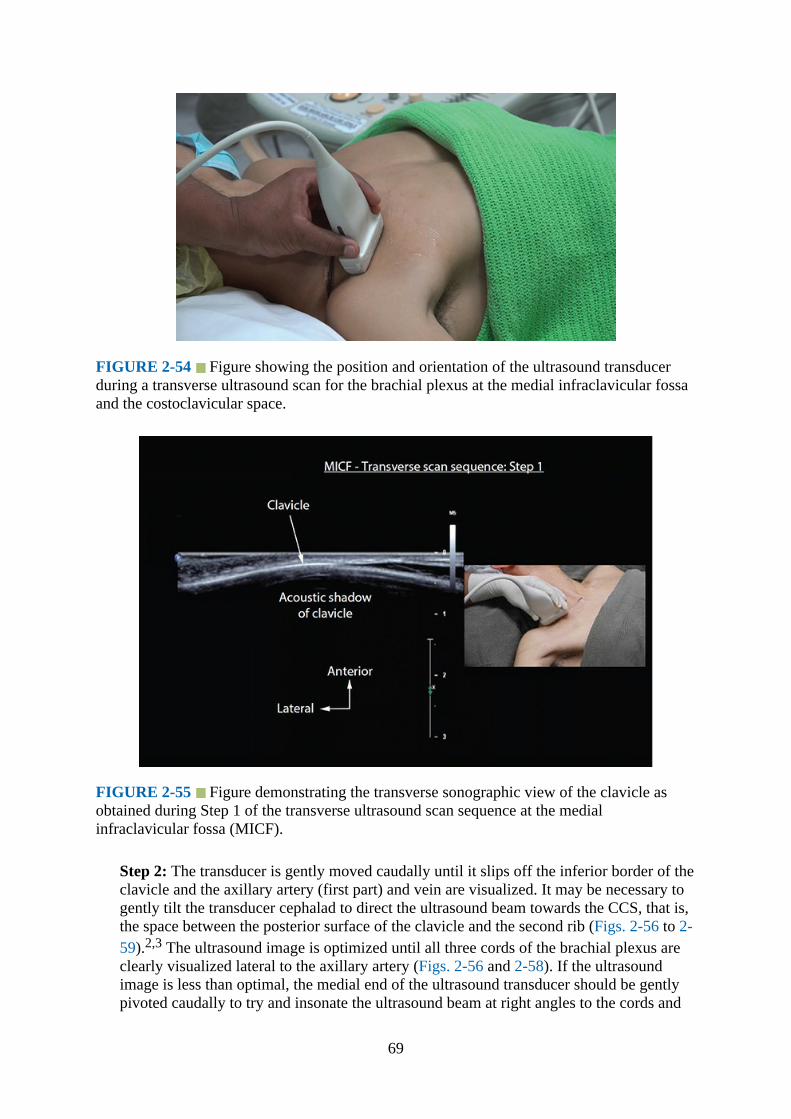
FIGURE 2-54 Figure showing the position and orientation of the ultrasound transducerduring a transverse ultrasound scan for the brachial plexus at the medial infraclavicular fossaand the costoclavicular space.
FIGURE 2-55 Figure demonstrating the transverse sonographic view of the clavicle asobtained during Step 1 of the transverse ultrasound scan sequence at the medialinfraclavicular fossa (MICF).
Step 2: The transducer is gently moved caudally until it slips off the inferior border of theclavicle and the axillary artery (first part) and vein are visualized. It may be necessary togently tilt the transducer cephalad to direct the ultrasound beam towards the CCS, that is,the space between the posterior surface of the clavicle and the second rib (Figs. 2-56 to 2-59).2,3 The ultrasound image is optimized until all three cords of the brachial plexus areclearly visualized lateral to the axillary artery (Figs. 2-56 and 2-58). If the ultrasoundimage is less than optimal, the medial end of the ultrasound transducer should be gentlypivoted caudally to try and insonate the ultrasound beam at right angles to the cords and
69

thus minimize anisotropy (Fig. 2-56).
FIGURE 2-56 Transverse sonogram of the medial infraclavicular fossa immediately belowthe midpoint of the clavicle (Step 2 of the transverse ultrasound scan sequence)demonstrating the cords of the brachial plexus in the costoclavicular space. Note the arm ofthe subject is abducted and the three cords are clustered together lateral to the axillary artery(AA). Accompanying photographs illustrate the position and orientation of the ultrasoundtransducer during the scan.
FIGURE 2-57 Figure highlighting the anatomical structures that are insonated during atransverse ultrasound scan for the brachial plexus at the medial infraclavicular fossa belowthe midpoint of the clavicle. AA, axillary artery.
70
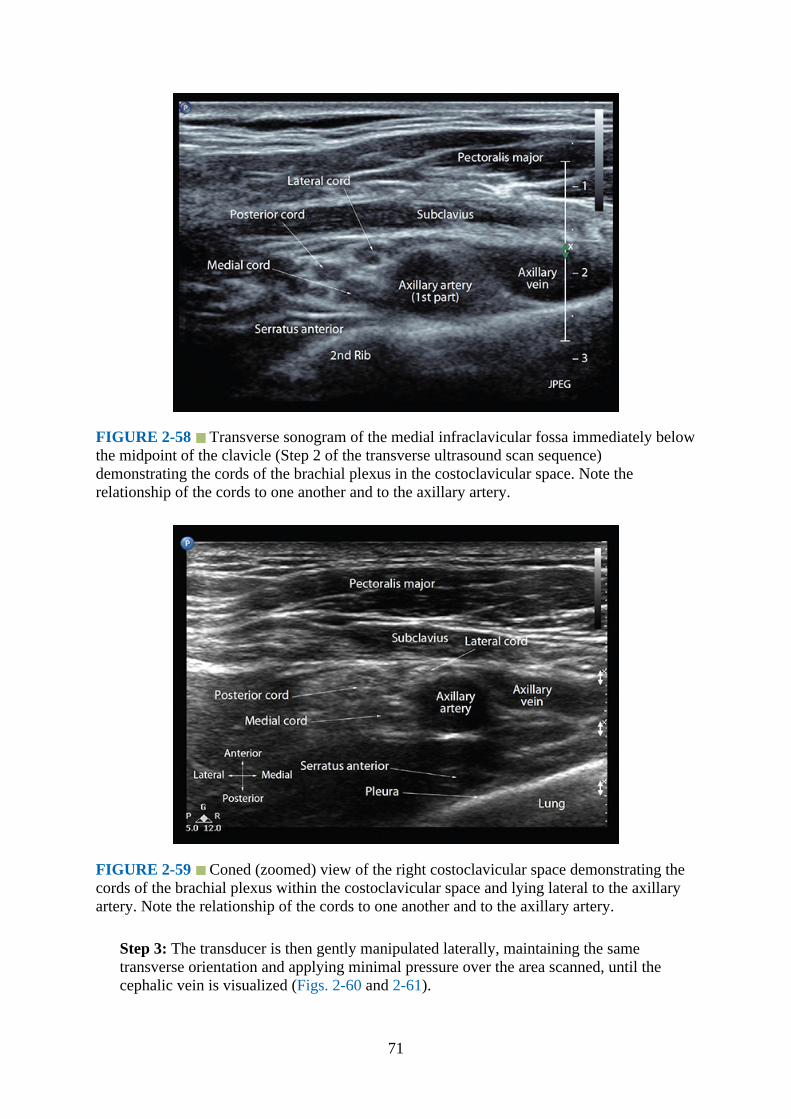
FIGURE 2-58 Transverse sonogram of the medial infraclavicular fossa immediately belowthe midpoint of the clavicle (Step 2 of the transverse ultrasound scan sequence)demonstrating the cords of the brachial plexus in the costoclavicular space. Note therelationship of the cords to one another and to the axillary artery.
FIGURE 2-59 Coned (zoomed) view of the right costoclavicular space demonstrating thecords of the brachial plexus within the costoclavicular space and lying lateral to the axillaryartery. Note the relationship of the cords to one another and to the axillary artery.
Step 3: The transducer is then gently manipulated laterally, maintaining the sametransverse orientation and applying minimal pressure over the area scanned, until thecephalic vein is visualized (Figs. 2-60 and 2-61).
71

FIGURE 2-60 Transverse oblique sonogram of the right medial infraclavicular fossa(MICF) from just distal to the costoclavicular space (Step 3 of the transverse scan sequence).Note how the cephalic vein arches over the cords of the brachial plexus and the axillary arteryto join the axillary vein from a lateral to medial direction. PM, pectoralis major muscle; CV,cephalic vein; AA, axillary artery; AV, axillary vein.
FIGURE 2-61 Transverse oblique sonogram (zoomed view) of the medial infraclavicularfossa (MICF) showing the cephalic vein joining the axillary vein. Note the cords of thebrachial plexus are located posterior to the cephalic vein and lateral to the axillary artery.
Step 4: From this position the transducer is manipulated further laterally until the
72
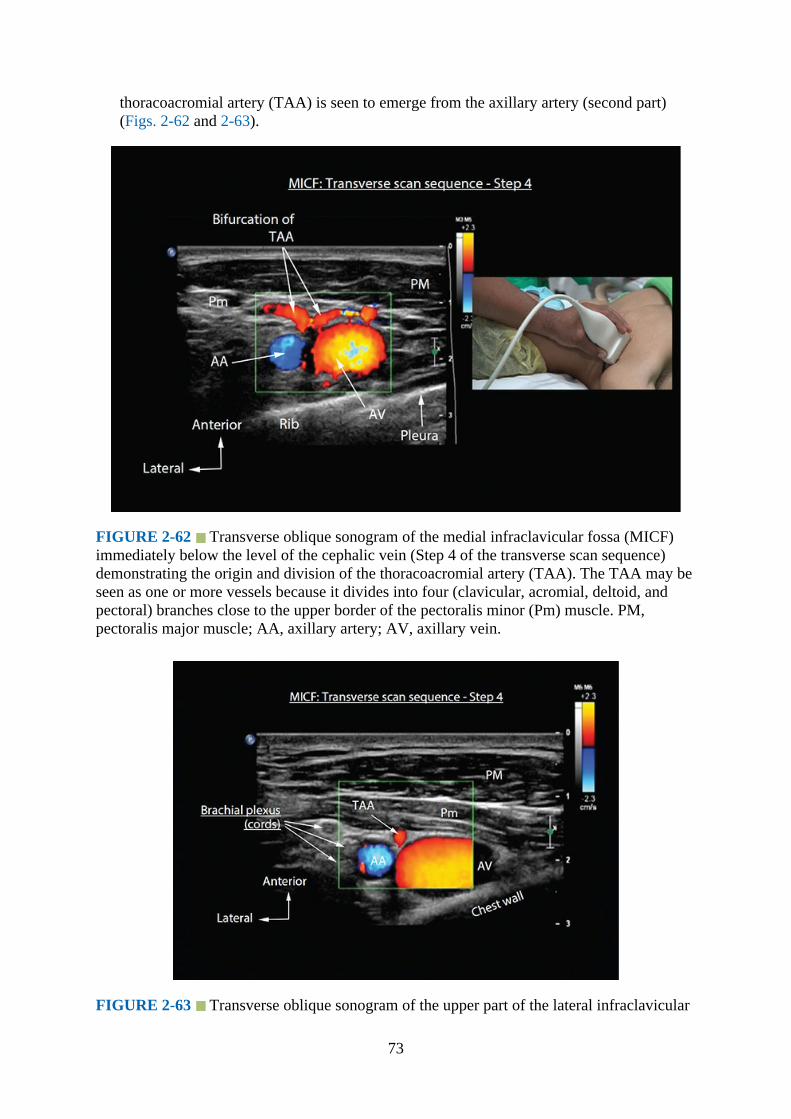
thoracoacromial artery (TAA) is seen to emerge from the axillary artery (second part)(Figs. 2-62 and 2-63).
FIGURE 2-62 Transverse oblique sonogram of the medial infraclavicular fossa (MICF)immediately below the level of the cephalic vein (Step 4 of the transverse scan sequence)demonstrating the origin and division of the thoracoacromial artery (TAA). The TAA may beseen as one or more vessels because it divides into four (clavicular, acromial, deltoid, andpectoral) branches close to the upper border of the pectoralis minor (Pm) muscle. PM,pectoralis major muscle; AA, axillary artery; AV, axillary vein.
FIGURE 2-63 Transverse oblique sonogram of the upper part of the lateral infraclavicular
73
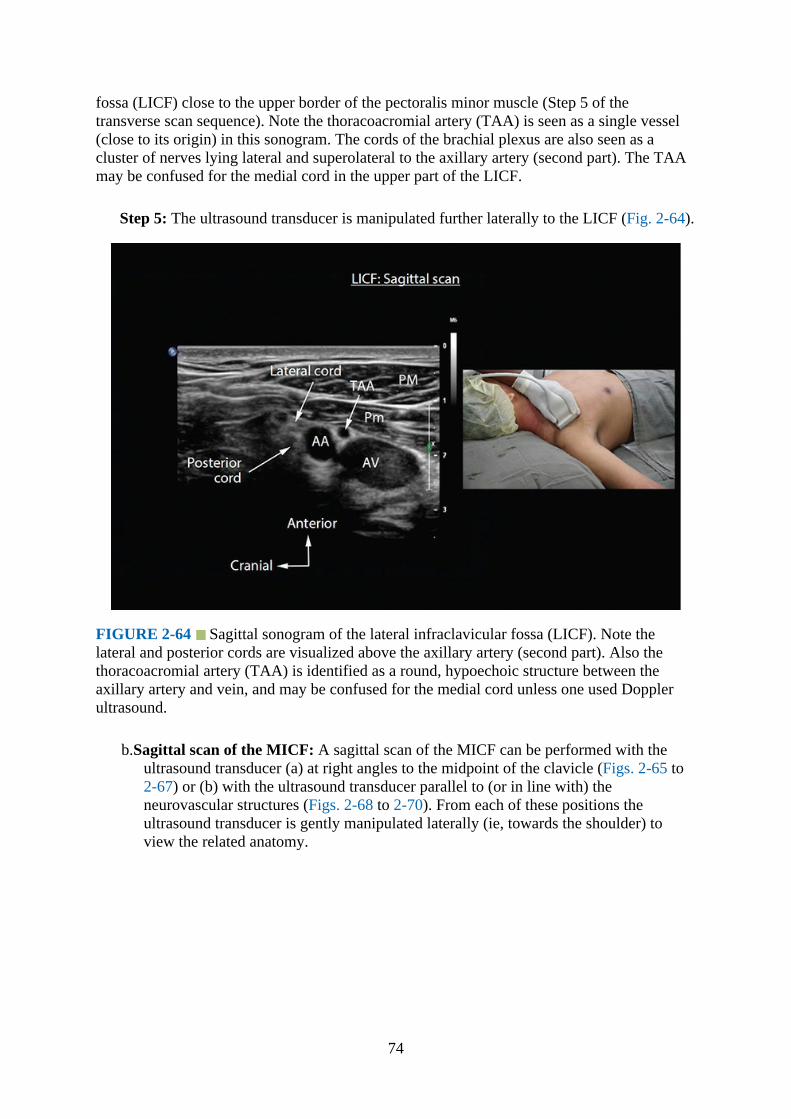
fossa (LICF) close to the upper border of the pectoralis minor muscle (Step 5 of thetransverse scan sequence). Note the thoracoacromial artery (TAA) is seen as a single vessel(close to its origin) in this sonogram. The cords of the brachial plexus are also seen as acluster of nerves lying lateral and superolateral to the axillary artery (second part). The TAAmay be confused for the medial cord in the upper part of the LICF.
Step 5: The ultrasound transducer is manipulated further laterally to the LICF (Fig. 2-64).
FIGURE 2-64 Sagittal sonogram of the lateral infraclavicular fossa (LICF). Note thelateral and posterior cords are visualized above the axillary artery (second part). Also thethoracoacromial artery (TAA) is identified as a round, hypoechoic structure between theaxillary artery and vein, and may be confused for the medial cord unless one used Dopplerultrasound.
b.Sagittal scan of the MICF: A sagittal scan of the MICF can be performed with theultrasound transducer (a) at right angles to the midpoint of the clavicle (Figs. 2-65 to2-67) or (b) with the ultrasound transducer parallel to (or in line with) theneurovascular structures (Figs. 2-68 to 2-70). From each of these positions theultrasound transducer is gently manipulated laterally (ie, towards the shoulder) toview the related anatomy.
74
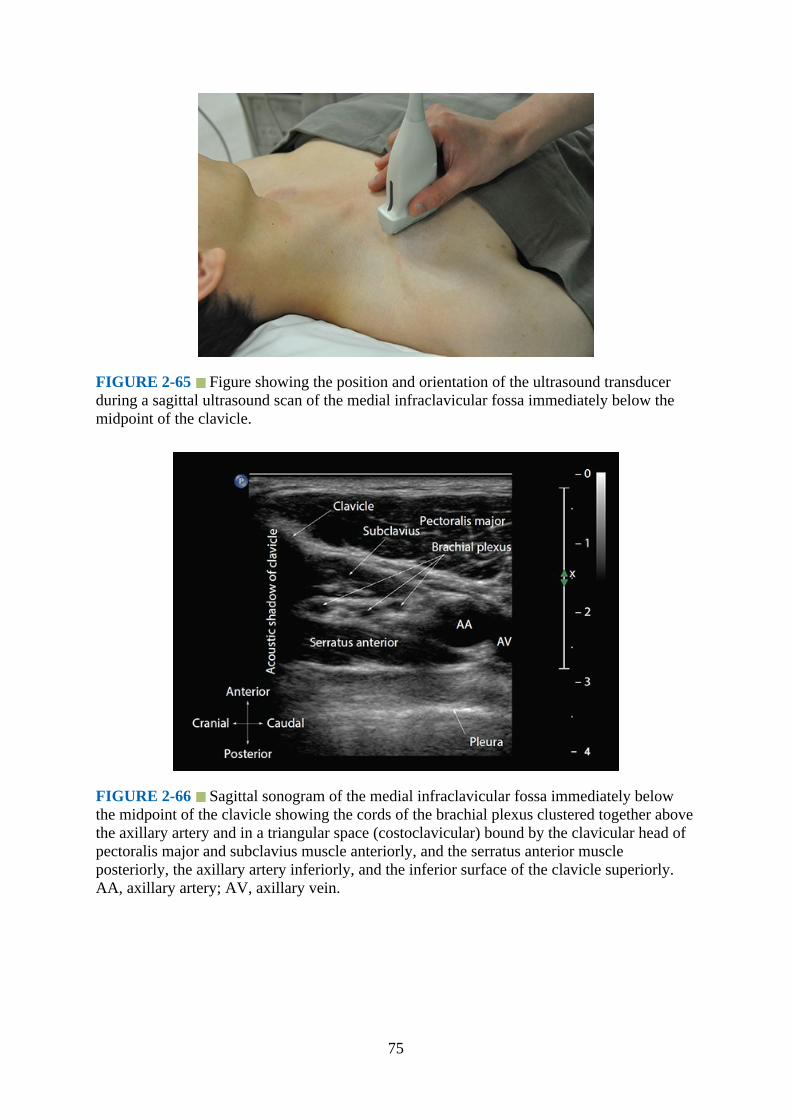
FIGURE 2-65 Figure showing the position and orientation of the ultrasound transducerduring a sagittal ultrasound scan of the medial infraclavicular fossa immediately below themidpoint of the clavicle.
FIGURE 2-66 Sagittal sonogram of the medial infraclavicular fossa immediately belowthe midpoint of the clavicle showing the cords of the brachial plexus clustered together abovethe axillary artery and in a triangular space (costoclavicular) bound by the clavicular head ofpectoralis major and subclavius muscle anteriorly, and the serratus anterior muscleposteriorly, the axillary artery inferiorly, and the inferior surface of the clavicle superiorly.AA, axillary artery; AV, axillary vein.
75

FIGURE 2-67 Sagittal sonogram of the medial infraclavicular fossa lateral to the positiondescribed earlier (Fig. 2-66). Note how the cords of the brachial plexus (BP) are clusteredtogether and located above the axillary artery in a space (costoclavicular) bound by theinferior surface of the clavicle superiorly, the axillary artery inferiorly, the subclavius muscleanteriorly, and the serratus anterior muscle posteriorly. The cephalic vein (CV) is locatedanterior to the axillary artery. AA, axillary artery; AV, axillary vein.
FIGURE 2-68 Sagittal sonogram of the medial infraclavicular fossa showing the cephalicvein joining the axillary vein. Note how the cords of the brachial plexus are clustered togetherposterior to the cephalic vein and superior to the axillary artery. The position of the cephalicvein relative to the cords of the brachial plexus in the sagittal sonogram often precludes safeneedle insertion at this level.
76
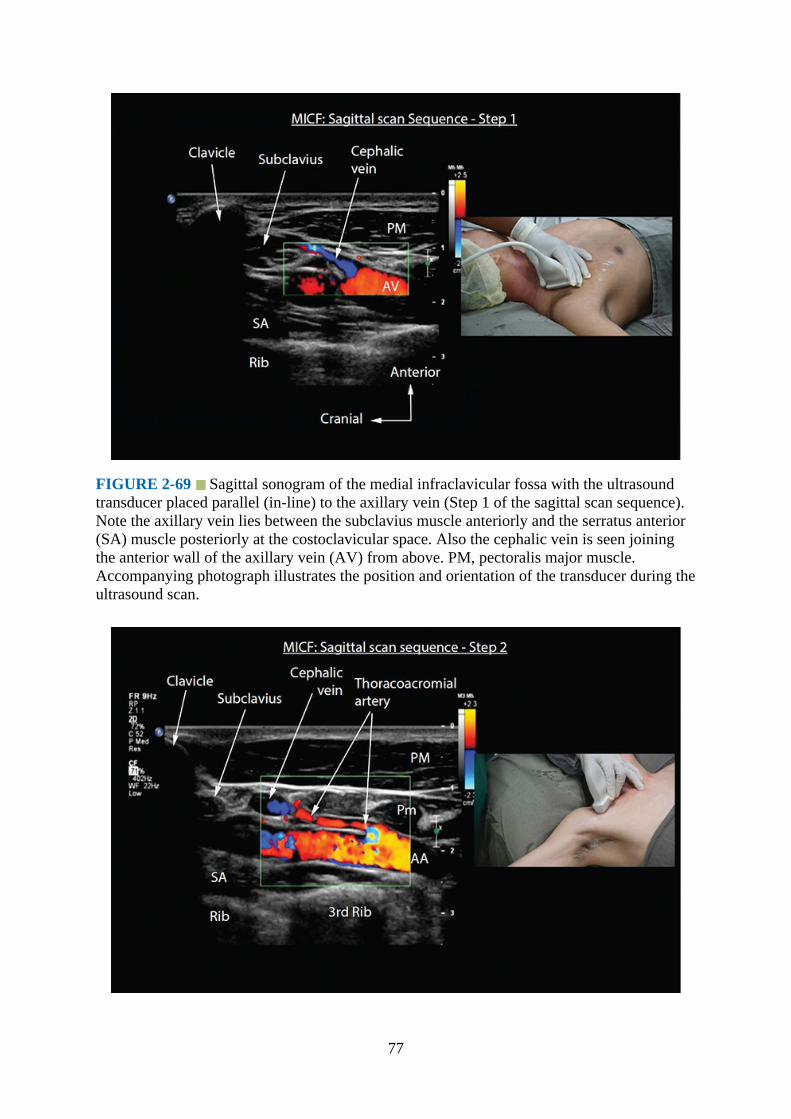
FIGURE 2-69 Sagittal sonogram of the medial infraclavicular fossa with the ultrasoundtransducer placed parallel (in-line) to the axillary vein (Step 1 of the sagittal scan sequence).Note the axillary vein lies between the subclavius muscle anteriorly and the serratus anterior(SA) muscle posteriorly at the costoclavicular space. Also the cephalic vein is seen joiningthe anterior wall of the axillary vein (AV) from above. PM, pectoralis major muscle.Accompanying photograph illustrates the position and orientation of the transducer during theultrasound scan.
77
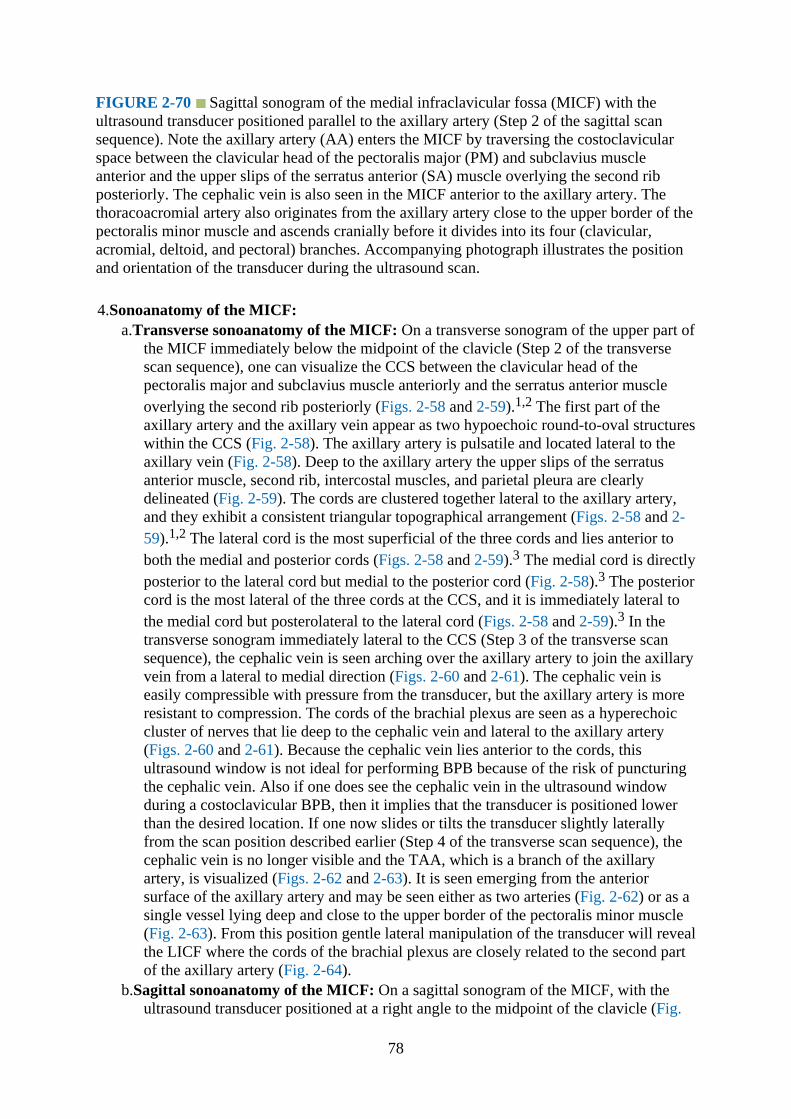
FIGURE 2-70 Sagittal sonogram of the medial infraclavicular fossa (MICF) with theultrasound transducer positioned parallel to the axillary artery (Step 2 of the sagittal scansequence). Note the axillary artery (AA) enters the MICF by traversing the costoclavicularspace between the clavicular head of the pectoralis major (PM) and subclavius muscleanterior and the upper slips of the serratus anterior (SA) muscle overlying the second ribposteriorly. The cephalic vein is also seen in the MICF anterior to the axillary artery. Thethoracoacromial artery also originates from the axillary artery close to the upper border of thepectoralis minor muscle and ascends cranially before it divides into its four (clavicular,acromial, deltoid, and pectoral) branches. Accompanying photograph illustrates the positionand orientation of the transducer during the ultrasound scan.
4.Sonoanatomy of the MICF:a.Transverse sonoanatomy of the MICF: On a transverse sonogram of the upper part of
the MICF immediately below the midpoint of the clavicle (Step 2 of the transversescan sequence), one can visualize the CCS between the clavicular head of thepectoralis major and subclavius muscle anteriorly and the serratus anterior muscleoverlying the second rib posteriorly (Figs. 2-58 and 2-59).1,2 The first part of theaxillary artery and the axillary vein appear as two hypoechoic round-to-oval structureswithin the CCS (Fig. 2-58). The axillary artery is pulsatile and located lateral to theaxillary vein (Fig. 2-58). Deep to the axillary artery the upper slips of the serratusanterior muscle, second rib, intercostal muscles, and parietal pleura are clearlydelineated (Fig. 2-59). The cords are clustered together lateral to the axillary artery,and they exhibit a consistent triangular topographical arrangement (Figs. 2-58 and 2-59).1,2 The lateral cord is the most superficial of the three cords and lies anterior toboth the medial and posterior cords (Figs. 2-58 and 2-59).3 The medial cord is directlyposterior to the lateral cord but medial to the posterior cord (Fig. 2-58).3 The posteriorcord is the most lateral of the three cords at the CCS, and it is immediately lateral tothe medial cord but posterolateral to the lateral cord (Figs. 2-58 and 2-59).3 In thetransverse sonogram immediately lateral to the CCS (Step 3 of the transverse scansequence), the cephalic vein is seen arching over the axillary artery to join the axillaryvein from a lateral to medial direction (Figs. 2-60 and 2-61). The cephalic vein iseasily compressible with pressure from the transducer, but the axillary artery is moreresistant to compression. The cords of the brachial plexus are seen as a hyperechoiccluster of nerves that lie deep to the cephalic vein and lateral to the axillary artery(Figs. 2-60 and 2-61). Because the cephalic vein lies anterior to the cords, thisultrasound window is not ideal for performing BPB because of the risk of puncturingthe cephalic vein. Also if one does see the cephalic vein in the ultrasound windowduring a costoclavicular BPB, then it implies that the transducer is positioned lowerthan the desired location. If one now slides or tilts the transducer slightly laterallyfrom the scan position described earlier (Step 4 of the transverse scan sequence), thecephalic vein is no longer visible and the TAA, which is a branch of the axillaryartery, is visualized (Figs. 2-62 and 2-63). It is seen emerging from the anteriorsurface of the axillary artery and may be seen either as two arteries (Fig. 2-62) or as asingle vessel lying deep and close to the upper border of the pectoralis minor muscle(Fig. 2-63). From this position gentle lateral manipulation of the transducer will revealthe LICF where the cords of the brachial plexus are closely related to the second partof the axillary artery (Fig. 2-64).
b.Sagittal sonoanatomy of the MICF: On a sagittal sonogram of the MICF, with theultrasound transducer positioned at a right angle to the midpoint of the clavicle (Fig.
78

2-65), the cords of the brachial plexus are seen as multiple hypoechoic round to oval,structures each with a hyperechoic rim lying superior to the pulsatile axillary artery(Figs. 2-66 to 2-68). The cords lie within the CCS formed by the pectoralis major andsubclavius muscle anteriorly and the upper slips of the serratus anterior muscle andchest wall posteriorly (Figs. 2-66 to 2-68). The axillary vein is located caudal to theaxillary artery (Figs. 2-66 to 2-68), and the cephalic vein joins the axillary vein fromabove (Fig. 2-68). Deep to the serratus anterior muscle outlines of the anteriorintercostal space and the hyperechoic pleura are clearly visualized. The arrangementof the cords in the sagittal sonogram is also consistent,20 with the lateral cord lyinganterior to the medial cord, and the posterior cords lying superior to the medial andlateral cord (Figs. 2-66 to 2-68).20
On a sagittal sonogram of the MICF, with the ultrasound transducer positioned parallel tothe long axis of the neurovascular structures (Figs. 2-69 to 2-71) and from a medial to lateraldirection, the axillary vein is the first structure visualized (Fig. 2-69). The axillary vein ishypoechoic, nonpulsatile, easily compressible, and lies on the anterior chest wall. Thecephalic vein is also delineated and, after it traverses the gap between the clavicular head ofthe pectoralis major and the subclavius muscle, joins the axillary vein from above (Fig. 2-69).In the adjoining sagittal sonogram, the pulsatile axillary artery is visualized (Fig. 2-70). Theaxillary artery, after it emerges from the CCS, lies in the MICF, deep to the clavicular head ofthe pectoralis major muscle and above the superior border of the pectoralis minor muscle(Fig. 2-69). The cephalic vein lies anterior to the axillary artery at the MICF (Fig. 2-69). Theaxillary artery continues distally to enter the LICF, where it is located posterior to thepectoralis major and minor muscles (Fig. 2-70). The axillary artery also gives off the TAAfrom its anterior wall, and the latter ascends cranially, lying close to the posterior surface ofthe pectoralis minor muscle (Fig. 2-70). In the sagittal sonogram acquired immediately lateraland parallel to the axillary artery, the cords of the brachial plexus are visualized aslongitudinal hyperechoic structures (Fig. 2-71) and lying within the CCS (close to theclavicle), MICF and LICF from a cranial to caudal direction (Fig. 2-71). At the MICF thecephalic vein and TAA (possibly the pectoral branch) lie anterior to the cords (Fig. 2-71).Due to the anatomic arrangement of the cords at the MICF (Figs. 2-10 and 2-11), all threecords of the brachial plexus are rarely visualized in a single sagittal sonogram. It is morecommon to visualize two cords, that is, the lateral cord lying anterior to the medial cord (Fig.2-71).
79
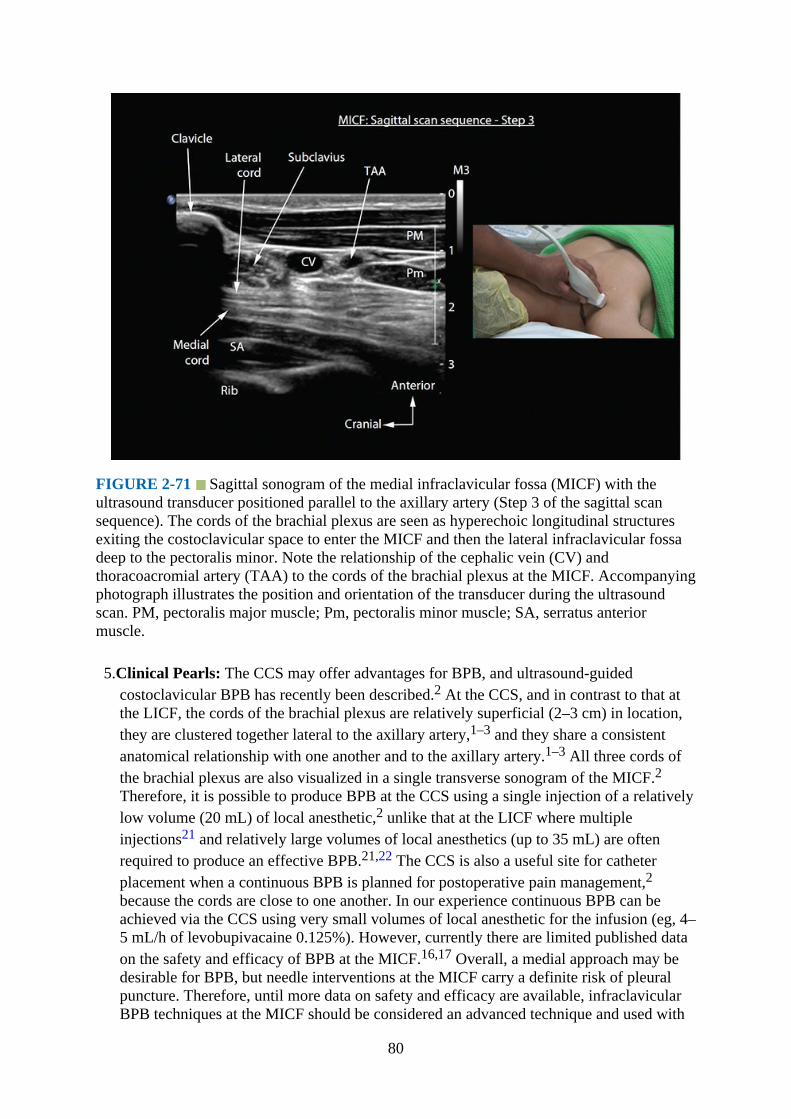
FIGURE 2-71 Sagittal sonogram of the medial infraclavicular fossa (MICF) with theultrasound transducer positioned parallel to the axillary artery (Step 3 of the sagittal scansequence). The cords of the brachial plexus are seen as hyperechoic longitudinal structuresexiting the costoclavicular space to enter the MICF and then the lateral infraclavicular fossadeep to the pectoralis minor. Note the relationship of the cephalic vein (CV) andthoracoacromial artery (TAA) to the cords of the brachial plexus at the MICF. Accompanyingphotograph illustrates the position and orientation of the transducer during the ultrasoundscan. PM, pectoralis major muscle; Pm, pectoralis minor muscle; SA, serratus anteriormuscle.
5.Clinical Pearls: The CCS may offer advantages for BPB, and ultrasound-guidedcostoclavicular BPB has recently been described.2 At the CCS, and in contrast to that atthe LICF, the cords of the brachial plexus are relatively superficial (2–3 cm) in location,they are clustered together lateral to the axillary artery,1–3 and they share a consistentanatomical relationship with one another and to the axillary artery.1–3 All three cords ofthe brachial plexus are also visualized in a single transverse sonogram of the MICF.2Therefore, it is possible to produce BPB at the CCS using a single injection of a relativelylow volume (20 mL) of local anesthetic,2 unlike that at the LICF where multipleinjections21 and relatively large volumes of local anesthetics (up to 35 mL) are oftenrequired to produce an effective BPB.21,22 The CCS is also a useful site for catheterplacement when a continuous BPB is planned for postoperative pain management,2because the cords are close to one another. In our experience continuous BPB can beachieved via the CCS using very small volumes of local anesthetic for the infusion (eg, 4–5 mL/h of levobupivacaine 0.125%). However, currently there are limited published dataon the safety and efficacy of BPB at the MICF.16,17 Overall, a medial approach may bedesirable for BPB, but needle interventions at the MICF carry a definite risk of pleuralpuncture. Therefore, until more data on safety and efficacy are available, infraclavicularBPB techniques at the MICF should be considered an advanced technique and used with
80

caution because the lateral sagittal infraclavicular BPB technique, despite some of itslimitations, is effective and has a long track record of safety.18,23
Ultrasound Imaging of the Brachial Plexus at the Lateral Infraclavicular Fossa
1.Position:a.Patient: Supine with the ipsilateral arm abducted (90 degrees) and the head turned
slightly to the contralateral side.b.Operator and ultrasound machine: The operator is positioned at the head end of the
patient. The ultrasound machine is placed on the ipsilateral side to be examined anddirectly in front.
2.Transducer selection: High-frequency linear array transducer (12-5 or 15-8 MHz). Forultrasound imaging of the LICF (paracoracoid location), we prefer to use a high-frequency linear array transducer (12-5 or 15-8 MHz, Fig. 2-72). However, in muscular orobese individuals, a high-frequency curved array transducer (eg, 8-5 MHz) with a smallfootprint may be preferable.
FIGURE 2-72 Figure showing the position and orientation of the ultrasound transducerduring a sagittal ultrasound scan of the lateral infraclavicular fossa immediately medial andinferior to the coracoid process (paracoracoid location).
3.Scan technique: The transducer is positioned just below the clavicle and over thedeltopectoral groove, medial and inferior to the coracoid process (Figs. 2-64 and 2-72).The first objective is to locate the axillary artery and vein. It may be necessary to gentlytilt, slide, or rotate the transducer to obtain an optimal view of the axillary artery. Alsoduring the scan it is possible to obtain a sagittal view of the LICF with (medial position,Figs. 2-73 and 2-74) or without (lateral position, Figs. 2-75 to 2-77) insonating the chestwall and pleura.
81

FIGURE 2-73 Figure highlighting the anatomical structures that are insonated during asagittal ultrasound scan for the brachial plexus immediately medial and inferior to thecoracoid process (paracoracoid location). AA, axillary artery.
FIGURE 2-74 Sagittal sonogram of the lateral infraclavicular fossa midway between themidpoint of the clavicle and the coracoid process. Note the pleura is visible posteriorly anddeep to the axillary artery and vein. AA, axillary artery; AV, axillary vein.
82
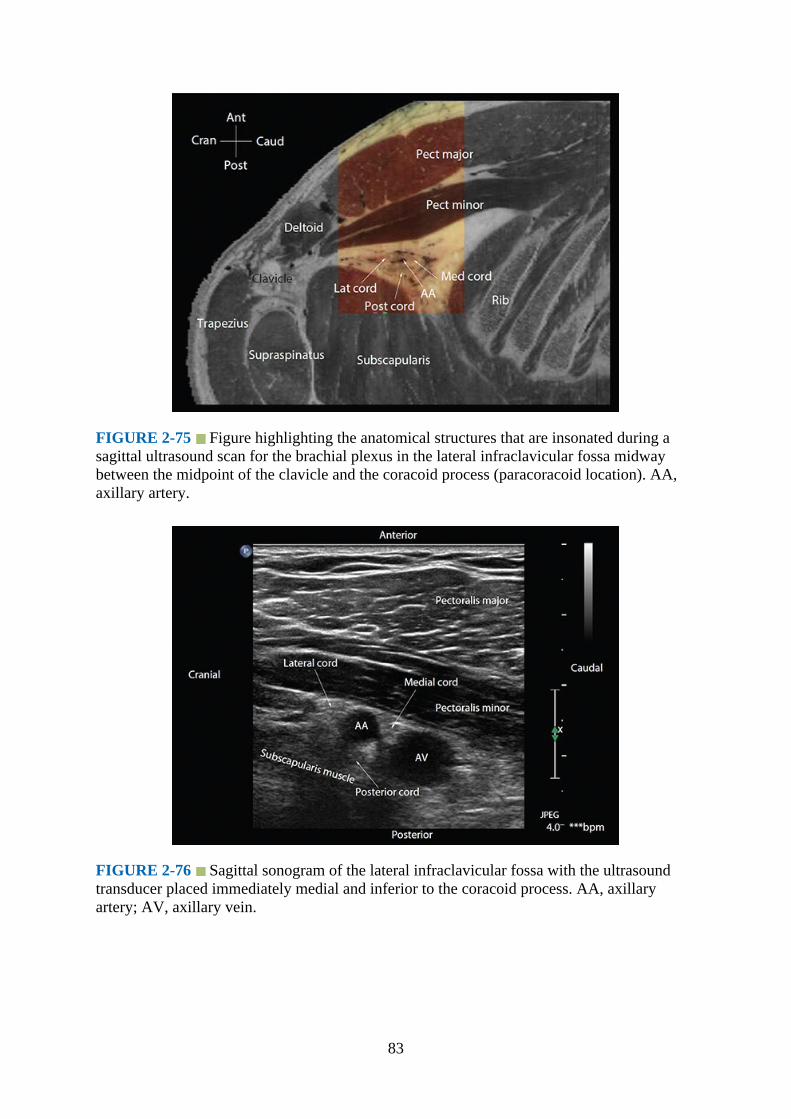
FIGURE 2-75 Figure highlighting the anatomical structures that are insonated during asagittal ultrasound scan for the brachial plexus in the lateral infraclavicular fossa midwaybetween the midpoint of the clavicle and the coracoid process (paracoracoid location). AA,axillary artery.
FIGURE 2-76 Sagittal sonogram of the lateral infraclavicular fossa with the ultrasoundtransducer placed immediately medial and inferior to the coracoid process. AA, axillaryartery; AV, axillary vein.
83
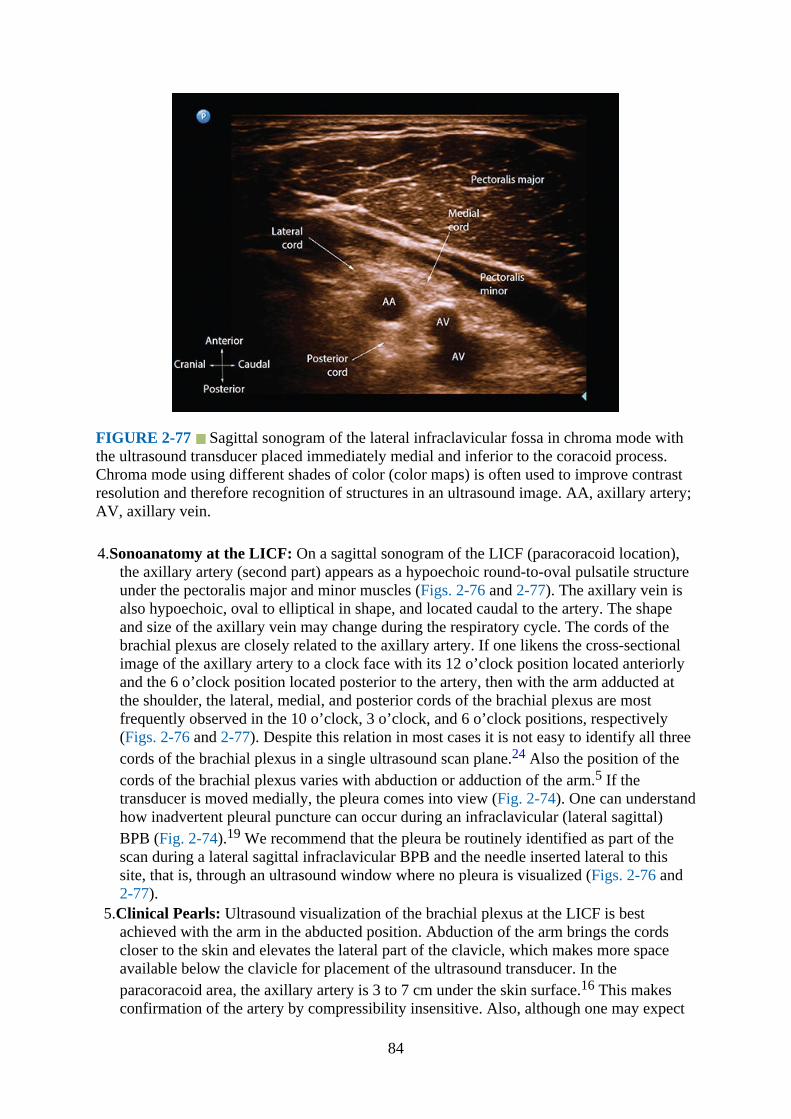
FIGURE 2-77 Sagittal sonogram of the lateral infraclavicular fossa in chroma mode withthe ultrasound transducer placed immediately medial and inferior to the coracoid process.Chroma mode using different shades of color (color maps) is often used to improve contrastresolution and therefore recognition of structures in an ultrasound image. AA, axillary artery;AV, axillary vein.
4.Sonoanatomy at the LICF: On a sagittal sonogram of the LICF (paracoracoid location),the axillary artery (second part) appears as a hypoechoic round-to-oval pulsatile structureunder the pectoralis major and minor muscles (Figs. 2-76 and 2-77). The axillary vein isalso hypoechoic, oval to elliptical in shape, and located caudal to the artery. The shapeand size of the axillary vein may change during the respiratory cycle. The cords of thebrachial plexus are closely related to the axillary artery. If one likens the cross-sectionalimage of the axillary artery to a clock face with its 12 o’clock position located anteriorlyand the 6 o’clock position located posterior to the artery, then with the arm adducted atthe shoulder, the lateral, medial, and posterior cords of the brachial plexus are mostfrequently observed in the 10 o’clock, 3 o’clock, and 6 o’clock positions, respectively(Figs. 2-76 and 2-77). Despite this relation in most cases it is not easy to identify all threecords of the brachial plexus in a single ultrasound scan plane.24 Also the position of thecords of the brachial plexus varies with abduction or adduction of the arm.5 If thetransducer is moved medially, the pleura comes into view (Fig. 2-74). One can understandhow inadvertent pleural puncture can occur during an infraclavicular (lateral sagittal)BPB (Fig. 2-74).19 We recommend that the pleura be routinely identified as part of thescan during a lateral sagittal infraclavicular BPB and the needle inserted lateral to thissite, that is, through an ultrasound window where no pleura is visualized (Figs. 2-76 and2-77).
5.Clinical Pearls: Ultrasound visualization of the brachial plexus at the LICF is bestachieved with the arm in the abducted position. Abduction of the arm brings the cordscloser to the skin and elevates the lateral part of the clavicle, which makes more spaceavailable below the clavicle for placement of the ultrasound transducer. In theparacoracoid area, the axillary artery is 3 to 7 cm under the skin surface.16 This makesconfirmation of the artery by compressibility insensitive. Also, although one may expect
84

to be able to compress the axillary vein with pressure at the LICF, it may not always bepossible. Therefore, it is advisable to use Doppler ultrasound whenever possible todifferentiate the artery from the vein. Rarely one may visualize a bifid axillary artery25 inthe infraclavicular fossa as a normal variant of the axillary artery anatomy. It is alsocommon to see a hyperechoic shadow posterior to the axillary artery at the 6 o’clockposition. This is usually an artifact caused by acoustic enhancement resulting from thesudden reduction in acoustic impedance as the ultrasound signal travels through the bloodin the axillary artery. This hyperechoic shadow may be mistaken as the posterior cord.Tilting the transducer or performing a “trace back technique”9 may help to differentiatean artifact from the posterior cord. The LICF is a popular site for brachial plexus catheterplacement. The target location for the catheter placement should be posterior (ie, at the 6or 7 o’clock position) to the axillary artery. The muscles of the chest wall, through whichthe catheter is passed, help stabilize the catheter and may prevent catheter dislodgement.
Brachial Plexus: AxillaGross Anatomy
As the brachial plexus enters the arm, its four main terminal nerves (median, ulnar, radial,and musculocutaneous) travel in close proximity to the third part of the axillary artery (Fig. 2-13 and 2-78). The nerves lie superficial to the conjoint tendon of the teres major andlatissimus dorsi muscles and under the subcutaneous tissue lateral to the anterior axillary fold(Fig. 2-78). When the arm is abducted and externally rotated, the median nerve is located onthe anterior or anterolateral aspect of the axillary artery (97.9%), the ulnar nerve is located onthe anteromedial side of the artery (91.3%), and the radial nerve is located posterior to theaxillary artery (89.9%).26 The musculocutaneous nerve lies between the coracobrachialis andbiceps muscles, but can also be within the substance of the coracobrachialis muscle (Figs. 2-78 to 2-81). Occasionally the musculocutaneous nerve may also be located adjacent to themedian nerve.
85
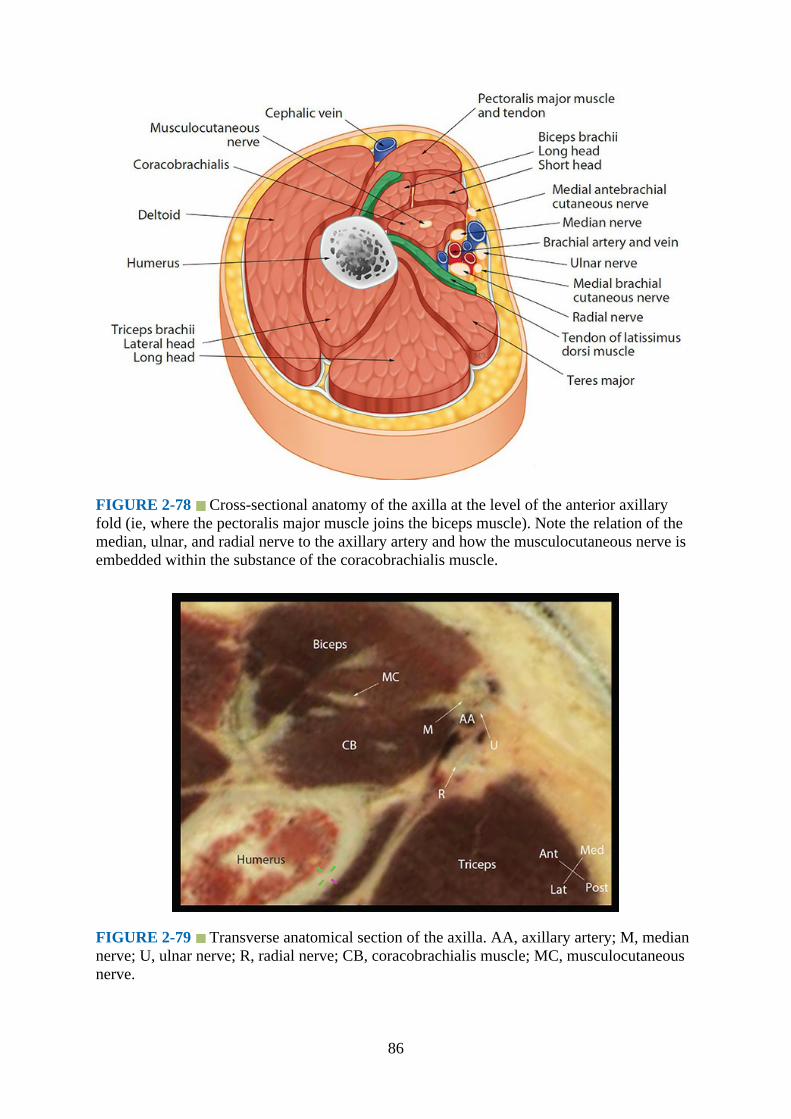
FIGURE 2-78 Cross-sectional anatomy of the axilla at the level of the anterior axillaryfold (ie, where the pectoralis major muscle joins the biceps muscle). Note the relation of themedian, ulnar, and radial nerve to the axillary artery and how the musculocutaneous nerve isembedded within the substance of the coracobrachialis muscle.
FIGURE 2-79 Transverse anatomical section of the axilla. AA, axillary artery; M, mediannerve; U, ulnar nerve; R, radial nerve; CB, coracobrachialis muscle; MC, musculocutaneousnerve.
86

Magnetic Resonance Imaging Anatomy of the Axilla
Figs. 2-80 and 2-81
FIGURE 2-80 Transverse (axial) MRI of the axilla above the anterior axillary fold. Notethe position of the musculocutaneous nerve.
FIGURE 2-81 Transverse (axial) MRI of the axilla at the level of the anterior axillary fold.Note the musculocutaneous nerve is located between the biceps and coracobrachialis muscle.
Technique of Ultrasound Imaging of the Brachial Plexus at the Axilla
1.Position:
87
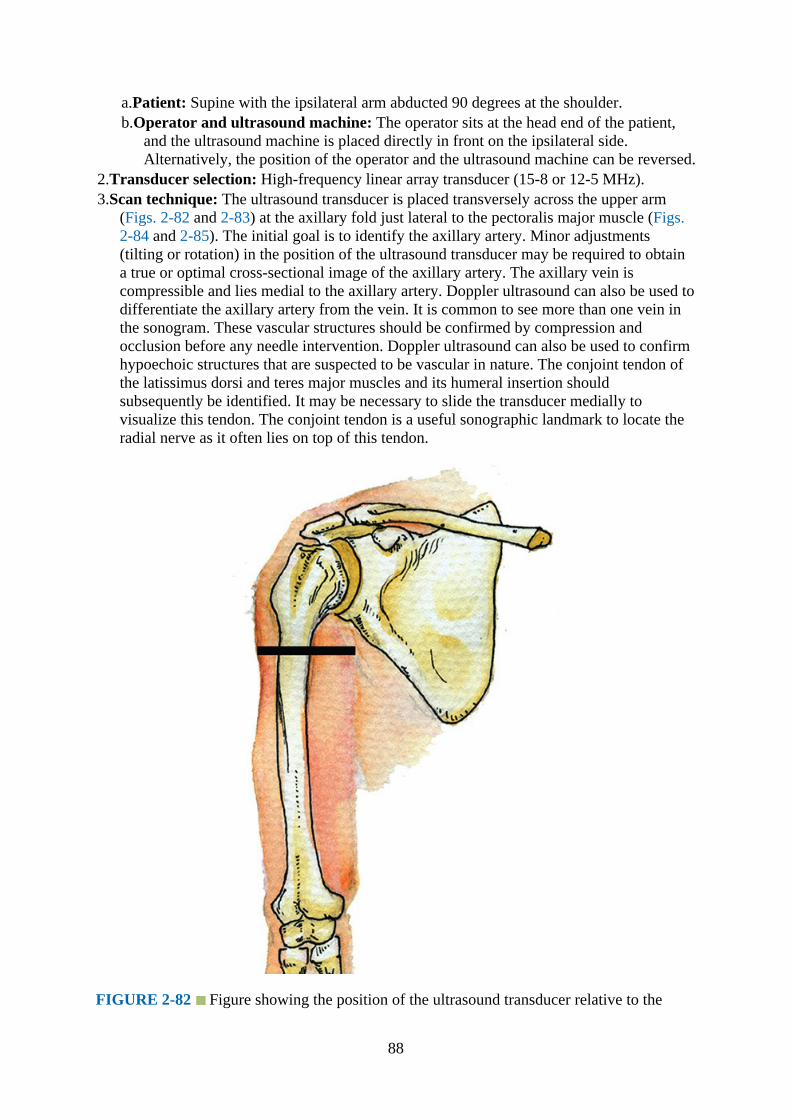
a.Patient: Supine with the ipsilateral arm abducted 90 degrees at the shoulder.b.Operator and ultrasound machine: The operator sits at the head end of the patient,
and the ultrasound machine is placed directly in front on the ipsilateral side.Alternatively, the position of the operator and the ultrasound machine can be reversed.
2.Transducer selection: High-frequency linear array transducer (15-8 or 12-5 MHz).3.Scan technique: The ultrasound transducer is placed transversely across the upper arm
(Figs. 2-82 and 2-83) at the axillary fold just lateral to the pectoralis major muscle (Figs.2-84 and 2-85). The initial goal is to identify the axillary artery. Minor adjustments(tilting or rotation) in the position of the ultrasound transducer may be required to obtaina true or optimal cross-sectional image of the axillary artery. The axillary vein iscompressible and lies medial to the axillary artery. Doppler ultrasound can also be used todifferentiate the axillary artery from the vein. It is common to see more than one vein inthe sonogram. These vascular structures should be confirmed by compression andocclusion before any needle intervention. Doppler ultrasound can also be used to confirmhypoechoic structures that are suspected to be vascular in nature. The conjoint tendon ofthe latissimus dorsi and teres major muscles and its humeral insertion shouldsubsequently be identified. It may be necessary to slide the transducer medially tovisualize this tendon. The conjoint tendon is a useful sonographic landmark to locate theradial nerve as it often lies on top of this tendon.
FIGURE 2-82 Figure showing the position of the ultrasound transducer relative to the
88

humerus during an ultrasound scan of the axilla at the axillary fold.
FIGURE 2-83 Figure highlighting the anatomical structures that are insonated during atransverse ultrasound scan of the axilla. AA, axillary artery; M, median nerve; U, ulnar nerve;R, radial nerve; CB, coracobrachialis muscle; MC, musculocutaneous nerve.
FIGURE 2-84 Figure showing the position and orientation of the ultrasound transducerduring a transverse ultrasound scan of the axilla at the axillary fold.
89
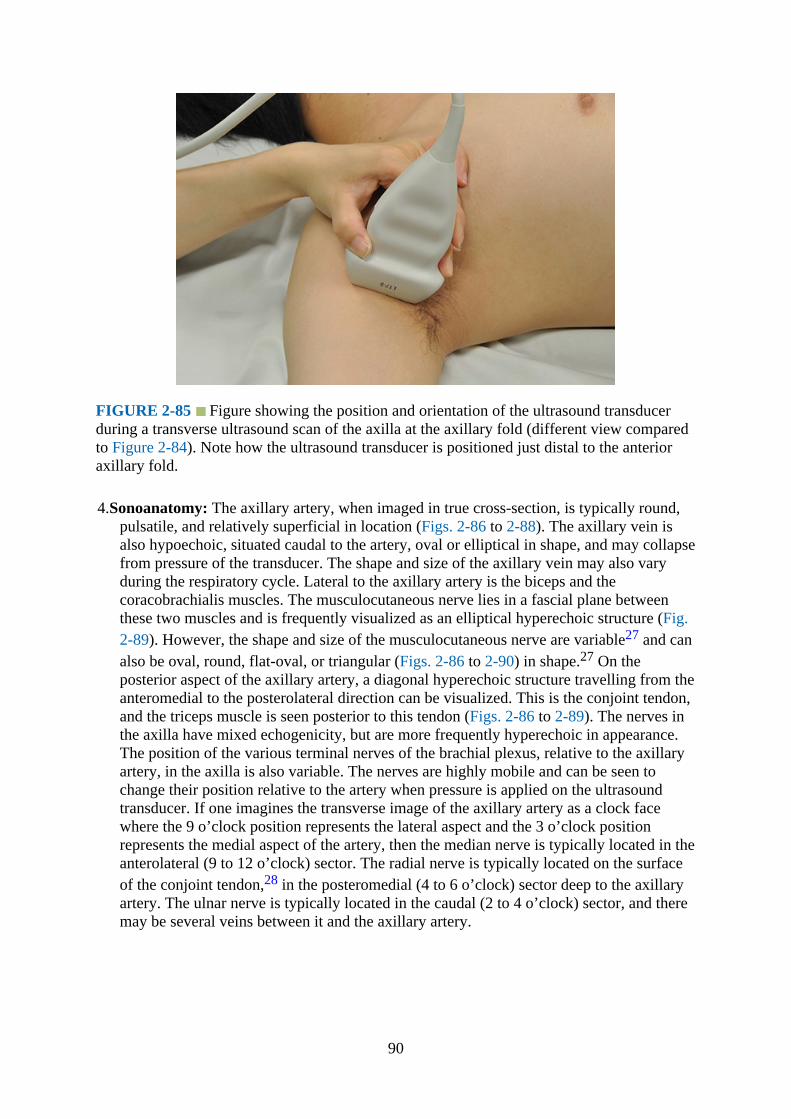
FIGURE 2-85 Figure showing the position and orientation of the ultrasound transducerduring a transverse ultrasound scan of the axilla at the axillary fold (different view comparedto Figure 2-84). Note how the ultrasound transducer is positioned just distal to the anterioraxillary fold.
4.Sonoanatomy: The axillary artery, when imaged in true cross-section, is typically round,pulsatile, and relatively superficial in location (Figs. 2-86 to 2-88). The axillary vein isalso hypoechoic, situated caudal to the artery, oval or elliptical in shape, and may collapsefrom pressure of the transducer. The shape and size of the axillary vein may also varyduring the respiratory cycle. Lateral to the axillary artery is the biceps and thecoracobrachialis muscles. The musculocutaneous nerve lies in a fascial plane betweenthese two muscles and is frequently visualized as an elliptical hyperechoic structure (Fig.2-89). However, the shape and size of the musculocutaneous nerve are variable27 and canalso be oval, round, flat-oval, or triangular (Figs. 2-86 to 2-90) in shape.27 On theposterior aspect of the axillary artery, a diagonal hyperechoic structure travelling from theanteromedial to the posterolateral direction can be visualized. This is the conjoint tendon,and the triceps muscle is seen posterior to this tendon (Figs. 2-86 to 2-89). The nerves inthe axilla have mixed echogenicity, but are more frequently hyperechoic in appearance.The position of the various terminal nerves of the brachial plexus, relative to the axillaryartery, in the axilla is also variable. The nerves are highly mobile and can be seen tochange their position relative to the artery when pressure is applied on the ultrasoundtransducer. If one imagines the transverse image of the axillary artery as a clock facewhere the 9 o’clock position represents the lateral aspect and the 3 o’clock positionrepresents the medial aspect of the artery, then the median nerve is typically located in theanterolateral (9 to 12 o’clock) sector. The radial nerve is typically located on the surfaceof the conjoint tendon,28 in the posteromedial (4 to 6 o’clock) sector deep to the axillaryartery. The ulnar nerve is typically located in the caudal (2 to 4 o’clock) sector, and theremay be several veins between it and the axillary artery.
90

FIGURE 2-86 Transverse sonogram of the axilla. AV, axillary vein; AA, axillary artery;U, ulnar nerve; R, radial nerve; CB, coracobrachialis muscle; MC, musculocutaneous nerve.
FIGURE 2-87 Transverse sonogram of the axilla showing all four terminal branches of thebrachial plexus. M, median nerve; R, radial nerve; U, ulnar nerve; MC, musculocutaneousnerve; CB, coracobrachialis muscle; AA, axillary artery; AV, axillary vein.
91
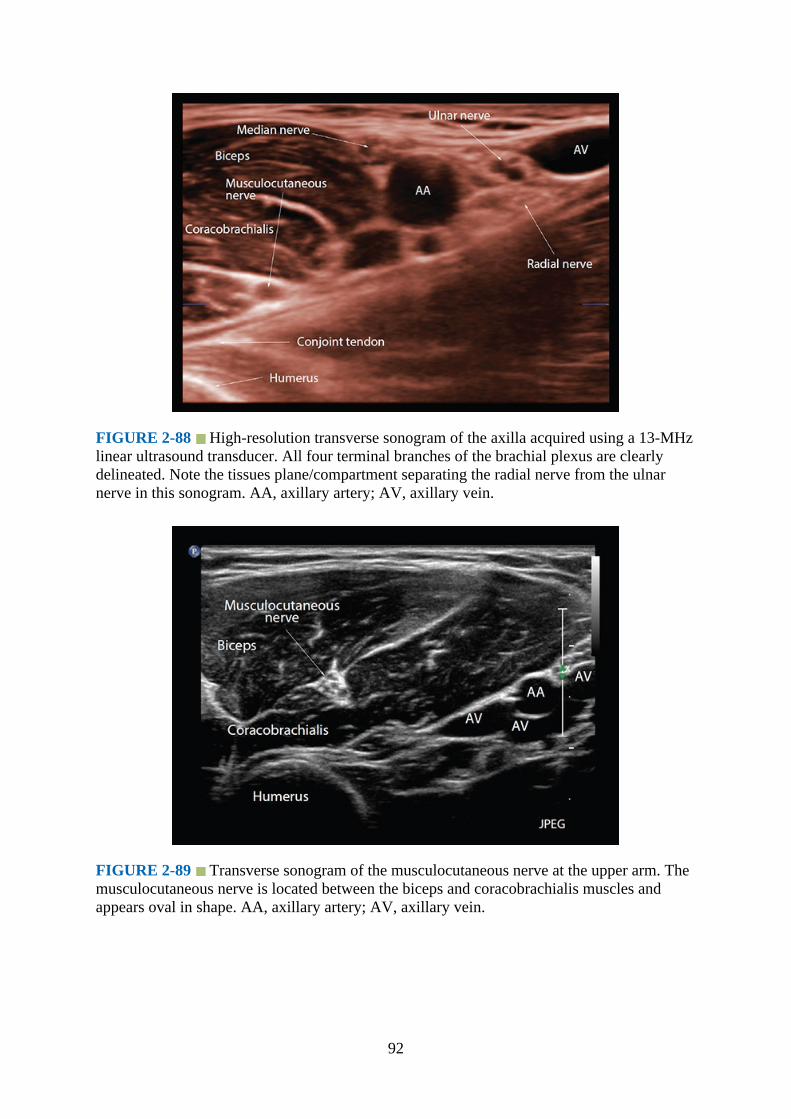
FIGURE 2-88 High-resolution transverse sonogram of the axilla acquired using a 13-MHzlinear ultrasound transducer. All four terminal branches of the brachial plexus are clearlydelineated. Note the tissues plane/compartment separating the radial nerve from the ulnarnerve in this sonogram. AA, axillary artery; AV, axillary vein.
FIGURE 2-89 Transverse sonogram of the musculocutaneous nerve at the upper arm. Themusculocutaneous nerve is located between the biceps and coracobrachialis muscles andappears oval in shape. AA, axillary artery; AV, axillary vein.
92
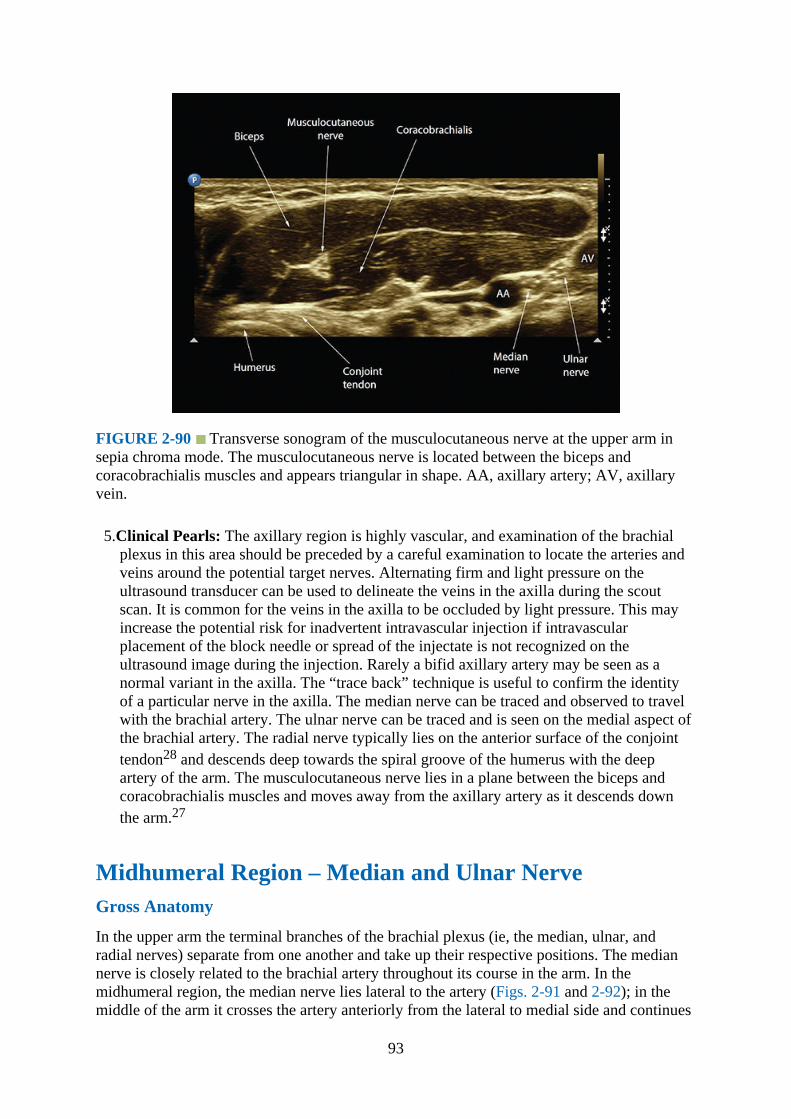
FIGURE 2-90 Transverse sonogram of the musculocutaneous nerve at the upper arm insepia chroma mode. The musculocutaneous nerve is located between the biceps andcoracobrachialis muscles and appears triangular in shape. AA, axillary artery; AV, axillaryvein.
5.Clinical Pearls: The axillary region is highly vascular, and examination of the brachialplexus in this area should be preceded by a careful examination to locate the arteries andveins around the potential target nerves. Alternating firm and light pressure on theultrasound transducer can be used to delineate the veins in the axilla during the scoutscan. It is common for the veins in the axilla to be occluded by light pressure. This mayincrease the potential risk for inadvertent intravascular injection if intravascularplacement of the block needle or spread of the injectate is not recognized on theultrasound image during the injection. Rarely a bifid axillary artery may be seen as anormal variant in the axilla. The “trace back” technique is useful to confirm the identityof a particular nerve in the axilla. The median nerve can be traced and observed to travelwith the brachial artery. The ulnar nerve can be traced and is seen on the medial aspect ofthe brachial artery. The radial nerve typically lies on the anterior surface of the conjointtendon28 and descends deep towards the spiral groove of the humerus with the deepartery of the arm. The musculocutaneous nerve lies in a plane between the biceps andcoracobrachialis muscles and moves away from the axillary artery as it descends downthe arm.27
Midhumeral Region – Median and Ulnar NerveGross Anatomy
In the upper arm the terminal branches of the brachial plexus (ie, the median, ulnar, andradial nerves) separate from one another and take up their respective positions. The mediannerve is closely related to the brachial artery throughout its course in the arm. In themidhumeral region, the median nerve lies lateral to the artery (Figs. 2-91 and 2-92); in themiddle of the arm it crosses the artery anteriorly from the lateral to medial side and continues
93
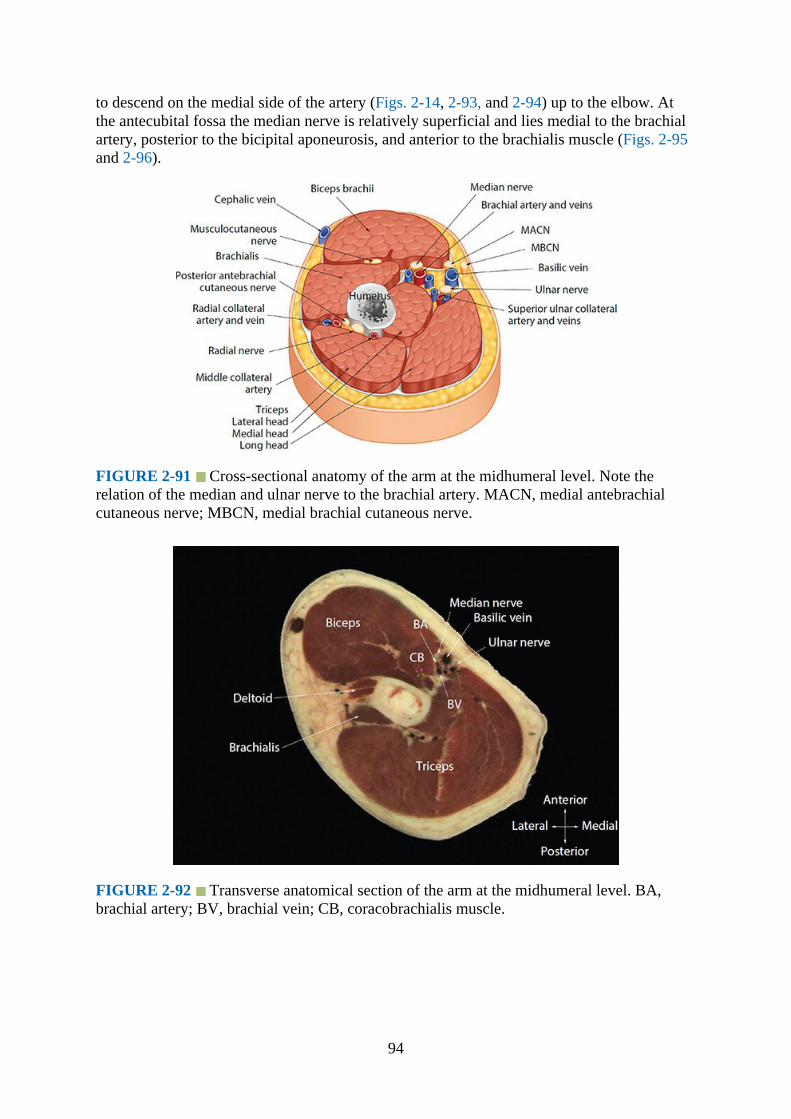
to descend on the medial side of the artery (Figs. 2-14, 2-93, and 2-94) up to the elbow. Atthe antecubital fossa the median nerve is relatively superficial and lies medial to the brachialartery, posterior to the bicipital aponeurosis, and anterior to the brachialis muscle (Figs. 2-95and 2-96).
FIGURE 2-91 Cross-sectional anatomy of the arm at the midhumeral level. Note therelation of the median and ulnar nerve to the brachial artery. MACN, medial antebrachialcutaneous nerve; MBCN, medial brachial cutaneous nerve.
FIGURE 2-92 Transverse anatomical section of the arm at the midhumeral level. BA,brachial artery; BV, brachial vein; CB, coracobrachialis muscle.
94
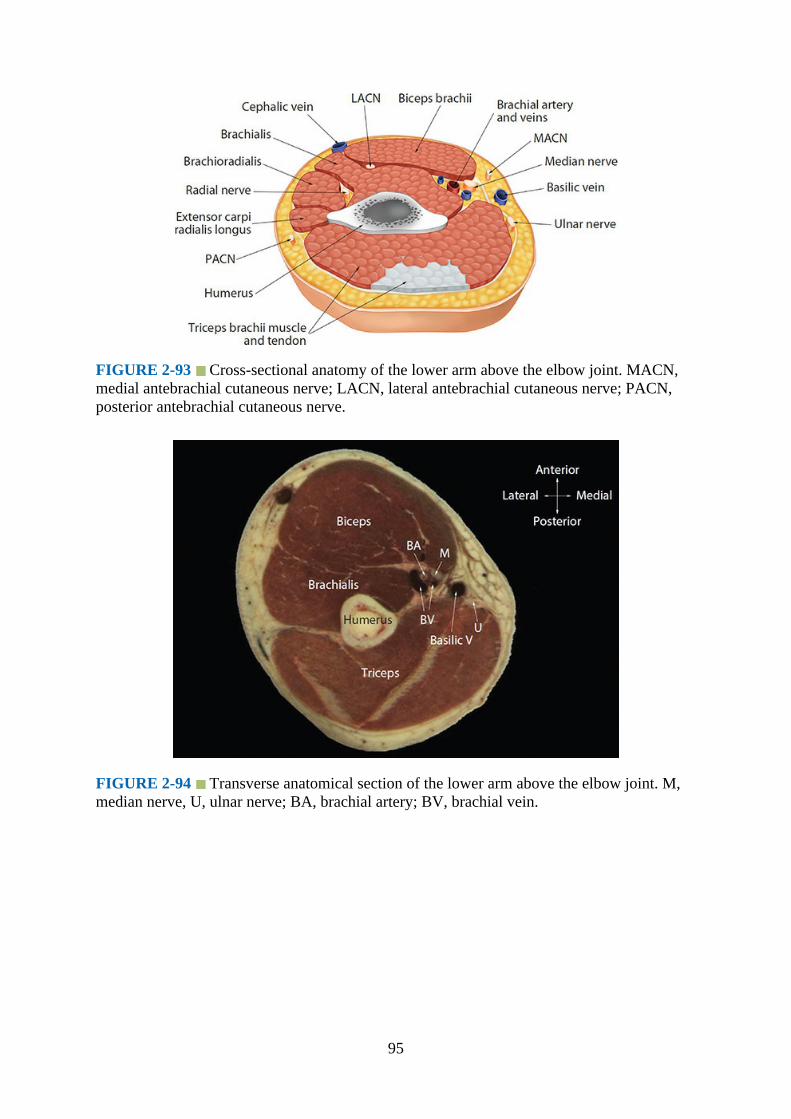
FIGURE 2-93 Cross-sectional anatomy of the lower arm above the elbow joint. MACN,medial antebrachial cutaneous nerve; LACN, lateral antebrachial cutaneous nerve; PACN,posterior antebrachial cutaneous nerve.
FIGURE 2-94 Transverse anatomical section of the lower arm above the elbow joint. M,median nerve, U, ulnar nerve; BA, brachial artery; BV, brachial vein.
95

FIGURE 2-95 Anatomy of the median, radial, and ulnar nerve at the cubital fossa.
In the arm, the ulnar nerve lies medial to the brachial artery up to about the insertion of thecoracobrachialis muscle, where it pierces the medial intermuscular septum to enter theposterior compartment of the arm. It then continues its distal course and passes behind themedial epicondyle to enter the ulnar nerve sulcus (Fig. 2-96).
FIGURE 2-96 Cross-sectional anatomy of the arm at the level of the elbow joint. FCR,flexor carpi radialis; PL, palmaris longus; FDS, flexor digitorum superficialis.
Magnetic Resonance Imaging Anatomy of the Midhumeral Region
Fig. 2-97
96
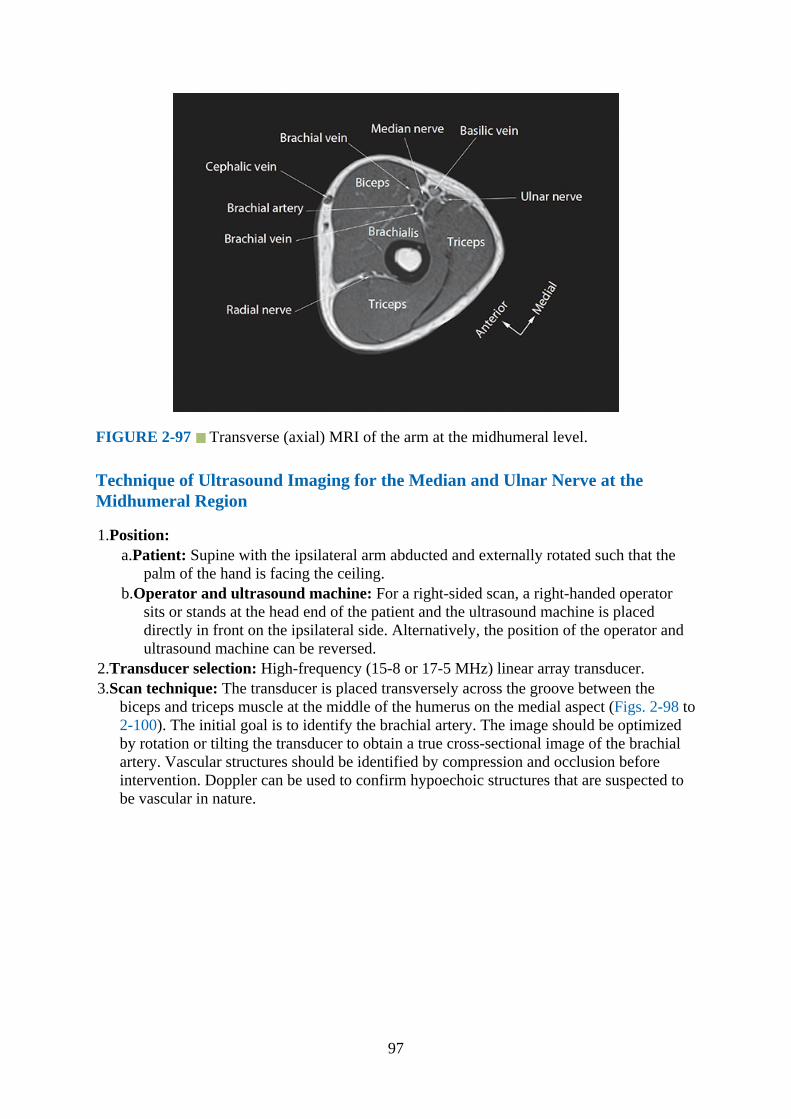
FIGURE 2-97 Transverse (axial) MRI of the arm at the midhumeral level.
Technique of Ultrasound Imaging for the Median and Ulnar Nerve at theMidhumeral Region
1.Position:a.Patient: Supine with the ipsilateral arm abducted and externally rotated such that the
palm of the hand is facing the ceiling.b.Operator and ultrasound machine: For a right-sided scan, a right-handed operator
sits or stands at the head end of the patient and the ultrasound machine is placeddirectly in front on the ipsilateral side. Alternatively, the position of the operator andultrasound machine can be reversed.
2.Transducer selection: High-frequency (15-8 or 17-5 MHz) linear array transducer.3.Scan technique: The transducer is placed transversely across the groove between the
biceps and triceps muscle at the middle of the humerus on the medial aspect (Figs. 2-98 to2-100). The initial goal is to identify the brachial artery. The image should be optimizedby rotation or tilting the transducer to obtain a true cross-sectional image of the brachialartery. Vascular structures should be identified by compression and occlusion beforeintervention. Doppler can be used to confirm hypoechoic structures that are suspected tobe vascular in nature.
97

FIGURE 2-98 Figure showing the position of the ultrasound transducer relative to thehumerus during an ultrasound scan of the arm at the level of the midhumerus.
98

FIGURE 2-99 Figure showing the position and orientation of the ultrasound transducerduring a transverse ultrasound scan of the arm at the midhumeral level.
FIGURE 2-100 Figure highlighting the anatomical structures that are insonated during atransverse scan of the arm at the midhumeral level. M, median nerve; U, ulnar nerve; BA,brachial artery; BV brachial vein; CB, coracobrachialis muscle.
4.Sonoanatomy: The median and ulnar nerves are visualized as hyperechoic structures witha honeycomb appearance. Both nerves lie adjacent to the brachial artery at this level (Fig.2-101).
FIGURE 2-101 Transverse sonogram of the median nerve and ulnar nerve at themidhumeral level. BA, brachial artery; BV, brachial vein; CB, coracobrachialis muscle.
99

5.Clinical Pearls: The median and ulnar nerves are confirmed in this region using the “traceback” technique. Both nerves can easily be followed proximally and distally along thearm. The median nerve typically lies on the lateral aspect of the brachial arteryproximally, crosses the brachial artery anteriorly, and continues on its medial sidedistally. The ulnar nerve lies in the medial side of the brachial artery. The position of bothnerves in relation to the artery are variable, and they can be observed “rolling” from oneto the other side of the artery.
Midhumeral Region – Radial NerveGross Anatomy
At the level of the anterior axillary fold, the radial nerve lies deep to the axillary artery andsuperficial to the conjoint tendon (Figs. 2-78 and 2-88). It then enters the posteriorcompartment of the arm to lie in the spiral groove on the posterior aspect of the humerus andin between the medial and lateral heads of the triceps muscles (Figs. 2-88, 2-102, and 2-103).The radial nerve then emerges on the lateral aspect of the humerus and comes to lie betweenthe brachialis, brachioradialis, and extensor carpi radialis longus muscles. It gives off theposterior antebrachial cutaneous nerve and continuous to the radial tunnel in the forearm(upper), where it divides into its superficial and deep branches.
FIGURE 2-102 Anatomy of the radial nerve at the level of the spiral groove of thehumerus.
100
http://radiologyme.com/

FIGURE 2-103 Transverse anatomical section of the arm at the level of the radial groove.
Magnetic Resonance Imaging of the Midhumeral Region (Radial Nerve)
Figs. 2-104 and 2-105
FIGURE 2-104 Transverse (axial) MRI of the arm at the level of the radial groove.
101
http://radiologyme.com/

FIGURE 2-105 Transverse (axial) MRI of the arm distal to the radial groove showing theradial nerve at the lateral aspect of the humerus.
Ultrasound Scan Technique for Radial Nerve at the Radial Groove
1.Position:a.Patient: Supine with the patient asked to touch the opposite shoulder tip with the
ipsilateral hand. An assistant may help to steady the arm in position.b. Operator and ultrasound machine: The operator sits or stands caudal to the abducted
arm facing the head of the patient. The ultrasound machine is placed cephalad to theabducted arm on the ipsilateral side and directly in front of the operator.
2.Transducer selection: High-frequency (15-8 or 17-5 MHz) linear array transducer.3.Scan technique: The transducer is placed transversely over the posterolateral aspect of the
midhumerus (Figs. 2-106 to 2-108). The initial goal is to image the triceps muscle and thehumerus. The image should be optimized by gently rotating and tilting the transducer tominimize anisotropy and obtain a true cross-sectional image of the radial nerve in theradial groove (spiral or musculospiral groove), together with the deep artery of the arm,which is also referred to as the profunda brachii artery (Figs. 2-109 and 2-110).
102
http://radiologyme.com/

FIGURE 2-106 Figure showing the position of the ultrasound transducer relative to thehumerus during an ultrasound scan of the arm at the level of the radial groove.
FIGURE 2-107 Figure showing the position and orientation of the ultrasound transducer
103
http://radiologyme.com/

during an ultrasound scan for the radial nerve at the radial groove.
FIGURE 2-108 Figure highlighting the anatomical structures that are insonated during atransverse scan of the arm at the level of the radial groove.
FIGURE 2-109 Transverse sonogram of the radial nerve at the radial groove of thehumerus.
104
http://radiologyme.com/

FIGURE 2-110 Transverse sonogram of the arm at the level of the radial groove showingthe radial nerve accompanied by the profunda brachii artery. Accompanying photographillustrates the position and orientation of the transducer during the ultrasound scan.
4.Sonoanatomy: The posterior surface of the humerus appears as a hyperechoic curvilinearstructure with a corresponding acoustic shadow anteriorly. The radial nerve is visualizedas an oval hypoechoic structure with a hyperechoic outline in the spiral groove betweenthe two heads of the triceps muscle. It is also common to visualize the pulsatile deepartery of the arm, which accompanies the radial nerve at the spiral groove (Figs. 2-109and 2-110).
5.Clinical Pearls: The radial nerve is confirmed at the spiral groove using the “trace back”technique. Although the radial nerve can be imaged at the spiral groove of the humerus,its blockade at this site does not confer any advantage to blockade nearer the elbow.29
Ultrasound Scan Technique for Radial Nerve at the Lateral Aspect of the Arm
1.Position:a.Patient: Supine with the arm abducted and internally rotated such that the hand and
forearm are resting on the abdomen (Fig. 2-111).
105
http://radiologyme.com/

FIGURE 2-111 Figure showing the position and orientation of the ultrasound transducerduring an ultrasound scan for the radial nerve at the lateral aspect of the arm.
b.Operator and ultrasound machine: The operator sits or stands at the patient’s side onthe side to be examined, and the ultrasound machine is placed directly in front of theoperator on the ipsilateral side.
2.Transducer selection: High-frequency (15-8 or 17-5 MHz) linear array transducer.3.Scan technique: The ultrasound transducer is positioned transversely over the lateral
aspect of the lower arm (Fig. 2-111).4.Sonoanatomy: The lateral aspect of the humerus is visualized as a hyperechoic structure
with a corresponding acoustic shadow anteriorly (Figs. 2-112 and 2-113). The radialnerve and its posterior antebrachial cutaneous branch are often seen as round-to-ovalhypoechoic structures between the brachialis (medially) and the brachioradialis andextensor carpi radialis longus muscles (laterally).
106
http://radiologyme.com/
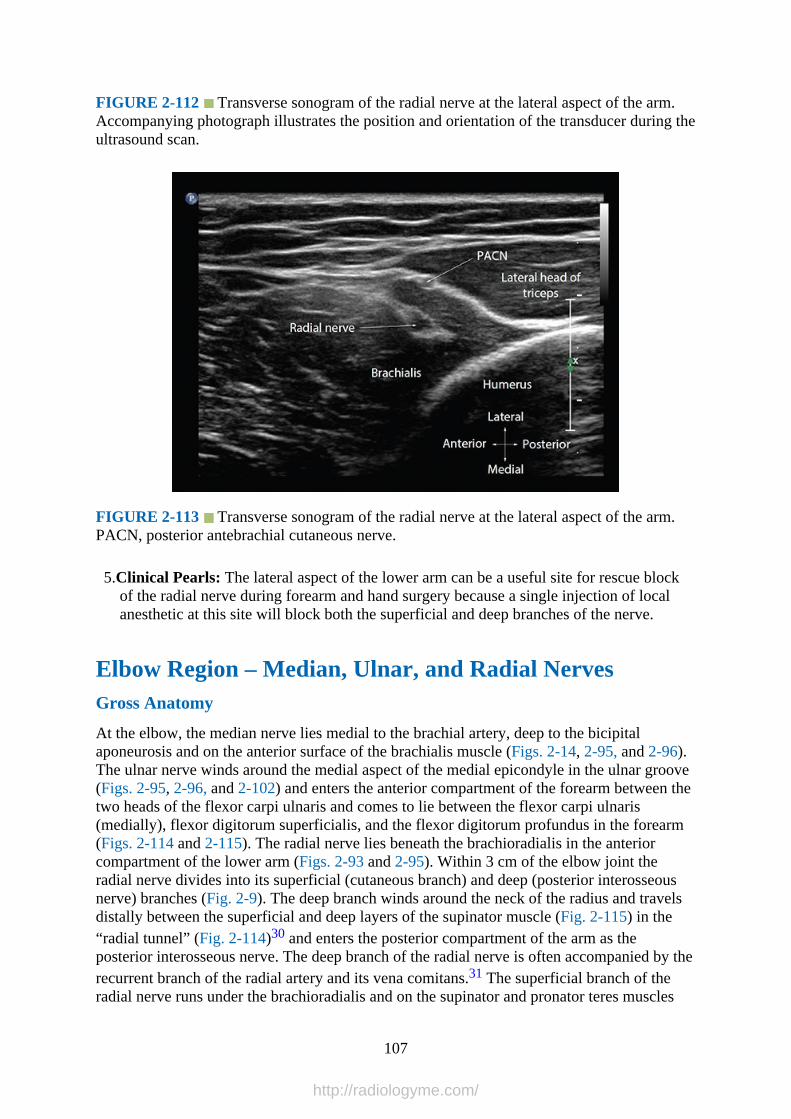
FIGURE 2-112 Transverse sonogram of the radial nerve at the lateral aspect of the arm.Accompanying photograph illustrates the position and orientation of the transducer during theultrasound scan.
FIGURE 2-113 Transverse sonogram of the radial nerve at the lateral aspect of the arm.PACN, posterior antebrachial cutaneous nerve.
5.Clinical Pearls: The lateral aspect of the lower arm can be a useful site for rescue blockof the radial nerve during forearm and hand surgery because a single injection of localanesthetic at this site will block both the superficial and deep branches of the nerve.
Elbow Region – Median, Ulnar, and Radial NervesGross Anatomy
At the elbow, the median nerve lies medial to the brachial artery, deep to the bicipitalaponeurosis and on the anterior surface of the brachialis muscle (Figs. 2-14, 2-95, and 2-96).The ulnar nerve winds around the medial aspect of the medial epicondyle in the ulnar groove(Figs. 2-95, 2-96, and 2-102) and enters the anterior compartment of the forearm between thetwo heads of the flexor carpi ulnaris and comes to lie between the flexor carpi ulnaris(medially), flexor digitorum superficialis, and the flexor digitorum profundus in the forearm(Figs. 2-114 and 2-115). The radial nerve lies beneath the brachioradialis in the anteriorcompartment of the lower arm (Figs. 2-93 and 2-95). Within 3 cm of the elbow joint theradial nerve divides into its superficial (cutaneous branch) and deep (posterior interosseousnerve) branches (Fig. 2-9). The deep branch winds around the neck of the radius and travelsdistally between the superficial and deep layers of the supinator muscle (Fig. 2-115) in the“radial tunnel” (Fig. 2-114)30 and enters the posterior compartment of the arm as theposterior interosseous nerve. The deep branch of the radial nerve is often accompanied by therecurrent branch of the radial artery and its vena comitans.31 The superficial branch of theradial nerve runs under the brachioradialis and on the supinator and pronator teres muscles
107
http://radiologyme.com/

(Fig. 2-116). It then descends close to the lateral aspect of the radial artery in the midforearm(Figs. 2-116 and 2-117) after which it leaves the artery and courses backward under thetendon of the brachioradialis to reach the posterior surface of the wrist.
FIGURE 2-114 Transverse anatomical section of the upper forearm at the radial tunnel.FCR, flexor carpi radialis muscle; PL, palmaris longus muscle; FDS, flexor digitorumsuperficialis muscle; FCU, flexor carpi ulnaris muscle; BCR, brachioradialis muscle; FDP,flexor digitorum profundus muscle.
FIGURE 2-115 Cross-sectional anatomy of the proximal forearm just below the elbowjoint. LACN, lateral antebrachial cutaneous nerve; PACN, posterior antebrachial cutaneous
108
http://radiologyme.com/
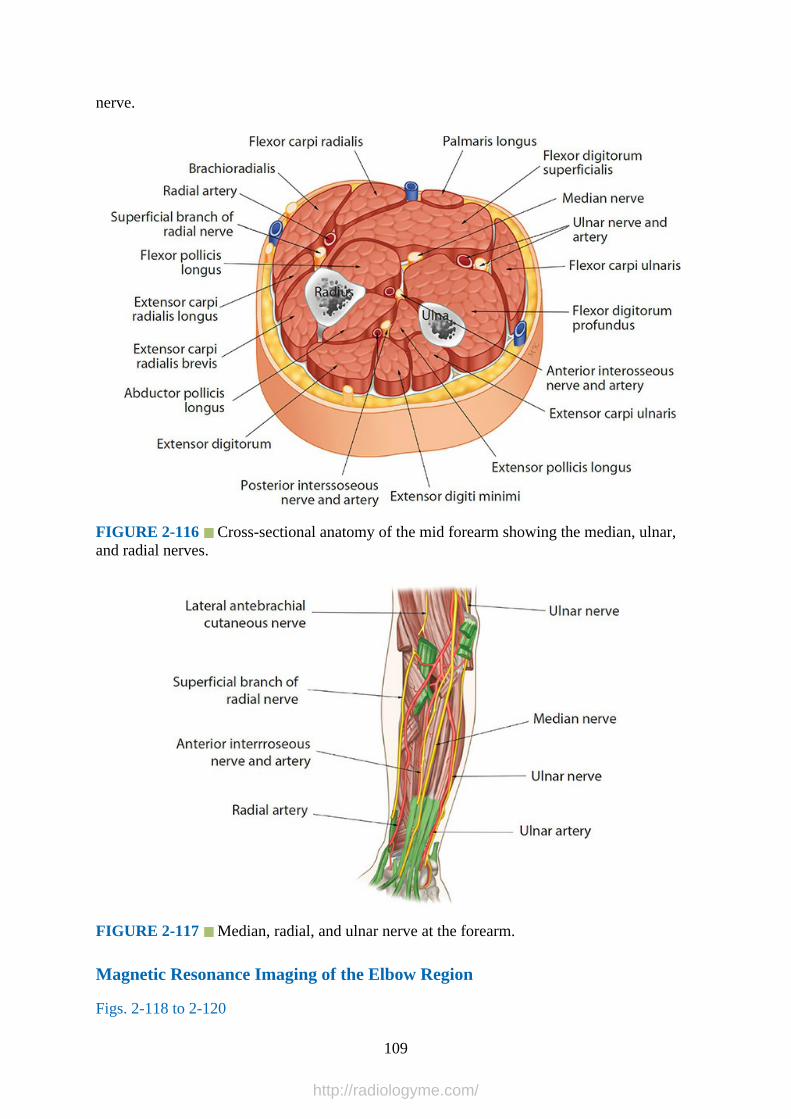
nerve.
FIGURE 2-116 Cross-sectional anatomy of the mid forearm showing the median, ulnar,and radial nerves.
FIGURE 2-117 Median, radial, and ulnar nerve at the forearm.
Magnetic Resonance Imaging of the Elbow Region
Figs. 2-118 to 2-120
109
http://radiologyme.com/

FIGURE 2-118 Transverse (axial) MRI demonstrating the median nerve at the level of theelbow joint (cubital fossa).
FIGURE 2-119 Transverse (axial) MRI of the upper forearm demonstrating the radialnerve in the radial tunnel. ECRL, extensor carpi radialis longus muscle; ECRB, extensorcarpi radialis brevis muscle; EDC, extensor digitorum communis muscle; FDP, flexordigitorum profundus muscle; FCU, flexor carpi ulnaris muscle; FDS, flexor digitorumsuperficialis.
110
http://radiologyme.com/
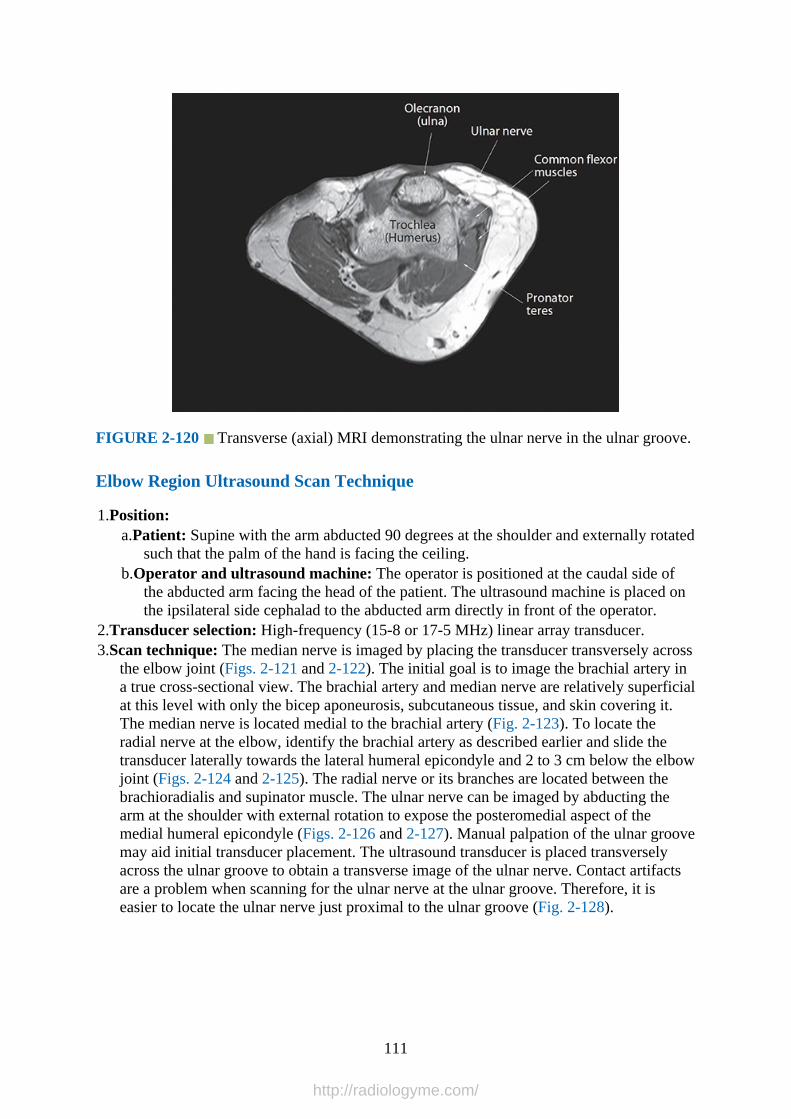
FIGURE 2-120 Transverse (axial) MRI demonstrating the ulnar nerve in the ulnar groove.
Elbow Region Ultrasound Scan Technique
1.Position:a.Patient: Supine with the arm abducted 90 degrees at the shoulder and externally rotated
such that the palm of the hand is facing the ceiling.b.Operator and ultrasound machine: The operator is positioned at the caudal side of
the abducted arm facing the head of the patient. The ultrasound machine is placed onthe ipsilateral side cephalad to the abducted arm directly in front of the operator.
2.Transducer selection: High-frequency (15-8 or 17-5 MHz) linear array transducer.3.Scan technique: The median nerve is imaged by placing the transducer transversely across
the elbow joint (Figs. 2-121 and 2-122). The initial goal is to image the brachial artery ina true cross-sectional view. The brachial artery and median nerve are relatively superficialat this level with only the bicep aponeurosis, subcutaneous tissue, and skin covering it.The median nerve is located medial to the brachial artery (Fig. 2-123). To locate theradial nerve at the elbow, identify the brachial artery as described earlier and slide thetransducer laterally towards the lateral humeral epicondyle and 2 to 3 cm below the elbowjoint (Figs. 2-124 and 2-125). The radial nerve or its branches are located between thebrachioradialis and supinator muscle. The ulnar nerve can be imaged by abducting thearm at the shoulder with external rotation to expose the posteromedial aspect of themedial humeral epicondyle (Figs. 2-126 and 2-127). Manual palpation of the ulnar groovemay aid initial transducer placement. The ultrasound transducer is placed transverselyacross the ulnar groove to obtain a transverse image of the ulnar nerve. Contact artifactsare a problem when scanning for the ulnar nerve at the ulnar groove. Therefore, it iseasier to locate the ulnar nerve just proximal to the ulnar groove (Fig. 2-128).
111
http://radiologyme.com/

FIGURE 2-121 Figure showing the position and orientation of the ultrasound transducerduring an ultrasound scan for the median nerve at the cubital fossa.
FIGURE 2-122 Figure highlighting the anatomical structures that are insonated during anultrasound scan for the median nerve at the level of the elbow joint. Basilic V, basilic vein;FCR, flexor carpi radialis muscle; PL, palmaris longus muscle; FDS, flexor digitorumsuperficialis muscle.
112
http://radiologyme.com/

FIGURE 2-123 Transverse sonogram of the median nerve at the elbow. Note the mediannerve lies immediately medial to the brachial artery. BA, brachial artery.
FIGURE 2-124 Figure showing the position and orientation of the ultrasound transducerduring an ultrasound scan for the radial nerve at the lateral aspect of the upper forearm (radialtunnel).
113
http://radiologyme.com/
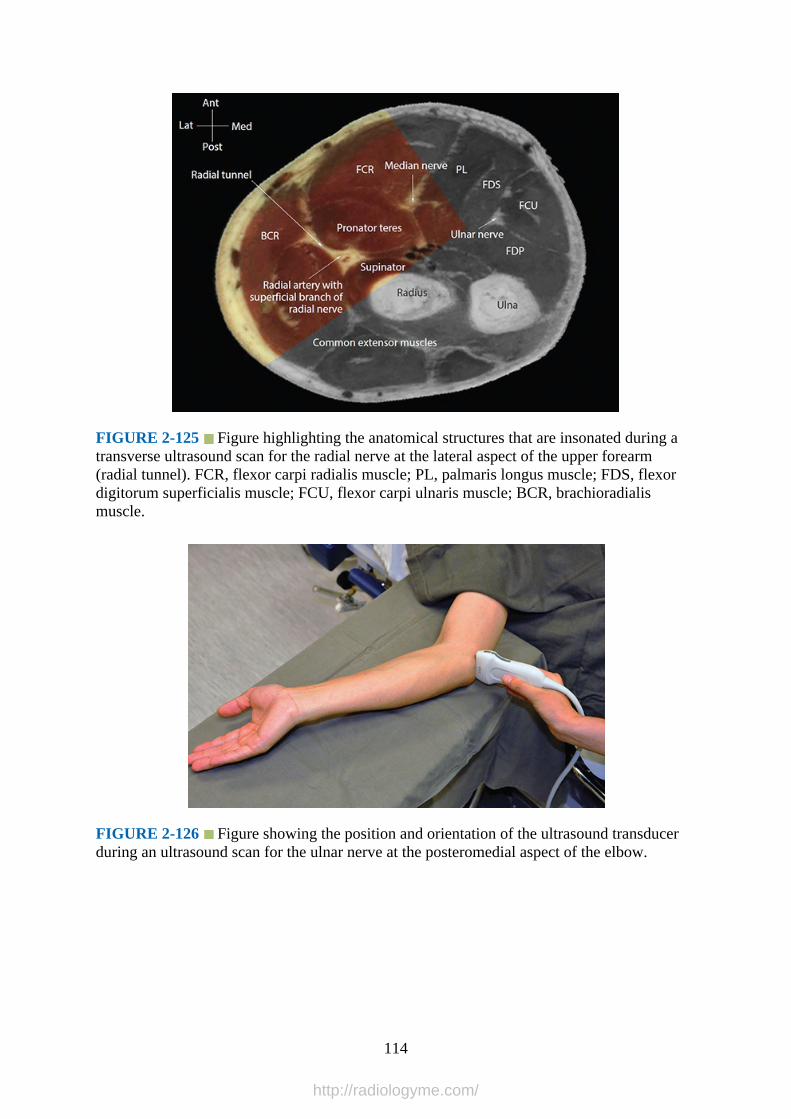
FIGURE 2-125 Figure highlighting the anatomical structures that are insonated during atransverse ultrasound scan for the radial nerve at the lateral aspect of the upper forearm(radial tunnel). FCR, flexor carpi radialis muscle; PL, palmaris longus muscle; FDS, flexordigitorum superficialis muscle; FCU, flexor carpi ulnaris muscle; BCR, brachioradialismuscle.
FIGURE 2-126 Figure showing the position and orientation of the ultrasound transducerduring an ultrasound scan for the ulnar nerve at the posteromedial aspect of the elbow.
114
http://radiologyme.com/

FIGURE 2-127 Figure highlighting the anatomical structures that are insonated during anultrasound scan for the ulnar nerve at the ulnar groove. PL, palmaris longus muscle; FDS,flexor digitorum superficialis muscle; FCR, flexor carpi radialis muscle.
FIGURE 2-128 Transverse sonogram of the ulnar nerve just above the ulnar groove andon the posteromedial aspect of the lower arm. Accompanying photograph illustrates theposition and orientation of the transducer during the ultrasound scan.
4.Sonoanatomy: The median nerve appears as an oval or elliptical-shaped, hyperechoic, andhoneycombed structure medial to the brachial artery at the elbow (Fig. 2-123). The ulnarnerve at the ulnar groove is frequently triangular in shape and hypoechoic in appearance(Fig. 2-129). Proximal to the ulnar groove the ulnar nerve is relatively superficial andappears hypoechoic (Fig. 2-128). When examining the radial nerve at the elbow, the
115
http://radiologyme.com/
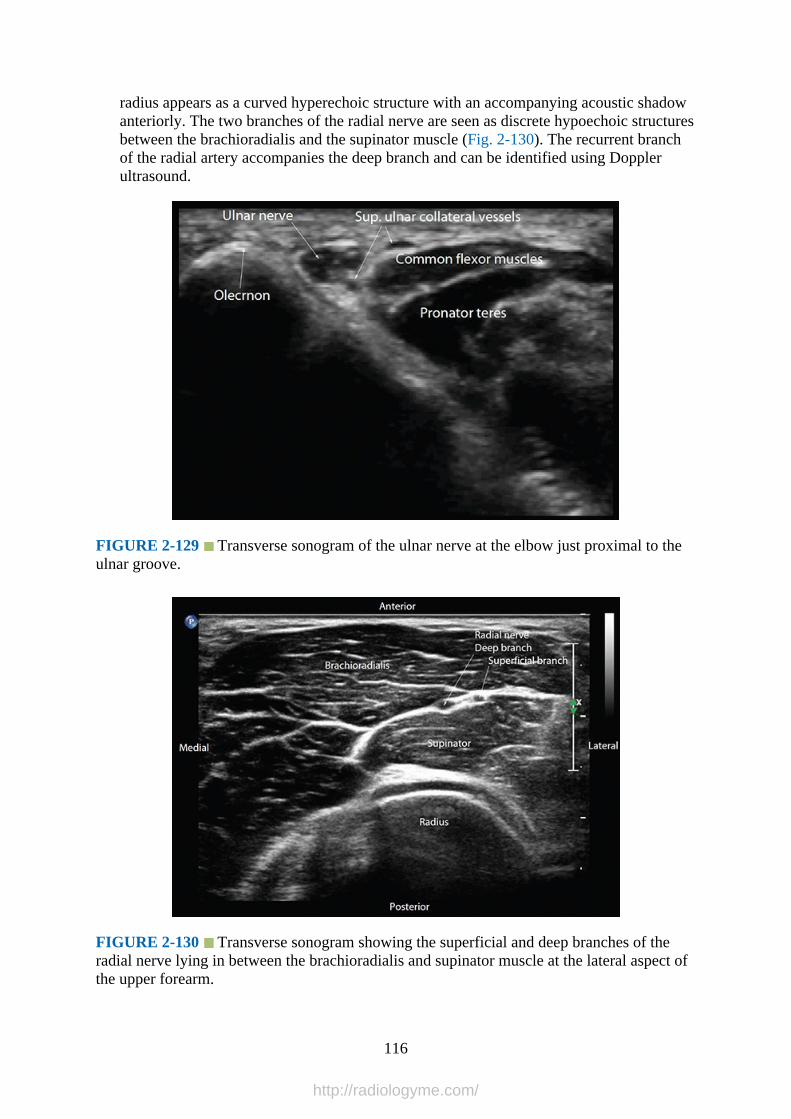
radius appears as a curved hyperechoic structure with an accompanying acoustic shadowanteriorly. The two branches of the radial nerve are seen as discrete hypoechoic structuresbetween the brachioradialis and the supinator muscle (Fig. 2-130). The recurrent branchof the radial artery accompanies the deep branch and can be identified using Dopplerultrasound.
FIGURE 2-129 Transverse sonogram of the ulnar nerve at the elbow just proximal to theulnar groove.
FIGURE 2-130 Transverse sonogram showing the superficial and deep branches of theradial nerve lying in between the brachioradialis and supinator muscle at the lateral aspect ofthe upper forearm.
116
http://radiologyme.com/

5.Clinical Pearls: The identity of the nerves at the elbow is confirmed using the “traceback” technique and visualized along their expected course based on anatomicalknowledge. Median nerve block at the elbow can be performed as a rescue block or whenthere is surgical dressing or plaster casts covering the forearm. When examining the ulnarnerve at the ulnar groove or cubital tunnel, apply liberal amounts of ultrasound gel andapply minimal pressure during the ultrasound scan to reduce contact artifacts. It may alsobe safer to perform an ulnar nerve block at a more proximal site rather than at the ulnargroove because of the perceived increased risk of nerve injury at the ulnar groove.
Midforearm Region – Median, Ulnar, and Radial NervesGross Anatomy
In the midforearm the median nerve lies in a fascial plane between the flexor digitorumsuperficialis and the flexor digitorum profundus muscle (Figs. 2-116 and 2-131). At the wrist,the median nerve lies lateral to the flexor digitorum superficialis muscle and beneath thepalmaris longus tendon (Fig. 2-132) and continues under the flexor retinaculum to enter thehand. At the midforearm the ulnar nerve runs between the flexor digitorum profundus(posteriorly), the flexor digitorum superficialis (anteriorly), and the flexor carpi ulnaris(medially) muscle (Fig. 2-116). In the distal forearm the ulnar nerve is accompanied by theulnar artery (Fig. 2-132) and enters the hand superficial to the flexor retinaculum.
FIGURE 2-131 Transverse anatomical section through the midforearm showing themedian nerve. FCR, flexor carpi radialis muscle; PL, palmaris longus muscle; FDS, flexordigitorum superficialis muscle; FCU, flexor carpi ulnaris muscle; BCR, brachioradialismuscle; FPL, flexor pollicis longus muscle; FDS, flexor digitorum superficialis muscle; FDP,flexor digitorum profundus muscle; ECU, extensor carpi ulnaris muscle; APL, abductorpollicis longus muscle.
117
http://radiologyme.com/

FIGURE 2-132 Cross-sectional anatomy of the distal forearm showing the median, ulnar,and superficial and deep (posterior interosseous nerve) branches of the radial nerve.
Magnetic Resonance Imaging Anatomy of the Midforearm
Figs. 2-133 and 2-134
FIGURE 2-133 Transverse (axial) MRI of the midforearm demonstrating the median,radial, and ulnar nerves. FDP, flexor digitorum profundus.
118
http://radiologyme.com/

FIGURE 2-134 Transverse (axial) MRI of the distal forearm demonstrating the medianand radial nerve. FDS, flexor digitorum superficialis muscle; FDP, flexor digitorumprofundus muscle.
Midforearm Ultrasound Scan Technique
1.Position:a.Patient: Supine with the arm abducted and externally rotated such that the palm of the
hand is facing the ceiling.b.Operator and ultrasound machine: The operator is positioned at the caudad side of
the abducted arm facing the head of the patient. The ultrasound machine is placed onthe ipsilateral side to be examined on the cephalad side of the abducted arm directly infront of the operator.
2.Transducer selection: High-frequency (15-8 or 17-5 MHz) linear array transducer.3.Scan technique: To image the median nerve, the ultrasound transducer is placed in the
transverse orientation across the volar surface of the midforearm (Figs. 2-135 to 2-137).The median nerve is seen as a hyperechoic nodule between the flexor digitorumsuperficialis, which is superficial to the nerve, and the flexor digitorum profundus, whichis deep to the nerve (Figs. 2-138 to 2-141). To image the ulnar nerve, slide the ultrasoundmedially from the earlier position. It may be easier to start the ultrasound scan at the wristby locating the ulnar artery (Figs. 2-142 and 2-143). The ulnar nerve lies medial to theulnar artery at the wrist. One can then trace the ulnar nerve back to the midforearm (Figs.2-144 and 2-145). To image the superficial (cutaneous) branch of the radial nerve, theultrasound transducer is placed laterally on the volar surface of the midforearm and traceddistally (Fig. 2-146). The superficial branch of the radial nerve is seen lateral to the radialartery (Fig. 2-147).
119
http://radiologyme.com/

FIGURE 2-135 Figure showing the position of the ultrasound transducer relative to theforearm during an ultrasound scan for the median nerve at the midforearm.
120
http://radiologyme.com/
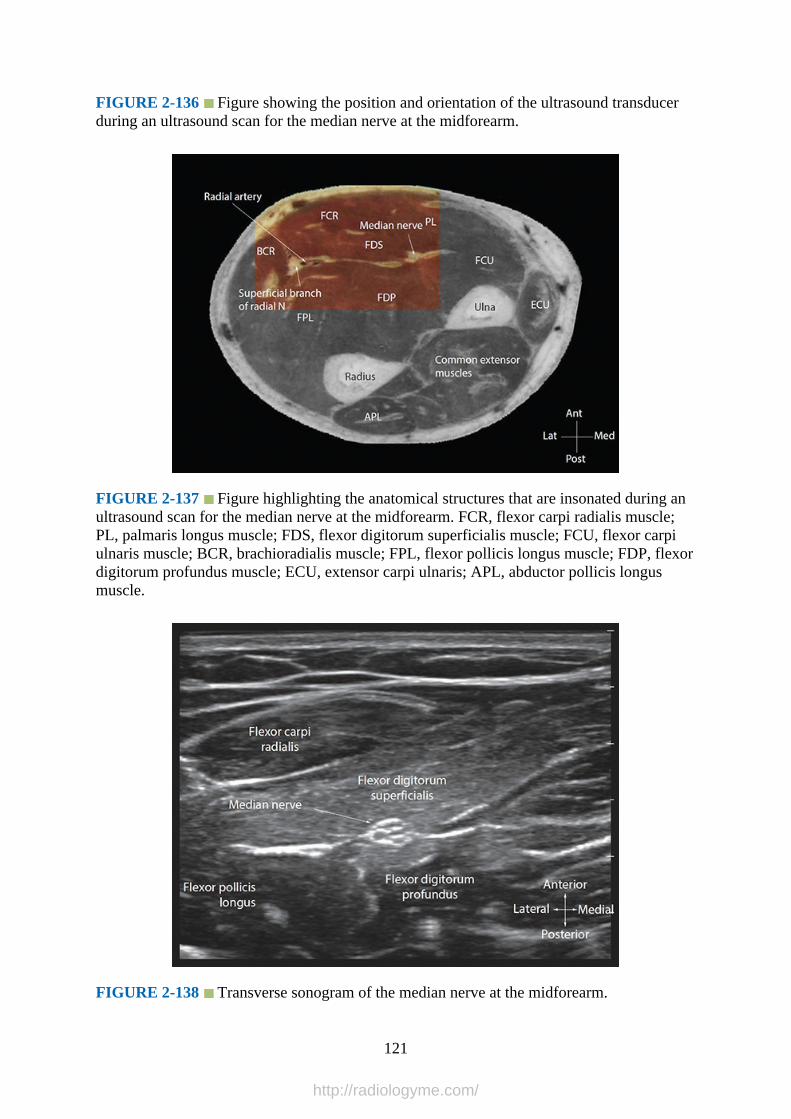
FIGURE 2-136 Figure showing the position and orientation of the ultrasound transducerduring an ultrasound scan for the median nerve at the midforearm.
FIGURE 2-137 Figure highlighting the anatomical structures that are insonated during anultrasound scan for the median nerve at the midforearm. FCR, flexor carpi radialis muscle;PL, palmaris longus muscle; FDS, flexor digitorum superficialis muscle; FCU, flexor carpiulnaris muscle; BCR, brachioradialis muscle; FPL, flexor pollicis longus muscle; FDP, flexordigitorum profundus muscle; ECU, extensor carpi ulnaris; APL, abductor pollicis longusmuscle.
FIGURE 2-138 Transverse sonogram of the median nerve at the midforearm.
121
http://radiologyme.com/
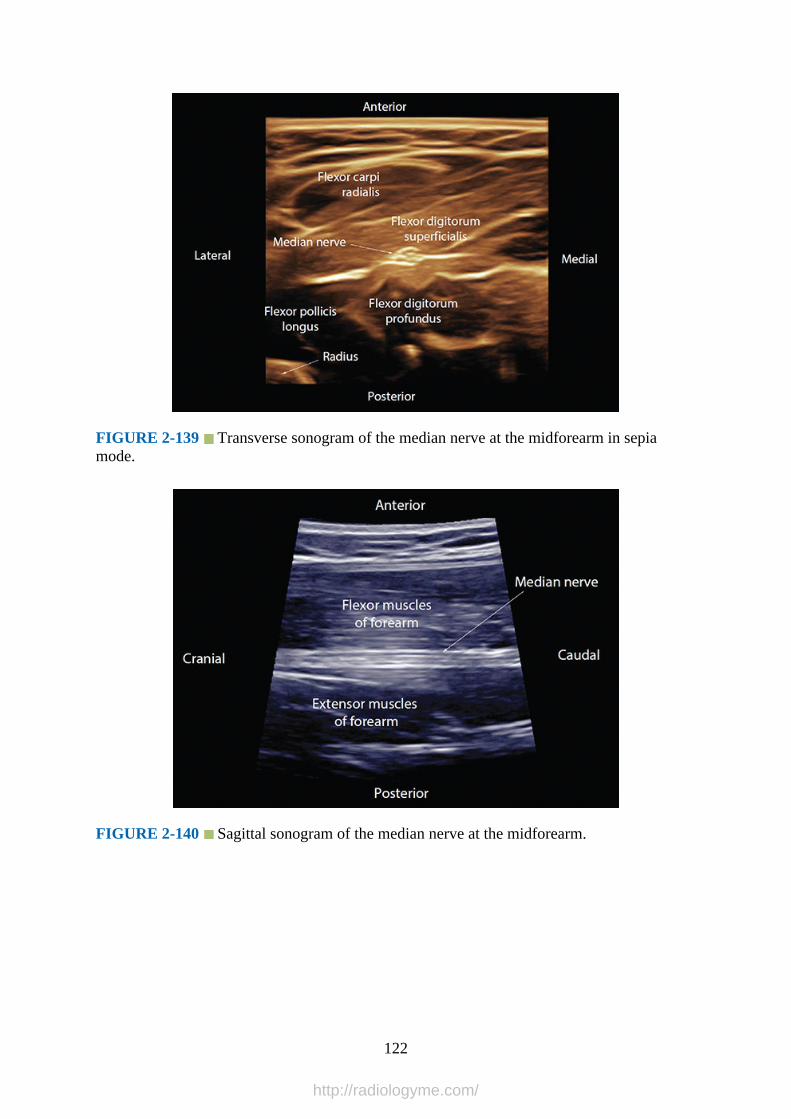
FIGURE 2-139 Transverse sonogram of the median nerve at the midforearm in sepiamode.
FIGURE 2-140 Sagittal sonogram of the median nerve at the midforearm.
122
http://radiologyme.com/

FIGURE 2-141 Three-dimensional multiplanar image of the median nerve at themidforearm. Reference marker has been placed over the median nerve: (a) transverse view,(b) sagittal view, and (c) coronal view.
FIGURE 2-142 Figure showing the position and orientation of the ultrasound transducerduring a ultrasound scan for the median nerve at the distal forearm.
123
http://radiologyme.com/
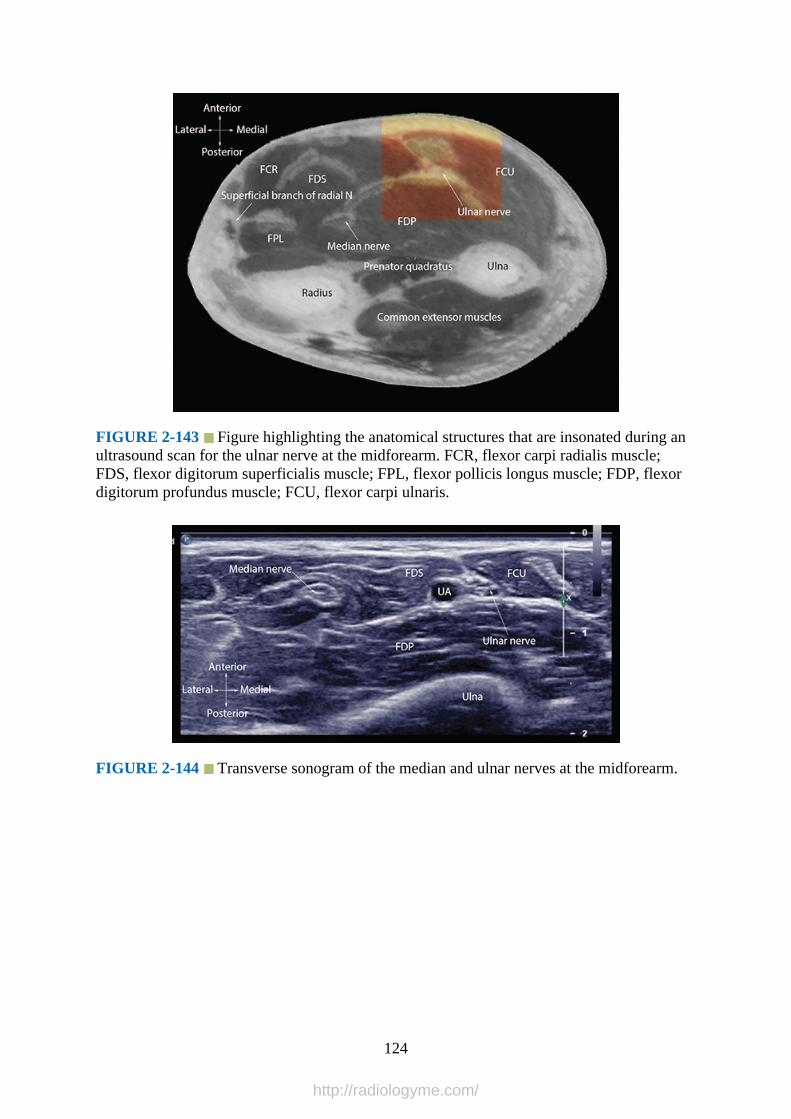
FIGURE 2-143 Figure highlighting the anatomical structures that are insonated during anultrasound scan for the ulnar nerve at the midforearm. FCR, flexor carpi radialis muscle;FDS, flexor digitorum superficialis muscle; FPL, flexor pollicis longus muscle; FDP, flexordigitorum profundus muscle; FCU, flexor carpi ulnaris.
FIGURE 2-144 Transverse sonogram of the median and ulnar nerves at the midforearm.
124
http://radiologyme.com/
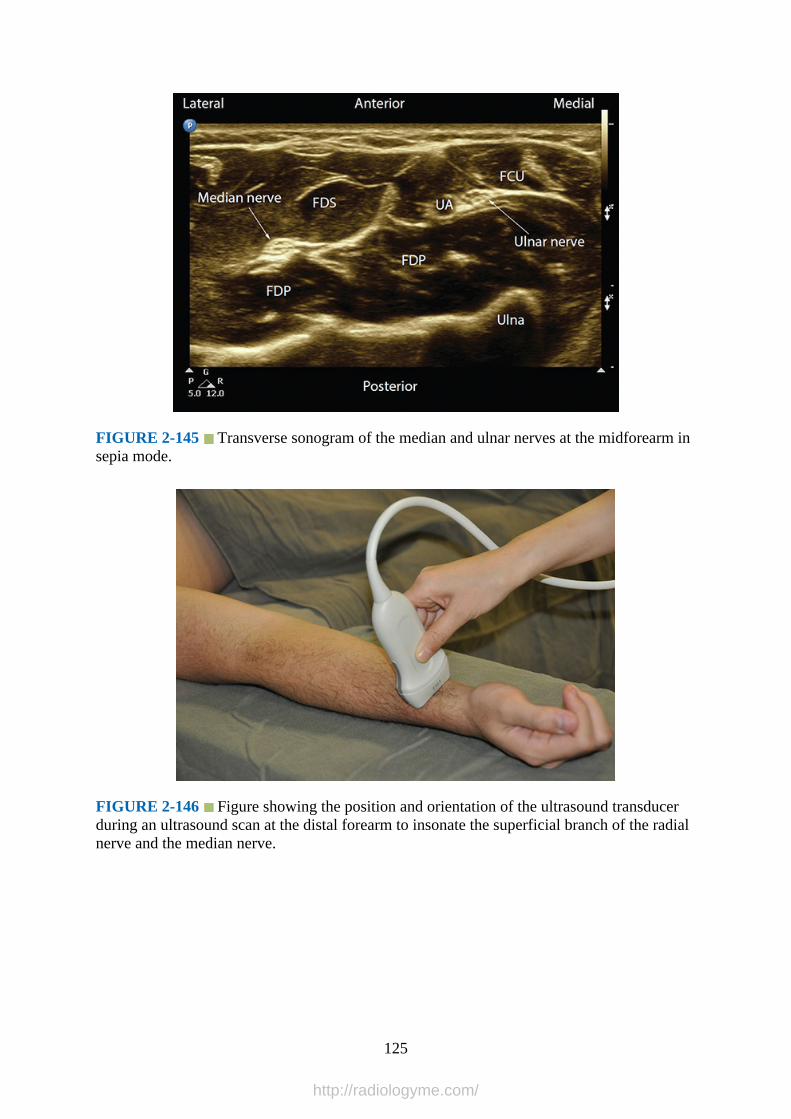
FIGURE 2-145 Transverse sonogram of the median and ulnar nerves at the midforearm insepia mode.
FIGURE 2-146 Figure showing the position and orientation of the ultrasound transducerduring an ultrasound scan at the distal forearm to insonate the superficial branch of the radialnerve and the median nerve.
125
http://radiologyme.com/
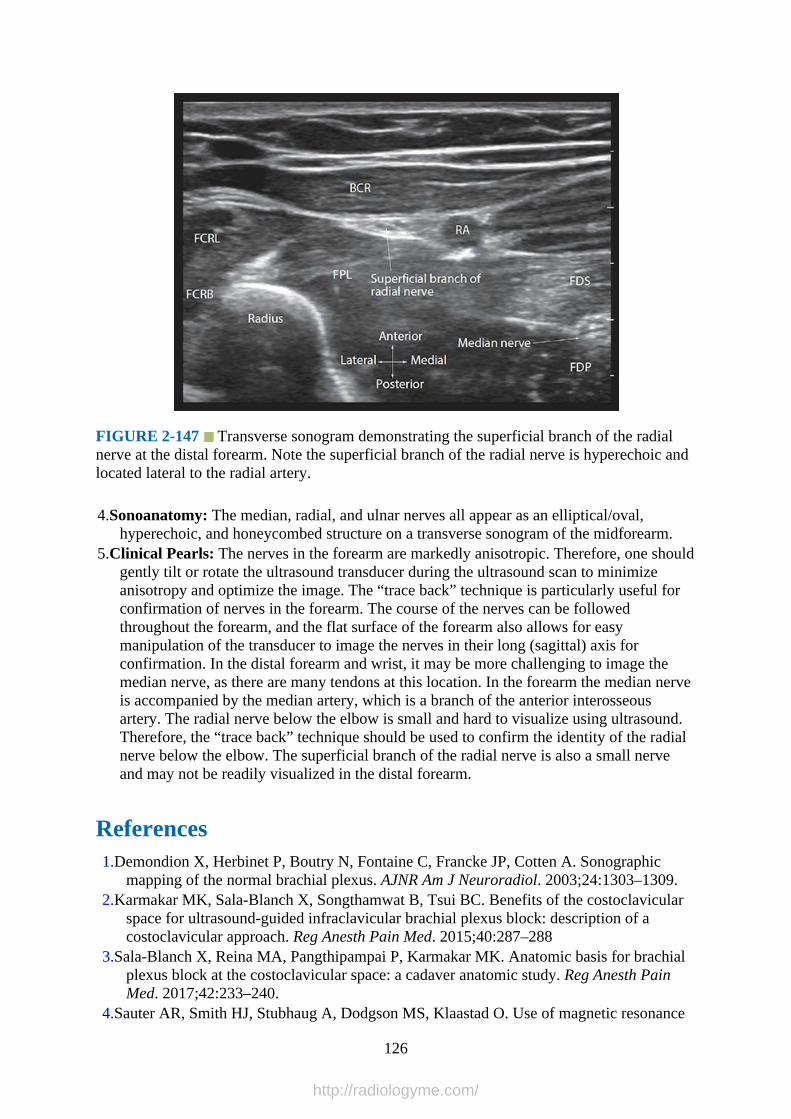
FIGURE 2-147 Transverse sonogram demonstrating the superficial branch of the radialnerve at the distal forearm. Note the superficial branch of the radial nerve is hyperechoic andlocated lateral to the radial artery.
4.Sonoanatomy: The median, radial, and ulnar nerves all appear as an elliptical/oval,hyperechoic, and honeycombed structure on a transverse sonogram of the midforearm.
5.Clinical Pearls: The nerves in the forearm are markedly anisotropic. Therefore, one shouldgently tilt or rotate the ultrasound transducer during the ultrasound scan to minimizeanisotropy and optimize the image. The “trace back” technique is particularly useful forconfirmation of nerves in the forearm. The course of the nerves can be followedthroughout the forearm, and the flat surface of the forearm also allows for easymanipulation of the transducer to image the nerves in their long (sagittal) axis forconfirmation. In the distal forearm and wrist, it may be more challenging to image themedian nerve, as there are many tendons at this location. In the forearm the median nerveis accompanied by the median artery, which is a branch of the anterior interosseousartery. The radial nerve below the elbow is small and hard to visualize using ultrasound.Therefore, the “trace back” technique should be used to confirm the identity of the radialnerve below the elbow. The superficial branch of the radial nerve is also a small nerveand may not be readily visualized in the distal forearm.
References1.Demondion X, Herbinet P, Boutry N, Fontaine C, Francke JP, Cotten A. Sonographic
mapping of the normal brachial plexus. AJNR Am J Neuroradiol. 2003;24:1303–1309.2.Karmakar MK, Sala-Blanch X, Songthamwat B, Tsui BC. Benefits of the costoclavicular
space for ultrasound-guided infraclavicular brachial plexus block: description of acostoclavicular approach. Reg Anesth Pain Med. 2015;40:287–288
3.Sala-Blanch X, Reina MA, Pangthipampai P, Karmakar MK. Anatomic basis for brachialplexus block at the costoclavicular space: a cadaver anatomic study. Reg Anesth PainMed. 2017;42:233–240.
4.Sauter AR, Smith HJ, Stubhaug A, Dodgson MS, Klaastad O. Use of magnetic resonance
126
http://radiologyme.com/
imaging to define the anatomical location closest to all three cords of the infraclavicularbrachial plexus. Anesth Analg. 2006;103:1574–1576.
5.Ruiz A, Sala X, Bargallo X, Hurtado P, Arguis MJ, Carrera A. The influence of armabduction on the anatomic relations of infraclavicular brachial plexus: an ultrasoundstudy. Anesth Analg. 2009;108:364–366.
6.Chan VW. Applying ultrasound imaging to interscalene brachial plexus block. Reg AnesthPain Med. 2003;28:340–343.
7.Narouze S, Peng PW. Ultrasound-guided interventional procedures in pain medicine: areview of anatomy, sonoanatomy, and procedures. Part II: axial structures. Reg AnesthPain Med. 2010;35:386–396.
8.Canella C, Demondion X, Delebarre A, Moraux A, Cotten H, Cotten A. Anatomical studyof phrenic nerve using ultrasound. Eur Radiol. 2010;20:659–665.
9.Tsui BC, Finucane BT. The importance of ultrasound landmarks: a “traceback” approachusing the popliteal blood vessels for identification of the sciatic nerve. Reg Anesth PainMed. 2006;31:481–482.
10.Gerscovich EO, Cronan M, McGahan JP, Jain K, Jones CD, McDonald C.Ultrasonographic evaluation of diaphragmatic motion. J Ultrasound Med. 2001;20:597–604.
11.Sinha SK, Abrams JH, Barnett JT, et al. Decreasing the local anesthetic volume from 20 to10 mL for ultrasound-guided interscalene block at the cricoid level does not reduce theincidence of hemidiaphragmatic paresis. Reg Anesth Pain Med. 2011;36:17–20.
12.Perlas A, Chan VW, Simons M. Brachial plexus examination and localization usingultrasound and electrical stimulation: a volunteer study. Anesthesiology. 2003;99:429–435.
13.Manickam BP, Oosthuysen SA, Parikh MK. Supraclavicular brachial plexus block-variantrelation of brachial plexus to subclavian artery on the first rib. Reg Anesth Pain Med.2009;34:383–384.
14.Lichtenstein DA, Menu Y. A bedside ultrasound sign ruling out pneumothorax in thecritically ill. Lung sliding. Chest. 1995;108:1345–1348.
15.Murata H, Sakai A, Hadzic A, Sumikawa K. The presence of transverse cervical and dorsalscapular arteries at three ultrasound probe positions commonly used in supraclavicularbrachial plexus blockade. Anesth Analg. 2012;115:470–473.
16.Bigeleisen P, Wilson M. A comparison of two techniques for ultrasound guidedinfraclavicular block. Br J Anaesth. 2006;96:502–507.
17.Kilka HG, Geiger P, Mehrkens HH. [Infraclavicular vertical brachial plexus blockade. Anew method for anesthesia of the upper extremity. An anatomical and clinical study].Anaesthesist. 1995;44:339–344.
18.Sandhu NS, Capan LM. Ultrasound-guided infraclavicular brachial plexus block. Br JAnaesth. 2002;89:254–259.
19.Crews JC, Gerancher JC, Weller RS. Pneumothorax after coracoid infraclavicular brachialplexus block. Anesth Analg. 2007;105:275–277.
20.Moayeri N, Renes S, van Geffen GJ, Groen GJ. Vertical infraclavicular brachial plexusblock: needle redirection after elicitation of elbow flexion. Reg Anesth Pain Med.2009;34:236–241.
21.Rodriguez J, Barcena M, Taboada-Muniz M, Lagunilla J, Alvarez J. A comparison ofsingle versus multiple injections on the extent of anesthesia with coracoid infraclavicularbrachial plexus block. Anesth Analg. 2004;99:1225–1230.
22.Tran DQ, Dugani S, Dyachenko A, Correa JA, Finlayson RJ. Minimum effective volumeof lidocaine for ultrasound-guided infraclavicular block. Reg Anesth Pain Med.
127
http://radiologyme.com/
2011;36:190–194.23.Sandhu NS, Manne JS, Medabalmi PK, Capan LM. Sonographically guided infraclavicular
brachial plexus block in adults: a retrospective analysis of 1146 cases. J Ultrasound Med.2006;25:1555–1561.
24.Di Filippo A, Orando S, Luna A, et al. Ultrasound identification of nerve cords in theinfraclavicular fossa: a clinical study. Minerva Anestesiol. 2012;78:450–455.
25.Bigeleisen PE. The bifid axillary artery. J Clin Anesth. 2004;16:224–225.26.Retzl G, Kapral S, Greher M, Mauritz W. Ultrasonographic findings of the axillary part of
the brachial plexus. Anesth Analg. 2001;92:1271–1275.27.Schafhalter-Zoppoth I, Gray AT. The musculocutaneous nerve: ultrasound appearance for
peripheral nerve block. Reg Anesth Pain Med. 2005;30:385–390.28.Gray AT. The conjoint tendon of the latissimus dorsi and teres major: an important
landmark for ultrasound-guided axillary block. Reg Anesth Pain Med. 2009;34:179–180.29.Foxall GL, Skinner D, Hardman JG, Bedforth NM. Ultrasound anatomy of the radial nerve
in the distal upper arm. Reg Anesth Pain Med. 2007;32:217–220.30.Ferdinand BD, Rosenberg ZS, Schweitzer ME, et al. MR imaging features of radial tunnel
syndrome: initial experience. Radiology. 2006;240:161–168.31.Hazani R, Engineer NJ, Mowlavi A, Neumeister M, Lee WP, Wilhelmi BJ. Anatomic
landmarks for the radial tunnel. Eplasty. 2008;8:e37.
128
http://radiologyme.com/
CHAPTER 3
Sonoanatomy Relevant for Ultrasound-Guided LowerExtremity Nerve Blocks
IntroductionFour main nerves of the lumbosacral plexus provide sensory and motor innervation to thelower extremity: the femoral, lateral femoral cutaneous, obturator, and the sciatic nerve.
Gross AnatomyThe anatomy of the lumbar plexus is described in detail in Chapter 8 (Fig. 3-1). The terminalnerves of the lumbosacral plexus relevant for innervating the lower extremity include thelateral cutaneous nerve of the thigh, the femoral nerve, the obturator nerve, and the sciaticnerve. The lateral cutaneous nerve of the thigh and the femoral nerve leave the lumbar plexusalong the posterolateral border of the psoas major muscle; the obturator nerve emerges fromthe medial border of the psoas muscle at the pelvic brim and crosses in front of the sacroiliacjoint.1 The sacral plexus provides sensorimotor innervation to the posterior thigh, most of thelower extremity, the entire foot, and parts of the pelvis. It is formed by the union of theanterior primary rami of the spinal nerves of L4, L5, S1, S2, S3, and S4 (lumbosacral plexus,Fig. 3-2). The sacral plexus lies deep within the pelvis between the piriformis muscleposteriorly and the pelvis fascia anteriorly (Fig. 3-3). The sigmoid colon, ureter, internal iliacartery, and vein lie anterior to it. The superior gluteal artery and vein lies between thelumbosacral trunk and the first sacral nerve, and the inferior gluteal artery and vein liebetween the second and third sacral nerves. The nerves forming the sacral plexus converge asthey descend towards the lower part of the greater sciatic foramen and unite within the pelvisto form the sciatic nerve (Fig. 3-4). The sciatic nerve is the largest (thickest) nerve of thebody and exits the pelvis through the greater sciatic foramen, between the piriformis and thesuperior gemellus muscles (Fig. 3-5), to enter the “subgluteal space” between the greatertrochanter and ischial tuberosity (Figs. 3-6 and 3-7).2,3 Sciatic nerve and piriformis muscleanomaly are seen in 16.2% (95% CI: 10.7–23.5%) of individuals.4 The entire sciatic nerve orone of its components (tibial or common peroneal) may rarely exit the pelvis by passingthrough or above the superior border of the piriformis muscle.4 The sciatic nerve, after itemerges from the pelvis, descends along the back of the thigh, lying deep to thesemitendinosus and biceps femoris muscles, to about its lower third (Figs. 3-8 and 3-9),where it bifurcates into its two branches: the tibial and common peroneal (fibular) nerves.This bifurcation may take place at any point between its origin at the sacral plexus and thelower third of the thigh or at a variable distance from the popliteal crease.5 The tibial andcommon peroneal nerves may also arise separately from the sacral plexus.
129
http://radiologyme.com/
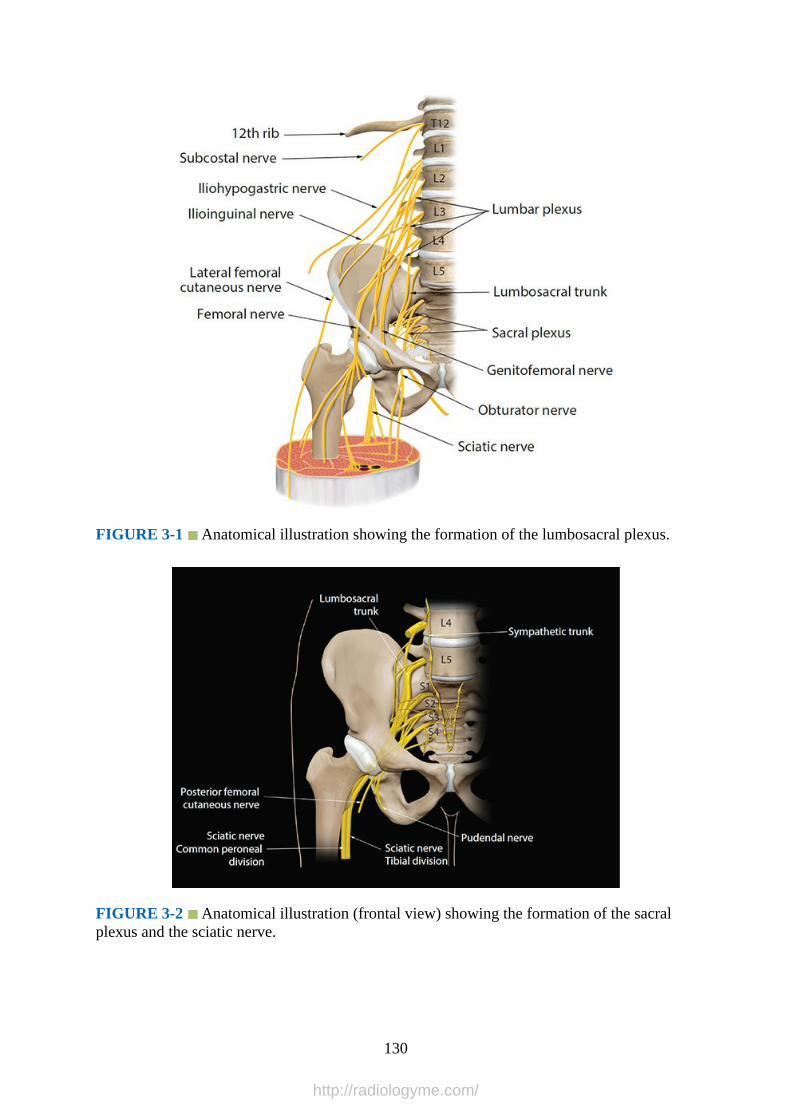
FIGURE 3-1 Anatomical illustration showing the formation of the lumbosacral plexus.
FIGURE 3-2 Anatomical illustration (frontal view) showing the formation of the sacralplexus and the sciatic nerve.
130
http://radiologyme.com/
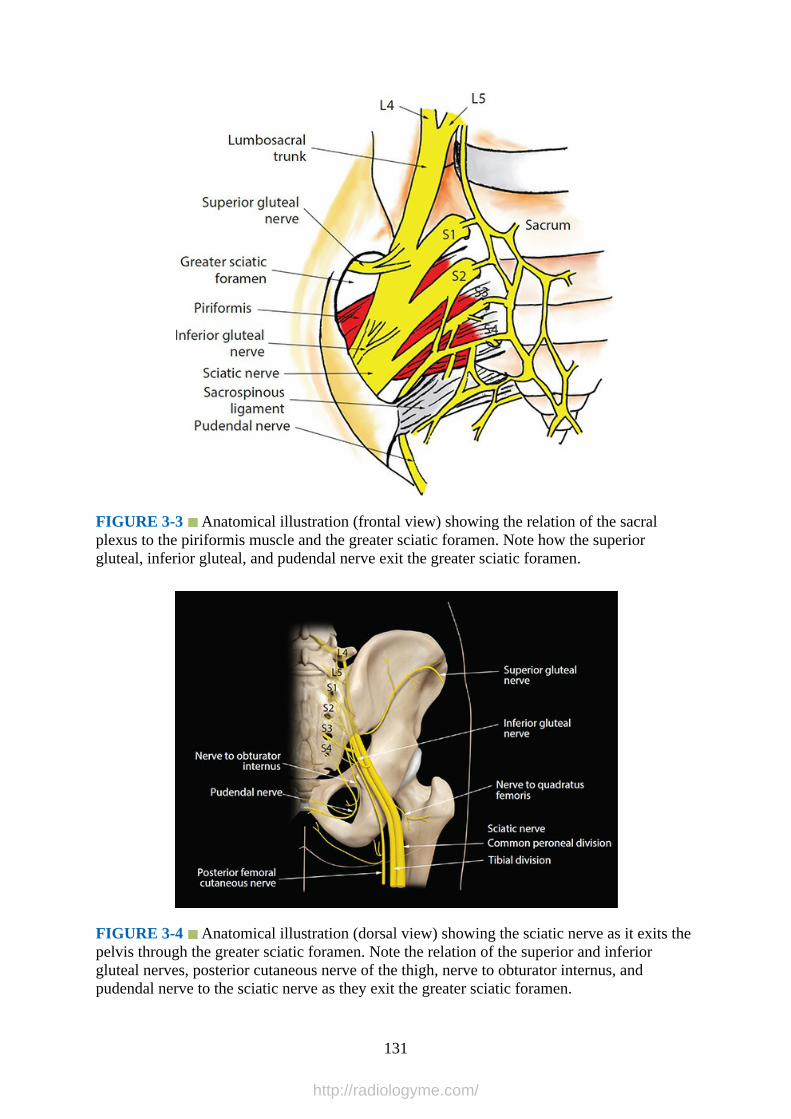
FIGURE 3-3 Anatomical illustration (frontal view) showing the relation of the sacralplexus to the piriformis muscle and the greater sciatic foramen. Note how the superiorgluteal, inferior gluteal, and pudendal nerve exit the greater sciatic foramen.
FIGURE 3-4 Anatomical illustration (dorsal view) showing the sciatic nerve as it exits thepelvis through the greater sciatic foramen. Note the relation of the superior and inferiorgluteal nerves, posterior cutaneous nerve of the thigh, nerve to obturator internus, andpudendal nerve to the sciatic nerve as they exit the greater sciatic foramen.
131
http://radiologyme.com/

FIGURE 3-5 Anatomical illustration showing the relation of the sciatic nerve to themuscles of the buttock and upper thigh.
FIGURE 3-6 Multiplanar 3-D anatomy (rendered from the Visible Human Server) of thesciatic nerve at the subgluteal space. Note the reference marker (green crosshair) has beenplaced over the sciatic nerve in the transverse view and its corresponding position in thesagittal and coronal images can be seen. AM, adductor magnus; VL, vastus lateralis; IT,ischial tuberosity; QF, quadratus femoris; GM, gluteus maximus; GS, gemellus superior; GI,gemellus inferior; BF, biceps femoris; OI, obturator internus; PF, piriformis.
132
http://radiologyme.com/
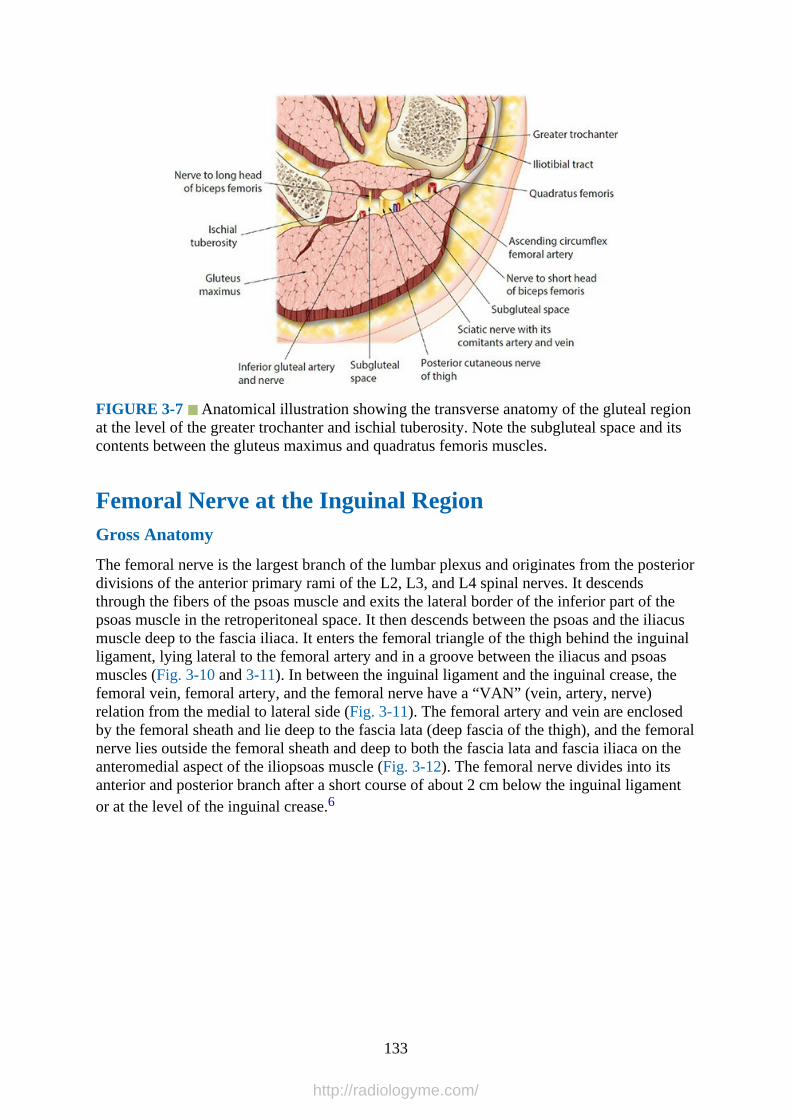
FIGURE 3-7 Anatomical illustration showing the transverse anatomy of the gluteal regionat the level of the greater trochanter and ischial tuberosity. Note the subgluteal space and itscontents between the gluteus maximus and quadratus femoris muscles.
Femoral Nerve at the Inguinal RegionGross Anatomy
The femoral nerve is the largest branch of the lumbar plexus and originates from the posteriordivisions of the anterior primary rami of the L2, L3, and L4 spinal nerves. It descendsthrough the fibers of the psoas muscle and exits the lateral border of the inferior part of thepsoas muscle in the retroperitoneal space. It then descends between the psoas and the iliacusmuscle deep to the fascia iliaca. It enters the femoral triangle of the thigh behind the inguinalligament, lying lateral to the femoral artery and in a groove between the iliacus and psoasmuscles (Fig. 3-10 and 3-11). In between the inguinal ligament and the inguinal crease, thefemoral vein, femoral artery, and the femoral nerve have a “VAN” (vein, artery, nerve)relation from the medial to lateral side (Fig. 3-11). The femoral artery and vein are enclosedby the femoral sheath and lie deep to the fascia lata (deep fascia of the thigh), and the femoralnerve lies outside the femoral sheath and deep to both the fascia lata and fascia iliaca on theanteromedial aspect of the iliopsoas muscle (Fig. 3-12). The femoral nerve divides into itsanterior and posterior branch after a short course of about 2 cm below the inguinal ligamentor at the level of the inguinal crease.6
133
http://radiologyme.com/

FIGURE 3-8 Multiplanar 3-D anatomy of the sciatic nerve at the midthigh. AL, adductorlongus; AM, adductor magnus; BF, biceps femoris; GM, gluteus maximus; RF, rectusfemoris; SM, semimembranosus; SR, sartorius; ST, semitendinosus; VI, vastus intermedialis;VL, vastus lateralis; VM, vastus medialis.
134
http://radiologyme.com/

FIGURE 3-9 Multiplanar 3-D anatomy of the sciatic nerve at or close to the apex of thepopliteal fossa. AM, adductor magnus; AL, adductor longus; BF, biceps femoris; GR,gracilis; SM, semimembranosus; SR, sartorius; ST, semitendinosus; VI, vastus intermedialis;VL, vastus lateralis; VM, vastus medialis; RF; rectus femoris.
FIGURE 3-10 Anatomy of the femoral nerve at the inguinal region. Note the relation ofthe femoral nerve to the femoral artery and vein and the iliopsoas muscle.
FIGURE 3-11 Transverse anatomical section of the inguinal region at the level of theinguinal ligament. Note the relation of the femoral nerve to the iliopsoas muscle.
135
http://radiologyme.com/
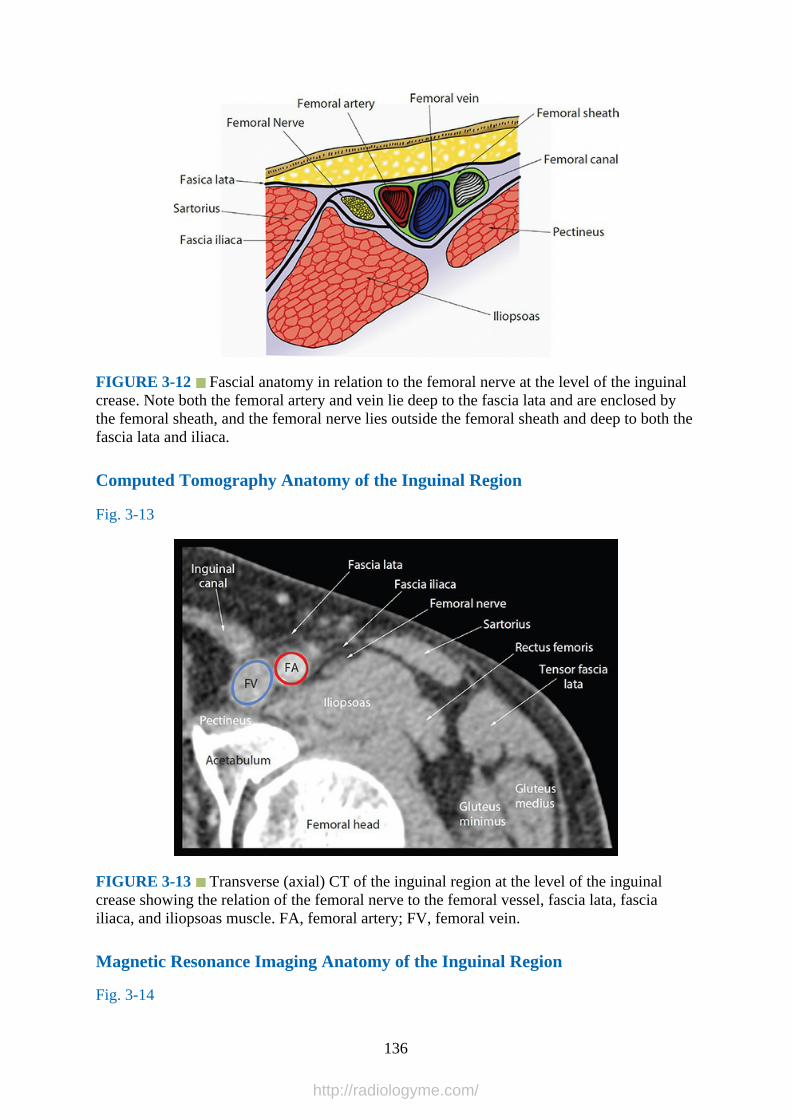
FIGURE 3-12 Fascial anatomy in relation to the femoral nerve at the level of the inguinalcrease. Note both the femoral artery and vein lie deep to the fascia lata and are enclosed bythe femoral sheath, and the femoral nerve lies outside the femoral sheath and deep to both thefascia lata and iliaca.
Computed Tomography Anatomy of the Inguinal Region
Fig. 3-13
FIGURE 3-13 Transverse (axial) CT of the inguinal region at the level of the inguinalcrease showing the relation of the femoral nerve to the femoral vessel, fascia lata, fasciailiaca, and iliopsoas muscle. FA, femoral artery; FV, femoral vein.
Magnetic Resonance Imaging Anatomy of the Inguinal Region
Fig. 3-14
136
http://radiologyme.com/
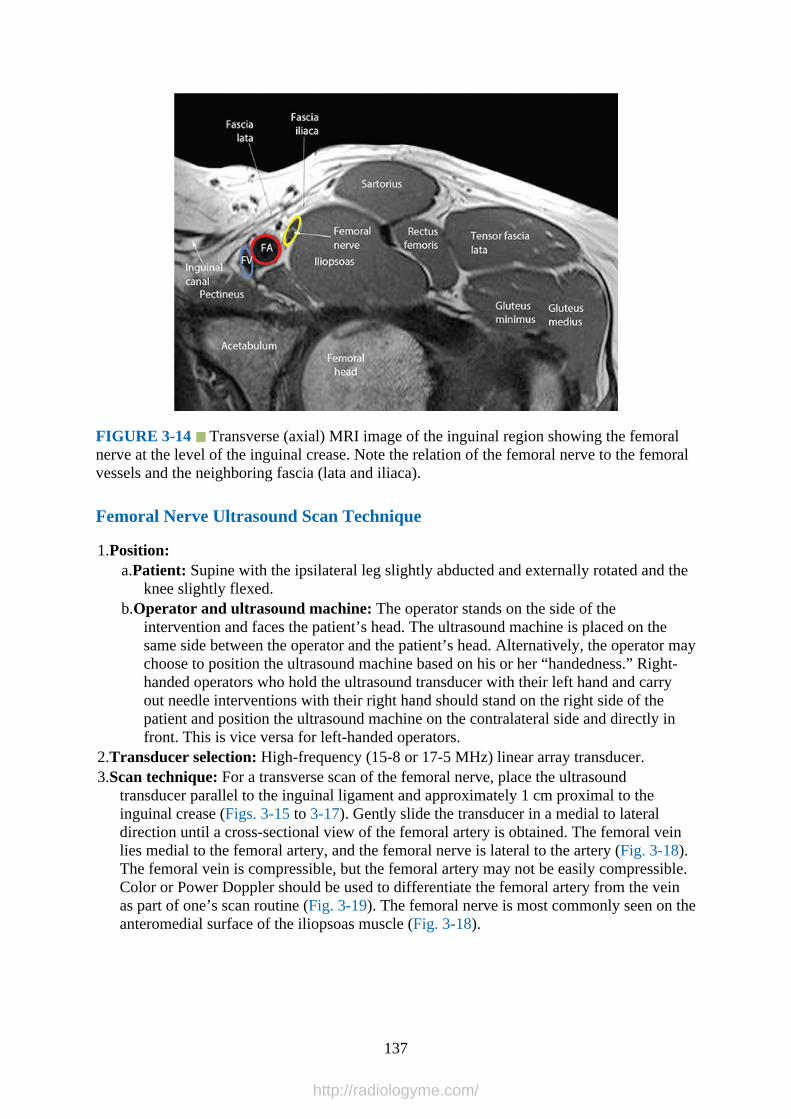
FIGURE 3-14 Transverse (axial) MRI image of the inguinal region showing the femoralnerve at the level of the inguinal crease. Note the relation of the femoral nerve to the femoralvessels and the neighboring fascia (lata and iliaca).
Femoral Nerve Ultrasound Scan Technique
1.Position:a.Patient: Supine with the ipsilateral leg slightly abducted and externally rotated and the
knee slightly flexed.b.Operator and ultrasound machine: The operator stands on the side of the
intervention and faces the patient’s head. The ultrasound machine is placed on thesame side between the operator and the patient’s head. Alternatively, the operator maychoose to position the ultrasound machine based on his or her “handedness.” Right-handed operators who hold the ultrasound transducer with their left hand and carryout needle interventions with their right hand should stand on the right side of thepatient and position the ultrasound machine on the contralateral side and directly infront. This is vice versa for left-handed operators.
2.Transducer selection: High-frequency (15-8 or 17-5 MHz) linear array transducer.3.Scan technique: For a transverse scan of the femoral nerve, place the ultrasound
transducer parallel to the inguinal ligament and approximately 1 cm proximal to theinguinal crease (Figs. 3-15 to 3-17). Gently slide the transducer in a medial to lateraldirection until a cross-sectional view of the femoral artery is obtained. The femoral veinlies medial to the femoral artery, and the femoral nerve is lateral to the artery (Fig. 3-18).The femoral vein is compressible, but the femoral artery may not be easily compressible.Color or Power Doppler should be used to differentiate the femoral artery from the veinas part of one’s scan routine (Fig. 3-19). The femoral nerve is most commonly seen on theanteromedial surface of the iliopsoas muscle (Fig. 3-18).
137
http://radiologyme.com/

FIGURE 3-15 Figure showing the position of the ultrasound transducer during atransverse ultrasound scan for the femoral nerve at the inguinal region.
138
http://radiologyme.com/
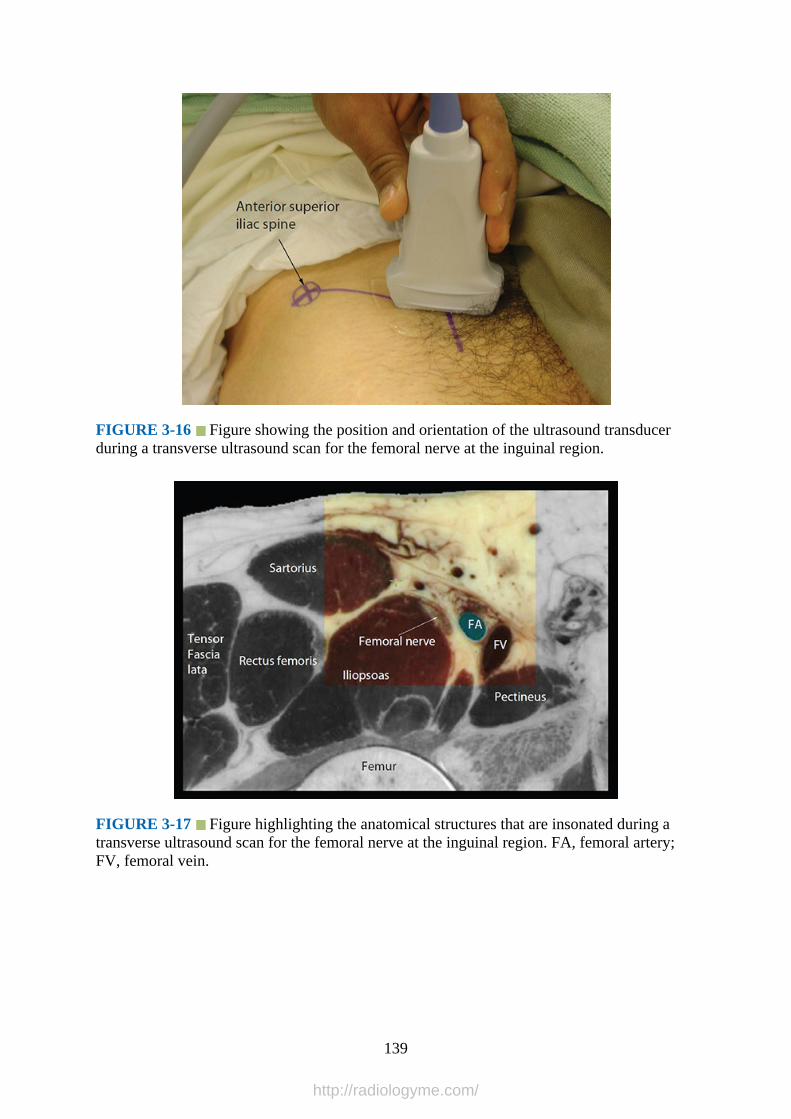
FIGURE 3-16 Figure showing the position and orientation of the ultrasound transducerduring a transverse ultrasound scan for the femoral nerve at the inguinal region.
FIGURE 3-17 Figure highlighting the anatomical structures that are insonated during atransverse ultrasound scan for the femoral nerve at the inguinal region. FA, femoral artery;FV, femoral vein.
139
http://radiologyme.com/
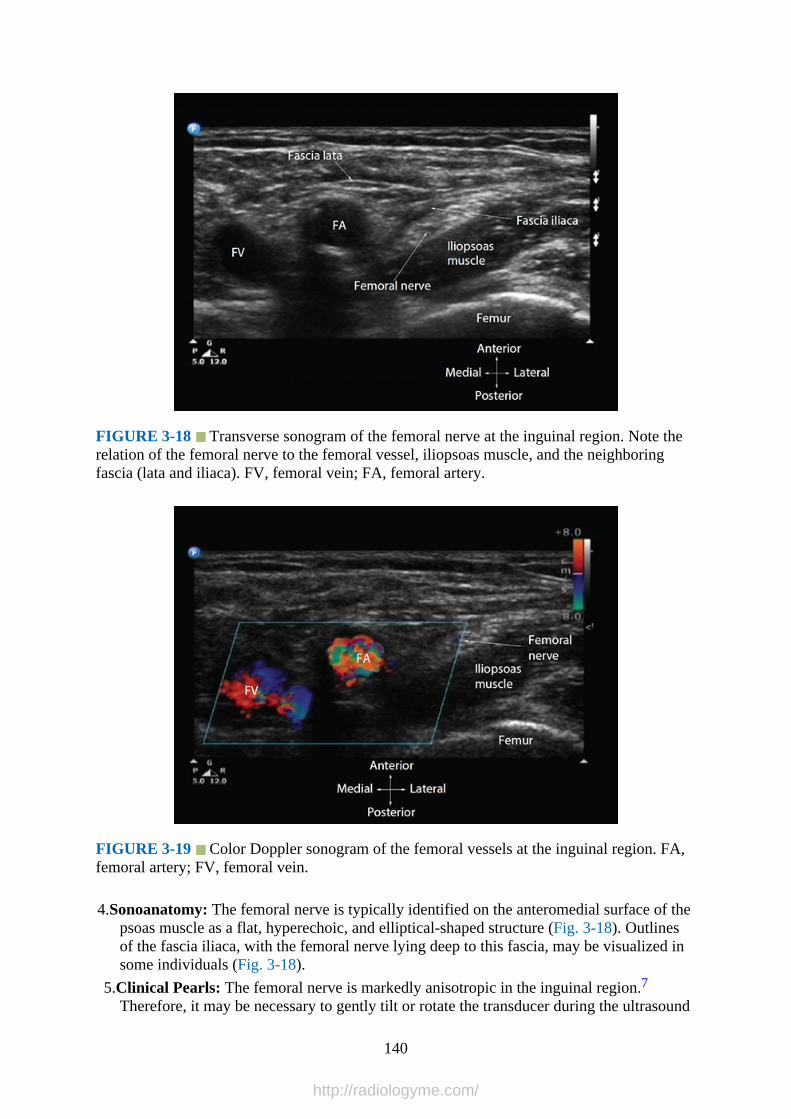
FIGURE 3-18 Transverse sonogram of the femoral nerve at the inguinal region. Note therelation of the femoral nerve to the femoral vessel, iliopsoas muscle, and the neighboringfascia (lata and iliaca). FV, femoral vein; FA, femoral artery.
FIGURE 3-19 Color Doppler sonogram of the femoral vessels at the inguinal region. FA,femoral artery; FV, femoral vein.
4.Sonoanatomy: The femoral nerve is typically identified on the anteromedial surface of thepsoas muscle as a flat, hyperechoic, and elliptical-shaped structure (Fig. 3-18). Outlinesof the fascia iliaca, with the femoral nerve lying deep to this fascia, may be visualized insome individuals (Fig. 3-18).
5.Clinical Pearls: The femoral nerve is markedly anisotropic in the inguinal region.7Therefore, it may be necessary to gently tilt or rotate the transducer during the ultrasound
140
http://radiologyme.com/
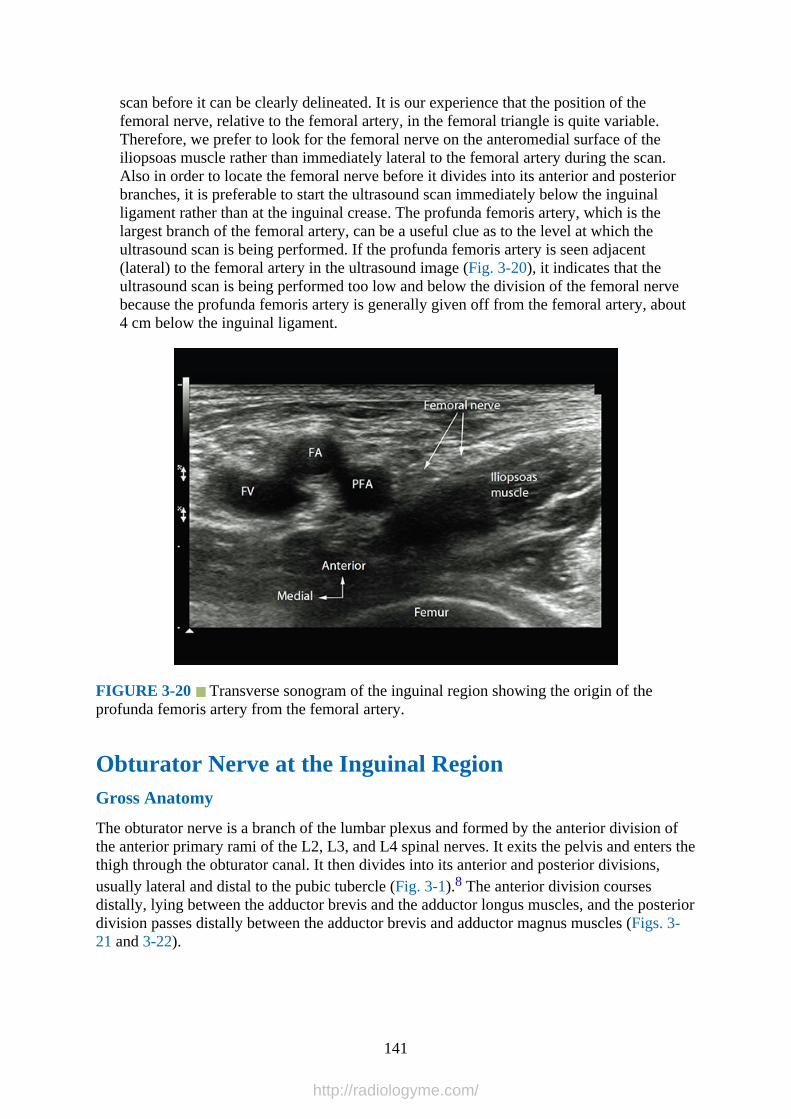
scan before it can be clearly delineated. It is our experience that the position of thefemoral nerve, relative to the femoral artery, in the femoral triangle is quite variable.Therefore, we prefer to look for the femoral nerve on the anteromedial surface of theiliopsoas muscle rather than immediately lateral to the femoral artery during the scan.Also in order to locate the femoral nerve before it divides into its anterior and posteriorbranches, it is preferable to start the ultrasound scan immediately below the inguinalligament rather than at the inguinal crease. The profunda femoris artery, which is thelargest branch of the femoral artery, can be a useful clue as to the level at which theultrasound scan is being performed. If the profunda femoris artery is seen adjacent(lateral) to the femoral artery in the ultrasound image (Fig. 3-20), it indicates that theultrasound scan is being performed too low and below the division of the femoral nervebecause the profunda femoris artery is generally given off from the femoral artery, about4 cm below the inguinal ligament.
FIGURE 3-20 Transverse sonogram of the inguinal region showing the origin of theprofunda femoris artery from the femoral artery.
Obturator Nerve at the Inguinal RegionGross Anatomy
The obturator nerve is a branch of the lumbar plexus and formed by the anterior division ofthe anterior primary rami of the L2, L3, and L4 spinal nerves. It exits the pelvis and enters thethigh through the obturator canal. It then divides into its anterior and posterior divisions,usually lateral and distal to the pubic tubercle (Fig. 3-1).8 The anterior division coursesdistally, lying between the adductor brevis and the adductor longus muscles, and the posteriordivision passes distally between the adductor brevis and adductor magnus muscles (Figs. 3-21 and 3-22).
141
http://radiologyme.com/
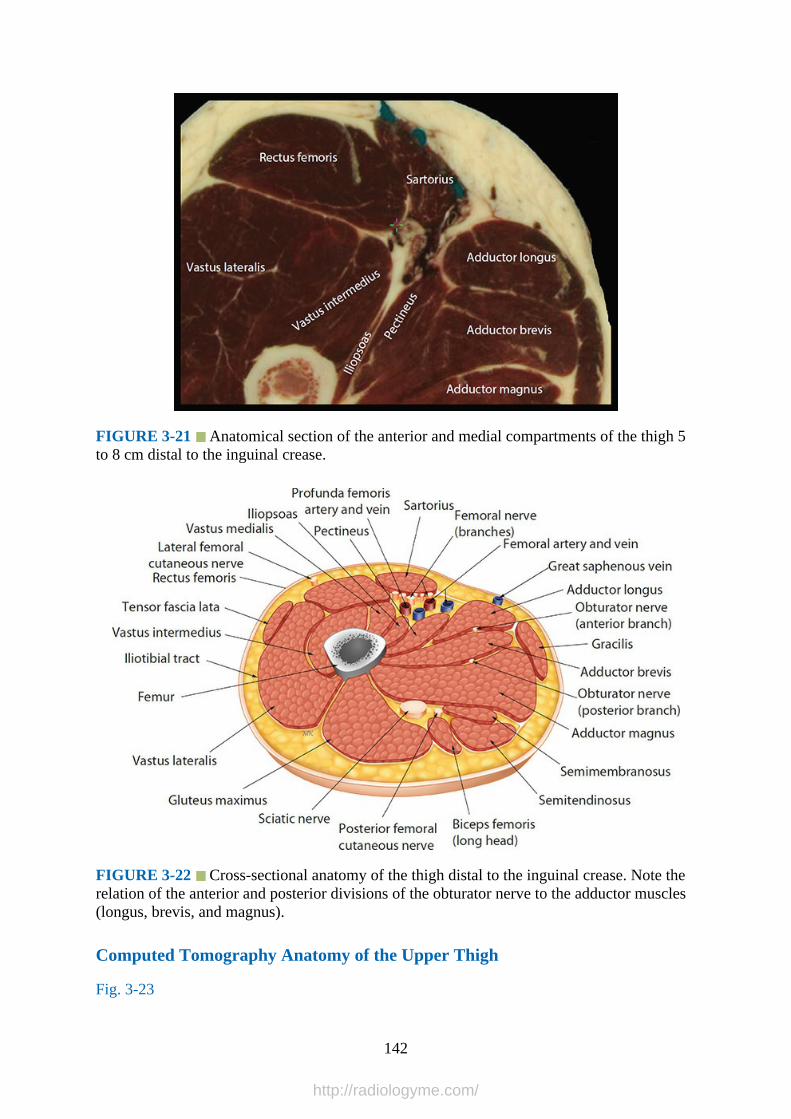
FIGURE 3-21 Anatomical section of the anterior and medial compartments of the thigh 5to 8 cm distal to the inguinal crease.
FIGURE 3-22 Cross-sectional anatomy of the thigh distal to the inguinal crease. Note therelation of the anterior and posterior divisions of the obturator nerve to the adductor muscles(longus, brevis, and magnus).
Computed Tomography Anatomy of the Upper Thigh
Fig. 3-23
142
http://radiologyme.com/
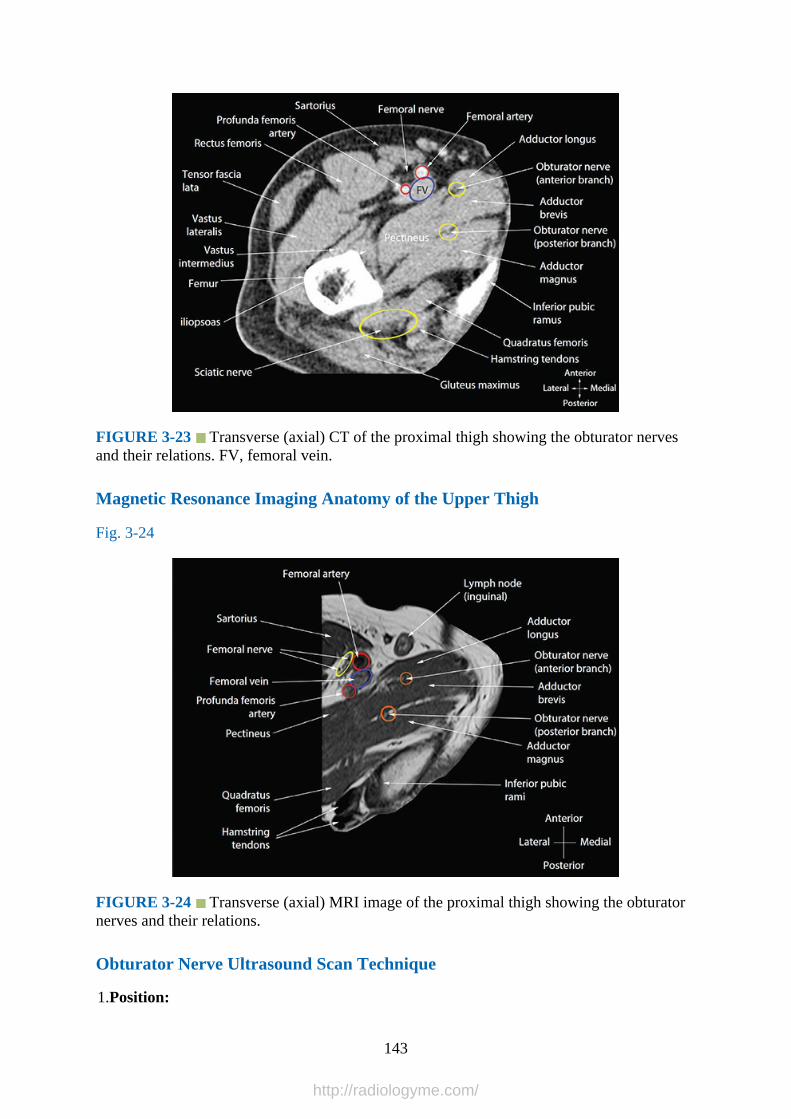
FIGURE 3-23 Transverse (axial) CT of the proximal thigh showing the obturator nervesand their relations. FV, femoral vein.
Magnetic Resonance Imaging Anatomy of the Upper Thigh
Fig. 3-24
FIGURE 3-24 Transverse (axial) MRI image of the proximal thigh showing the obturatornerves and their relations.
Obturator Nerve Ultrasound Scan Technique
1.Position:
143
http://radiologyme.com/
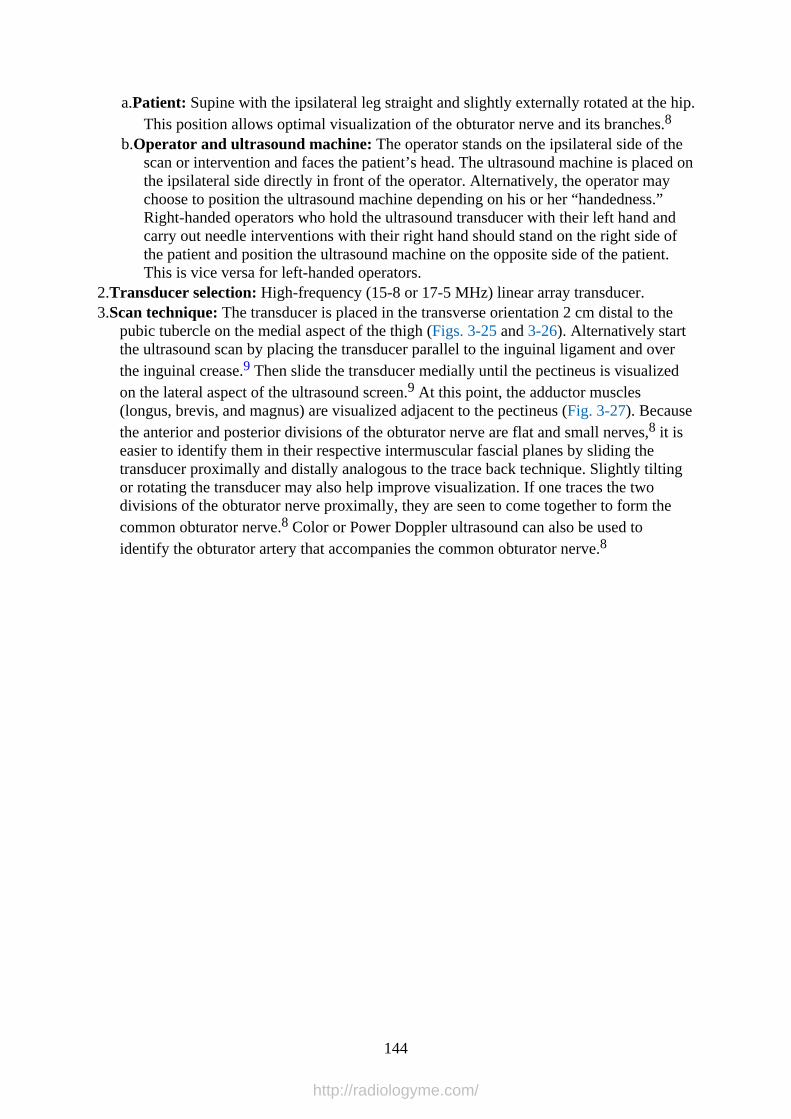
a.Patient: Supine with the ipsilateral leg straight and slightly externally rotated at the hip.This position allows optimal visualization of the obturator nerve and its branches.8
b.Operator and ultrasound machine: The operator stands on the ipsilateral side of thescan or intervention and faces the patient’s head. The ultrasound machine is placed onthe ipsilateral side directly in front of the operator. Alternatively, the operator maychoose to position the ultrasound machine depending on his or her “handedness.”Right-handed operators who hold the ultrasound transducer with their left hand andcarry out needle interventions with their right hand should stand on the right side ofthe patient and position the ultrasound machine on the opposite side of the patient.This is vice versa for left-handed operators.
2.Transducer selection: High-frequency (15-8 or 17-5 MHz) linear array transducer.3.Scan technique: The transducer is placed in the transverse orientation 2 cm distal to the
pubic tubercle on the medial aspect of the thigh (Figs. 3-25 and 3-26). Alternatively startthe ultrasound scan by placing the transducer parallel to the inguinal ligament and overthe inguinal crease.9 Then slide the transducer medially until the pectineus is visualizedon the lateral aspect of the ultrasound screen.9 At this point, the adductor muscles(longus, brevis, and magnus) are visualized adjacent to the pectineus (Fig. 3-27). Becausethe anterior and posterior divisions of the obturator nerve are flat and small nerves,8 it iseasier to identify them in their respective intermuscular fascial planes by sliding thetransducer proximally and distally analogous to the trace back technique. Slightly tiltingor rotating the transducer may also help improve visualization. If one traces the twodivisions of the obturator nerve proximally, they are seen to come together to form thecommon obturator nerve.8 Color or Power Doppler ultrasound can also be used toidentify the obturator artery that accompanies the common obturator nerve.8
144
http://radiologyme.com/

FIGURE 3-25 Figure showing the position of the ultrasound transducer relative to thethigh during a transverse scan for the anterior and posterior divisions of the obturator nerve.
145
http://radiologyme.com/

FIGURE 3-26 Transverse sonogram of the medial compartment of the upper thighshowing the branches of the obturator nerve in the intermuscular plane between the adductormuscles. Accompanying photographs show the position and orientation of the transducerduring the ultrasound scan.
FIGURE 3-27 Figure highlighting the anatomical structures that are insonated during atransverse ultrasound scan for the anterior and posterior division of the obturator nerve at themedial aspect of the upper thigh.
4.Sonoanatomy: The common obturator nerve or its divisions (anterior and posterior) arenot readily identified as discrete nerves on ultrasound imaging, as they are small and flat
146
http://radiologyme.com/

nerves.8 Unlike other peripheral nerves, the anterior and posterior divisions of theobturator nerve appear as two flat and hyperechoic structures in the intermuscular fascialplanes between the adductor muscles (Fig. 3-28).
FIGURE 3-28 Transverse sonogram of the medial compartment of the proximal thighshowing the adductor muscles (longus, brevis, and magnus) and the anterior and posteriordivisions of the obturator nerve in the intermuscular plane between the adductor muscles.
5.Clinical Pearls: The anterior division travels in the intermuscular plane between theadductor longus and adductor brevis muscles. The posterior division travels in the planebetween the adductor brevis and adductor magnus muscles. The typical appearance on atransverse sonogram would include the pectineus muscle on the lateral aspect of thescreen and the three adductors muscles on the medial aspect, with the adductor longusbeing most superficial, the adductor brevis in the middle, and the adductor magnusdeepest, respectively (Figs. 3-27 and 3-28). Small branches of the obturator vesselsaccompany the divisions of the obturator nerve in the intermuscular plane and can beidentified using Color or Power Doppler ultrasound.8 However, to what extent this isreliable in locating the nerves is yet to be determined, as the position of the obturatorvessels relative to the nerves is variable.
Lateral Cutaneous Nerve of the ThighGross Anatomy
The lateral cutaneous nerve of the thigh, also called the lateral femoral cutaneous nerve of thethigh, innervates the skin on the lateral aspect of the thigh. It is a branch of the lumbar plexusand formed within the psoas muscle by the fusion of the posterior divisions of the L2 and L3spinal nerves. It exits the psoas muscle from its lateral border, in the retroperitoneum, atabout its middle and travels across the iliacus muscle obliquely lying deep to the fascia iliaca(Fig. 3-1). It enters the thigh medial to the anterior superior iliac spine (ASIS) lying under thelateral edge of the inguinal ligament (Figs. 3-29 and 3-30). It then crosses over the sartorius
147
http://radiologyme.com/
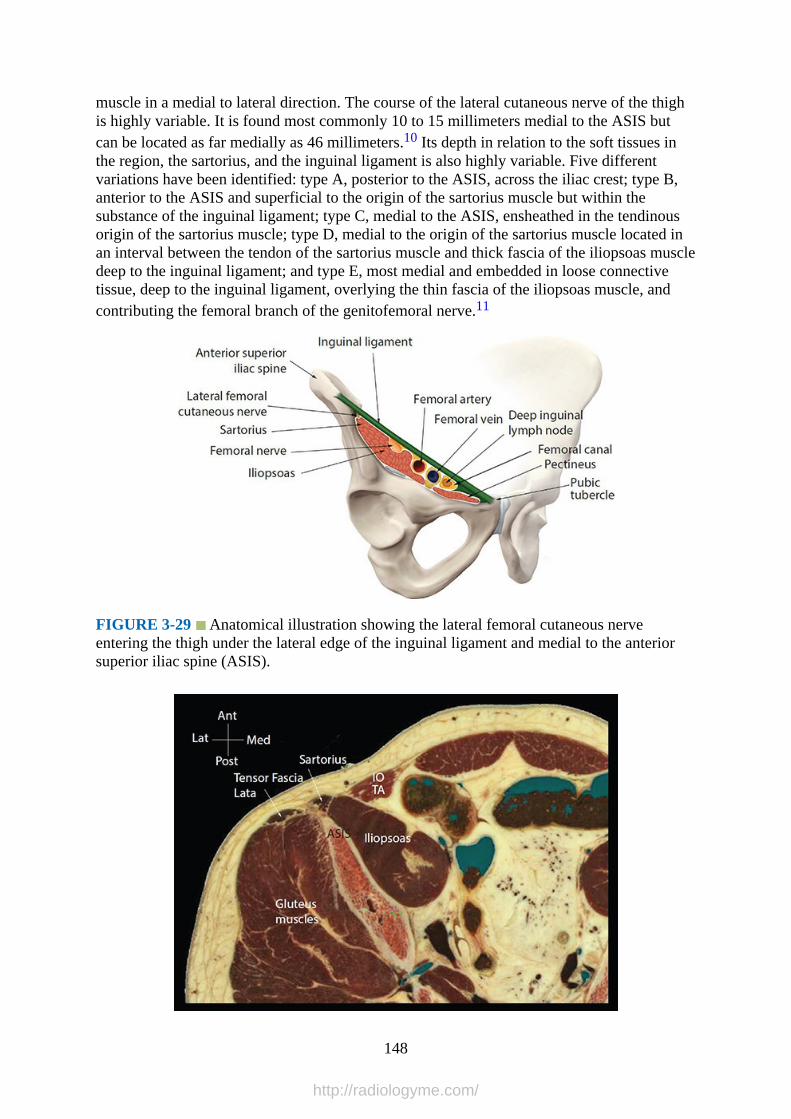
muscle in a medial to lateral direction. The course of the lateral cutaneous nerve of the thighis highly variable. It is found most commonly 10 to 15 millimeters medial to the ASIS butcan be located as far medially as 46 millimeters.10 Its depth in relation to the soft tissues inthe region, the sartorius, and the inguinal ligament is also highly variable. Five differentvariations have been identified: type A, posterior to the ASIS, across the iliac crest; type B,anterior to the ASIS and superficial to the origin of the sartorius muscle but within thesubstance of the inguinal ligament; type C, medial to the ASIS, ensheathed in the tendinousorigin of the sartorius muscle; type D, medial to the origin of the sartorius muscle located inan interval between the tendon of the sartorius muscle and thick fascia of the iliopsoas muscledeep to the inguinal ligament; and type E, most medial and embedded in loose connectivetissue, deep to the inguinal ligament, overlying the thin fascia of the iliopsoas muscle, andcontributing the femoral branch of the genitofemoral nerve.11
FIGURE 3-29 Anatomical illustration showing the lateral femoral cutaneous nerveentering the thigh under the lateral edge of the inguinal ligament and medial to the anteriorsuperior iliac spine (ASIS).
148
http://radiologyme.com/

FIGURE 3-30 Transverse anatomical section of the upper thigh and lower abdomen a fewcentimeters distal to the anterior superior iliac spine showing the anatomy related to thelateral femoral cutaneous nerve (the nerve is not seen in this image), which usually lies on theanterior surface of the sartorius muscle or in the groove between the sartorius and the iliacusmuscles at this level. IO, internal oblique muscle; TA, transversus abdominis muscle.
Magnetic Resonance Imaging Anatomy of the Lateral Cutaneous Nerve of theThigh
Fig. 3-31
FIGURE 3-31 Transverse (axial) MRI image of the upper thigh showing the lateralcutaneous nerve of the thigh.
Lateral Cutaneous Nerve of the Thigh Ultrasound Scan Technique
1.Position:a.Patient: Supine positionb.Operator and ultrasound machine: The operator may stand on the ipsilateral side of
the intervention and face the patient’s head. The ultrasound machine is placed on thesame side between the operator and the patient’s head. Alternatively, the operator maychoose to position the ultrasound machine depending on his or her “handedness.”Right-handed operators who hold ultrasound transducer with their left hand and carryout needle interventions with their right hand should stand on the right side of thepatient and position the ultrasound machine on the opposite side of the patient. This isvice versa for left-handed operators.
2.Transducer selection: High-frequency (15-8 or 17-5 MHz) linear array transducer.3.Scan technique: The transducer is placed with one edge on the ASIS. The medial edge of
the transducer is rotated slightly caudally such that the transducer is parallel to theinguinal ligament. Slide the transducer medially along the inguinal ligament (Figs. 3-32 to3-34). The ASIS appears as a hyperechoic line with an acoustic shadow. Immediately
149
http://radiologyme.com/
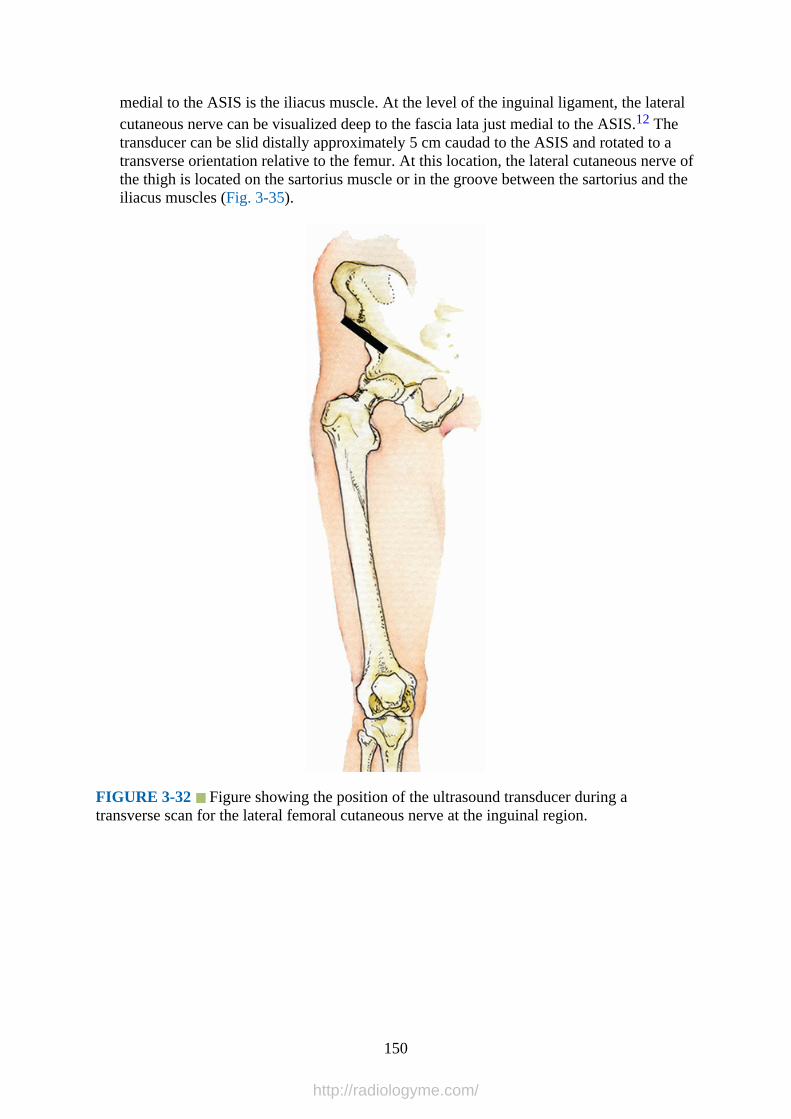
medial to the ASIS is the iliacus muscle. At the level of the inguinal ligament, the lateralcutaneous nerve can be visualized deep to the fascia lata just medial to the ASIS.12 Thetransducer can be slid distally approximately 5 cm caudad to the ASIS and rotated to atransverse orientation relative to the femur. At this location, the lateral cutaneous nerve ofthe thigh is located on the sartorius muscle or in the groove between the sartorius and theiliacus muscles (Fig. 3-35).
FIGURE 3-32 Figure showing the position of the ultrasound transducer during atransverse scan for the lateral femoral cutaneous nerve at the inguinal region.
150
http://radiologyme.com/
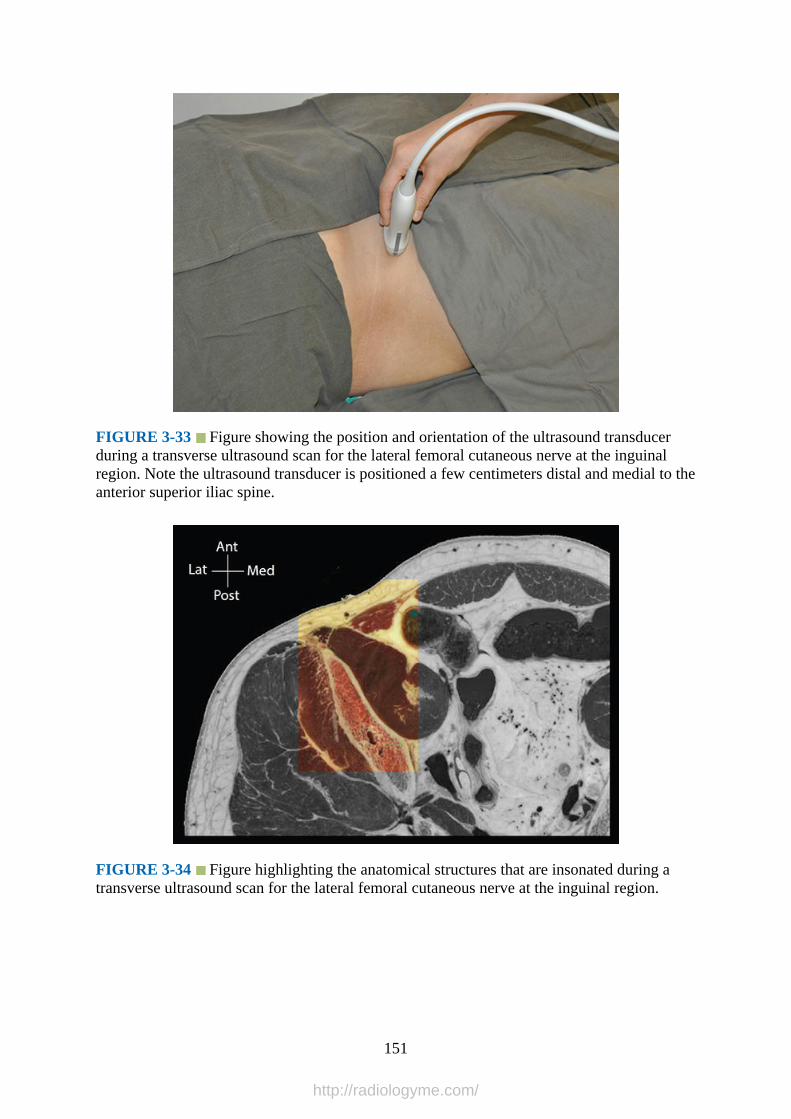
FIGURE 3-33 Figure showing the position and orientation of the ultrasound transducerduring a transverse ultrasound scan for the lateral femoral cutaneous nerve at the inguinalregion. Note the ultrasound transducer is positioned a few centimeters distal and medial to theanterior superior iliac spine.
FIGURE 3-34 Figure highlighting the anatomical structures that are insonated during atransverse ultrasound scan for the lateral femoral cutaneous nerve at the inguinal region.
151
http://radiologyme.com/
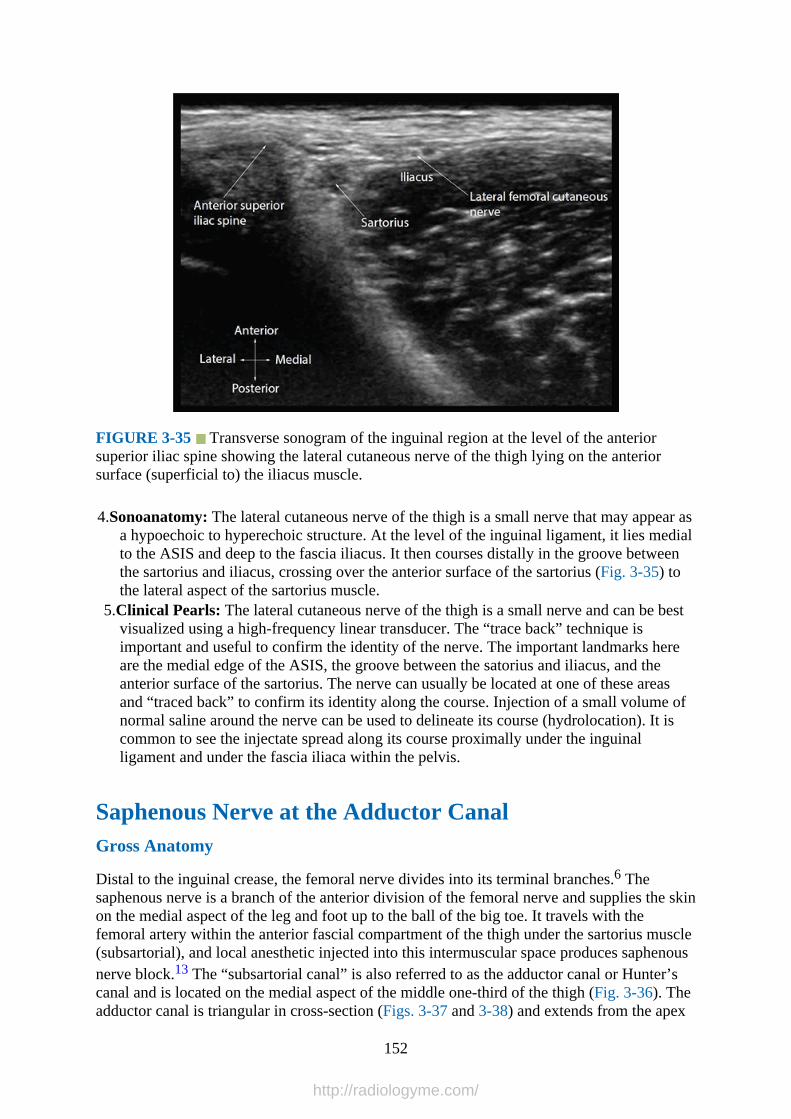
FIGURE 3-35 Transverse sonogram of the inguinal region at the level of the anteriorsuperior iliac spine showing the lateral cutaneous nerve of the thigh lying on the anteriorsurface (superficial to) the iliacus muscle.
4.Sonoanatomy: The lateral cutaneous nerve of the thigh is a small nerve that may appear asa hypoechoic to hyperechoic structure. At the level of the inguinal ligament, it lies medialto the ASIS and deep to the fascia iliacus. It then courses distally in the groove betweenthe sartorius and iliacus, crossing over the anterior surface of the sartorius (Fig. 3-35) tothe lateral aspect of the sartorius muscle.
5.Clinical Pearls: The lateral cutaneous nerve of the thigh is a small nerve and can be bestvisualized using a high-frequency linear transducer. The “trace back” technique isimportant and useful to confirm the identity of the nerve. The important landmarks hereare the medial edge of the ASIS, the groove between the satorius and iliacus, and theanterior surface of the sartorius. The nerve can usually be located at one of these areasand “traced back” to confirm its identity along the course. Injection of a small volume ofnormal saline around the nerve can be used to delineate its course (hydrolocation). It iscommon to see the injectate spread along its course proximally under the inguinalligament and under the fascia iliaca within the pelvis.
Saphenous Nerve at the Adductor CanalGross Anatomy
Distal to the inguinal crease, the femoral nerve divides into its terminal branches.6 Thesaphenous nerve is a branch of the anterior division of the femoral nerve and supplies the skinon the medial aspect of the leg and foot up to the ball of the big toe. It travels with thefemoral artery within the anterior fascial compartment of the thigh under the sartorius muscle(subsartorial), and local anesthetic injected into this intermuscular space produces saphenousnerve block.13 The “subsartorial canal” is also referred to as the adductor canal or Hunter’scanal and is located on the medial aspect of the middle one-third of the thigh (Fig. 3-36). Theadductor canal is triangular in cross-section (Figs. 3-37 and 3-38) and extends from the apex
152
http://radiologyme.com/

of the femoral triangle, above, to the tendinous opening in the adductor magnus muscle(adductor hiatus), below. The anterior wall of the adductor canal is formed by the vastusmedialis muscle; the posterior wall or floor is formed by the adductor longus, above, and theadductor magnus, below; and the roof or medial wall is formed by a strong fibrous membraneunderlying the sartorius muscle (Figs. 3-37 and 3-38).
The adductor canal contains the following structures: femoral artery and vein, saphenousnerve, anterior and posterior division of the obturator nerve, and nerve to vastus medialis(Fig. 3-38). The femoral vein lies posterior to the femoral artery in the upper part of theadductor canal and lateral to the artery in the lower part of the canal (Fig. 3-39). Thesaphenous nerve crosses the femoral artery anteriorly from a lateral to medial direction. The“subsartorial plexus” of nerves lie on the fibrous roof of the adductor canal deep to thesartorius muscle (Fig. 3-38) and are formed by branches from the medial cutaneous nerve ofthe thigh, saphenous nerve, and anterior division of the obturator nerve. It supplies theneighboring skin and overlying fascia lata. The femoral artery exits the adductor canalthrough the adductor hiatus and continues as the popliteal artery. At the adductor hiatus, thesaphenous nerve leaves the femoral artery and travels along the lower edge of the aponeurosisof the canal and is closely related to the saphenous branch of the descending genicularartery.14 The saphenous nerve then courses distally along the medial side of the knee deep tothe sartorius and pierces the fascia lata, between the tendons of the sartorius and gracilismuscles.
FIGURE 3-36 Transverse anatomical section of the midthigh showing the anatomy of theanterior, medial, and posterior compartment of the thigh.
153
http://radiologyme.com/
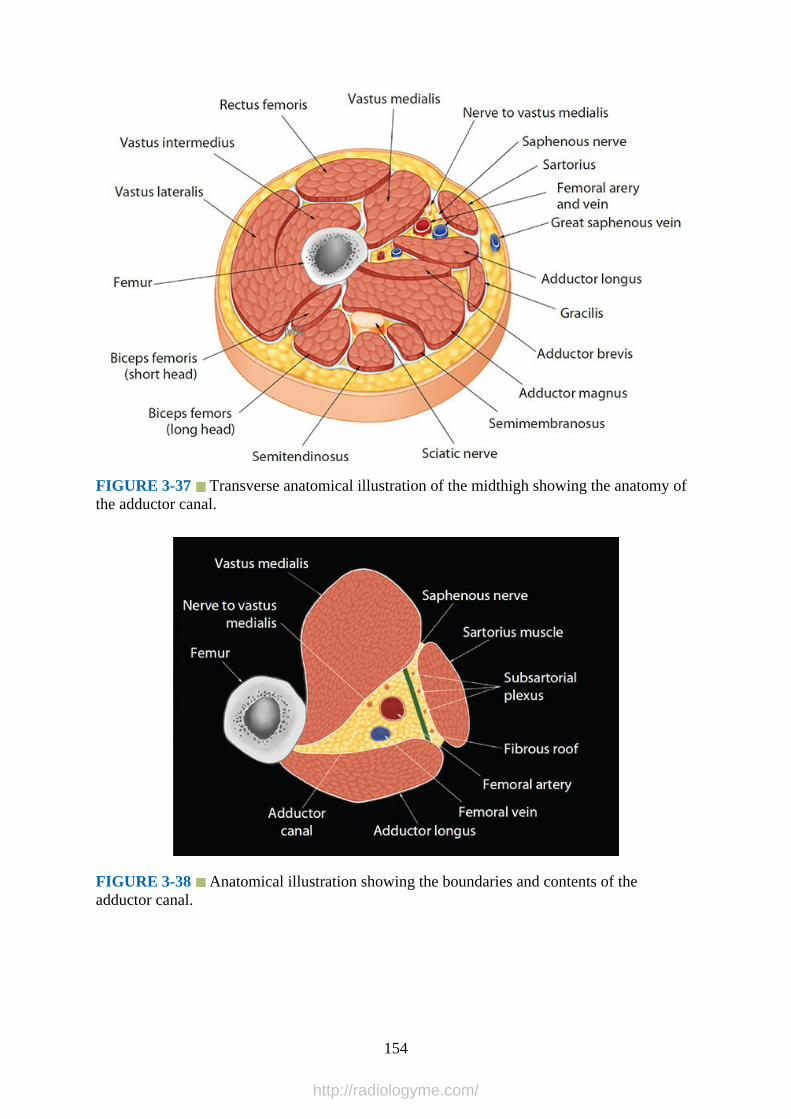
FIGURE 3-37 Transverse anatomical illustration of the midthigh showing the anatomy ofthe adductor canal.
FIGURE 3-38 Anatomical illustration showing the boundaries and contents of theadductor canal.
154
http://radiologyme.com/

FIGURE 3-39 Anatomical illustration showing the course of the saphenous nerve relativeto the femoral vessels within the adductor canal.
Computed Tomography Anatomy of the Midfemoral/Adductor Canal Region
Fig. 3-40
FIGURE 3-40 Transverse (axial) CT of the midthigh showing the relation and contents ofthe adductor canal.
Magnetic Resonance Imaging Anatomy of the Midfemoral/Adductor CanalRegion
155
http://radiologyme.com/

Fig. 3-41
FIGURE 3-41 Transverse (axial) MRI image of the midthigh showing the relation andcontents of the adductor canal.
Midfemoral/Adductor Canal Region Ultrasound Scan Technique
1.Position:a.Patient: Supine position with the ipsilateral hip slightly externally rotated and knee
slightly flexed.b.Operator and ultrasound machine: The operator may choose to position the
ultrasound machine based on his or her “handedness.” Right-handed operators whohold ultrasound probes with their left hand and carry out needle interventions withtheir right hand should stand on the right side of the patient and position theultrasound machine on the opposite side of the patient. This is vice versa for left-handed operators.
2.Transducer selection: High-frequency (15-8 MHz) linear array transducer. A curved arraylow-frequency (5-2 MHz) transducer can also be used if one wishes to visualize thesciatic nerve, which is located at a depth, at the same time.
3.Scan technique: The ultrasound transducer is placed on a medial aspect of the thigh of themiddle third of the thigh (midfemoral region) in the transverse orientation (Figs. 3-42 to3-46). The reference structure to identify is the femoral artery in the transverse view.Thereafter slide the transducer along the medial border of the sartorius to visualize theartery at its most superficial location and just proximal to the point where the femoralartery passes the adductor hiatus to become the popliteal artery.15 The sartorius istypically triangular/elliptical in shape when imaged transversely. Beneath the sartorius,the femoral artery and veins can be imaged and followed until they pass through theadductor hiatus.
156
http://radiologyme.com/
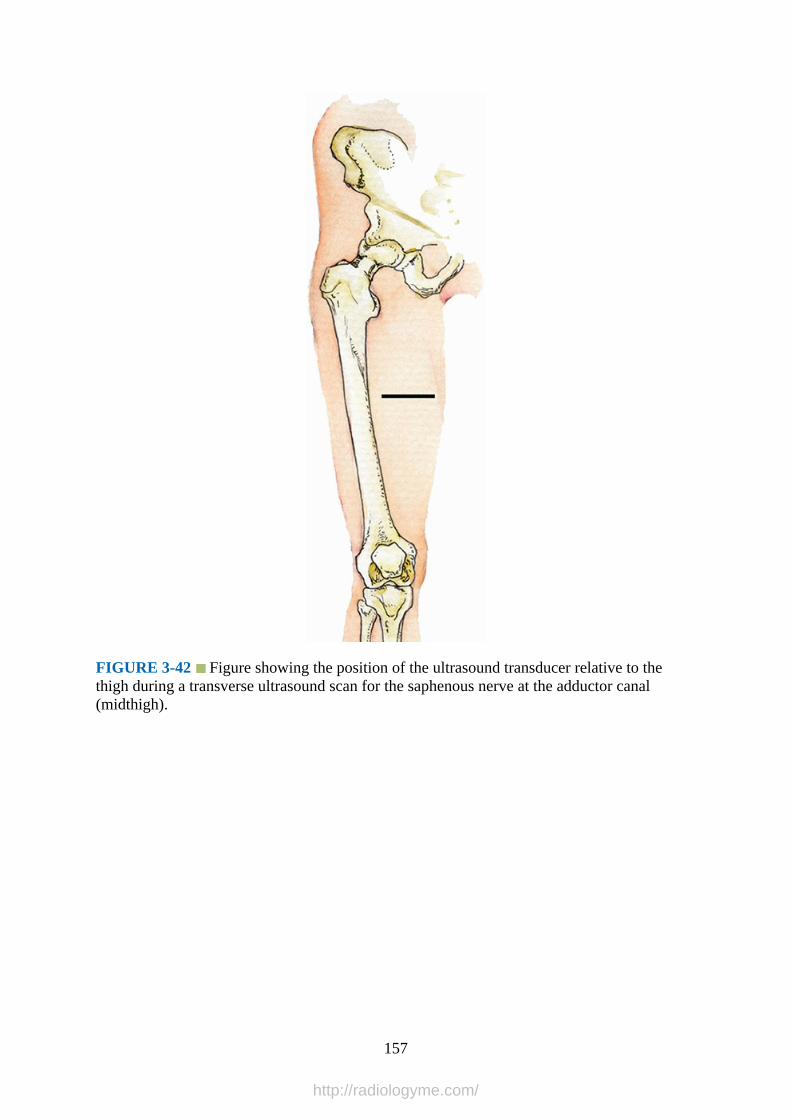
FIGURE 3-42 Figure showing the position of the ultrasound transducer relative to thethigh during a transverse ultrasound scan for the saphenous nerve at the adductor canal(midthigh).
157
http://radiologyme.com/

FIGURE 3-43 Figure showing the position and orientation of the ultrasound transducerduring a transverse ultrasound scan of the adductor canal at the midthigh.
FIGURE 3-44 Figure highlighting the anatomical structures that are insonated during atransverse ultrasound scan of the adductor canal at the midthigh.
158
http://radiologyme.com/
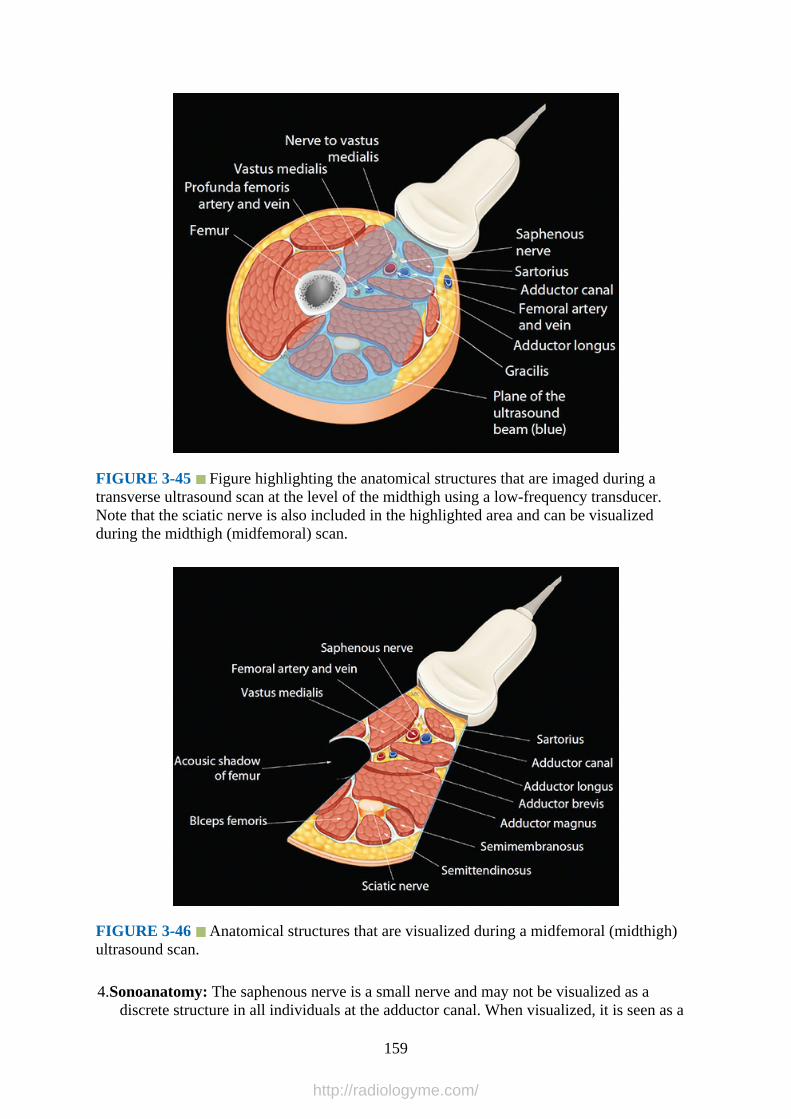
FIGURE 3-45 Figure highlighting the anatomical structures that are imaged during atransverse ultrasound scan at the level of the midthigh using a low-frequency transducer.Note that the sciatic nerve is also included in the highlighted area and can be visualizedduring the midthigh (midfemoral) scan.
FIGURE 3-46 Anatomical structures that are visualized during a midfemoral (midthigh)ultrasound scan.
4.Sonoanatomy: The saphenous nerve is a small nerve and may not be visualized as adiscrete structure in all individuals at the adductor canal. When visualized, it is seen as a
159
http://radiologyme.com/
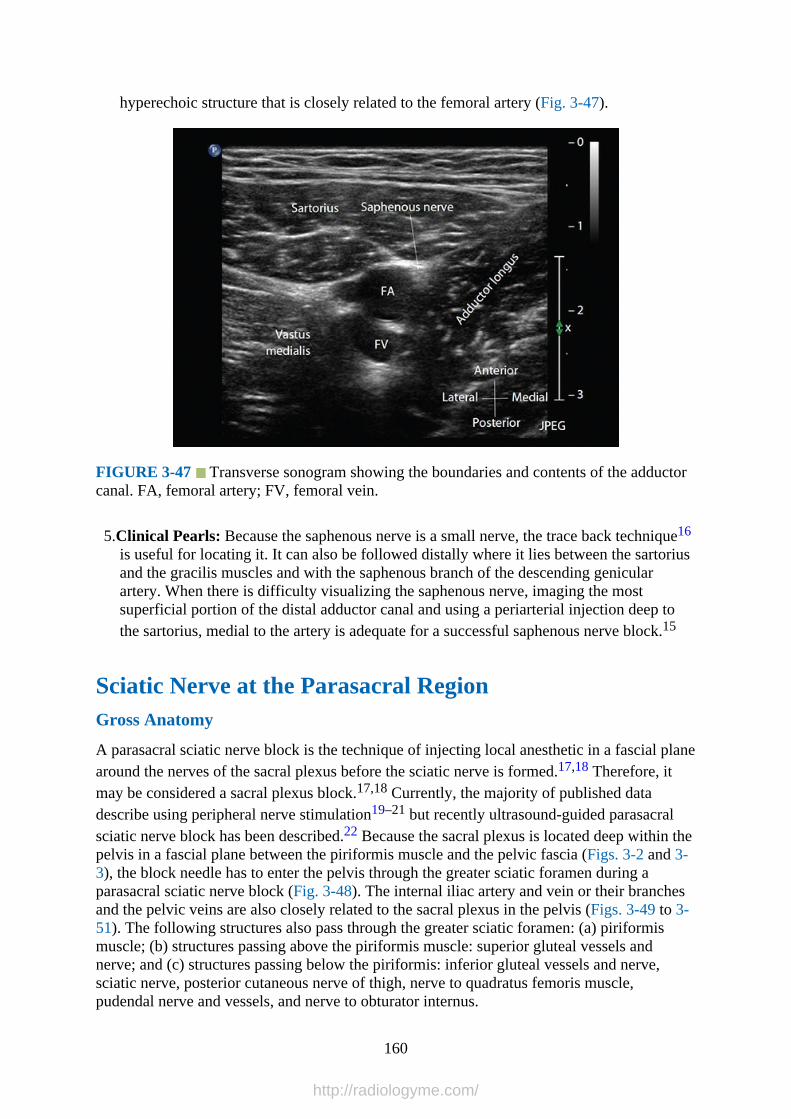
hyperechoic structure that is closely related to the femoral artery (Fig. 3-47).
FIGURE 3-47 Transverse sonogram showing the boundaries and contents of the adductorcanal. FA, femoral artery; FV, femoral vein.
5.Clinical Pearls: Because the saphenous nerve is a small nerve, the trace back technique16
is useful for locating it. It can also be followed distally where it lies between the sartoriusand the gracilis muscles and with the saphenous branch of the descending genicularartery. When there is difficulty visualizing the saphenous nerve, imaging the mostsuperficial portion of the distal adductor canal and using a periarterial injection deep tothe sartorius, medial to the artery is adequate for a successful saphenous nerve block.15
Sciatic Nerve at the Parasacral RegionGross Anatomy
A parasacral sciatic nerve block is the technique of injecting local anesthetic in a fascial planearound the nerves of the sacral plexus before the sciatic nerve is formed.17,18 Therefore, itmay be considered a sacral plexus block.17,18 Currently, the majority of published datadescribe using peripheral nerve stimulation19–21 but recently ultrasound-guided parasacralsciatic nerve block has been described.22 Because the sacral plexus is located deep within thepelvis in a fascial plane between the piriformis muscle and the pelvic fascia (Figs. 3-2 and 3-3), the block needle has to enter the pelvis through the greater sciatic foramen during aparasacral sciatic nerve block (Fig. 3-48). The internal iliac artery and vein or their branchesand the pelvic veins are also closely related to the sacral plexus in the pelvis (Figs. 3-49 to 3-51). The following structures also pass through the greater sciatic foramen: (a) piriformismuscle; (b) structures passing above the piriformis muscle: superior gluteal vessels andnerve; and (c) structures passing below the piriformis: inferior gluteal vessels and nerve,sciatic nerve, posterior cutaneous nerve of thigh, nerve to quadratus femoris muscle,pudendal nerve and vessels, and nerve to obturator internus.
160
http://radiologyme.com/

FIGURE 3-48 Anatomical illustration showing the sacral plexus (within the pelvis)formation of the sciatic nerve and how it exits the pelvis through the greater sciatic foramento enter the gluteal region. Note in this anatomical section one of the components of thesciatic nerve is seen to exit the pelvis by traversing the piriformis muscle to join the othercomponent in the infrapiriformis fossa (a normal anatomical variation).
FIGURE 3-49 Sagittal oblique CT image demonstrating the sciatic nerve between theilium and ischium (greater sciatic foramen).
161
http://radiologyme.com/
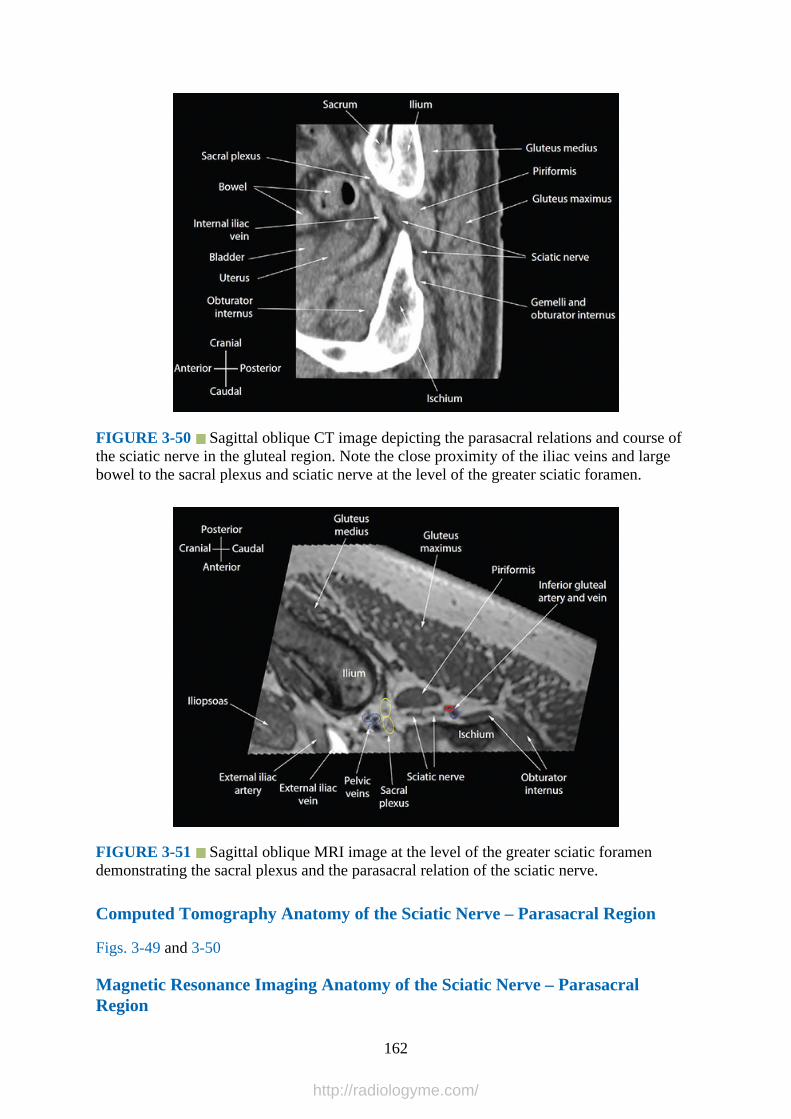
FIGURE 3-50 Sagittal oblique CT image depicting the parasacral relations and course ofthe sciatic nerve in the gluteal region. Note the close proximity of the iliac veins and largebowel to the sacral plexus and sciatic nerve at the level of the greater sciatic foramen.
FIGURE 3-51 Sagittal oblique MRI image at the level of the greater sciatic foramendemonstrating the sacral plexus and the parasacral relation of the sciatic nerve.
Computed Tomography Anatomy of the Sciatic Nerve – Parasacral Region
Figs. 3-49 and 3-50
Magnetic Resonance Imaging Anatomy of the Sciatic Nerve – ParasacralRegion
162
http://radiologyme.com/
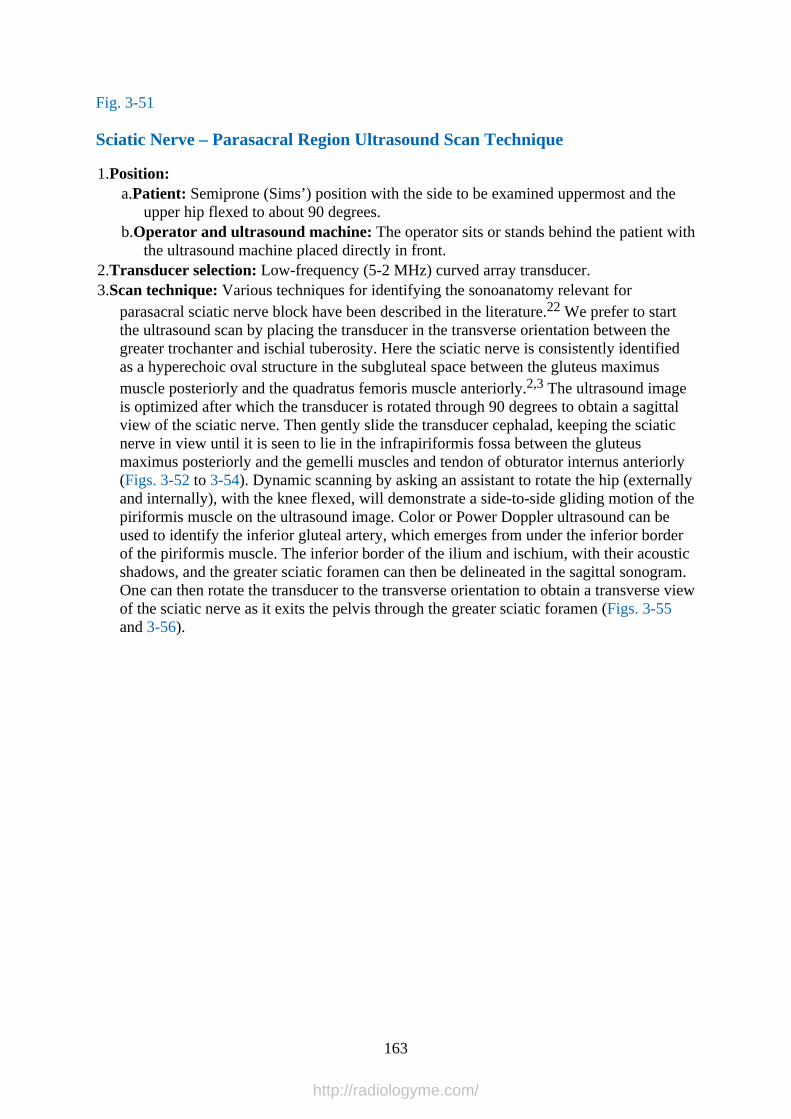
Fig. 3-51
Sciatic Nerve – Parasacral Region Ultrasound Scan Technique
1.Position:a.Patient: Semiprone (Sims’) position with the side to be examined uppermost and the
upper hip flexed to about 90 degrees.b.Operator and ultrasound machine: The operator sits or stands behind the patient with
the ultrasound machine placed directly in front.2.Transducer selection: Low-frequency (5-2 MHz) curved array transducer.3.Scan technique: Various techniques for identifying the sonoanatomy relevant for
parasacral sciatic nerve block have been described in the literature.22 We prefer to startthe ultrasound scan by placing the transducer in the transverse orientation between thegreater trochanter and ischial tuberosity. Here the sciatic nerve is consistently identifiedas a hyperechoic oval structure in the subgluteal space between the gluteus maximusmuscle posteriorly and the quadratus femoris muscle anteriorly.2,3 The ultrasound imageis optimized after which the transducer is rotated through 90 degrees to obtain a sagittalview of the sciatic nerve. Then gently slide the transducer cephalad, keeping the sciaticnerve in view until it is seen to lie in the infrapiriformis fossa between the gluteusmaximus posteriorly and the gemelli muscles and tendon of obturator internus anteriorly(Figs. 3-52 to 3-54). Dynamic scanning by asking an assistant to rotate the hip (externallyand internally), with the knee flexed, will demonstrate a side-to-side gliding motion of thepiriformis muscle on the ultrasound image. Color or Power Doppler ultrasound can beused to identify the inferior gluteal artery, which emerges from under the inferior borderof the piriformis muscle. The inferior border of the ilium and ischium, with their acousticshadows, and the greater sciatic foramen can then be delineated in the sagittal sonogram.One can then rotate the transducer to the transverse orientation to obtain a transverse viewof the sciatic nerve as it exits the pelvis through the greater sciatic foramen (Figs. 3-55and 3-56).
163
http://radiologyme.com/
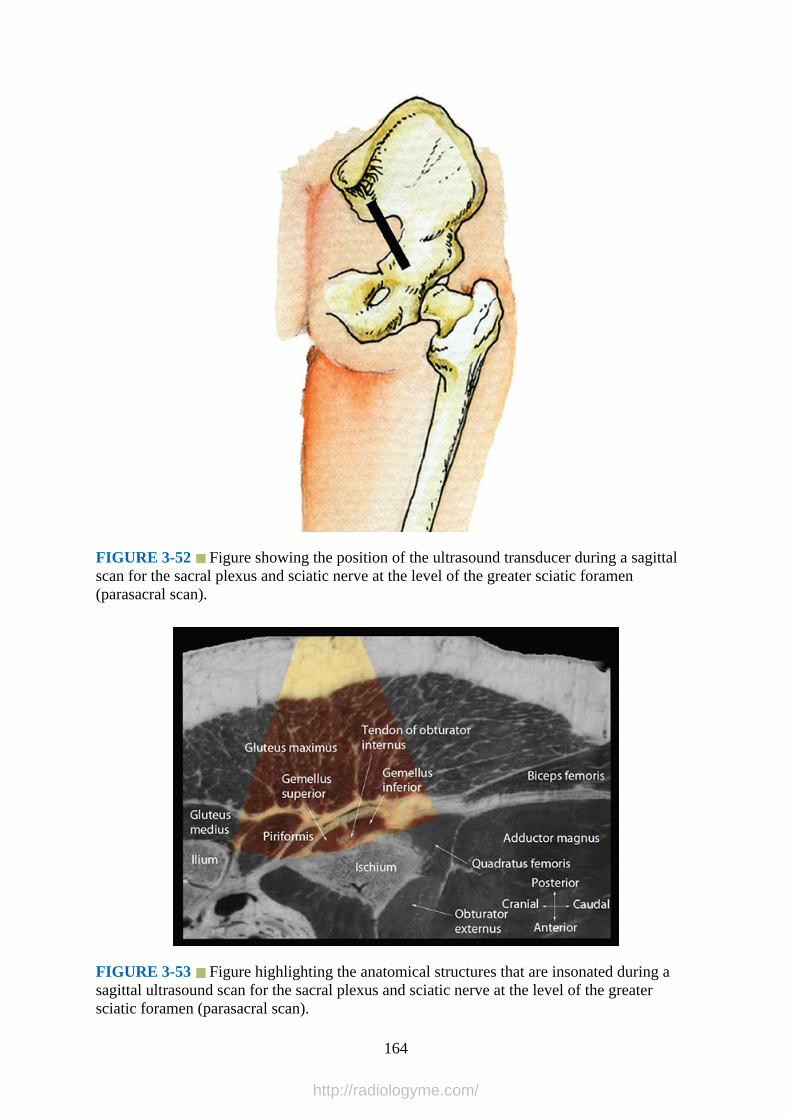
FIGURE 3-52 Figure showing the position of the ultrasound transducer during a sagittalscan for the sacral plexus and sciatic nerve at the level of the greater sciatic foramen(parasacral scan).
FIGURE 3-53 Figure highlighting the anatomical structures that are insonated during asagittal ultrasound scan for the sacral plexus and sciatic nerve at the level of the greatersciatic foramen (parasacral scan).
164
http://radiologyme.com/

FIGURE 3-54 Sagittal sonogram of the sciatic nerve as it exits the pelvis through thegreater sciatic foramen. Accompanying photograph shows the position and orientation of theultrasound transducer during a sagittal ultrasound scan for the sacral plexus and sciatic nerveat the level of the greater sciatic foramen (parasacral scan). RPS, retroperitoneal space.
FIGURE 3-55 Figure showing the position of the ultrasound transducer during atransverse scan for the sciatic nerve at the level of the greater sciatic foramen (parasacralscan).
165
http://radiologyme.com/
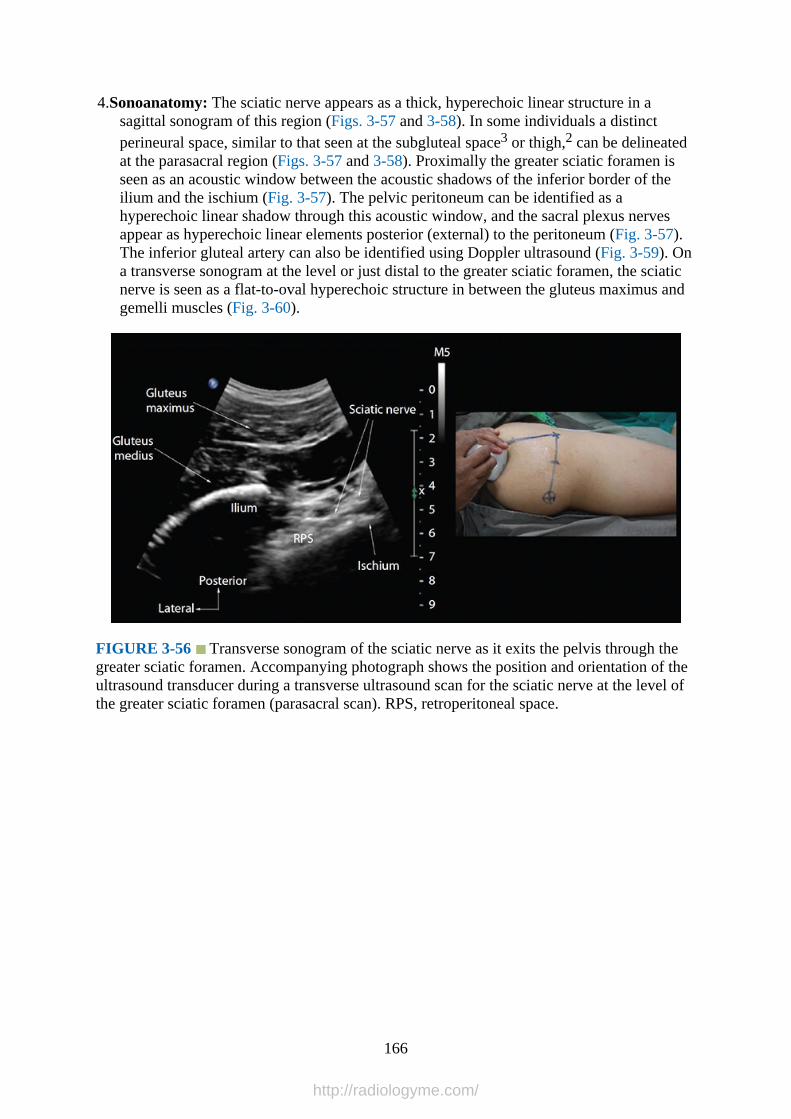
4.Sonoanatomy: The sciatic nerve appears as a thick, hyperechoic linear structure in asagittal sonogram of this region (Figs. 3-57 and 3-58). In some individuals a distinctperineural space, similar to that seen at the subgluteal space3 or thigh,2 can be delineatedat the parasacral region (Figs. 3-57 and 3-58). Proximally the greater sciatic foramen isseen as an acoustic window between the acoustic shadows of the inferior border of theilium and the ischium (Fig. 3-57). The pelvic peritoneum can be identified as ahyperechoic linear shadow through this acoustic window, and the sacral plexus nervesappear as hyperechoic linear elements posterior (external) to the peritoneum (Fig. 3-57).The inferior gluteal artery can also be identified using Doppler ultrasound (Fig. 3-59). Ona transverse sonogram at the level or just distal to the greater sciatic foramen, the sciaticnerve is seen as a flat-to-oval hyperechoic structure in between the gluteus maximus andgemelli muscles (Fig. 3-60).
FIGURE 3-56 Transverse sonogram of the sciatic nerve as it exits the pelvis through thegreater sciatic foramen. Accompanying photograph shows the position and orientation of theultrasound transducer during a transverse ultrasound scan for the sciatic nerve at the level ofthe greater sciatic foramen (parasacral scan). RPS, retroperitoneal space.
166
http://radiologyme.com/
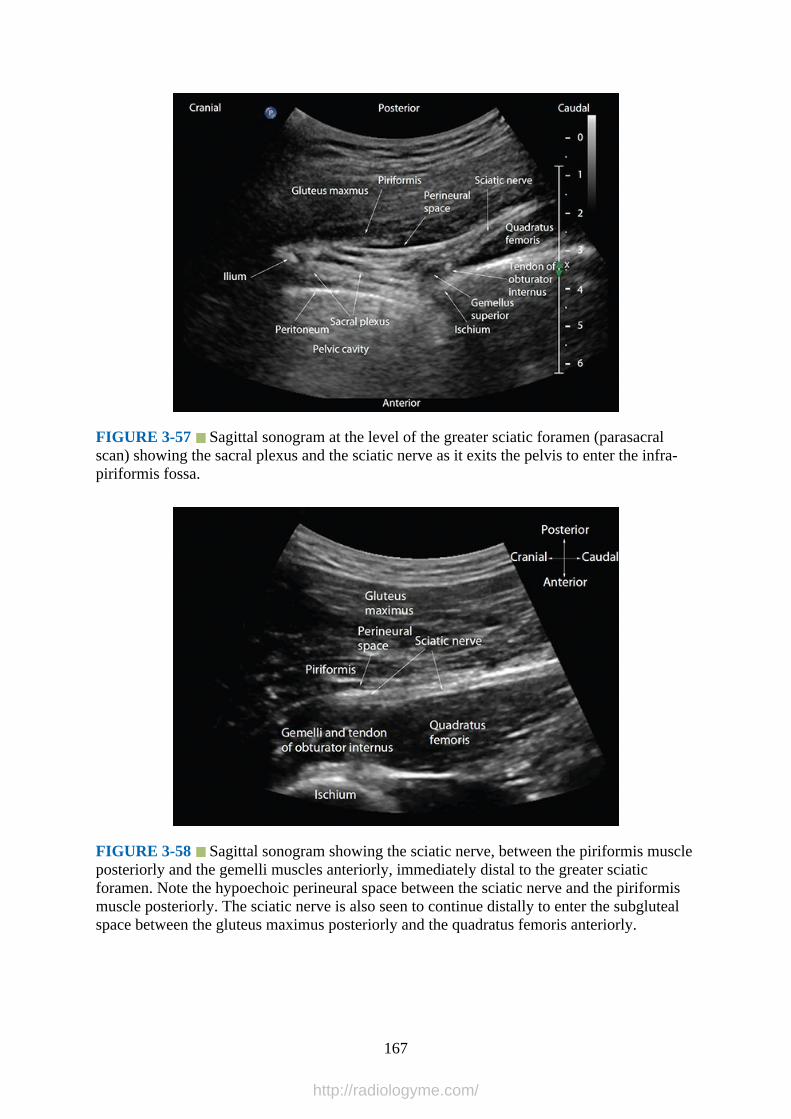
FIGURE 3-57 Sagittal sonogram at the level of the greater sciatic foramen (parasacralscan) showing the sacral plexus and the sciatic nerve as it exits the pelvis to enter the infra-piriformis fossa.
FIGURE 3-58 Sagittal sonogram showing the sciatic nerve, between the piriformis muscleposteriorly and the gemelli muscles anteriorly, immediately distal to the greater sciaticforamen. Note the hypoechoic perineural space between the sciatic nerve and the piriformismuscle posteriorly. The sciatic nerve is also seen to continue distally to enter the subglutealspace between the gluteus maximus posteriorly and the quadratus femoris anteriorly.
167
http://radiologyme.com/
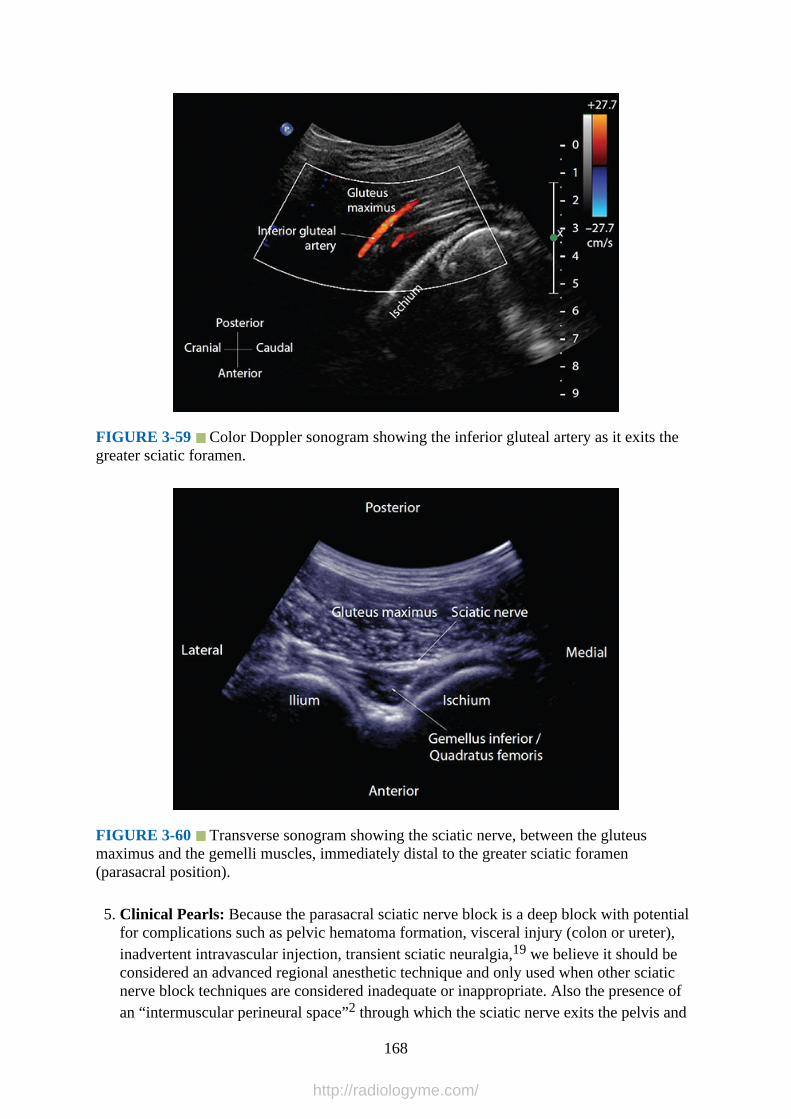
FIGURE 3-59 Color Doppler sonogram showing the inferior gluteal artery as it exits thegreater sciatic foramen.
FIGURE 3-60 Transverse sonogram showing the sciatic nerve, between the gluteusmaximus and the gemelli muscles, immediately distal to the greater sciatic foramen(parasacral position).
5. Clinical Pearls: Because the parasacral sciatic nerve block is a deep block with potentialfor complications such as pelvic hematoma formation, visceral injury (colon or ureter),inadvertent intravascular injection, transient sciatic neuralgia,19 we believe it should beconsidered an advanced regional anesthetic technique and only used when other sciaticnerve block techniques are considered inadequate or inappropriate. Also the presence ofan “intermuscular perineural space”2 through which the sciatic nerve exits the pelvis and
168
http://radiologyme.com/

descends caudally deserves further investigation as a site for local anesthetic injectionbecause it can be identified using ultrasound imaging (Figs. 3-57 and 3-58). We believethat local anesthetic injected into this perineural space close to the greater sciatic foramenwill not only anesthetize the sacral plexus nerves, but also the sciatic nerve because ofcranial and caudal spread of the local anesthetic through the intermuscular “conduit.”This may also be safer than inserting the block needle into the pelvis to anesthetize thesacral plexus nerves during a parasacral sciatic nerve block. Future research to validatethis hypothesis in clinical practice is warranted.
Sciatic Nerve – At the Subgluteal RegionGross Anatomy
Once the sciatic nerve exits the greater sciatic foramen, it enters the subgluteal space belowthe piriformis muscle. It then descends on the dorsal surface of the ischium, together with theposterior cutaneous nerve of the thigh, lying on the posterior surface of the gemellus superiormuscle, tendon of obturator internus, gemellus inferior muscle, and the quadratus femorismuscle (in a cranial to caudal direction) before it enters the hollow between the greatertrochanter and the ischial tuberosity (Figs. 3-5 to 3-7).23 The “subgluteal space” is a well-defined anatomical space between the anterior surface of the gluteus maximus and theposterior surface of the quadratus femoris muscle (Fig. 3-61)23 and contains the sciatic nerve,posterior cutaneous nerve of the thigh, inferior gluteal vessels and nerve, nerve to the shortand long heads of the biceps femoris, the comitans artery and vein of the sciatic nerve, andthe ascending branch of the medial circumflex femoral artery (Fig. 3-7).23
FIGURE 3-61 Anatomical illustration showing the sciatic nerve at the subgluteal spacebetween the gluteus maximum muscle posteriorly and the quadratus femoris muscleanteriorly.
Computed Tomography Anatomy of the Sciatic Nerve – Subgluteal Region
169
http://radiologyme.com/
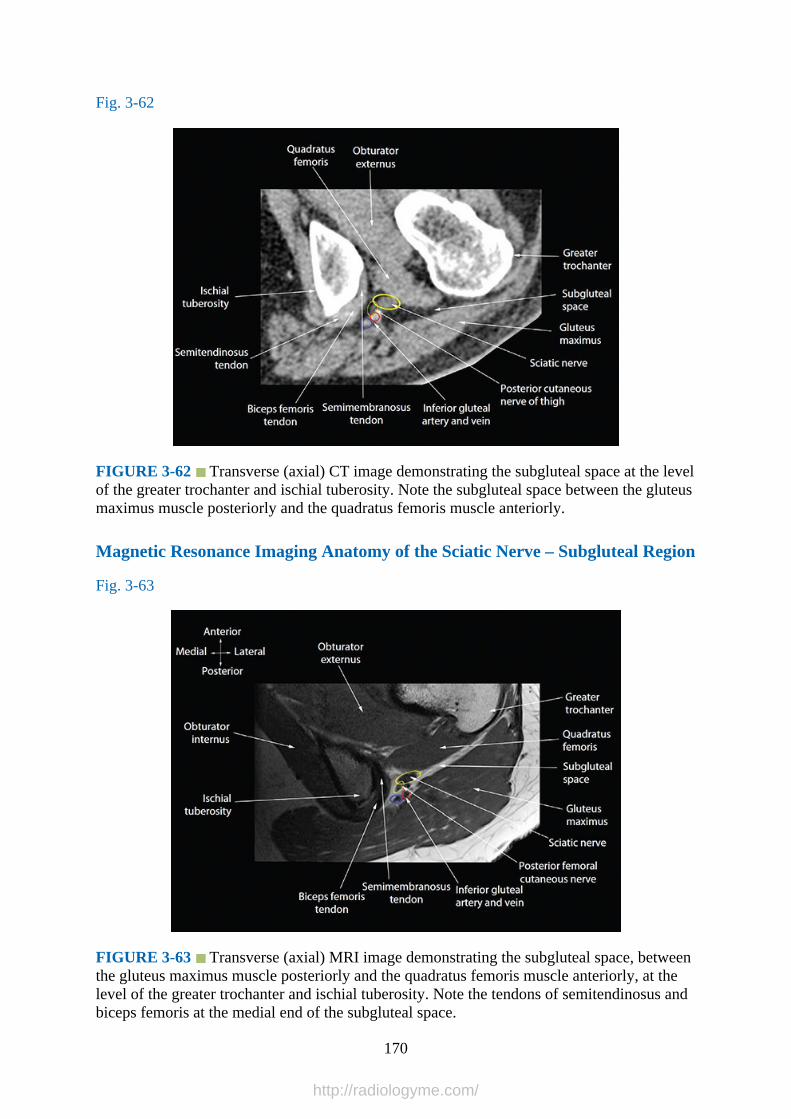
Fig. 3-62
FIGURE 3-62 Transverse (axial) CT image demonstrating the subgluteal space at the levelof the greater trochanter and ischial tuberosity. Note the subgluteal space between the gluteusmaximus muscle posteriorly and the quadratus femoris muscle anteriorly.
Magnetic Resonance Imaging Anatomy of the Sciatic Nerve – Subgluteal Region
Fig. 3-63
FIGURE 3-63 Transverse (axial) MRI image demonstrating the subgluteal space, betweenthe gluteus maximus muscle posteriorly and the quadratus femoris muscle anteriorly, at thelevel of the greater trochanter and ischial tuberosity. Note the tendons of semitendinosus andbiceps femoris at the medial end of the subgluteal space.
170
http://radiologyme.com/

Sciatic Nerve at the Subgluteal Region – Ultrasound Scan Technique
1.Position:a.Patient: Lateral position with the side to be examined uppermost (nondependent side)
and the hip and knees slightly flexed. It is also possible to position the patient in thesemiprone (Sims’) position.
b.Operator and ultrasound machine: The operator sits or stands behind the patient withthe ultrasound machine placed directly in front.
2.Transducer selection: Low-frequency (5-2 MHz) curved array transducer.3.Scan technique: The ultrasound transducer is placed parallel to a line joining the greater
trochanter and the ischial tuberosity (Figs. 3-64 to 3-66) to obtain a transverse image ofthe sciatic nerve in the subgluteal space. It may be necessary to slide the transducer in acranial to caudal direction to obtain an optimal image of the sciatic nerve. The greatertrochanter and the ischial tuberosity are visualized at the edges of the ultrasound image.They appear hyperechoic with a corresponding acoustic shadow and are key landmarksfor imaging this region. Rotating the transducer through 90 degrees produces a sagittalimage of the sciatic nerve and the subgluteal space.
FIGURE 3-64 Figure showing the position of the ultrasound transducer during a
171
http://radiologyme.com/
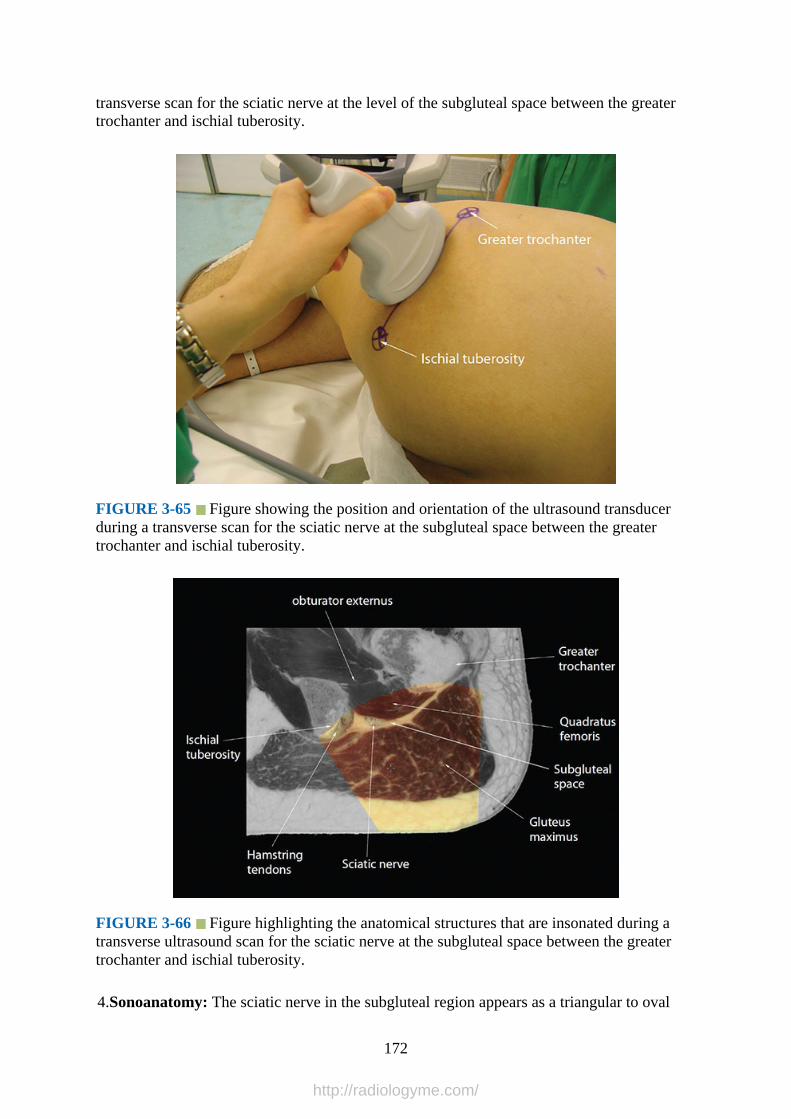
transverse scan for the sciatic nerve at the level of the subgluteal space between the greatertrochanter and ischial tuberosity.
FIGURE 3-65 Figure showing the position and orientation of the ultrasound transducerduring a transverse scan for the sciatic nerve at the subgluteal space between the greatertrochanter and ischial tuberosity.
FIGURE 3-66 Figure highlighting the anatomical structures that are insonated during atransverse ultrasound scan for the sciatic nerve at the subgluteal space between the greatertrochanter and ischial tuberosity.
4.Sonoanatomy: The sciatic nerve in the subgluteal region appears as a triangular to oval
172
http://radiologyme.com/
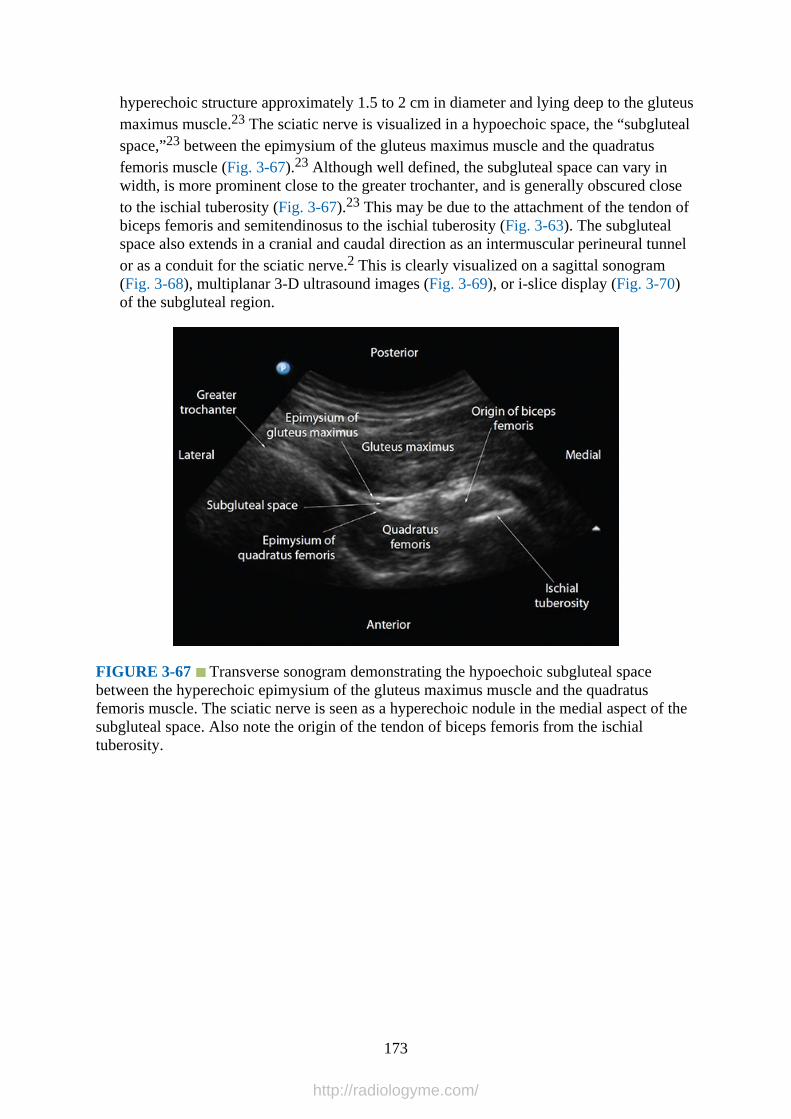
hyperechoic structure approximately 1.5 to 2 cm in diameter and lying deep to the gluteusmaximus muscle.23 The sciatic nerve is visualized in a hypoechoic space, the “subglutealspace,”23 between the epimysium of the gluteus maximus muscle and the quadratusfemoris muscle (Fig. 3-67).23 Although well defined, the subgluteal space can vary inwidth, is more prominent close to the greater trochanter, and is generally obscured closeto the ischial tuberosity (Fig. 3-67).23 This may be due to the attachment of the tendon ofbiceps femoris and semitendinosus to the ischial tuberosity (Fig. 3-63). The subglutealspace also extends in a cranial and caudal direction as an intermuscular perineural tunnelor as a conduit for the sciatic nerve.2 This is clearly visualized on a sagittal sonogram(Fig. 3-68), multiplanar 3-D ultrasound images (Fig. 3-69), or i-slice display (Fig. 3-70)of the subgluteal region.
FIGURE 3-67 Transverse sonogram demonstrating the hypoechoic subgluteal spacebetween the hyperechoic epimysium of the gluteus maximus muscle and the quadratusfemoris muscle. The sciatic nerve is seen as a hyperechoic nodule in the medial aspect of thesubgluteal space. Also note the origin of the tendon of biceps femoris from the ischialtuberosity.
173
http://radiologyme.com/
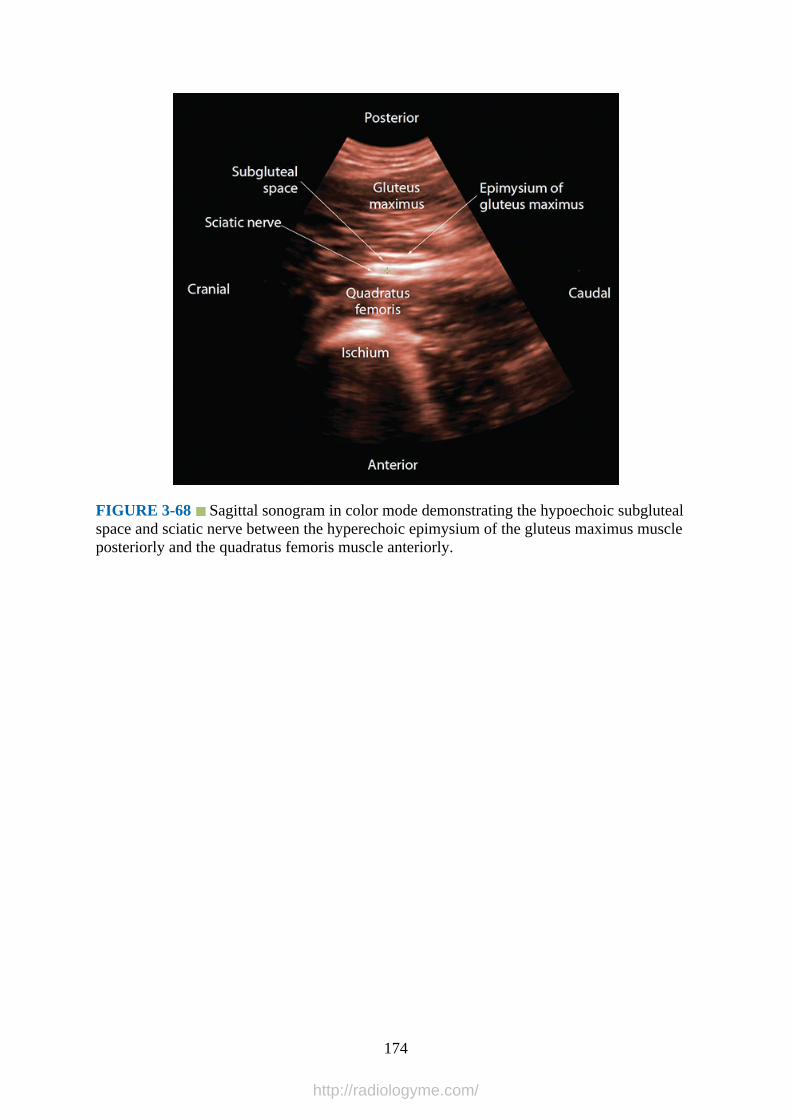
FIGURE 3-68 Sagittal sonogram in color mode demonstrating the hypoechoic subglutealspace and sciatic nerve between the hyperechoic epimysium of the gluteus maximus muscleposteriorly and the quadratus femoris muscle anteriorly.
174
http://radiologyme.com/
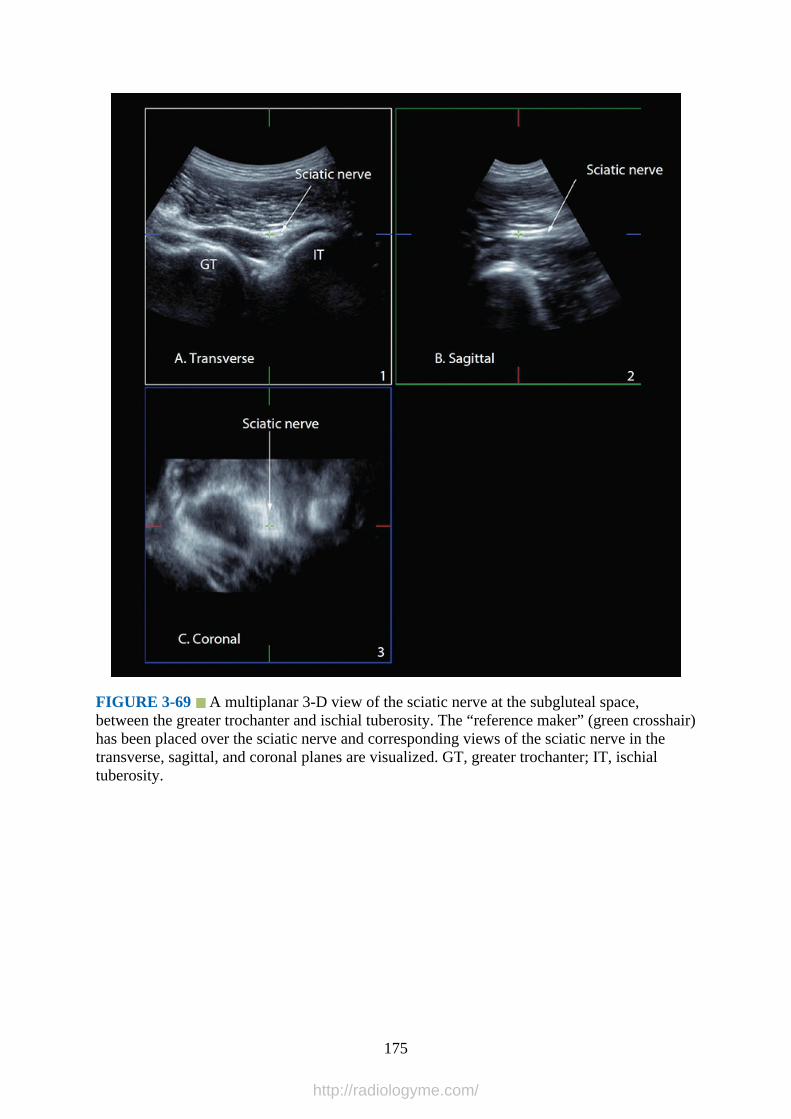
FIGURE 3-69 A multiplanar 3-D view of the sciatic nerve at the subgluteal space,between the greater trochanter and ischial tuberosity. The “reference maker” (green crosshair)has been placed over the sciatic nerve and corresponding views of the sciatic nerve in thetransverse, sagittal, and coronal planes are visualized. GT, greater trochanter; IT, ischialtuberosity.
175
http://radiologyme.com/

FIGURE 3-70 A transverse i-slice display of the sciatic nerve at the subgluteal space incolor (sepia tone) mode. In this figure 16 contiguous sagittal cuts of the sciatic nerve volume,which are 0.9 mm apart, are displayed.
5.Clinical Pearls: The sciatic nerve exhibits anisotropy at the subgluteal region and requiresslight tilting or rotation of the transducer during the ultrasound scan to clearly delineatethe nerve. Color or Power Doppler ultrasound is useful in delineating the inferior glutealartery, which is close to the sciatic nerve in the subgluteal space.
Sciatic Nerve at the Infragluteal RegionGross Anatomy
After the sciatic nerve descends from the subgluteal space, it enters the back of the thigh
176
http://radiologyme.com/
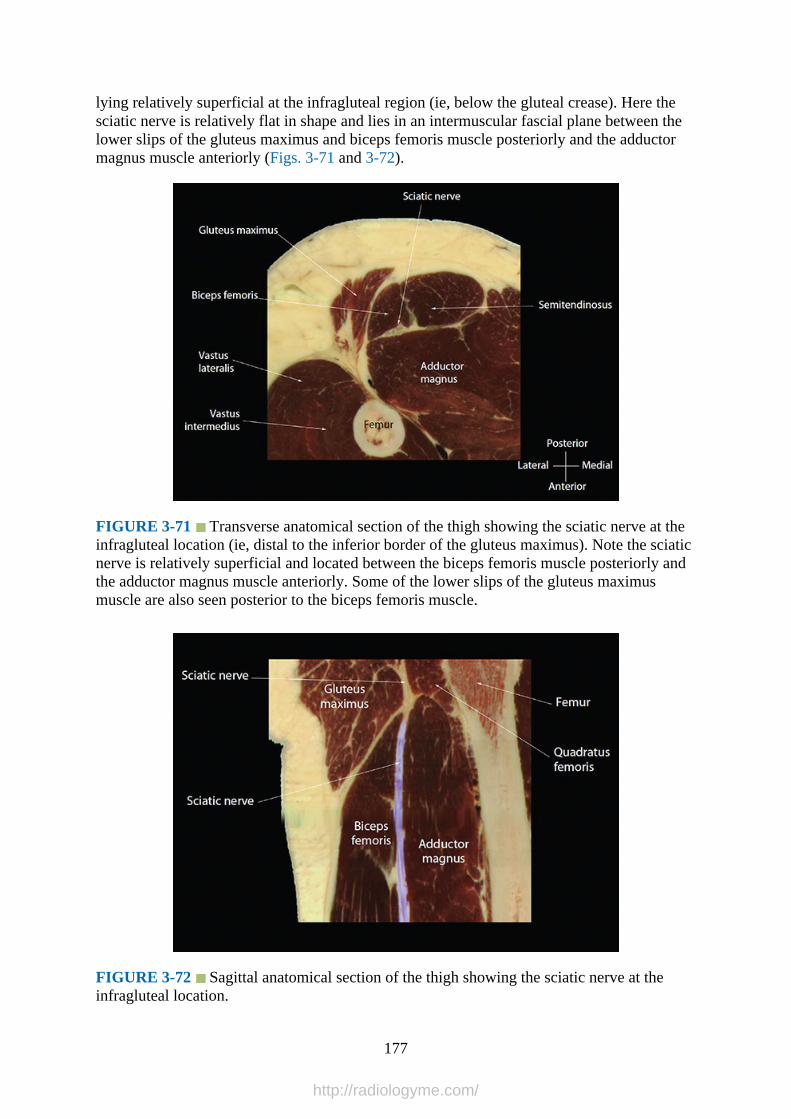
lying relatively superficial at the infragluteal region (ie, below the gluteal crease). Here thesciatic nerve is relatively flat in shape and lies in an intermuscular fascial plane between thelower slips of the gluteus maximus and biceps femoris muscle posteriorly and the adductormagnus muscle anteriorly (Figs. 3-71 and 3-72).
FIGURE 3-71 Transverse anatomical section of the thigh showing the sciatic nerve at theinfragluteal location (ie, distal to the inferior border of the gluteus maximus). Note the sciaticnerve is relatively superficial and located between the biceps femoris muscle posteriorly andthe adductor magnus muscle anteriorly. Some of the lower slips of the gluteus maximusmuscle are also seen posterior to the biceps femoris muscle.
FIGURE 3-72 Sagittal anatomical section of the thigh showing the sciatic nerve at theinfragluteal location.
177
http://radiologyme.com/
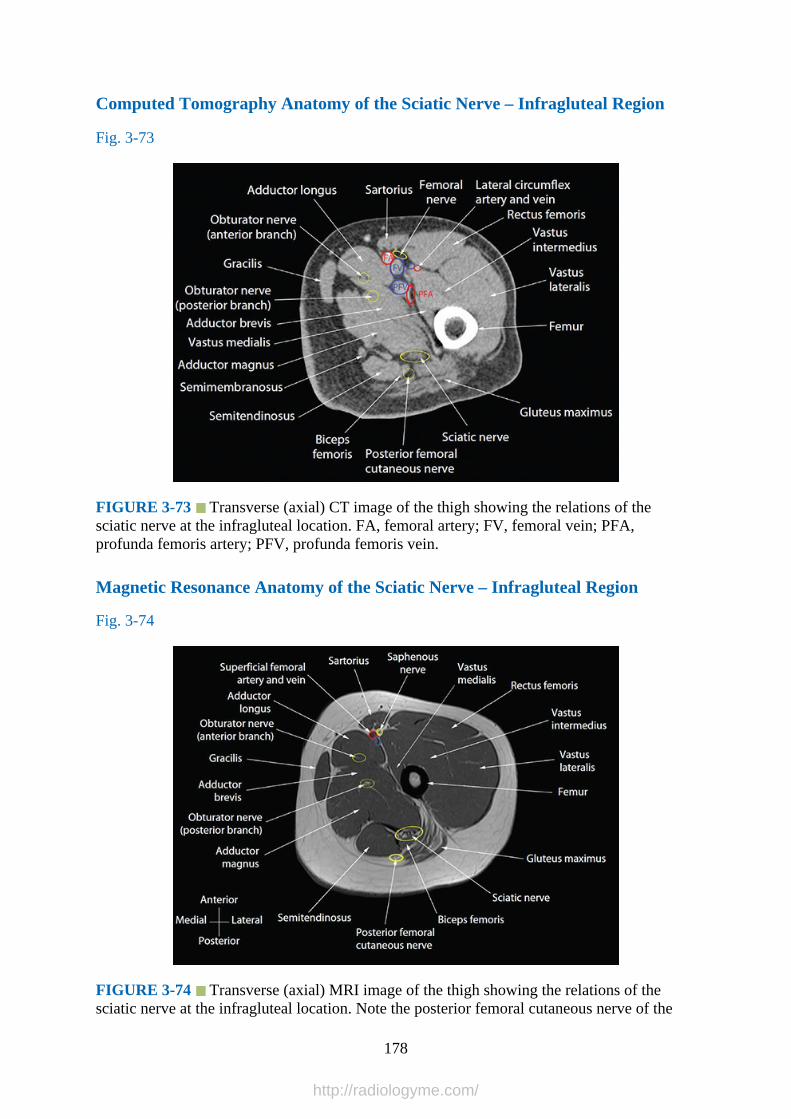
Computed Tomography Anatomy of the Sciatic Nerve – Infragluteal Region
Fig. 3-73
FIGURE 3-73 Transverse (axial) CT image of the thigh showing the relations of thesciatic nerve at the infragluteal location. FA, femoral artery; FV, femoral vein; PFA,profunda femoris artery; PFV, profunda femoris vein.
Magnetic Resonance Anatomy of the Sciatic Nerve – Infragluteal Region
Fig. 3-74
FIGURE 3-74 Transverse (axial) MRI image of the thigh showing the relations of thesciatic nerve at the infragluteal location. Note the posterior femoral cutaneous nerve of the
178
http://radiologyme.com/

thigh on the posterior aspect of the semitendinosus muscle.
Sciatic Nerve at the Infragluteal Region – Ultrasound Scan Technique
1.Position:a.Patient: Lateral position with the side to be examined uppermost (nondependent side)
and the hip and knees slightly flexed. It is also possible to position the patient in thesemiprone (Sims’) or prone position.
b.Operator and ultrasound machine: The operator sits or stands behind the patient withthe ultrasound machine placed directly in front.
2.Transducer selection: Because the sciatic nerve is relatively superficial at this level, it ispossible to use a high-frequency (12-5 MHz) linear array transducer for the ultrasoundscan. We prefer to use a low-frequency (5-2 MHz) curved array transducer because itprovides a wider field of view.
3.Scan technique: Start by placing the ultrasound transducer parallel to a line joining thegreater trochanter and the ischial tuberosity as described earlier for the sciatic nerve at thesubgluteal space (Figs. 3-75 to 3-77). Once the sciatic nerve is identified in the transversesonogram, slide the transducer caudally until it is below the gluteal crease. The sciaticnerve is seen lying superficially between the biceps femoris muscle posteriorly and theadductor magnus muscle anteriorly. It is not uncommon to visualize the lower slips of thegluteus maximus muscle posterior to the biceps femoris muscle in the transversesonogram.
179
http://radiologyme.com/

FIGURE 3-75 Figure showing the position of the ultrasound transducer during atransverse scan for the sciatic nerve at the infragluteal position.
180
http://radiologyme.com/

FIGURE 3-76 Figure showing the position and orientation of the ultrasound transducerduring a transverse scan for the sciatic nerve at the infragluteal position.
FIGURE 3-77 Figure highlighting the anatomical structures that are insonated during atransverse ultrasound scan for the sciatic nerve at the infragluteal position.
4.Sonoanatomy: The sciatic nerve is visualized as a triangular hyperechoic structurebetween the biceps femoris muscle posteriorly and the adductor magnus muscle anteriorly(Fig. 3-78). Some of the lower slips of the gluteus maximus muscle may also bevisualized posterior to the biceps femoris muscle in the transverse sonogram.
181
http://radiologyme.com/
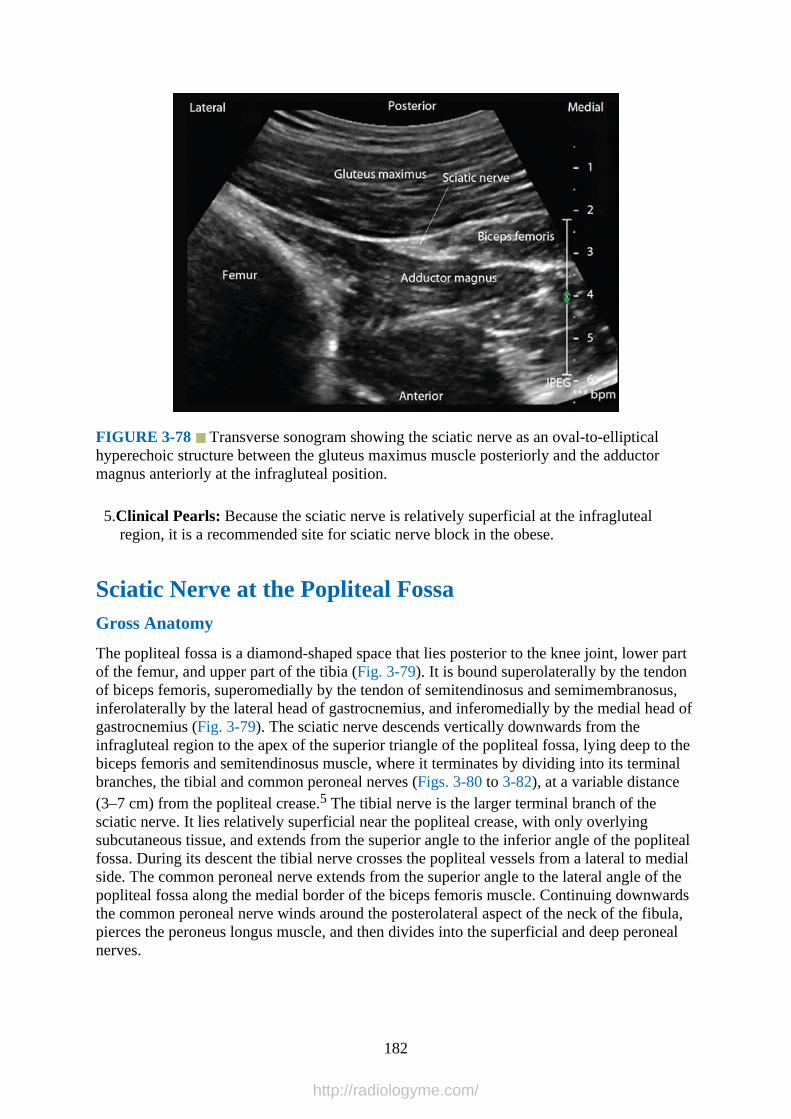
FIGURE 3-78 Transverse sonogram showing the sciatic nerve as an oval-to-ellipticalhyperechoic structure between the gluteus maximus muscle posteriorly and the adductormagnus anteriorly at the infragluteal position.
5.Clinical Pearls: Because the sciatic nerve is relatively superficial at the infraglutealregion, it is a recommended site for sciatic nerve block in the obese.
Sciatic Nerve at the Popliteal FossaGross Anatomy
The popliteal fossa is a diamond-shaped space that lies posterior to the knee joint, lower partof the femur, and upper part of the tibia (Fig. 3-79). It is bound superolaterally by the tendonof biceps femoris, superomedially by the tendon of semitendinosus and semimembranosus,inferolaterally by the lateral head of gastrocnemius, and inferomedially by the medial head ofgastrocnemius (Fig. 3-79). The sciatic nerve descends vertically downwards from theinfragluteal region to the apex of the superior triangle of the popliteal fossa, lying deep to thebiceps femoris and semitendinosus muscle, where it terminates by dividing into its terminalbranches, the tibial and common peroneal nerves (Figs. 3-80 to 3-82), at a variable distance(3–7 cm) from the popliteal crease.5 The tibial nerve is the larger terminal branch of thesciatic nerve. It lies relatively superficial near the popliteal crease, with only overlyingsubcutaneous tissue, and extends from the superior angle to the inferior angle of the poplitealfossa. During its descent the tibial nerve crosses the popliteal vessels from a lateral to medialside. The common peroneal nerve extends from the superior angle to the lateral angle of thepopliteal fossa along the medial border of the biceps femoris muscle. Continuing downwardsthe common peroneal nerve winds around the posterolateral aspect of the neck of the fibula,pierces the peroneus longus muscle, and then divides into the superficial and deep peronealnerves.
182
http://radiologyme.com/
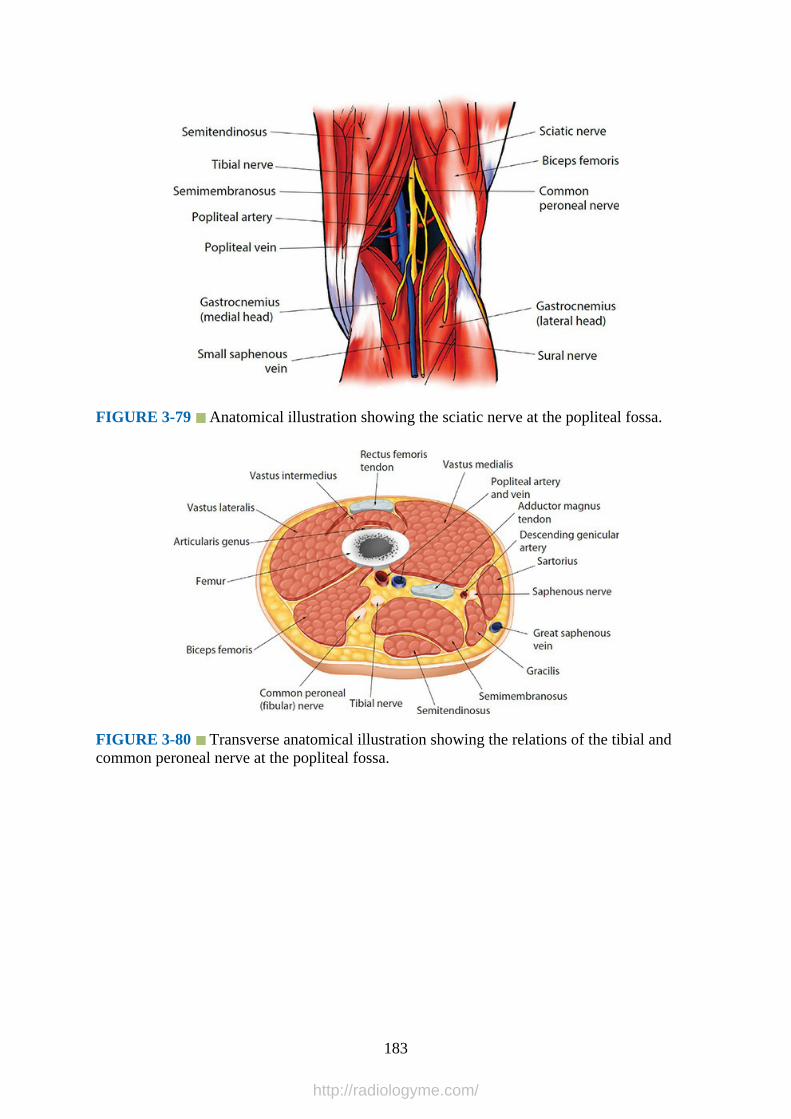
FIGURE 3-79 Anatomical illustration showing the sciatic nerve at the popliteal fossa.
FIGURE 3-80 Transverse anatomical illustration showing the relations of the tibial andcommon peroneal nerve at the popliteal fossa.
183
http://radiologyme.com/

FIGURE 3-81 Transverse anatomical section of the lower thigh showing the anatomy ofthe sciatic nerve before its division into the tibial and common peroneal nerve at the poplitealfossa.
FIGURE 3-82 Transverse anatomical section of the lower thigh showing the sciatic nerveafter its division into the tibial and common peroneal nerves at the popliteal fossa.
Computed Tomography Anatomy of the Popliteal Fossa
Figs. 3-83 to 3-85
184
http://radiologyme.com/
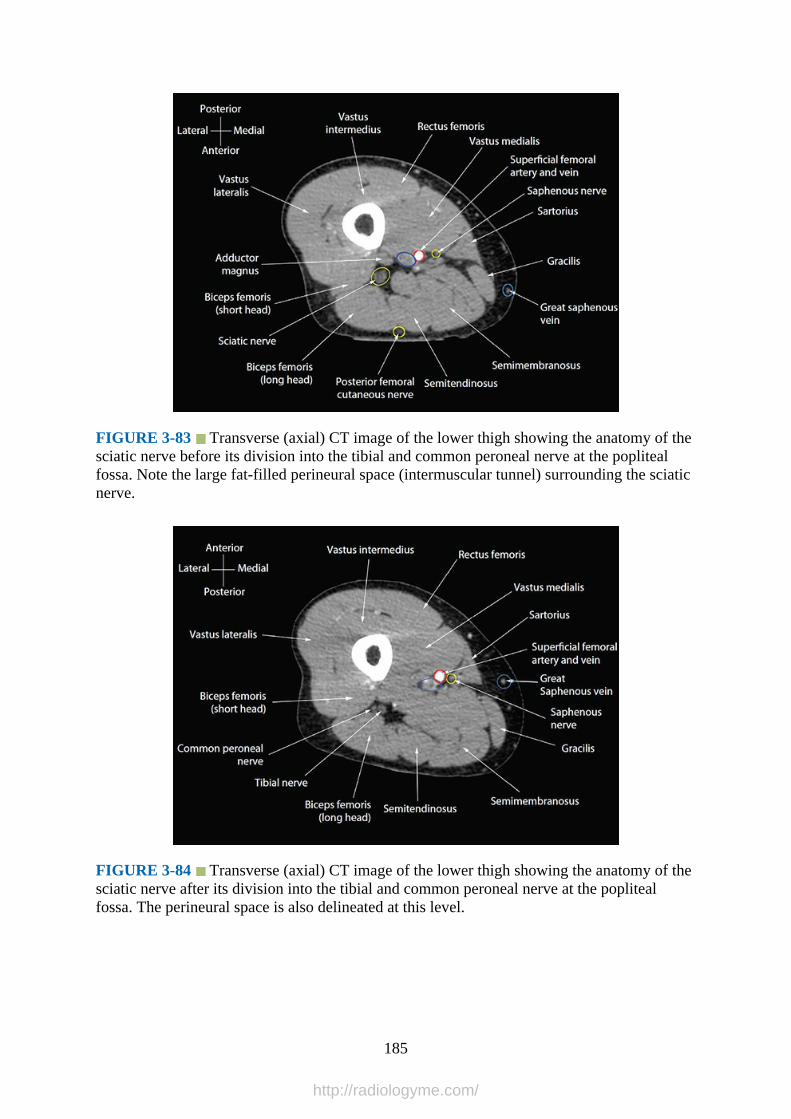
FIGURE 3-83 Transverse (axial) CT image of the lower thigh showing the anatomy of thesciatic nerve before its division into the tibial and common peroneal nerve at the poplitealfossa. Note the large fat-filled perineural space (intermuscular tunnel) surrounding the sciaticnerve.
FIGURE 3-84 Transverse (axial) CT image of the lower thigh showing the anatomy of thesciatic nerve after its division into the tibial and common peroneal nerve at the poplitealfossa. The perineural space is also delineated at this level.
185
http://radiologyme.com/
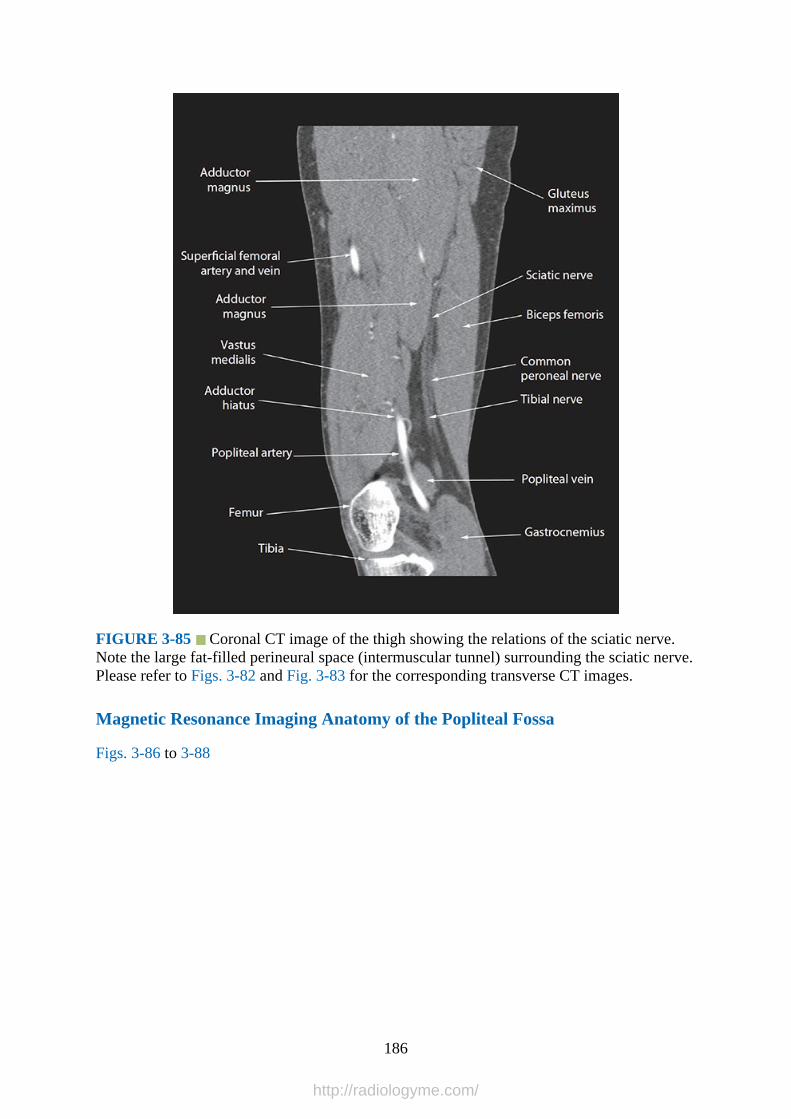
FIGURE 3-85 Coronal CT image of the thigh showing the relations of the sciatic nerve.Note the large fat-filled perineural space (intermuscular tunnel) surrounding the sciatic nerve.Please refer to Figs. 3-82 and Fig. 3-83 for the corresponding transverse CT images.
Magnetic Resonance Imaging Anatomy of the Popliteal Fossa
Figs. 3-86 to 3-88
186
http://radiologyme.com/
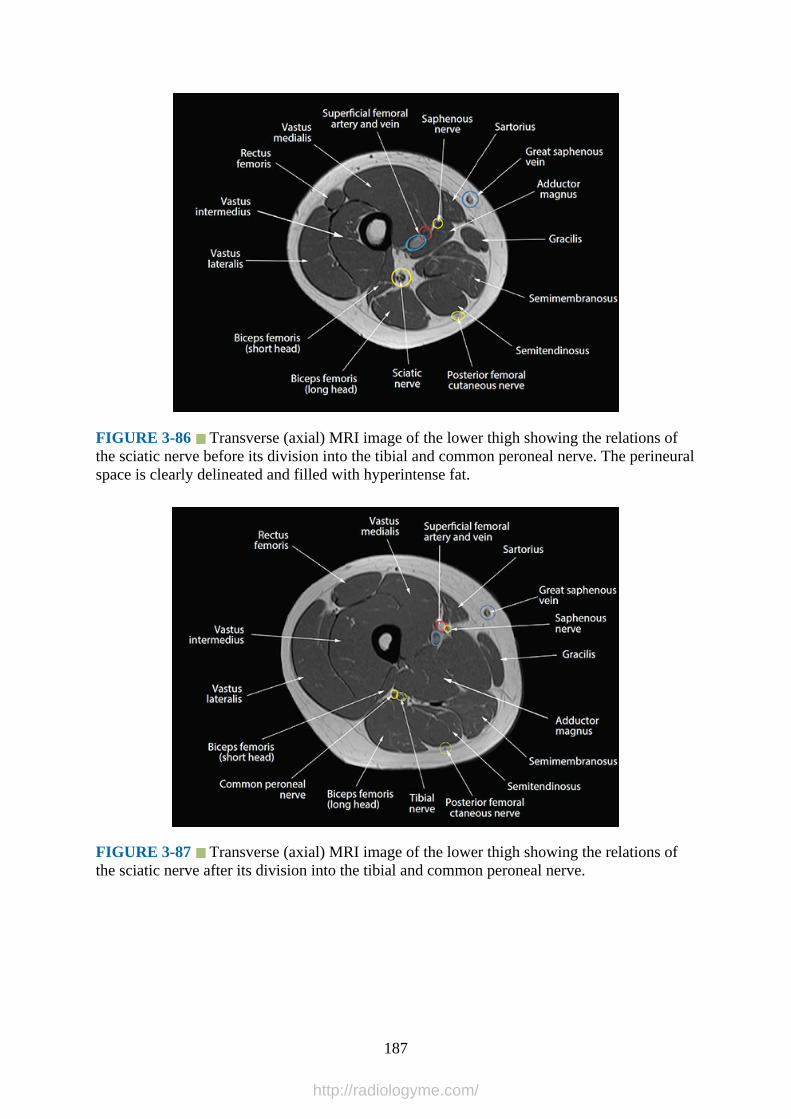
FIGURE 3-86 Transverse (axial) MRI image of the lower thigh showing the relations ofthe sciatic nerve before its division into the tibial and common peroneal nerve. The perineuralspace is clearly delineated and filled with hyperintense fat.
FIGURE 3-87 Transverse (axial) MRI image of the lower thigh showing the relations ofthe sciatic nerve after its division into the tibial and common peroneal nerve.
187
http://radiologyme.com/
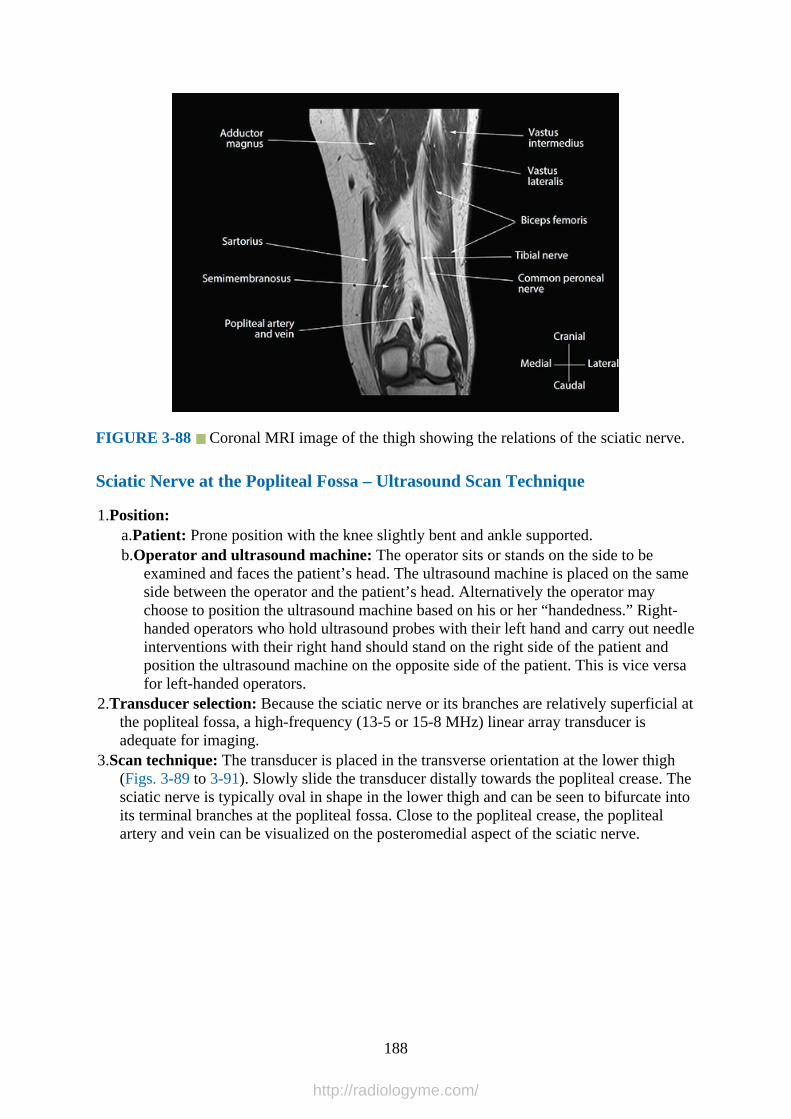
FIGURE 3-88 Coronal MRI image of the thigh showing the relations of the sciatic nerve.
Sciatic Nerve at the Popliteal Fossa – Ultrasound Scan Technique
1.Position:a.Patient: Prone position with the knee slightly bent and ankle supported.b.Operator and ultrasound machine: The operator sits or stands on the side to be
examined and faces the patient’s head. The ultrasound machine is placed on the sameside between the operator and the patient’s head. Alternatively the operator maychoose to position the ultrasound machine based on his or her “handedness.” Right-handed operators who hold ultrasound probes with their left hand and carry out needleinterventions with their right hand should stand on the right side of the patient andposition the ultrasound machine on the opposite side of the patient. This is vice versafor left-handed operators.
2.Transducer selection: Because the sciatic nerve or its branches are relatively superficial atthe popliteal fossa, a high-frequency (13-5 or 15-8 MHz) linear array transducer isadequate for imaging.
3.Scan technique: The transducer is placed in the transverse orientation at the lower thigh(Figs. 3-89 to 3-91). Slowly slide the transducer distally towards the popliteal crease. Thesciatic nerve is typically oval in shape in the lower thigh and can be seen to bifurcate intoits terminal branches at the popliteal fossa. Close to the popliteal crease, the poplitealartery and vein can be visualized on the posteromedial aspect of the sciatic nerve.
188
http://radiologyme.com/

FIGURE 3-89 Figure showing the position of the ultrasound transducer during atransverse scan for the sciatic nerve at the popliteal fossa.
189
http://radiologyme.com/
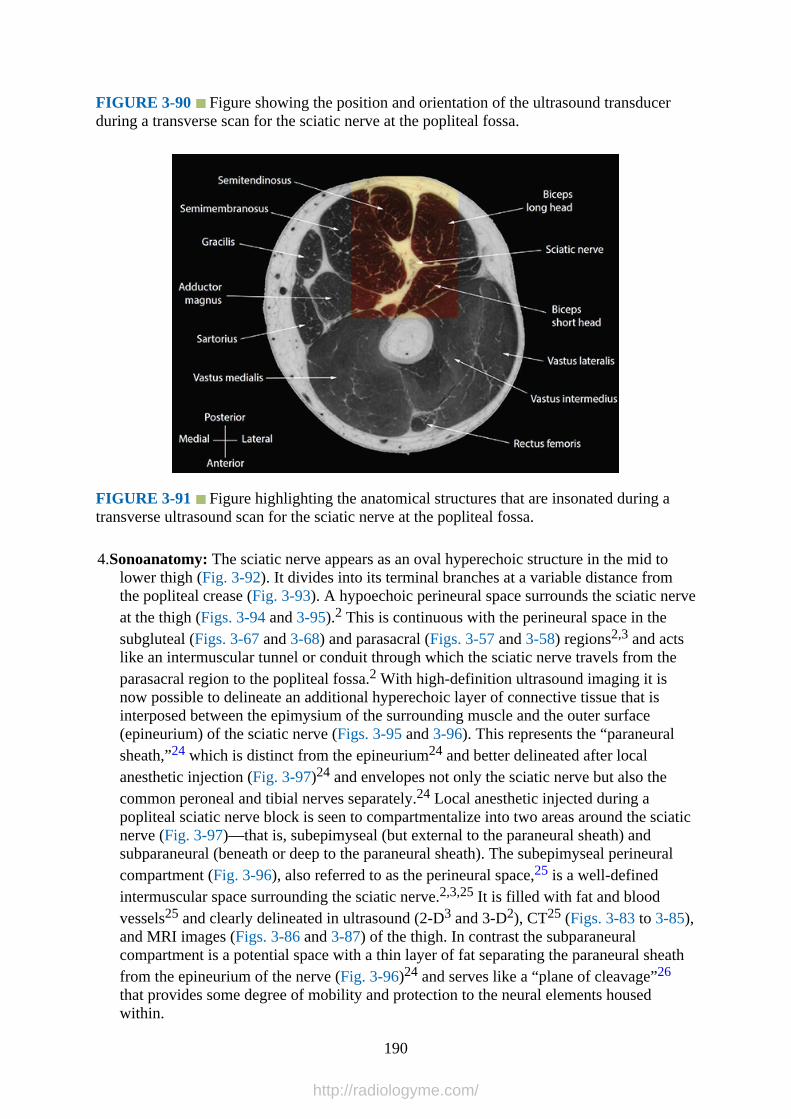
FIGURE 3-90 Figure showing the position and orientation of the ultrasound transducerduring a transverse scan for the sciatic nerve at the popliteal fossa.
FIGURE 3-91 Figure highlighting the anatomical structures that are insonated during atransverse ultrasound scan for the sciatic nerve at the popliteal fossa.
4.Sonoanatomy: The sciatic nerve appears as an oval hyperechoic structure in the mid tolower thigh (Fig. 3-92). It divides into its terminal branches at a variable distance fromthe popliteal crease (Fig. 3-93). A hypoechoic perineural space surrounds the sciatic nerveat the thigh (Figs. 3-94 and 3-95).2 This is continuous with the perineural space in thesubgluteal (Figs. 3-67 and 3-68) and parasacral (Figs. 3-57 and 3-58) regions2,3 and actslike an intermuscular tunnel or conduit through which the sciatic nerve travels from theparasacral region to the popliteal fossa.2 With high-definition ultrasound imaging it isnow possible to delineate an additional hyperechoic layer of connective tissue that isinterposed between the epimysium of the surrounding muscle and the outer surface(epineurium) of the sciatic nerve (Figs. 3-95 and 3-96). This represents the “paraneuralsheath,”24 which is distinct from the epineurium24 and better delineated after localanesthetic injection (Fig. 3-97)24 and envelopes not only the sciatic nerve but also thecommon peroneal and tibial nerves separately.24 Local anesthetic injected during apopliteal sciatic nerve block is seen to compartmentalize into two areas around the sciaticnerve (Fig. 3-97)—that is, subepimyseal (but external to the paraneural sheath) andsubparaneural (beneath or deep to the paraneural sheath). The subepimyseal perineuralcompartment (Fig. 3-96), also referred to as the perineural space,25 is a well-definedintermuscular space surrounding the sciatic nerve.2,3,25 It is filled with fat and bloodvessels25 and clearly delineated in ultrasound (2-D3 and 3-D2), CT25 (Figs. 3-83 to 3-85),and MRI images (Figs. 3-86 and 3-87) of the thigh. In contrast the subparaneuralcompartment is a potential space with a thin layer of fat separating the paraneural sheathfrom the epineurium of the nerve (Fig. 3-96)24 and serves like a “plane of cleavage”26
that provides some degree of mobility and protection to the neural elements housedwithin.
190
http://radiologyme.com/
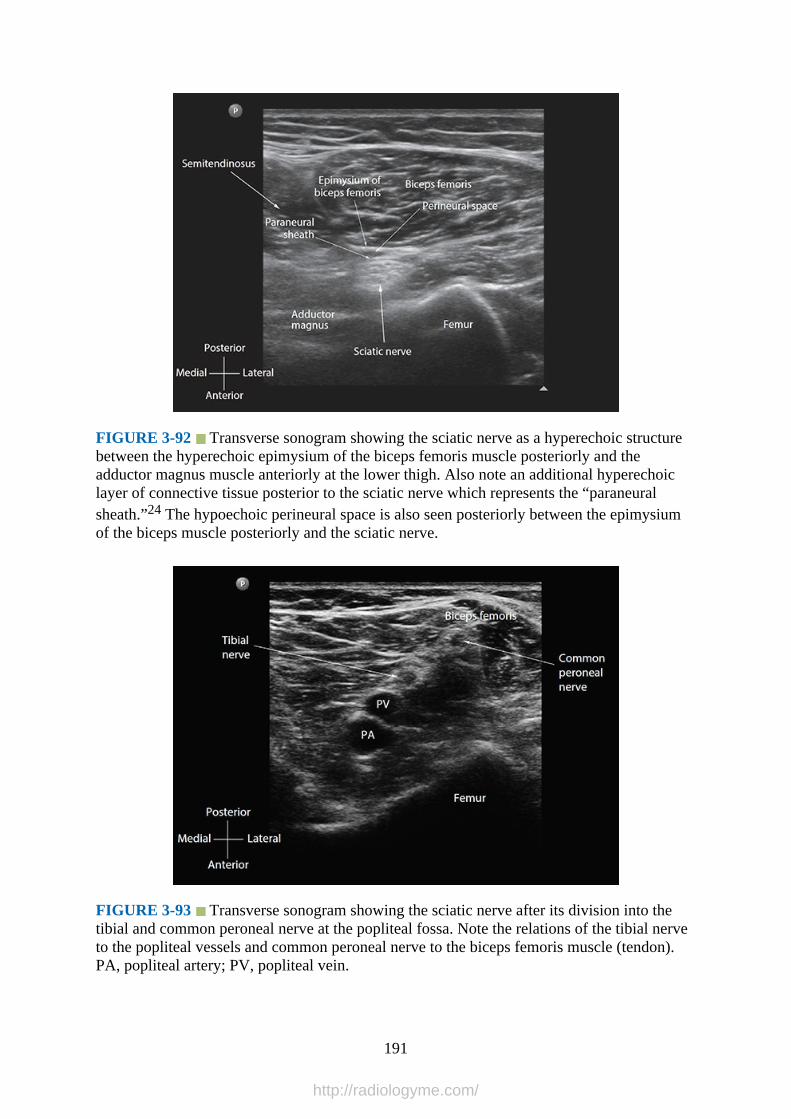
FIGURE 3-92 Transverse sonogram showing the sciatic nerve as a hyperechoic structurebetween the hyperechoic epimysium of the biceps femoris muscle posteriorly and theadductor magnus muscle anteriorly at the lower thigh. Also note an additional hyperechoiclayer of connective tissue posterior to the sciatic nerve which represents the “paraneuralsheath.”24 The hypoechoic perineural space is also seen posteriorly between the epimysiumof the biceps muscle posteriorly and the sciatic nerve.
FIGURE 3-93 Transverse sonogram showing the sciatic nerve after its division into thetibial and common peroneal nerve at the popliteal fossa. Note the relations of the tibial nerveto the popliteal vessels and common peroneal nerve to the biceps femoris muscle (tendon).PA, popliteal artery; PV, popliteal vein.
191
http://radiologyme.com/

FIGURE 3-94 Sagittal sonogram showing the sciatic nerve as a hyperechoic structurewithin a narrow hypoechoic space (perineural space) between the hyperechoic epimysium(short white arrows) of the surrounding muscles at the lower thigh.
FIGURE 3-95 High-definition transverse sonogram of the sciatic nerve at the level of itsbifurcation into the tibial and common peroneal nerve at the popliteal fossa. The paraneuralsheath (white arrow heads) is interposed between the epimysium (short white arrows) of thesurrounding muscles and the outer surface of the sciatic nerve (epineurium), which alsoappears hyperechoic. The subepimyseal (perineural) and subparaneural compartments areseen as hypoechoic areas between the epimysium and the paraneural sheath and between theparaneural sheath and the epineurium, respectively.
192
http://radiologyme.com/

FIGURE 3-96 Schematic diagram illustrating the fascial compartments surrounding thesciatic nerve at the popliteal fossa. CPN, common peroneal nerve; TN, tibial nerve.
FIGURE 3-97 Multiplanar 3-D view of the common peroneal (CPN) and tibial (TN) nerveat the popliteal fossa after an ultrasound-guided sciatic nerve block. A rendered 3D volumedemonstrating the front, right, and top surfaces of the volume is also presented in Fig. 3-97D.The reference marker has been placed over the tibial nerve (Fig. 3-97A). Spread of the localanesthetic (LA) relative to the sciatic nerve and its divisions or the paraneural sheath isclearly delineated in the multiplanar views.
193
http://radiologyme.com/
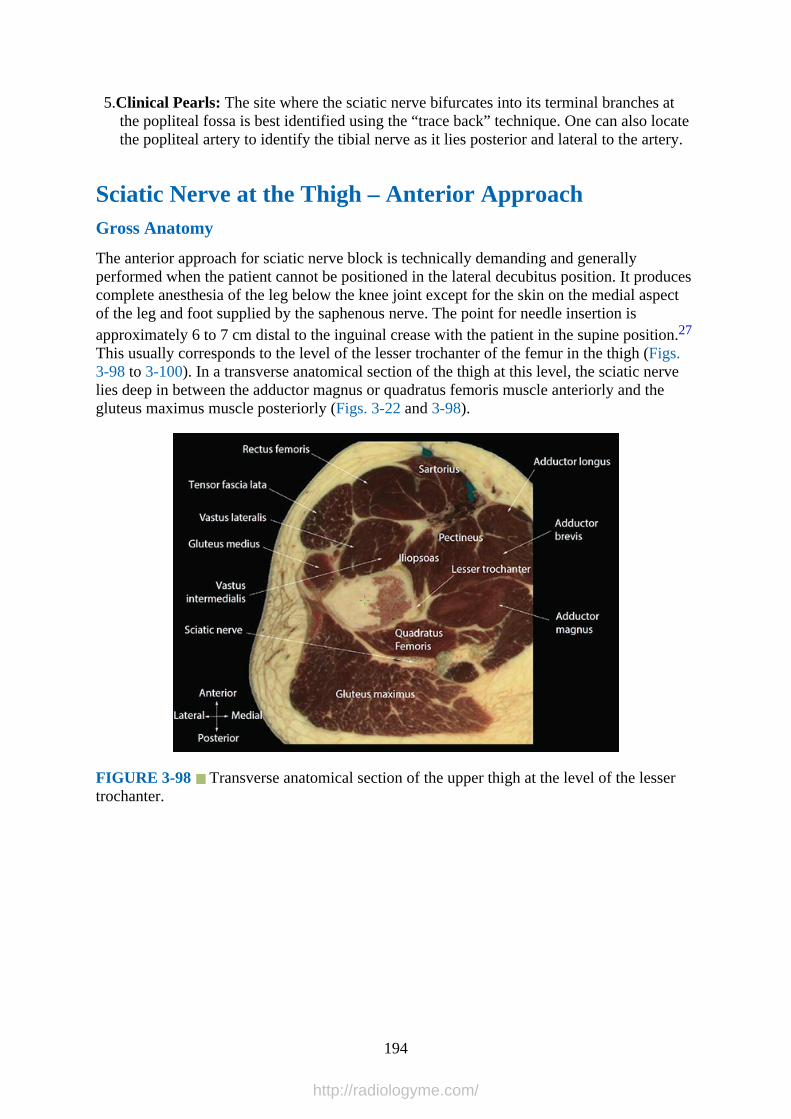
5.Clinical Pearls: The site where the sciatic nerve bifurcates into its terminal branches atthe popliteal fossa is best identified using the “trace back” technique. One can also locatethe popliteal artery to identify the tibial nerve as it lies posterior and lateral to the artery.
Sciatic Nerve at the Thigh – Anterior ApproachGross Anatomy
The anterior approach for sciatic nerve block is technically demanding and generallyperformed when the patient cannot be positioned in the lateral decubitus position. It producescomplete anesthesia of the leg below the knee joint except for the skin on the medial aspectof the leg and foot supplied by the saphenous nerve. The point for needle insertion isapproximately 6 to 7 cm distal to the inguinal crease with the patient in the supine position.27
This usually corresponds to the level of the lesser trochanter of the femur in the thigh (Figs.3-98 to 3-100). In a transverse anatomical section of the thigh at this level, the sciatic nervelies deep in between the adductor magnus or quadratus femoris muscle anteriorly and thegluteus maximus muscle posteriorly (Figs. 3-22 and 3-98).
FIGURE 3-98 Transverse anatomical section of the upper thigh at the level of the lessertrochanter.
194
http://radiologyme.com/
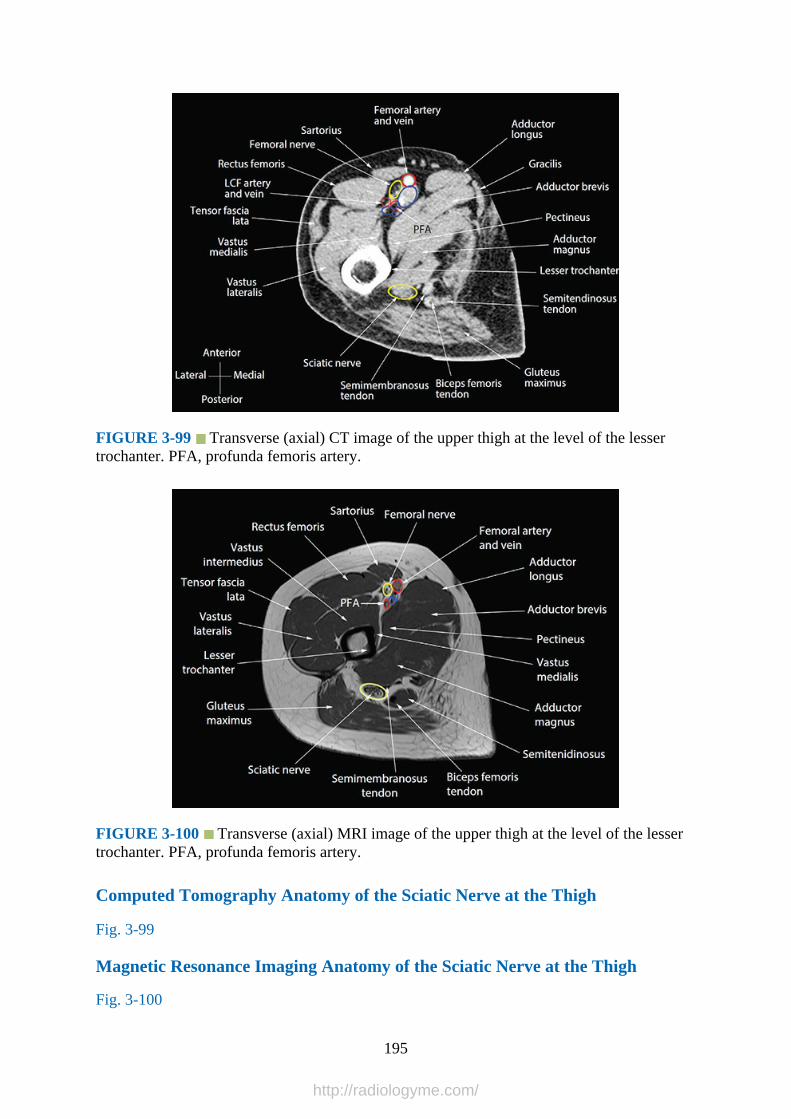
FIGURE 3-99 Transverse (axial) CT image of the upper thigh at the level of the lessertrochanter. PFA, profunda femoris artery.
FIGURE 3-100 Transverse (axial) MRI image of the upper thigh at the level of the lessertrochanter. PFA, profunda femoris artery.
Computed Tomography Anatomy of the Sciatic Nerve at the Thigh
Fig. 3-99
Magnetic Resonance Imaging Anatomy of the Sciatic Nerve at the Thigh
Fig. 3-100
195
http://radiologyme.com/

Sciatic Nerve at the Thigh – Anterior Approach Ultrasound Scan Technique
1.Position:a.Patient: Supine with the leg fully extended and slightly internally rotated.28
b.Operator and ultrasound machine: The operator may choose to position theultrasound machine based on his or her “handedness.” Right-handed operators whohold ultrasound probes with their left hand and carry out needle interventions withtheir right hand should stand on the right side of the patient and position theultrasound machine on the opposite side of the patient. This is vice versa for left-handed operators.
2.Transducer selection: Low-frequency (5-2 MHz) curve array transducer.3.Scan technique: The transducer is placed on the medial aspect of the thigh approximately
6 to 7 cm distal and parallel to the inguinal crease in a transverse orientation (Figs. 3-101to 3-103). The reference structure to visualize is the femur (lesser trochanter). Oncevisualized, slide the transducer medially to bring the femur to the lateral edge of theultrasound image. The sciatic nerve is visualized as a hyperechoic structure between theadductor magnus muscle anteriorly and gluteus maximus muscle posteriorly (Fig. 3-104).
FIGURE 3-101 Figure showing the position of the ultrasound transducer during a
196
http://radiologyme.com/

transverse scan for the sciatic nerve at the upper thigh during an anterior approach for sciaticnerve block.
FIGURE 3-102 Figure showing the position and orientation of the ultrasound transducerduring a transverse scan for the sciatic nerve at the upper thigh during an anterior approachfor sciatic nerve block. GT, greater trochanter; ASIS, anterior superior iliac spine.
FIGURE 3-103 Figure highlighting the anatomical structures that are insonated during atransverse ultrasound scan for the sciatic nerve at the upper thigh during an anterior approachfor sciatic nerve block.
197
http://radiologyme.com/

FIGURE 3-104 Sonogram demonstrating the sciatic nerve at the upper thigh at the level ofthe lesser trochanter during an anterior approach for sciatic nerve block.
4.Sonoanatomy: In a transverse sonogram the sciatic nerve is typically visualized as anelliptical and hyperechoic structure between the adductor magnus and gluteus maximusmuscle (Fig. 3-104). This can be confirmed by rotating the transducer to the sagittalorientation in relation to the femur to visualize the hyperechoic laminated appearance ofthe sciatic nerve.
5.Clinical Pearls: The anterior approach for sciatic nerve block is an advanced regionalanesthetic technique and can be technically demanding. The sciatic nerve is deep at thislevel, and there are no reference vascular structures in close vicinity. The sagittal axismay be superior to the transverse axis for visualizing the sciatic nerve at this level.29
Terminal Nerves in the LegGross Anatomy
The four terminal nerves of the leg below the knee provide sensation and motor function tothe foot and ankle (Figs. 3-105 to 3-107). The tibial nerve is a terminal branch of the sciaticnerve. It lies deep to the gastrocnemius and soleus muscles and on the posterior surface of thetibialis posterior muscle (Fig. 3-106). The tibial nerve accompanies the posterior tibial artery(Fig. 3-106) and at the level of the medial malleolus lies medial to the artery and lateral to theflexor hallucis longus tendon under the flexor retinaculum (Figs. 3-108 and 3-109). Thesaphenous nerve is a terminal branch of the femoral nerve (Fig. 3-110). It typically piercesthe deep fascia on the medial aspect of the knee after emerging between the tendons of thesartorius and gracilis. It then travels down the leg superficially along the course of the greatsaphenous vein (Figs. 3-105 to 3-107, 3-110, and 3-111).
198
http://radiologyme.com/

FIGURE 3-105 Transverse anatomical illustration of the leg at the level of the tibialtuberosity.
FIGURE 3-106 Transverse anatomical illustration of the leg above the middle of the leg.
199
http://radiologyme.com/
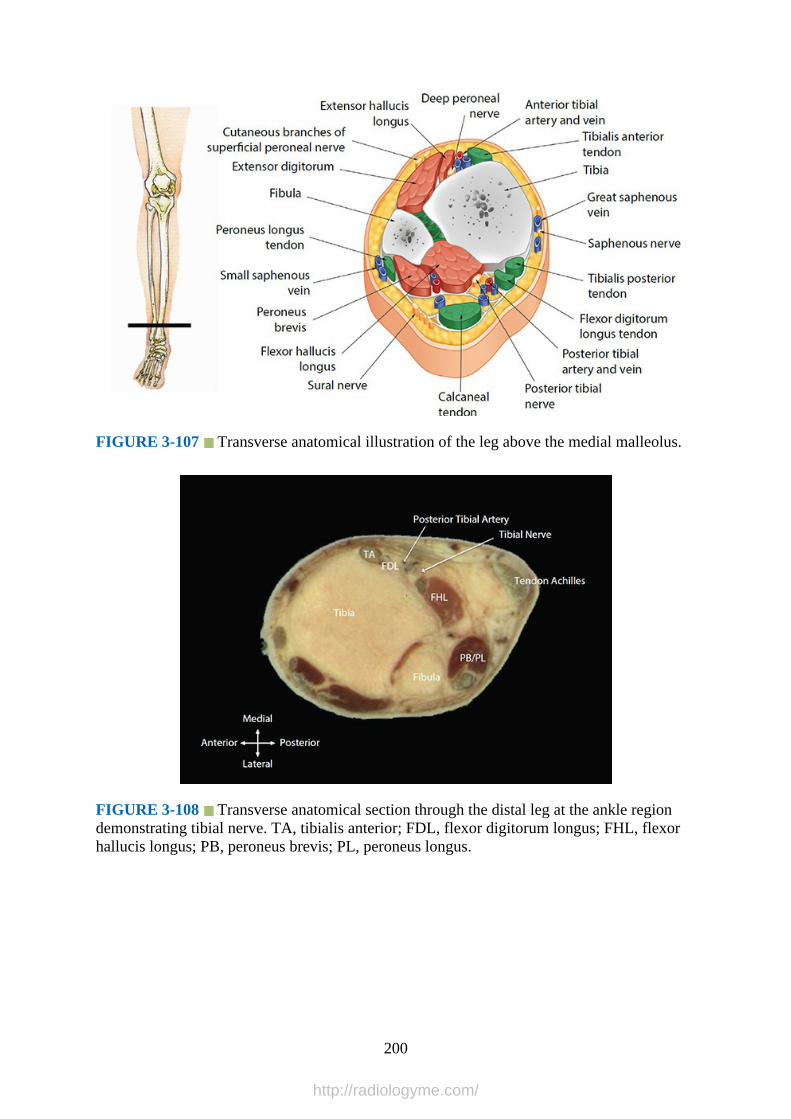
FIGURE 3-107 Transverse anatomical illustration of the leg above the medial malleolus.
FIGURE 3-108 Transverse anatomical section through the distal leg at the ankle regiondemonstrating tibial nerve. TA, tibialis anterior; FDL, flexor digitorum longus; FHL, flexorhallucis longus; PB, peroneus brevis; PL, peroneus longus.
200
http://radiologyme.com/
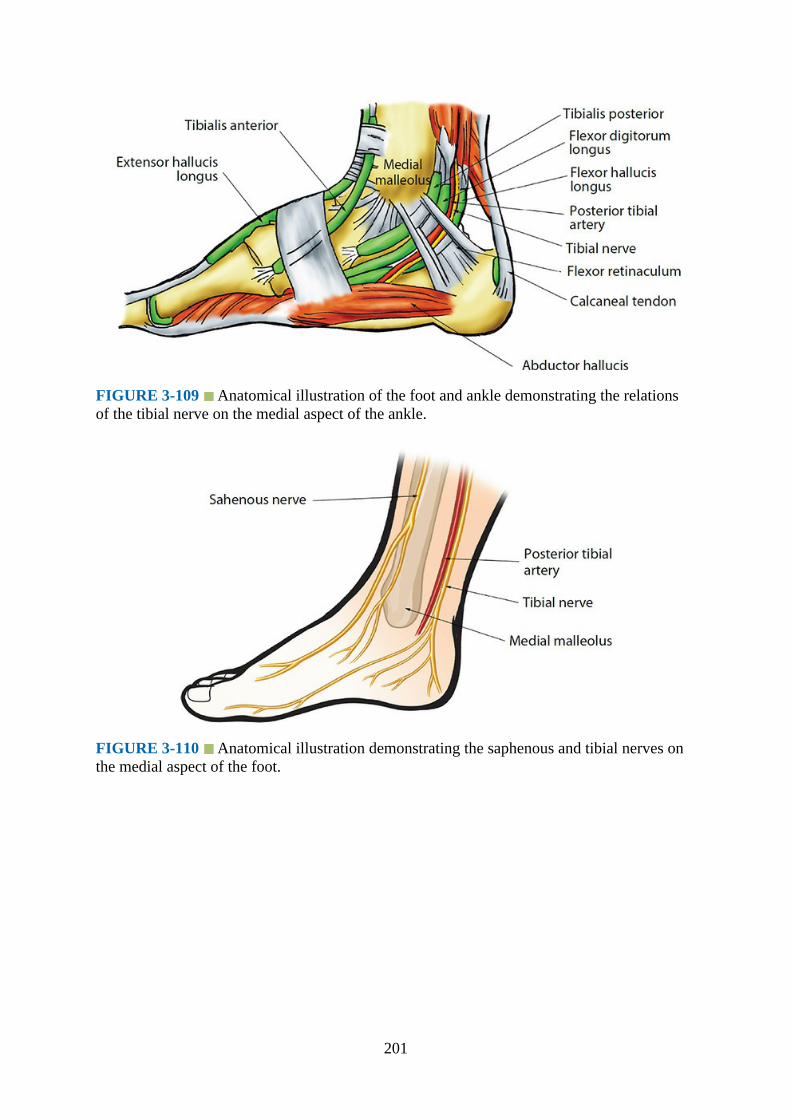
FIGURE 3-109 Anatomical illustration of the foot and ankle demonstrating the relationsof the tibial nerve on the medial aspect of the ankle.
FIGURE 3-110 Anatomical illustration demonstrating the saphenous and tibial nerves onthe medial aspect of the foot.
201
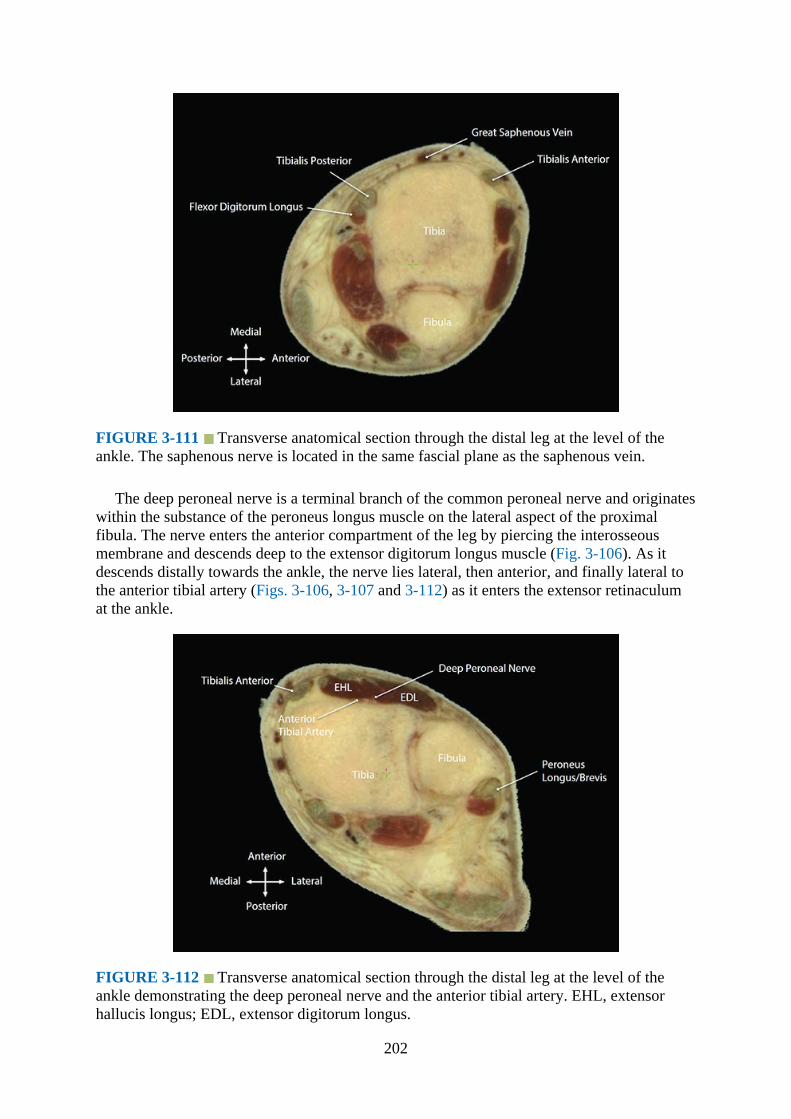
FIGURE 3-111 Transverse anatomical section through the distal leg at the level of theankle. The saphenous nerve is located in the same fascial plane as the saphenous vein.
The deep peroneal nerve is a terminal branch of the common peroneal nerve and originateswithin the substance of the peroneus longus muscle on the lateral aspect of the proximalfibula. The nerve enters the anterior compartment of the leg by piercing the interosseousmembrane and descends deep to the extensor digitorum longus muscle (Fig. 3-106). As itdescends distally towards the ankle, the nerve lies lateral, then anterior, and finally lateral tothe anterior tibial artery (Figs. 3-106, 3-107 and 3-112) as it enters the extensor retinaculumat the ankle.
FIGURE 3-112 Transverse anatomical section through the distal leg at the level of theankle demonstrating the deep peroneal nerve and the anterior tibial artery. EHL, extensorhallucis longus; EDL, extensor digitorum longus.
202

The superficial peroneal nerve is also a terminal branch of the common peroneal nerve(Fig. 3-113) and like the deep peroneal nerve originates within the substance of the peroneuslongus muscle. It descends first between the peroneus longus and brevis muscle and thenbetween the intermuscular septum of the peroneus brevis and extensor digitorum longusmuscle (Fig. 3-114). It then pierces the deep crural fascia and becomes cutaneous in the lowerpart of the leg at a variable distance from the ankle (Fig. 3-107).30
FIGURE 3-113 Anatomical illustration of the foot demonstrating the course and divisionsof the saphenous, superficial, and deep peroneal nerves.
FIGURE 3-114 Transverse anatomical section through the distal leg demonstrating theintermuscular plane between the peroneus brevis and the extensor digitorum longus in whichthe superficial peroneal nerve is located.
203

The sural nerve (Fig. 3-115) arises from cutaneous branches of the tibial nerve andcommon peroneal nerve. It descends on the posterior aspect of the leg between the two headsof the gastrocnemius and descends along the lateral edge of the Achilles tendon (Figs. 3-107and 3-116), lying close to the short saphenous vein (Fig. 3-116), to the space between thelateral malleolus and the calcaneus.
FIGURE 3-115 Anatomical illustration of the foot demonstrating the course and divisionsof the superficial peroneal and sural nerves.
FIGURE 3-116 Anatomical section through the distal leg at the ankle regiondemonstrating the sural nerve in the vicinity of the small saphenous vein.
Computed Tomography Anatomy of the Terminal Nerves of the Leg
204
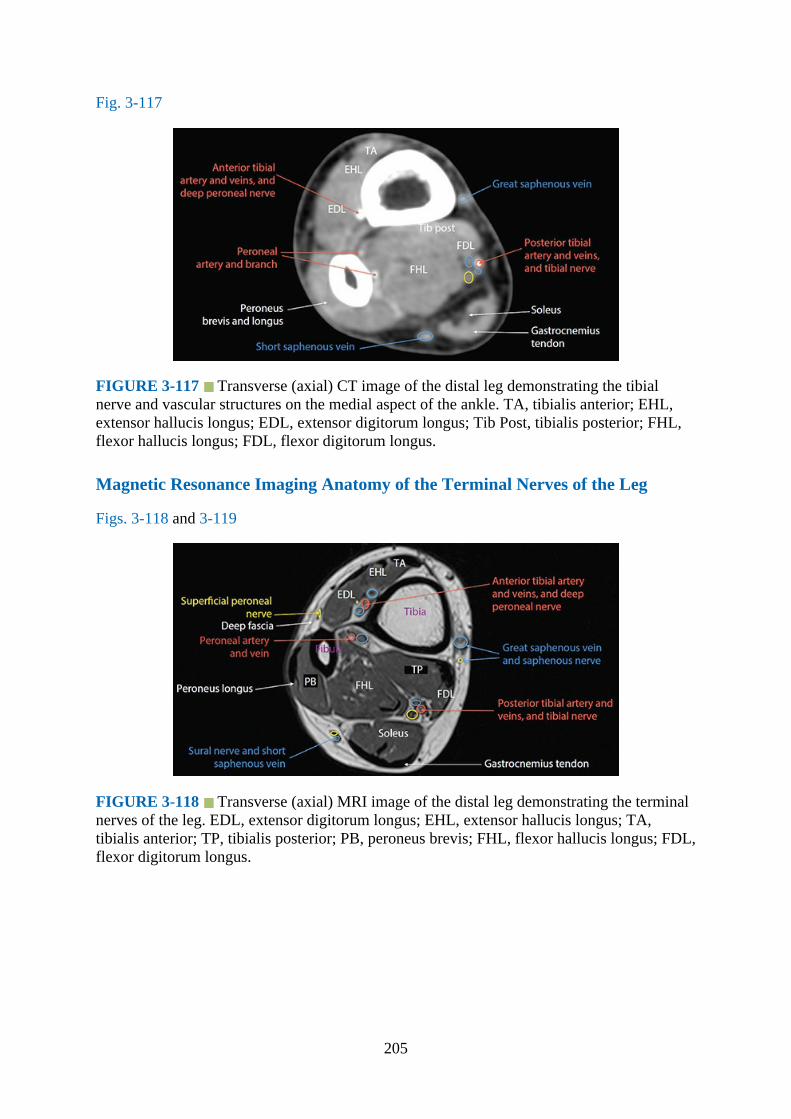
Fig. 3-117
FIGURE 3-117 Transverse (axial) CT image of the distal leg demonstrating the tibialnerve and vascular structures on the medial aspect of the ankle. TA, tibialis anterior; EHL,extensor hallucis longus; EDL, extensor digitorum longus; Tib Post, tibialis posterior; FHL,flexor hallucis longus; FDL, flexor digitorum longus.
Magnetic Resonance Imaging Anatomy of the Terminal Nerves of the Leg
Figs. 3-118 and 3-119
FIGURE 3-118 Transverse (axial) MRI image of the distal leg demonstrating the terminalnerves of the leg. EDL, extensor digitorum longus; EHL, extensor hallucis longus; TA,tibialis anterior; TP, tibialis posterior; PB, peroneus brevis; FHL, flexor hallucis longus; FDL,flexor digitorum longus.
205

FIGURE 3-119 Transverse (axial) MRI image of the ankle region demonstrating theterminal nerves of the leg. EDL, extensor digitorum longus, EHL; extensor hallucis longus;FHL, flexor hallucis longus; FDL, flexor digitorum longus.
Terminal Nerves of the Leg – Ultrasound Scan Technique
1.Position:a.Patient: Supine position. The leg that is examined is positioned according to the nerve
to be examined. For the saphenous (Fig. 3-120) and tibial (Fig. 3-121) nerves theipsilateral knee and hip is slightly flexed and externally rotated. For the superficialperoneal (Fig. 3-122), deep peroneal (Fig. 3-123), and sural (Fig. 3-124) nerves theipsilateral knee is flexed and the sole of the foot is placed flat on the bed. An assistantmay be asked to support the leg during the examination.
FIGURE 3-120 Figure showing the position and orientation of the ultrasound transducerduring a transverse ultrasound scan for the saphenous nerve at the distal leg.
206

FIGURE 3-121 Figure showing the position and orientation of the ultrasound transducerduring a transverse ultrasound scan for the tibial nerve at the distal leg.
FIGURE 3-122 Figure showing the position and orientation of the ultrasound transducerduring a transverse ultrasound scan for the superficial peroneal nerve at the distal leg. Note anassistant is supporting the leg during the ultrasound scan.
207
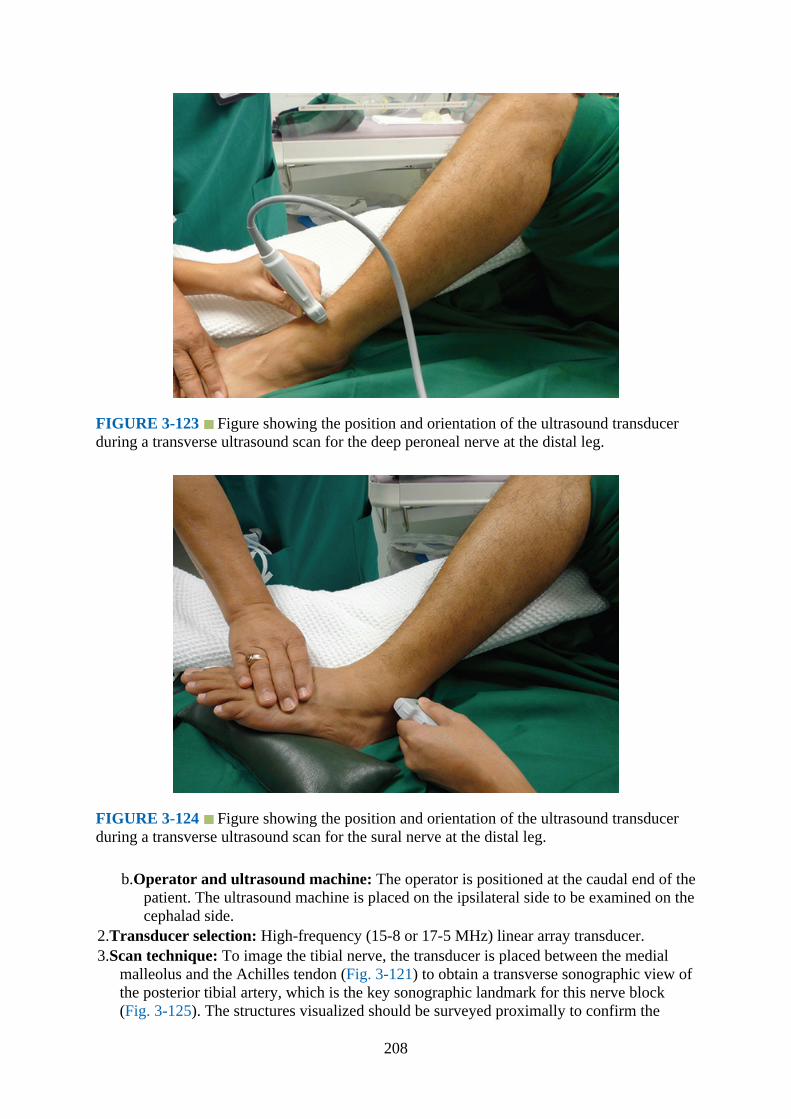
FIGURE 3-123 Figure showing the position and orientation of the ultrasound transducerduring a transverse ultrasound scan for the deep peroneal nerve at the distal leg.
FIGURE 3-124 Figure showing the position and orientation of the ultrasound transducerduring a transverse ultrasound scan for the sural nerve at the distal leg.
b.Operator and ultrasound machine: The operator is positioned at the caudal end of thepatient. The ultrasound machine is placed on the ipsilateral side to be examined on thecephalad side.
2.Transducer selection: High-frequency (15-8 or 17-5 MHz) linear array transducer.3.Scan technique: To image the tibial nerve, the transducer is placed between the medial
malleolus and the Achilles tendon (Fig. 3-121) to obtain a transverse sonographic view ofthe posterior tibial artery, which is the key sonographic landmark for this nerve block(Fig. 3-125). The structures visualized should be surveyed proximally to confirm the
208
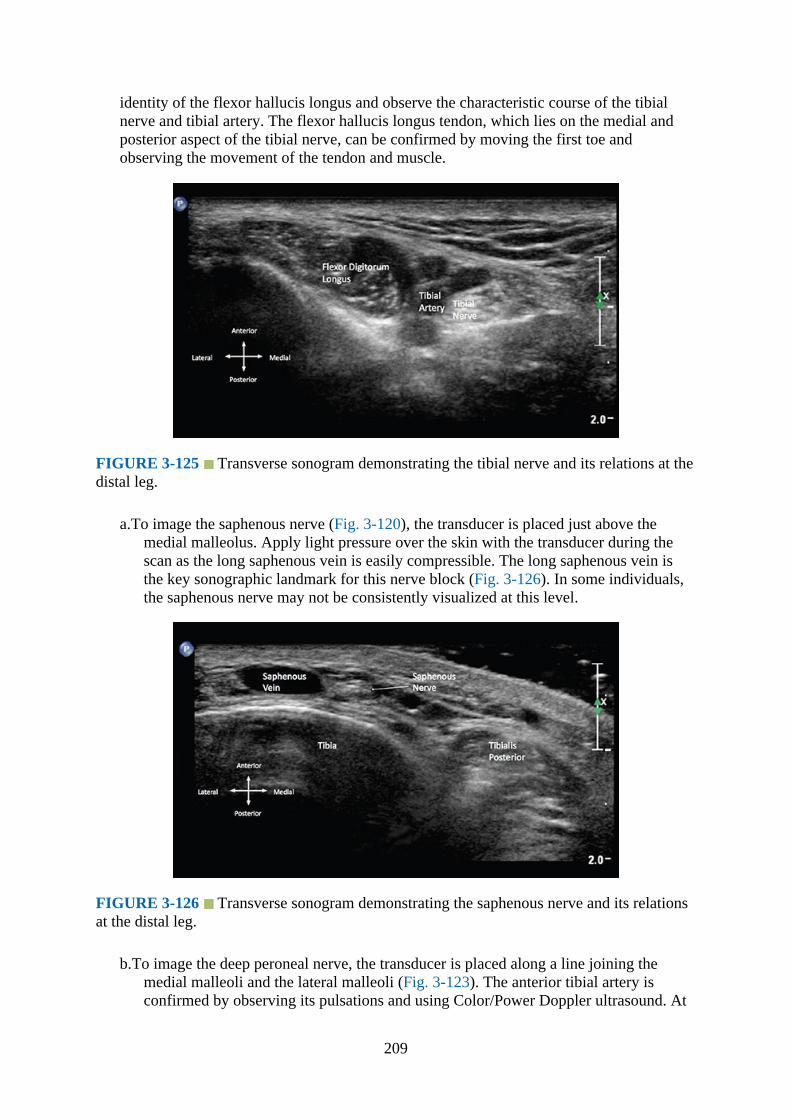
identity of the flexor hallucis longus and observe the characteristic course of the tibialnerve and tibial artery. The flexor hallucis longus tendon, which lies on the medial andposterior aspect of the tibial nerve, can be confirmed by moving the first toe andobserving the movement of the tendon and muscle.
FIGURE 3-125 Transverse sonogram demonstrating the tibial nerve and its relations at thedistal leg.
a.To image the saphenous nerve (Fig. 3-120), the transducer is placed just above themedial malleolus. Apply light pressure over the skin with the transducer during thescan as the long saphenous vein is easily compressible. The long saphenous vein isthe key sonographic landmark for this nerve block (Fig. 3-126). In some individuals,the saphenous nerve may not be consistently visualized at this level.
FIGURE 3-126 Transverse sonogram demonstrating the saphenous nerve and its relationsat the distal leg.
b.To image the deep peroneal nerve, the transducer is placed along a line joining themedial malleoli and the lateral malleoli (Fig. 3-123). The anterior tibial artery isconfirmed by observing its pulsations and using Color/Power Doppler ultrasound. At
209

this level, the deep peroneal nerve appears as a small hypoechoic structure lateral tothe artery (Fig. 3-127). The anterior tibial artery is the key sonographic landmark forthis nerve block.
FIGURE 3-127 Transverse sonogram demonstrating the deep peroneal nerve and itsrelations at the distal leg. EDL, extensor digitorum longus; EHL, extensor hallucis longus;TA, tibialis anterior.
c.To image the superficial peroneal nerve (Fig. 3-122), the transducer is placedtransversely across the fibula just above the lateral malleoli to image the fibula in atransverse section (Fig. 3-128). The transducer is then moved proximately along thefibula. During this survey, the fibula is observed to move deeper as the muscle of thelateral and anterior leg compartments become more pronounced. An intermuscularseptum arises from the edge of the fibula which separates the extensor digitorumlongus and the peroneus brevis/peroneus longus. This is the intermuscular septum thatdivides the anterior and lateral compartment of the leg. This is the key sonographiclandmark to identify the superficial peroneal nerve. The superficial peroneal nerveappears as a honeycomb structure (Fig. 3-128) that lies in the groove within theintermuscular septum approximately 5 to 10 cm above the lateral malleoli (Fig. 3-114). It lies below the deep crural fascia of the leg in the midleg and pierces thisfascia to lie superficial to it as the nerve travels down the leg towards the lateralmalleolus.
210

FIGURE 3-128 Transverse sonogram demonstrating the superficial peroneal nerve and itsrelations at the distal leg.
d.To image the sural nerve, the transducer is placed transversely along a line joining thelateral malleolus and the Achilles tendon (Fig. 3-124). Apply light pressure over theskin with the transducer during the scan, as the short saphenous vein is easilycompressible. The short saphenous vein is visualized and confirmed by compressionand surveyed proximally along its course. The short saphenous vein is the keysonographic landmark for this nerve block. The sural nerve appears as a honeycombstructure and usually lies posterior to the short saphenous vein between the shortsaphenous vein and the Achilles tendon (Fig. 3-129) and can be confirmed by tracingit back and forth along its course.
FIGURE 3-129 Transverse sonogram demonstrating the sural nerve and its relations at thedistal leg. Note the short saphenous vein adjacent to the sural nerve.
4.Sonoanatomy: The tibial nerve has a typical honeycomb appearance and is located deepand medial to the tibial artery at the level just above the medial malleolus (Fig. 3-125).The saphenous nerve also has a honeycombed appearance in the short axis (Fig. 3-126)but is not consistently visualized in all individuals. The deep peroneal nerve appears as ahyperechoic structure with hypoechoic dots in the short axis (Fig. 3-127). The superficialperoneal nerve appears as one or two fusiform hypoechoic structures in the short axis(Fig. 3-128). The sural nerve appears as a honeycombed structure in the short axis (Fig. 3-129).
5.Clinical Pearls: The “trace back” technique is particularly useful for confirming the nervesin the leg. Compared with the traditional ankle block using landmark techniques,ultrasound-guided ankle blocks are generally administered more proximal to the malleoli.Sonographic study of the peripheral nerves at the ankle typically involves theidentification of key anatomical landmarks (artery, vein, or intermuscular septum)associated with the nerve and then tracing it proximally until it is best visualized andtargeted for nerve blockade. At the level of the malleoli, numerous tendons look similar tothe nerves in a sonogram. Muscles can be differentiated from nerves by observingmovement on sonography by asking the patient to move his or her toes or ankle. Inaddition, the tendons will change in appearance as a dynamic scan is performedproximally. The tendons transform into their corresponding muscle proximally. The
211
nerves are mobile and may “slip” on either side of the vessels with transducer pressure.With respect to the superficial peroneal nerve there are several variations on where thenerve is located, that is, whether it is deep to the crural fascia, where it divides into themedial dorsal cutaneous nerve and the intermediate dorsal cutaneous nerve, and where itpierces the crural fascia to lie superficial to it. These variations may be difficult toappreciate using ultrasound. The use of ultrasound for ankle blocks may improve thesuccess rates of sural and tibial nerve blocks.31,32 Also blockade of the saphenous nerveat the ankle may not be necessary for forefoot surgery.33
References1.Farny J, Drolet P, Girard M. Anatomy of the posterior approach to the lumbar plexus
block. Can J Anaesth. 1994;41:480–485.2.Karmakar M, Li X, Li J, Sala-Blanch X, Hadzic A, Gin T. Three-dimensional/four-
dimensional volumetric ultrasound imaging of the sciatic nerve. Reg Anesth Pain Med.2012;37:60–66.
3.Karmakar MK, Kwok WH, Ho AM, Tsang K, Chui PT, Gin T. Ultrasound-guided sciaticnerve block: description of a new approach at the subgluteal space. Br J Anaesth.2007;98:390–395.
4.Smoll NR. Variations of the piriformis and sciatic nerve with clinical consequence: areview. Clin Anat. 2010;23:8–17.
5.Vloka JD, Hadzic A, April E, Thys DM. The division of the sciatic nerve in the poplitealfossa: anatomical implications for popliteal nerve blockade. Anesth Analg. 2001;92:215–217.
6.Gustafson KJ, Pinault GC, Neville JJ, et al. Fascicular anatomy of human femoral nerve:implications for neural prostheses using nerve cuff electrodes. J Rehabil Res Dev.2009;46:973–984.
7.Soong J, Schafhalter-Zoppoth I, Gray AT. The importance of transducer angle toultrasound visibility of the femoral nerve. Reg Anesth Pain Med. 2005;30:505.
8.Soong J, Schafhalter-Zoppoth I, Gray AT. Sonographic imaging of the obturator nerve forregional block. Reg Anesth Pain Med. 2007;32:146–151.
9.Sinha SK, Abrams JH, Houle TT, Weller RS. Ultrasound-guided obturator nerve block: aninterfascial injection approach without nerve stimulation. Reg Anesth Pain Med. 2009;34:261–264.
10.Hospodar PP, Ashman ES, Traub JA. Anatomic study of the lateral femoral cutaneousnerve with respect to the ilioinguinal surgical dissection. J Orthop Trauma. 1999;13:17–19.
11.Aszmann OC, Dellon ES, Dellon AL. Anatomical course of the lateral femoral cutaneousnerve and its susceptibility to compression and injury. Plast Reconstr Surg.1997;100:600–604.
12.Hurdle MF, Weingarten TN, Crisostomo RA, Psimos C, Smith J. Ultrasound-guidedblockade of the lateral femoral cutaneous nerve: technical description and review of 10cases. Arch Phys Med Rehabil. 2007;88:1362–1364.
13.Saranteas T, Anagnostis G, Paraskeuopoulos T, et al. Anatomy and clinical implications ofthe ultrasound-guided subsartorial saphenous nerve block. Reg Anesth Pain Med.2011;36:399–402.
14.Horn JL, Pitsch T, Salinas F, Benninger B. Anatomic basis to the ultrasound-guidedapproach for saphenous nerve blockade. Reg Anesth Pain Med. 2009;34:486–489.
212
15.Tsui BC, Ozelsel T. Ultrasound-guided transsartorial perifemoral artery approach forsaphenous nerve block. Reg Anesth Pain Med. 2009;34:177–178.
16.Tsui BC, Finucane BT. The importance of ultrasound landmarks: a “traceback” approachusing the popliteal blood vessels for identification of the sciatic nerve. Reg Anesth PainMed. 2006;31:481–482.
17.Gaertner E, Lascurain P, Venet C, et al. Continuous parasacral sciatic block: aradiographic study. Anesth Analg. 2004;98:831–834, table.
18.Morris GF, Lang SA, Dust WN, Van der Wal M. The parasacral sciatic nerve block. RegAnesth. 1997;22:223–228.
19.Ripart J, Cuvillon P, Nouvellon E, Gaertner E, Eledjam JJ. Parasacral approach to blockthe sciatic nerve: a 400-case survey. Reg Anesth Pain Med. 2005;30:193–197.
20.Hagon BS, Itani O, Bidgoli JH, Van der Linden PJ. Parasacral sciatic nerve block: does theelicited motor response predict the success rate? Anesth Analg. 2007;105:263–266.
21.Ho AM, Karmakar MK. Combined paravertebral lumbar plexus and parasacral sciaticnerve block for reduction of hip fracture in a patient with severe aortic stenosis. Can JAnaesth. 2002;49:946–950.
22.Ben-Ari AY, Joshi R, Uskova A, Chelly JE. Ultrasound localization of the sacral plexususing a parasacral approach. Anesth Analg. 2009;108:1977–1980.
23.Guardini R, Waldron BA, Wallace WA. Sciatic nerve block: a new lateral approach. ActaAnaesthesiol Scand. 1985;29:515–519.
24.Andersen HL, Andersen SL, Tranum-Jensen J. Injection inside the paraneural sheath of thesciatic nerve: direct comparison among ultrasound imaging, macroscopic anatomy, andhistologic analysis. Reg Anesth Pain Med. 2012;37:410–414.
25.Floch H, Naux E, Pham DC, Dupas B, Pinaud M. Computed tomography scanning of thesciatic nerve posterior to the femur: Practical implications for the lateral midfemoralblock. Reg Anesth Pain Med. 2003;28:445–449.
26.Franco CD. Connective tissues associated with peripheral nerves. Reg Anesth Pain Med.2012;37:363–365.
27.Ota J, Sakura S, Hara K, Saito Y. Ultrasound-guided anterior approach to sciatic nerveblock: a comparison with the posterior approach. Anesth Analg. 2009;108:660–665.
28.Vloka JD, Hadzic A, April E, Thys DM. Anterior approach to the sciatic nerve block: theeffects of leg rotation. Anesth Analg. 2001;92:460–462.
29.Tsui BC, Ozelsel TJ. Ultrasound-guided anterior sciatic nerve block using a longitudinalapproach: “expanding the view.” Reg Anesth Pain Med. 2008;33:275–276.
30.Canella C, Demondion X, Guillin R, Boutry N, Peltier J, Cotten A. Anatomic study of thesuperficial peroneal nerve using sonography. AJR Am J Roentgenol. 2009;193:174–179.
31.Redborg KE, Sites BD, Chinn CD, et al. Ultrasound improves the success rate of a suralnerve block at the ankle. Reg Anesth Pain Med. 2009;34:24–28.
32.Redborg KE, Antonakakis JG, Beach ML, Chinn CD, Sites BD. Ultrasound improves thesuccess rate of a tibial nerve block at the ankle. Reg Anesth Pain Med. 2009;34:256–260.
33.Lopez AM, Sala-Blanch X, Magaldi M, Poggio D, Asuncion J, Franco CD. Ultrasound-guided ankle block for forefoot surgery: the contribution of the saphenous nerve. RegAnesth Pain Med. 2012;37:554–557.
213
CHAPTER 4
Sonoanatomy Relevant for Ultrasound-GuidedAbdominal Wall Nerve Blocks
IntroductionUltrasound-guided abdominal wall blocks are a recent innovation of the traditional landmark-based techniques of performing abdominal wall field blocks.1 These blocks include thetransverse abdominis plane (TAP) block (lateral/midaxillary and subcostal),1–8 rectus sheathblock, iliohypogastric and ilioinguinal nerve block,8 and the quadratus lumborum block(QLB).,,8–12 They are fairly simple to perform, largely devoid of complications, and producesensory and motor blockade of the abdominal wall.
Gross AnatomyMuscles of the Anterior Abdominal Wall
The anterior abdominal wall is made of four large, flat muscles on either side of the midline.They are the external oblique muscle (EOM, Figs. 4-1 to 4-3), internal oblique muscle (IOM,Figs. 4-3 to 4-5), transversus abdominis muscle (TAM, Figs. 4-3, 4-6, and 4-7), and the rectusabdominis muscle (RAM, Figs. 4-3 and 4-6). Two other smaller muscles, the cremaster andthe pyrimidalis, are also present. The EOM, IOM, and the TAM each end in a fibrousaponeurosis that extends up to the midline (Figs. 4-1, 4-4, and 4-6). The aponeuroses oneither side fuse in the midline to form a median band called the linea alba. The RAM islongitudinal in shape, runs vertically on either side of the linea alba (Fig. 4-6), and isenclosed in a fibrous sheath called the “rectus sheath” (see later, Fig. 4-4).
214

FIGURE 4-1 Figure showing the innervation of the trunk and the abdominal wall. Note theaponeurosis of the external oblique muscle and the anterior and posterior wall of the rectussheath (cutout view).
FIGURE 4-2 Figure showing the origin, insertion, and arrangement of the muscle fibers ofthe external oblique muscle.
215
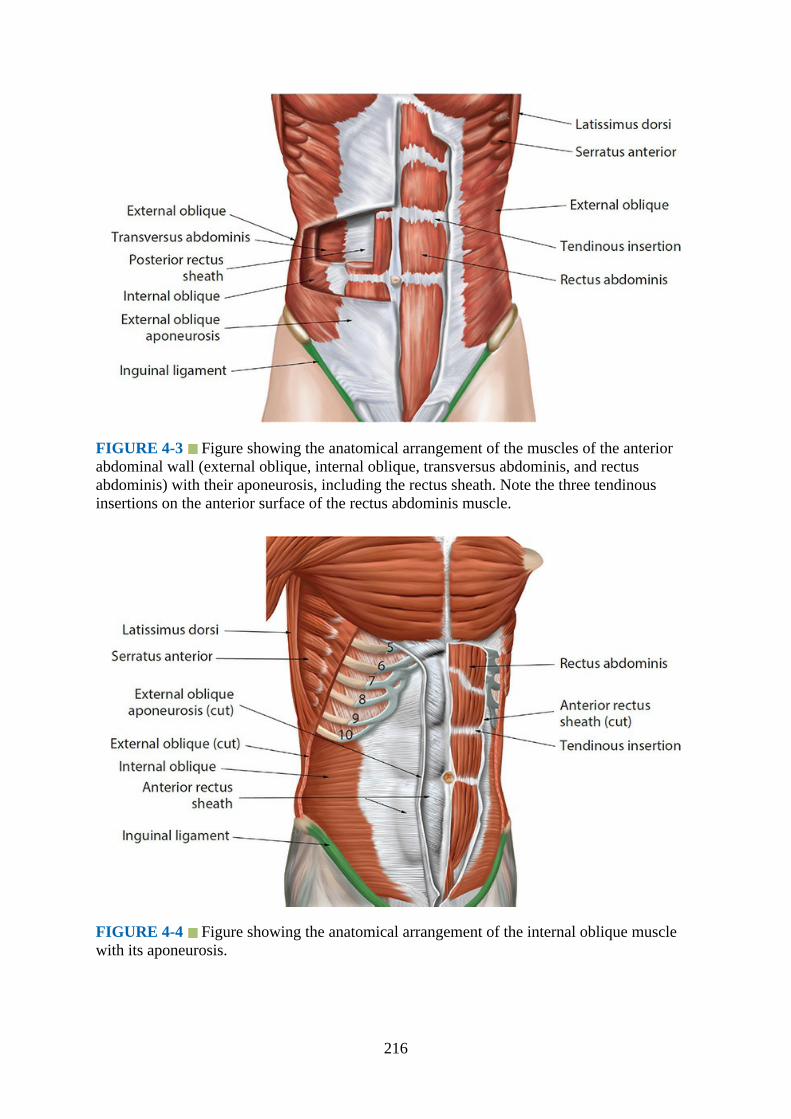
FIGURE 4-3 Figure showing the anatomical arrangement of the muscles of the anteriorabdominal wall (external oblique, internal oblique, transversus abdominis, and rectusabdominis) with their aponeurosis, including the rectus sheath. Note the three tendinousinsertions on the anterior surface of the rectus abdominis muscle.
FIGURE 4-4 Figure showing the anatomical arrangement of the internal oblique musclewith its aponeurosis.
216
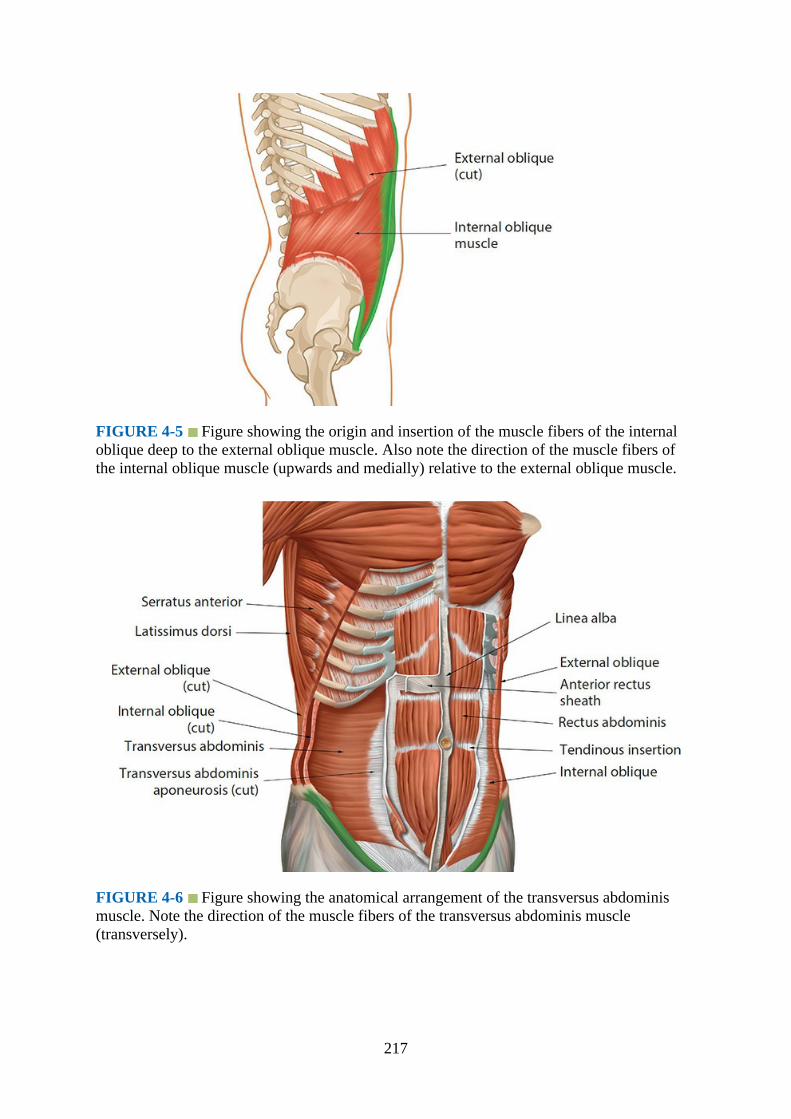
FIGURE 4-5 Figure showing the origin and insertion of the muscle fibers of the internaloblique deep to the external oblique muscle. Also note the direction of the muscle fibers ofthe internal oblique muscle (upwards and medially) relative to the external oblique muscle.
FIGURE 4-6 Figure showing the anatomical arrangement of the transversus abdominismuscle. Note the direction of the muscle fibers of the transversus abdominis muscle(transversely).
217

FIGURE 4-7 Figure showing the origin and insertion of the transversus abdominis muscleand its relation to the external and internal oblique muscles.
The EOM originates as eight fleshy slips from the lower eight ribs (Fig. 4-2). The upperslips of the origin of the EOM interdigitate with that of the serratus anterior muscle, and thelower slips of the EOM interdigitate with that of the latissimus dorsi muscle. The fibers of themuscle run downwards, forward, and medially (Fig. 4-2) to end in a broad aponeurosis (Fig.4-1), which is inserted (from above downwards) to the xiphoid process, pubic symphysis,pubic crest, and the pectineal line of the pubis. The caudal fibers of the muscle are inserted tothe anterior two-thirds of the outer lip of the iliac crest (Fig. 4-2). The caudal end of theexternal oblique aponeurosis is folded on itself to form the inguinal ligament, and above thepubic tubercle there is a small triangular opening called the superficial inguinal ring. Medialto the lateral edge of the rectus abdominis muscle the external oblique aponeurosiscontributes to forming the rectus sheath (Fig. 4-6, see later).
The IOM originates from the lateral two-thirds of the inguinal ligament, anterior two-thirds of the intermediate area of the iliac crest (Fig. 4-5), and the thoracolumbar fasciaposteriorly. From its origin the fibers of the IOM run obliquely upwards, forwards, andmedially, crossing the fibers of the EOM at right angles (Fig. 4-5), to end in an aponeurosisthrough which it is attached to the xiphoid process, the seventh to ninth costal cartilage, lineaalba, pubic crest, and pectineal line. The IOM aponeurosis also contributes to the formationof the rectus sheath (Fig. 4-4, see later).
The TAM has a fleshy origin from the lateral one-third of the inguinal ligament, anteriortwo-thirds of the inner lip of the iliac crest, thoracolumbar fascia posteriorly, and the innersurface of the lower six costal cartilages. The fibers of the TAM are directed horizontallyforwards (Figs. 4-6 and 4-7) and end in an aponeurosis that is attached to the xiphoid process,linea alba, pubic crest, and pectineal line of the pubis. At the lower part of the TAM the lowerfibers of the muscle fuse with the lower fibers of the IOM to form the conjoint tendon. TheTAM aponeurosis also takes part in the formation of the rectus sheath (Fig. 4-6, see later).The neurovascular structures of the abdominal wall lie in between the IOM and TAM (Fig. 4-8). This intermuscular plane is also referred to as the transversus abdominis plane (TAP, Figs.4-9 to 4-11) and is a popular site for ultrasound-guided abdominal wall nerve blocks.
218
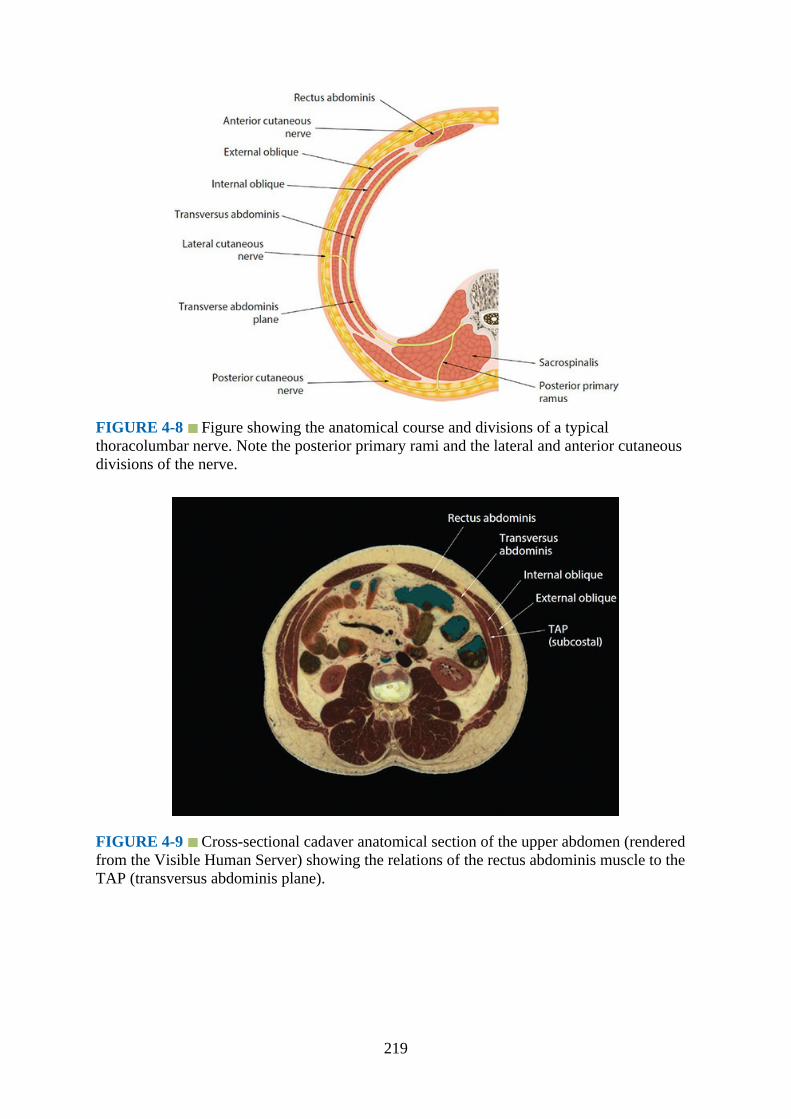
FIGURE 4-8 Figure showing the anatomical course and divisions of a typicalthoracolumbar nerve. Note the posterior primary rami and the lateral and anterior cutaneousdivisions of the nerve.
FIGURE 4-9 Cross-sectional cadaver anatomical section of the upper abdomen (renderedfrom the Visible Human Server) showing the relations of the rectus abdominis muscle to theTAP (transversus abdominis plane).
219

FIGURE 4-10 Coronal cadaver anatomic section (rendered from the Visible HumanServer) showing anatomical relations of the TAP (transversus abdominis plane).
FIGURE 4-11 Cross-sectional cadaver anatomical section of the abdomen (rendered fromthe Visible Human Server) showing the posterior relations of the TAP (transversus abdominisplane).
The rectus abdominis muscle (RAM) originates as two heads from the lateral (lateral head)part of the pubic crest and from the anterior pubic ligament (medial head). The fibers of theRAM run vertically upwards to be inserted into the anterior aspect of the chest wall, that is, tothe xiphoid process and the fifth to seventh costal cartilages (Fig. 4-12). There are threefibrous bands, also called the tendinous insertions or inscriptions, on the anterior surface ofthe RAM (Figs. 4-6 and 4-12). The most cephalad tendinous insertion lies opposite the free
220
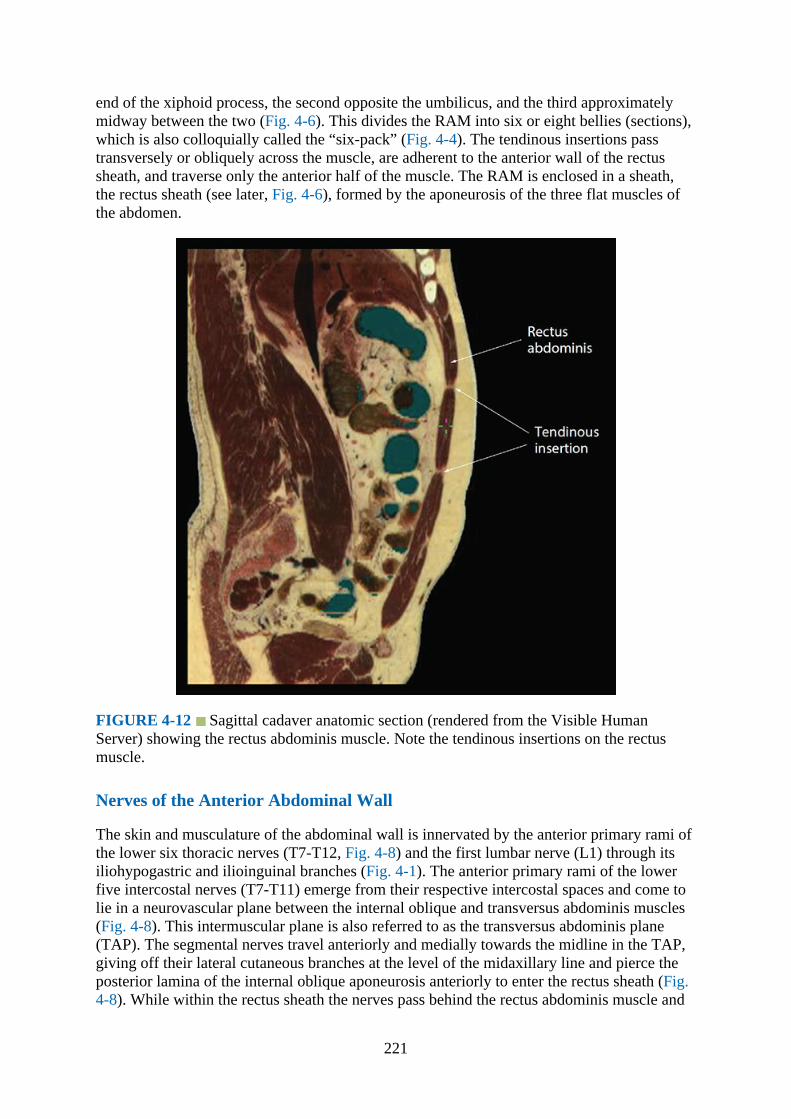
end of the xiphoid process, the second opposite the umbilicus, and the third approximatelymidway between the two (Fig. 4-6). This divides the RAM into six or eight bellies (sections),which is also colloquially called the “six-pack” (Fig. 4-4). The tendinous insertions passtransversely or obliquely across the muscle, are adherent to the anterior wall of the rectussheath, and traverse only the anterior half of the muscle. The RAM is enclosed in a sheath,the rectus sheath (see later, Fig. 4-6), formed by the aponeurosis of the three flat muscles ofthe abdomen.
FIGURE 4-12 Sagittal cadaver anatomic section (rendered from the Visible HumanServer) showing the rectus abdominis muscle. Note the tendinous insertions on the rectusmuscle.
Nerves of the Anterior Abdominal Wall
The skin and musculature of the abdominal wall is innervated by the anterior primary rami ofthe lower six thoracic nerves (T7-T12, Fig. 4-8) and the first lumbar nerve (L1) through itsiliohypogastric and ilioinguinal branches (Fig. 4-1). The anterior primary rami of the lowerfive intercostal nerves (T7-T11) emerge from their respective intercostal spaces and come tolie in a neurovascular plane between the internal oblique and transversus abdominis muscles(Fig. 4-8). This intermuscular plane is also referred to as the transversus abdominis plane(TAP). The segmental nerves travel anteriorly and medially towards the midline in the TAP,giving off their lateral cutaneous branches at the level of the midaxillary line and pierce theposterior lamina of the internal oblique aponeurosis anteriorly to enter the rectus sheath (Fig.4-8). While within the rectus sheath the nerves pass behind the rectus abdominis muscle and
221

lie in front of the epigastric arteries. They then pierce the rectus muscle and the anteriorrectus sheath to emerge anteriorly as the anterior cutaneous branches, which supply theoverlying skin (Fig. 4-8). The lateral and anterior cutaneous branches supply the skin of theabdomen from the midline to the anterior axillary line. T7 provides sensory supply to theepigastrium, T10 to the umbilicus, and L1 to the groin.
The subcostal nerve is the anterior primary rami of the 12th thoracic nerve and enters theabdomen posteriorly under the lateral arcuate ligament of the diaphragm. It then passeslaterally on the anterior surface of the quadratus lumborum muscle and pierces thetransversus abdominis muscle to enter the TAP. The remaining part of the course of thesubcostal nerve is similar to that of the other thoracolumbar nerves except that it supplies thepyramidalis muscle, and its lateral cutaneous branch supplies the upper and lateral aspect ofthe gluteal region (Fig. 4-1).
The first lumbar nerve (L1) divides in front of the quadratus lumborum muscle into theiliohypogastric and ilioinguinal nerves after which they pierce the transversus abdominismuscle to enter the TAP (Figs. 4-13 and 4-14). The iliohypogastric nerve then travelsanteriorly in the TAP and pierces the internal oblique muscle about 1 inch in front of theanterior superior iliac spine (Fig. 4-1). It then becomes superficial by piercing the externaloblique aponeurosis close to the superficial inguinal ring and supplies the skin over thesuprapubic region. The lateral cutaneous branch of the iliohypogastric nerve supplies theupper and lateral aspect of the gluteal region (Fig. 4-1). The ilioinguinal nerve has no lateralcutaneous branch but also pierces the internal oblique muscle. It then traverses the inguinalcanal with the spermatic cord or the round ligament of the uterus to emerge through thesuperficial inguinal ring or through the adjacent external oblique aponeurosis to supply theskin of the upper and medial aspect of the thigh and the genitals.
FIGURE 4-13 Cross-sectional cadaver anatomical section of the lower abdomen (renderedfrom the Visible Human Server) from the level of the anterior superior iliac spine showingthe relations of the TAP (transversus abdominis plane) to the lower abdomen.
222
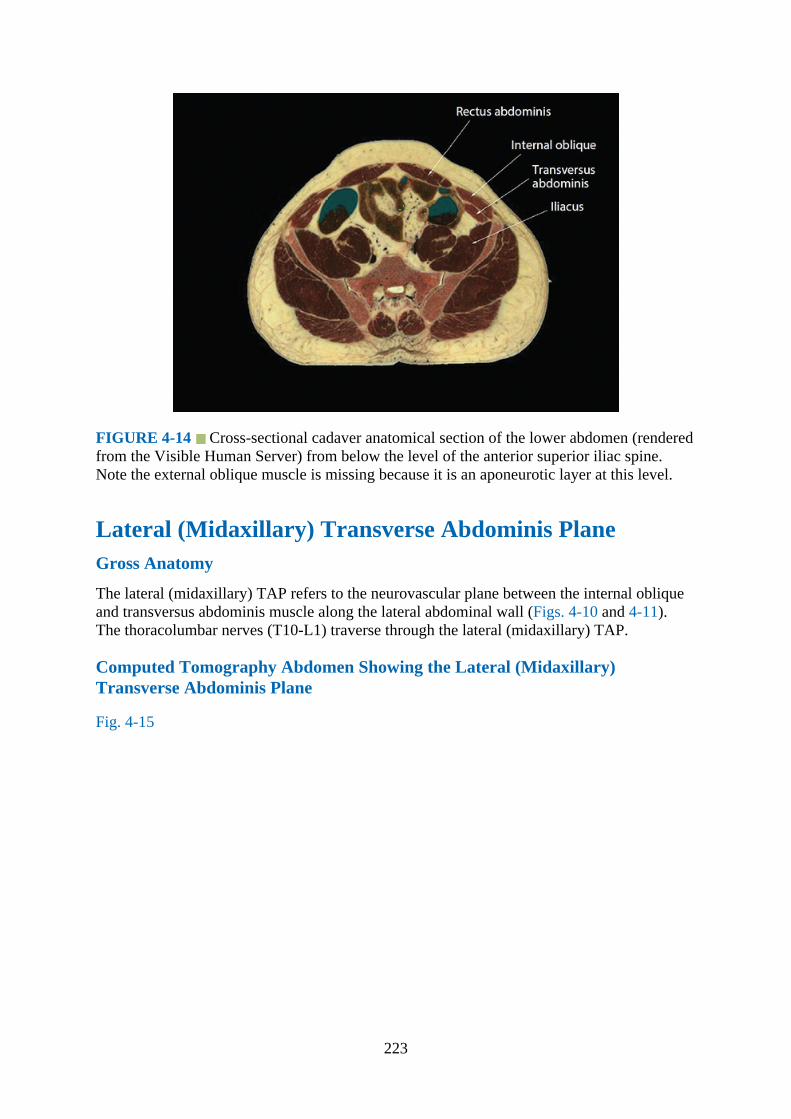
FIGURE 4-14 Cross-sectional cadaver anatomical section of the lower abdomen (renderedfrom the Visible Human Server) from below the level of the anterior superior iliac spine.Note the external oblique muscle is missing because it is an aponeurotic layer at this level.
Lateral (Midaxillary) Transverse Abdominis PlaneGross Anatomy
The lateral (midaxillary) TAP refers to the neurovascular plane between the internal obliqueand transversus abdominis muscle along the lateral abdominal wall (Figs. 4-10 and 4-11).The thoracolumbar nerves (T10-L1) traverse through the lateral (midaxillary) TAP.
Computed Tomography Abdomen Showing the Lateral (Midaxillary)Transverse Abdominis Plane
Fig. 4-15
223
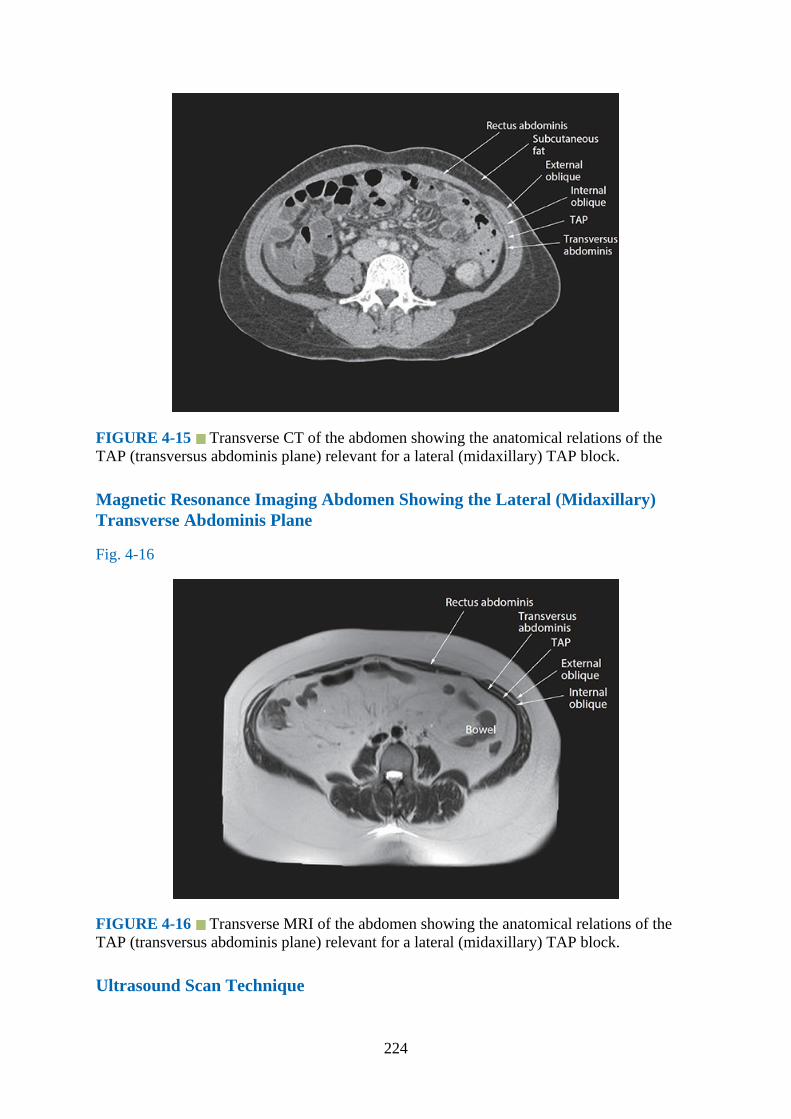
FIGURE 4-15 Transverse CT of the abdomen showing the anatomical relations of theTAP (transversus abdominis plane) relevant for a lateral (midaxillary) TAP block.
Magnetic Resonance Imaging Abdomen Showing the Lateral (Midaxillary)Transverse Abdominis Plane
Fig. 4-16
FIGURE 4-16 Transverse MRI of the abdomen showing the anatomical relations of theTAP (transversus abdominis plane) relevant for a lateral (midaxillary) TAP block.
Ultrasound Scan Technique
224
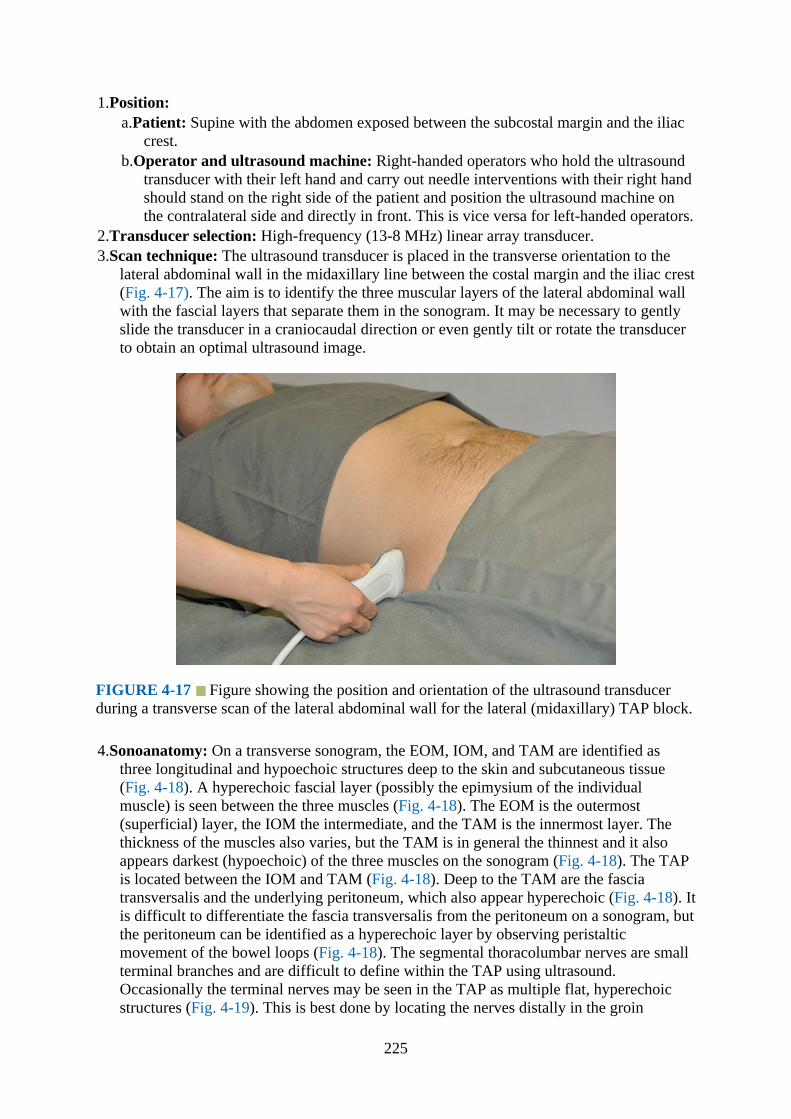
1.Position:a.Patient: Supine with the abdomen exposed between the subcostal margin and the iliac
crest.b.Operator and ultrasound machine: Right-handed operators who hold the ultrasound
transducer with their left hand and carry out needle interventions with their right handshould stand on the right side of the patient and position the ultrasound machine onthe contralateral side and directly in front. This is vice versa for left-handed operators.
2.Transducer selection: High-frequency (13-8 MHz) linear array transducer.3.Scan technique: The ultrasound transducer is placed in the transverse orientation to the
lateral abdominal wall in the midaxillary line between the costal margin and the iliac crest(Fig. 4-17). The aim is to identify the three muscular layers of the lateral abdominal wallwith the fascial layers that separate them in the sonogram. It may be necessary to gentlyslide the transducer in a craniocaudal direction or even gently tilt or rotate the transducerto obtain an optimal ultrasound image.
FIGURE 4-17 Figure showing the position and orientation of the ultrasound transducerduring a transverse scan of the lateral abdominal wall for the lateral (midaxillary) TAP block.
4.Sonoanatomy: On a transverse sonogram, the EOM, IOM, and TAM are identified asthree longitudinal and hypoechoic structures deep to the skin and subcutaneous tissue(Fig. 4-18). A hyperechoic fascial layer (possibly the epimysium of the individualmuscle) is seen between the three muscles (Fig. 4-18). The EOM is the outermost(superficial) layer, the IOM the intermediate, and the TAM is the innermost layer. Thethickness of the muscles also varies, but the TAM is in general the thinnest and it alsoappears darkest (hypoechoic) of the three muscles on the sonogram (Fig. 4-18). The TAPis located between the IOM and TAM (Fig. 4-18). Deep to the TAM are the fasciatransversalis and the underlying peritoneum, which also appear hyperechoic (Fig. 4-18). Itis difficult to differentiate the fascia transversalis from the peritoneum on a sonogram, butthe peritoneum can be identified as a hyperechoic layer by observing peristalticmovement of the bowel loops (Fig. 4-18). The segmental thoracolumbar nerves are smallterminal branches and are difficult to define within the TAP using ultrasound.Occasionally the terminal nerves may be seen in the TAP as multiple flat, hyperechoicstructures (Fig. 4-19). This is best done by locating the nerves distally in the groin
225
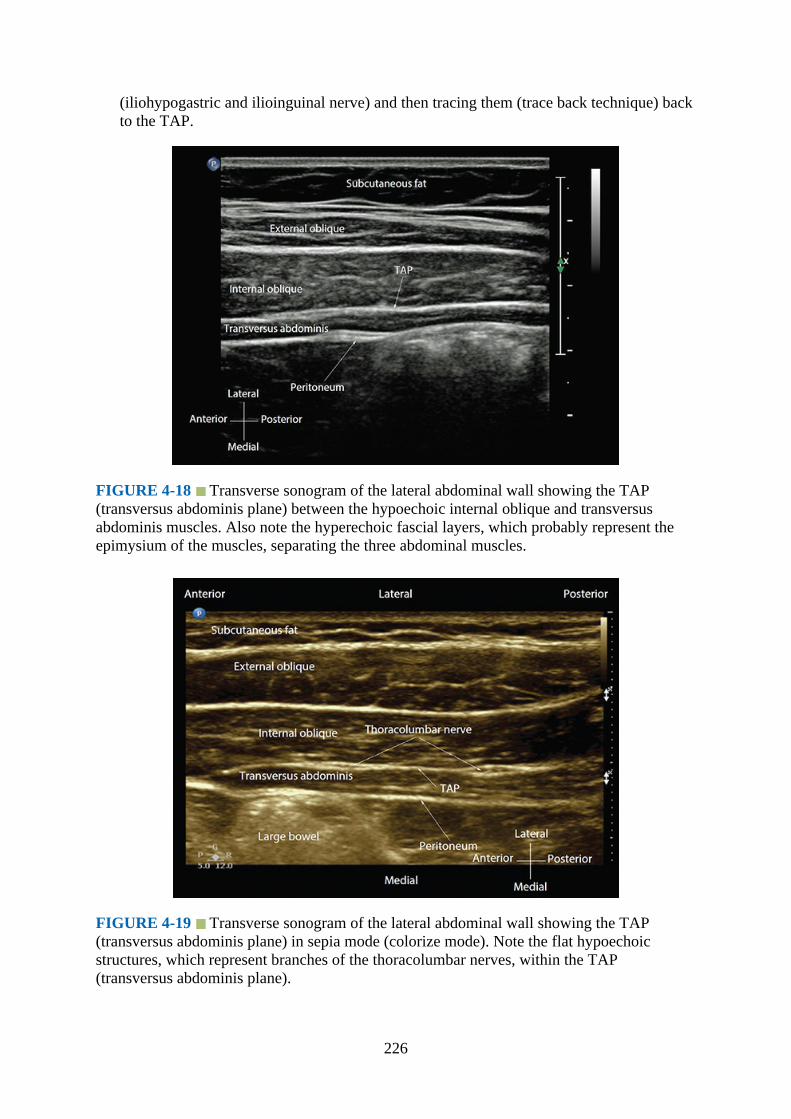
(iliohypogastric and ilioinguinal nerve) and then tracing them (trace back technique) backto the TAP.
FIGURE 4-18 Transverse sonogram of the lateral abdominal wall showing the TAP(transversus abdominis plane) between the hypoechoic internal oblique and transversusabdominis muscles. Also note the hyperechoic fascial layers, which probably represent theepimysium of the muscles, separating the three abdominal muscles.
FIGURE 4-19 Transverse sonogram of the lateral abdominal wall showing the TAP(transversus abdominis plane) in sepia mode (colorize mode). Note the flat hypoechoicstructures, which represent branches of the thoracolumbar nerves, within the TAP(transversus abdominis plane).
226
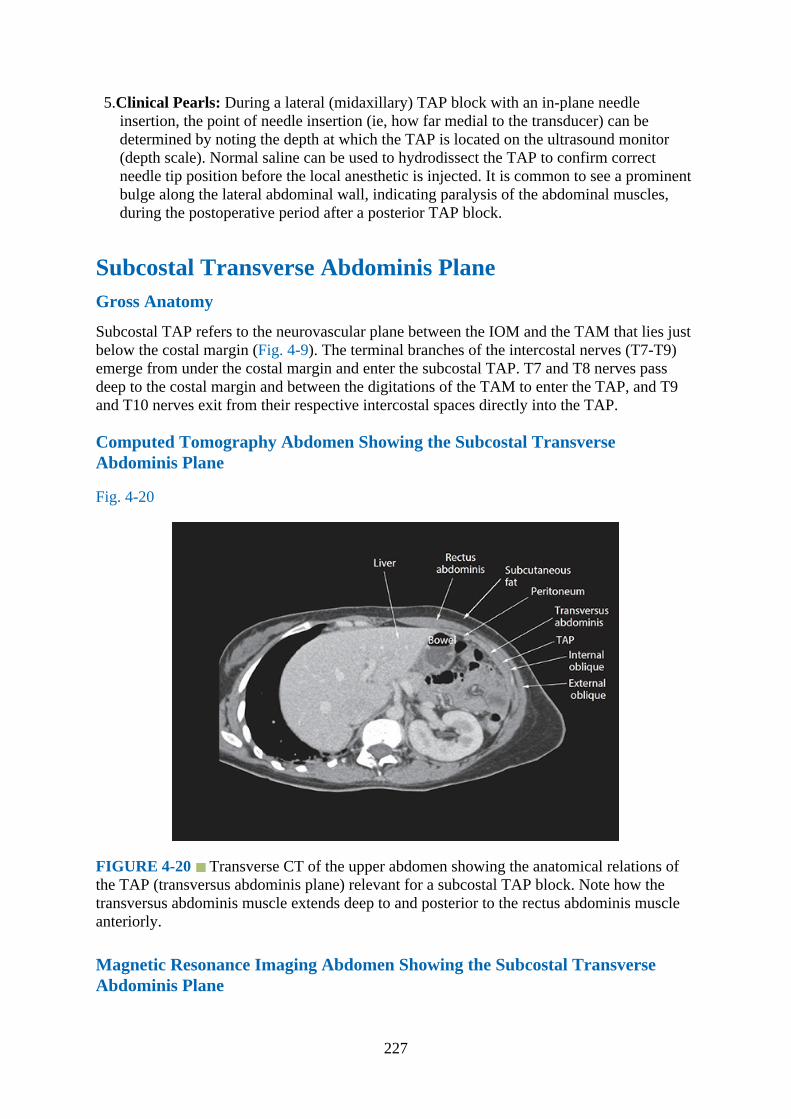
5.Clinical Pearls: During a lateral (midaxillary) TAP block with an in-plane needleinsertion, the point of needle insertion (ie, how far medial to the transducer) can bedetermined by noting the depth at which the TAP is located on the ultrasound monitor(depth scale). Normal saline can be used to hydrodissect the TAP to confirm correctneedle tip position before the local anesthetic is injected. It is common to see a prominentbulge along the lateral abdominal wall, indicating paralysis of the abdominal muscles,during the postoperative period after a posterior TAP block.
Subcostal Transverse Abdominis PlaneGross Anatomy
Subcostal TAP refers to the neurovascular plane between the IOM and the TAM that lies justbelow the costal margin (Fig. 4-9). The terminal branches of the intercostal nerves (T7-T9)emerge from under the costal margin and enter the subcostal TAP. T7 and T8 nerves passdeep to the costal margin and between the digitations of the TAM to enter the TAP, and T9and T10 nerves exit from their respective intercostal spaces directly into the TAP.
Computed Tomography Abdomen Showing the Subcostal TransverseAbdominis Plane
Fig. 4-20
FIGURE 4-20 Transverse CT of the upper abdomen showing the anatomical relations ofthe TAP (transversus abdominis plane) relevant for a subcostal TAP block. Note how thetransversus abdominis muscle extends deep to and posterior to the rectus abdominis muscleanteriorly.
Magnetic Resonance Imaging Abdomen Showing the Subcostal TransverseAbdominis Plane
227

Fig. 4-21
FIGURE 4-21 Transverse MRI of the upper abdomen showing the anatomical relations ofthe TAP (transversus abdominis plane) relevant for a subcostal TAP block.
Ultrasound Scan Technique
1.Position:a.Patient: Supine with the abdomen exposed between the costal margin and the iliac
crest.b.Operator and ultrasound machine: For a bilateral subcostal TAP block, right-handed
operators who hold the ultrasound transducer with their left hand and carry out needleinterventions with their right hand should stand on the left side of the patient andposition the ultrasound machine on the contralateral side and directly in front. This isvice versa for left-handed operators.
2.Transducer selection: High-frequency (13-8 MHz) linear array transducer.3.Scan technique: The ultrasound transducer is placed immediately below and parallel to the
costal margin, typically lateral to the linea semilunaris (Fig. 4-22). The aim is to identifythe three muscular layers of the lateral abdominal wall with the fascial layers that separatethem on the sonogram.
228

FIGURE 4-22 Figure showing the position and orientation of the ultrasound transducerduring a transverse scan of the anterior abdominal wall for a TAP (transversus abdominisplane) block at the subcostal region.
4.Sonoanatomy: At the medial end, the linea semilunaris is seen lateral to the RAM (Figs. 4-23 and 4-24), and the TAM may be the only muscle between the skin and the peritoneum.Laterally and along the midclavicular line the three muscular layers of the abdominal walland the TAP are clearly delineated and appear similar to the lateral (midaxillary) TAP(Figs. 4-23 to 4-26).
FIGURE 4-23 Transverse sonogram of the anterior abdominal wall showing the formationof the linea semilunaris and the transversus abdominis plane (TAP) lateral to the lateral edgeof the rectus abdominis muscle (in colorize mode). Also note how the transversus abdominismuscle extends deep to and posterior to the rectus abdominis muscle medially.
229

FIGURE 4-24 Transverse sonogram of the anterior abdominal wall showing a close-upview of the aponeurotic layers of the three abdominal muscles at the level of the lineasemilunaris lateral to the lateral edge of the rectus abdominis muscle.
FIGURE 4-25 Transverse sonogram (panoramic view) of the right subcostal regionshowing the anatomic relations of the anterior abdominal muscles and the formation of thetransversus abdominis plane (TAP).
230

FIGURE 4-26 Transverse sonogram (panoramic view) of the left subcostal region showingthe anatomic relations of the anterior abdominal muscles and the formation of the transversusabdominis plane (TAP).
5.Clinical Pearls: During a subcostal TAP block, a multiple injection technique producesgreater spread of the injectate compared to a single injection in the TAP lateral to thelinea semilunaris.,13 The aim during a multiple injection technique is to hydrodissect theTAP plane such that the injection is deposited progressively more laterally from the lineasemilunaris.
Rectus SheathGross Anatomy
The rectus sheath is an aponeurotic sheath that covers the rectus abdominis muscle (Fig. 4-1).It is made up of an anterior and a posterior wall that are formed by the aponeurosis of thethree flat muscles of the abdomen (Figs. 4-27 to 4-29). The anterior wall is completethroughout its length and adherent to the tendinous insertions of the RAM. In contrast, theposterior wall of the rectus sheath is free (not adherent) from the RAM and incomplete belowthe “arcuate line” (Fig. 4-29). The latter is also referred to as the “linea semicircularis” or“fold of Douglas” and lies about one-third the distance from the umbilicus to the pubic crest,but there are variations. Above the costal margin the anterior wall is formed by the externaloblique aponeurosis, and the posterior wall is deficient and the muscle lies directly on thecostal cartilages with an intervening layer of fatty tissue (Fig. 4-27). In between the costalmargin and the arcuate line the anterior wall is formed by the external oblique aponeurosisand the anterior lamina of the IOM, and the posterior wall is formed by the posterior laminaof the IOM and the aponeurosis of the TAM (Fig. 4-28). Below the arcuate line the anteriorwall is formed by the aponeurosis of all the three flat muscles of the anterior abdominal wall,but the posterior wall is deficient and the RAM lies directly on the fascia transversalis, beingseparated from it by a layer of loose extraperitoneal fatty tissue (Fig. 4-29). The rectus sheathon either side is held together in the midline by a median raphe, the linea alba (Fig. 4-1),
231

which extends form the xiphoid process to the pubic symphysis.
FIGURE 4-27 Figure showing the formation of the rectus sheath in transverse sectionabove the costal margin.
FIGURE 4-28 Figure showing the formation of the rectus sheath in transverse sectionbetween the costal cartilage and the arcuate line.
FIGURE 4-29 Figure showing the formation of the rectus sheath in transverse sectionbelow the arcuate line.
Computed Tomography Abdomen Showing the Rectus Abdominis Muscle
232
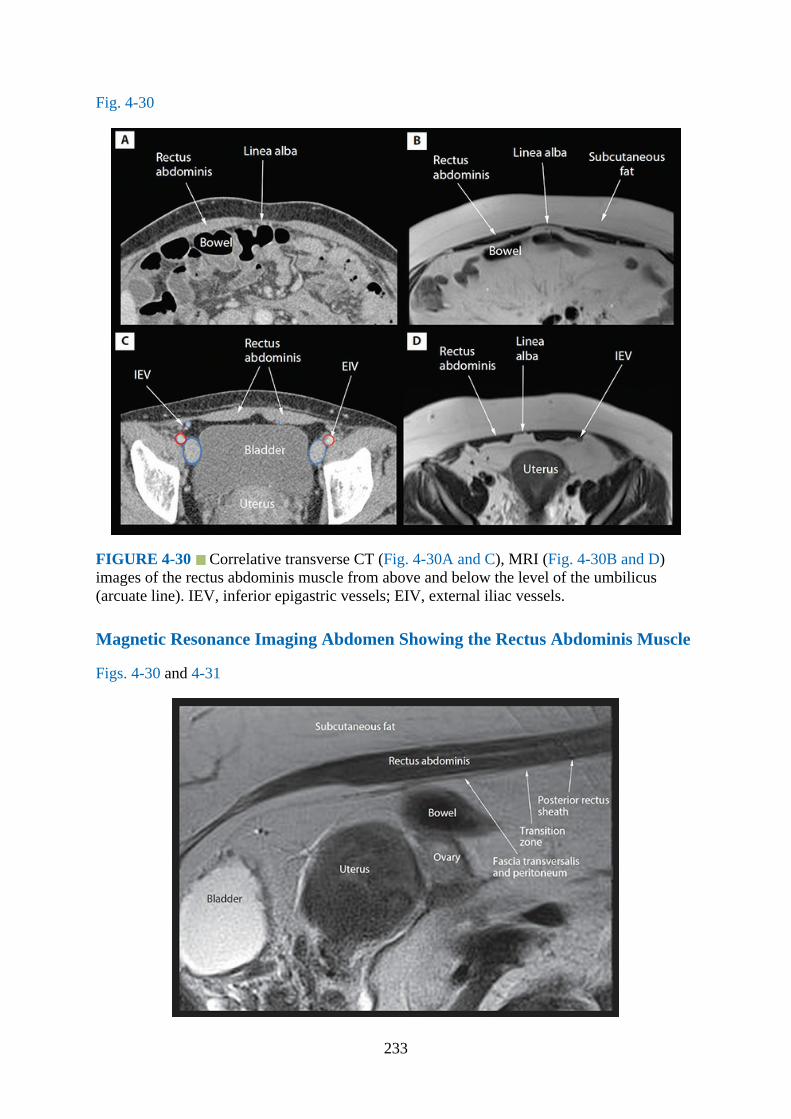
Fig. 4-30
FIGURE 4-30 Correlative transverse CT (Fig. 4-30A and C), MRI (Fig. 4-30B and D)images of the rectus abdominis muscle from above and below the level of the umbilicus(arcuate line). IEV, inferior epigastric vessels; EIV, external iliac vessels.
Magnetic Resonance Imaging Abdomen Showing the Rectus Abdominis Muscle
Figs. 4-30 and 4-31
233

FIGURE 4-31 Sagittal MRI image of the lower abdomen showing the rectus abdominismuscle and the transition zone at the level of the arcuate line on the posterior aspect of themuscle.
Ultrasound Scan Technique
1.Position:a.Patient: Supine with the abdomen exposed between the costal margin and the iliac
crest.b.Operator and ultrasound machine: For a scan of the RAM and rectus sheath, the
operator stands on one side of the subject and the ultrasound machine is placeddirectly opposite on the contralateral side. For a bilateral rectus sheath block, right-handed operators who hold the ultrasound transducer with their left hand and carryout needle interventions with their right hand should stand on the left side of thepatient and position the ultrasound machine directly in front on the contralateral side.This is vice-versa for left-handed operators.
2.Transducer selection: High-frequency (13-8 MHz) linear array transducer.3.Scan technique: For a transverse scan of the RAM and the rectus sheath, the ultrasound
transducer is positioned above the umbilicus (ie, above the arcuate line) and to one side ofthe midline (Fig. 4-32). The aim is to obtain a transverse view of the RAM, which is seenas a hypoechoic oval-to-elliptical structure that is surrounded by its hyperechoicepimysium (Figs. 4-33 and 4-34). For a sagittal scan, the ultrasound transducer is rotatedthrough 90 degrees and positioned midway between the xiphisternum and the umbilicusto obtain a longitudinal view of the RAM (Fig. 4-35).
FIGURE 4-32 Figure showing the position and orientation of the ultrasound transducerduring a transverse scan of the anterior abdominal wall for the rectus abdominis muscleabove the arcuate line.
234
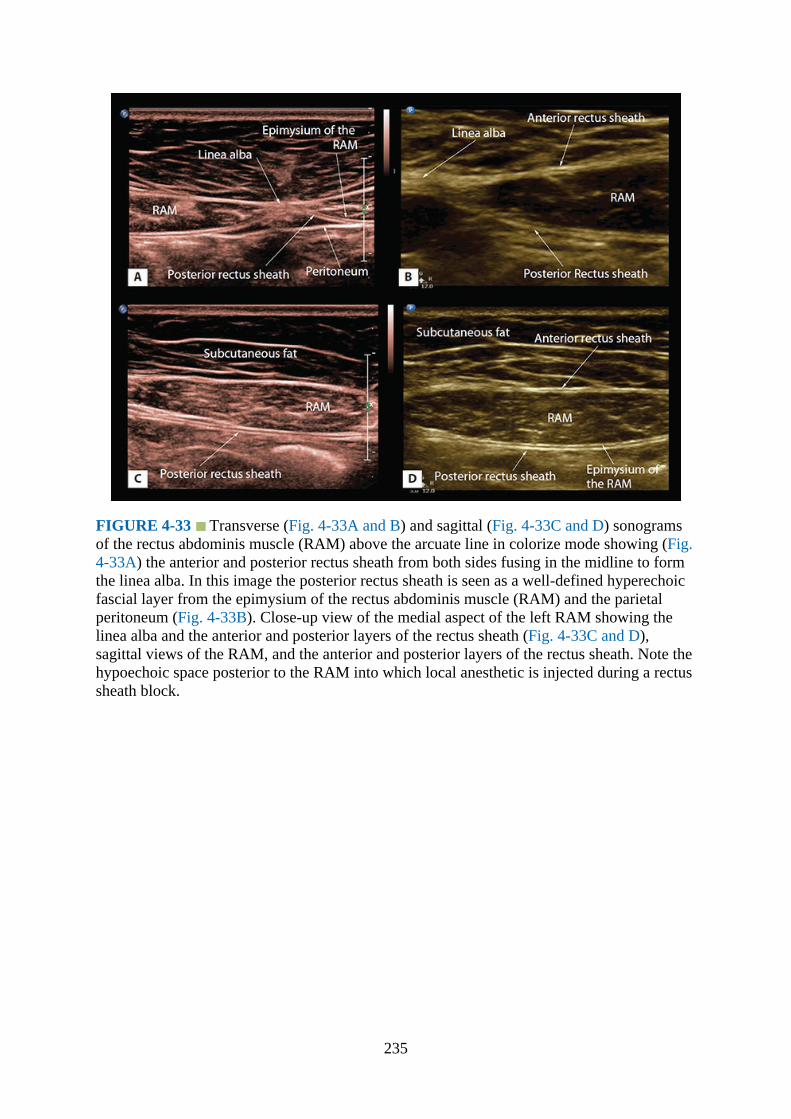
FIGURE 4-33 Transverse (Fig. 4-33A and B) and sagittal (Fig. 4-33C and D) sonogramsof the rectus abdominis muscle (RAM) above the arcuate line in colorize mode showing (Fig.4-33A) the anterior and posterior rectus sheath from both sides fusing in the midline to formthe linea alba. In this image the posterior rectus sheath is seen as a well-defined hyperechoicfascial layer from the epimysium of the rectus abdominis muscle (RAM) and the parietalperitoneum (Fig. 4-33B). Close-up view of the medial aspect of the left RAM showing thelinea alba and the anterior and posterior layers of the rectus sheath (Fig. 4-33C and D),sagittal views of the RAM, and the anterior and posterior layers of the rectus sheath. Note thehypoechoic space posterior to the RAM into which local anesthetic is injected during a rectussheath block.
235

FIGURE 4-34 Transverse sonogram of the anterior abdominal wall (close to the midline)above the arcuate line showing the medial aspect of the rectus abdominis muscle (RAM)from both sides with the rectus sheath and the linea alba.
FIGURE 4-35 Figure showing the position and orientation of the ultrasound transducerduring a sagittal scan of the anterior abdominal wall for the rectus abdominis muscle abovethe arcuate line.
4.Sonoanatomy: On a transverse sonogram, the RAM is seen as a hypoechoic oval-to-elliptical structure that is surrounded by a hyperechoic epimysium (Figs. 4-33 and 4-34).Between the costal margin and the arcuate line, the RAM is enveloped by a further layerof fibrous connective tissue, the rectus sheath (details provided earlier), which alsoappears hyperechoic and can be traced medially to the midline where it is continuous withthe linea alba (Fig. 4-34). Below the arcuate line the posterior rectus sheath is deficient
236
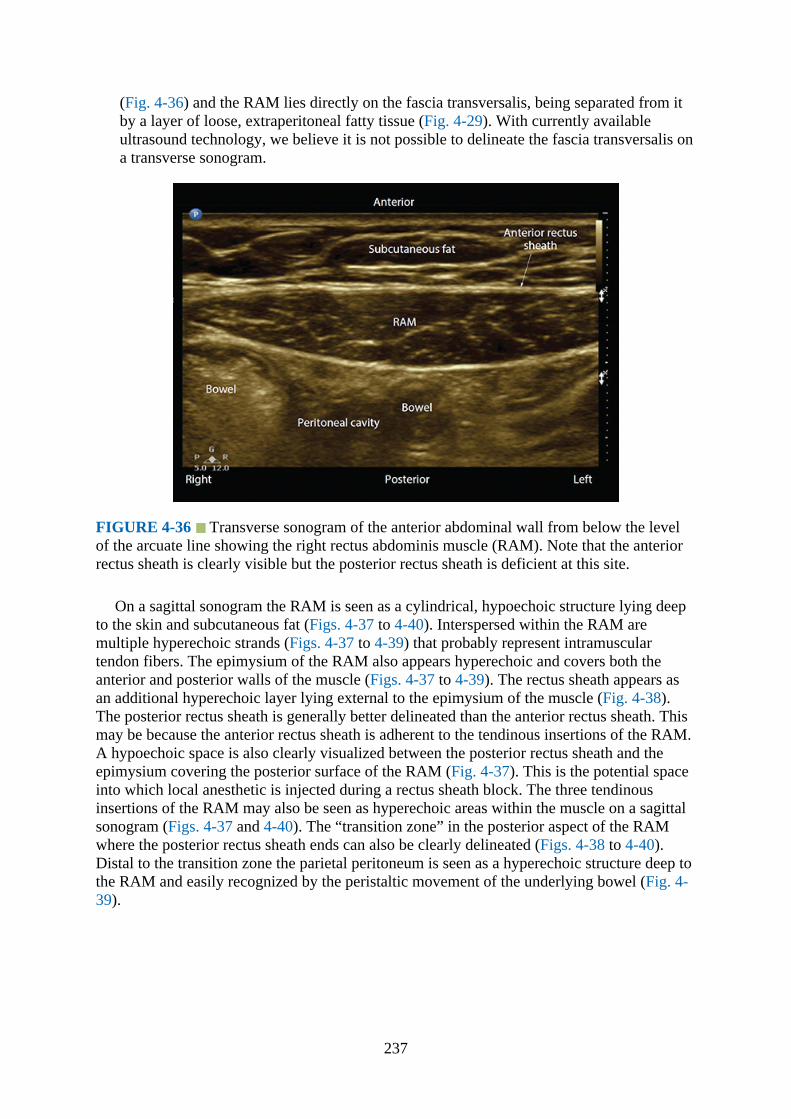
(Fig. 4-36) and the RAM lies directly on the fascia transversalis, being separated from itby a layer of loose, extraperitoneal fatty tissue (Fig. 4-29). With currently availableultrasound technology, we believe it is not possible to delineate the fascia transversalis ona transverse sonogram.
FIGURE 4-36 Transverse sonogram of the anterior abdominal wall from below the levelof the arcuate line showing the right rectus abdominis muscle (RAM). Note that the anteriorrectus sheath is clearly visible but the posterior rectus sheath is deficient at this site.
On a sagittal sonogram the RAM is seen as a cylindrical, hypoechoic structure lying deepto the skin and subcutaneous fat (Figs. 4-37 to 4-40). Interspersed within the RAM aremultiple hyperechoic strands (Figs. 4-37 to 4-39) that probably represent intramusculartendon fibers. The epimysium of the RAM also appears hyperechoic and covers both theanterior and posterior walls of the muscle (Figs. 4-37 to 4-39). The rectus sheath appears asan additional hyperechoic layer lying external to the epimysium of the muscle (Fig. 4-38).The posterior rectus sheath is generally better delineated than the anterior rectus sheath. Thismay be because the anterior rectus sheath is adherent to the tendinous insertions of the RAM.A hypoechoic space is also clearly visualized between the posterior rectus sheath and theepimysium covering the posterior surface of the RAM (Fig. 4-37). This is the potential spaceinto which local anesthetic is injected during a rectus sheath block. The three tendinousinsertions of the RAM may also be seen as hyperechoic areas within the muscle on a sagittalsonogram (Figs. 4-37 and 4-40). The “transition zone” in the posterior aspect of the RAMwhere the posterior rectus sheath ends can also be clearly delineated (Figs. 4-38 to 4-40).Distal to the transition zone the parietal peritoneum is seen as a hyperechoic structure deep tothe RAM and easily recognized by the peristaltic movement of the underlying bowel (Fig. 4-39).
237

FIGURE 4-37 Sagittal sonogram of the anterior abdominal wall showing the rectusabdominis muscle (RAM) with the anterior and posterior layers of the rectus sheath. Alsonote the hyperechoic tendinous insertion of the rectus abdominis muscle and the hypoechoicspace between the epimysium of the RAM and the posterior rectus sheath.
FIGURE 4-38 Sagittal sonogram of the anterior abdominal wall at the level of the arcuateline showing the “transition zone” where the posterior rectus sheath ends. RAM, rectusabdominis muscle.
238

FIGURE 4-39 Sagittal sonogram of the anterior abdominal wall showing the intermusculartendons (hyperechoic) of the rectus abdominis muscle (RAM). Because the ultrasound scan isat the level of the arcuate line, the “transition zone” is clearly visible. The peritoneum is alsoseen as a hyperechoic structure and distinct from the posterior rectus sheath.
FIGURE 4-40 Sagittal sonogram (panoramic view) of the rectus abdominis muscle (RAM)showing the anatomy of the rectus sheath. Note the posterior rectus sheath is deficient distalto the “transition zone” (ie, distal to the arcuate line). Also one of the tendinous insertions isvisible above the arcuate line in this sonogram.
Ilioinguinal and Iliohypogastric Nerve
239
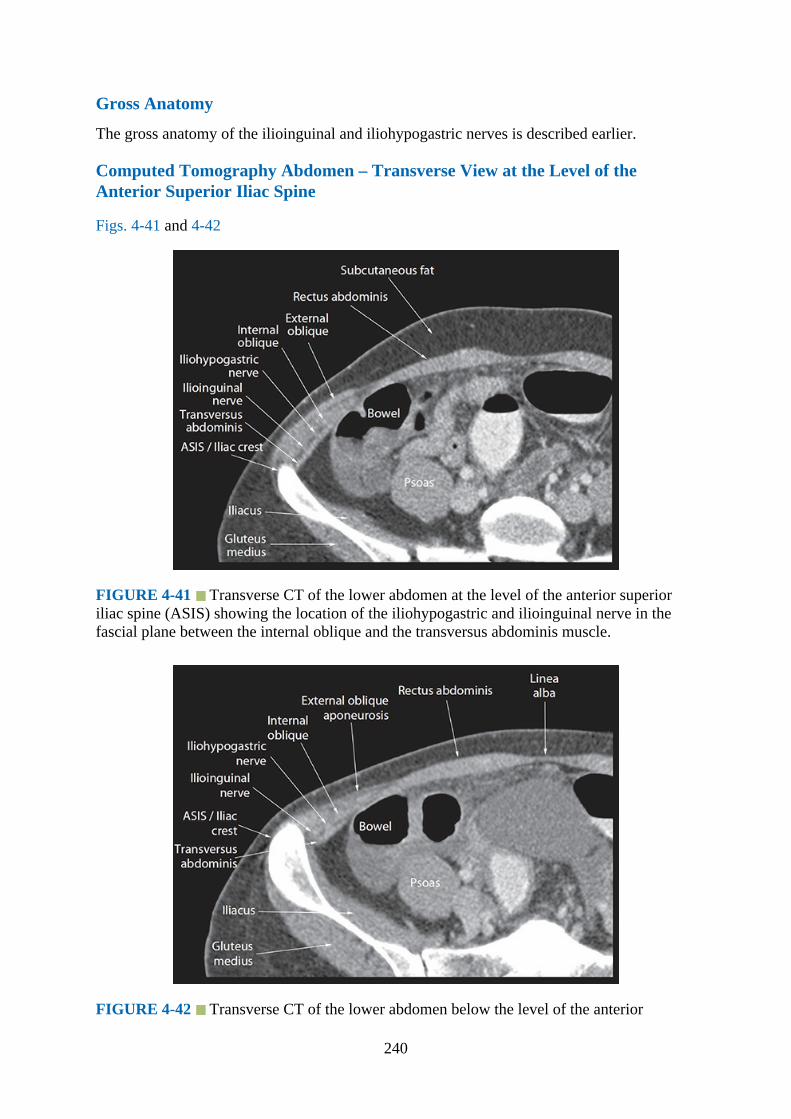
Gross Anatomy
The gross anatomy of the ilioinguinal and iliohypogastric nerves is described earlier.
Computed Tomography Abdomen – Transverse View at the Level of theAnterior Superior Iliac Spine
Figs. 4-41 and 4-42
FIGURE 4-41 Transverse CT of the lower abdomen at the level of the anterior superioriliac spine (ASIS) showing the location of the iliohypogastric and ilioinguinal nerve in thefascial plane between the internal oblique and the transversus abdominis muscle.
FIGURE 4-42 Transverse CT of the lower abdomen below the level of the anterior
240
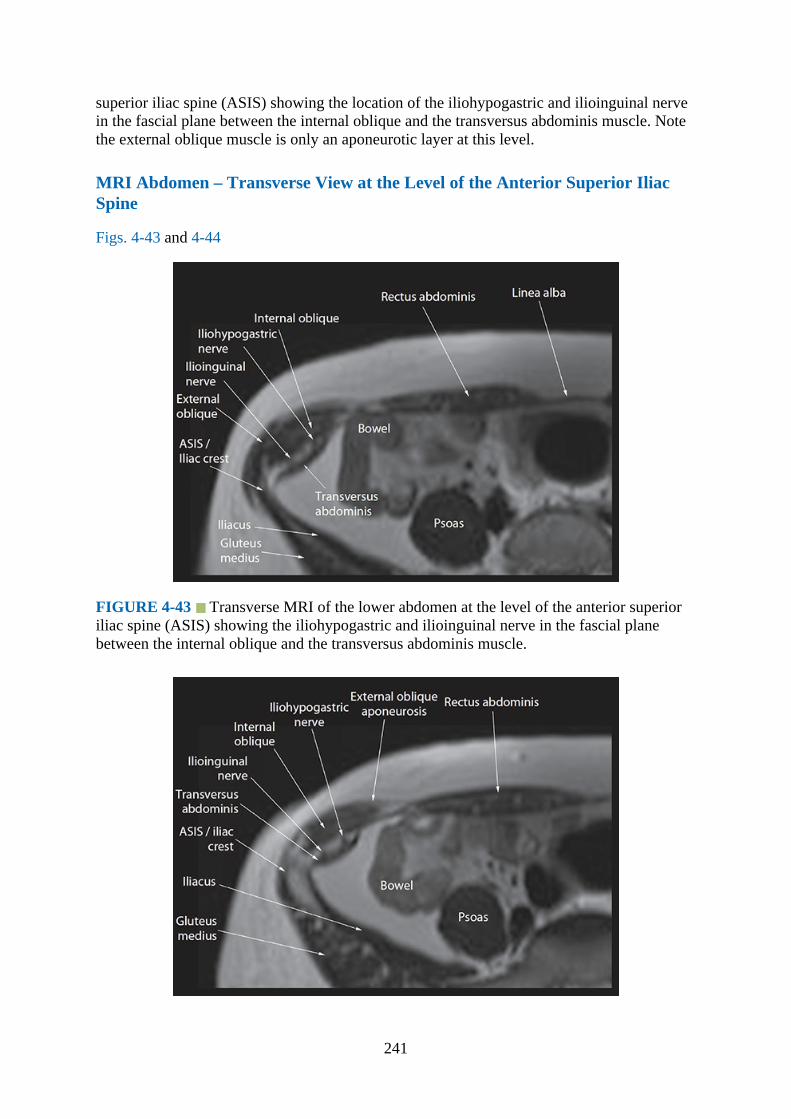
superior iliac spine (ASIS) showing the location of the iliohypogastric and ilioinguinal nervein the fascial plane between the internal oblique and the transversus abdominis muscle. Notethe external oblique muscle is only an aponeurotic layer at this level.
MRI Abdomen – Transverse View at the Level of the Anterior Superior IliacSpine
Figs. 4-43 and 4-44
FIGURE 4-43 Transverse MRI of the lower abdomen at the level of the anterior superioriliac spine (ASIS) showing the iliohypogastric and ilioinguinal nerve in the fascial planebetween the internal oblique and the transversus abdominis muscle.
241
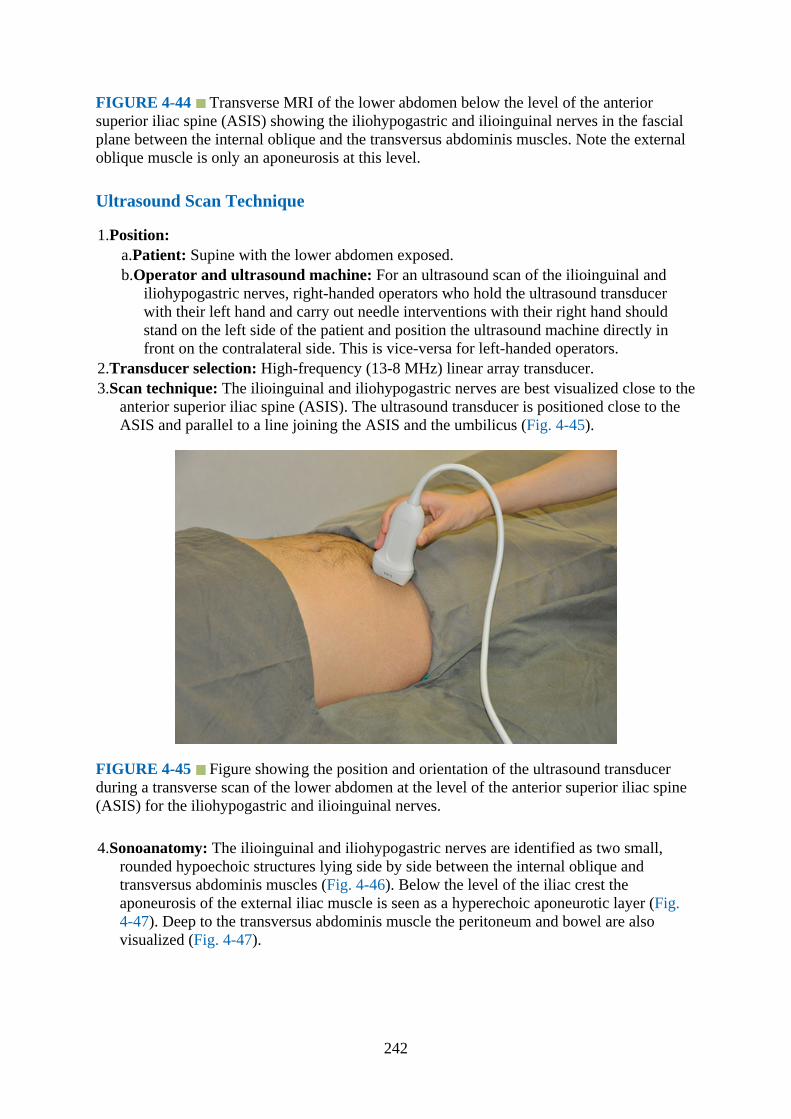
FIGURE 4-44 Transverse MRI of the lower abdomen below the level of the anteriorsuperior iliac spine (ASIS) showing the iliohypogastric and ilioinguinal nerves in the fascialplane between the internal oblique and the transversus abdominis muscles. Note the externaloblique muscle is only an aponeurosis at this level.
Ultrasound Scan Technique
1.Position:a.Patient: Supine with the lower abdomen exposed.b.Operator and ultrasound machine: For an ultrasound scan of the ilioinguinal and
iliohypogastric nerves, right-handed operators who hold the ultrasound transducerwith their left hand and carry out needle interventions with their right hand shouldstand on the left side of the patient and position the ultrasound machine directly infront on the contralateral side. This is vice-versa for left-handed operators.
2.Transducer selection: High-frequency (13-8 MHz) linear array transducer.3.Scan technique: The ilioinguinal and iliohypogastric nerves are best visualized close to the
anterior superior iliac spine (ASIS). The ultrasound transducer is positioned close to theASIS and parallel to a line joining the ASIS and the umbilicus (Fig. 4-45).
FIGURE 4-45 Figure showing the position and orientation of the ultrasound transducerduring a transverse scan of the lower abdomen at the level of the anterior superior iliac spine(ASIS) for the iliohypogastric and ilioinguinal nerves.
4.Sonoanatomy: The ilioinguinal and iliohypogastric nerves are identified as two small,rounded hypoechoic structures lying side by side between the internal oblique andtransversus abdominis muscles (Fig. 4-46). Below the level of the iliac crest theaponeurosis of the external iliac muscle is seen as a hyperechoic aponeurotic layer (Fig.4-47). Deep to the transversus abdominis muscle the peritoneum and bowel are alsovisualized (Fig. 4-47).
242
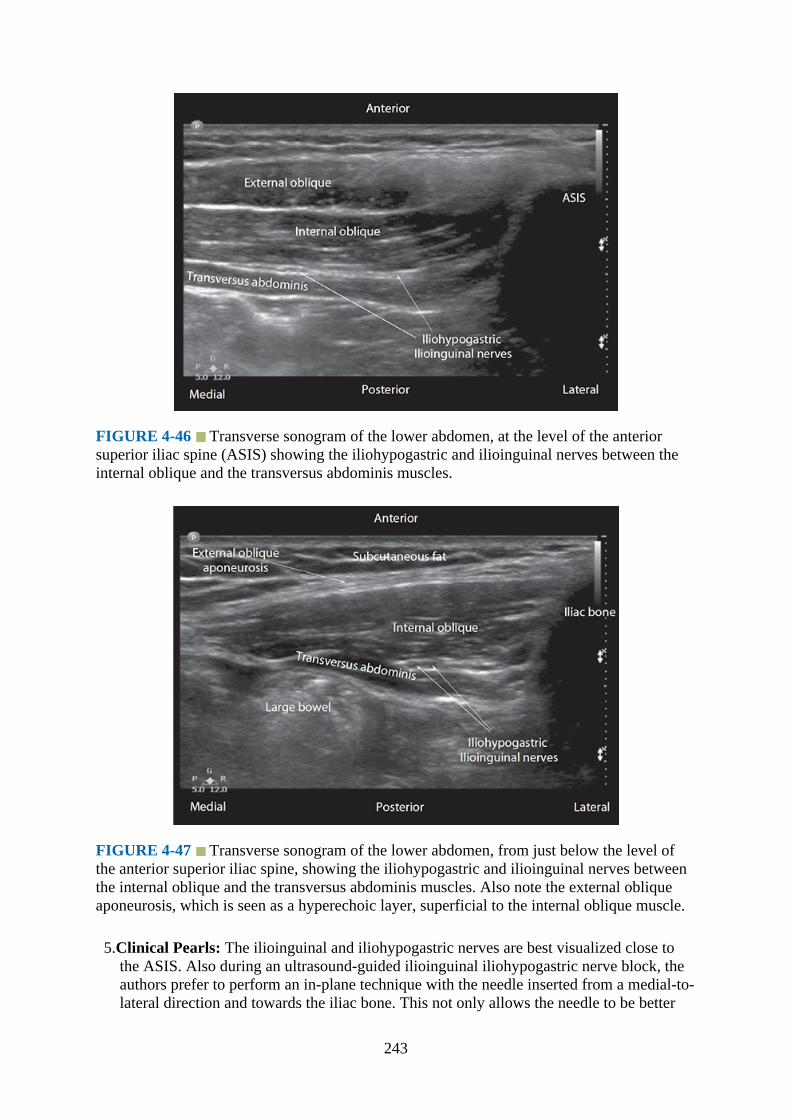
FIGURE 4-46 Transverse sonogram of the lower abdomen, at the level of the anteriorsuperior iliac spine (ASIS) showing the iliohypogastric and ilioinguinal nerves between theinternal oblique and the transversus abdominis muscles.
FIGURE 4-47 Transverse sonogram of the lower abdomen, from just below the level ofthe anterior superior iliac spine, showing the iliohypogastric and ilioinguinal nerves betweenthe internal oblique and the transversus abdominis muscles. Also note the external obliqueaponeurosis, which is seen as a hyperechoic layer, superficial to the internal oblique muscle.
5.Clinical Pearls: The ilioinguinal and iliohypogastric nerves are best visualized close tothe ASIS. Also during an ultrasound-guided ilioinguinal iliohypogastric nerve block, theauthors prefer to perform an in-plane technique with the needle inserted from a medial-to-lateral direction and towards the iliac bone. This not only allows the needle to be better
243

visualized, but also in the event of inadvertent deep needle insertion the iliac bone willprevent further needle advancement. We believe this approach may also prevent seriouscomplications like bowel and visceral perforation because the needle is inserted awayfrom the peritoneum and bowel.
Quadratus Lumborum BlockGross Anatomy
Quadratus lumborum block (QLB) is a recently introduced abdominal wall field block9 inwhich the local anesthetic is injected into a fascial plane that is deep to the fascia transversalis(the deep fascia of the abdominal wall) and on the anterolateral aspect of the quadratuslumborum muscle (Fig. 4-48).9–12 The point of injection is believed to approximate to thelandmark-based technique of performing a TAP block at the lumbar triangle of Petit.8,,14
Several ultrasound-guided techniques for QLB10–12,,15 or their variations have beendescribed in the literature (Fig. 4-48), but the optimal technique or the site of injection is stillnot known. There are also limited clinical data on QLB8,10,12 and in particular themechanism by which it produces clinical efficacy. Preliminary reports suggest that a QLBacts by a combination of mechanisms: (a) craniocaudal spread of the local anesthetic in thefascial plane anterior to the quadratus lumborum,10,14 (b) ipsilateral paravertebralspread,10,14 and (c) possibly ipsilateral epidural spread.14 There is also an anatomical planeof communication between the retroperitoneal space and the thoracic paravertebralspace,,16–19 which may also be involved in the extended lumbothoracic spread of the localanesthetic after a QLB injection.
FIGURE 4-48 Figure showing the facial planes in the posterior abdomen where the localanesthetic is injected during a quadratus lumborum block (QLB). TAM, transversusabdominis muscle; IOM, internal oblique muscle; EOM, external oblique muscle; QLN,quadratus lumborum muscle; VB, vertebral body; Ao, aorta; IVC, inferior vena cava.
244
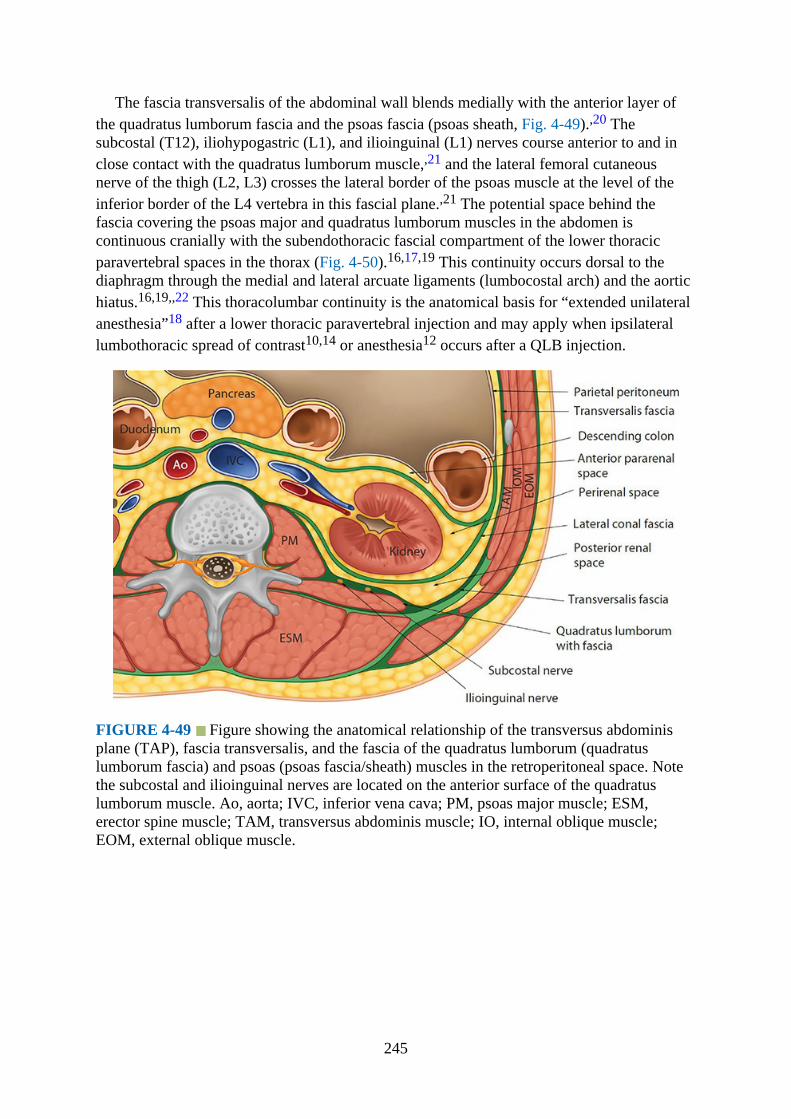
The fascia transversalis of the abdominal wall blends medially with the anterior layer ofthe quadratus lumborum fascia and the psoas fascia (psoas sheath, Fig. 4-49).,20 Thesubcostal (T12), iliohypogastric (L1), and ilioinguinal (L1) nerves course anterior to and inclose contact with the quadratus lumborum muscle,,21 and the lateral femoral cutaneousnerve of the thigh (L2, L3) crosses the lateral border of the psoas muscle at the level of theinferior border of the L4 vertebra in this fascial plane.,21 The potential space behind thefascia covering the psoas major and quadratus lumborum muscles in the abdomen iscontinuous cranially with the subendothoracic fascial compartment of the lower thoracicparavertebral spaces in the thorax (Fig. 4-50).16,17,19 This continuity occurs dorsal to thediaphragm through the medial and lateral arcuate ligaments (lumbocostal arch) and the aortichiatus.16,19,,22 This thoracolumbar continuity is the anatomical basis for “extended unilateralanesthesia”18 after a lower thoracic paravertebral injection and may apply when ipsilaterallumbothoracic spread of contrast10,14 or anesthesia12 occurs after a QLB injection.
FIGURE 4-49 Figure showing the anatomical relationship of the transversus abdominisplane (TAP), fascia transversalis, and the fascia of the quadratus lumborum (quadratuslumborum fascia) and psoas (psoas fascia/sheath) muscles in the retroperitoneal space. Notethe subcostal and ilioinguinal nerves are located on the anterior surface of the quadratuslumborum muscle. Ao, aorta; IVC, inferior vena cava; PM, psoas major muscle; ESM,erector spine muscle; TAM, transversus abdominis muscle; IO, internal oblique muscle;EOM, external oblique muscle.
245
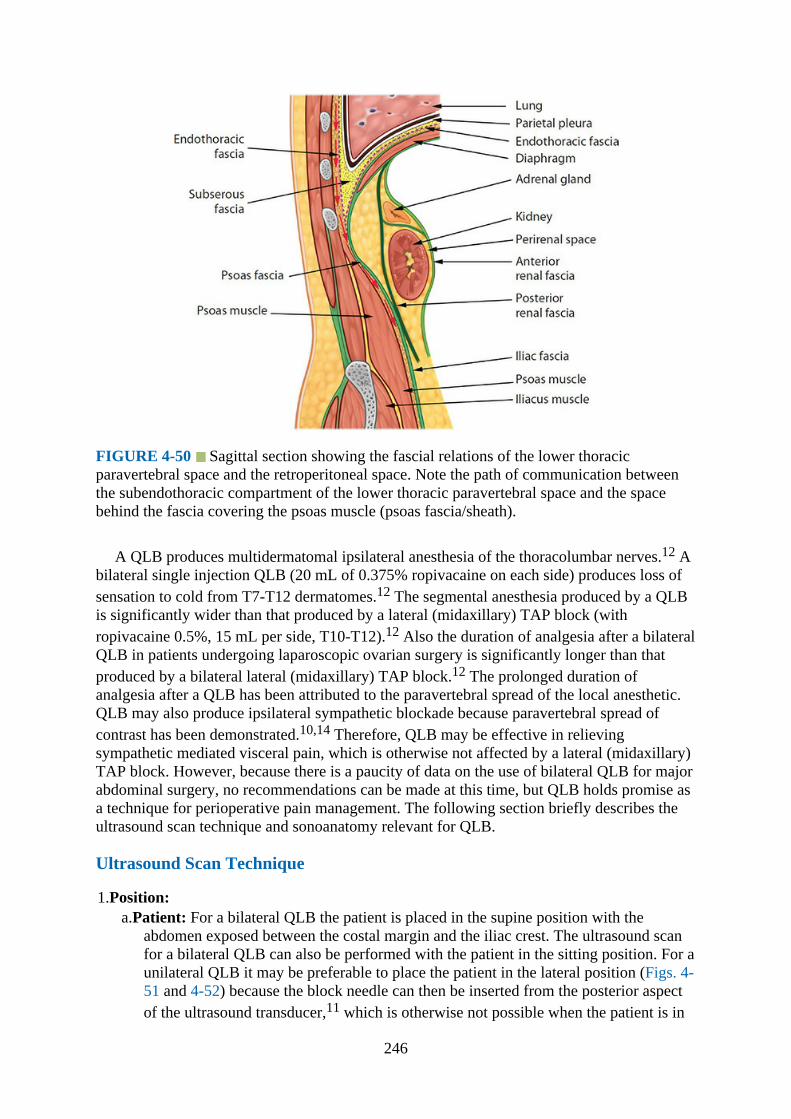
FIGURE 4-50 Sagittal section showing the fascial relations of the lower thoracicparavertebral space and the retroperitoneal space. Note the path of communication betweenthe subendothoracic compartment of the lower thoracic paravertebral space and the spacebehind the fascia covering the psoas muscle (psoas fascia/sheath).
A QLB produces multidermatomal ipsilateral anesthesia of the thoracolumbar nerves.12 Abilateral single injection QLB (20 mL of 0.375% ropivacaine on each side) produces loss ofsensation to cold from T7-T12 dermatomes.12 The segmental anesthesia produced by a QLBis significantly wider than that produced by a lateral (midaxillary) TAP block (withropivacaine 0.5%, 15 mL per side, T10-T12).12 Also the duration of analgesia after a bilateralQLB in patients undergoing laparoscopic ovarian surgery is significantly longer than thatproduced by a bilateral lateral (midaxillary) TAP block.12 The prolonged duration ofanalgesia after a QLB has been attributed to the paravertebral spread of the local anesthetic.QLB may also produce ipsilateral sympathetic blockade because paravertebral spread ofcontrast has been demonstrated.10,14 Therefore, QLB may be effective in relievingsympathetic mediated visceral pain, which is otherwise not affected by a lateral (midaxillary)TAP block. However, because there is a paucity of data on the use of bilateral QLB for majorabdominal surgery, no recommendations can be made at this time, but QLB holds promise asa technique for perioperative pain management. The following section briefly describes theultrasound scan technique and sonoanatomy relevant for QLB.
Ultrasound Scan Technique
1.Position:a.Patient: For a bilateral QLB the patient is placed in the supine position with the
abdomen exposed between the costal margin and the iliac crest. The ultrasound scanfor a bilateral QLB can also be performed with the patient in the sitting position. For aunilateral QLB it may be preferable to place the patient in the lateral position (Figs. 4-51 and 4-52) because the block needle can then be inserted from the posterior aspectof the ultrasound transducer,11 which is otherwise not possible when the patient is in
246
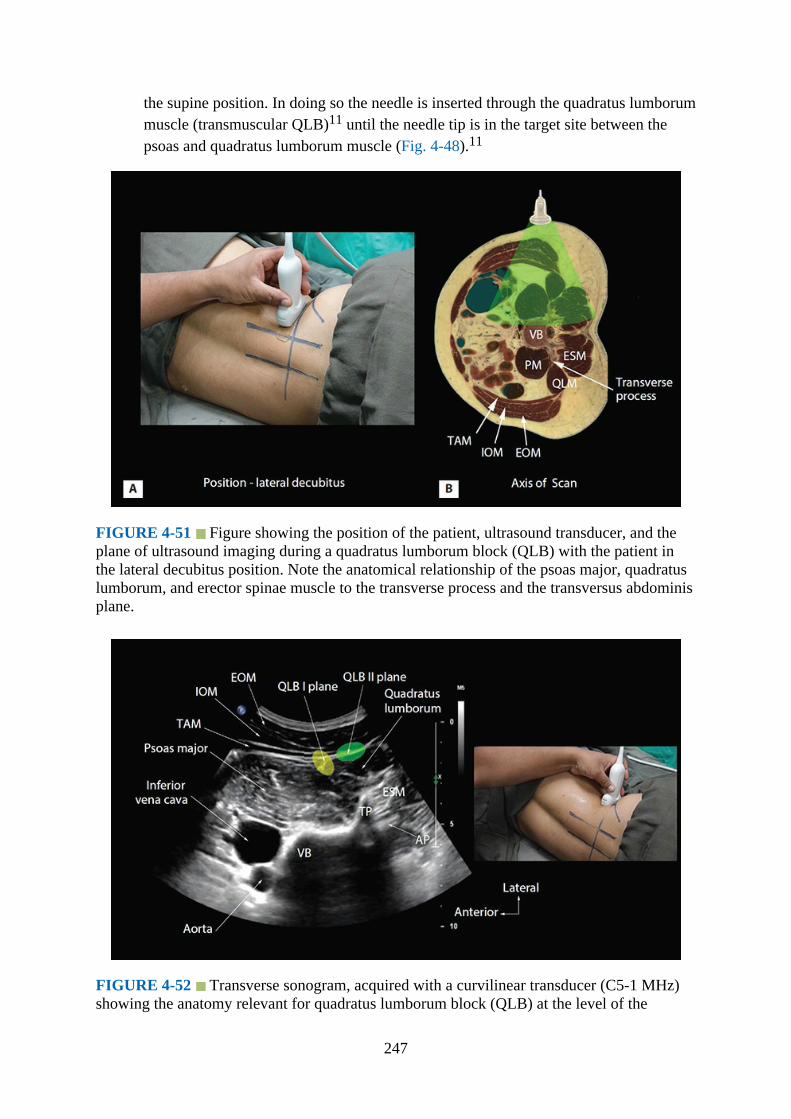
the supine position. In doing so the needle is inserted through the quadratus lumborummuscle (transmuscular QLB)11 until the needle tip is in the target site between thepsoas and quadratus lumborum muscle (Fig. 4-48).11
FIGURE 4-51 Figure showing the position of the patient, ultrasound transducer, and theplane of ultrasound imaging during a quadratus lumborum block (QLB) with the patient inthe lateral decubitus position. Note the anatomical relationship of the psoas major, quadratuslumborum, and erector spinae muscle to the transverse process and the transversus abdominisplane.
FIGURE 4-52 Transverse sonogram, acquired with a curvilinear transducer (C5-1 MHz)showing the anatomy relevant for quadratus lumborum block (QLB) at the level of the
247
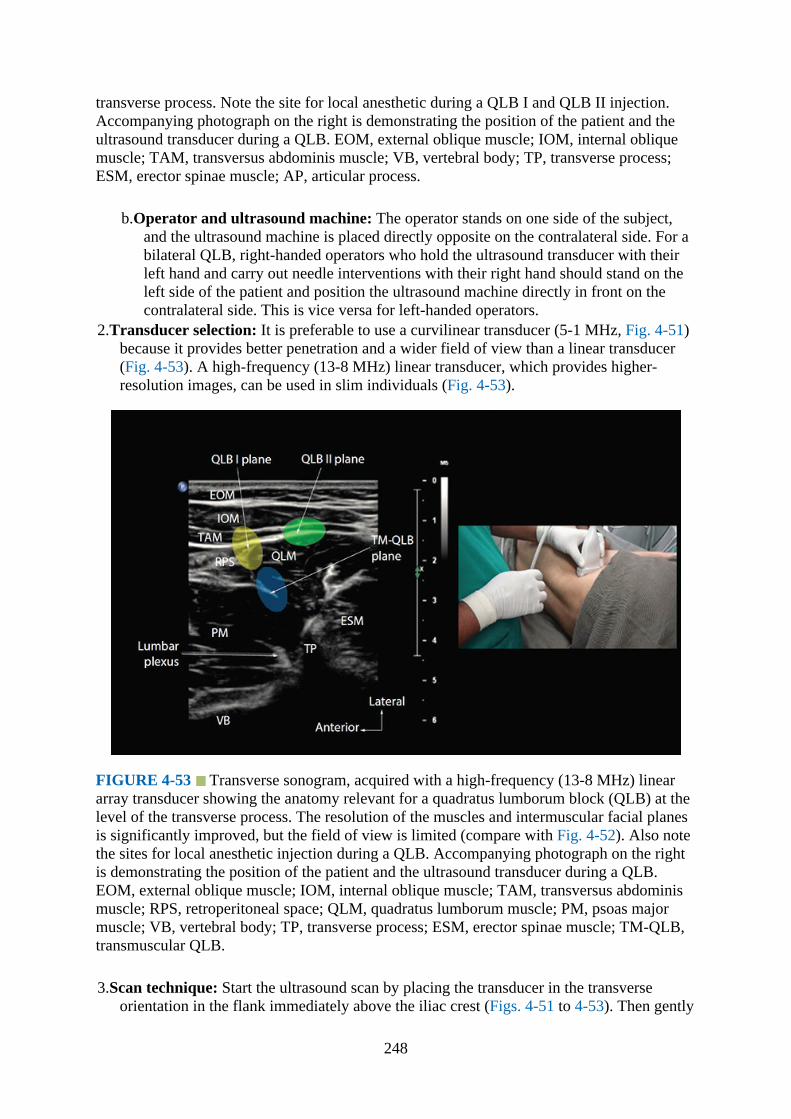
transverse process. Note the site for local anesthetic during a QLB I and QLB II injection.Accompanying photograph on the right is demonstrating the position of the patient and theultrasound transducer during a QLB. EOM, external oblique muscle; IOM, internal obliquemuscle; TAM, transversus abdominis muscle; VB, vertebral body; TP, transverse process;ESM, erector spinae muscle; AP, articular process.
b.Operator and ultrasound machine: The operator stands on one side of the subject,and the ultrasound machine is placed directly opposite on the contralateral side. For abilateral QLB, right-handed operators who hold the ultrasound transducer with theirleft hand and carry out needle interventions with their right hand should stand on theleft side of the patient and position the ultrasound machine directly in front on thecontralateral side. This is vice versa for left-handed operators.
2.Transducer selection: It is preferable to use a curvilinear transducer (5-1 MHz, Fig. 4-51)because it provides better penetration and a wider field of view than a linear transducer(Fig. 4-53). A high-frequency (13-8 MHz) linear transducer, which provides higher-resolution images, can be used in slim individuals (Fig. 4-53).
FIGURE 4-53 Transverse sonogram, acquired with a high-frequency (13-8 MHz) lineararray transducer showing the anatomy relevant for a quadratus lumborum block (QLB) at thelevel of the transverse process. The resolution of the muscles and intermuscular facial planesis significantly improved, but the field of view is limited (compare with Fig. 4-52). Also notethe sites for local anesthetic injection during a QLB. Accompanying photograph on the rightis demonstrating the position of the patient and the ultrasound transducer during a QLB.EOM, external oblique muscle; IOM, internal oblique muscle; TAM, transversus abdominismuscle; RPS, retroperitoneal space; QLM, quadratus lumborum muscle; PM, psoas majormuscle; VB, vertebral body; TP, transverse process; ESM, erector spinae muscle; TM-QLB,transmuscular QLB.
3.Scan technique: Start the ultrasound scan by placing the transducer in the transverseorientation in the flank immediately above the iliac crest (Figs. 4-51 to 4-53). Then gently
248

slide the transducer posteriorly, aiming to identify the anterolateral surface of thevertebral body and the transverse process in the transverse sonogram (Fig. 4-52). Oncethe transverse process is located and the relevant anatomy identified, tilt or slide thetransducer slightly caudally to perform the transverse scan through the intertransversespace (Fig. 4-54). The acoustic shadow of the transverse process will no longer be visibleand will be replaced by the hyperechoic articular process (Fig. 4-54).
FIGURE 4-54 Transverse sonogram, acquired with a curvilinear transducer (C5-1 MHz),showing the anatomy relevant for quadratus lumborum block (QLB) at the level of thearticular process (AP). Note the site for local anesthetic injection during a QLB I and QLB II.The lumbar plexus nerves are visualized on the posterior aspect of the psoas muscle. Also thespinal canal is visualized through the intervertebral foramen (IVF). EOM, external obliquemuscle; IOM; internal oblique muscle, TAM; transversus abdominis muscle; VB, vertebralbody; ESM, erector spinae muscle.
4.Sonoanatomy: On the transverse sonogram the vertebral body and transverse process ofthe vertebra appear as hyperechoic structures with a corresponding acoustic shadow (Fig.4-52). The psoas major, quadratus lumborum, and erector spinae muscles are easilyrecognized surrounding the transverse process. Also depending on the side scanned, theinferior vena cava (on the right) and aorta (on the left) are visualized anterolateral to thevertebral body (Fig. 4-52). The arrangement of the three muscles around the transverseprocess, that is, the psoas muscle lying anterior, the erector spinae muscle lying posterior,and the quadratus lumborum muscle lying at the apex (Fig. 4-52), produces a sonographicpattern that has been likened to a “shamrock” with the muscles representing the threeleaves.,23 Superficial and anterior to these three muscles the external oblique, internaloblique, and transversus abdominis muscles can be identified (Figs. 4-52 to 4-54). In thetransverse sonogram through the lumbar intertransverse space the acoustic shadow of thetransverse process is no longer visualized, and the intervertebral foramen and spinal canalmay also be visualized in addition to the psoas major, quadratus lumborum, and erectorspine muscles (Fig. 4-54).
5.Clinical Pearls: One must identify the lower pole of the kidney and the peritoneal cavityduring the scout scan to avoid deep needle insertion and visceral injury. When performinga QLB scan in individuals with a thick abdominal wall, gentle inward pressure may be
249
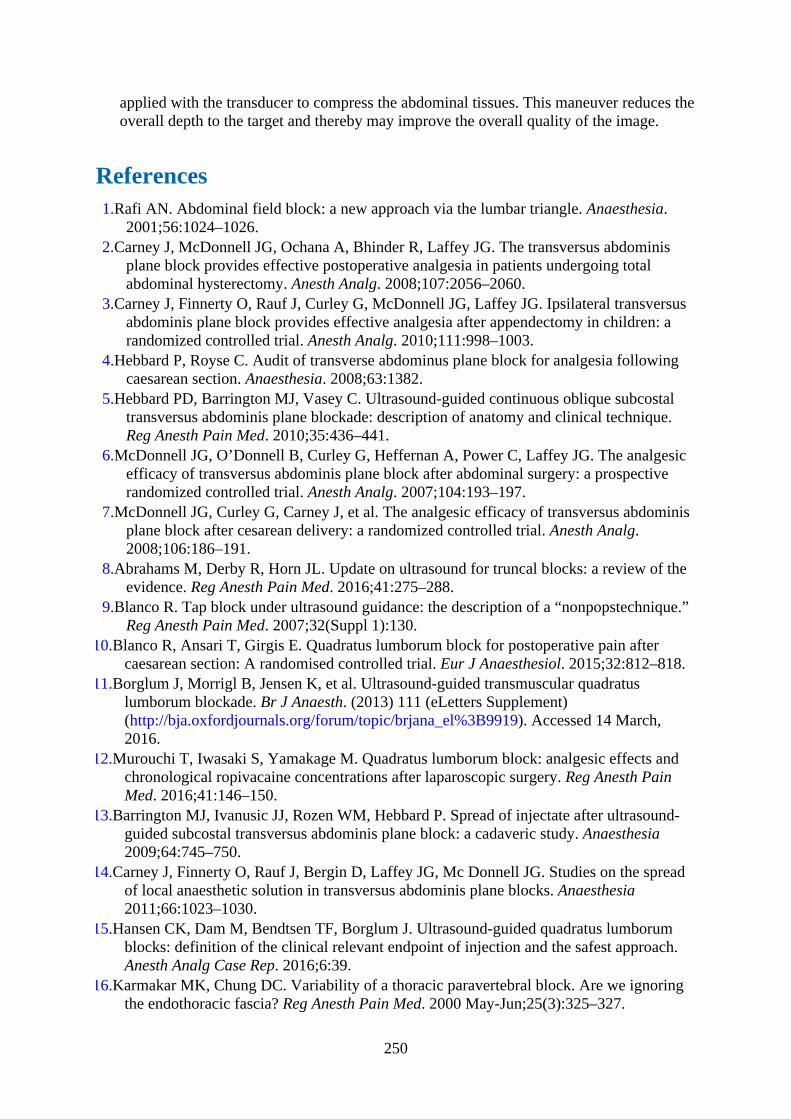
applied with the transducer to compress the abdominal tissues. This maneuver reduces theoverall depth to the target and thereby may improve the overall quality of the image.
References1.Rafi AN. Abdominal field block: a new approach via the lumbar triangle. Anaesthesia.
2001;56:1024–1026.2.Carney J, McDonnell JG, Ochana A, Bhinder R, Laffey JG. The transversus abdominis
plane block provides effective postoperative analgesia in patients undergoing totalabdominal hysterectomy. Anesth Analg. 2008;107:2056–2060.
3.Carney J, Finnerty O, Rauf J, Curley G, McDonnell JG, Laffey JG. Ipsilateral transversusabdominis plane block provides effective analgesia after appendectomy in children: arandomized controlled trial. Anesth Analg. 2010;111:998–1003.
4.Hebbard P, Royse C. Audit of transverse abdominus plane block for analgesia followingcaesarean section. Anaesthesia. 2008;63:1382.
5.Hebbard PD, Barrington MJ, Vasey C. Ultrasound-guided continuous oblique subcostaltransversus abdominis plane blockade: description of anatomy and clinical technique.Reg Anesth Pain Med. 2010;35:436–441.
6.McDonnell JG, O’Donnell B, Curley G, Heffernan A, Power C, Laffey JG. The analgesicefficacy of transversus abdominis plane block after abdominal surgery: a prospectiverandomized controlled trial. Anesth Analg. 2007;104:193–197.
7.McDonnell JG, Curley G, Carney J, et al. The analgesic efficacy of transversus abdominisplane block after cesarean delivery: a randomized controlled trial. Anesth Analg.2008;106:186–191.
8.Abrahams M, Derby R, Horn JL. Update on ultrasound for truncal blocks: a review of theevidence. Reg Anesth Pain Med. 2016;41:275–288.
9.Blanco R. Tap block under ultrasound guidance: the description of a “nonpopstechnique.”Reg Anesth Pain Med. 2007;32(Suppl 1):130.
10.Blanco R, Ansari T, Girgis E. Quadratus lumborum block for postoperative pain aftercaesarean section: A randomised controlled trial. Eur J Anaesthesiol. 2015;32:812–818.
11.Borglum J, Morrigl B, Jensen K, et al. Ultrasound-guided transmuscular quadratuslumborum blockade. Br J Anaesth. (2013) 111 (eLetters Supplement)(http://bja.oxfordjournals.org/forum/topic/brjana_el%3B9919). Accessed 14 March,2016.
12.Murouchi T, Iwasaki S, Yamakage M. Quadratus lumborum block: analgesic effects andchronological ropivacaine concentrations after laparoscopic surgery. Reg Anesth PainMed. 2016;41:146–150.
13.Barrington MJ, Ivanusic JJ, Rozen WM, Hebbard P. Spread of injectate after ultrasound-guided subcostal transversus abdominis plane block: a cadaveric study. Anaesthesia2009;64:745–750.
14.Carney J, Finnerty O, Rauf J, Bergin D, Laffey JG, Mc Donnell JG. Studies on the spreadof local anaesthetic solution in transversus abdominis plane blocks. Anaesthesia2011;66:1023–1030.
15.Hansen CK, Dam M, Bendtsen TF, Borglum J. Ultrasound-guided quadratus lumborumblocks: definition of the clinical relevant endpoint of injection and the safest approach.Anesth Analg Case Rep. 2016;6:39.
16.Karmakar MK, Chung DC. Variability of a thoracic paravertebral block. Are we ignoringthe endothoracic fascia? Reg Anesth Pain Med. 2000 May-Jun;25(3):325–327.
250
17.Karmakar MK, Gin T, Ho AM. Ipsilateral thoraco-lumbar anaesthesia and paravertebralspread after low thoracic paravertebral injection. Br J Anaesth. 2001;87:312–316.
18.Saito T, Gallagher ET, Cutler S, et al. Extended unilateral anesthesia. New technique orparavertebral anesthesia? Reg Anesth. 1996;21:304–307.
19.Saito T, Den S, Tanuma K, Tanuma Y, Carney E, Carlsson C. Anatomical bases forparavertebral anesthetic block: fluid communication between the thoracic and lumbarparavertebral regions. Surg Radiol Anat. 1999;21:359–363.
20.Donovan PJ, Zerhouni EA, Siegelman SS. CT of the psoas compartment of theretroperitoneum. Semin Roentgenol. 1981;16:241–250.
21.Farny J, Drolet P, Girard M. Anatomy of the posterior approach to the lumbar plexusblock. Can J Anaesth. 1994;41:480–485.
22.Dugan DJ, Samson PC. Surgical significance of the endothoracic fascia. The anatomicbasis for empyemectomy and other extrapleural technics. Am J Surg. 1975;130:151–158.
23.Sauter AR, Ullensvang K, Bendtsen TF, Boerglum J. The “Shamrock Method”—a newand promising technique for ultrasound guided lumbar plexus blocks. Br J Anaesth.(2013) 111 eLetters Supplement.(http://bja.oxfordjournals.org/forum/topic/brjana_el%3B9814). Accessed 14 March,2016.
251
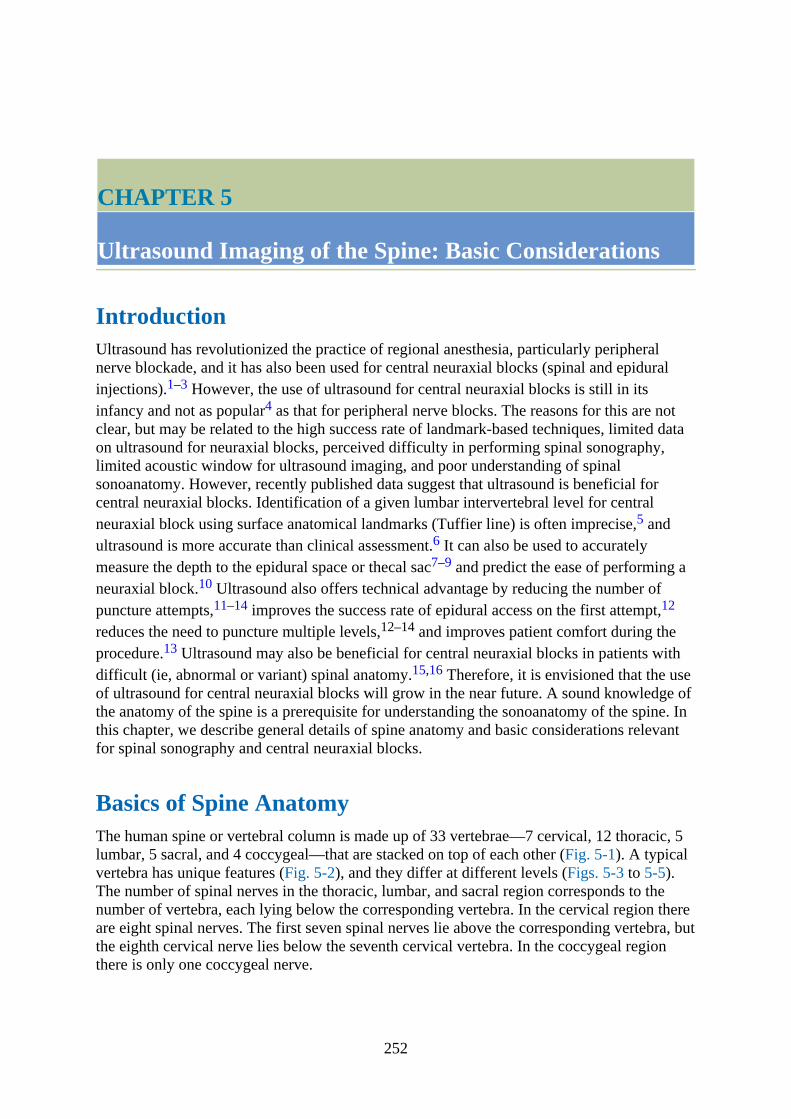
CHAPTER 5
Ultrasound Imaging of the Spine: Basic Considerations
IntroductionUltrasound has revolutionized the practice of regional anesthesia, particularly peripheralnerve blockade, and it has also been used for central neuraxial blocks (spinal and epiduralinjections).1–3 However, the use of ultrasound for central neuraxial blocks is still in itsinfancy and not as popular4 as that for peripheral nerve blocks. The reasons for this are notclear, but may be related to the high success rate of landmark-based techniques, limited dataon ultrasound for neuraxial blocks, perceived difficulty in performing spinal sonography,limited acoustic window for ultrasound imaging, and poor understanding of spinalsonoanatomy. However, recently published data suggest that ultrasound is beneficial forcentral neuraxial blocks. Identification of a given lumbar intervertebral level for centralneuraxial block using surface anatomical landmarks (Tuffier line) is often imprecise,5 andultrasound is more accurate than clinical assessment.6 It can also be used to accuratelymeasure the depth to the epidural space or thecal sac7–9 and predict the ease of performing aneuraxial block.10 Ultrasound also offers technical advantage by reducing the number ofpuncture attempts,11–14 improves the success rate of epidural access on the first attempt,12
reduces the need to puncture multiple levels,12–14 and improves patient comfort during theprocedure.13 Ultrasound may also be beneficial for central neuraxial blocks in patients withdifficult (ie, abnormal or variant) spinal anatomy.15,16 Therefore, it is envisioned that the useof ultrasound for central neuraxial blocks will grow in the near future. A sound knowledge ofthe anatomy of the spine is a prerequisite for understanding the sonoanatomy of the spine. Inthis chapter, we describe general details of spine anatomy and basic considerations relevantfor spinal sonography and central neuraxial blocks.
Basics of Spine AnatomyThe human spine or vertebral column is made up of 33 vertebrae—7 cervical, 12 thoracic, 5lumbar, 5 sacral, and 4 coccygeal—that are stacked on top of each other (Fig. 5-1). A typicalvertebra has unique features (Fig. 5-2), and they differ at different levels (Figs. 5-3 to 5-5).The number of spinal nerves in the thoracic, lumbar, and sacral region corresponds to thenumber of vertebra, each lying below the corresponding vertebra. In the cervical region thereare eight spinal nerves. The first seven spinal nerves lie above the corresponding vertebra, butthe eighth cervical nerve lies below the seventh cervical vertebra. In the coccygeal regionthere is only one coccygeal nerve.
252
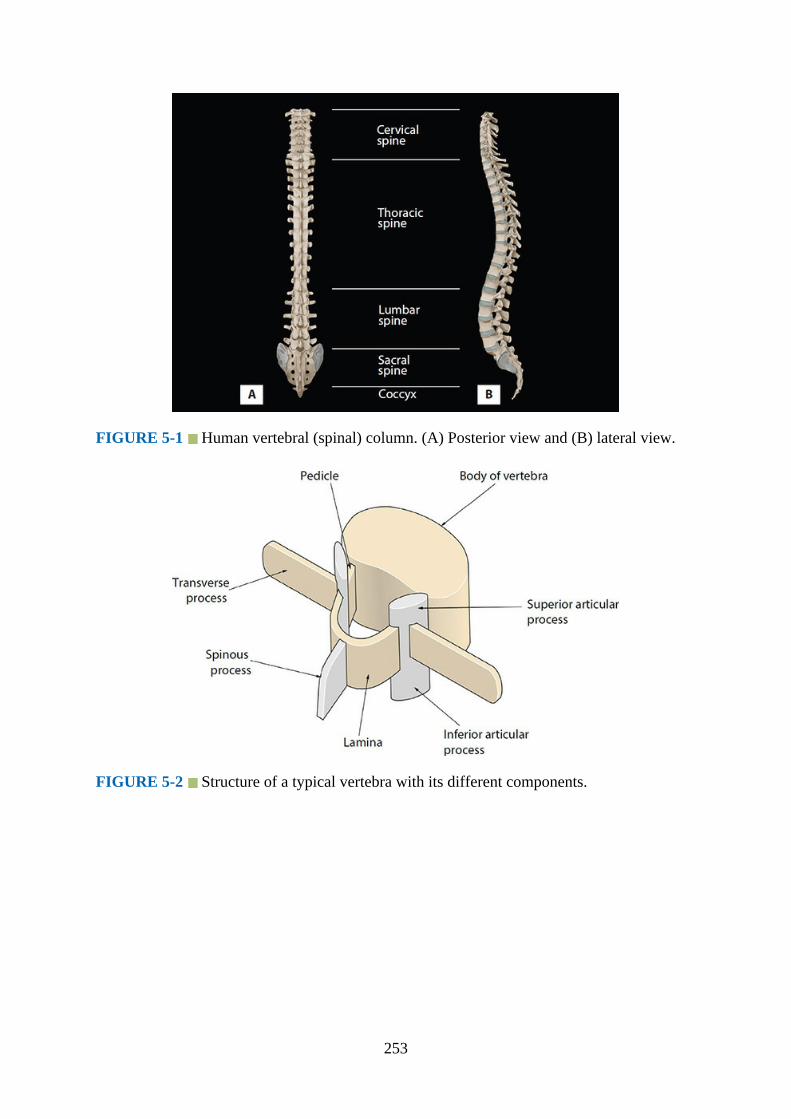
FIGURE 5-1 Human vertebral (spinal) column. (A) Posterior view and (B) lateral view.
FIGURE 5-2 Structure of a typical vertebra with its different components.
253
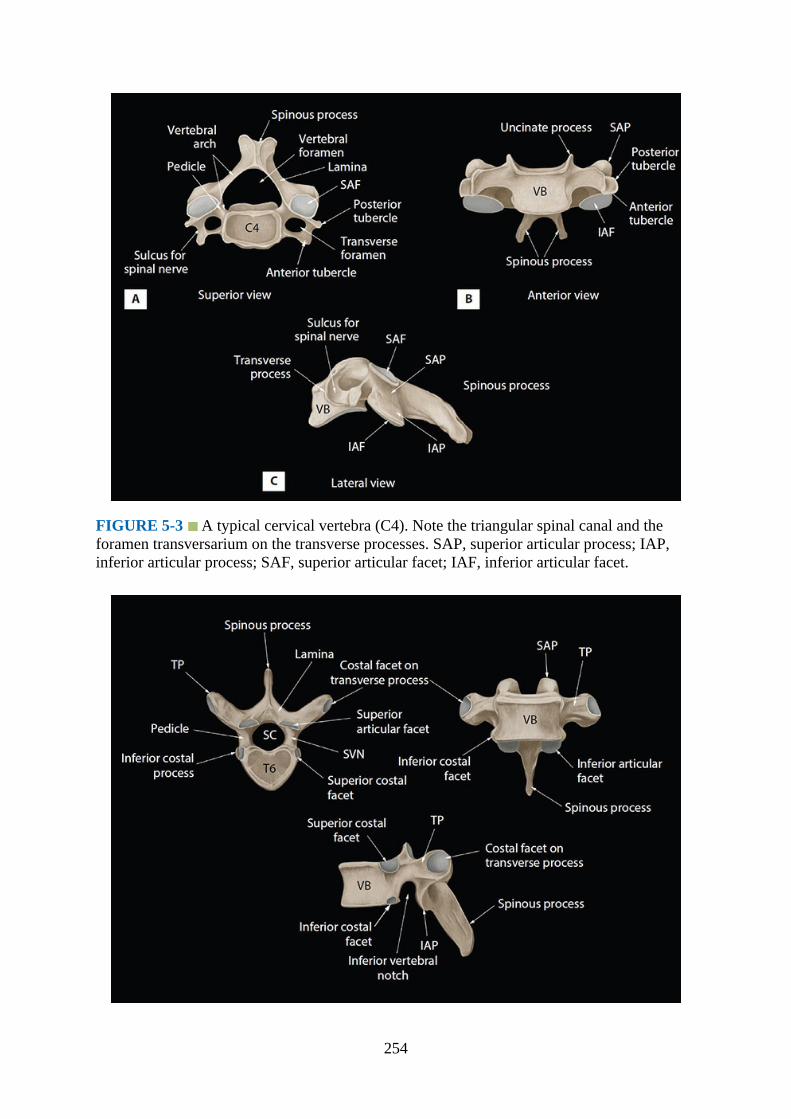
FIGURE 5-3 A typical cervical vertebra (C4). Note the triangular spinal canal and theforamen transversarium on the transverse processes. SAP, superior articular process; IAP,inferior articular process; SAF, superior articular facet; IAF, inferior articular facet.
254
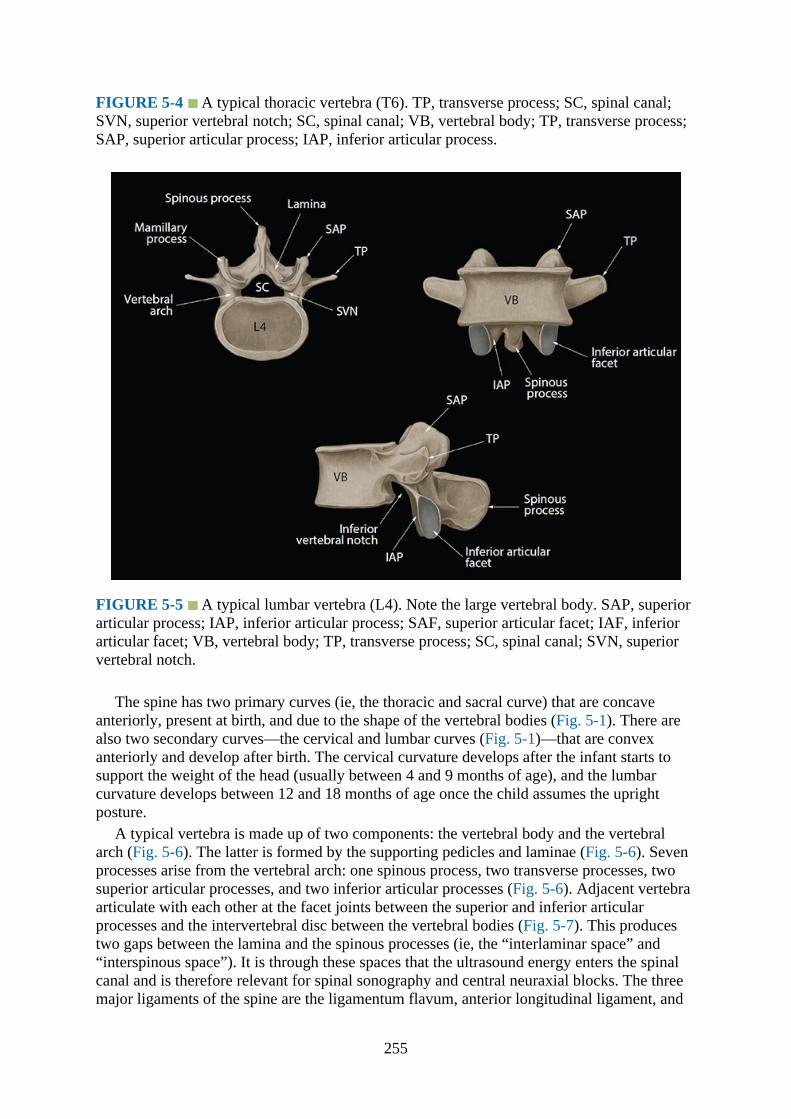
FIGURE 5-4 A typical thoracic vertebra (T6). TP, transverse process; SC, spinal canal;SVN, superior vertebral notch; SC, spinal canal; VB, vertebral body; TP, transverse process;SAP, superior articular process; IAP, inferior articular process.
FIGURE 5-5 A typical lumbar vertebra (L4). Note the large vertebral body. SAP, superiorarticular process; IAP, inferior articular process; SAF, superior articular facet; IAF, inferiorarticular facet; VB, vertebral body; TP, transverse process; SC, spinal canal; SVN, superiorvertebral notch.
The spine has two primary curves (ie, the thoracic and sacral curve) that are concaveanteriorly, present at birth, and due to the shape of the vertebral bodies (Fig. 5-1). There arealso two secondary curves—the cervical and lumbar curves (Fig. 5-1)—that are convexanteriorly and develop after birth. The cervical curvature develops after the infant starts tosupport the weight of the head (usually between 4 and 9 months of age), and the lumbarcurvature develops between 12 and 18 months of age once the child assumes the uprightposture.
A typical vertebra is made up of two components: the vertebral body and the vertebralarch (Fig. 5-6). The latter is formed by the supporting pedicles and laminae (Fig. 5-6). Sevenprocesses arise from the vertebral arch: one spinous process, two transverse processes, twosuperior articular processes, and two inferior articular processes (Fig. 5-6). Adjacent vertebraarticulate with each other at the facet joints between the superior and inferior articularprocesses and the intervertebral disc between the vertebral bodies (Fig. 5-7). This producestwo gaps between the lamina and the spinous processes (ie, the “interlaminar space” and“interspinous space”). It is through these spaces that the ultrasound energy enters the spinalcanal and is therefore relevant for spinal sonography and central neuraxial blocks. The threemajor ligaments of the spine are the ligamentum flavum, anterior longitudinal ligament, and
255

posterior longitudinal ligament (Fig. 5-7). The posterior longitudinal ligament is attachedalong the length of the anterior wall of the vertebral canal (Figs. 5-7 and 5-8). Theligamentum flavum, also referred to as the “yellow ligament,” is a dense layer of connectivetissue that bridges the interlaminar spaces and connects the lamina of adjacent vertebra (Figs.5-7 to 5-9). It is archlike on cross-section and widest posteriorly in the midline and in thelumbar region. The ligamentum flavum is attached to the anterior surface of the inferiormargin of the lamina above, but it splits inferiorly to attach to both the posterior surface(superficial component) and anterior surface (deep component) of the lamina below. Thespinous processes are attached at their tips by the supraspinous ligament (Fig. 5-7), which isthick and cordlike, and along their length by the interspinous ligament (Fig. 5-9), which isthin and membranous.
FIGURE 5-6 The vertebral arch (highlighted in green).
256

FIGURE 5-7 Ligaments of the vertebral column.
FIGURE 5-8 Ligamentum flavum (yellow ligament) and its attachment to the laminae.
FIGURE 5-9 Sagittal section of the lumbosacral spine showing the relationship of thespinal cord, conus medullaris, cauda equina, filum terminale, and thecal sac to the vertebralcolumn.
257
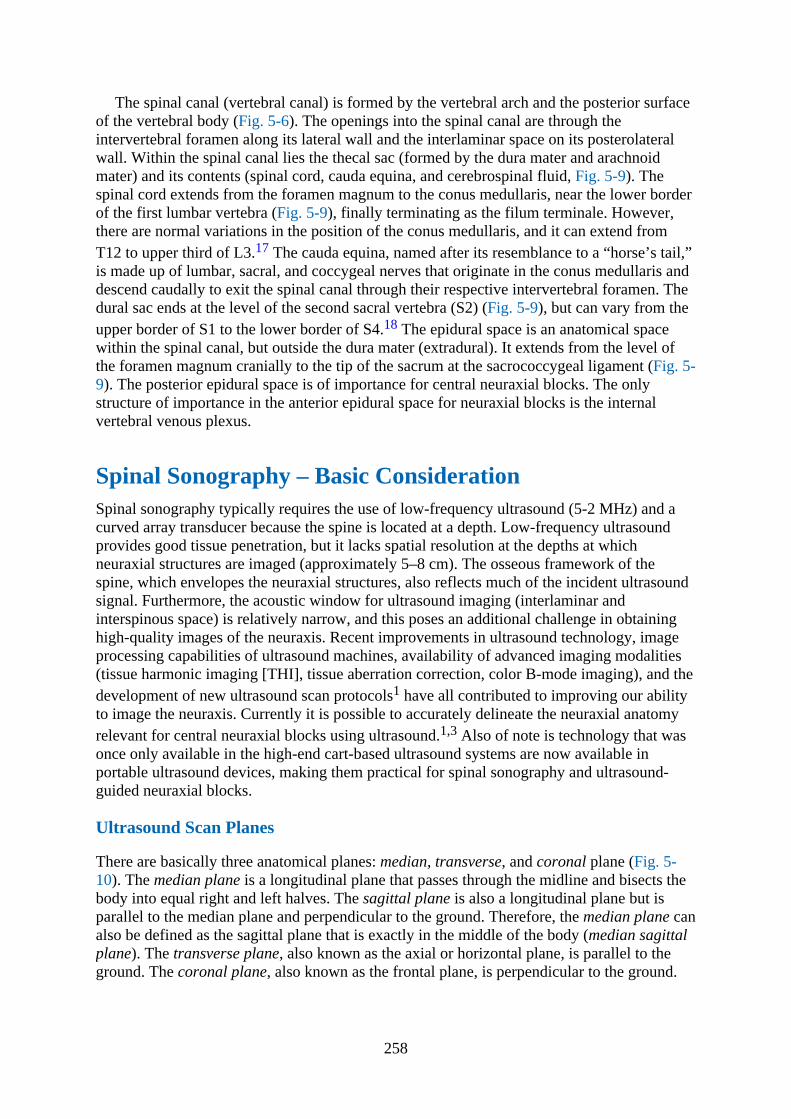
The spinal canal (vertebral canal) is formed by the vertebral arch and the posterior surfaceof the vertebral body (Fig. 5-6). The openings into the spinal canal are through theintervertebral foramen along its lateral wall and the interlaminar space on its posterolateralwall. Within the spinal canal lies the thecal sac (formed by the dura mater and arachnoidmater) and its contents (spinal cord, cauda equina, and cerebrospinal fluid, Fig. 5-9). Thespinal cord extends from the foramen magnum to the conus medullaris, near the lower borderof the first lumbar vertebra (Fig. 5-9), finally terminating as the filum terminale. However,there are normal variations in the position of the conus medullaris, and it can extend fromT12 to upper third of L3.17 The cauda equina, named after its resemblance to a “horse’s tail,”is made up of lumbar, sacral, and coccygeal nerves that originate in the conus medullaris anddescend caudally to exit the spinal canal through their respective intervertebral foramen. Thedural sac ends at the level of the second sacral vertebra (S2) (Fig. 5-9), but can vary from theupper border of S1 to the lower border of S4.18 The epidural space is an anatomical spacewithin the spinal canal, but outside the dura mater (extradural). It extends from the level ofthe foramen magnum cranially to the tip of the sacrum at the sacrococcygeal ligament (Fig. 5-9). The posterior epidural space is of importance for central neuraxial blocks. The onlystructure of importance in the anterior epidural space for neuraxial blocks is the internalvertebral venous plexus.
Spinal Sonography – Basic ConsiderationSpinal sonography typically requires the use of low-frequency ultrasound (5-2 MHz) and acurved array transducer because the spine is located at a depth. Low-frequency ultrasoundprovides good tissue penetration, but it lacks spatial resolution at the depths at whichneuraxial structures are imaged (approximately 5–8 cm). The osseous framework of thespine, which envelopes the neuraxial structures, also reflects much of the incident ultrasoundsignal. Furthermore, the acoustic window for ultrasound imaging (interlaminar andinterspinous space) is relatively narrow, and this poses an additional challenge in obtaininghigh-quality images of the neuraxis. Recent improvements in ultrasound technology, imageprocessing capabilities of ultrasound machines, availability of advanced imaging modalities(tissue harmonic imaging [THI], tissue aberration correction, color B-mode imaging), and thedevelopment of new ultrasound scan protocols1 have all contributed to improving our abilityto image the neuraxis. Currently it is possible to accurately delineate the neuraxial anatomyrelevant for central neuraxial blocks using ultrasound.1,3 Also of note is technology that wasonce only available in the high-end cart-based ultrasound systems are now available inportable ultrasound devices, making them practical for spinal sonography and ultrasound-guided neuraxial blocks.
Ultrasound Scan Planes
There are basically three anatomical planes: median, transverse, and coronal plane (Fig. 5-10). The median plane is a longitudinal plane that passes through the midline and bisects thebody into equal right and left halves. The sagittal plane is also a longitudinal plane but isparallel to the median plane and perpendicular to the ground. Therefore, the median plane canalso be defined as the sagittal plane that is exactly in the middle of the body (median sagittalplane). The transverse plane, also known as the axial or horizontal plane, is parallel to theground. The coronal plane, also known as the frontal plane, is perpendicular to the ground.
258
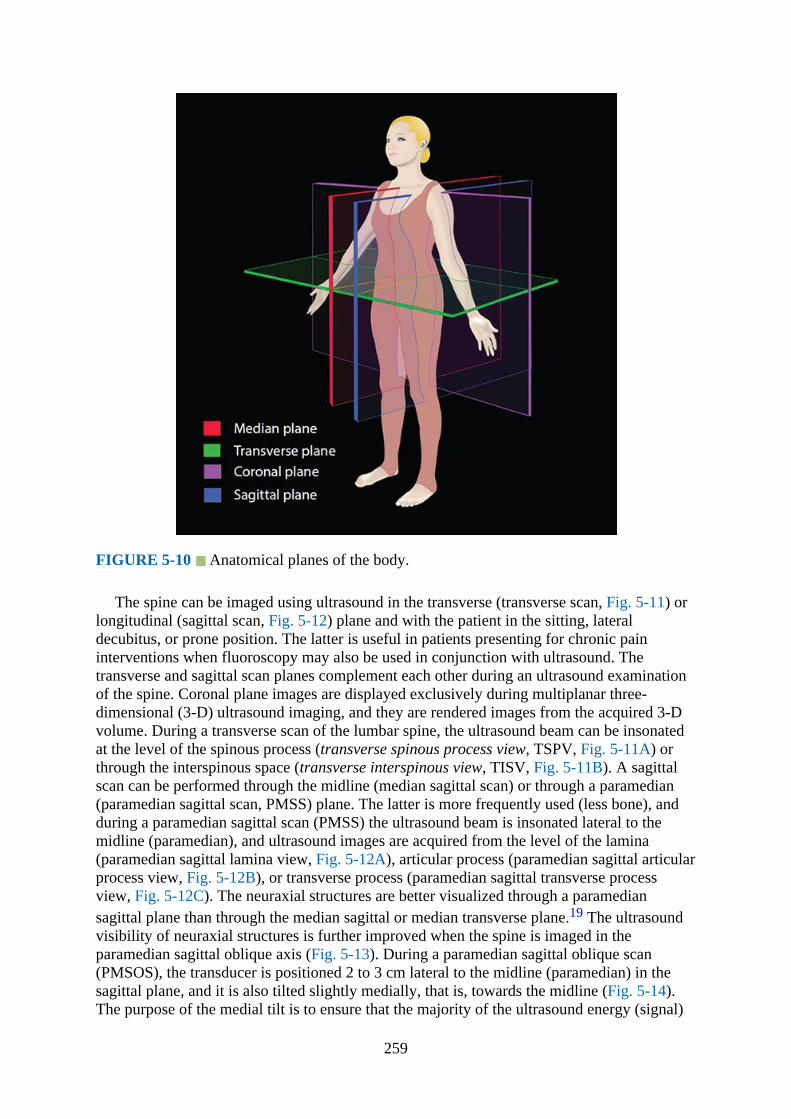
FIGURE 5-10 Anatomical planes of the body.
The spine can be imaged using ultrasound in the transverse (transverse scan, Fig. 5-11) orlongitudinal (sagittal scan, Fig. 5-12) plane and with the patient in the sitting, lateraldecubitus, or prone position. The latter is useful in patients presenting for chronic paininterventions when fluoroscopy may also be used in conjunction with ultrasound. Thetransverse and sagittal scan planes complement each other during an ultrasound examinationof the spine. Coronal plane images are displayed exclusively during multiplanar three-dimensional (3-D) ultrasound imaging, and they are rendered images from the acquired 3-Dvolume. During a transverse scan of the lumbar spine, the ultrasound beam can be insonatedat the level of the spinous process (transverse spinous process view, TSPV, Fig. 5-11A) orthrough the interspinous space (transverse interspinous view, TISV, Fig. 5-11B). A sagittalscan can be performed through the midline (median sagittal scan) or through a paramedian(paramedian sagittal scan, PMSS) plane. The latter is more frequently used (less bone), andduring a paramedian sagittal scan (PMSS) the ultrasound beam is insonated lateral to themidline (paramedian), and ultrasound images are acquired from the level of the lamina(paramedian sagittal lamina view, Fig. 5-12A), articular process (paramedian sagittal articularprocess view, Fig. 5-12B), or transverse process (paramedian sagittal transverse processview, Fig. 5-12C). The neuraxial structures are better visualized through a paramediansagittal plane than through the median sagittal or median transverse plane.19 The ultrasoundvisibility of neuraxial structures is further improved when the spine is imaged in theparamedian sagittal oblique axis (Fig. 5-13). During a paramedian sagittal oblique scan(PMSOS), the transducer is positioned 2 to 3 cm lateral to the midline (paramedian) in thesagittal plane, and it is also tilted slightly medially, that is, towards the midline (Fig. 5-14).The purpose of the medial tilt is to ensure that the majority of the ultrasound energy (signal)
259
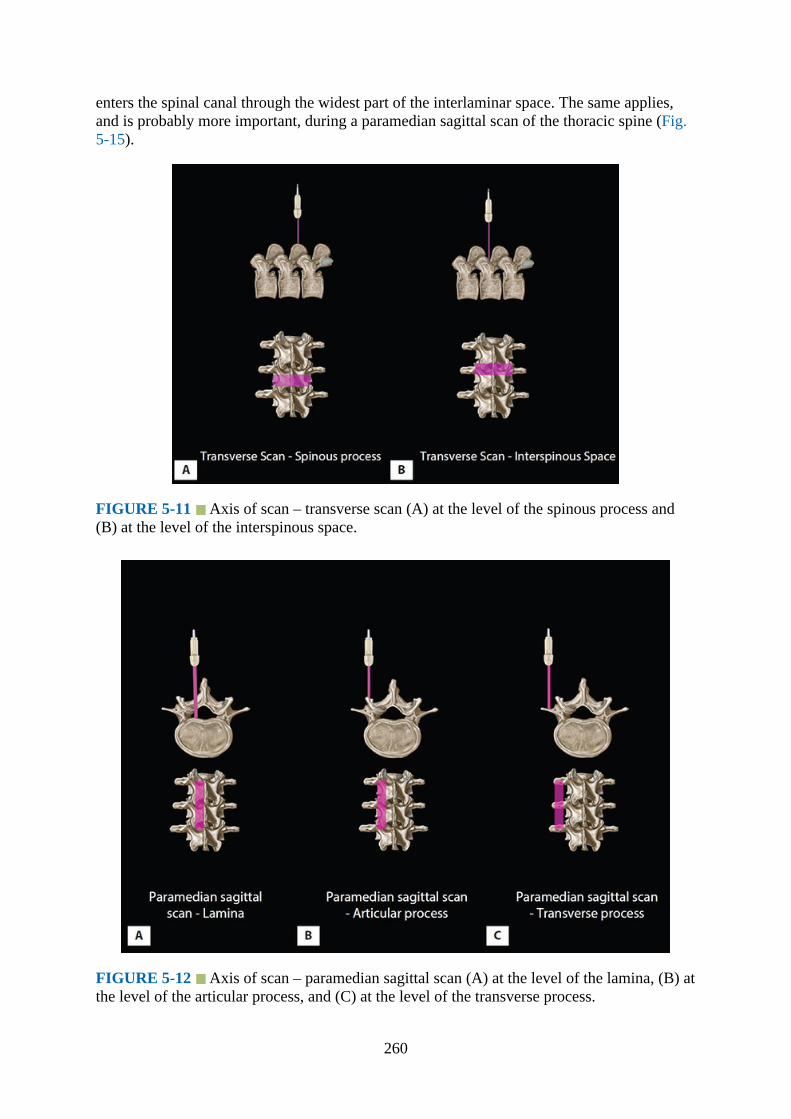
enters the spinal canal through the widest part of the interlaminar space. The same applies,and is probably more important, during a paramedian sagittal scan of the thoracic spine (Fig.5-15).
FIGURE 5-11 Axis of scan – transverse scan (A) at the level of the spinous process and(B) at the level of the interspinous space.
FIGURE 5-12 Axis of scan – paramedian sagittal scan (A) at the level of the lamina, (B) atthe level of the articular process, and (C) at the level of the transverse process.
260
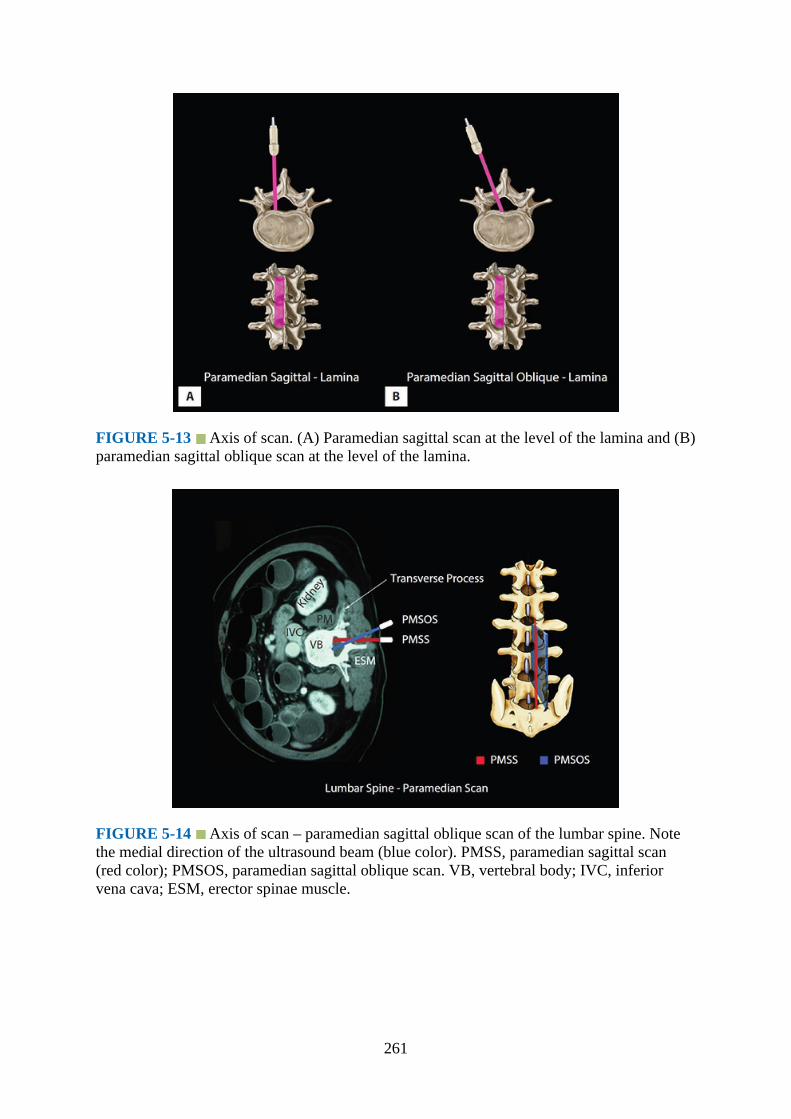
FIGURE 5-13 Axis of scan. (A) Paramedian sagittal scan at the level of the lamina and (B)paramedian sagittal oblique scan at the level of the lamina.
FIGURE 5-14 Axis of scan – paramedian sagittal oblique scan of the lumbar spine. Notethe medial direction of the ultrasound beam (blue color). PMSS, paramedian sagittal scan(red color); PMSOS, paramedian sagittal oblique scan. VB, vertebral body; IVC, inferiorvena cava; ESM, erector spinae muscle.
261
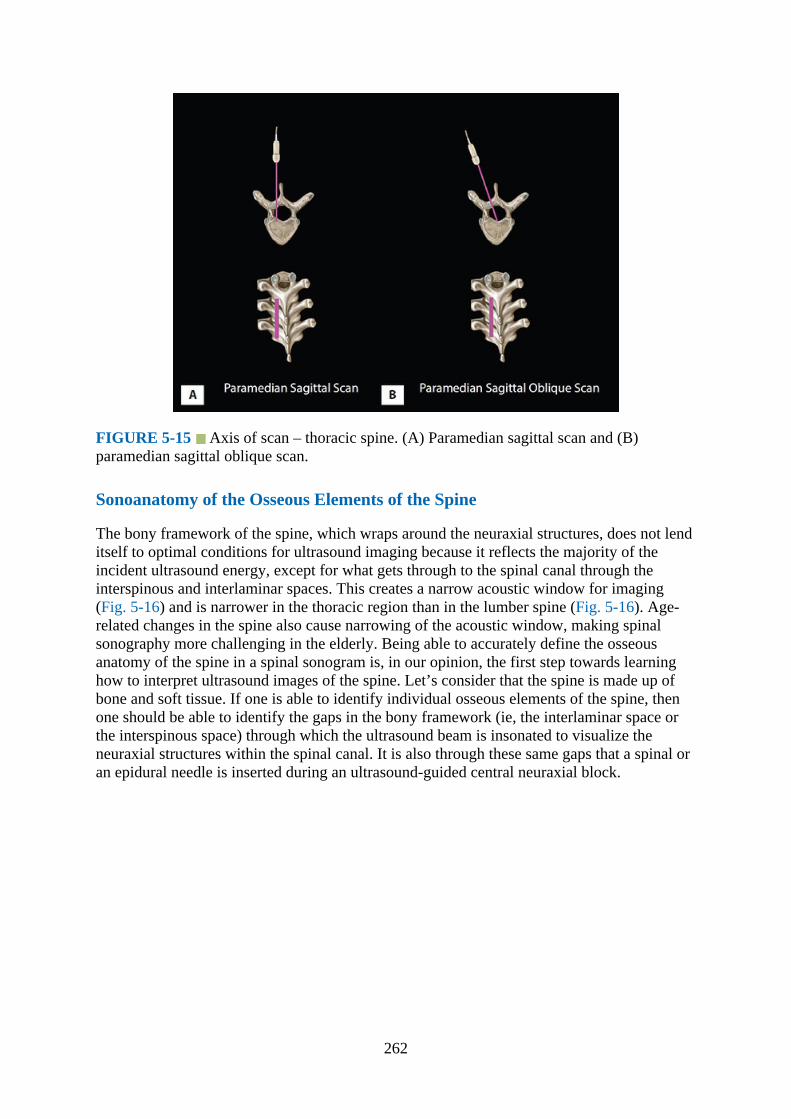
FIGURE 5-15 Axis of scan – thoracic spine. (A) Paramedian sagittal scan and (B)paramedian sagittal oblique scan.
Sonoanatomy of the Osseous Elements of the Spine
The bony framework of the spine, which wraps around the neuraxial structures, does not lenditself to optimal conditions for ultrasound imaging because it reflects the majority of theincident ultrasound energy, except for what gets through to the spinal canal through theinterspinous and interlaminar spaces. This creates a narrow acoustic window for imaging(Fig. 5-16) and is narrower in the thoracic region than in the lumber spine (Fig. 5-16). Age-related changes in the spine also cause narrowing of the acoustic window, making spinalsonography more challenging in the elderly. Being able to accurately define the osseousanatomy of the spine in a spinal sonogram is, in our opinion, the first step towards learninghow to interpret ultrasound images of the spine. Let’s consider that the spine is made up ofbone and soft tissue. If one is able to identify individual osseous elements of the spine, thenone should be able to identify the gaps in the bony framework (ie, the interlaminar space orthe interspinous space) through which the ultrasound beam is insonated to visualize theneuraxial structures within the spinal canal. It is also through these same gaps that a spinal oran epidural needle is inserted during an ultrasound-guided central neuraxial block.
262

FIGURE 5-16 Sagittal sonogram of the lumbar and thoracic spine demonstrating theacoustic window between the acoustic shadows of the laminae. Note the acoustic window islarger in the lumbar spine.
The water-based spine phantom is a simple model to study the osseous anatomy of thespine.1,3,20 It is prepared by immersing a commercially available spine model in a water bath(Fig. 5-17) and imaging it in the transverse and sagittal plane through the water using a low-frequency curved array transducer (Fig. 5-18). The water-based spine phantom, althoughoriginally developed to study the osseous anatomy of the lumbosacral spine,1,3,20 can also beused for the thoracic (Fig. 5-18) and cervical spine. Ultrasonography is often a case of“pattern recognition,” and this is also true for spinal sonography. Each osseous element of thespine produces a characteristic (signature) sonographic pattern that is comparable with thatseen in vivo (Figs. 5-19 to 5-24).1,3 Because water produces an anechoic (black) background,the hyperechoic reflections from the bone are clearly visualized. Also because one can see thespine model through the water, it is possible to validate the sonographic appearance of agiven osseous element by performing the scan with a marker (eg, a needle) in contact with it(Fig. 5-20A). The water-based spine phantom is also relatively cheap, easily prepared,requires little setup time, and can be repeatedly used without it deteriorating or decomposing
263
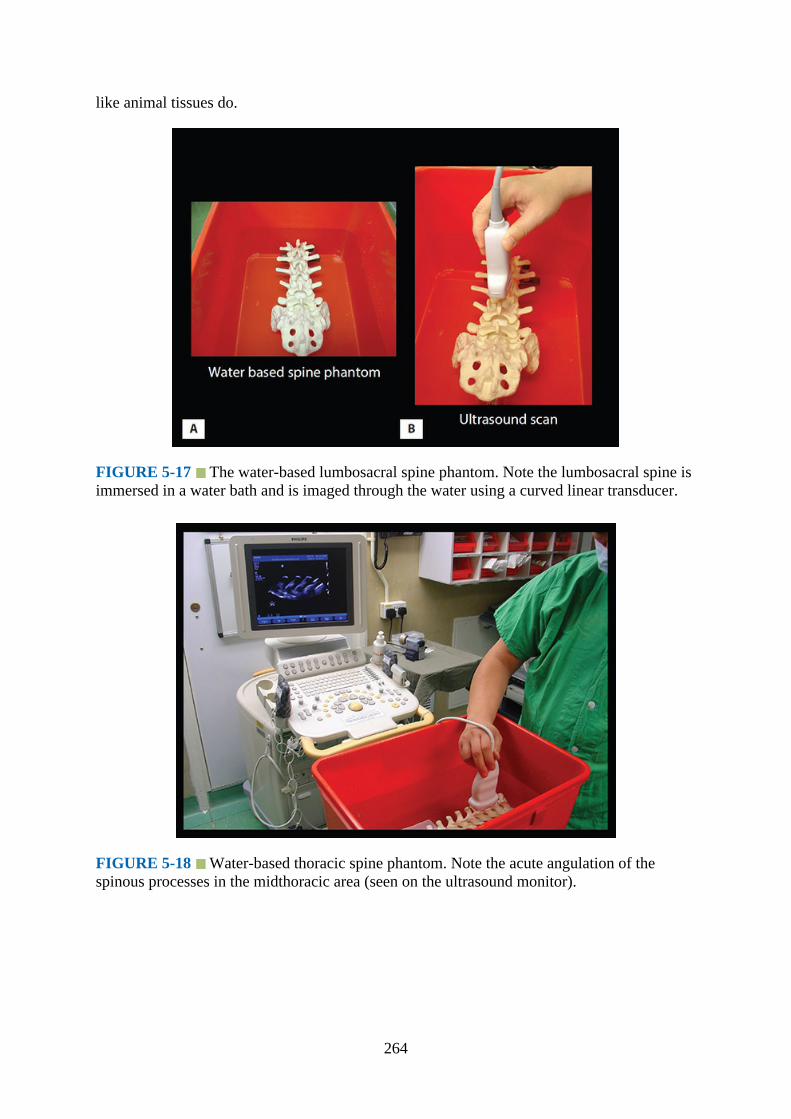
like animal tissues do.
FIGURE 5-17 The water-based lumbosacral spine phantom. Note the lumbosacral spine isimmersed in a water bath and is imaged through the water using a curved linear transducer.
FIGURE 5-18 Water-based thoracic spine phantom. Note the acute angulation of thespinous processes in the midthoracic area (seen on the ultrasound monitor).
264
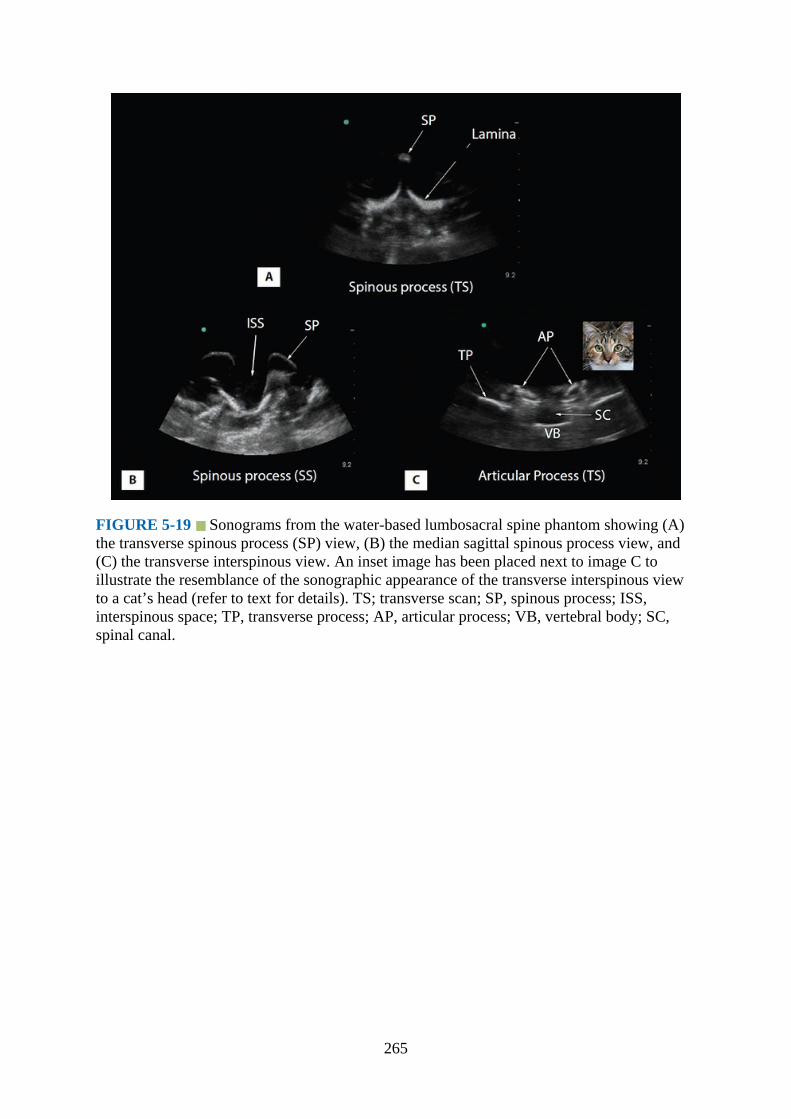
FIGURE 5-19 Sonograms from the water-based lumbosacral spine phantom showing (A)the transverse spinous process (SP) view, (B) the median sagittal spinous process view, and(C) the transverse interspinous view. An inset image has been placed next to image C toillustrate the resemblance of the sonographic appearance of the transverse interspinous viewto a cat’s head (refer to text for details). TS; transverse scan; SP, spinous process; ISS,interspinous space; TP, transverse process; AP, articular process; VB, vertebral body; SC,spinal canal.
265
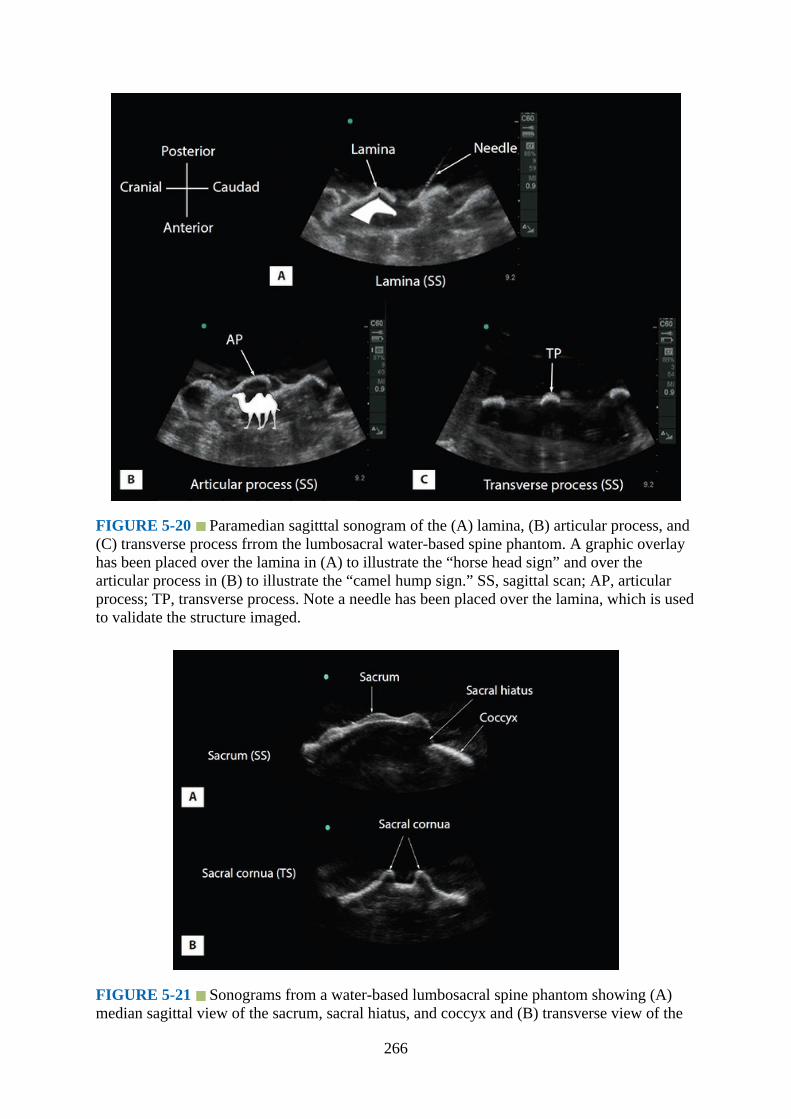
FIGURE 5-20 Paramedian sagitttal sonogram of the (A) lamina, (B) articular process, and(C) transverse process frrom the lumbosacral water-based spine phantom. A graphic overlayhas been placed over the lamina in (A) to illustrate the “horse head sign” and over thearticular process in (B) to illustrate the “camel hump sign.” SS, sagittal scan; AP, articularprocess; TP, transverse process. Note a needle has been placed over the lamina, which is usedto validate the structure imaged.
FIGURE 5-21 Sonograms from a water-based lumbosacral spine phantom showing (A)median sagittal view of the sacrum, sacral hiatus, and coccyx and (B) transverse view of the
266
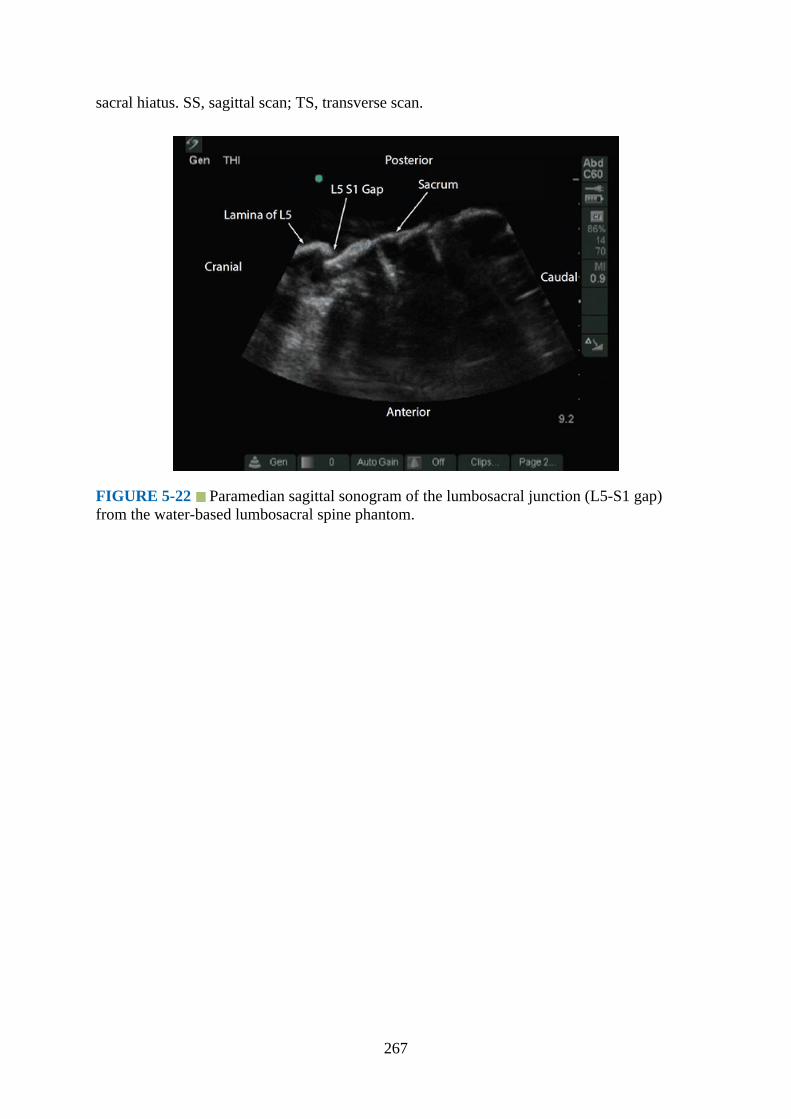
sacral hiatus. SS, sagittal scan; TS, transverse scan.
FIGURE 5-22 Paramedian sagittal sonogram of the lumbosacral junction (L5-S1 gap)from the water-based lumbosacral spine phantom.
267
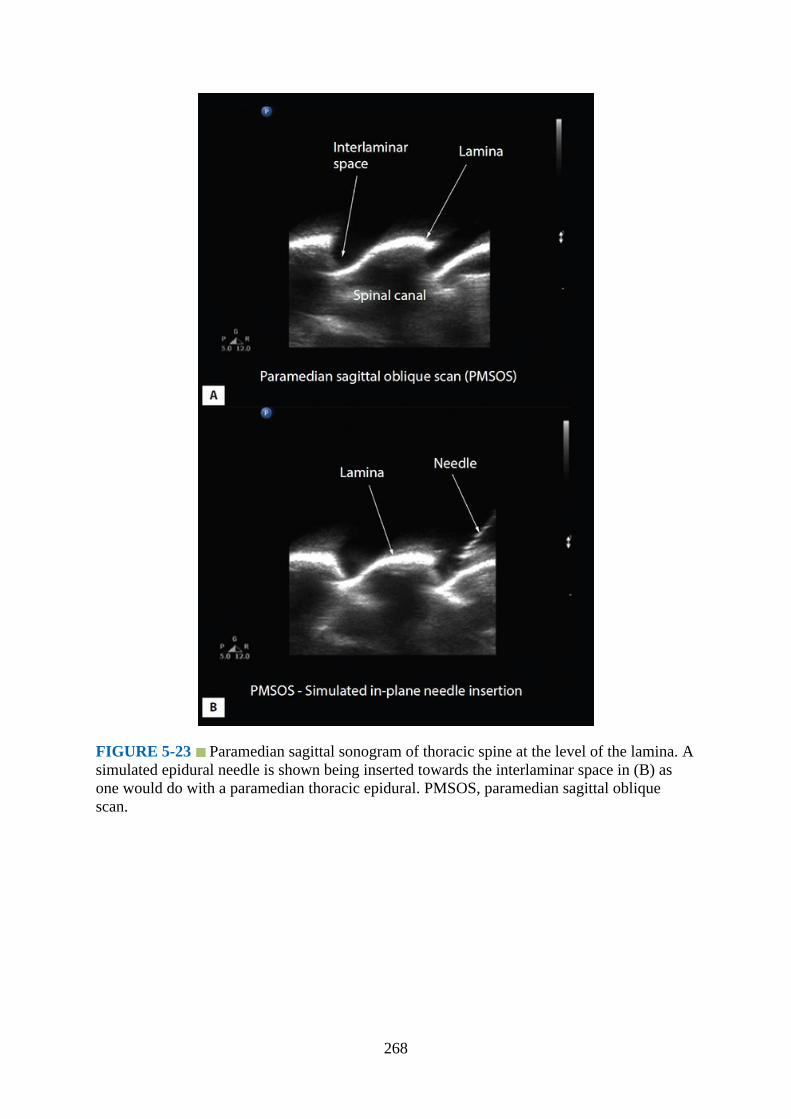
FIGURE 5-23 Paramedian sagittal sonogram of thoracic spine at the level of the lamina. Asimulated epidural needle is shown being inserted towards the interlaminar space in (B) asone would do with a paramedian thoracic epidural. PMSOS, paramedian sagittal obliquescan.
268
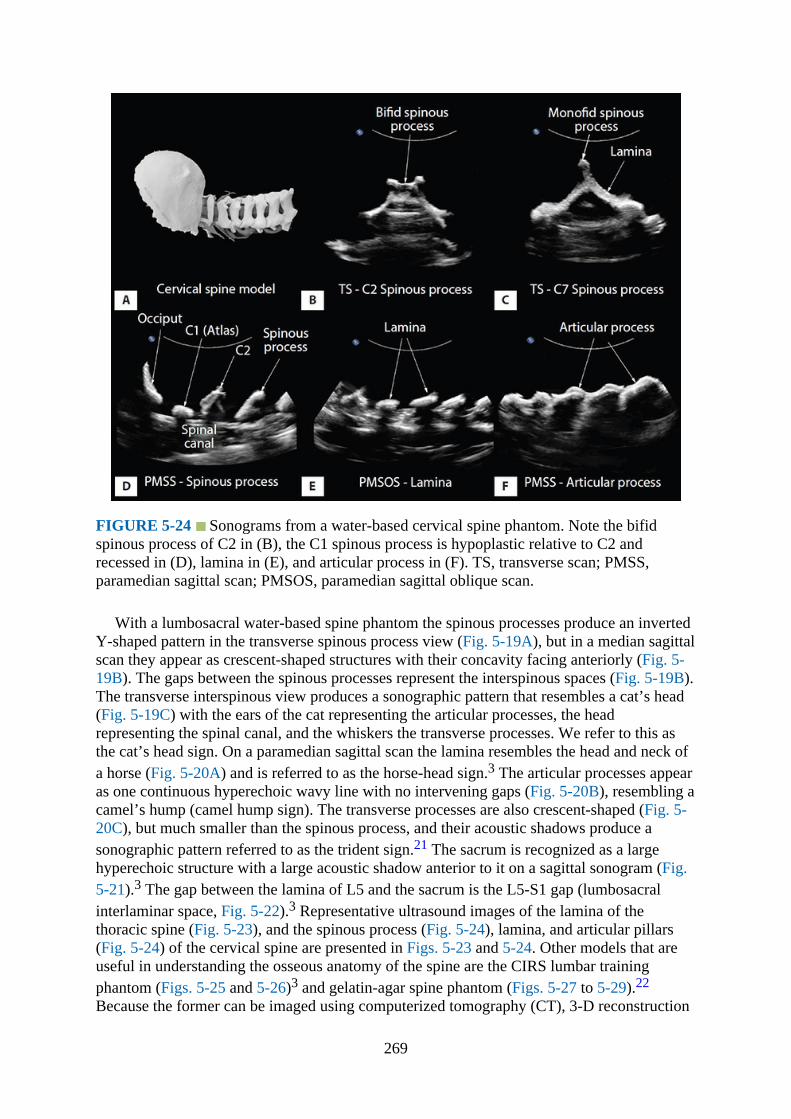
FIGURE 5-24 Sonograms from a water-based cervical spine phantom. Note the bifidspinous process of C2 in (B), the C1 spinous process is hypoplastic relative to C2 andrecessed in (D), lamina in (E), and articular process in (F). TS, transverse scan; PMSS,paramedian sagittal scan; PMSOS, paramedian sagittal oblique scan.
With a lumbosacral water-based spine phantom the spinous processes produce an invertedY-shaped pattern in the transverse spinous process view (Fig. 5-19A), but in a median sagittalscan they appear as crescent-shaped structures with their concavity facing anteriorly (Fig. 5-19B). The gaps between the spinous processes represent the interspinous spaces (Fig. 5-19B).The transverse interspinous view produces a sonographic pattern that resembles a cat’s head(Fig. 5-19C) with the ears of the cat representing the articular processes, the headrepresenting the spinal canal, and the whiskers the transverse processes. We refer to this asthe cat’s head sign. On a paramedian sagittal scan the lamina resembles the head and neck ofa horse (Fig. 5-20A) and is referred to as the horse-head sign.3 The articular processes appearas one continuous hyperechoic wavy line with no intervening gaps (Fig. 5-20B), resembling acamel’s hump (camel hump sign). The transverse processes are also crescent-shaped (Fig. 5-20C), but much smaller than the spinous process, and their acoustic shadows produce asonographic pattern referred to as the trident sign.21 The sacrum is recognized as a largehyperechoic structure with a large acoustic shadow anterior to it on a sagittal sonogram (Fig.5-21).3 The gap between the lamina of L5 and the sacrum is the L5-S1 gap (lumbosacralinterlaminar space, Fig. 5-22).3 Representative ultrasound images of the lamina of thethoracic spine (Fig. 5-23), and the spinous process (Fig. 5-24), lamina, and articular pillars(Fig. 5-24) of the cervical spine are presented in Figs. 5-23 and 5-24. Other models that areuseful in understanding the osseous anatomy of the spine are the CIRS lumbar trainingphantom (Figs. 5-25 and 5-26)3 and gelatin-agar spine phantom (Figs. 5-27 to 5-29).22
Because the former can be imaged using computerized tomography (CT), 3-D reconstruction
269

of high-definition CT scan data (3-D volume data set) can also be used to study the osseousanatomy (Figs. 5-25 and 5-26).
FIGURE 5-25 The CIRS lumbar training phantom (A) shown being imaged usingultrasound (C and D). Also shown is a 3-D reconstructed image of the volume CT data set ofthe CIRS phantom (B).
270
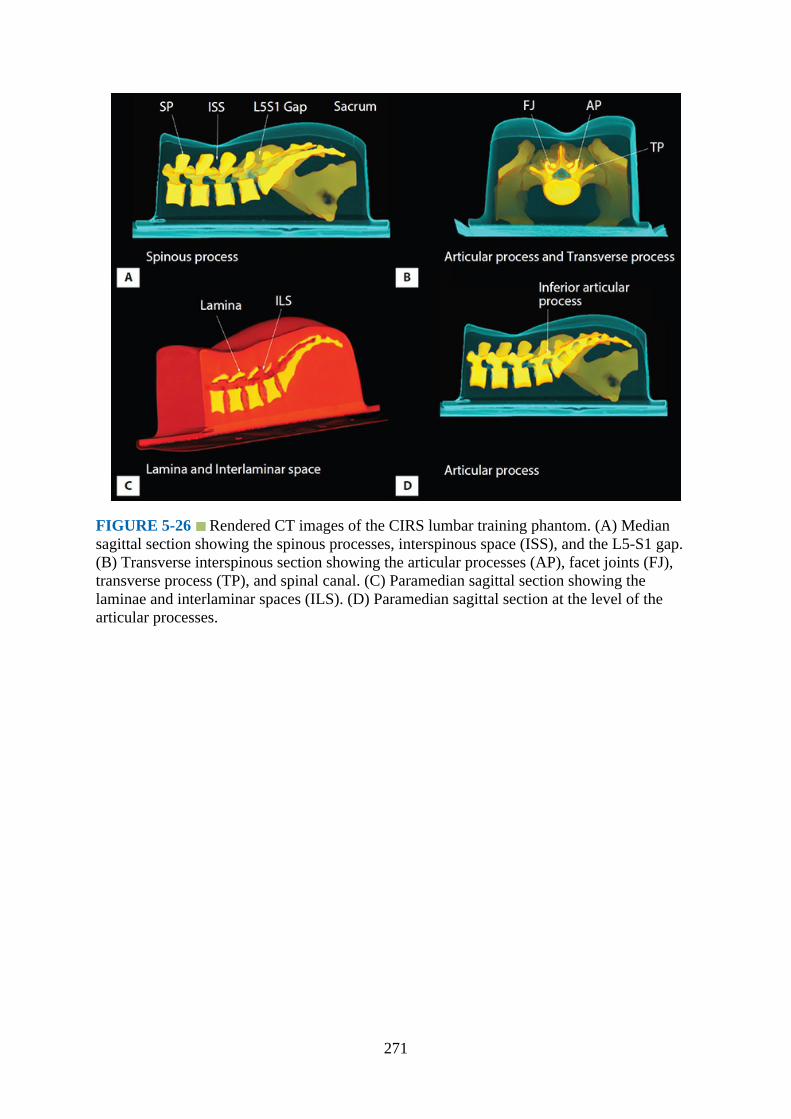
FIGURE 5-26 Rendered CT images of the CIRS lumbar training phantom. (A) Mediansagittal section showing the spinous processes, interspinous space (ISS), and the L5-S1 gap.(B) Transverse interspinous section showing the articular processes (AP), facet joints (FJ),transverse process (TP), and spinal canal. (C) Paramedian sagittal section showing thelaminae and interlaminar spaces (ILS). (D) Paramedian sagittal section at the level of thearticular processes.
271

FIGURE 5-27 Gelatin-agar spine phantom. (A) Lumbosacral spine model secured to thebase of the plastic box. (B) Spine phantom after being embedded in the gelatin-agar mixture.(C) Performing ultrasound scan of the gelatin-agar spine phantom. (D) Simulated in-planeneedle insertion in the gelatin-agar spine phantom.
272
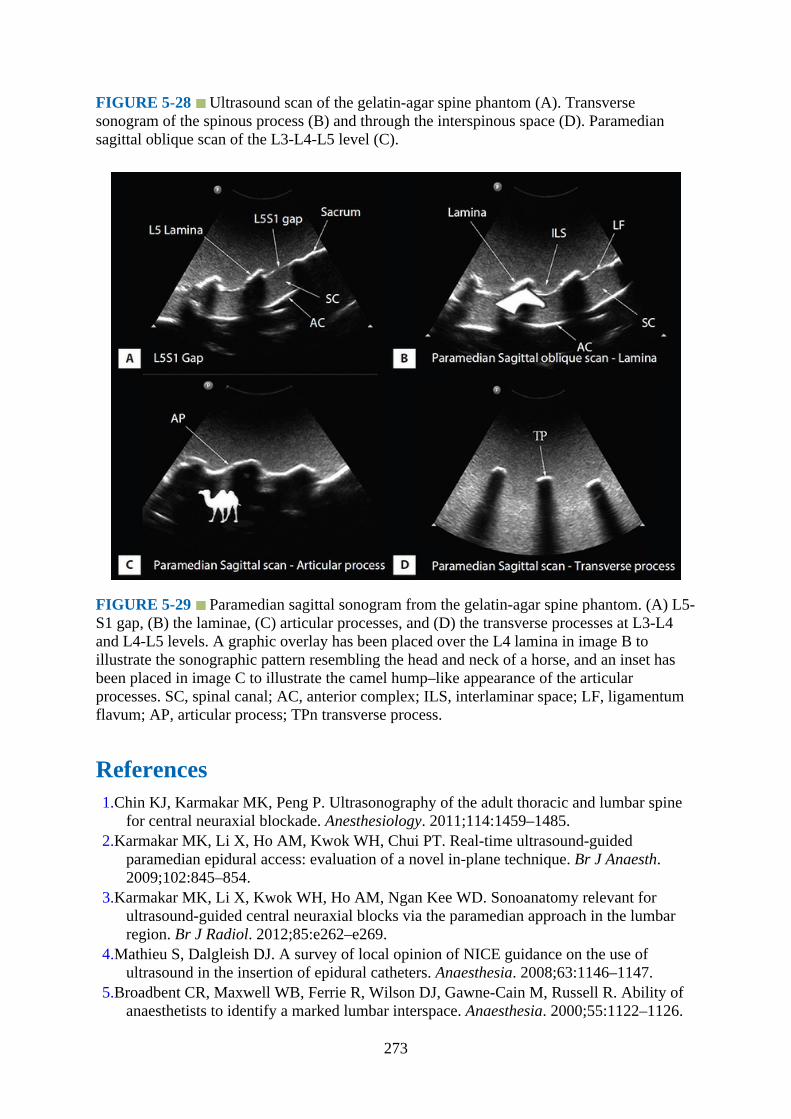
FIGURE 5-28 Ultrasound scan of the gelatin-agar spine phantom (A). Transversesonogram of the spinous process (B) and through the interspinous space (D). Paramediansagittal oblique scan of the L3-L4-L5 level (C).
FIGURE 5-29 Paramedian sagittal sonogram from the gelatin-agar spine phantom. (A) L5-S1 gap, (B) the laminae, (C) articular processes, and (D) the transverse processes at L3-L4and L4-L5 levels. A graphic overlay has been placed over the L4 lamina in image B toillustrate the sonographic pattern resembling the head and neck of a horse, and an inset hasbeen placed in image C to illustrate the camel hump–like appearance of the articularprocesses. SC, spinal canal; AC, anterior complex; ILS, interlaminar space; LF, ligamentumflavum; AP, articular process; TPn transverse process.
References1.Chin KJ, Karmakar MK, Peng P. Ultrasonography of the adult thoracic and lumbar spine
for central neuraxial blockade. Anesthesiology. 2011;114:1459–1485.2.Karmakar MK, Li X, Ho AM, Kwok WH, Chui PT. Real-time ultrasound-guided
paramedian epidural access: evaluation of a novel in-plane technique. Br J Anaesth.2009;102:845–854.
3.Karmakar MK, Li X, Kwok WH, Ho AM, Ngan Kee WD. Sonoanatomy relevant forultrasound-guided central neuraxial blocks via the paramedian approach in the lumbarregion. Br J Radiol. 2012;85:e262–e269.
4.Mathieu S, Dalgleish DJ. A survey of local opinion of NICE guidance on the use ofultrasound in the insertion of epidural catheters. Anaesthesia. 2008;63:1146–1147.
5.Broadbent CR, Maxwell WB, Ferrie R, Wilson DJ, Gawne-Cain M, Russell R. Ability ofanaesthetists to identify a marked lumbar interspace. Anaesthesia. 2000;55:1122–1126.
273

6.Furness G, Reilly MP, Kuchi S. An evaluation of ultrasound imaging for identification oflumbar intervertebral level. Anaesthesia. 2002;57:277–280.
7.Arzola C, Davies S, Rofaeel A, Carvalho JC. Ultrasound using the transverse approach tothe lumbar spine provides reliable landmarks for labor epidurals. Anesth Analg.2007;104:1188–1192.
8.Balki M, Lee Y, Halpern S, Carvalho JC. Ultrasound imaging of the lumbar spine in thetransverse plane: the correlation between estimated and actual depth to the epiduralspace in obese parturients. Anesth Analg. 2009;108:1876–1881.
9.Cork RC, Kryc JJ, Vaughan RW. Ultrasonic localization of the lumbar epidural space.Anesthesiology. 1980;52:513–516.
10.Weed JT, Taenzer AH, Finkel KJ, Sites BD. Evaluation of pre-procedure ultrasoundexamination as a screening tool for difficult spinal anaesthesia. Anaesthesia.2011;66:925–930.
11.Grau T, Leipold RW, Conradi R, Martin E. Ultrasound control for presumed difficultepidural puncture. Acta Anaesthesiol Scand. 2001;45:766–771.
12.Grau T, Leipold RW, Conradi R, Martin E, Motsch J. Ultrasound imaging facilitateslocalization of the epidural space during combined spinal and epidural anesthesia. RegAnesth Pain Med. 2001;26:64–67.
13.Grau T, Leipold RW, Conradi R, Martin E, Motsch J. Efficacy of ultrasound imaging inobstetric epidural anesthesia. J Clin Anesth. 2002;14:169–175.
14.Grau T, Leipold RW, Fatehi S, Martin E, Motsch J. Real-time ultrasonic observation ofcombined spinal-epidural anaesthesia. Eur J Anaesthesiol. 2004;21:25–31.
15.Chin KJ, Chan VW, Ramlogan R, Perlas A. Real-time ultrasound-guided spinal anesthesiain patients with a challenging spinal anatomy: two case reports. Acta Anaesthesiol Scand.2010;54:252–255.
16.Yeo ST, French R. Combined spinal-epidural in the obstetric patient with Harrington rodsassisted by ultrasonography. Br J Anaesth. 1999;83:670–672.
17.Saifuddin A, Burnett SJ, White J. The variation of position of the conus medullaris in anadult population. A magnetic resonance imaging study. Spine (Phila Pa 1976).1998;23:1452–1456.
18.MacDonald A, Chatrath P, Spector T, Ellis H. Level of termination of the spinal cord andthe dural sac: a magnetic resonance study. Clin Anat. 1999;12:149–152.
19.Grau T, Leipold RW, Horter J, Conradi R, Martin EO, Motsch J. Paramedian access to theepidural space: the optimum window for ultrasound imaging. J Clin Anesth.2001;13:213–217.
20.Karmakar MK, Li X, Kwok WH, Ho AM, Ngan Kee WD. The “water-based-spine-phantom” — A small step towards learning the basics of spinal sonography. Br J Anaest.2009. (http://bja.oxfordjournals.org/cgi/qa-display/short/brjana_el;4114). AccessedDecember 31, 2014.
21.Karmakar MK, Ho AM, Li X, Kwok WH, Tsang K, Kee WD. Ultrasound-guided lumbarplexus block through the acoustic window of the lumbar ultrasound trident. Br J Anaesth.2008;100:533–537.
22.Li JW, Karmakar MK, Li X, Kwok WH, Ngan Kee WD. Gelatin-agar lumbosacral spinephantom: a simple model for learning the basic skills required to perform real-timesonographically guided central neuraxial blocks. J Ultrasound Med. 2011;30:263–272.
274

275

CHAPTER 6
Sonoanatomy Relevant for Ultrasound-Guided Injectionsof the Cervical Spine
IntroductionInjections of the cervical spine are frequently used for pain management in chronic painmedicine. The concentration of bony structures and nerves in the cervical spine, each ofwhich can be a cause of pain, as well as vessels, requires an intimate knowledge of theanatomy. The relevant procedures in the cervical spine include facet joint and medial branchblocks, selective nerve root injection, third occipital nerve block, epidural steroid injection,and stellate ganglion block. In this chapter we discuss the anatomy relevant for theseprocedures.
Basic Cervical Spine AnatomyThe cervical spine (Figs. 6-1 to 6-3) is a column of seven vertebrae supporting the skull andneck structures. The atlanto-occipital and atlantoaxial joints are unique. The former is anellipsoid joint, and the atlantoaxial joint is a rotatory joint. The atlantoaxial joint is borderedby the C2 dorsal root ganglion and vertebral artery. The cervical vertebrae are identified bythe presence of the foramen transversarium (transverse foramen) for the vertebral artery.
276

FIGURE 6-1 Cervical spine – lateral view.
FIGURE 6-2 Cervical spine – anterior view. VB, vertebral body.
277
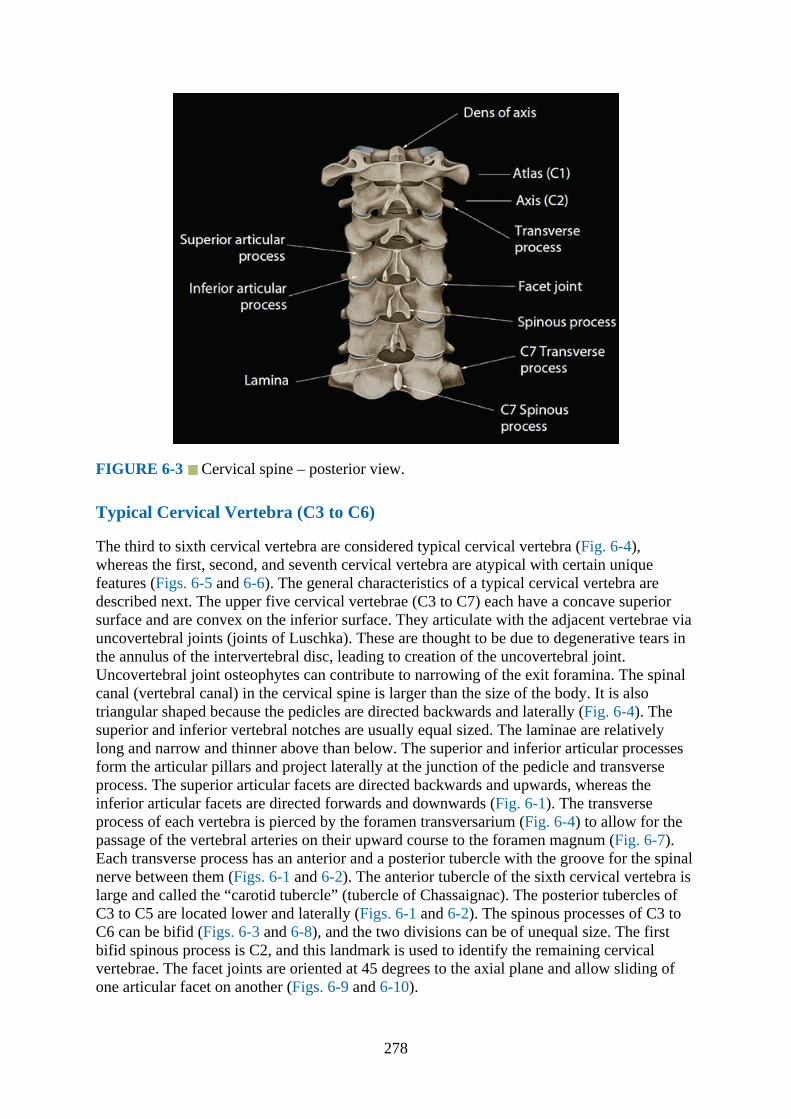
FIGURE 6-3 Cervical spine – posterior view.
Typical Cervical Vertebra (C3 to C6)
The third to sixth cervical vertebra are considered typical cervical vertebra (Fig. 6-4),whereas the first, second, and seventh cervical vertebra are atypical with certain uniquefeatures (Figs. 6-5 and 6-6). The general characteristics of a typical cervical vertebra aredescribed next. The upper five cervical vertebrae (C3 to C7) each have a concave superiorsurface and are convex on the inferior surface. They articulate with the adjacent vertebrae viauncovertebral joints (joints of Luschka). These are thought to be due to degenerative tears inthe annulus of the intervertebral disc, leading to creation of the uncovertebral joint.Uncovertebral joint osteophytes can contribute to narrowing of the exit foramina. The spinalcanal (vertebral canal) in the cervical spine is larger than the size of the body. It is alsotriangular shaped because the pedicles are directed backwards and laterally (Fig. 6-4). Thesuperior and inferior vertebral notches are usually equal sized. The laminae are relativelylong and narrow and thinner above than below. The superior and inferior articular processesform the articular pillars and project laterally at the junction of the pedicle and transverseprocess. The superior articular facets are directed backwards and upwards, whereas theinferior articular facets are directed forwards and downwards (Fig. 6-1). The transverseprocess of each vertebra is pierced by the foramen transversarium (Fig. 6-4) to allow for thepassage of the vertebral arteries on their upward course to the foramen magnum (Fig. 6-7).Each transverse process has an anterior and a posterior tubercle with the groove for the spinalnerve between them (Figs. 6-1 and 6-2). The anterior tubercle of the sixth cervical vertebra islarge and called the “carotid tubercle” (tubercle of Chassaignac). The posterior tubercles ofC3 to C5 are located lower and laterally (Figs. 6-1 and 6-2). The spinous processes of C3 toC6 can be bifid (Figs. 6-3 and 6-8), and the two divisions can be of unequal size. The firstbifid spinous process is C2, and this landmark is used to identify the remaining cervicalvertebrae. The facet joints are oriented at 45 degrees to the axial plane and allow sliding ofone articular facet on another (Figs. 6-9 and 6-10).
278

FIGURE 6-4 A typical cervical vertebra (C4 - fourth cervical vertebra). SAF, superiorarticular facet; SAP, superior articular process; VB, vertebral body; IAF, inferior articularfacet; IAP, inferior articular process.
279
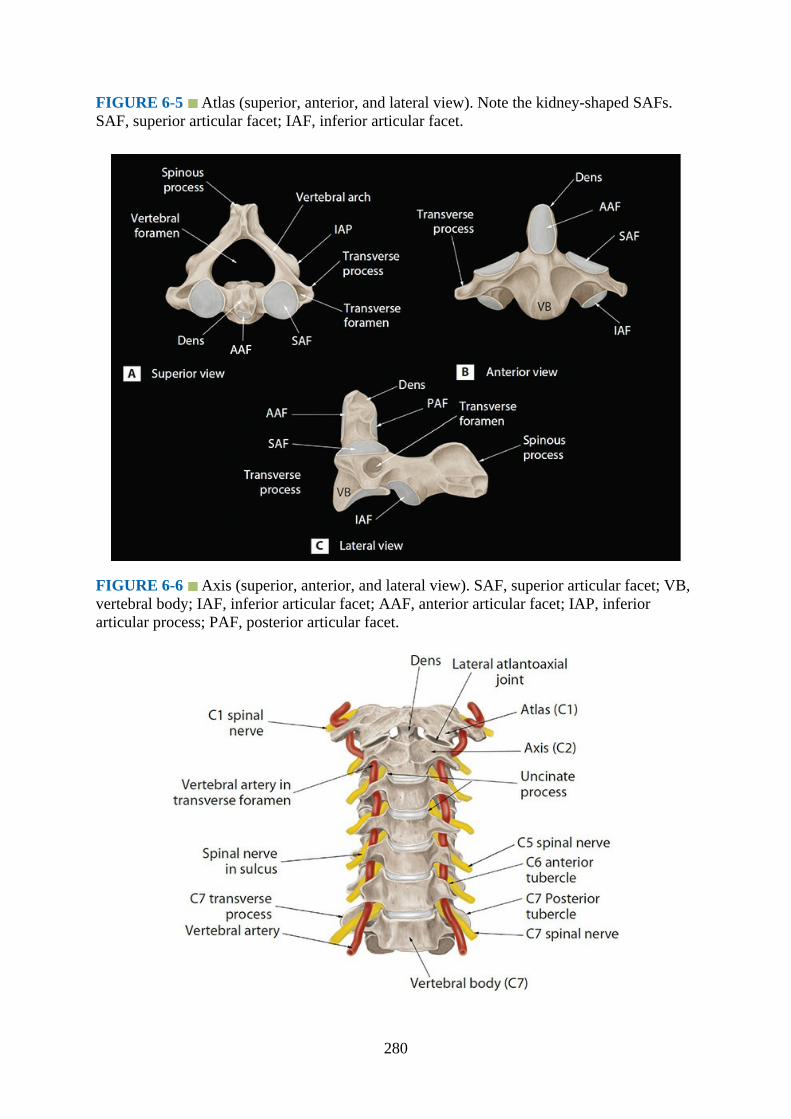
FIGURE 6-5 Atlas (superior, anterior, and lateral view). Note the kidney-shaped SAFs.SAF, superior articular facet; IAF, inferior articular facet.
FIGURE 6-6 Axis (superior, anterior, and lateral view). SAF, superior articular facet; VB,vertebral body; IAF, inferior articular facet; AAF, anterior articular facet; IAP, inferiorarticular process; PAF, posterior articular facet.
280

FIGURE 6-7 Cervical spine (anterior view) showing the relationship of the cervical spinalnerves and the vertebral artery to the transverse processes of the vertebra. Note the transverseprocesses of the C7 vertebra lack an anterior tubercle and the relationship of the vertebralartery to the C7 spinal nerve and the transverse processes.
FIGURE 6-8 Cross-sectional cadaver anatomic section through the C2 vertebral bodyshowing the bifid spinous process of C2. This is an anatomical landmark used to identify theC2 vertebra as it is the first cervical vertebra with a bifid spinous process. The spinousprocess may be tilted to the right or left. Gentle left and right angulation of the probe in thelongitudinal sagittal plane may be required to visualize these spinous processes.
281

FIGURE 6-9 Paramedian sagittal cadaver anatomic section through the cervical spinedemonstrating the lamina of the cervical vertebrae. VB, vertebral body.
FIGURE 6-10 Cross-sectional cadaver anatomic section through the cervical spinedemonstrating the facet joints. Note that the facet joints are orientated at about 45 degrees tothe horizontal plane in transverse section.
The cervical spinal canal measures about 14 to 20 mm in the mediolateral dimension and15 to 20 mm in the anteroposterior dimension. The spinal nerves (formed by the anterior andposterior nerve roots) exit through the neural foramina. These foramina are largest at C2 toC3 and progressively decrease in size to the C6 to C7 levels. The spinal nerve and gangliontake up about 33% of the foraminal space. The foramen is bordered anteromedially by theuncovertebral joints and posterolaterally by the facet joints. The pedicles border the exitforamina superior and inferiorly. The spinal nerves exit above their corresponding vertebralbodies. The C1 nerve exits above the C1 vertebra (atlas). The next spinal nerve is C2, exitingabove the C2 vertebra (axis). Following this naming convention, the last cervical nerve root isC8, and it exits between the C7 and T1 vertebrae (Figs. 6-11 and 6-12).
282

FIGURE 6-11 Cross-sectional cadaver anatomic section through the cervical spinedemonstrating the exiting C5 nerve root. The C5 nerve root exits the neural foramen and is inclose relation to the vertebral artery posteriorly. Both these structures are bound by the largeranterior tubercle and the smaller posterior tubercle. TP, transverse process.
FIGURE 6-12 Sagittal cadaver anatomic section of the exit neural foramina demonstratingthe C5 nerve root exiting between the transverse processes (TP) of C4 superiorly (C4 TP) andC5 (C5 TP) inferiorly. The bulk of sternocleidomastoid muscle lies anteriorly and may betraversed during procedures in the cervical spine.
The anterior spinal artery is located in the central sulcus of the cord, with paired posteriorarteries running on the posterolateral aspect of the cord dorsally. The anterior spinal artery isan important artery: it supplies the anterior two-thirds of the cervical spinal cord. The artery
283
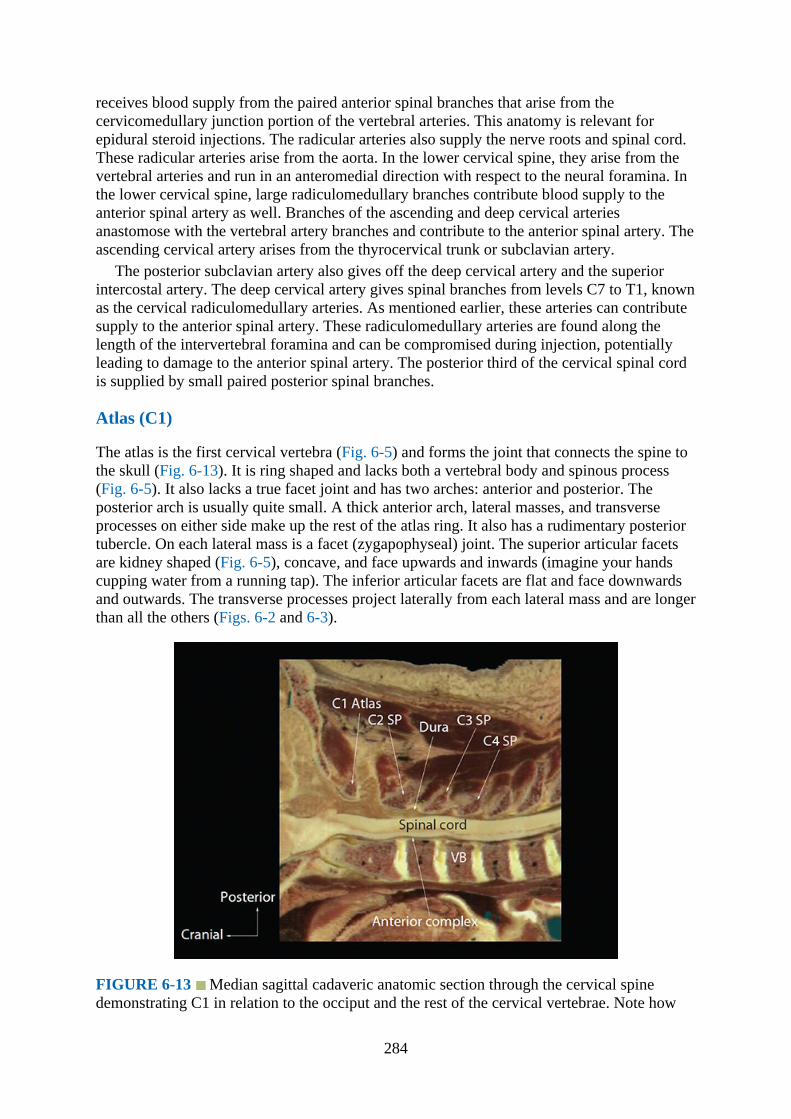
receives blood supply from the paired anterior spinal branches that arise from thecervicomedullary junction portion of the vertebral arteries. This anatomy is relevant forepidural steroid injections. The radicular arteries also supply the nerve roots and spinal cord.These radicular arteries arise from the aorta. In the lower cervical spine, they arise from thevertebral arteries and run in an anteromedial direction with respect to the neural foramina. Inthe lower cervical spine, large radiculomedullary branches contribute blood supply to theanterior spinal artery as well. Branches of the ascending and deep cervical arteriesanastomose with the vertebral artery branches and contribute to the anterior spinal artery. Theascending cervical artery arises from the thyrocervical trunk or subclavian artery.
The posterior subclavian artery also gives off the deep cervical artery and the superiorintercostal artery. The deep cervical artery gives spinal branches from levels C7 to T1, knownas the cervical radiculomedullary arteries. As mentioned earlier, these arteries can contributesupply to the anterior spinal artery. These radiculomedullary arteries are found along thelength of the intervertebral foramina and can be compromised during injection, potentiallyleading to damage to the anterior spinal artery. The posterior third of the cervical spinal cordis supplied by small paired posterior spinal branches.
Atlas (C1)
The atlas is the first cervical vertebra (Fig. 6-5) and forms the joint that connects the spine tothe skull (Fig. 6-13). It is ring shaped and lacks both a vertebral body and spinous process(Fig. 6-5). It also lacks a true facet joint and has two arches: anterior and posterior. Theposterior arch is usually quite small. A thick anterior arch, lateral masses, and transverseprocesses on either side make up the rest of the atlas ring. It also has a rudimentary posteriortubercle. On each lateral mass is a facet (zygapophyseal) joint. The superior articular facetsare kidney shaped (Fig. 6-5), concave, and face upwards and inwards (imagine your handscupping water from a running tap). The inferior articular facets are flat and face downwardsand outwards. The transverse processes project laterally from each lateral mass and are longerthan all the others (Figs. 6-2 and 6-3).
FIGURE 6-13 Median sagittal cadaveric anatomic section through the cervical spinedemonstrating C1 in relation to the occiput and the rest of the cervical vertebrae. Note how
284
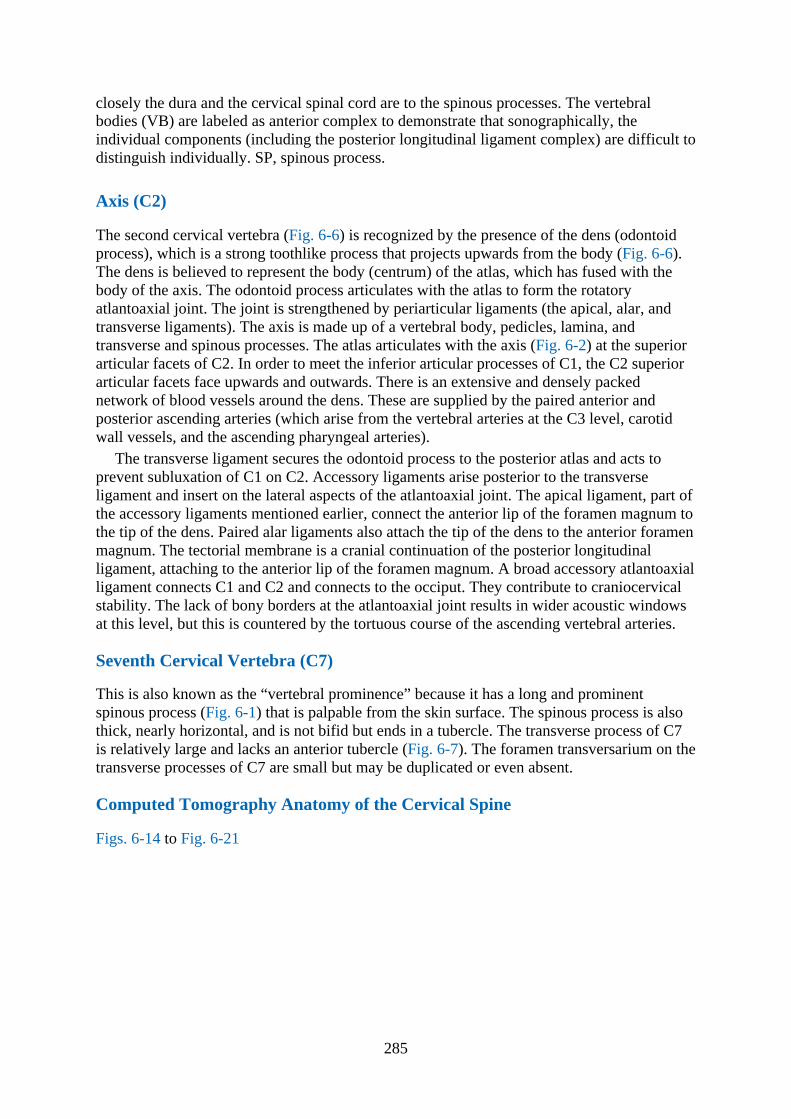
closely the dura and the cervical spinal cord are to the spinous processes. The vertebralbodies (VB) are labeled as anterior complex to demonstrate that sonographically, theindividual components (including the posterior longitudinal ligament complex) are difficult todistinguish individually. SP, spinous process.
Axis (C2)
The second cervical vertebra (Fig. 6-6) is recognized by the presence of the dens (odontoidprocess), which is a strong toothlike process that projects upwards from the body (Fig. 6-6).The dens is believed to represent the body (centrum) of the atlas, which has fused with thebody of the axis. The odontoid process articulates with the atlas to form the rotatoryatlantoaxial joint. The joint is strengthened by periarticular ligaments (the apical, alar, andtransverse ligaments). The axis is made up of a vertebral body, pedicles, lamina, andtransverse and spinous processes. The atlas articulates with the axis (Fig. 6-2) at the superiorarticular facets of C2. In order to meet the inferior articular processes of C1, the C2 superiorarticular facets face upwards and outwards. There is an extensive and densely packednetwork of blood vessels around the dens. These are supplied by the paired anterior andposterior ascending arteries (which arise from the vertebral arteries at the C3 level, carotidwall vessels, and the ascending pharyngeal arteries).
The transverse ligament secures the odontoid process to the posterior atlas and acts toprevent subluxation of C1 on C2. Accessory ligaments arise posterior to the transverseligament and insert on the lateral aspects of the atlantoaxial joint. The apical ligament, part ofthe accessory ligaments mentioned earlier, connect the anterior lip of the foramen magnum tothe tip of the dens. Paired alar ligaments also attach the tip of the dens to the anterior foramenmagnum. The tectorial membrane is a cranial continuation of the posterior longitudinalligament, attaching to the anterior lip of the foramen magnum. A broad accessory atlantoaxialligament connects C1 and C2 and connects to the occiput. They contribute to craniocervicalstability. The lack of bony borders at the atlantoaxial joint results in wider acoustic windowsat this level, but this is countered by the tortuous course of the ascending vertebral arteries.
Seventh Cervical Vertebra (C7)
This is also known as the “vertebral prominence” because it has a long and prominentspinous process (Fig. 6-1) that is palpable from the skin surface. The spinous process is alsothick, nearly horizontal, and is not bifid but ends in a tubercle. The transverse process of C7is relatively large and lacks an anterior tubercle (Fig. 6-7). The foramen transversarium on thetransverse processes of C7 are small but may be duplicated or even absent.
Computed Tomography Anatomy of the Cervical Spine
Figs. 6-14 to Fig. 6-21
285

FIGURE 6-14 Transverse CT section through the cervical spine demonstrating the facetjoints at the C5 to C6 level. The inferior articular pillar of the C6 (vertebra inferior to thejoint) is located anterior to the joint space. The superior articular pillar of the C5 (vertebrasuperior to the joint) is located posterior to the joint space.
FIGURE 6-15 Transverse CT section through the cervical spine demonstrating the facetjoints at the C6 to C7 level. Note the relatively horizontal orientation of the facet joint asopposed to the obliquity of the C5 to C6 facet superiorly.
286

FIGURE 6-16 Transverse CT section through the cervical spine. The lamina on theposterolateral aspect of the vertebra flows into the transverse process. The longus collimuscle lies on the anteromedial aspect of the transverse process.
FIGURE 6-17 Transverse CT section through the body of the seventh cervical spinedemonstrating its large and prominent spinous process (vertebra prominence). VB, vertebralbody.
287
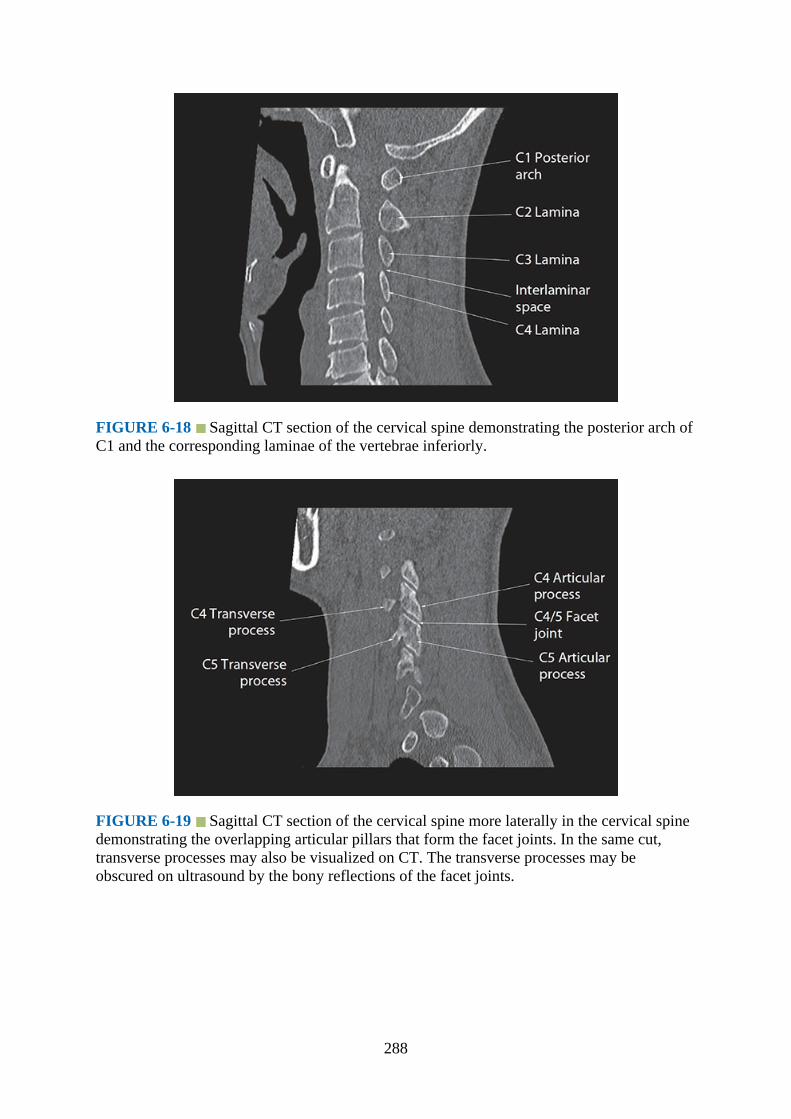
FIGURE 6-18 Sagittal CT section of the cervical spine demonstrating the posterior arch ofC1 and the corresponding laminae of the vertebrae inferiorly.
FIGURE 6-19 Sagittal CT section of the cervical spine more laterally in the cervical spinedemonstrating the overlapping articular pillars that form the facet joints. In the same cut,transverse processes may also be visualized on CT. The transverse processes may beobscured on ultrasound by the bony reflections of the facet joints.
288

FIGURE 6-20 Sagittal CT section of the cervical spine in the midline demonstrating thespinous processes aligned with the occiput. The tips of the spinous processes are echogenicon ultrasound. Starting with the broad echogenic base of the occiput, these echogenic pointscan be used to identify the levels of the cervical spine. Note that the spinous process of C1 ishypoplastic relative to C2 and recessed. It is important to identify this recess to avoidmislabeling C2 as the first cervical vertebra on ultrasound.
FIGURE 6-21 Sagittal CT section of the cervical spine demonstrating the relationships ofthe articular pillars, facet joints, and the vertebral artery within the foramen transversarium.Also note the oblique angulation of the facet joints in the sagittal plane. In order forsuccessful facet joint injection, the needle should be parallel to the angulation of the joint.
289

Magnetic Resonance Anatomy of the Cervical Spine
Figs. 6-22 to 6-38
FIGURE 6-22 Sagittal T2-weighted MRI section of the cervical spine demonstrating theposterior arch of C1 and the corresponding laminae of the vertebrae inferiorly. Note the slightoverlap of the laminae, which is seen on ultrasound as a “horse head” configuration.Cerebrospinal fluid (hyperintense signal) bathes the small nerve roots in the spinal canal.
FIGURE 6-23 Sagittal T2-weighted MRI section of the cervical spine more laterally in thecervical spine demonstrating the overlapping articular pillars that form facet joints.
290
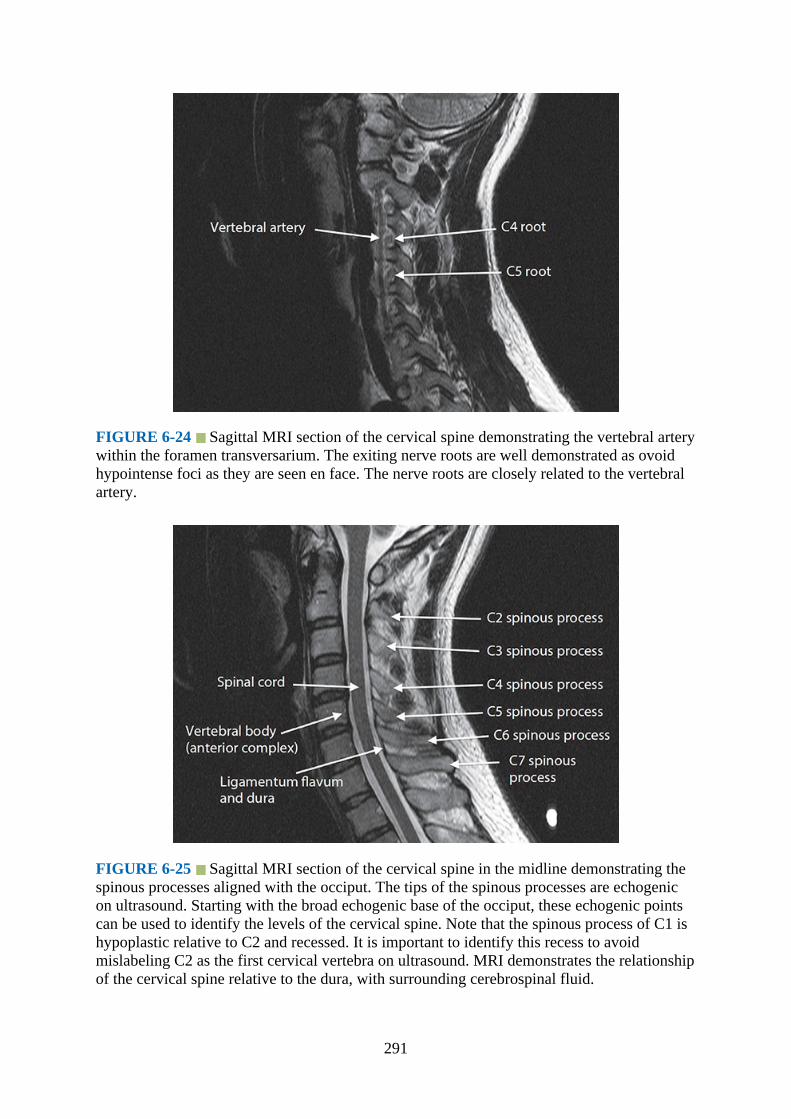
FIGURE 6-24 Sagittal MRI section of the cervical spine demonstrating the vertebral arterywithin the foramen transversarium. The exiting nerve roots are well demonstrated as ovoidhypointense foci as they are seen en face. The nerve roots are closely related to the vertebralartery.
FIGURE 6-25 Sagittal MRI section of the cervical spine in the midline demonstrating thespinous processes aligned with the occiput. The tips of the spinous processes are echogenicon ultrasound. Starting with the broad echogenic base of the occiput, these echogenic pointscan be used to identify the levels of the cervical spine. Note that the spinous process of C1 ishypoplastic relative to C2 and recessed. It is important to identify this recess to avoidmislabeling C2 as the first cervical vertebra on ultrasound. MRI demonstrates the relationshipof the cervical spine relative to the dura, with surrounding cerebrospinal fluid.
291
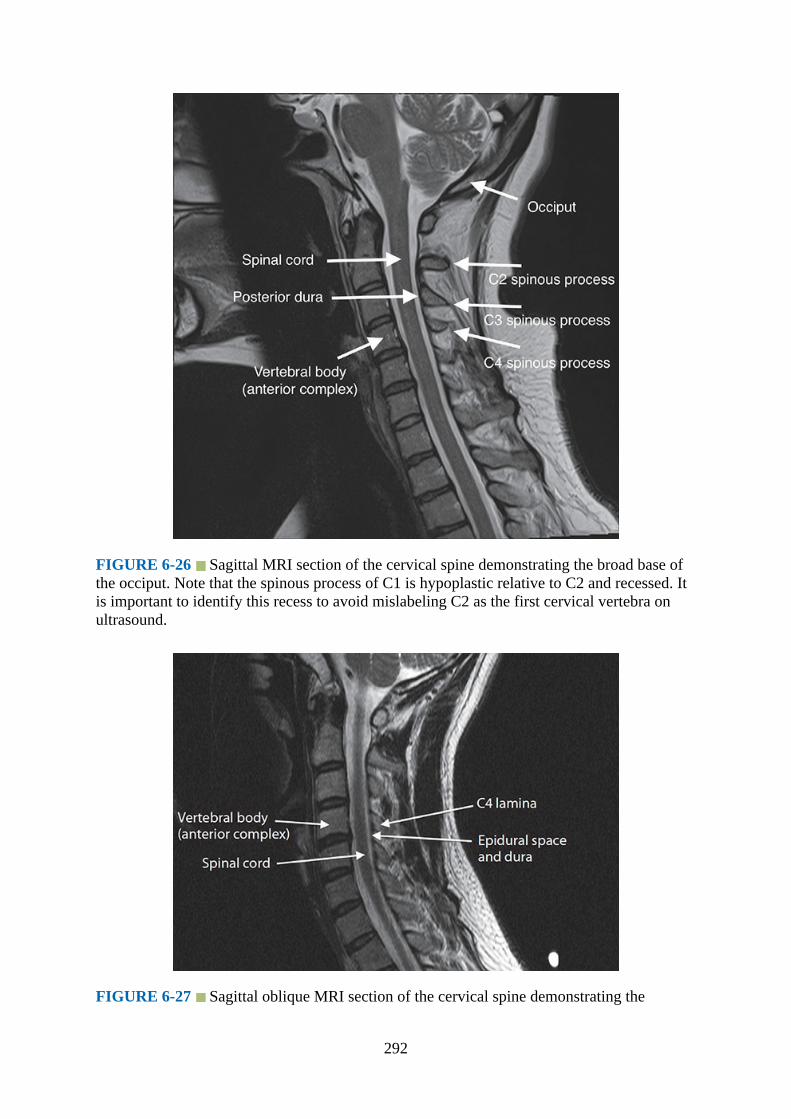
FIGURE 6-26 Sagittal MRI section of the cervical spine demonstrating the broad base ofthe occiput. Note that the spinous process of C1 is hypoplastic relative to C2 and recessed. Itis important to identify this recess to avoid mislabeling C2 as the first cervical vertebra onultrasound.
FIGURE 6-27 Sagittal oblique MRI section of the cervical spine demonstrating the
292
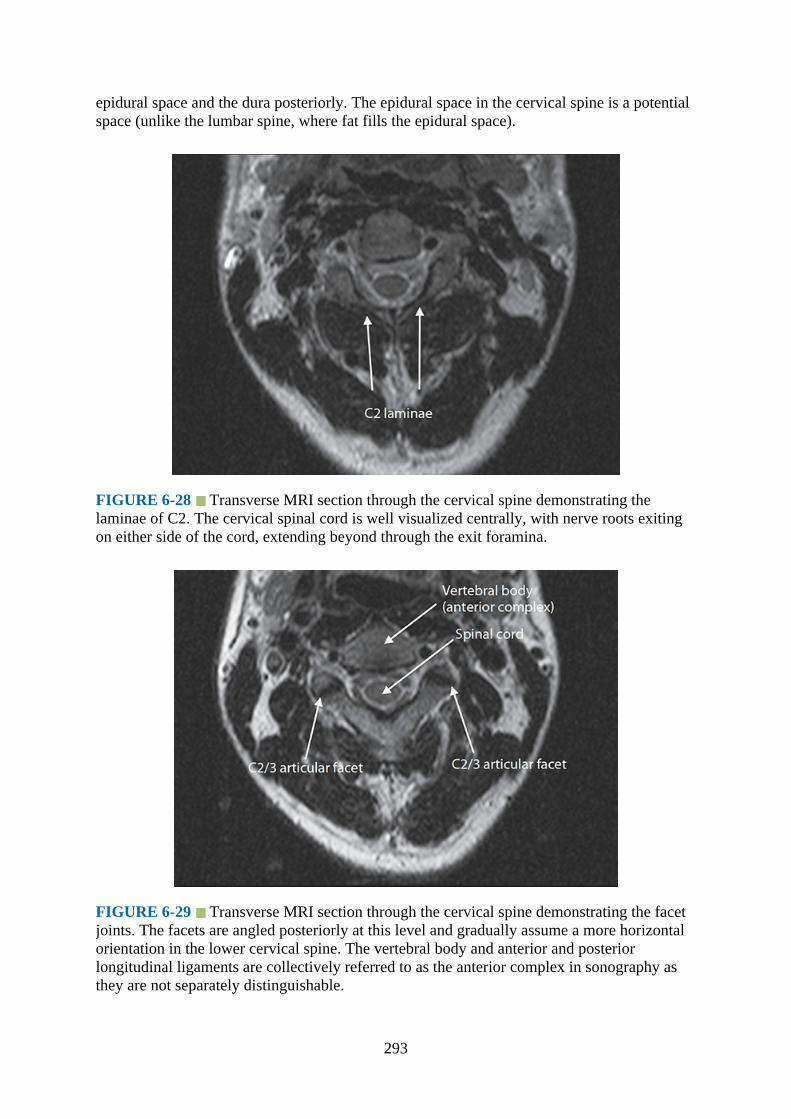
epidural space and the dura posteriorly. The epidural space in the cervical spine is a potentialspace (unlike the lumbar spine, where fat fills the epidural space).
FIGURE 6-28 Transverse MRI section through the cervical spine demonstrating thelaminae of C2. The cervical spinal cord is well visualized centrally, with nerve roots exitingon either side of the cord, extending beyond through the exit foramina.
FIGURE 6-29 Transverse MRI section through the cervical spine demonstrating the facetjoints. The facets are angled posteriorly at this level and gradually assume a more horizontalorientation in the lower cervical spine. The vertebral body and anterior and posteriorlongitudinal ligaments are collectively referred to as the anterior complex in sonography asthey are not separately distinguishable.
293

FIGURE 6-30 Paramedian sagittal MRI of the cervical spine demonstrating the almostvertical oblique course of the cervical nerve roots of C4 and C5 as they plunge toward theinterscalene groove. The large overlying sternocleidomastoid muscle is demonstrated.
FIGURE 6-31 Paramedian sagittal MRI section of the cervical spine demonstrates the C5nerve root beyond the exit foramen. It runs between the transverse processes of C4 and C5 enroute to the interscalene groove (between the anterior and middle scalene muscles).
294
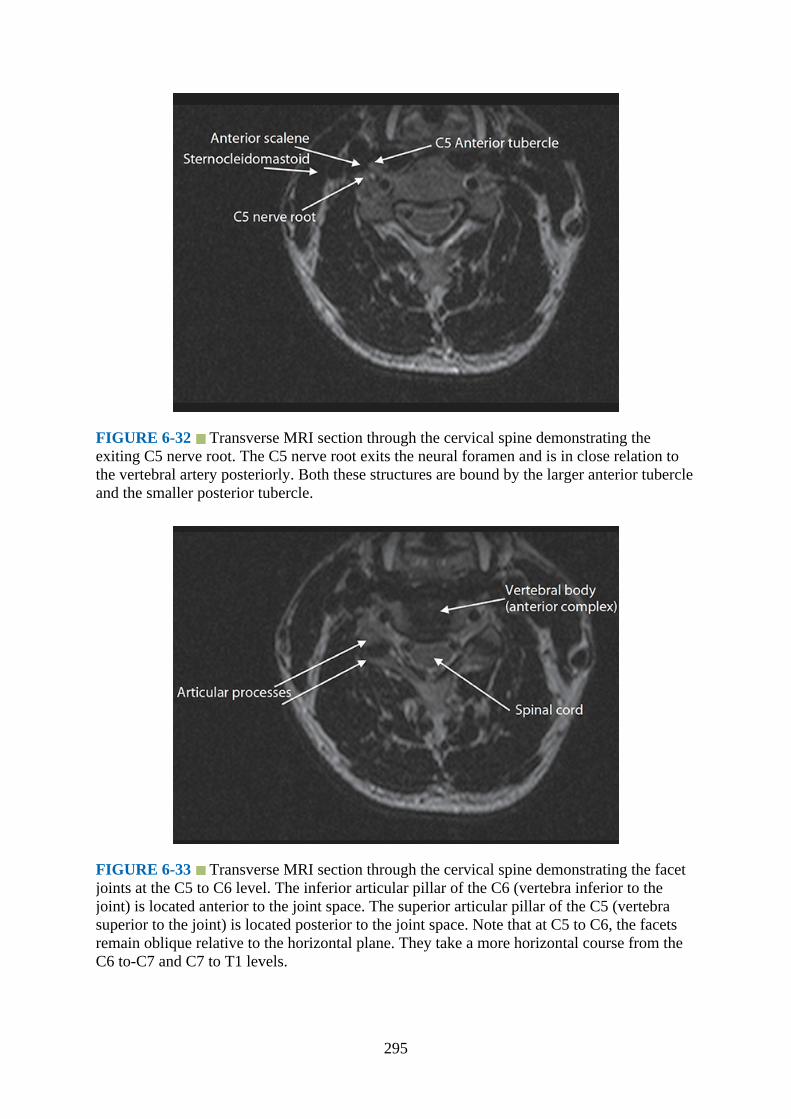
FIGURE 6-32 Transverse MRI section through the cervical spine demonstrating theexiting C5 nerve root. The C5 nerve root exits the neural foramen and is in close relation tothe vertebral artery posteriorly. Both these structures are bound by the larger anterior tubercleand the smaller posterior tubercle.
FIGURE 6-33 Transverse MRI section through the cervical spine demonstrating the facetjoints at the C5 to C6 level. The inferior articular pillar of the C6 (vertebra inferior to thejoint) is located anterior to the joint space. The superior articular pillar of the C5 (vertebrasuperior to the joint) is located posterior to the joint space. Note that at C5 to C6, the facetsremain oblique relative to the horizontal plane. They take a more horizontal course from theC6 to-C7 and C7 to T1 levels.
295

FIGURE 6-34 Transverse MRI section through the cervical spine demonstrating theprominent anterior tubercle of C6 (Chassaignac’s tubercle). This is a sonoanatomicallandmark to identify C6 and the exiting C6 nerve root immediately posterior to the tubercle.The longus colli muscle lies anteromedial to the Chassaignac tubercle in close relationshipwith the carotid artery on its lateral aspect.
FIGURE 6-35 Transverse MRI section through the cervical spine demonstrating the C6 toC7 facet joints. In comparison with the C5 to C6 level, the facets are orientated in a morehorizontal plane.
296
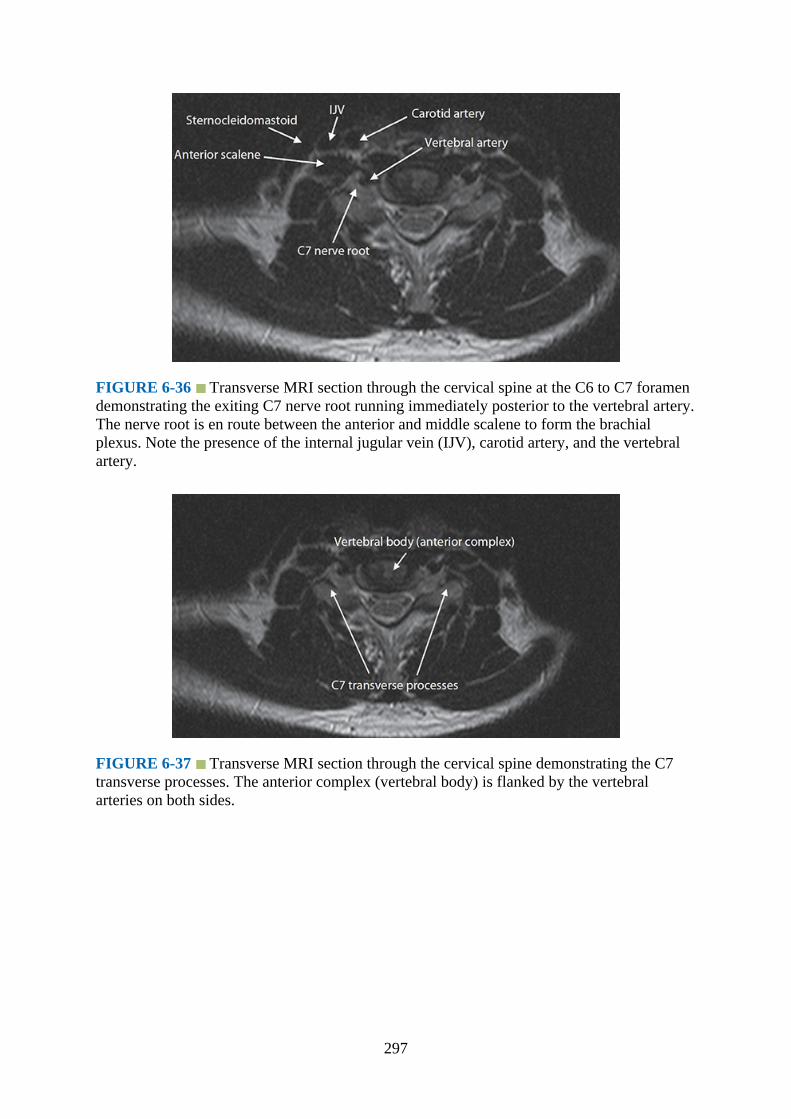
FIGURE 6-36 Transverse MRI section through the cervical spine at the C6 to C7 foramendemonstrating the exiting C7 nerve root running immediately posterior to the vertebral artery.The nerve root is en route between the anterior and middle scalene to form the brachialplexus. Note the presence of the internal jugular vein (IJV), carotid artery, and the vertebralartery.
FIGURE 6-37 Transverse MRI section through the cervical spine demonstrating the C7transverse processes. The anterior complex (vertebral body) is flanked by the vertebralarteries on both sides.
297
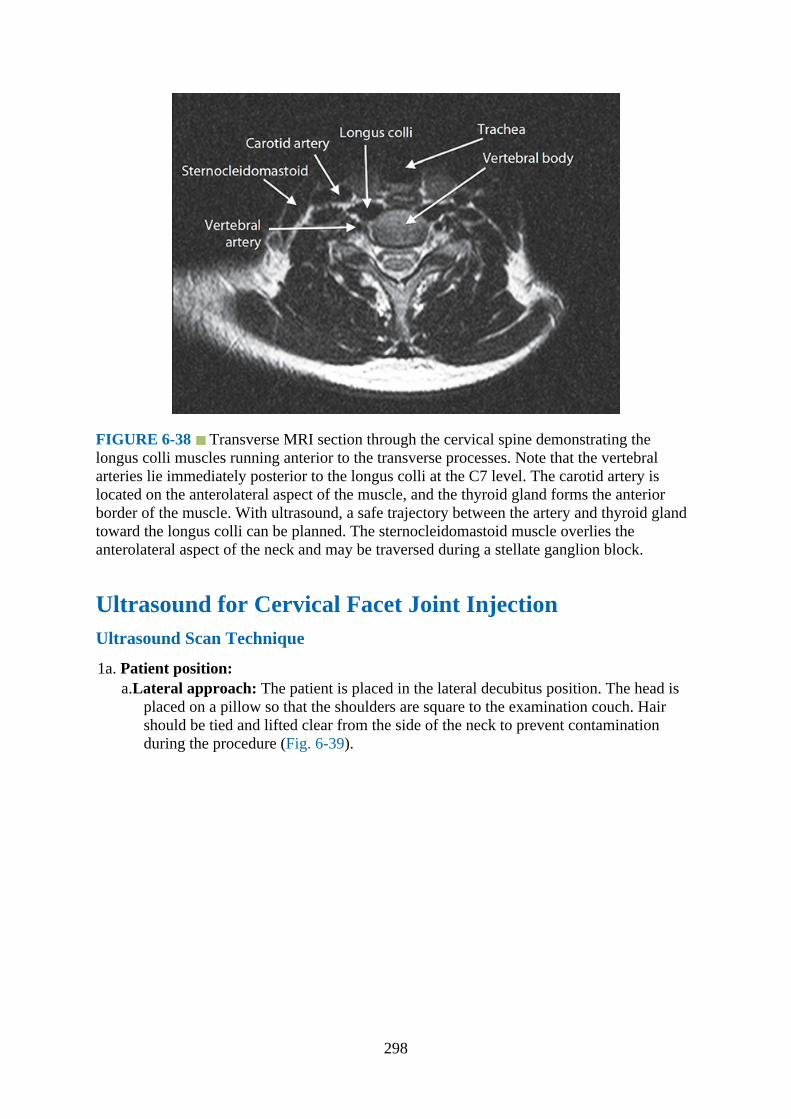
FIGURE 6-38 Transverse MRI section through the cervical spine demonstrating thelongus colli muscles running anterior to the transverse processes. Note that the vertebralarteries lie immediately posterior to the longus colli at the C7 level. The carotid artery islocated on the anterolateral aspect of the muscle, and the thyroid gland forms the anteriorborder of the muscle. With ultrasound, a safe trajectory between the artery and thyroid glandtoward the longus colli can be planned. The sternocleidomastoid muscle overlies theanterolateral aspect of the neck and may be traversed during a stellate ganglion block.
Ultrasound for Cervical Facet Joint InjectionUltrasound Scan Technique
1a. Patient position:a.Lateral approach: The patient is placed in the lateral decubitus position. The head is
placed on a pillow so that the shoulders are square to the examination couch. Hairshould be tied and lifted clear from the side of the neck to prevent contaminationduring the procedure (Fig. 6-39).
298
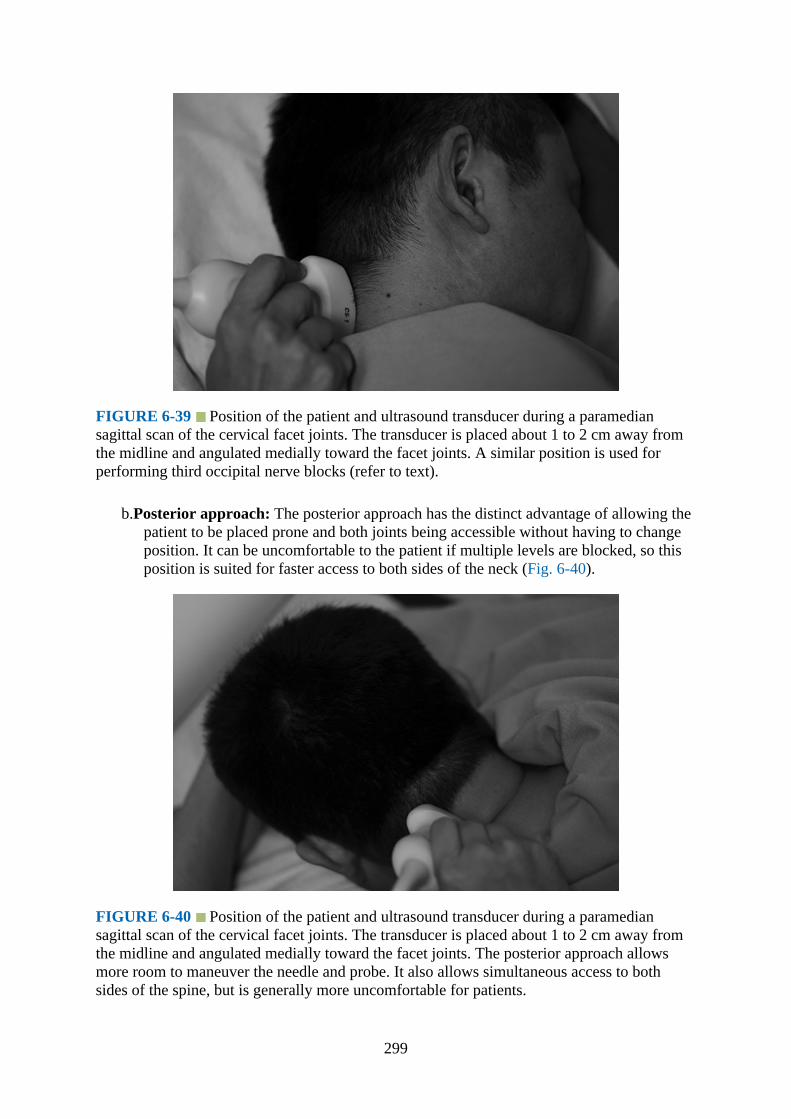
FIGURE 6-39 Position of the patient and ultrasound transducer during a paramediansagittal scan of the cervical facet joints. The transducer is placed about 1 to 2 cm away fromthe midline and angulated medially toward the facet joints. A similar position is used forperforming third occipital nerve blocks (refer to text).
b.Posterior approach: The posterior approach has the distinct advantage of allowing thepatient to be placed prone and both joints being accessible without having to changeposition. It can be uncomfortable to the patient if multiple levels are blocked, so thisposition is suited for faster access to both sides of the neck (Fig. 6-40).
FIGURE 6-40 Position of the patient and ultrasound transducer during a paramediansagittal scan of the cervical facet joints. The transducer is placed about 1 to 2 cm away fromthe midline and angulated medially toward the facet joints. The posterior approach allowsmore room to maneuver the needle and probe. It also allows simultaneous access to bothsides of the spine, but is generally more uncomfortable for patients.
299

1b. Position of operator and ultrasound machine:The operator sits or stands facing the patient’s back in the lateral position or on the side ofthe patient for the posterior approach. It is more comfortable for the operator if thenondominant hand anchors the transducer and the dominant hand manipulates the needle.
2.Transducer selection:Due to the density of muscular structures around the cervical spine, a curvilinear probe(5–2 MHz) is used for imaging and blocks in the cervical spine (facet blocks and occipitalnerve blocks). The in-plane resolution of the images is reduced compared with a linearprobe, but this is often necessary due to the depth of the facet joints in relation to the skin.The probe footprint is often large, and maneuvering the transducer into the correctposition requires practice. Although visualization of small (2 mm and below) structures iscompromised by using a curvilinear probe traditionally, processing techniques such asspatial compound imaging and tissue harmonic imaging on new ultrasound machinesenable us to examine tissues at those depths with reasonable clarity. Beam steeringtechnology (which is an offshoot of compound imaging) enhances needle visualization,and color B-mode imaging (such as indigo or sepia hue) aids the human eye for imagevisualization when image contrast is poor.
3.Scanning technique for facet joint blocks:A sagittal plane scan is performed in the midline, using the spinous processes to identifythe level to inject. Align the transducer in a craniocaudal direction with respect to thecervical spine, starting at the occiput and sliding inferiorly. C1 has a very small or absentspinous process (Figs. 6-41 and 6-42), and the first bifid spinous process will be C2. Thetransducer can be slid inferiorly until the desired level for the injection is reached. Havingidentified the level, the transducer should be shifted slightly laterally along the lamina byabout 1 to 2 cm from the midline. From there, a slight lateral shift of the transducer willreveal facet joints, which appear with a characteristic “saw sign.” The probe may have tobe angled medially to produce a slightly paramedian sagittal oblique image. The needle isinserted in a posterior-to-anterior plane and followed in real time (Fig. 6-43).1
FIGURE 6-43 Paramedian sagittal sonogram of the cervical spine lateral to the laminaedemonstrating the overlying echogenic “hills” of the facet joints.
300

FIGURE 6-41 Median sagittal sonogram of the cervical spine. The broad echogenic baseof the occiput is immediately followed by the recessed spinous process of C1. The C2spinous process is larger and appears as a step superficially relative to the C1 vertebra.
FIGURE 6-42. Coned (zoomed) sagittal view of the cervical spine. The occiput and C1articulation is clearly demonstrated.
4.Sonoanatomy of the facet joint:On ultrasound, cervical segments can be identified with respect to the occiput by countingthe echogenic points, which represent the spinous processes. The first echogenic pointlocated inferior to the occiput is the C1 cervical vertebra. The C2 vertebra is locatedimmediately inferior to that and has a characteristic bifid appearance. This presents as two
301
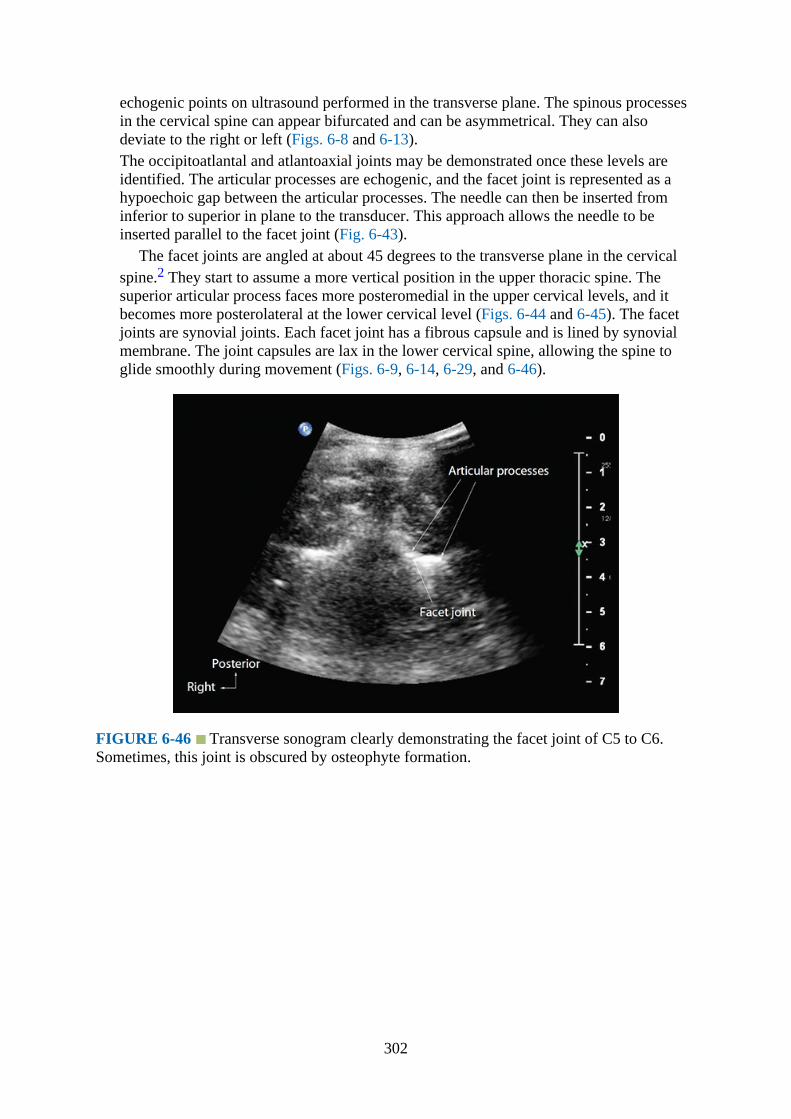
echogenic points on ultrasound performed in the transverse plane. The spinous processesin the cervical spine can appear bifurcated and can be asymmetrical. They can alsodeviate to the right or left (Figs. 6-8 and 6-13).The occipitoatlantal and atlantoaxial joints may be demonstrated once these levels areidentified. The articular processes are echogenic, and the facet joint is represented as ahypoechoic gap between the articular processes. The needle can then be inserted frominferior to superior in plane to the transducer. This approach allows the needle to beinserted parallel to the facet joint (Fig. 6-43).
The facet joints are angled at about 45 degrees to the transverse plane in the cervicalspine.2 They start to assume a more vertical position in the upper thoracic spine. Thesuperior articular process faces more posteromedial in the upper cervical levels, and itbecomes more posterolateral at the lower cervical level (Figs. 6-44 and 6-45). The facetjoints are synovial joints. Each facet joint has a fibrous capsule and is lined by synovialmembrane. The joint capsules are lax in the lower cervical spine, allowing the spine toglide smoothly during movement (Figs. 6-9, 6-14, 6-29, and 6-46).
FIGURE 6-46 Transverse sonogram clearly demonstrating the facet joint of C5 to C6.Sometimes, this joint is obscured by osteophyte formation.
302
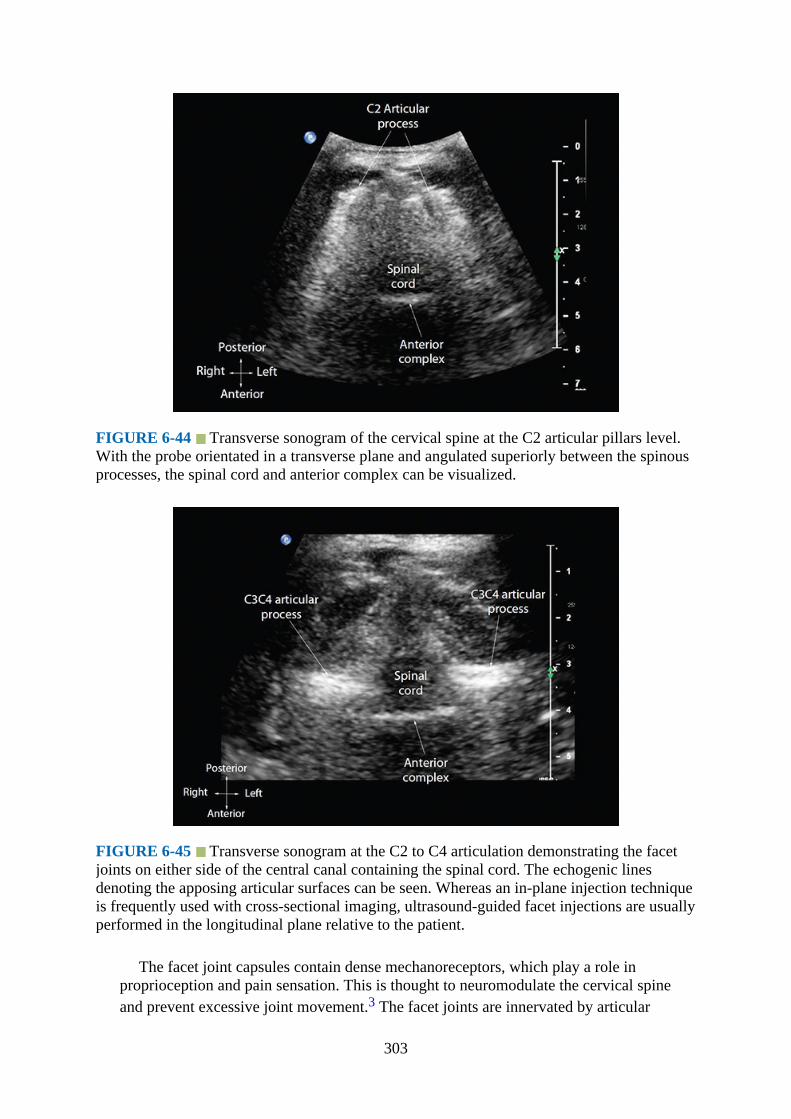
FIGURE 6-44 Transverse sonogram of the cervical spine at the C2 articular pillars level.With the probe orientated in a transverse plane and angulated superiorly between the spinousprocesses, the spinal cord and anterior complex can be visualized.
FIGURE 6-45 Transverse sonogram at the C2 to C4 articulation demonstrating the facetjoints on either side of the central canal containing the spinal cord. The echogenic linesdenoting the apposing articular surfaces can be seen. Whereas an in-plane injection techniqueis frequently used with cross-sectional imaging, ultrasound-guided facet injections are usuallyperformed in the longitudinal plane relative to the patient.
The facet joint capsules contain dense mechanoreceptors, which play a role inproprioception and pain sensation. This is thought to neuromodulate the cervical spineand prevent excessive joint movement.3 The facet joints are innervated by articular
303
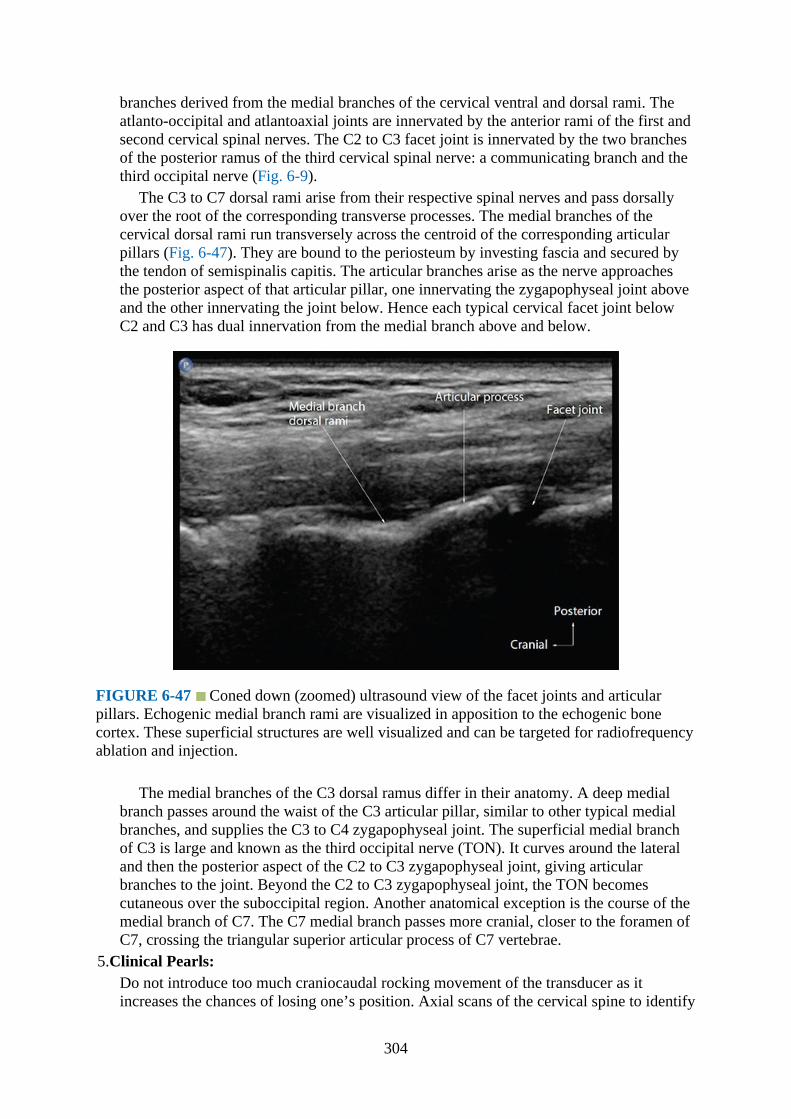
branches derived from the medial branches of the cervical ventral and dorsal rami. Theatlanto-occipital and atlantoaxial joints are innervated by the anterior rami of the first andsecond cervical spinal nerves. The C2 to C3 facet joint is innervated by the two branchesof the posterior ramus of the third cervical spinal nerve: a communicating branch and thethird occipital nerve (Fig. 6-9).
The C3 to C7 dorsal rami arise from their respective spinal nerves and pass dorsallyover the root of the corresponding transverse processes. The medial branches of thecervical dorsal rami run transversely across the centroid of the corresponding articularpillars (Fig. 6-47). They are bound to the periosteum by investing fascia and secured bythe tendon of semispinalis capitis. The articular branches arise as the nerve approachesthe posterior aspect of that articular pillar, one innervating the zygapophyseal joint aboveand the other innervating the joint below. Hence each typical cervical facet joint belowC2 and C3 has dual innervation from the medial branch above and below.
FIGURE 6-47 Coned down (zoomed) ultrasound view of the facet joints and articularpillars. Echogenic medial branch rami are visualized in apposition to the echogenic bonecortex. These superficial structures are well visualized and can be targeted for radiofrequencyablation and injection.
The medial branches of the C3 dorsal ramus differ in their anatomy. A deep medialbranch passes around the waist of the C3 articular pillar, similar to other typical medialbranches, and supplies the C3 to C4 zygapophyseal joint. The superficial medial branchof C3 is large and known as the third occipital nerve (TON). It curves around the lateraland then the posterior aspect of the C2 to C3 zygapophyseal joint, giving articularbranches to the joint. Beyond the C2 to C3 zygapophyseal joint, the TON becomescutaneous over the suboccipital region. Another anatomical exception is the course of themedial branch of C7. The C7 medial branch passes more cranial, closer to the foramen ofC7, crossing the triangular superior articular process of C7 vertebrae.
5.Clinical Pearls:Do not introduce too much craniocaudal rocking movement of the transducer as itincreases the chances of losing one’s position. Axial scans of the cervical spine to identify
304

the facet joints are usually not practiced routinely. The reason is that rotating thetransducer to produce an axial image increases the chances of losing one’s position alongthe cervical vertebrae, requiring a recount. Furthermore, visualization of the facet joint inthe axial plane does not facilitate needle positioning, as the sonographic technique uses acraniocaudal approach (as opposed to a lateral-to-median approach).
The skin entry point of the needle is usually about 2 to 3 cm inferior to the end of theprobe, rather than at the probe itself. This allows the needle to enter at a shallower angleand to be inserted parallel to the facet joint. Confirmation of injectate can be done bywatching out for a hyperechoic flush (representing a small pocket of air trapped withinthe needle). However, once the air has been expelled, it can be difficult to visualize theinjectate. Turning on the Color Doppler function on the ultrasound machine allows flowto be visualized, and injection can be done under continuous Doppler monitoring.
Ultrasound for Third Occipital Nerve BlockGross Anatomy of the Third Occipital Nerve
As described in the facet joint section, the joints are innervated by articular branches derivedfrom medial branches of the cervical dorsal rami. The C3 to C7 dorsal rami arise from thecorresponding spinal nerves and travel dorsally over the transverse processes posteriorly.Now, the C3 medial branches have a different anatomy. A deep medial branch passes aroundthe waist of the C3 articular pillar to supply the C3 to C4 facet (similar to the other levelscaudally). The superficial medial branch of C3 (the TON) curves laterally and around theposterior aspect of the C2 to C3 facet. It supplies branches to the joint prior to travelingdorsal to the semispinalis obliquus capitis muscle. So, each facet joint is innervated by themedial branch at the levels inferior and superior to it (dual innervation), with the exception ofC2 to C3, which is innervated by a single nerve (TON). The TON is the only nerve thatcrosses over the facet joint. The TON measures about 2 mm in diameter (range of 1–3 mm)and is located about 2 cm (range 1.4–2.7 cm) from the skin.
Ultrasound Scan Technique
1.Position:a.Patient: The patient is placed in the lateral decubitus position, similar to a lateral facet
injection position (Fig. 6-39). The head is placed on a pillow so that the shoulders aresquare to the examination couch. Hair should be tied and lifted clear from the side ofthe neck to prevent contamination during the procedure.
305

FIGURE 6-48 Position of the patient and ultrasound transducer during a scan for selectivenerve root injection. The high-frequency linear array transducer is placed in a transverseoblique plane with respect to the long axis of the cervical spine, allowing visualization of thenerve root.
b.Operator and ultrasound machine: The operator sits or stands facing the patient’sback in the lateral position. It is more comfortable for the operator if the nondominanthand anchors the transducer and the dominant hand manipulates the needle.
2.Transducer selection:A high-frequency (15–12 MHz) linear transducer is generally used. This allowsvisualization of the greater occipital nerve at the level of the obliquus capitis inferiormuscle. Imaging techniques like beam steering technology and compound and harmonicimaging are available on most new ultrasound machines. These generally improvevisualization of the anatomy and the needle. A lower-frequency curvilinear transducer (3–5 MHz) can be used in obese patients, but nerve visualization will be more difficultcompared with the linear transducer. The footprint of the curvilinear transducer is alsobigger than the linear transducer. Circumstances will usually dictate the appropriatetransducer to use.
3.Scanning technique and sonoanatomy:Starting in the midline of the posterior spine, the probe can be slid anteriorly and laterallyto the level of the mastoid process. This will allow identification of the occipital bone andthe C1 and C2 transverse processes. Turning on the Color Doppler function at this level isuseful to identify aberrant branches of the vertebral artery. The probe can be slidinferiorly and posteriorly, and the articular pillars of C2 and C3 will come into view. TheTON runs perpendicular to the probe at this point and is located dorsal to the C2 to C3articulation. Sonographically, the fibrillar ovoid nerve can be seen overlying the C2 to C3facet joint. The TON crosses the C2 to C3 articular pillars about 1 mm from the bone, andthe operator can identify the typical fibrillar pattern of the nerve on ultrasound by anglingthe probe slightly back and forth. The facets can also be confirmed by visualizing theechogenic “hills” representing the facet joints caudally. The medial branch nerves arelocated in the troughs or valleys of these echogenic “hills”4 (Figs. 6-43 and 6-47).Another technique to detect the TON involves placing the transducer in an oblique
306

transverse orientation, with the cranial end of the transducer anchored to the occipitalbone. The caudal end of the transducer can then be tilted inferiorly (keeping the cranialend anchored to the mastoid), until the semispinalis obliquus capitis muscle comes intoview in the longitudinal plane. The third occipital nerve can be seen as an ovoid fibrillarstructure overlying the muscle. This corresponds to the traditional suboccipital landmarkused in palpation-based injection techniques.
4.Clinical Pearls:The ultrasound technique is a modification of the blind palpation technique. The nerve isblocked at a more proximal level, prior to branching of the nerve, increasing the treatedarea. Using Doppler prior to injection is important to identify aberrant vessels in thesuboccipital area.
Ultrasound for Selective Nerve Root BlockUltrasound Scan Technique
1.Position:a.Patient:i.Lateral approach: The patient is placed in the lateral decubitus position (Fig. 6-48).
The head is placed on a pillow so that the shoulders are square to the examinationcouch. Hair should be tied and lifted clear from the side of the neck to preventcontamination during the procedure.
ii.Posterior approach: The posterior approach has the distinct advantage of allowing thepatient to be placed prone and both sides being accessible without having to changeposition. It can be uncomfortable to the patient if multiple levels are blocked, so thisposition is suited for faster access to both sides of the neck.
b.Position of operator and ultrasound machine:The operator sits or stands facing the patient’s back in the lateral position or on theside of the patient for the posterior approach. It is more comfortable for the operator ifthe nondominant hand anchors the transducer and the dominant hand manipulates theneedle.
2.Transducer selection:For selective nerve root blocks, a high-frequency (15–12 MHz) linear array transducercan be used. The linear footprint is smaller than the curvilinear transducer and can beplaced at the base of the neck for the lower cervical nerve roots. Imaging techniques likebeam steering technology and compound and harmonic imaging are generally availableon most new ultrasound machines and improve visualization of the anatomy and theneedle point.
3.Scanning technique:Locating the correct cervical vertebral level has been described in the section on facetjoint injection. This involves identifying the C1 vertebra (with a small or nonexistentspinous process) and the C2 vertebra inferiorly (the first bifid cervical spinous process,Fig. 6-8). The levels are then labeled sequentially from C2 (Fig. 6-41). Another techniqueof identifying the cervical vertebral levels on a lateral image is to count upwards(cephalad direction) from C6. The C6 vertebral anterior tubercle is the largest in thecervical spine (Chassaignac’s tubercle). The transducer is maintained in the same axialorientation and gently moved upwards. The anterior tubercles of the respective cervicalvertebrae are identified and counted. The vertebral artery must be identified at the same
307
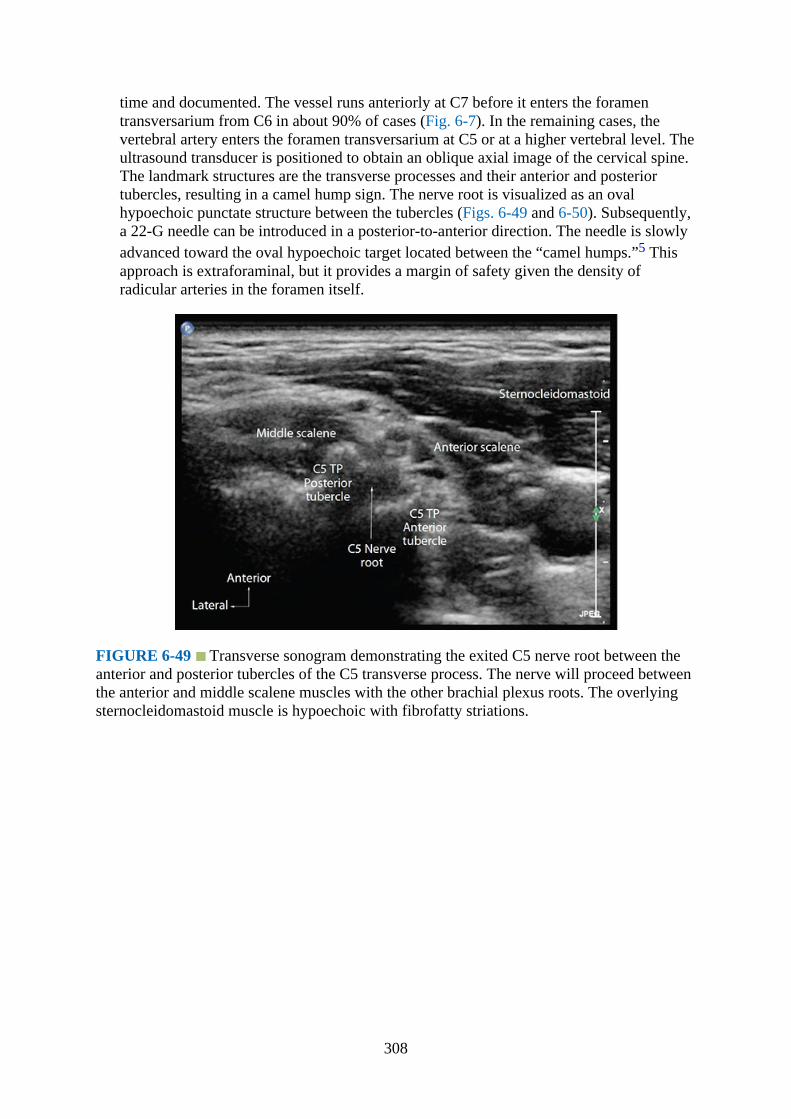
time and documented. The vessel runs anteriorly at C7 before it enters the foramentransversarium from C6 in about 90% of cases (Fig. 6-7). In the remaining cases, thevertebral artery enters the foramen transversarium at C5 or at a higher vertebral level. Theultrasound transducer is positioned to obtain an oblique axial image of the cervical spine.The landmark structures are the transverse processes and their anterior and posteriortubercles, resulting in a camel hump sign. The nerve root is visualized as an ovalhypoechoic punctate structure between the tubercles (Figs. 6-49 and 6-50). Subsequently,a 22-G needle can be introduced in a posterior-to-anterior direction. The needle is slowlyadvanced toward the oval hypoechoic target located between the “camel humps.”5 Thisapproach is extraforaminal, but it provides a margin of safety given the density ofradicular arteries in the foramen itself.
FIGURE 6-49 Transverse sonogram demonstrating the exited C5 nerve root between theanterior and posterior tubercles of the C5 transverse process. The nerve will proceed betweenthe anterior and middle scalene muscles with the other brachial plexus roots. The overlyingsternocleidomastoid muscle is hypoechoic with fibrofatty striations.
308

FIGURE 6-50 Transverse sonogram demonstrating the exited C6 nerve root between theanterior and posterior tubercles. The nerve will proceed between the anterior and middlescalene muscles, with the other brachial plexus roots. The overlying sternocleidomastoidmuscle is hypoechoic, with fibrofatty striations.
The anterior tubercle at C7 is hypoplastic. Hence, there is no bony landmark toindicate the anteriormost extent of the nerve root. More importantly, the vertebral arteryat C7 runs in close proximity to the exited nerve root. It takes a vertical course toward thesubclavian artery, and the C7 nerve root eventually runs laterally as part of the brachialplexus (Fig. 6-51). Due to the inherent risks of cervical spine procedures, monitoring withfluoroscopy is still advisable.6–12
FIGURE 6-51 Transverse sonogram demonstrating the exited C7 nerve root. The anterior
309
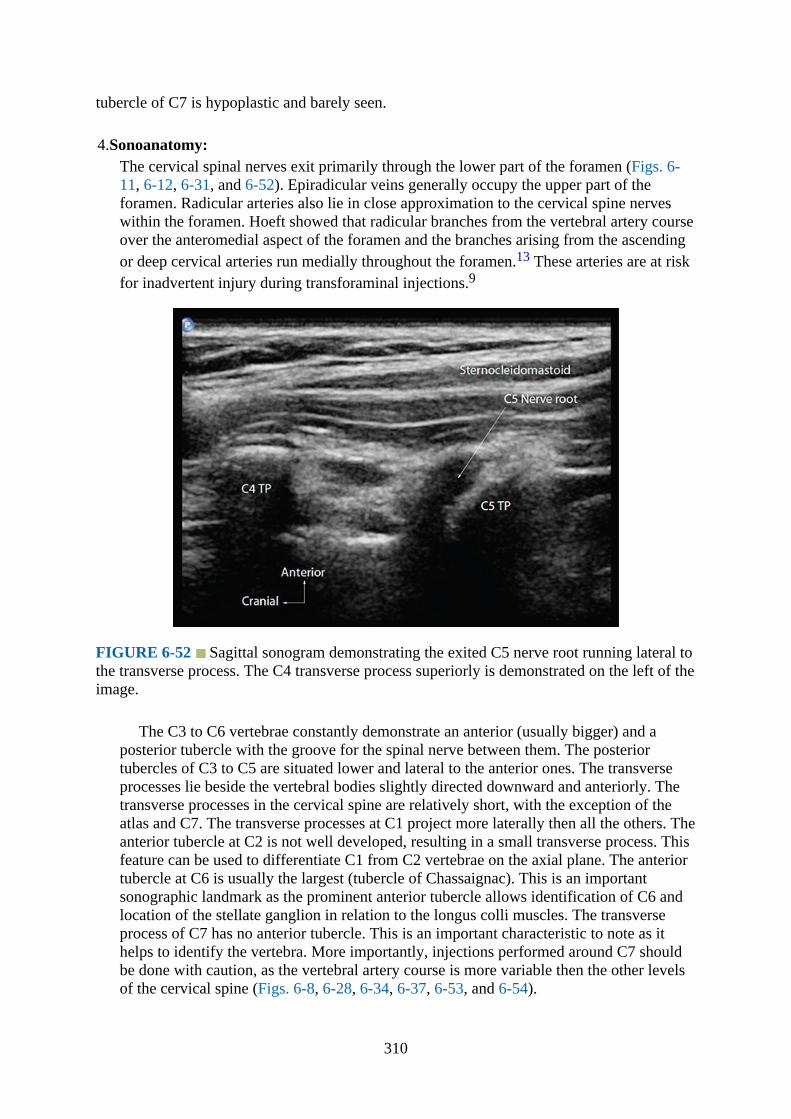
tubercle of C7 is hypoplastic and barely seen.
4.Sonoanatomy:The cervical spinal nerves exit primarily through the lower part of the foramen (Figs. 6-11, 6-12, 6-31, and 6-52). Epiradicular veins generally occupy the upper part of theforamen. Radicular arteries also lie in close approximation to the cervical spine nerveswithin the foramen. Hoeft showed that radicular branches from the vertebral artery courseover the anteromedial aspect of the foramen and the branches arising from the ascendingor deep cervical arteries run medially throughout the foramen.13 These arteries are at riskfor inadvertent injury during transforaminal injections.9
FIGURE 6-52 Sagittal sonogram demonstrating the exited C5 nerve root running lateral tothe transverse process. The C4 transverse process superiorly is demonstrated on the left of theimage.
The C3 to C6 vertebrae constantly demonstrate an anterior (usually bigger) and aposterior tubercle with the groove for the spinal nerve between them. The posteriortubercles of C3 to C5 are situated lower and lateral to the anterior ones. The transverseprocesses lie beside the vertebral bodies slightly directed downward and anteriorly. Thetransverse processes in the cervical spine are relatively short, with the exception of theatlas and C7. The transverse processes at C1 project more laterally then all the others. Theanterior tubercle at C2 is not well developed, resulting in a small transverse process. Thisfeature can be used to differentiate C1 from C2 vertebrae on the axial plane. The anteriortubercle at C6 is usually the largest (tubercle of Chassaignac). This is an importantsonographic landmark as the prominent anterior tubercle allows identification of C6 andlocation of the stellate ganglion in relation to the longus colli muscles. The transverseprocess of C7 has no anterior tubercle. This is an important characteristic to note as ithelps to identify the vertebra. More importantly, injections performed around C7 shouldbe done with caution, as the vertebral artery course is more variable then the other levelsof the cervical spine (Figs. 6-8, 6-28, 6-34, 6-37, 6-53, and 6-54).
310

FIGURE 6-53 Transverse cadaver anatomic section through the cervical spinedemonstrating the prominent anterior tubercle of C6 (Chassaignac’s tubercle). This is asonoanatomical landmark to identify C6 and the exiting C6 nerve root immediately posteriorto the tubercle. The longus colli muscle lies anteromedial to the Chassaignac tubercle.
FIGURE 6-54 Anterior sagittal sonogram of the cervical spine at the tips of the transverseprocesses. The nerve is a hypoechoic structure located between the transverse processes. Alinear tubular structure located deep to the nerve with echogenic walls is the vertebral artery.It can be confirmed using Color Doppler.
Cervical ribs of various lengths and size may also occur and are usually bilateral whenpresent. They can indent or impinge on the brachial plexus nerve roots. The foramentransversarium at C1 to C7 contain vertebral arteries and sympathetic nervous plexus
311

from C6 upwards. Intervertebral foramina are largest at C2 and C3 (Figs. 6-55 and 6-56).
FIGURE 6-55 Sagittal cadaver anatomic section of the cervical spine showing thevertebral artery immediately posterior to the transverse processes of C4 and C5. The relativepositions of the vertebral bodies and cervical spinal cord are also demonstrated. The largebelly of the sternocleidomastoid muscle is located anteriorly.
FIGURE 6-56 Anterior sagittal sonogram of the cervical spine at the level of the C4 andC5 transverse processes demonstrating the hypoechoic nerve roots. The vertebral arterieswithin the foramen transversarium are well demonstrated with Color Doppler mode.
5.Clinical Pearls:
312
Although ultrasound guidance is useful in identification of the vertebral and inferiorthyroid arteries, spinal radicular arteries are often too small in caliber to visualizeconsistently with ultrasound. Hence, using a smaller volume of injectate and continuoussonographic and Doppler monitoring are suggested. Epidural extension of the injectatethrough a transforaminal approach can result in a wider area of pain relief.
Ultrasound for Stellate Ganglion (Cervical SympatheticChain) BlockGross Anatomy
The cervical sympathetic chain is composed of the superior, middle, intermediate, andinferior cervical ganglia. In 80% of cases, the inferior cervical ganglion is fused with the firstthoracic ganglion, forming the stellate (cervicothoracic) ganglion. It measures approximately2.5 cm in length, 1 cm in width, and 0.5 cm in anteroposterior depth. The ganglion is usuallyfound between the inferior border of the C7 transverse process to T1 (especially if the lowercervical and upper thoracic ganglia remained separate) or adjacent to the pleural dome. It iscontained within the fascial plane of the prevertebral fascia, overlying the longus collimuscles, on either side of the cervical vertebrae. The postganglionic fibers from the stellateganglion and seventh and eighth cervical nerves to the first thoracic nerve providesympathetic innervation to the upper limbs. The preganglionic fibers travel in a cephaladdirection to the superior and middle cervical ganglia through the cervical sympathetic trunk.Hence, injection of local anesthetic at the level of the stellate ganglion blocks the sympatheticsupply to a larger area (the head, neck, and upper limbs) than injection of the cervicalsympathetic trunk (which results in sympathetic blockade of the head and neck regions only).
The vertebral artery is relatively free floating at the C7 level prior to entering the foramentransversarium at C6 as it ascends the neck. This is true in about 90% of cases. It can enterthe foramen transversarium at C5 or higher instead in the remaining 10% of cases and isvulnerable to injury.14 The inferior thyroid artery is also exposed at the base of the neck. Itarises from the thyrocervical trunk of the subclavian artery (running anterior to the vertebralartery and the longus colli muscle) and has a tortuous and variable course.15 These vascularstructures can be visualized with Color Doppler and avoided during ultrasound-guidedinjections.
Ultrasound Scan Technique
1.Position:a.Patient: The patient is placed in a supine position, with the neck slightly extended (Fig.
6-57). A high-resolution linear transducer (17–9 MHz) is placed slightly lateral to themidline at the base of the neck.16
313
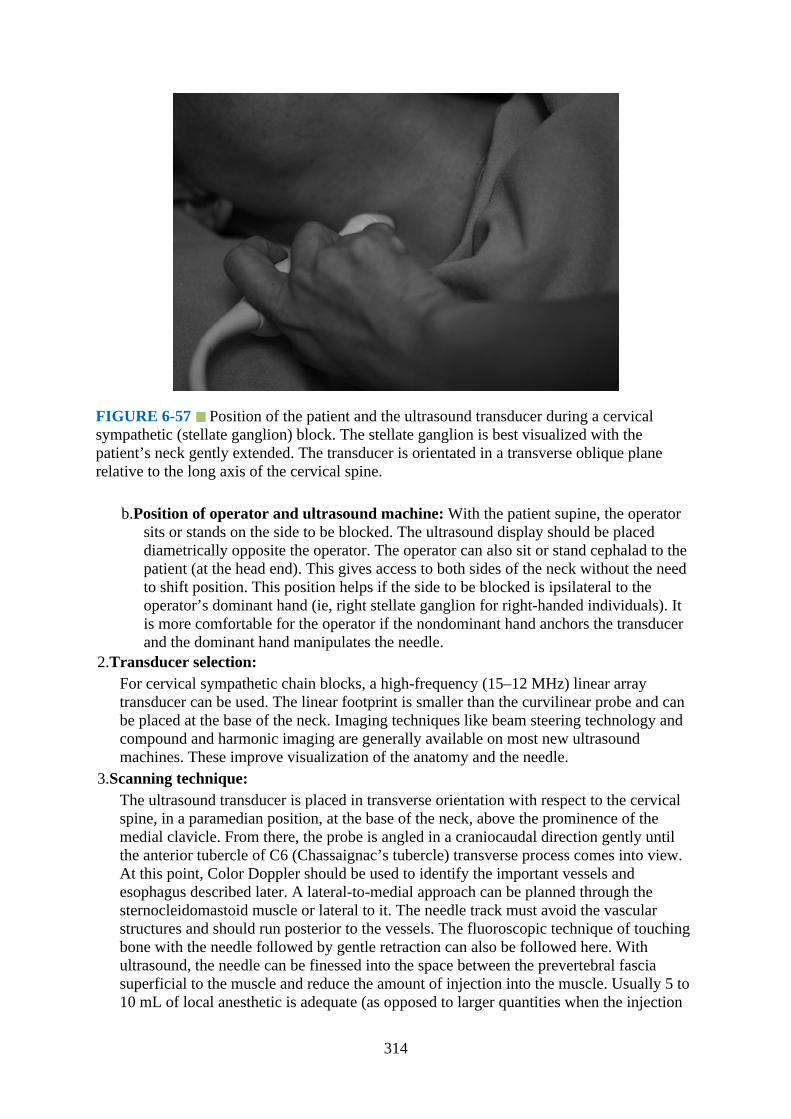
FIGURE 6-57 Position of the patient and the ultrasound transducer during a cervicalsympathetic (stellate ganglion) block. The stellate ganglion is best visualized with thepatient’s neck gently extended. The transducer is orientated in a transverse oblique planerelative to the long axis of the cervical spine.
b.Position of operator and ultrasound machine: With the patient supine, the operatorsits or stands on the side to be blocked. The ultrasound display should be placeddiametrically opposite the operator. The operator can also sit or stand cephalad to thepatient (at the head end). This gives access to both sides of the neck without the needto shift position. This position helps if the side to be blocked is ipsilateral to theoperator’s dominant hand (ie, right stellate ganglion for right-handed individuals). Itis more comfortable for the operator if the nondominant hand anchors the transducerand the dominant hand manipulates the needle.
2.Transducer selection:For cervical sympathetic chain blocks, a high-frequency (15–12 MHz) linear arraytransducer can be used. The linear footprint is smaller than the curvilinear probe and canbe placed at the base of the neck. Imaging techniques like beam steering technology andcompound and harmonic imaging are generally available on most new ultrasoundmachines. These improve visualization of the anatomy and the needle.
3.Scanning technique:The ultrasound transducer is placed in transverse orientation with respect to the cervicalspine, in a paramedian position, at the base of the neck, above the prominence of themedial clavicle. From there, the probe is angled in a craniocaudal direction gently untilthe anterior tubercle of C6 (Chassaignac’s tubercle) transverse process comes into view.At this point, Color Doppler should be used to identify the important vessels andesophagus described later. A lateral-to-medial approach can be planned through thesternocleidomastoid muscle or lateral to it. The needle track must avoid the vascularstructures and should run posterior to the vessels. The fluoroscopic technique of touchingbone with the needle followed by gentle retraction can also be followed here. Withultrasound, the needle can be finessed into the space between the prevertebral fasciasuperficial to the muscle and reduce the amount of injection into the muscle. Usually 5 to10 mL of local anesthetic is adequate (as opposed to larger quantities when the injection
314
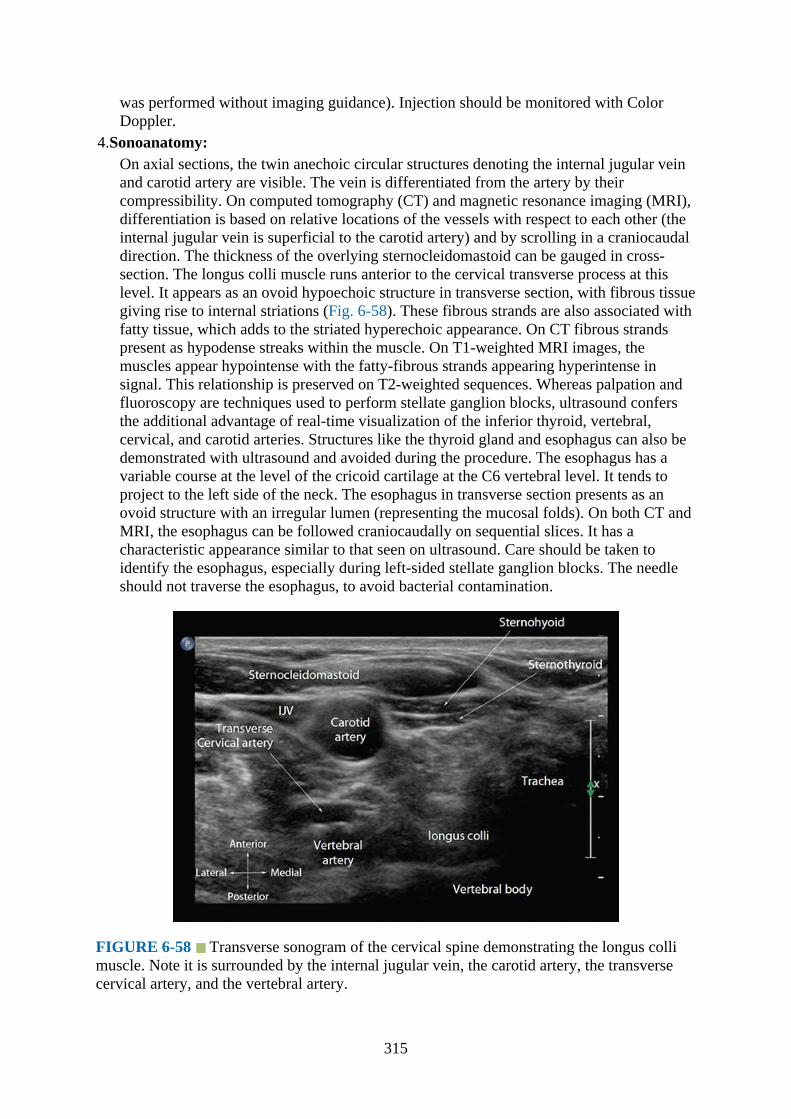
was performed without imaging guidance). Injection should be monitored with ColorDoppler.
4.Sonoanatomy:On axial sections, the twin anechoic circular structures denoting the internal jugular veinand carotid artery are visible. The vein is differentiated from the artery by theircompressibility. On computed tomography (CT) and magnetic resonance imaging (MRI),differentiation is based on relative locations of the vessels with respect to each other (theinternal jugular vein is superficial to the carotid artery) and by scrolling in a craniocaudaldirection. The thickness of the overlying sternocleidomastoid can be gauged in cross-section. The longus colli muscle runs anterior to the cervical transverse process at thislevel. It appears as an ovoid hypoechoic structure in transverse section, with fibrous tissuegiving rise to internal striations (Fig. 6-58). These fibrous strands are also associated withfatty tissue, which adds to the striated hyperechoic appearance. On CT fibrous strandspresent as hypodense streaks within the muscle. On T1-weighted MRI images, themuscles appear hypointense with the fatty-fibrous strands appearing hyperintense insignal. This relationship is preserved on T2-weighted sequences. Whereas palpation andfluoroscopy are techniques used to perform stellate ganglion blocks, ultrasound confersthe additional advantage of real-time visualization of the inferior thyroid, vertebral,cervical, and carotid arteries. Structures like the thyroid gland and esophagus can also bedemonstrated with ultrasound and avoided during the procedure. The esophagus has avariable course at the level of the cricoid cartilage at the C6 vertebral level. It tends toproject to the left side of the neck. The esophagus in transverse section presents as anovoid structure with an irregular lumen (representing the mucosal folds). On both CT andMRI, the esophagus can be followed craniocaudally on sequential slices. It has acharacteristic appearance similar to that seen on ultrasound. Care should be taken toidentify the esophagus, especially during left-sided stellate ganglion blocks. The needleshould not traverse the esophagus, to avoid bacterial contamination.
FIGURE 6-58 Transverse sonogram of the cervical spine demonstrating the longus collimuscle. Note it is surrounded by the internal jugular vein, the carotid artery, the transversecervical artery, and the vertebral artery.
315
5.Clinical Pearls:The esophagus can be distinguished from the other structures in the neck by observingperistaltic movements when the patient is asked to swallow. It is important to ensure theinferior (caudal) flow of injectate from C6 to T1 to ensure that the stellate ganglion isappropriately targeted. Recall that the ganglion is usually located at C7 to T1 levels andthat the injection is performed at C6 due to a slightly better safety profile (the vertebralartery is usually contained in the foramen transversarium at this level). If the injectateonly stays at C6, then the middle cervical sympathetic ganglion is treated and not thestellate ganglion. The traditional practice of stellate ganglion block avoided bilateralinjections. The reasons for this included potential for local anesthetic toxicity with the useof high volumes of local anesthetic (and hence higher plasma concentration) and recurrentlaryngeal nerve palsy (up to 10% of cases).17 With real-time ultrasound monitoring, flowof the injectate between the carotid sheath, thyroid, and esophagus may be detected, andneedle positioning can be adjusted if necessary.
References1.Galiano K, Obwegeser AA, Bodner G, et al. Ultrasound-guided facet joint injections in the
middle to lower cervical spine: a CT-controlled sonoanatomic study. Clin J Pain.2006;22:538–543.
2.Pal GP, Routal RV, Saggu SK. The orientation of the articular facets of the zygapophysealjoints at the cervical and upper thoracic region. J Anat. 2001;198:431–441.
3.Lord SM, McDonald GJ, Bogduk N. Percutaneous radiofrequency neurotomy of thecervical medial branches: a validated treatment for cervical zygapophyseal joint pain.Neurosurgery Quaterly. 1998;8:288–308.
4.Eichenberger U, Greher M, Kapral S, et al. Sonographic visualization and ultrasound-guided block of the third occipital nerve: prospective for a new method to diagnose C2-C3 zygapophysial joint pain. Anesthesiology. 2006;104:303–308.
5.Galiano K, Obwegeser AA, Bodner G, et al. Ultrasound-guided periradicular injections inthe middle to lower cervical spine: an imaging study of a new approach. Reg AnesthPain Med. 2005;30:391–396.
6.Narouze SN, Vydyanathan A, Kapural L, Sessler DI, Mekhail N. Ultrasound-guidedcervical selective nerve root block: a fluoroscopy-controlled feasibility study. RegAnesth Pain Med. 2009;34:343–348.
7.Brouwers PJ, Kottink EJ, Simon MA, Prevo RL. A cervical anterior spinal arterysyndrome after diagnostic blockade of the right C6-nerve root. Pain. 2001;91:397–399.
8.Muro K, O’Shaughnessy B, Ganju A. Infarction of the cervical spinal cord followingmultilevel transforaminal epidural steroid injection: case report and review of theliterature. J Spinal Cord Med. 2007;30:385–388.
9.Baker R, Dreyfuss P, Mercer S, Bogduk N. Cervical transforaminal injection ofcorticosteroids into a radicular artery: a possible mechanism for spinal cord injury. Pain.2003;103:211–215.
10.Tiso RL, Cutler T, Catania JA, Whalen K. Adverse central nervous system sequelae afterselective transforaminal block: the role of corticosteroids. Spine J. 2004;4:468–474.
11.Wallace MA, Fukui MB, Williams RL, Ku A, Baghai P. Complications of cervicalselective nerve root blocks performed with fluoroscopic guidance. AJR Am J Roentgenol.2007;188:1218–1221.
12.Narouze SN. Ultrasound-guided interventional procedures in pain management: Evidence-
316
based medicine. Reg Anesth Pain Med. 2010;35:S55–S58.13.Hoeft MA, Rathmell JP, Monsey RD, Fonda BJ. Cervical transforaminal injection and the
radicular artery: variation in anatomical location within the cervical intervertebralforamina. Reg Anesth Pain Med. 2006;31:270–274.
14.Higa K, Hirata K, Hirota K, Nitahara K, Shono S. Retropharyngeal hematoma after stellateganglion block: Analysis of 27 patients reported in the literature. Anesthesiology.2006;105:1238–1245.
15.Narouze S. Beware of the “serpentine” inferior thyroid artery while performing stellateganglion block. Anesth Analg. 2009;109:289–290.
16.Kapral S, Krafft P, Gosch M, Fleischmann D, Weinstabl C. Ultrasound imaging for stellateganglion block: direct visualization of puncture site and local anesthetic spread. A pilotstudy. Reg Anesth. 1995;20:323–328.
17.Hardy PA, Wells JC. Extent of sympathetic blockade after stellate ganglion block withbupivacaine. Pain. 1989;36:193–196.
317
CHAPTER 7
Ultrasound of the Thoracic Spine for Thoracic EpiduralInjections
IntroductionUltrasound imaging of the thoracic spine can be challenging due to peculiarities in itsanatomy. The osseous framework of the thoracic spine makes up for a narrow acousticwindow with limited ultrasound visibility of the spinal canal and neuraxial structures.1,2
Ultrasound visibility of the thoracic spine also varies depending on the plane1 of theultrasound imaging and which part of the thoracic spine is being imaged.1 Ultrasoundvisibility progressively decreases as one moves up the thoracic spine.1 Currently data arelimited on the use of ultrasound to guide or assist thoracic epidural injections.3,4 This chapterbriefly outlines the anatomy, the technique of ultrasound imaging, and sonoanatomy of thethoracic spine relevant for thoracic epidural injection.
Basic Anatomy of the Thoracic SpineThe thoracic spine is made up of a column of 12 vertebrae (Fig. 7-1) that makes up themidsection of the vertebral column. The thoracic vertebrae are identified by the presence ofarticular facets on the lateral surface of the vertebral bodies for articulation with the head ofthe ribs (Figs. 7-1 to 7-4). There are also facets on the transverse processes of all, except the11th and 12th vertebrae, for articulation with the tubercle of the ribs (Fig. 7-1). The thoracicvertebrae are intermediate in size between the cervical and lumbar vertebrae, with the lowerthoracic vertebrae being a lot larger than the upper thoracic vertebrae (Fig. 7-4) and the upperthoracic vertebrae (T1–T2) being similar in size to the cervical vertebrae (Fig. 7-2). Thethoracic spine has a primary curvature, which is concave anteriorly, but also has a lateralcurvature that is slightly concave to the left, most likely from greater use of the right upperextremity and pressure from the aorta.
318
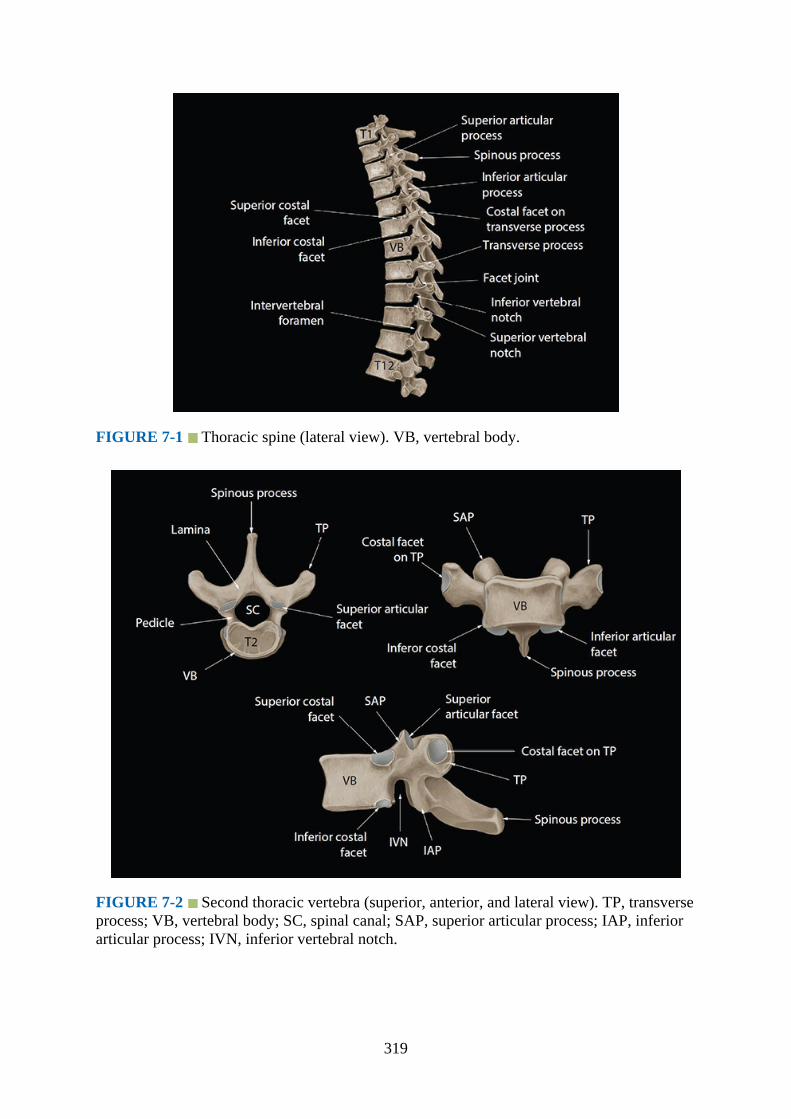
FIGURE 7-1 Thoracic spine (lateral view). VB, vertebral body.
FIGURE 7-2 Second thoracic vertebra (superior, anterior, and lateral view). TP, transverseprocess; VB, vertebral body; SC, spinal canal; SAP, superior articular process; IAP, inferiorarticular process; IVN, inferior vertebral notch.
319

FIGURE 7-3 Sixth thoracic vertebra (superior, anterior, and lateral view). TP, transverseprocess; SVN, superior vertebral notch; SC, spinal canal; SAP, superior articular process;IAP, inferior articular process.
320

FIGURE 7-4 Twelfth thoracic vertebra (superior, anterior, and lateral view). TP,transverse process; SC, spinal canal; SAP, superior articular process; IAP, inferior articularprocess; SVN, superior vertebral notch; VB, vertebral body.
Typical Thoracic Vertebrae
The 2nd to 8th thoracic vertebrae are considered typical thoracic vertebrae (Figs. 7-2 and 7-3), whereas the remaining five vertebrae (1st, 9th, 10th, 11th, and 12th) are atypical as theyhave certain unique features. The body of a typical thoracic vertebra is heart-shaped (Fig. 7-3) with its anteroposterior and lateral diameters being roughly the same (Fig. 7-3). Also thedistance between the two lamina of the vertebra is greater than the width of the vertebralbody (Fig. 7-3).5 On either side of the vertebral body are two costal (superior and inferior)facets (Fig. 7-3). The superior costal facets are larger, located on the superior border of thevertebra near the pedicle, and articulate with the head of the numerically identical rib (Figs.7-2 and 7-3). The inferior costal facets are smaller in size, they are located near the inferiorborder of the vertebra and in front of the inferior vertebral notch, and they articulate with thenext lower rib. The spinal canal is relatively small and circular (Fig. 7-3) and contains thespinal cord and meninges.
The pedicles of the thoracic vertebra are short and directed backwards (Fig. 7-2). Thesuperior vertebral notch is shallow, whereas the inferior vertebral notch is large and deep(Figs. 7-1 and 7-5). The laminae are broad and thick, overlap the one from the adjacentvertebrae (Fig. 7-6), and are connected to the pedicle anteriorly (Fig. 7-5). The interlaminarspaces are also narrow, and using ultrasound they measure approximately 0.9 cm at the lowerthoracic spine to 0.8 cm and 0.6 cm at the mid- and upper thoracic spine, respectively.1 Thetransverse processes are large and are directed laterally and backwards (Figs. 7-3 and 7-6)from the junction of the lamina and pedicle (Fig. 7-5). The costal facets on the anteriorsurface of the transverse process of the upper six vertebrae are concave (Fig. 7-3), facingforward, and articulate with the tubercle of the corresponding rib. The inferior articularprocesses are fused to the laminae, and their articular facets are directed forwards and slightlydownwards and medially (Fig. 7-5). The superior articular processes in contrast project fromthe junction of the pedicle and laminae and are directed backwards and slightly laterally andupwards. The articulation of the rib to the transverse process anteriorly results in the neck ofthe rib being hidden anteriorly by the transverse process at the vertebral levels T1 to T4, butfrom there on until T9 the neck of the rib progressively projects above the transverseprocess.5 The spinous processes are long and directed backwards, downwards (Figs. 7-1, 7-6and 7-7), and often slightly obliquely. Therefore even in a perfectly normal spine, the tips ofthe spinous processes may be slightly deviated from the midline (ie, paramedian in location,Fig. 7-7). The spinous processes are longest between T2 and T9 levels and overlap each otherlike “tiles on a roof.” This creates an acute angle for epidural needle insertion or insonation ofthe ultrasound beam if one were to do so through the midline. The spinous processes are lessoblique above T2 and below T9. The spinous processes of T11 and T12 are directedbackwards as with the lumbar spinous processes. The orientation of the T10 spinous processvaries, with it being only slightly caudally directed to resemble that of the T11 and T12.
321

FIGURE 7-5 Lateral view of the sixth thoracic vertebra. VB, vertebral body; TP,transverse process; IAP, inferior articular process.
FIGURE 7-6 Articulation of the thoracic vertebrae and the rib with the transverse process(costotransverse junction) in the midthoracic region. Note the acute angulation of the spinousprocesses and the posteriorly directed transverse processes.
322

FIGURE 7-7 Different views of the thoracic spine that were rendered from a single 3-Dvolume CT data set. Note that although there is no scoliosis in this patient, the spinousprocesses of the vertebrae are slightly deviated from the midline (Fig. 7-7F).
The ligamentum flavum is attached to the upper border and the upper part of the anteriorsurface of the laminae. The transverse process gives attachment to the following ligaments(Fig. 11-3): (i) lateral costotransverse ligament at the tip, (ii) superior costotransverseligament to the lower border, (iii) the inferior costotransverse ligament to the anterior surface,(iv) intertransverse ligament to the superior and inferior borders, and (v) the levator costae tothe posterior surface (T1–T11). The spinous processes give attachment to the supraspinousand interspinous ligaments. Also the superior and inferior borders of the vertebral bodies giveattachment in front and behind to the anterior and posterior longitudinal ligaments,respectively. There are also several muscles attached to the spine of the thoracic vertebrae,including the latissimus dorsi, trapezius, rhomboids, and many deep muscles of the back.
Gross Anatomy of the Upper Thoracic Spine (T1–T4)
Figs. 7-8 and 7-9
323
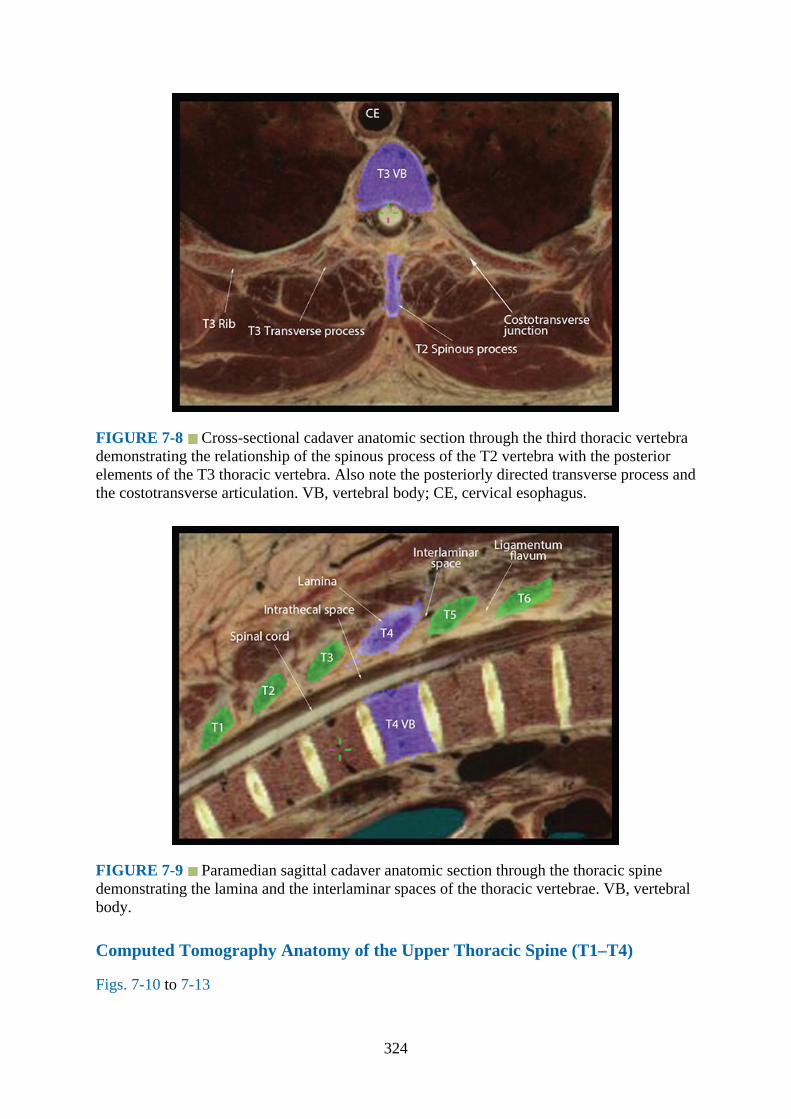
FIGURE 7-8 Cross-sectional cadaver anatomic section through the third thoracic vertebrademonstrating the relationship of the spinous process of the T2 vertebra with the posteriorelements of the T3 thoracic vertebra. Also note the posteriorly directed transverse process andthe costotransverse articulation. VB, vertebral body; CE, cervical esophagus.
FIGURE 7-9 Paramedian sagittal cadaver anatomic section through the thoracic spinedemonstrating the lamina and the interlaminar spaces of the thoracic vertebrae. VB, vertebralbody.
Computed Tomography Anatomy of the Upper Thoracic Spine (T1–T4)
Figs. 7-10 to 7-13
324
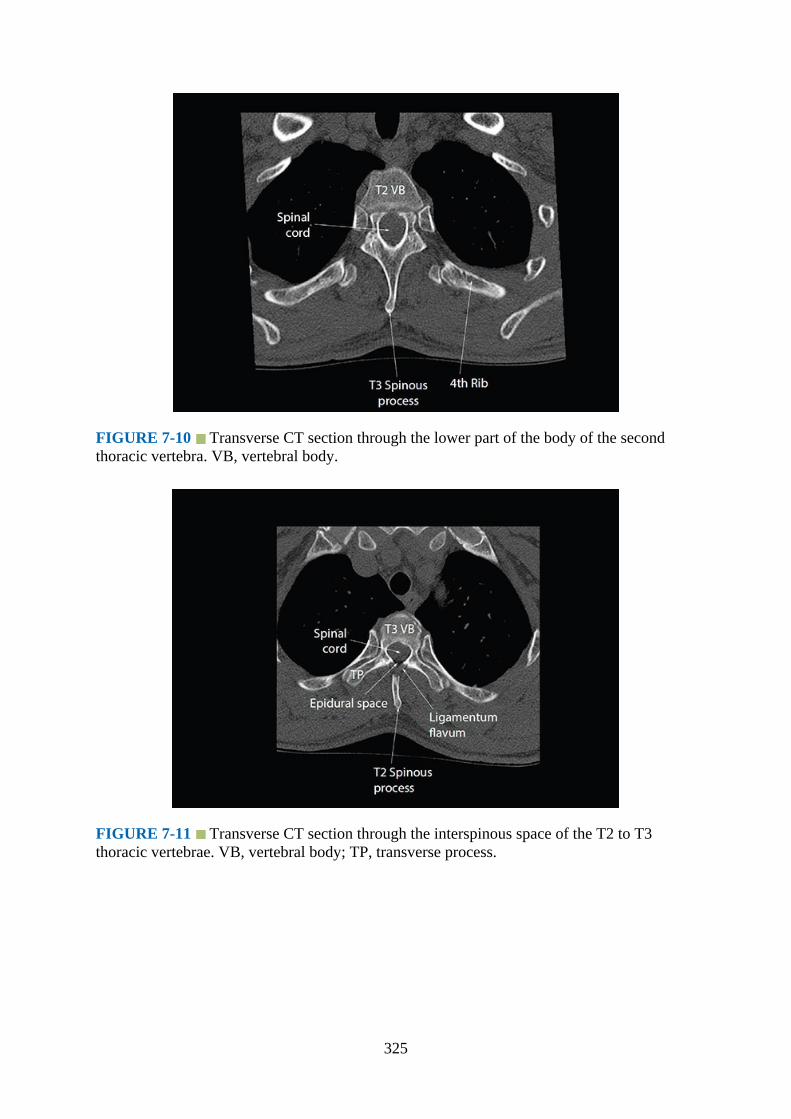
FIGURE 7-10 Transverse CT section through the lower part of the body of the secondthoracic vertebra. VB, vertebral body.
FIGURE 7-11 Transverse CT section through the interspinous space of the T2 to T3thoracic vertebrae. VB, vertebral body; TP, transverse process.
325

FIGURE 7-12 Median sagittal CT section of the upper thoracic spine (T1–T4). VB,vertebral body; ISS, interspinous space.
FIGURE 7-13 Paramedian sagittal CT section of the upper thoracic spine. ILS,interlaminar space; VB, vertebral body.
Magnetic Resonance Imaging Anatomy of the Upper Thoracic Spine (T1–T4)
Figs. 7-14 to 7-17
326
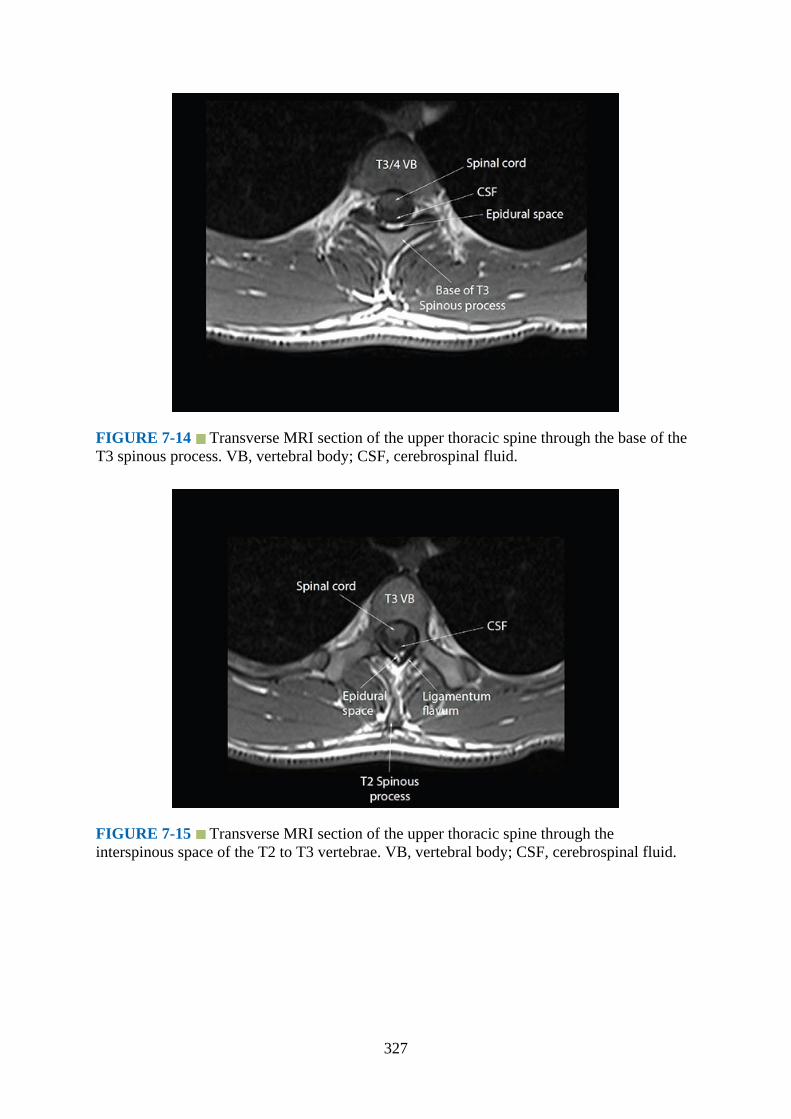
FIGURE 7-14 Transverse MRI section of the upper thoracic spine through the base of theT3 spinous process. VB, vertebral body; CSF, cerebrospinal fluid.
FIGURE 7-15 Transverse MRI section of the upper thoracic spine through theinterspinous space of the T2 to T3 vertebrae. VB, vertebral body; CSF, cerebrospinal fluid.
327

FIGURE 7-16 Median sagittal MRI section of the upper thoracic spine (T1–T4). VB,vertebral body; ISS, interspinous space.
FIGURE 7-17 Paramedian sagittal MRI section of the upper thoracic spine (T1–T4). VB,vertebral body; ILS, interlaminar space.
Gross Anatomy of the Midthoracic Spine (T5–T8)
Figs. 7-18 and 7-19
328
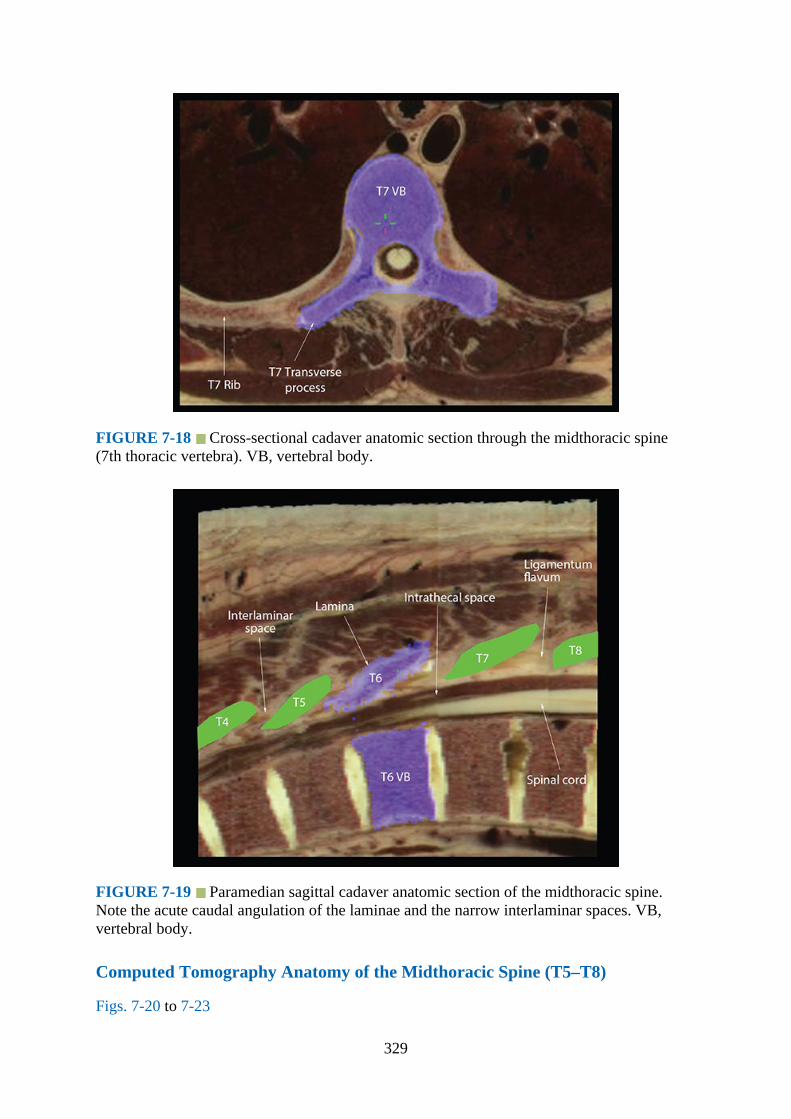
FIGURE 7-18 Cross-sectional cadaver anatomic section through the midthoracic spine(7th thoracic vertebra). VB, vertebral body.
FIGURE 7-19 Paramedian sagittal cadaver anatomic section of the midthoracic spine.Note the acute caudal angulation of the laminae and the narrow interlaminar spaces. VB,vertebral body.
Computed Tomography Anatomy of the Midthoracic Spine (T5–T8)
Figs. 7-20 to 7-23
329
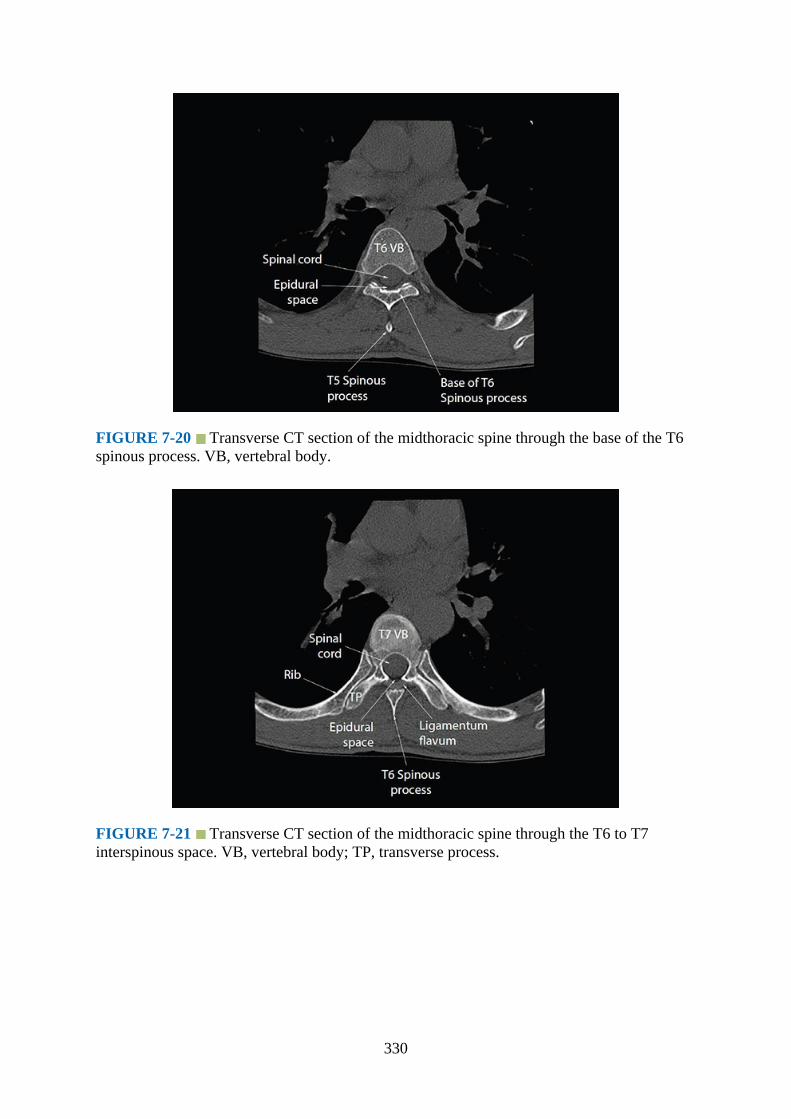
FIGURE 7-20 Transverse CT section of the midthoracic spine through the base of the T6spinous process. VB, vertebral body.
FIGURE 7-21 Transverse CT section of the midthoracic spine through the T6 to T7interspinous space. VB, vertebral body; TP, transverse process.
330
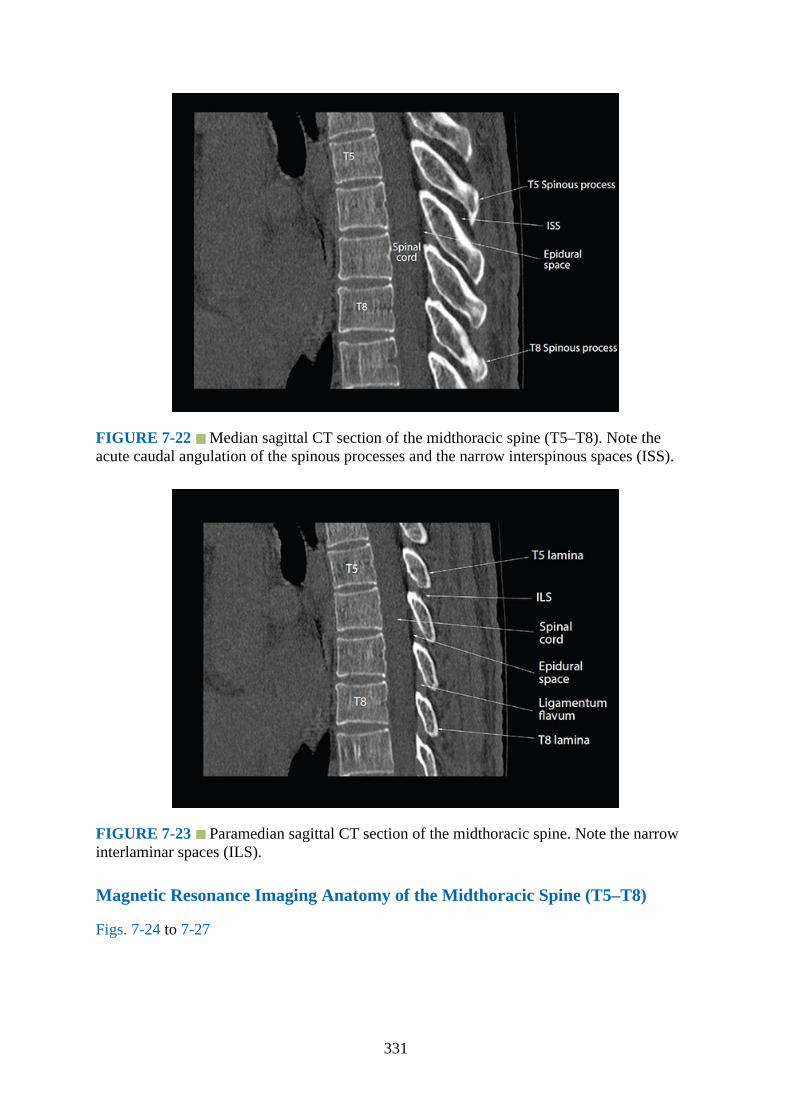
FIGURE 7-22 Median sagittal CT section of the midthoracic spine (T5–T8). Note theacute caudal angulation of the spinous processes and the narrow interspinous spaces (ISS).
FIGURE 7-23 Paramedian sagittal CT section of the midthoracic spine. Note the narrowinterlaminar spaces (ILS).
Magnetic Resonance Imaging Anatomy of the Midthoracic Spine (T5–T8)
Figs. 7-24 to 7-27
331

FIGURE 7-24 Transverse MRI section of the midthoracic spine through the base of the T6spinous process. VB, vertebral body.
FIGURE 7-25 Transverse MRI section of the midthoracic spine through the T6 to T7interspinous space. VB, vertebral body.
332

FIGURE 7-26 Median sagittal MRI section of the midthoracic spine. Note the sharp acutecaudal angulation of the spinous processes and the narrow interspinous spaces. VB, vertebralbody.
FIGURE 7-27 Paramedian sagittal MRI section of the midthoracic spine. VB, vertebralbody.
Gross Anatomy of the Lower Thoracic Spine (T9–T12)
Figs. 7-28 and 7-29
333
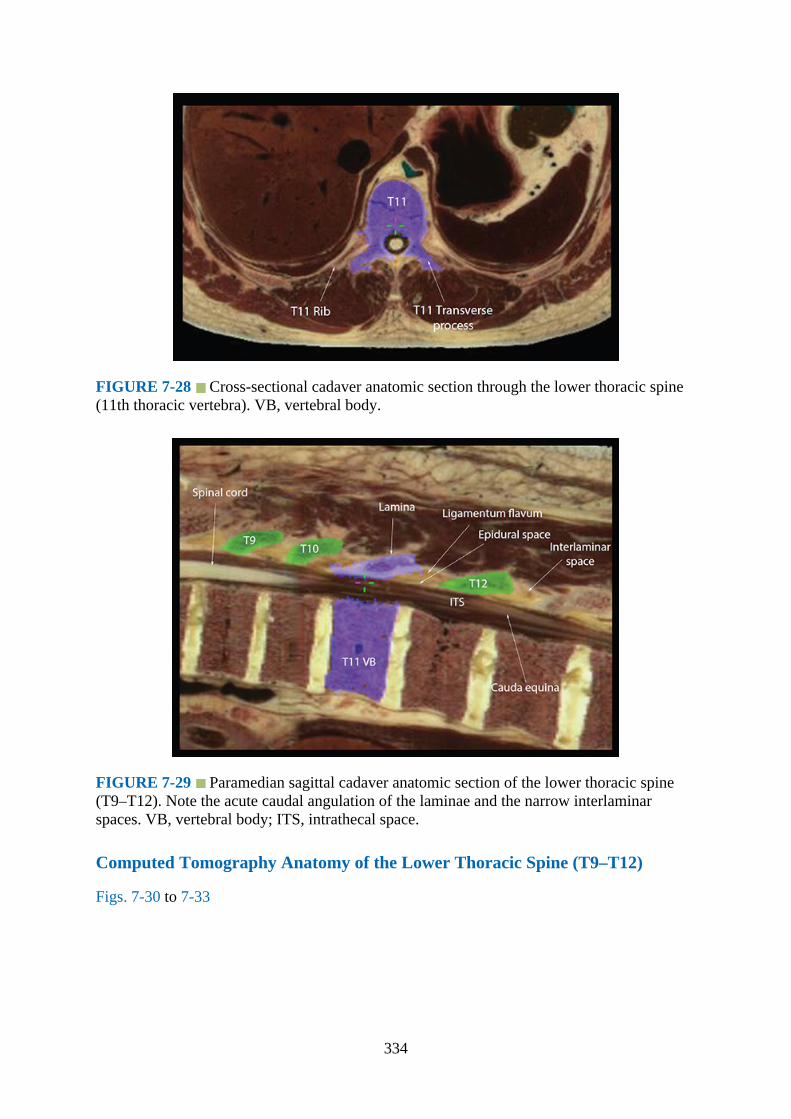
FIGURE 7-28 Cross-sectional cadaver anatomic section through the lower thoracic spine(11th thoracic vertebra). VB, vertebral body.
FIGURE 7-29 Paramedian sagittal cadaver anatomic section of the lower thoracic spine(T9–T12). Note the acute caudal angulation of the laminae and the narrow interlaminarspaces. VB, vertebral body; ITS, intrathecal space.
Computed Tomography Anatomy of the Lower Thoracic Spine (T9–T12)
Figs. 7-30 to 7-33
334

FIGURE 7-30 Transverse CT section of the lower thoracic spine through the base of theT10 spinous process. VB, vertebral body.
FIGURE 7-31 Transverse CT section of the lower thoracic spine through the T10 to T11interspinous space. VB, vertebral body; TP, transverse process.
335
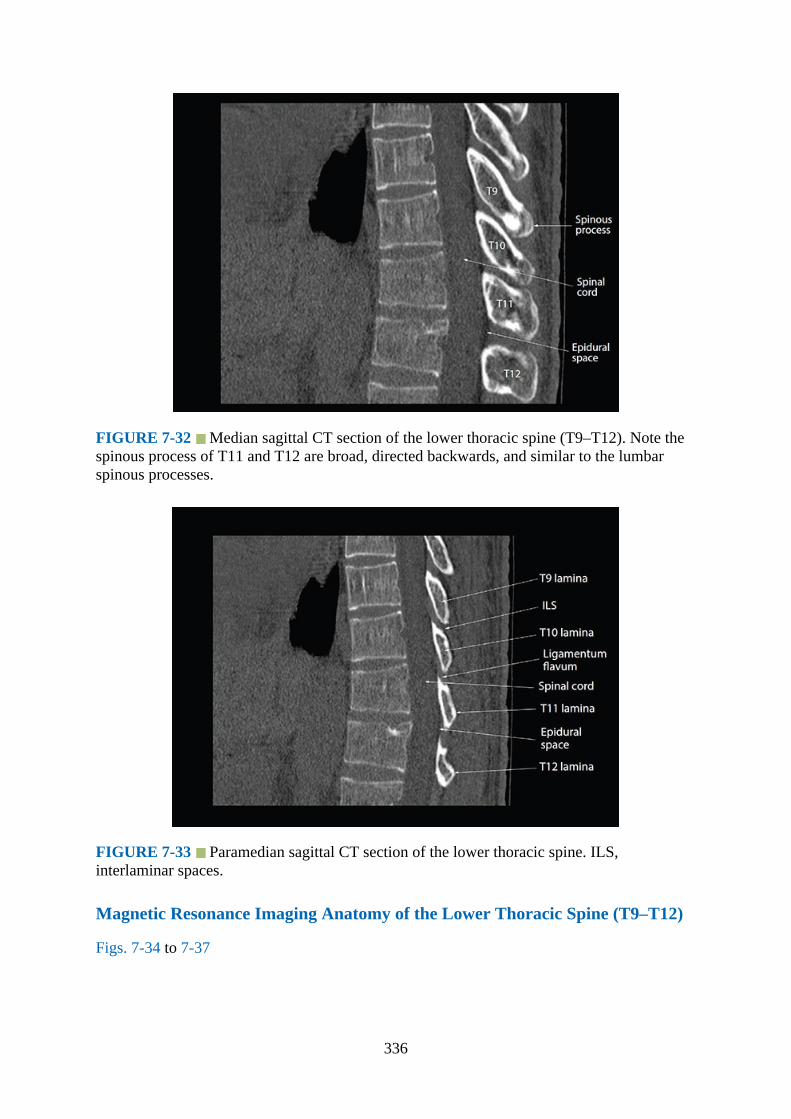
FIGURE 7-32 Median sagittal CT section of the lower thoracic spine (T9–T12). Note thespinous process of T11 and T12 are broad, directed backwards, and similar to the lumbarspinous processes.
FIGURE 7-33 Paramedian sagittal CT section of the lower thoracic spine. ILS,interlaminar spaces.
Magnetic Resonance Imaging Anatomy of the Lower Thoracic Spine (T9–T12)
Figs. 7-34 to 7-37
336
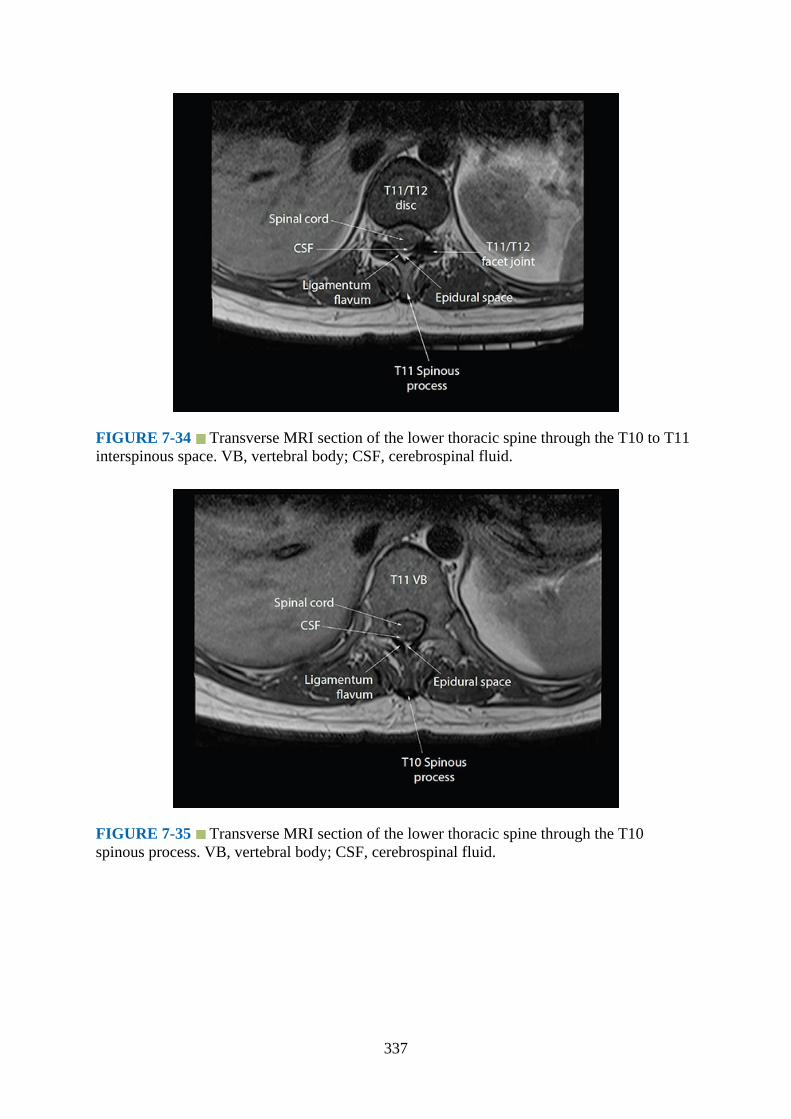
FIGURE 7-34 Transverse MRI section of the lower thoracic spine through the T10 to T11interspinous space. VB, vertebral body; CSF, cerebrospinal fluid.
FIGURE 7-35 Transverse MRI section of the lower thoracic spine through the T10spinous process. VB, vertebral body; CSF, cerebrospinal fluid.
337
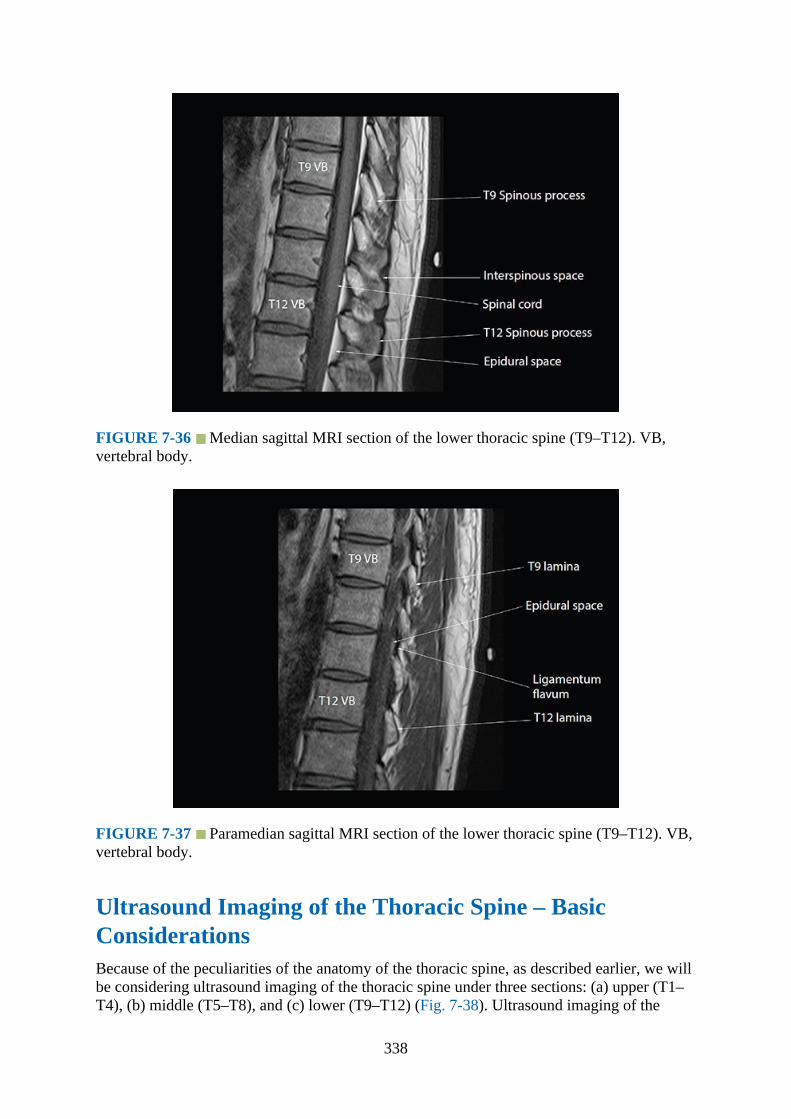
FIGURE 7-36 Median sagittal MRI section of the lower thoracic spine (T9–T12). VB,vertebral body.
FIGURE 7-37 Paramedian sagittal MRI section of the lower thoracic spine (T9–T12). VB,vertebral body.
Ultrasound Imaging of the Thoracic Spine – BasicConsiderationsBecause of the peculiarities of the anatomy of the thoracic spine, as described earlier, we willbe considering ultrasound imaging of the thoracic spine under three sections: (a) upper (T1–T4), (b) middle (T5–T8), and (c) lower (T9–T12) (Fig. 7-38). Ultrasound imaging of the
338
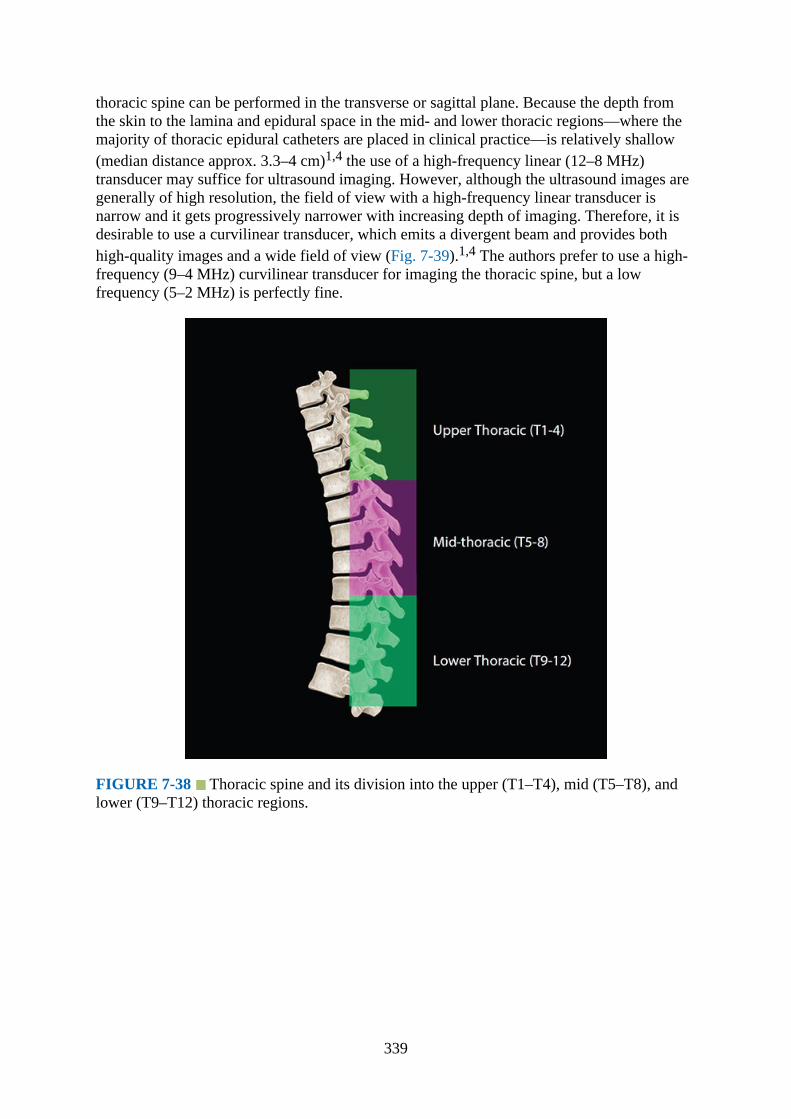
thoracic spine can be performed in the transverse or sagittal plane. Because the depth fromthe skin to the lamina and epidural space in the mid- and lower thoracic regions—where themajority of thoracic epidural catheters are placed in clinical practice—is relatively shallow(median distance approx. 3.3–4 cm)1,4 the use of a high-frequency linear (12–8 MHz)transducer may suffice for ultrasound imaging. However, although the ultrasound images aregenerally of high resolution, the field of view with a high-frequency linear transducer isnarrow and it gets progressively narrower with increasing depth of imaging. Therefore, it isdesirable to use a curvilinear transducer, which emits a divergent beam and provides bothhigh-quality images and a wide field of view (Fig. 7-39).1,4 The authors prefer to use a high-frequency (9–4 MHz) curvilinear transducer for imaging the thoracic spine, but a lowfrequency (5–2 MHz) is perfectly fine.
FIGURE 7-38 Thoracic spine and its division into the upper (T1–T4), mid (T5–T8), andlower (T9–T12) thoracic regions.
339
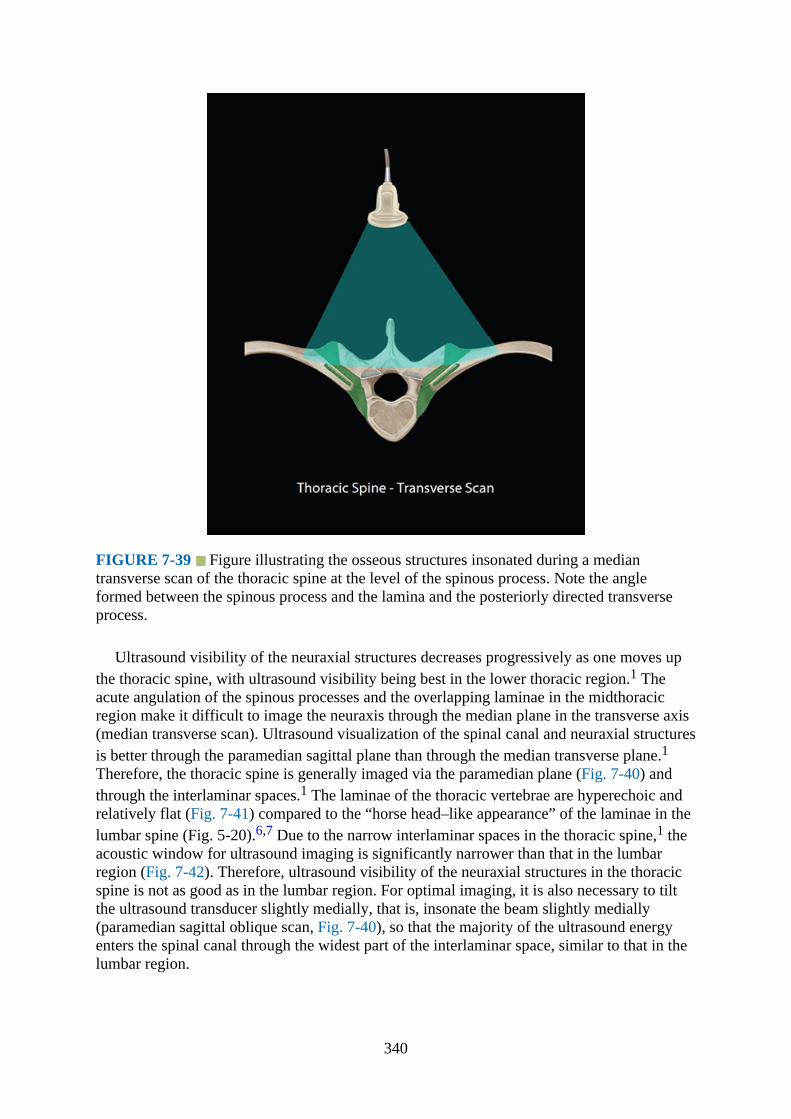
FIGURE 7-39 Figure illustrating the osseous structures insonated during a mediantransverse scan of the thoracic spine at the level of the spinous process. Note the angleformed between the spinous process and the lamina and the posteriorly directed transverseprocess.
Ultrasound visibility of the neuraxial structures decreases progressively as one moves upthe thoracic spine, with ultrasound visibility being best in the lower thoracic region.1 Theacute angulation of the spinous processes and the overlapping laminae in the midthoracicregion make it difficult to image the neuraxis through the median plane in the transverse axis(median transverse scan). Ultrasound visualization of the spinal canal and neuraxial structuresis better through the paramedian sagittal plane than through the median transverse plane.1Therefore, the thoracic spine is generally imaged via the paramedian plane (Fig. 7-40) andthrough the interlaminar spaces.1 The laminae of the thoracic vertebrae are hyperechoic andrelatively flat (Fig. 7-41) compared to the “horse head–like appearance” of the laminae in thelumbar spine (Fig. 5-20).6,7 Due to the narrow interlaminar spaces in the thoracic spine,1 theacoustic window for ultrasound imaging is significantly narrower than that in the lumbarregion (Fig. 7-42). Therefore, ultrasound visibility of the neuraxial structures in the thoracicspine is not as good as in the lumbar region. For optimal imaging, it is also necessary to tiltthe ultrasound transducer slightly medially, that is, insonate the beam slightly medially(paramedian sagittal oblique scan, Fig. 7-40), so that the majority of the ultrasound energyenters the spinal canal through the widest part of the interlaminar space, similar to that in thelumbar region.
340
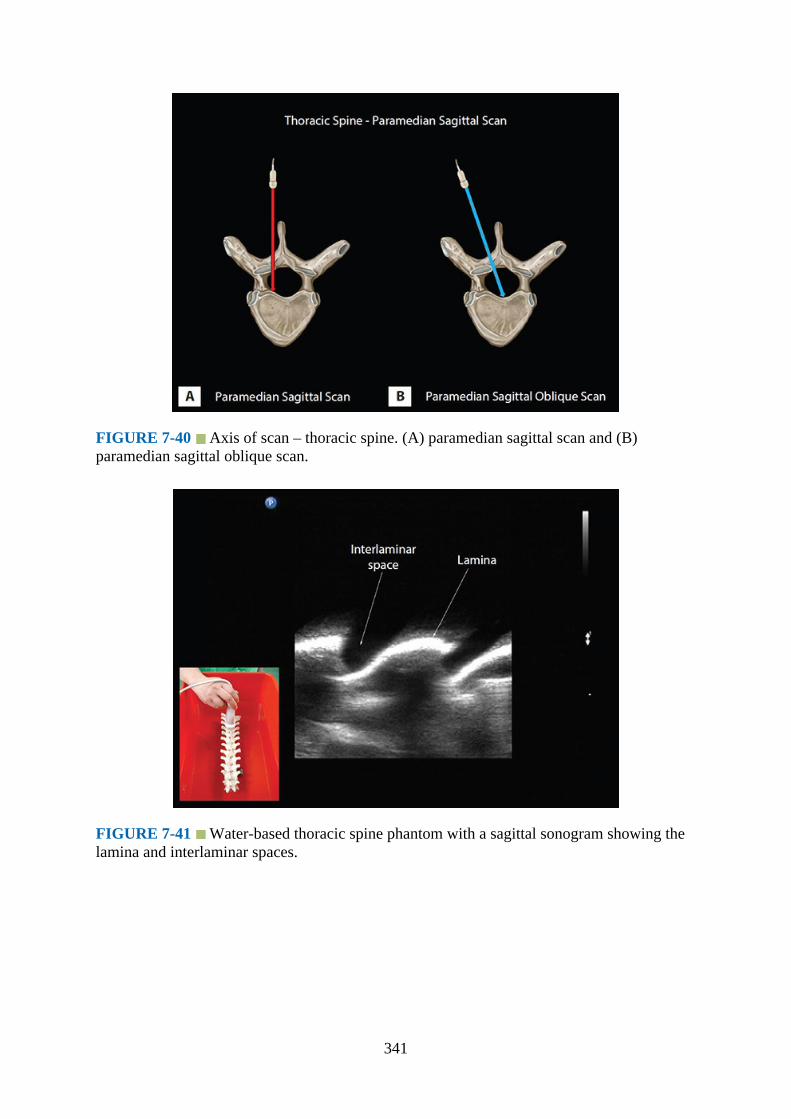
FIGURE 7-40 Axis of scan – thoracic spine. (A) paramedian sagittal scan and (B)paramedian sagittal oblique scan.
FIGURE 7-41 Water-based thoracic spine phantom with a sagittal sonogram showing thelamina and interlaminar spaces.
341
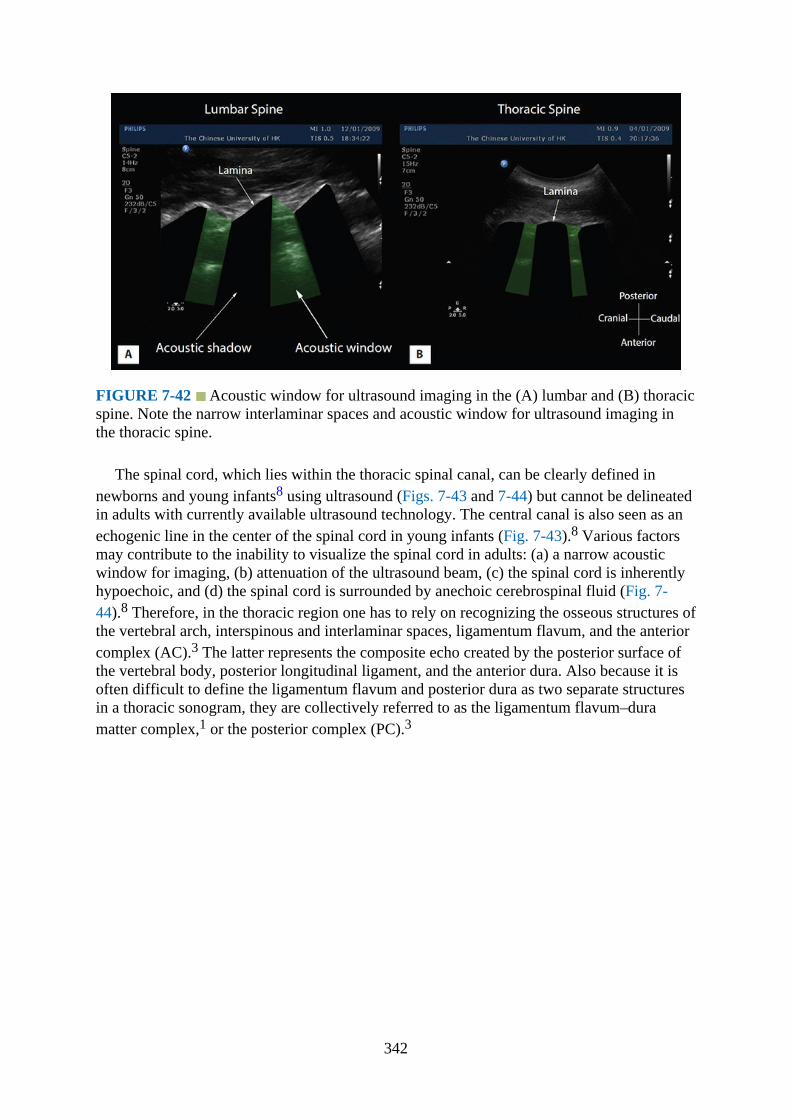
FIGURE 7-42 Acoustic window for ultrasound imaging in the (A) lumbar and (B) thoracicspine. Note the narrow interlaminar spaces and acoustic window for ultrasound imaging inthe thoracic spine.
The spinal cord, which lies within the thoracic spinal canal, can be clearly defined innewborns and young infants8 using ultrasound (Figs. 7-43 and 7-44) but cannot be delineatedin adults with currently available ultrasound technology. The central canal is also seen as anechogenic line in the center of the spinal cord in young infants (Fig. 7-43).8 Various factorsmay contribute to the inability to visualize the spinal cord in adults: (a) a narrow acousticwindow for imaging, (b) attenuation of the ultrasound beam, (c) the spinal cord is inherentlyhypoechoic, and (d) the spinal cord is surrounded by anechoic cerebrospinal fluid (Fig. 7-44).8 Therefore, in the thoracic region one has to rely on recognizing the osseous structures ofthe vertebral arch, interspinous and interlaminar spaces, ligamentum flavum, and the anteriorcomplex (AC).3 The latter represents the composite echo created by the posterior surface ofthe vertebral body, posterior longitudinal ligament, and the anterior dura. Also because it isoften difficult to define the ligamentum flavum and posterior dura as two separate structuresin a thoracic sonogram, they are collectively referred to as the ligamentum flavum–duramatter complex,1 or the posterior complex (PC).3
342

FIGURE 7-43 Sagittal sonogram of the thoracic spine in a neonate to illustrate thehypoechoic spinal cord, hyperechoic central canal, hyperechoic anterior and posterior dura,and the epidural spaces. CSF, cerebrospinal fluid.
FIGURE 7-44 Transverse sonogram of the thoracic spine in a neonate to illustrate thehypoechoic spinal cord, the thecal sac, dentate ligaments, dura (anterior and posterior), andthe epidural space. CSF, cerebrospinal fluid.
Ultrasound Imaging of the Upper Thoracic Spine (T1–T4)1.Position:
343

a.Patient: The patient is positioned comfortably in the sitting position with the armshanging down and resting on the thigh or on a pillow or support in front. The patientis also asked to slightly flex the head anteriorly. However, if the patient is unable tosit or is unwell, then the patient can be positioned in the lateral decubitus positionwith the head flexed anteriorly.
b.Operator and ultrasound machine: The operator stands behind the patient, and theultrasound machine is placed directly in front of the patient.
2.Transducer selection: Due to the thick musculature of the nape of the neck and relativelygreater depth from the skin to the neuraxial structures, curvilinear transducers are best forimaging the upper thoracic spine. The authors prefer to use a high-frequency (9–4 MHz)curvilinear transducer, but it is feasible to use a low-frequency (5–2 MHz) curvilineartransducer for the ultrasound scan.
3.Scanning technique: The upper thoracic spine can be imaged in the transverse (Fig. 7-45)or sagittal (Fig. 7-46) planes. During the median transverse scan, the aim is to obtain atransverse spinous process view (TSPV, Fig. 7-47) or a transverse interspinous view(TISV, Fig. 7-48). Because the spinous processes in the upper thoracic region are notinclined as steeply as in the midthoracic region, especially above the T3 levels, it may befeasible to obtain a TISV. Below this level it gets increasingly difficult to obtain a TISV.For a sagittal scan the ultrasound transducer is placed 2 to 3 cm lateral to the midline andgently tilted medially (paramedian sagittal oblique scan, PMSOS) until the thoraciclamina and the interlaminar spaces are visualized (Fig. 7-49).
FIGURE 7-45 Position and orientation of the ultrasound transducer during a transversescan of the upper thoracic spine with the subject in the sitting position.
344
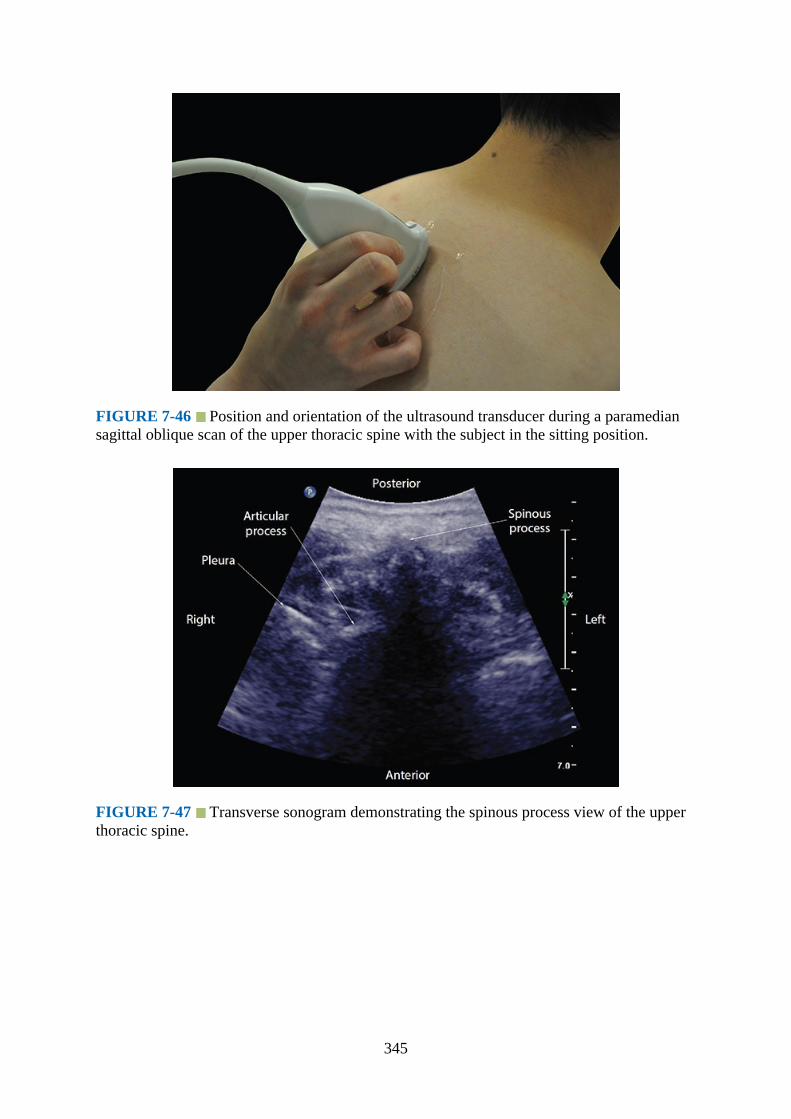
FIGURE 7-46 Position and orientation of the ultrasound transducer during a paramediansagittal oblique scan of the upper thoracic spine with the subject in the sitting position.
FIGURE 7-47 Transverse sonogram demonstrating the spinous process view of the upperthoracic spine.
345
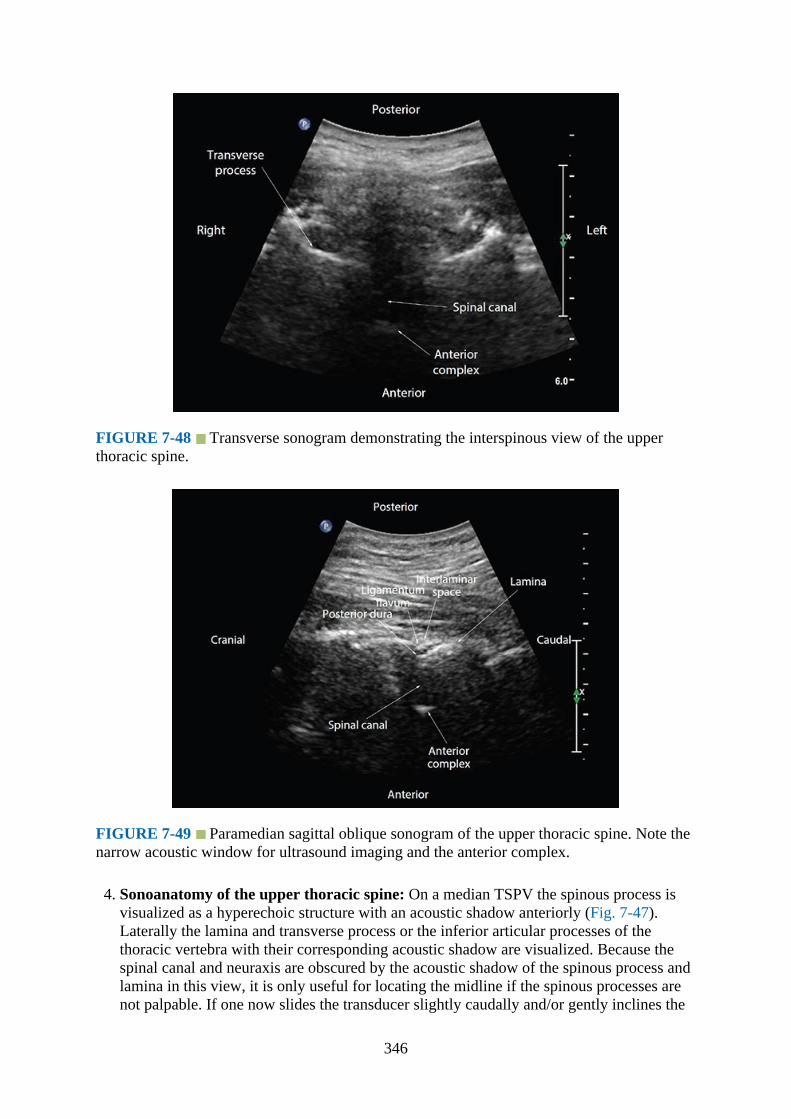
FIGURE 7-48 Transverse sonogram demonstrating the interspinous view of the upperthoracic spine.
FIGURE 7-49 Paramedian sagittal oblique sonogram of the upper thoracic spine. Note thenarrow acoustic window for ultrasound imaging and the anterior complex.
4. Sonoanatomy of the upper thoracic spine: On a median TSPV the spinous process isvisualized as a hyperechoic structure with an acoustic shadow anteriorly (Fig. 7-47).Laterally the lamina and transverse process or the inferior articular processes of thethoracic vertebra with their corresponding acoustic shadow are visualized. Because thespinal canal and neuraxis are obscured by the acoustic shadow of the spinous process andlamina in this view, it is only useful for locating the midline if the spinous processes arenot palpable. If one now slides the transducer slightly caudally and/or gently inclines the
346
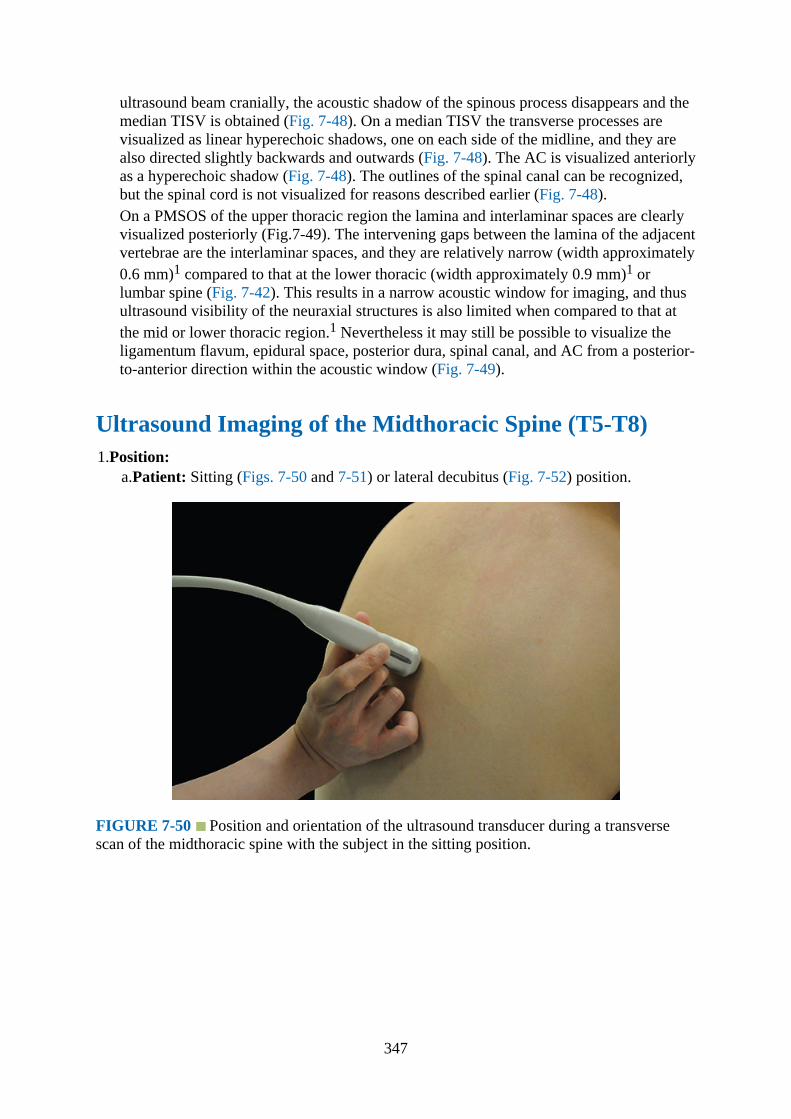
ultrasound beam cranially, the acoustic shadow of the spinous process disappears and themedian TISV is obtained (Fig. 7-48). On a median TISV the transverse processes arevisualized as linear hyperechoic shadows, one on each side of the midline, and they arealso directed slightly backwards and outwards (Fig. 7-48). The AC is visualized anteriorlyas a hyperechoic shadow (Fig. 7-48). The outlines of the spinal canal can be recognized,but the spinal cord is not visualized for reasons described earlier (Fig. 7-48).On a PMSOS of the upper thoracic region the lamina and interlaminar spaces are clearlyvisualized posteriorly (Fig.7-49). The intervening gaps between the lamina of the adjacentvertebrae are the interlaminar spaces, and they are relatively narrow (width approximately0.6 mm)1 compared to that at the lower thoracic (width approximately 0.9 mm)1 orlumbar spine (Fig. 7-42). This results in a narrow acoustic window for imaging, and thusultrasound visibility of the neuraxial structures is also limited when compared to that atthe mid or lower thoracic region.1 Nevertheless it may still be possible to visualize theligamentum flavum, epidural space, posterior dura, spinal canal, and AC from a posterior-to-anterior direction within the acoustic window (Fig. 7-49).
Ultrasound Imaging of the Midthoracic Spine (T5-T8)1.Position:
a.Patient: Sitting (Figs. 7-50 and 7-51) or lateral decubitus (Fig. 7-52) position.
FIGURE 7-50 Position and orientation of the ultrasound transducer during a transversescan of the midthoracic spine with the subject in the sitting position.
347

FIGURE 7-51 Paramedian sagittal oblique sonogram of the midthoracic spine with thesubject in the sitting position.
FIGURE 7-52 Paramedian sagittal oblique sonogram of the midthoracic spine with thepatient in the lateral position.
b.Operator and ultrasound machine: The operator sits or stands behind the patient, andthe ultrasound machine is positioned directly in front of the patient.
2.Transducer selection: Curved array transducer. The authors prefer to use a high-frequency(9–4 MHz) curvilinear transducer, but a low-frequency (5–2 MHz) curvilinear transducerwill suffice.
3.Scanning technique: Ultrasound imaging is more demanding in the midthoracic regionthan at the lower thoracic region due to the acute caudal angulation of the spinous
348

processes and the overlapping lamina. The narrow interspinous and interlaminar spaces(approximately 0.8 cm)1 create a narrow acoustic window for imaging with variablequality of ultrasound images of the neuraxis. The midthoracic spine can be imaged in thetransverse (Fig. 7-50) or sagittal (Figs. 7-51 and 7-52) axis. The median transverse scan(median TSPV, Fig. 7-53) is not very useful, as it provides little information relevant forneuraxial blockade other than identifying the midline and measuring the depth to thelamina. Also acquiring a median TISV (Fig. 7-54) at the midthoracic region ischallenging, and in some individuals it may be impossible. Because the paramediansagittal axis provides better visualization of the neuraxis than the transverse axis,1 it is thepreferred route for imaging. Also for optimal paramedian sagittal imaging one has toperform a PMSOS (Fig. 7-52) as described earlier.
FIGURE 7-53 Transverse sonogram demonstrating the spinous process view of themidthoracic spine.
349
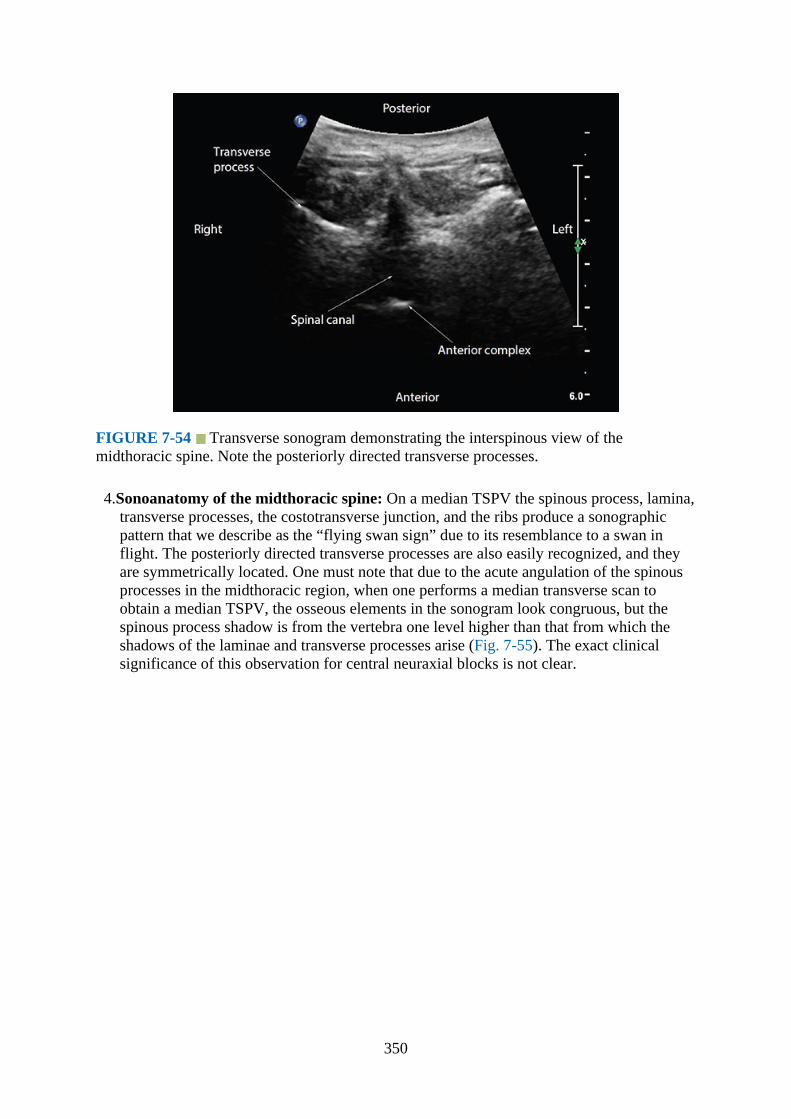
FIGURE 7-54 Transverse sonogram demonstrating the interspinous view of themidthoracic spine. Note the posteriorly directed transverse processes.
4.Sonoanatomy of the midthoracic spine: On a median TSPV the spinous process, lamina,transverse processes, the costotransverse junction, and the ribs produce a sonographicpattern that we describe as the “flying swan sign” due to its resemblance to a swan inflight. The posteriorly directed transverse processes are also easily recognized, and theyare symmetrically located. One must note that due to the acute angulation of the spinousprocesses in the midthoracic region, when one performs a median transverse scan toobtain a median TSPV, the osseous elements in the sonogram look congruous, but thespinous process shadow is from the vertebra one level higher than that from which theshadows of the laminae and transverse processes arise (Fig. 7-55). The exact clinicalsignificance of this observation for central neuraxial blocks is not clear.
350
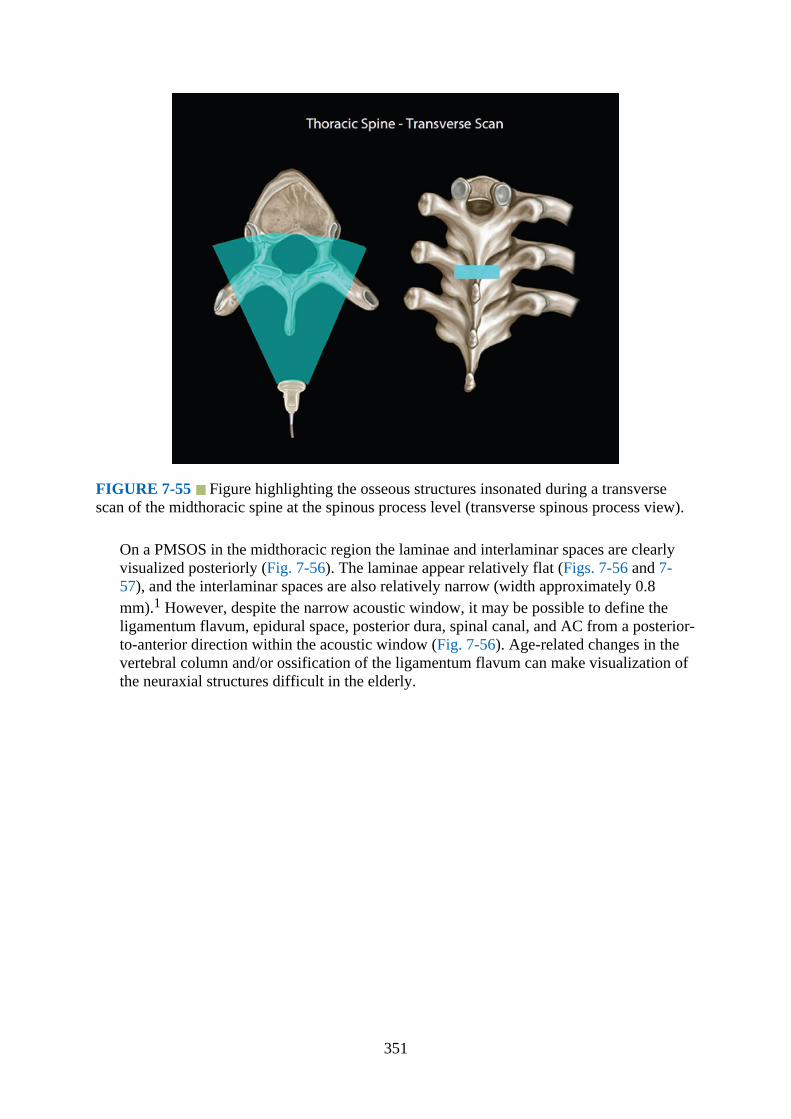
FIGURE 7-55 Figure highlighting the osseous structures insonated during a transversescan of the midthoracic spine at the spinous process level (transverse spinous process view).
On a PMSOS in the midthoracic region the laminae and interlaminar spaces are clearlyvisualized posteriorly (Fig. 7-56). The laminae appear relatively flat (Figs. 7-56 and 7-57), and the interlaminar spaces are also relatively narrow (width approximately 0.8mm).1 However, despite the narrow acoustic window, it may be possible to define theligamentum flavum, epidural space, posterior dura, spinal canal, and AC from a posterior-to-anterior direction within the acoustic window (Fig. 7-56). Age-related changes in thevertebral column and/or ossification of the ligamentum flavum can make visualization ofthe neuraxial structures difficult in the elderly.
351
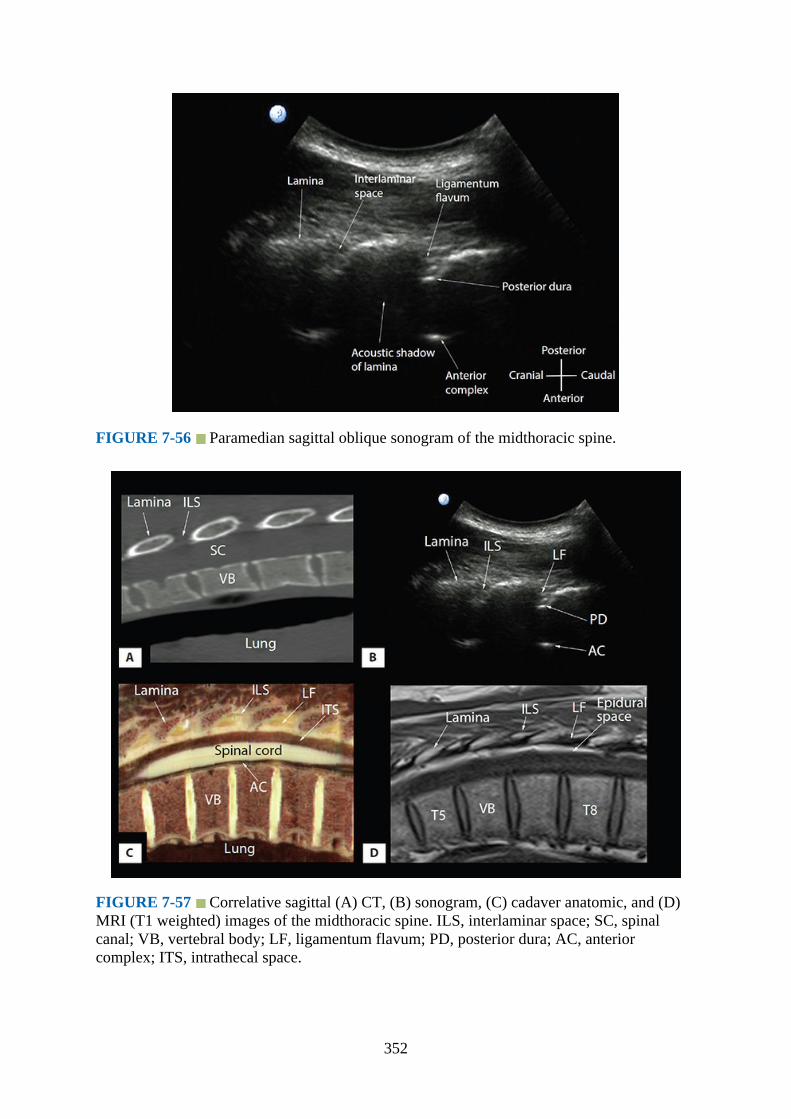
FIGURE 7-56 Paramedian sagittal oblique sonogram of the midthoracic spine.
FIGURE 7-57 Correlative sagittal (A) CT, (B) sonogram, (C) cadaver anatomic, and (D)MRI (T1 weighted) images of the midthoracic spine. ILS, interlaminar space; SC, spinalcanal; VB, vertebral body; LF, ligamentum flavum; PD, posterior dura; AC, anteriorcomplex; ITS, intrathecal space.
352
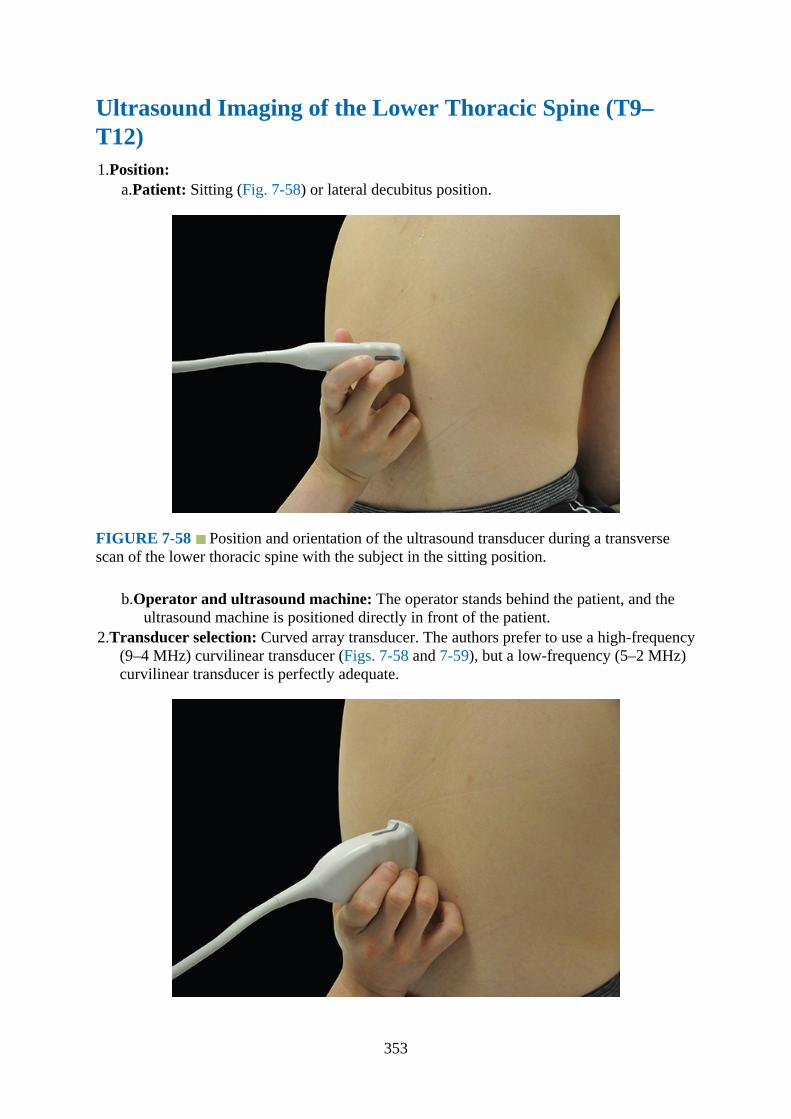
Ultrasound Imaging of the Lower Thoracic Spine (T9–T12)1.Position:
a.Patient: Sitting (Fig. 7-58) or lateral decubitus position.
FIGURE 7-58 Position and orientation of the ultrasound transducer during a transversescan of the lower thoracic spine with the subject in the sitting position.
b.Operator and ultrasound machine: The operator stands behind the patient, and theultrasound machine is positioned directly in front of the patient.
2.Transducer selection: Curved array transducer. The authors prefer to use a high-frequency(9–4 MHz) curvilinear transducer (Figs. 7-58 and 7-59), but a low-frequency (5–2 MHz)curvilinear transducer is perfectly adequate.
353
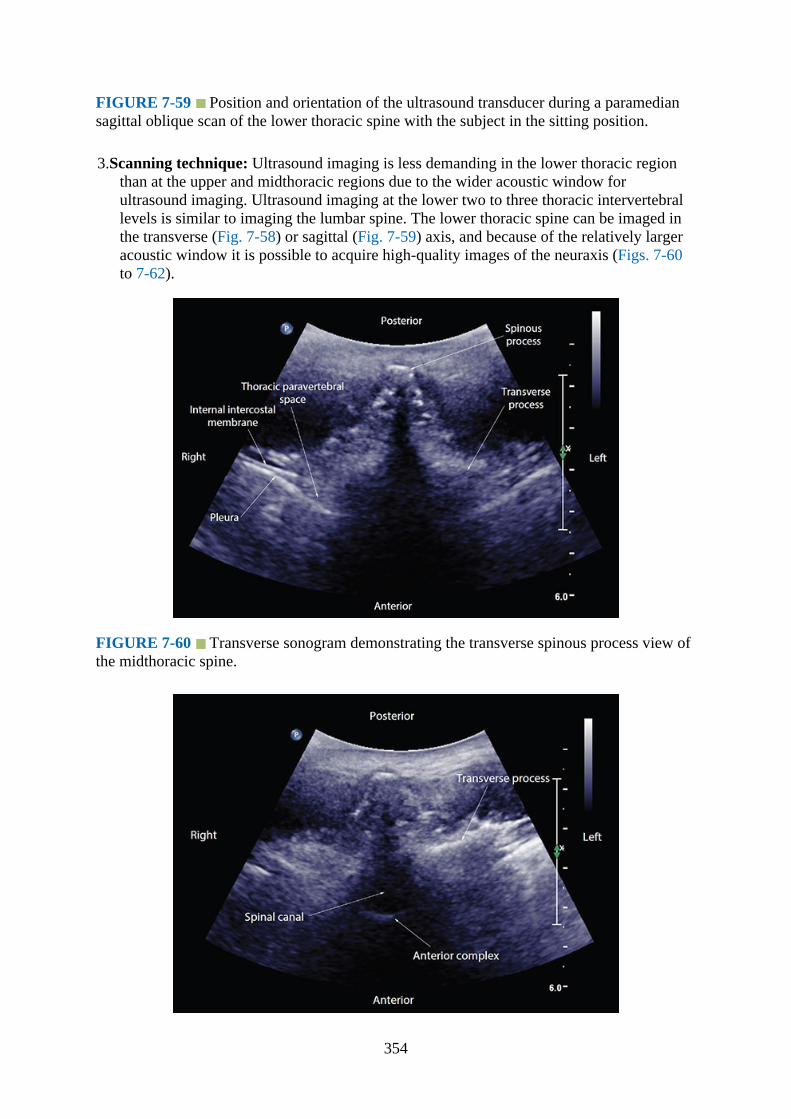
FIGURE 7-59 Position and orientation of the ultrasound transducer during a paramediansagittal oblique scan of the lower thoracic spine with the subject in the sitting position.
3.Scanning technique: Ultrasound imaging is less demanding in the lower thoracic regionthan at the upper and midthoracic regions due to the wider acoustic window forultrasound imaging. Ultrasound imaging at the lower two to three thoracic intervertebrallevels is similar to imaging the lumbar spine. The lower thoracic spine can be imaged inthe transverse (Fig. 7-58) or sagittal (Fig. 7-59) axis, and because of the relatively largeracoustic window it is possible to acquire high-quality images of the neuraxis (Figs. 7-60to 7-62).
FIGURE 7-60 Transverse sonogram demonstrating the transverse spinous process view ofthe midthoracic spine.
354
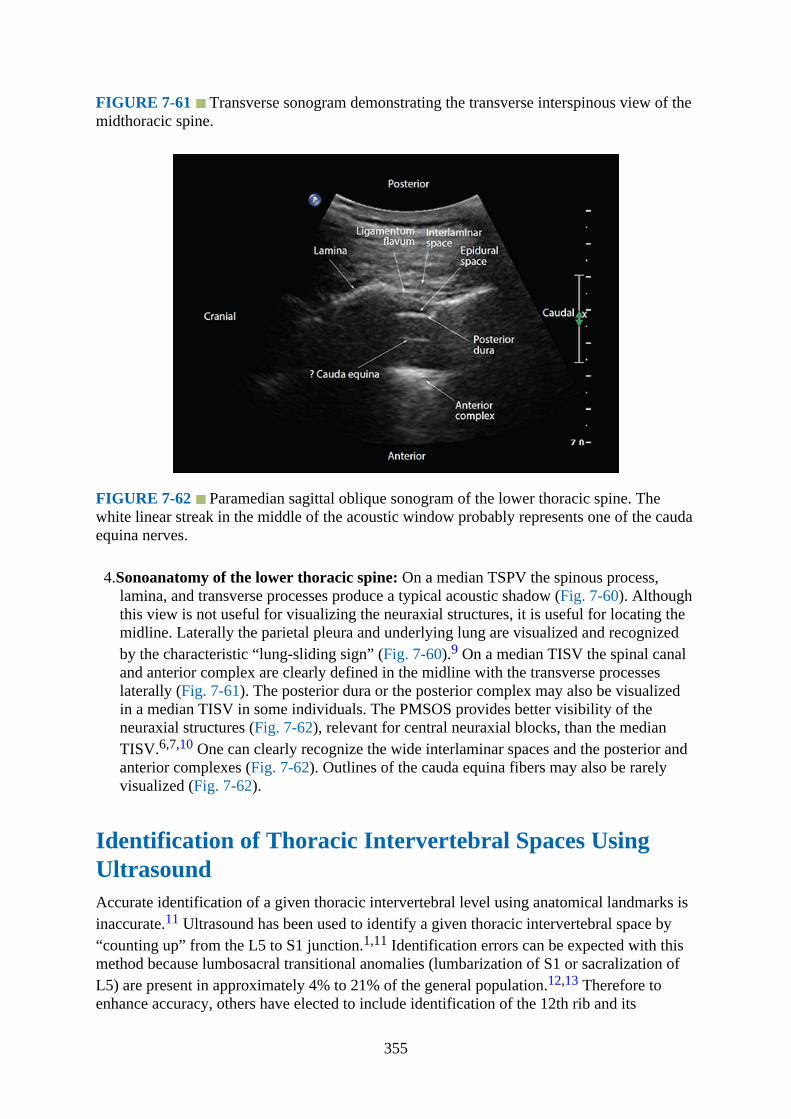
FIGURE 7-61 Transverse sonogram demonstrating the transverse interspinous view of themidthoracic spine.
FIGURE 7-62 Paramedian sagittal oblique sonogram of the lower thoracic spine. Thewhite linear streak in the middle of the acoustic window probably represents one of the caudaequina nerves.
4.Sonoanatomy of the lower thoracic spine: On a median TSPV the spinous process,lamina, and transverse processes produce a typical acoustic shadow (Fig. 7-60). Althoughthis view is not useful for visualizing the neuraxial structures, it is useful for locating themidline. Laterally the parietal pleura and underlying lung are visualized and recognizedby the characteristic “lung-sliding sign” (Fig. 7-60).9 On a median TISV the spinal canaland anterior complex are clearly defined in the midline with the transverse processeslaterally (Fig. 7-61). The posterior dura or the posterior complex may also be visualizedin a median TISV in some individuals. The PMSOS provides better visibility of theneuraxial structures (Fig. 7-62), relevant for central neuraxial blocks, than the medianTISV.6,7,10 One can clearly recognize the wide interlaminar spaces and the posterior andanterior complexes (Fig. 7-62). Outlines of the cauda equina fibers may also be rarelyvisualized (Fig. 7-62).
Identification of Thoracic Intervertebral Spaces UsingUltrasoundAccurate identification of a given thoracic intervertebral level using anatomical landmarks isinaccurate.11 Ultrasound has been used to identify a given thoracic intervertebral space by“counting up” from the L5 to S1 junction.1,11 Identification errors can be expected with thismethod because lumbosacral transitional anomalies (lumbarization of S1 or sacralization ofL5) are present in approximately 4% to 21% of the general population.12,13 Therefore toenhance accuracy, others have elected to include identification of the 12th rib and its
355

articulation with the T12 vertebra as a secondary ultrasound landmark to the “counting up”method.1,14 It is not known if this combined method improves accuracy because an accessoryL1 rib can also be present in approximately 2% of individuals.15 An alternative sonographicmethod, which has been used to identify the level of thoracic paravertebral injection, relies onidentifying the first rib.16 However, a limitation of this method is that the presence of acervical rib can affect its accuracy. Therefore, although various sonographic methods havebeen described, they have inherent inaccuracies. More importantly, none of these methodshave been tested against a gold-standard imaging modality such as computed tomography(CT) or magnetic resonance imaging (MRI). Despite these limitations it is our opinion thatfor day-to-day practice of thoracic epidural catheter placement, the sonographic methodsdescribed earlier are clinically useful because sonographic methods are generally moreaccurate than methods that solely reply on anatomical landmarks.11
Clinical PearlsCurrently there are limited published data on ultrasound imaging of the thoracic spine or onthe use of ultrasound for thoracic epidural catheter placement. Based on published data, it ismost frequently used to preview the anatomy of the spine before thoracic epidural catheterplacement.4 During the preprocedural or scout scan, ultrasound can be used to identify themidline, determine the presence of any underlying spinal abnormality (eg, scoliosis,17
underlying spinal instrumentation), determine the degree of axial rotation of the thoracicspine in scoliosis,17 accurately measure the depth to the lamina or posterior dura,4 anddetermine the optimal site for epidural needle placement. During a median transverse (formidline approach) or PMSOS (for a paramedian approach), the angle of insonation thatproduces the best ultrasound visualization of the neuraxial structures or the anterior complexclosely mirrors the angle or trajectory for needle insertion. Currently there are no publisheddata on the use of ultrasound to guide or assist real-time epidural needle placement in thethoracic region. In the authors’ experience ultrasound can be used to assist epidural catheterplacement in the thoracic region, especially in patients with obesity or difficult backs, byguiding the tip of the epidural needle to the target interlaminar space before the traditionalloss-of-resistance method is used to confirm correct epidural needle placement. This maytranslate into reduced needle passes and higher success rates on the first attempt. Futureresearch to establish the utility of ultrasound for thoracic epidural catheter placement iswarranted.
References1.Avramescu S, Arzola C, Tharmaratnam U, Chin KJ, Balki M. Sonoanatomy of the
thoracic spine in adult volunteers. Reg Anesth Pain Med. 2012;37:349–353.2.Grau T, Leipold RW, Delorme S, Martin E, Motsch J. Ultrasound imaging of the thoracic
epidural space. Reg Anesth Pain Med. 2002;27:200–206.3.Chin KJ, Karmakar MK, Peng P. Ultrasonography of the adult thoracic and lumbar spine
for central neuraxial blockade. Anesthesiology. 2011;114:1459–1485.4.Salman A, Arzola C, Tharmaratnam U, Balki M. Ultrasound imaging of the thoracic spine
in paramedian sagittal oblique plane: the correlation between estimated and actual depthto the epidural space. Reg Anesth Pain Med. 2011;36:542–547.
5.Moriggl B. Spine anatomy and sonoanatomy for pain physicians. In: Narouze S, ed. Atlas
356
of Ultrasound Guided Procedures in Interventional Pain Management. New York, NY:Springer; 2010:79–105.
6.Karmakar MK. Ultrasound guided central neuraxial blocks. In: Narouze S, ed. Atlas ofUltrasound Guided Procedures in Interventional Pain Management. 1st ed. New York,NY: Springer; 2010:161–178.
7.Karmakar MK, Li X, Kwok WH, Ho AM, Ngan Kee WD. Sonoanatomy relevant forultrasound-guided central neuraxial blocks via the paramedian approach in the lumbarregion. Br J Radiol. 2012;85:e262–e269.
8.Unsinn KM, Geley T, Freund MC, Gassner I. US of the spinal cord in newborns: spectrumof normal findings, variants, congenital anomalies, and acquired diseases.Radiographics. 2000;20:923–938.
9.Lichtenstein DA, Menu Y. A bedside ultrasound sign ruling out pneumothorax in thecritically ill. Lung sliding. Chest. 1995;108:1345–1348.
10.Karmakar MK, Li X, Ho AM, Kwok WH, Chui PT. Real-time ultrasound-guidedparamedian epidural access: evaluation of a novel in-plane technique. Br J Anaesth.2009;102:845–854.
11.Arzola C, Avramescu S, Tharmaratnam U, Chin KJ, Balki M. Identification ofcervicothoracic intervertebral spaces by surface landmarks and ultrasound. Can JAnaesth. 2011;58:1069–1074.
12.Hughes RJ, Saifuddin A. Imaging of lumbosacral transitional vertebrae. Clin Radiol.2004;59:984–991.
13.Bron JL, van Royen BJ, Wuisman PI. The clinical significance of lumbosacral transitionalanomalies. Acta Orthop Belg. 2007;73:687–695.
14.Arzola C, Davies S, Rofaeel A, Carvalho JC. Ultrasound using the transverse approach tothe lumbar spine provides reliable landmarks for labor epidurals. Anesth Analg.2007;104:1188–1192.
15.Tyl RW, Chernoff N, Rogers JM. Altered axial skeletal development. Birth Defects Res BDev Reprod Toxicol. 2007;80:451–472.
16.Bouzinac A, Delbos A, Rontes O. [Ultrasound location of the first rib confirm the level ofrealization of thoracic paravertebral block]. Ann Fr Anesth Reanim. 2012;31:571–572.
17.McLeod A, Roche A, Fennelly M. Case series: Ultrasonography may assist epiduralinsertion in scoliosis patients. Can J Anaesth. 2005;52:717–720.
357
CHAPTER 8
Ultrasound Imaging of the Lumbar Spine for CentralNeuraxial Blocks
IntroductionCentral neuraxial blocks (CNBs), which include spinal, epidural, and combined spinalepidural (CSE) injections, are frequently performed in the lumbar region for anesthesia andanalgesia and for managing chronic pain.1 Traditionally, they are performed using acombination of surface anatomic landmarks, the operator’s tactile perception of “loss ofresistance” during needle advancement through the ligamentum flavum, and/or visualizingthe efflux of cerebrospinal fluid. Anatomic landmarks (eg, the spinous processes) are usefulbut they are not always easily palpable in patients with edema, obesity,2 underlying spinaldeformity, or previous back surgery. The “Tuffier’s line,” which is a line joining the highestpoints of the iliac crests, is another surface anatomical landmark that is widely used toestimate the location of the L4 to L5 interspace; however, the correlation is inconsistent.3Even in the absence of spine abnormalities, estimation of a specific intervertebral level maynot be accurate in many patients4,5 and may result in needle placement one or two spinallevels higher than intended.4–7 This inaccuracy is exaggerated in the obese and in the upperspinal levels.4,6,8 Furthermore, using surface anatomical landmarks alone, it is not possible topredict the ease or difficulty of needle placement prior to skin puncture. Unanticipatedtechnical difficulty, multiple attempts at needle placement, and failure of CNB are thereforeprevalent in clinical practice.9,10
Recently, ultrasound imaging of the spine11–13 has emerged as a useful tool to overcomemany of the shortcomings of the traditional approach to CNBs, and it has been used withgreat success. Ultrasound is most frequently used as a preprocedural tool,11 but can also beused to guide the epidural or spinal needle in real time during CNBs.14 Advantages of thepreprocedural scan include being able to accurately locate the midline,15 identify a givenlumbar interspace, predict the depth to the epidural space, detect any vertebral rotationaldefects (eg, in scoliosis), and identify patients with a potentially difficult CNB.11,16 In experthands the use of ultrasound for epidural needle insertion reduces the number of punctureattempts,17–22 improves the success rate of epidural access on the first attempt,18 reduces theneed to puncture multiple levels,18–20 and improves patient comfort during the procedure.19
This chapter briefly outlines the anatomy, the technique of ultrasound imaging, andsonoanatomy relevant for CNBs in the lumbar region.
Basic Lumbar Spine Anatomy
358
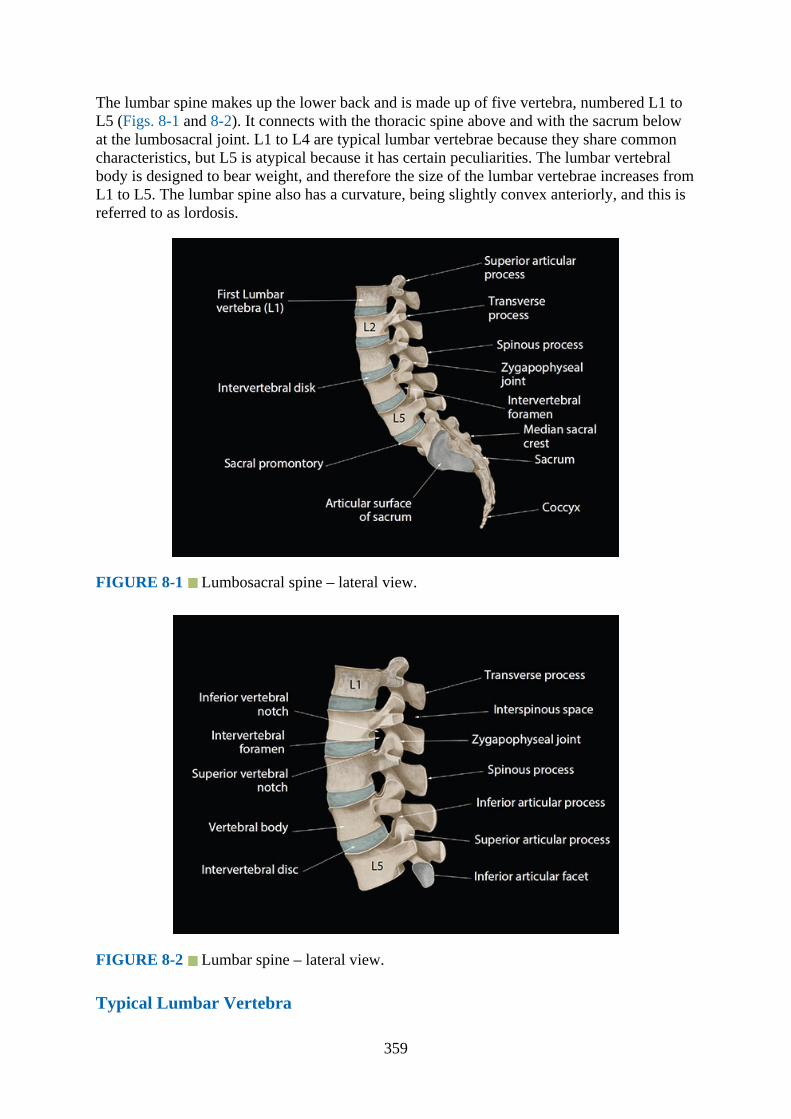
The lumbar spine makes up the lower back and is made up of five vertebra, numbered L1 toL5 (Figs. 8-1 and 8-2). It connects with the thoracic spine above and with the sacrum belowat the lumbosacral joint. L1 to L4 are typical lumbar vertebrae because they share commoncharacteristics, but L5 is atypical because it has certain peculiarities. The lumbar vertebralbody is designed to bear weight, and therefore the size of the lumbar vertebrae increases fromL1 to L5. The lumbar spine also has a curvature, being slightly convex anteriorly, and this isreferred to as lordosis.
FIGURE 8-1 Lumbosacral spine – lateral view.
FIGURE 8-2 Lumbar spine – lateral view.
Typical Lumbar Vertebra
359
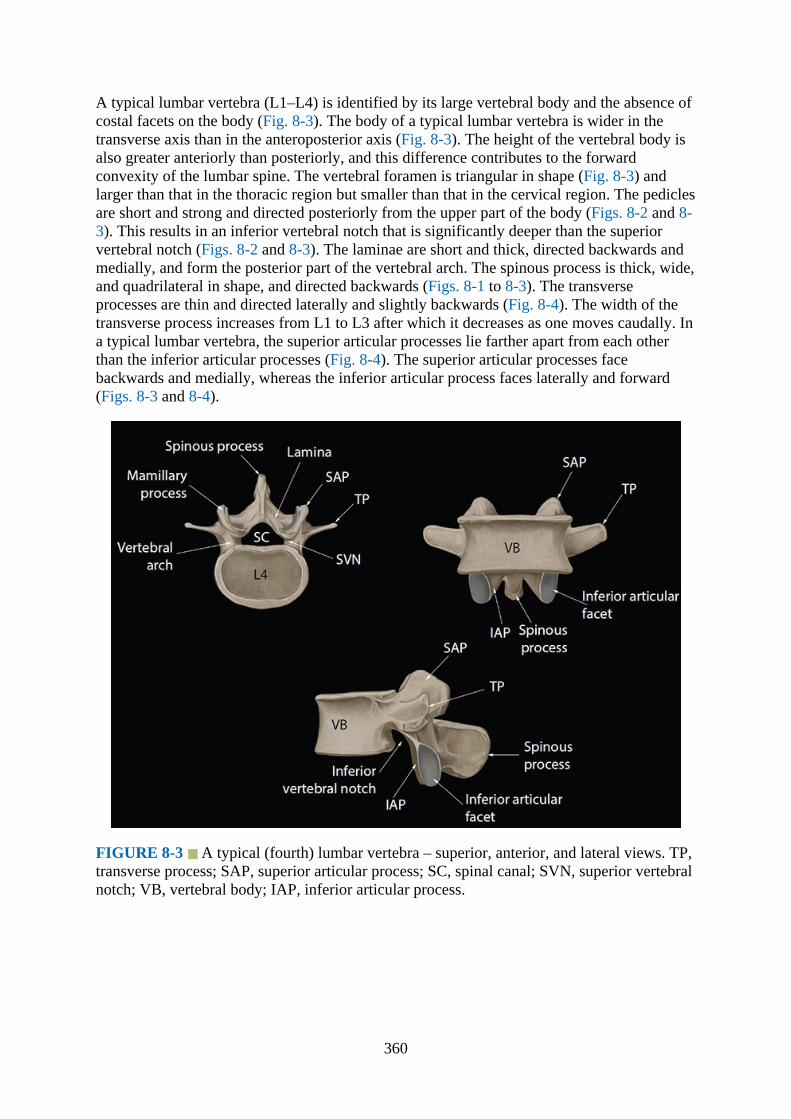
A typical lumbar vertebra (L1–L4) is identified by its large vertebral body and the absence ofcostal facets on the body (Fig. 8-3). The body of a typical lumbar vertebra is wider in thetransverse axis than in the anteroposterior axis (Fig. 8-3). The height of the vertebral body isalso greater anteriorly than posteriorly, and this difference contributes to the forwardconvexity of the lumbar spine. The vertebral foramen is triangular in shape (Fig. 8-3) andlarger than that in the thoracic region but smaller than that in the cervical region. The pediclesare short and strong and directed posteriorly from the upper part of the body (Figs. 8-2 and 8-3). This results in an inferior vertebral notch that is significantly deeper than the superiorvertebral notch (Figs. 8-2 and 8-3). The laminae are short and thick, directed backwards andmedially, and form the posterior part of the vertebral arch. The spinous process is thick, wide,and quadrilateral in shape, and directed backwards (Figs. 8-1 to 8-3). The transverseprocesses are thin and directed laterally and slightly backwards (Fig. 8-4). The width of thetransverse process increases from L1 to L3 after which it decreases as one moves caudally. Ina typical lumbar vertebra, the superior articular processes lie farther apart from each otherthan the inferior articular processes (Fig. 8-4). The superior articular processes facebackwards and medially, whereas the inferior articular process faces laterally and forward(Figs. 8-3 and 8-4).
FIGURE 8-3 A typical (fourth) lumbar vertebra – superior, anterior, and lateral views. TP,transverse process; SAP, superior articular process; SC, spinal canal; SVN, superior vertebralnotch; VB, vertebral body; IAP, inferior articular process.
360
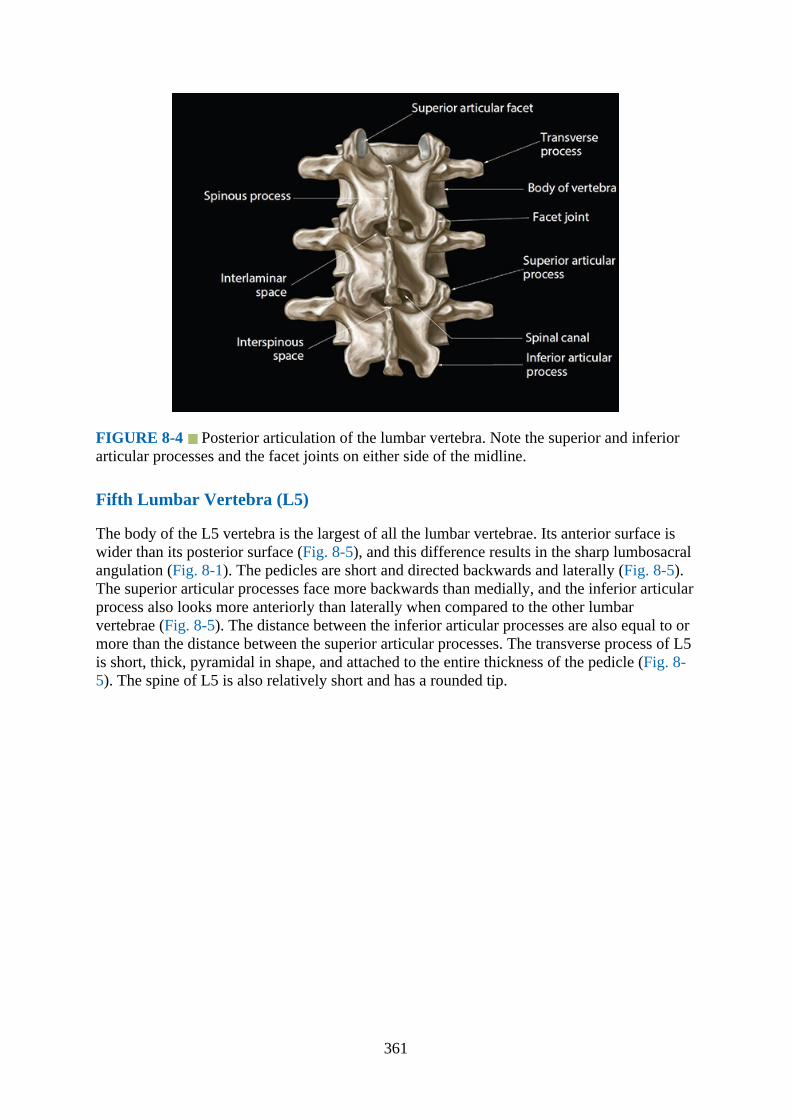
FIGURE 8-4 Posterior articulation of the lumbar vertebra. Note the superior and inferiorarticular processes and the facet joints on either side of the midline.
Fifth Lumbar Vertebra (L5)
The body of the L5 vertebra is the largest of all the lumbar vertebrae. Its anterior surface iswider than its posterior surface (Fig. 8-5), and this difference results in the sharp lumbosacralangulation (Fig. 8-1). The pedicles are short and directed backwards and laterally (Fig. 8-5).The superior articular processes face more backwards than medially, and the inferior articularprocess also looks more anteriorly than laterally when compared to the other lumbarvertebrae (Fig. 8-5). The distance between the inferior articular processes are also equal to ormore than the distance between the superior articular processes. The transverse process of L5is short, thick, pyramidal in shape, and attached to the entire thickness of the pedicle (Fig. 8-5). The spine of L5 is also relatively short and has a rounded tip.
361
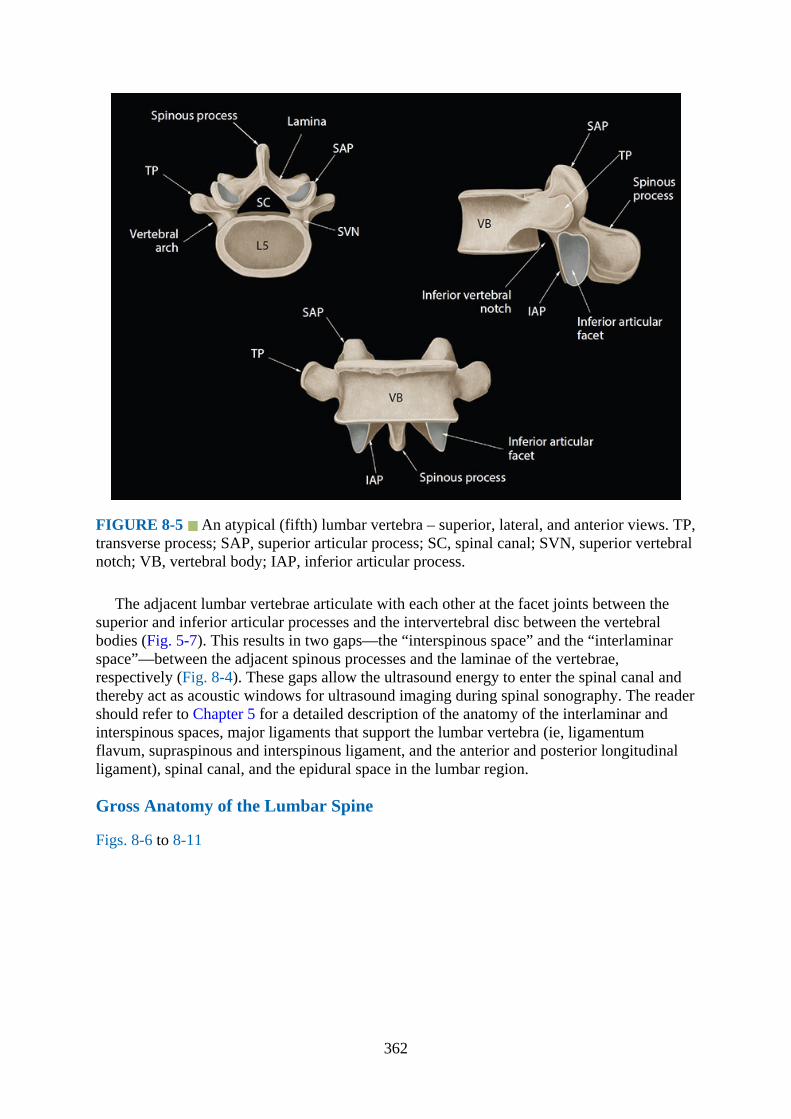
FIGURE 8-5 An atypical (fifth) lumbar vertebra – superior, lateral, and anterior views. TP,transverse process; SAP, superior articular process; SC, spinal canal; SVN, superior vertebralnotch; VB, vertebral body; IAP, inferior articular process.
The adjacent lumbar vertebrae articulate with each other at the facet joints between thesuperior and inferior articular processes and the intervertebral disc between the vertebralbodies (Fig. 5-7). This results in two gaps—the “interspinous space” and the “interlaminarspace”—between the adjacent spinous processes and the laminae of the vertebrae,respectively (Fig. 8-4). These gaps allow the ultrasound energy to enter the spinal canal andthereby act as acoustic windows for ultrasound imaging during spinal sonography. The readershould refer to Chapter 5 for a detailed description of the anatomy of the interlaminar andinterspinous spaces, major ligaments that support the lumbar vertebra (ie, ligamentumflavum, supraspinous and interspinous ligament, and the anterior and posterior longitudinalligament), spinal canal, and the epidural space in the lumbar region.
Gross Anatomy of the Lumbar Spine
Figs. 8-6 to 8-11
362
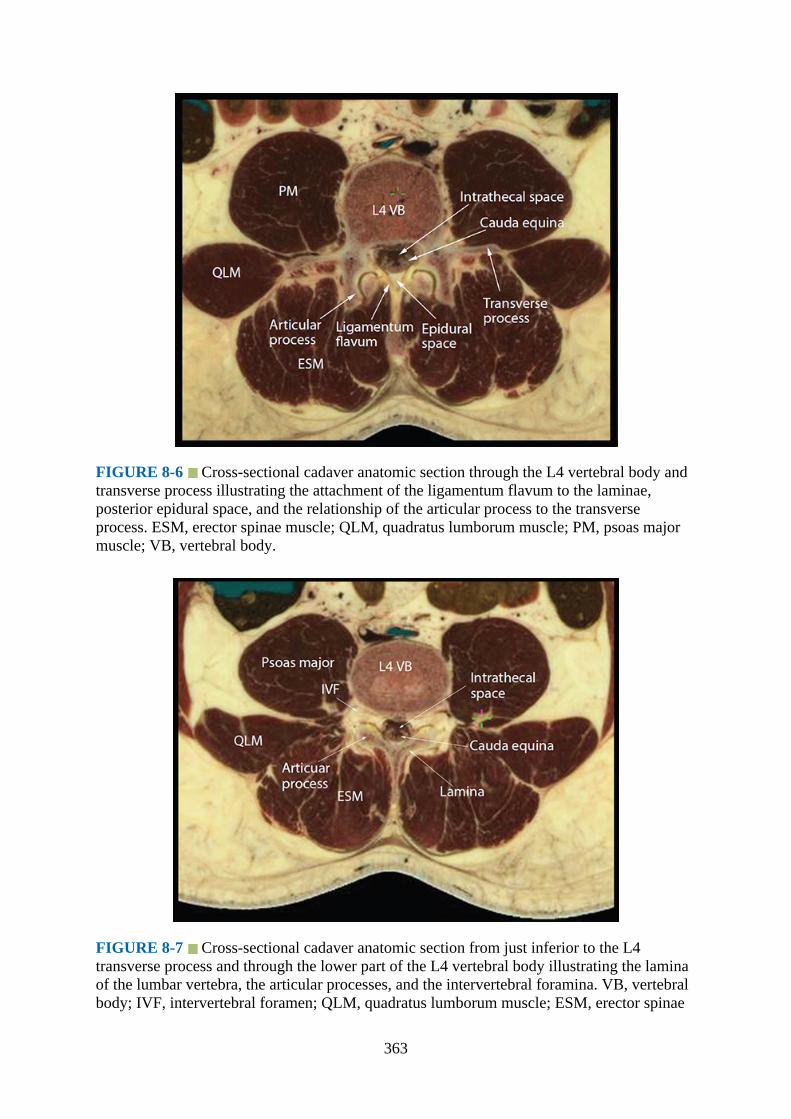
FIGURE 8-6 Cross-sectional cadaver anatomic section through the L4 vertebral body andtransverse process illustrating the attachment of the ligamentum flavum to the laminae,posterior epidural space, and the relationship of the articular process to the transverseprocess. ESM, erector spinae muscle; QLM, quadratus lumborum muscle; PM, psoas majormuscle; VB, vertebral body.
FIGURE 8-7 Cross-sectional cadaver anatomic section from just inferior to the L4transverse process and through the lower part of the L4 vertebral body illustrating the laminaof the lumbar vertebra, the articular processes, and the intervertebral foramina. VB, vertebralbody; IVF, intervertebral foramen; QLM, quadratus lumborum muscle; ESM, erector spinae
363

muscle.
FIGURE 8-8 Median sagittal cadaver anatomic section of the lumbar spine showing thespinous processes (L3–L5), interspinous spaces, ligamentum flavum, posterior epiduralspace, and the thecal sac. Also note the cauda equina (CE) within the thecal sac. ITS,intrathecal sac; VB, vertebral body.
FIGURE 8-9 Paramedian sagittal cadaver anatomic section of the lumbar spine at the levelof the lamina. The laminae have been shaded in green, and a graphic overlay has been placedover the L3 lamina to illustrate the horse head–like appearance of the lamina of the lumbarvertebra. ESM, erector spinae muscle; ILS, interlaminar space; ITS, intrathecal space; VB,
364

vertebral body; IVD, intervertebral disc.
FIGURE 8-10 Paramedian sagittal cadaver anatomic section of the lumbar spine at thelevel of the articular processes. A graphic overlay has been placed over the articularprocesses of the L4 vertebra to illustrate the camel hump–like appearance formed by thearticulations of the superior and inferior articular processes and the facet joints. VB, vertebralbody.
FIGURE 8-11 Paramedian sagittal cadaver anatomic section of the lumbar spine at thelevel of the transverse processes. Note the large fleshy muscle (ie, the psoas major muscle)lying anterior to the transverse processes. Also the lumbar plexus nerves can be identifiedwithin the substance of the psoas muscle. ESM, erector spinae muscle; TP, transverseprocess; NR, nerve root.
365

Computed Tomography Anatomy of the Lumbar Spine
Figs. 8-12 to 8-18
FIGURE 8-12 Transverse CT image of the lumbar spine at the level of the spinousprocess. IVC, inferior vena cava; VB, vertebral body; ITS, intrathecal space; PM, psoasmajor muscle; QLM, quadratus lumborum muscle; ESM, erector spinae muscle.
FIGURE 8-13 Transverse CT image of the lumbar spine at the level of the articularprocess. IVC, inferior vena cava; VB, vertebral body; ESM, erector spinae muscle; ITS,intrathecal space; PM, psoas major muscle; QLM, quadratus lumborum muscle.
366

FIGURE 8-14 Median sagittal CT image of the lumbosacral spine. Note the L5 to S1 gapbetween the spinous processes of L5 and S1 vertebra posteriorly. SP, spinous process; VB,vertebral body.
FIGURE 8-15 Paramedian sagittal oblique (rendered) CT section of the lumbosacral spineat the level of the lamina. Note the wide interlaminar space (L5–S1 gap) between the laminaof L5 and the sacrum. ITS, intrathecal space; VB, vertebral body.
367
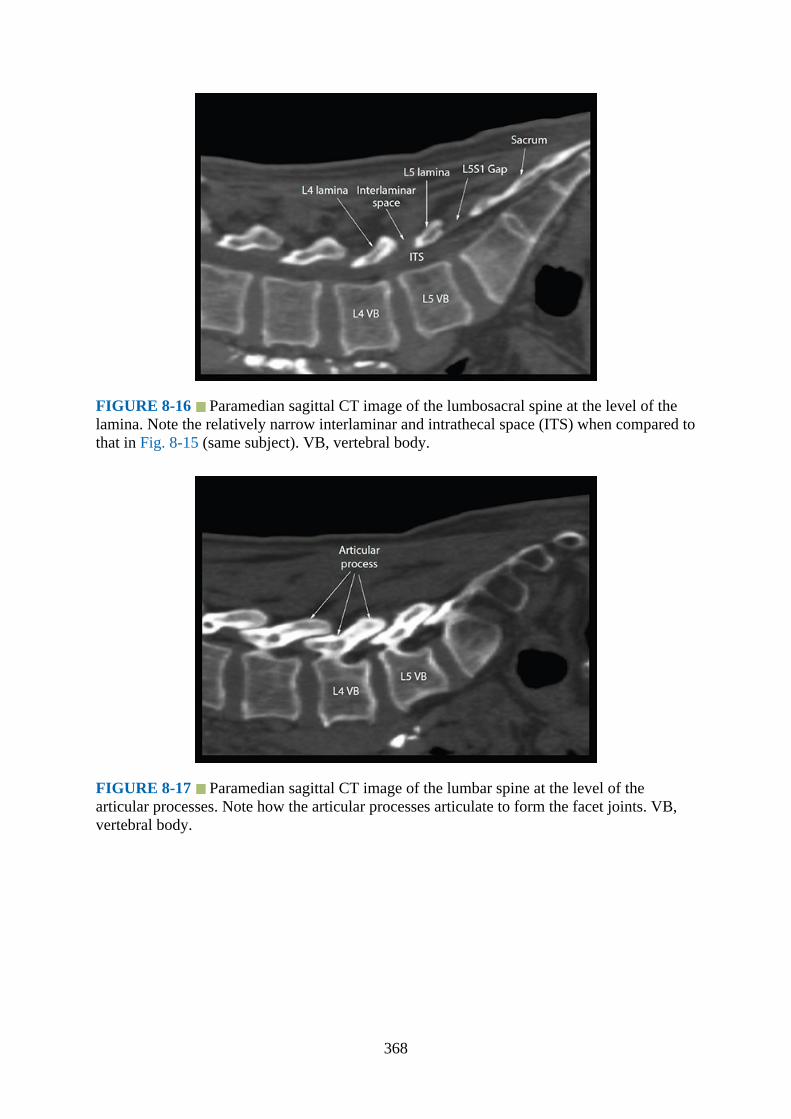
FIGURE 8-16 Paramedian sagittal CT image of the lumbosacral spine at the level of thelamina. Note the relatively narrow interlaminar and intrathecal space (ITS) when compared tothat in Fig. 8-15 (same subject). VB, vertebral body.
FIGURE 8-17 Paramedian sagittal CT image of the lumbar spine at the level of thearticular processes. Note how the articular processes articulate to form the facet joints. VB,vertebral body.
368

FIGURE 8-18 Paramedian sagittal CT image of the lumbosacral spine at the level of thetransverse processes. TP, transverse process; NR, nerve root.
Magnetic Resonance Imaging Anatomy of the Lumbar Spine
Figs. 8-19 to 8-26
FIGURE 8-19 Transverse T1-weighted magnetic resonance image of the lumbar spinethrough the interspinous space. Note the attachment of the ligamentum flavum to the laminaeand the wide posterior epidural space. IVC, inferior vena cava; PM, psoas major muscle; VB,vertebral body; QLM, quadratus lumborum muscle; ESM, erector spinae muscle; ITS,intrathecal space.
369
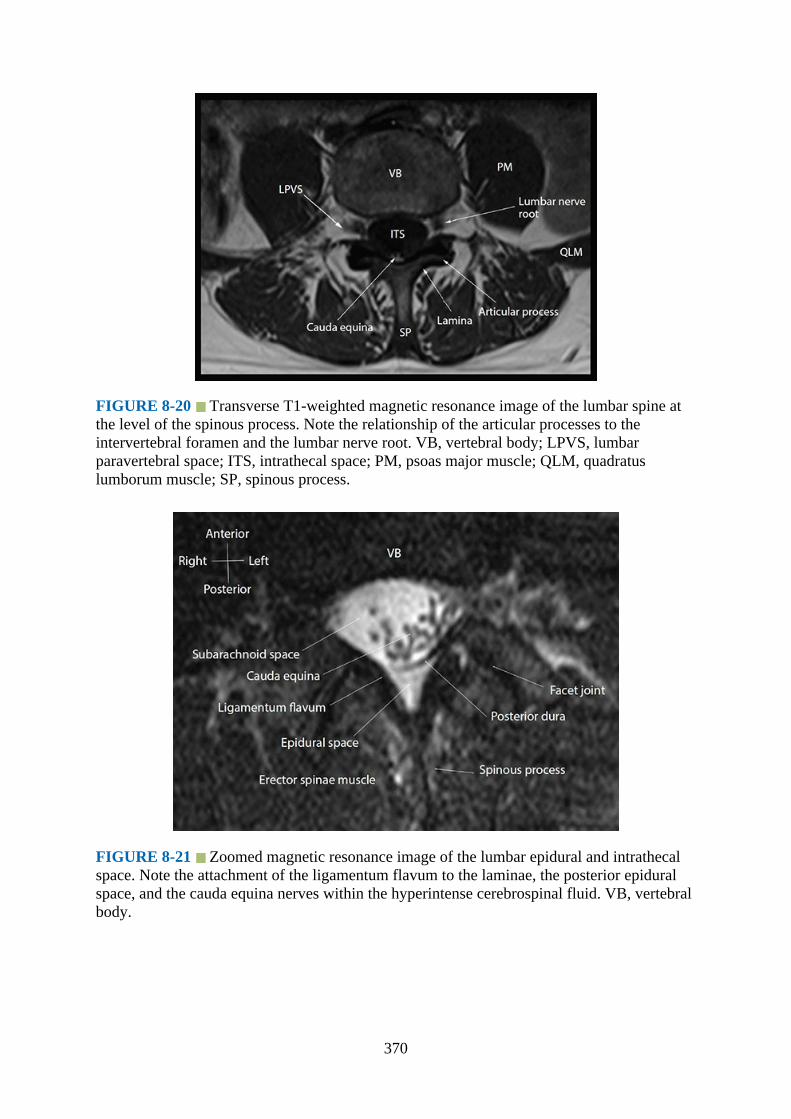
FIGURE 8-20 Transverse T1-weighted magnetic resonance image of the lumbar spine atthe level of the spinous process. Note the relationship of the articular processes to theintervertebral foramen and the lumbar nerve root. VB, vertebral body; LPVS, lumbarparavertebral space; ITS, intrathecal space; PM, psoas major muscle; QLM, quadratuslumborum muscle; SP, spinous process.
FIGURE 8-21 Zoomed magnetic resonance image of the lumbar epidural and intrathecalspace. Note the attachment of the ligamentum flavum to the laminae, the posterior epiduralspace, and the cauda equina nerves within the hyperintense cerebrospinal fluid. VB, vertebralbody.
370
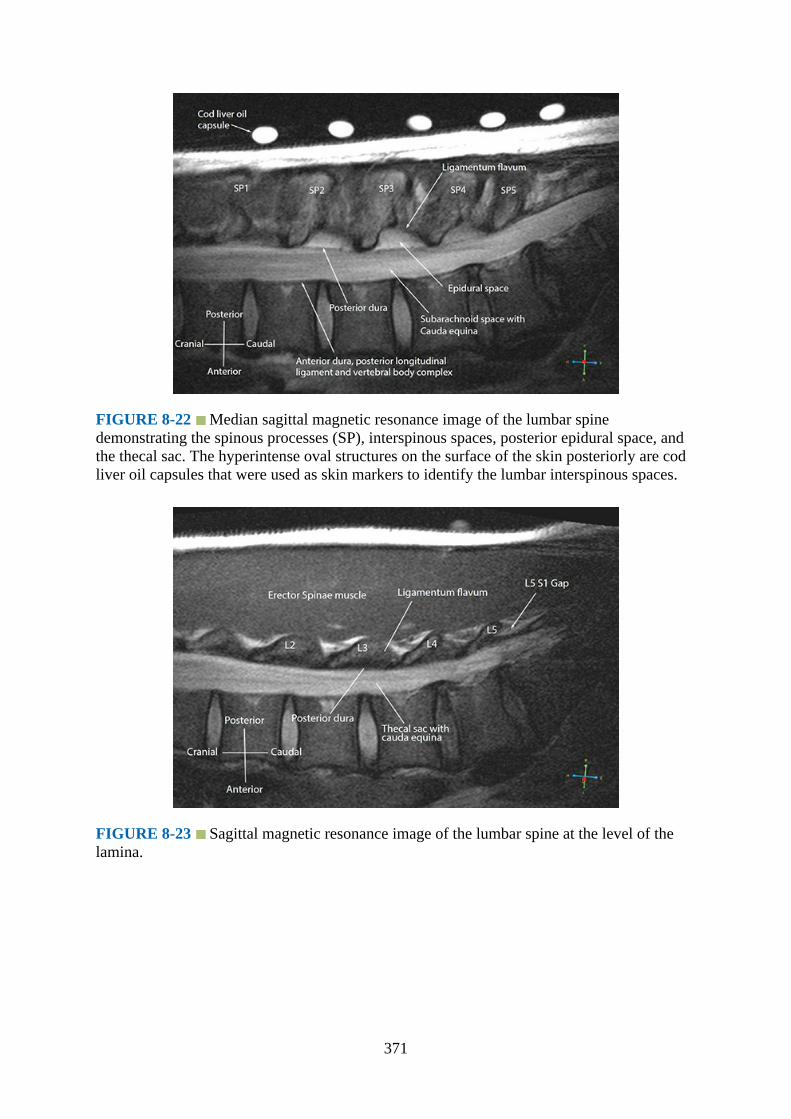
FIGURE 8-22 Median sagittal magnetic resonance image of the lumbar spinedemonstrating the spinous processes (SP), interspinous spaces, posterior epidural space, andthe thecal sac. The hyperintense oval structures on the surface of the skin posteriorly are codliver oil capsules that were used as skin markers to identify the lumbar interspinous spaces.
FIGURE 8-23 Sagittal magnetic resonance image of the lumbar spine at the level of thelamina.
371

FIGURE 8-24 Sagittal oblique (rendered) T1-weighted magnetic resonance image of thelumbar spine at the level of the lamina. Note the wide interlaminar and intrathecal spaceswhen compared to that in Fig. 8-23 (same subject).
FIGURE 8-25 Sagittal magnetic resonance image of the lumbosacral spine at the level ofthe lumbar articular processes. VB, vertebral body. IVD, intervertebral disc.
372
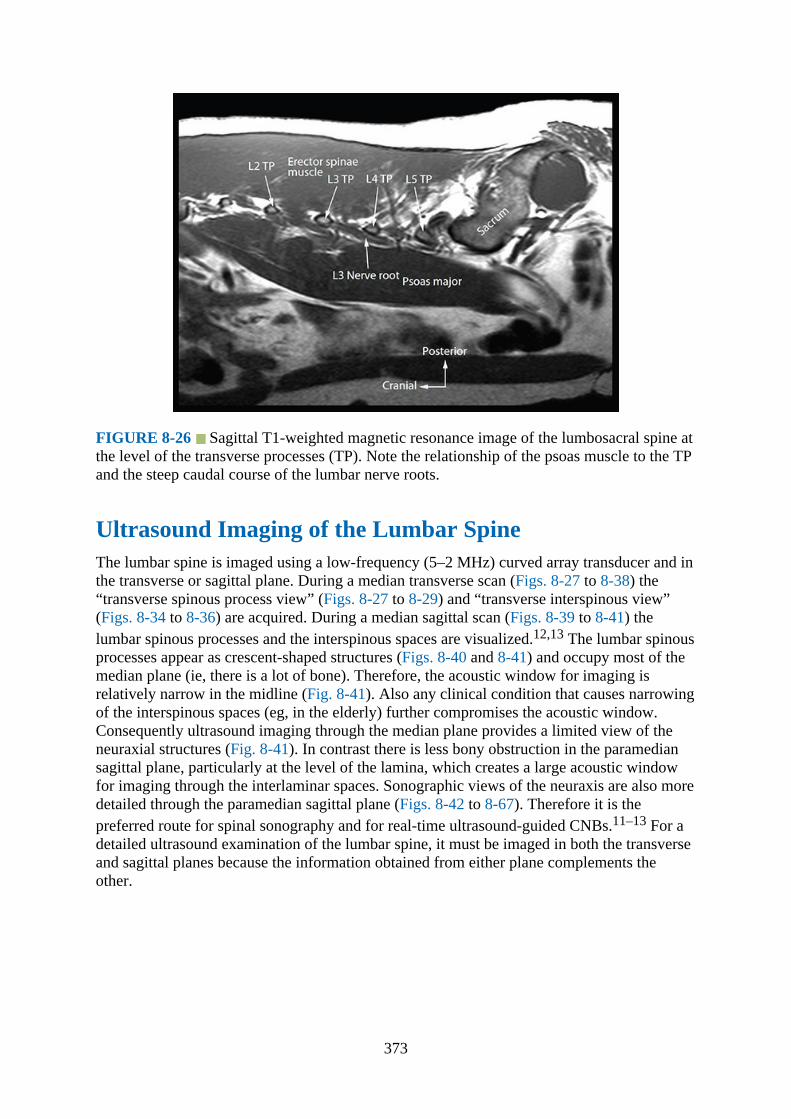
FIGURE 8-26 Sagittal T1-weighted magnetic resonance image of the lumbosacral spine atthe level of the transverse processes (TP). Note the relationship of the psoas muscle to the TPand the steep caudal course of the lumbar nerve roots.
Ultrasound Imaging of the Lumbar SpineThe lumbar spine is imaged using a low-frequency (5–2 MHz) curved array transducer and inthe transverse or sagittal plane. During a median transverse scan (Figs. 8-27 to 8-38) the“transverse spinous process view” (Figs. 8-27 to 8-29) and “transverse interspinous view”(Figs. 8-34 to 8-36) are acquired. During a median sagittal scan (Figs. 8-39 to 8-41) thelumbar spinous processes and the interspinous spaces are visualized.12,13 The lumbar spinousprocesses appear as crescent-shaped structures (Figs. 8-40 and 8-41) and occupy most of themedian plane (ie, there is a lot of bone). Therefore, the acoustic window for imaging isrelatively narrow in the midline (Fig. 8-41). Also any clinical condition that causes narrowingof the interspinous spaces (eg, in the elderly) further compromises the acoustic window.Consequently ultrasound imaging through the median plane provides a limited view of theneuraxial structures (Fig. 8-41). In contrast there is less bony obstruction in the paramediansagittal plane, particularly at the level of the lamina, which creates a large acoustic windowfor imaging through the interlaminar spaces. Sonographic views of the neuraxis are also moredetailed through the paramedian sagittal plane (Figs. 8-42 to 8-67). Therefore it is thepreferred route for spinal sonography and for real-time ultrasound-guided CNBs.11–13 For adetailed ultrasound examination of the lumbar spine, it must be imaged in both the transverseand sagittal planes because the information obtained from either plane complements theother.
373

FIGURE 8-27 Position and orientation of the ultrasound transducer during a transversescan of the lumbar spine with the subject in the lateral position.
FIGURE 8-28 Transverse sonogram of the lumbar spine with the transducer positioneddirectly over the lumbar spinous process (ie, the transverse spinous process view). Note theacoustic shadow of the spinous process and lamina completely obscures the spinal canal andthe neuraxial structures. SP, spinous process; ESM, erector spinae muscle.
374
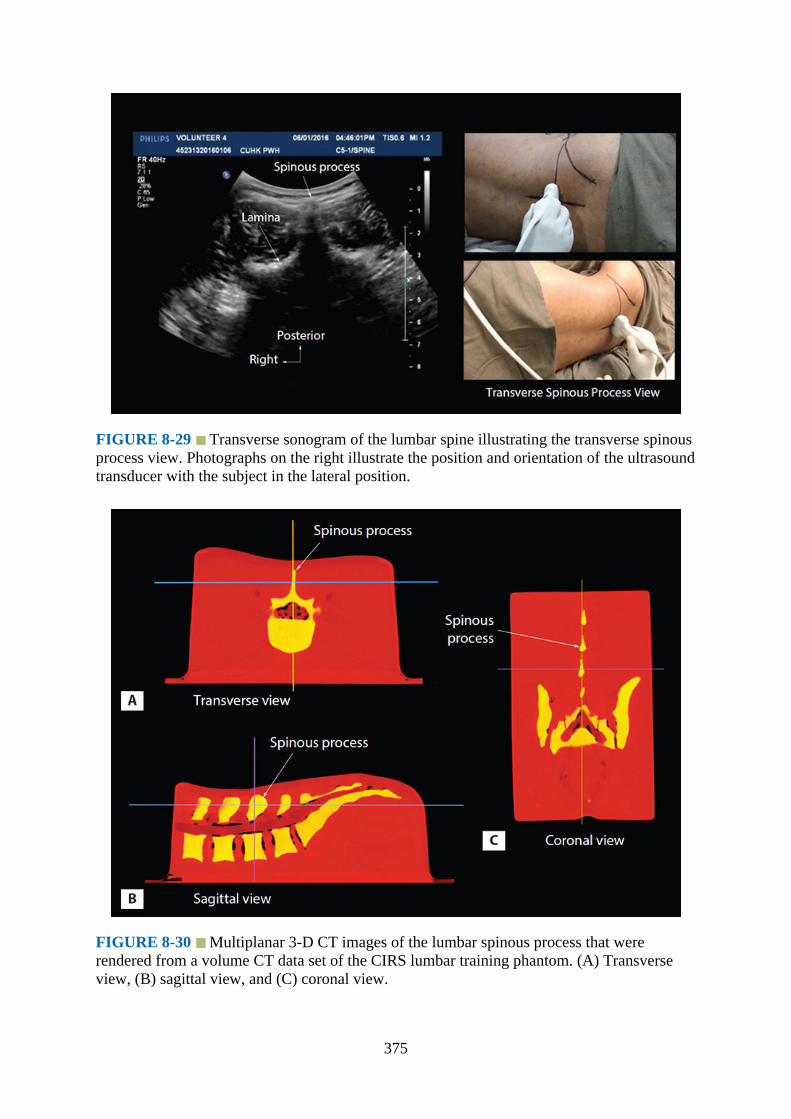
FIGURE 8-29 Transverse sonogram of the lumbar spine illustrating the transverse spinousprocess view. Photographs on the right illustrate the position and orientation of the ultrasoundtransducer with the subject in the lateral position.
FIGURE 8-30 Multiplanar 3-D CT images of the lumbar spinous process that wererendered from a volume CT data set of the CIRS lumbar training phantom. (A) Transverseview, (B) sagittal view, and (C) coronal view.
375

FIGURE 8-31 Correlative transverse (A) CT, (B) ultrasound, (C) cadaver anatomic, and(D) MRI images of the lumbar spinous process and lamina. SP, spinous process; SC, spinalcanal; VB, vertebral body; ESM, erector spinae muscle; QLM, quadratus lumborum muscle;PM, psoas major muscle; ITS, intrathecal space; PD, posterior dura; CE, cauda equina; ITS,intrathecal space.
FIGURE 8-32 Multiplanar 3-D ultrasound images of the lumbar spinous process with thereference marker (white crosshair) placed over the tip of the spinous process. (A) Transverse
376
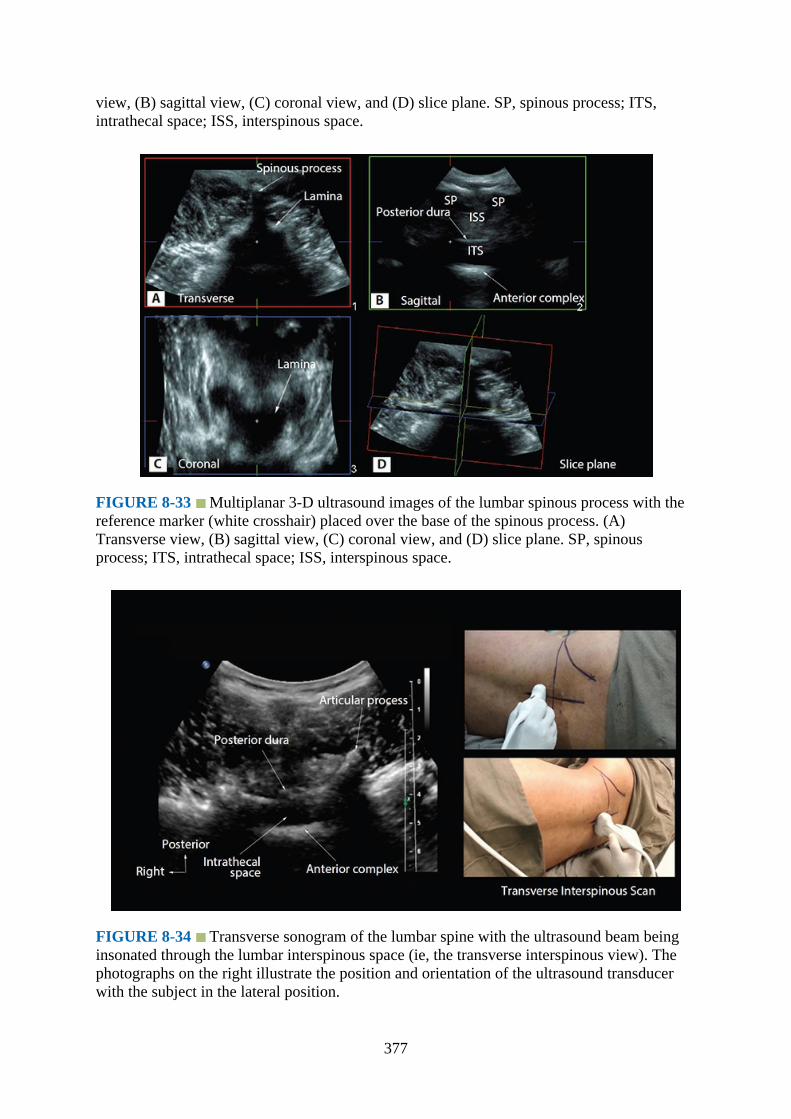
view, (B) sagittal view, (C) coronal view, and (D) slice plane. SP, spinous process; ITS,intrathecal space; ISS, interspinous space.
FIGURE 8-33 Multiplanar 3-D ultrasound images of the lumbar spinous process with thereference marker (white crosshair) placed over the base of the spinous process. (A)Transverse view, (B) sagittal view, (C) coronal view, and (D) slice plane. SP, spinousprocess; ITS, intrathecal space; ISS, interspinous space.
FIGURE 8-34 Transverse sonogram of the lumbar spine with the ultrasound beam beinginsonated through the lumbar interspinous space (ie, the transverse interspinous view). Thephotographs on the right illustrate the position and orientation of the ultrasound transducerwith the subject in the lateral position.
377

FIGURE 8-35 Transverse sonogram of the lumbar spine – coned (zoomed) transverseinterspinous view. The epidural space, posterior dura, intrathecal space, and the anteriorcomplex are visible in the midline, and the articular process (AP) is visible laterally on eitherside of the midline. Note how the articular processes on either side are symmetrically located.
FIGURE 8-36 Transverse sonogram of the lumbar spine – transverse interspinous view.Note the posterior epidural space is clearly delineated in this sonogram. ESM, erector spinaemuscle; ITS, intrathecal space; VB, vertebral body.
378

FIGURE 8-37 Multiplanar 3-D CT images of the lumbar spine that were rendered from avolume CT data set of the CIRS lumbar training phantom. The reference marker (crosshair)has been placed at the L3 to L4 interspinous space. (A) Sagittal view, (B) transverse view,and (C) coronal view.
379

FIGURE 8-38 Correlative transverse (A) CT, (B) ultrasound, (C) cadaver anatomic, and(D) high-definition coned (zoomed) ultrasound images of the lumbar interspinous view. Notehow the inferior and superior articular processes of the vertebrae make up the facet joints oneither side of the midline. TP, transverse process; FJ, facet joint; SC, spinal canal; IAP,inferior articular process; SAP, superior articular process; ESM, erector spinae muscle; ES,epidural space; ITS, intrathecal space; LF, ligamentum flavum; CE, cauda equina; PM, psoasmajor muscle; QLM, quadratus lumborum muscle; PD, posterior dura; AP, articular process;VB, vertebral body; AC, anterior complex; AD, anterior dura.
FIGURE 8-39 Position and orientation of the ultrasound transducer during a mediansagittal scan of the lumbar spine with the subject in the lateral position.
FIGURE 8-40 Median sagittal sonogram of the lumbar spine showing the crescent-shapedhyperechoic reflections of the spinous processes. The interspinous space is interposed
380
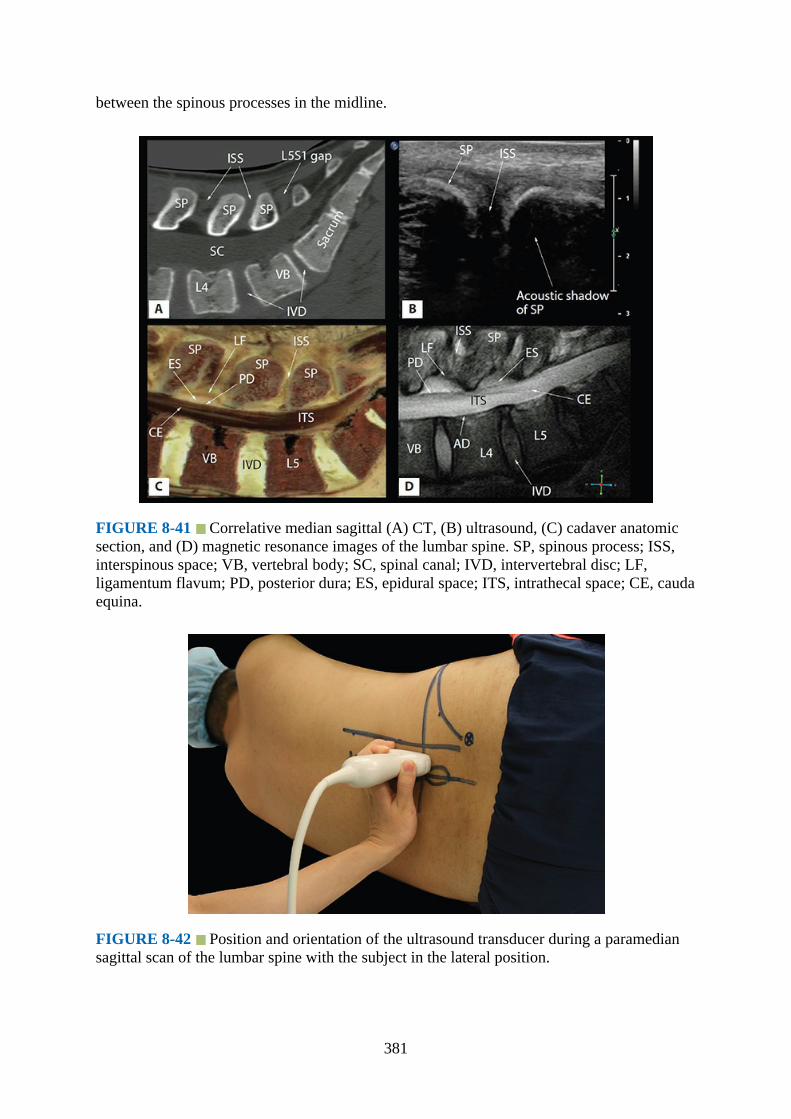
between the spinous processes in the midline.
FIGURE 8-41 Correlative median sagittal (A) CT, (B) ultrasound, (C) cadaver anatomicsection, and (D) magnetic resonance images of the lumbar spine. SP, spinous process; ISS,interspinous space; VB, vertebral body; SC, spinal canal; IVD, intervertebral disc; LF,ligamentum flavum; PD, posterior dura; ES, epidural space; ITS, intrathecal space; CE, caudaequina.
FIGURE 8-42 Position and orientation of the ultrasound transducer during a paramediansagittal scan of the lumbar spine with the subject in the lateral position.
381

FIGURE 8-43 Paramedian sagittal sonogram of the lumbar spine. Note the narrowintrathecal space in this sonogram. ESM, erector spinae muscle.
FIGURE 8-44 Position and orientation of the ultrasound transducer during a paramediansagittal oblique scan of the lumbar spine with the subject in the lateral position.
382

FIGURE 8-45 Figure illustrating how to identify a given lumbar intervertebral space byperforming a paramedian sagittal scan. (A) Locate the L5 to S1 gap and (B) slide thetransducer cephalad until the lamina of L3, L4, and L5 are identified.
FIGURE 8-46 Paramedian sagittal sonogram of the lumbosacral junction. The dip or gapbetween the posterior surface of the sacrum and the lamina of L5 is the L5 to S1 gap. ESM,erector spinae muscle; LF, ligamentum flavum; ITS, intrathecal space. The photographs onthe right illustrate the position and orientation of the ultrasound transducer to locate the L5 toS1 gap with the subject in the lateral position.
383
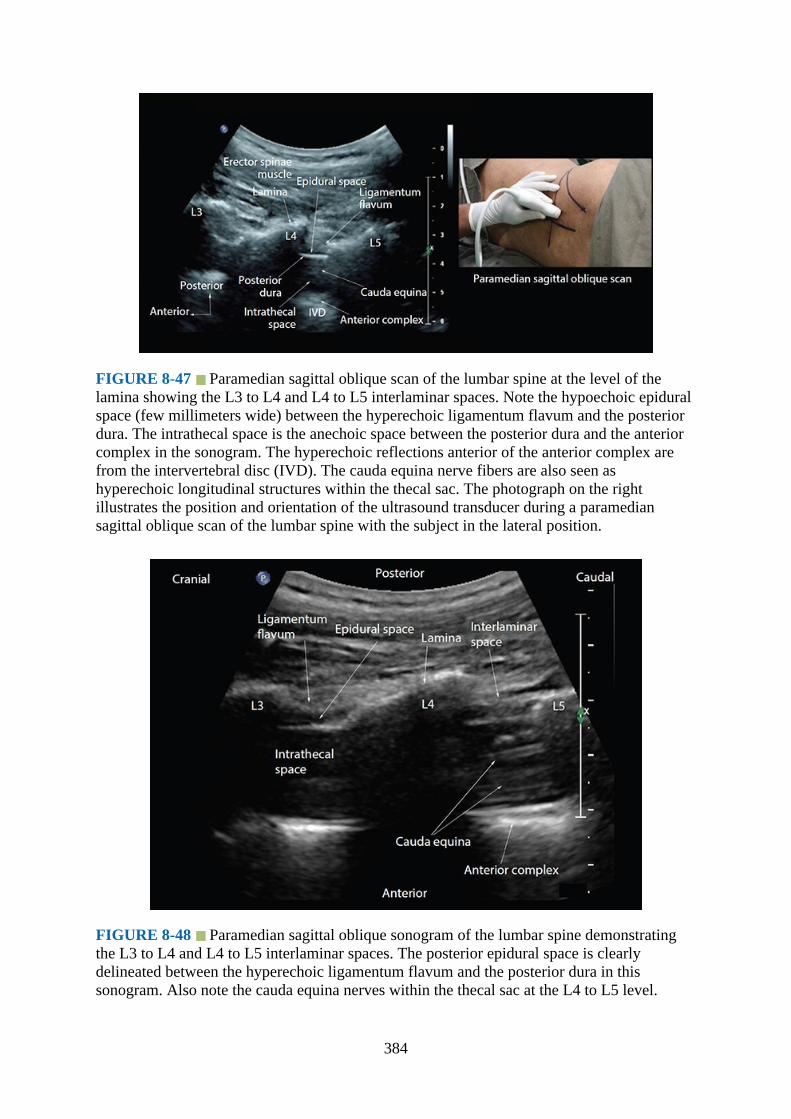
FIGURE 8-47 Paramedian sagittal oblique scan of the lumbar spine at the level of thelamina showing the L3 to L4 and L4 to L5 interlaminar spaces. Note the hypoechoic epiduralspace (few millimeters wide) between the hyperechoic ligamentum flavum and the posteriordura. The intrathecal space is the anechoic space between the posterior dura and the anteriorcomplex in the sonogram. The hyperechoic reflections anterior of the anterior complex arefrom the intervertebral disc (IVD). The cauda equina nerve fibers are also seen ashyperechoic longitudinal structures within the thecal sac. The photograph on the rightillustrates the position and orientation of the ultrasound transducer during a paramediansagittal oblique scan of the lumbar spine with the subject in the lateral position.
FIGURE 8-48 Paramedian sagittal oblique sonogram of the lumbar spine demonstratingthe L3 to L4 and L4 to L5 interlaminar spaces. The posterior epidural space is clearlydelineated between the hyperechoic ligamentum flavum and the posterior dura in thissonogram. Also note the cauda equina nerves within the thecal sac at the L4 to L5 level.
384

FIGURE 8-49 Paramedian sagittal oblique sonogram of the lumbar spine at the L3 to L5level demonstrating color Doppler signals from the vasculature within the erector spinaemuscle (ESM).
FIGURE 8-50 Panoramic view of a paramedian sagittal oblique scan of the lumbosacralspine.
385
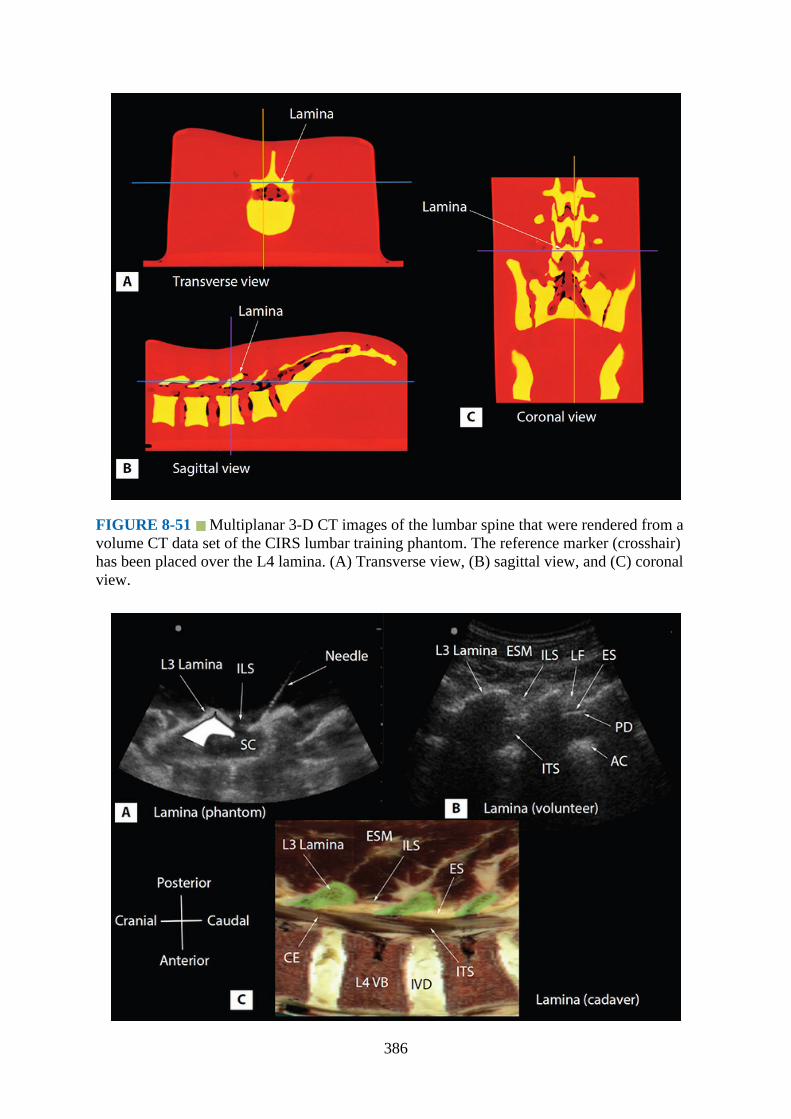
FIGURE 8-51 Multiplanar 3-D CT images of the lumbar spine that were rendered from avolume CT data set of the CIRS lumbar training phantom. The reference marker (crosshair)has been placed over the L4 lamina. (A) Transverse view, (B) sagittal view, and (C) coronalview.
386

FIGURE 8-52 Paramedian sagittal oblique sonogram of the lumbar spine at the level ofthe laminae (L3–L5) from (A) the water-based spine phantom and (B) volunteers and arepresentative anatomical section from (C) a representative cadaver anatomical section fromthe Visible Human Server. In the latter, the lamina has been shaded in green (C). Note themarker (needle) in contact with the lamina in the water-based spine phantom (A). This wasdone to ensure that the lamina was being scanned and also helped in validating itssonographic appearance. A graphic overlay has been placed over the lamina in (A) toillustrate the “horse head sign.” AC, anterior complex; CE, cauda equina; ES, epidural space;ESM, erector spinae muscle; ILS, interlaminar space; ITS, intrathecal space; IVD,intervertebral disc; LF, ligamentum flavum; PD, posterior dura; SC, spinal canal; VB,vertebral body.
FIGURE 8-53 Correlative paramedian sagittal (A) CT, (B) ultrasound, (C) cadaveranatomic section, and (D) magnetic resonance images of the lumbar spine. ILS, interlaminarspace; ESM, erector spinae muscle; ES, epidural space; SC, spinal canal; VB, vertebral body;IVD, intervertebral disc; LF, ligamentum flavum; ITS, intrathecal space; CE, cauda equina;PD, posterior dura; AC, anterior complex.
387
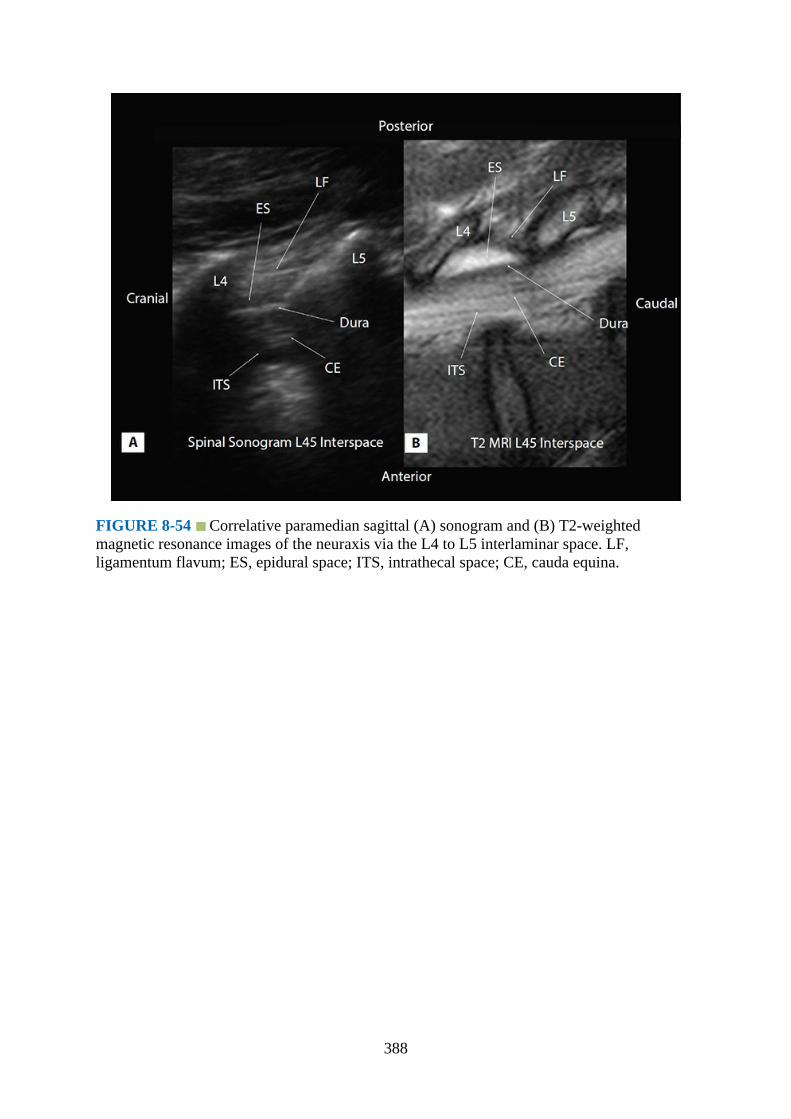
FIGURE 8-54 Correlative paramedian sagittal (A) sonogram and (B) T2-weightedmagnetic resonance images of the neuraxis via the L4 to L5 interlaminar space. LF,ligamentum flavum; ES, epidural space; ITS, intrathecal space; CE, cauda equina.
388
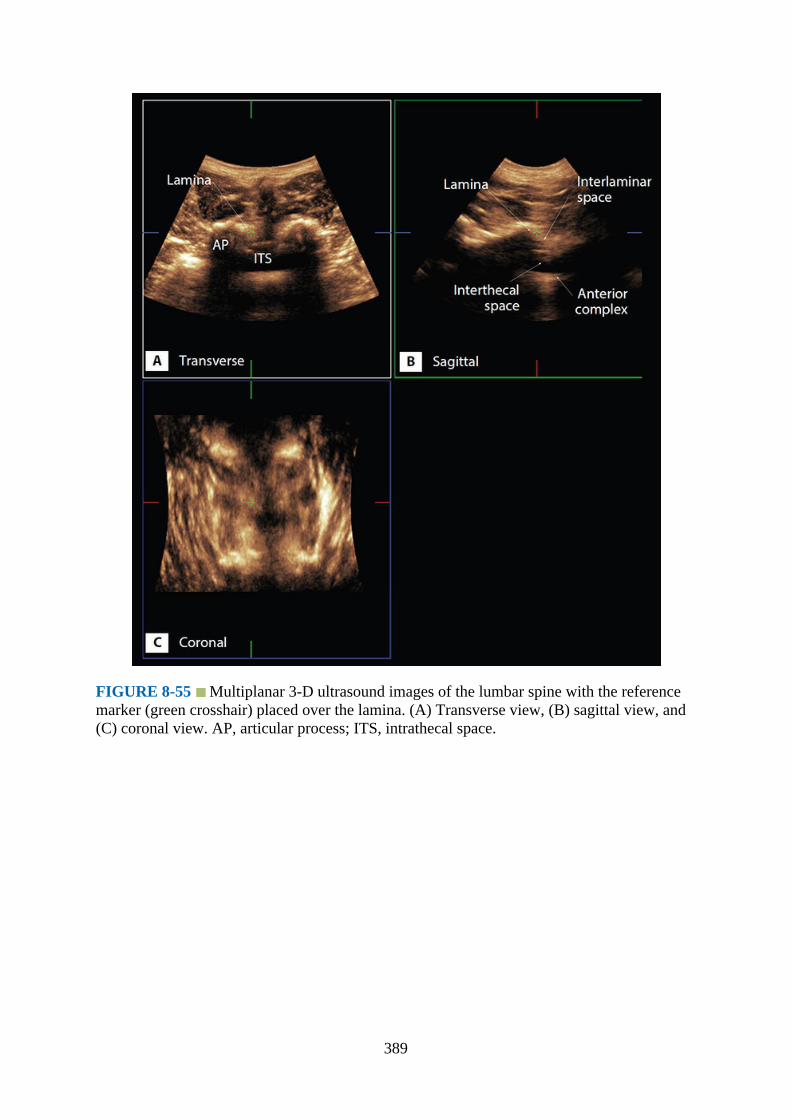
FIGURE 8-55 Multiplanar 3-D ultrasound images of the lumbar spine with the referencemarker (green crosshair) placed over the lamina. (A) Transverse view, (B) sagittal view, and(C) coronal view. AP, articular process; ITS, intrathecal space.
389

FIGURE 8-56 Paramedian sagittal sonogram of the lumbar spine showing the articularprocesses. The photographs on the right illustrate the position and orientation of theultrasound transducer during a paramedian sagittal scan of the lumbar spine at the level of thearticular processes of the vertebra with the subject in the lateral position.
FIGURE 8-57 Paramedian sagittal sonogram of the lumbar spine at the level of thearticular processes of the vertebra. A graphic overlay has been placed in this image toillustrate the camel hump–like appearance of the articular processes.
390

FIGURE 8-58 Multiplanar 3-D CT images of the lumbar spine that were rendered from avolume CT data set of the CIRS lumbar training phantom. The reference marker (crosshair)has been placed over the articular process (AP) of the L4 vertebra. (A) Sagittal view, (B)transverse view, and (C) coronal view.
391

FIGURE 8-59 Paramedian sagittal sonogram of the articular process from the (A) water-based spine phantom, (B) volunteer, and (C) a representative cadaver anatomical section. Agraphic overlay has been placed in (B) to illustrate the camel hump–like appearance of thearticular processes. AP, articular process; ESM, erector spinae muscle; FJ, facet joint; VB,vertebral body.
FIGURE 8-60 Correlative sagittal (A) CT, (B) ultrasound, (C) cadaver anatomic section,and (D) magnetic resonance images of the lumbar spine at the level of the articular processes(AP). IAP, inferior articular process; SAP, superior articular process; VB, vertebral body;IVD, intervertebral disc; ESM, erector spinae muscle; FJ, facet joint.
392
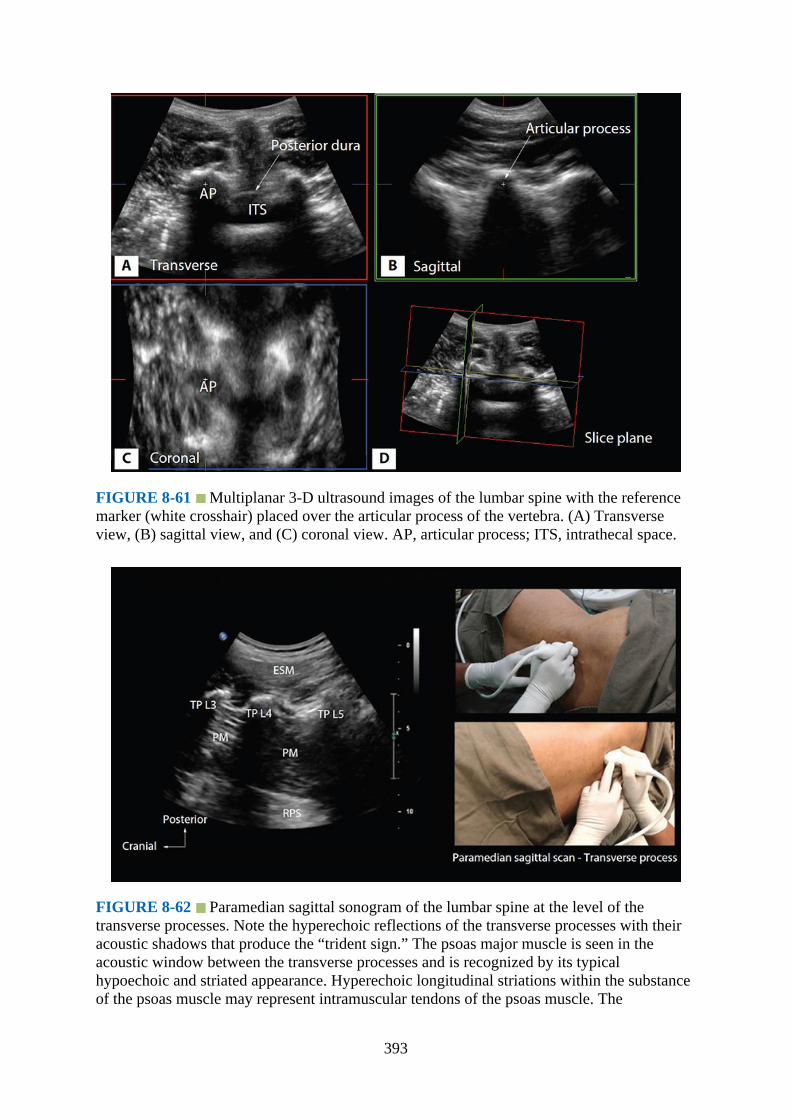
FIGURE 8-61 Multiplanar 3-D ultrasound images of the lumbar spine with the referencemarker (white crosshair) placed over the articular process of the vertebra. (A) Transverseview, (B) sagittal view, and (C) coronal view. AP, articular process; ITS, intrathecal space.
FIGURE 8-62 Paramedian sagittal sonogram of the lumbar spine at the level of thetransverse processes. Note the hyperechoic reflections of the transverse processes with theiracoustic shadows that produce the “trident sign.” The psoas major muscle is seen in theacoustic window between the transverse processes and is recognized by its typicalhypoechoic and striated appearance. Hyperechoic longitudinal striations within the substanceof the psoas muscle may represent intramuscular tendons of the psoas muscle. The
393

photographs on the right illustrate the position and orientation of the ultrasound transducerduring a paramedian sagittal scan of the lumbar spine at the level of the transverse processesof the vertebra with the subject in the lateral position. ESM, erector spinae muscle; TP,transverse process; PM, psoas major muscle; RPS, retroperitoneal space.
FIGURE 8-63 Paramedian sagittal sonogram of the lumbar spine at the level of thetransverse processes. The acoustic shadows of the transverse processes produce the “tridentsign.” In this sonogram the lumbar plexus is visualized as a hyperechoic shadow in theposterior part of the psoas muscle between the L3 and L4 transverse process (TP).Intramuscular tendons of the psoas muscle are also seen within the substance of the psoasmuscle and should not to be confused with the lumbar plexus nerves. ESM, erector spinaemuscle.
394
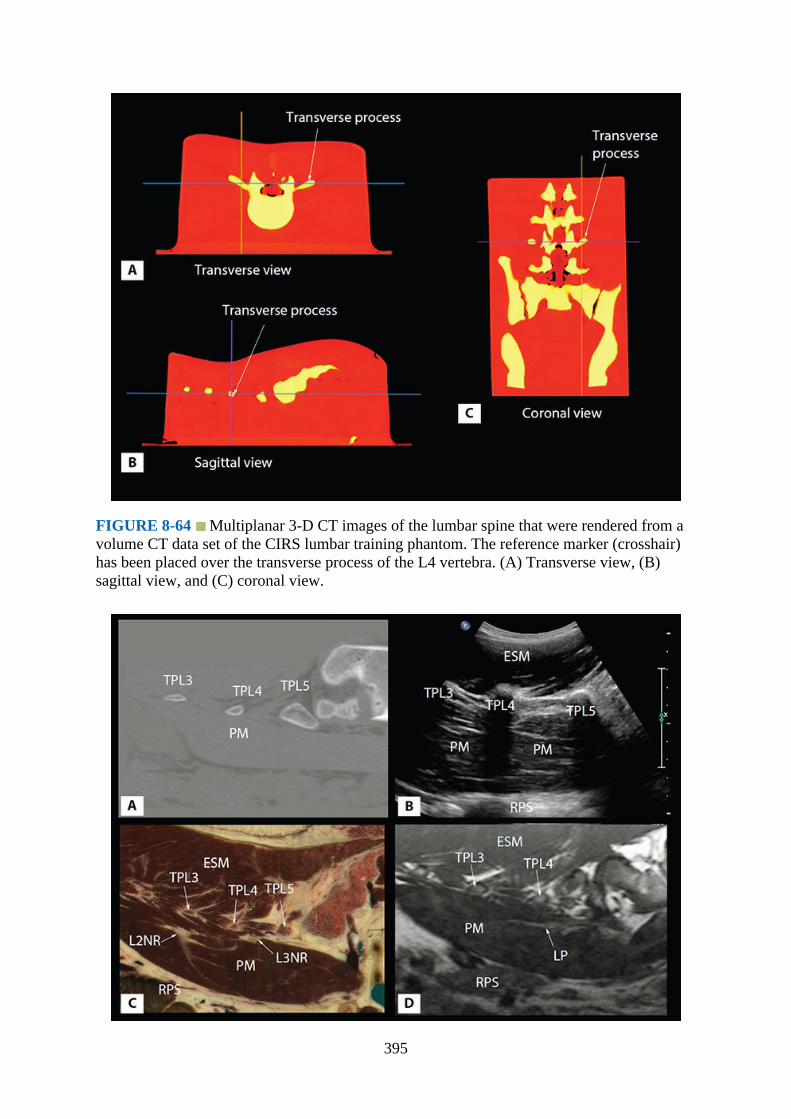
FIGURE 8-64 Multiplanar 3-D CT images of the lumbar spine that were rendered from avolume CT data set of the CIRS lumbar training phantom. The reference marker (crosshair)has been placed over the transverse process of the L4 vertebra. (A) Transverse view, (B)sagittal view, and (C) coronal view.
395
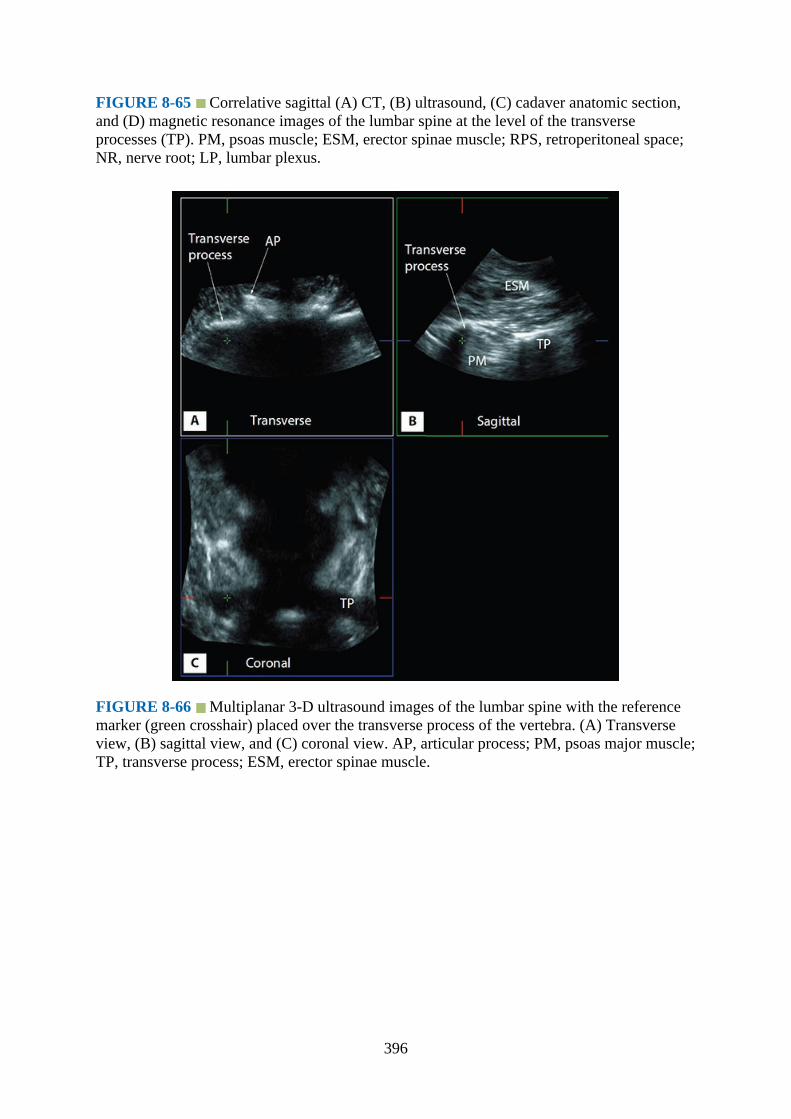
FIGURE 8-65 Correlative sagittal (A) CT, (B) ultrasound, (C) cadaver anatomic section,and (D) magnetic resonance images of the lumbar spine at the level of the transverseprocesses (TP). PM, psoas muscle; ESM, erector spinae muscle; RPS, retroperitoneal space;NR, nerve root; LP, lumbar plexus.
FIGURE 8-66 Multiplanar 3-D ultrasound images of the lumbar spine with the referencemarker (green crosshair) placed over the transverse process of the vertebra. (A) Transverseview, (B) sagittal view, and (C) coronal view. AP, articular process; PM, psoas major muscle;TP, transverse process; ESM, erector spinae muscle.
396
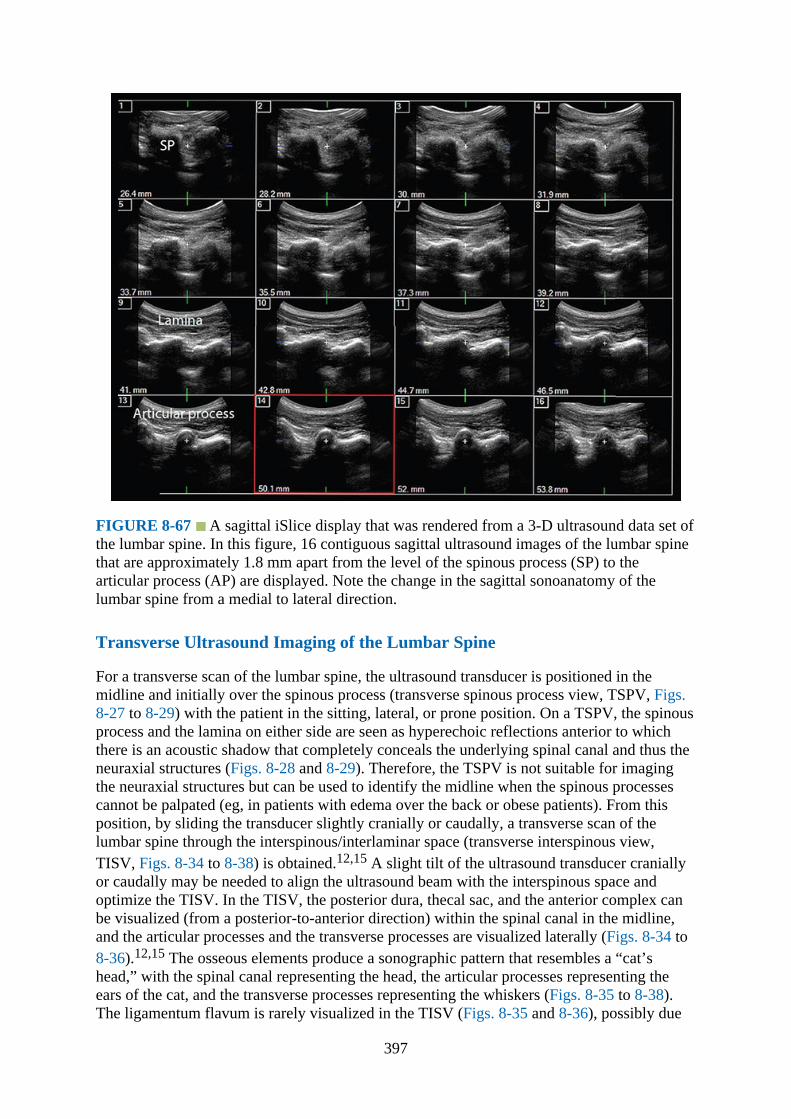
FIGURE 8-67 A sagittal iSlice display that was rendered from a 3-D ultrasound data set ofthe lumbar spine. In this figure, 16 contiguous sagittal ultrasound images of the lumbar spinethat are approximately 1.8 mm apart from the level of the spinous process (SP) to thearticular process (AP) are displayed. Note the change in the sagittal sonoanatomy of thelumbar spine from a medial to lateral direction.
Transverse Ultrasound Imaging of the Lumbar Spine
For a transverse scan of the lumbar spine, the ultrasound transducer is positioned in themidline and initially over the spinous process (transverse spinous process view, TSPV, Figs.8-27 to 8-29) with the patient in the sitting, lateral, or prone position. On a TSPV, the spinousprocess and the lamina on either side are seen as hyperechoic reflections anterior to whichthere is an acoustic shadow that completely conceals the underlying spinal canal and thus theneuraxial structures (Figs. 8-28 and 8-29). Therefore, the TSPV is not suitable for imagingthe neuraxial structures but can be used to identify the midline when the spinous processescannot be palpated (eg, in patients with edema over the back or obese patients). From thisposition, by sliding the transducer slightly cranially or caudally, a transverse scan of thelumbar spine through the interspinous/interlaminar space (transverse interspinous view,TISV, Figs. 8-34 to 8-38) is obtained.12,15 A slight tilt of the ultrasound transducer craniallyor caudally may be needed to align the ultrasound beam with the interspinous space andoptimize the TISV. In the TISV, the posterior dura, thecal sac, and the anterior complex canbe visualized (from a posterior-to-anterior direction) within the spinal canal in the midline,and the articular processes and the transverse processes are visualized laterally (Figs. 8-34 to8-36).12,15 The osseous elements produce a sonographic pattern that resembles a “cat’shead,” with the spinal canal representing the head, the articular processes representing theears of the cat, and the transverse processes representing the whiskers (Figs. 8-35 to 8-38).The ligamentum flavum is rarely visualized in the TISV (Figs. 8-35 and 8-36), possibly due
397

to anisotropy caused by the archlike attachment of the ligamentum flavum to the lamina (Fig.8-38). The epidural space is also less frequently visualized in the TISV (Fig. 8-6) than in theparamedian sagittal oblique scan (PMSOS). In the TISV the depth of the posterior dura fromthe skin can be easily measured using the internal caliper of the ultrasound system. The TISVcan also be used to examine for rotational defects of the vertebra, such as in scoliosis.Normally, both the lamina and the articular processes on either side are symmetrically located(Figs. 8-35 and 8-36). However, if there is asymmetry, then a rotational deformity of thevertebral column23 should be suspected and a difficult CNB should be anticipated.
Sagittal Ultrasound Imaging of the Lumbar Spine
For a sagittal scan (Figs. 8-39 to 8-67) the patient is positioned in the sitting, lateral (Fig. 8-39), or prone position with the lumbosacral spine maximally flexed. The transducer is placed1 to 2 cm lateral to the spinous process (paramedian sagittal scan, PMSS) at the lower backwith its orientation marker directed cranially (Fig. 8-39). For optimal imaging the transduceris also tilted slightly medially during the scan (paramedian sagittal oblique scan, PMSOS,Fig. 8-44) so that majority of the ultrasound signal enters the spinal canal through the widestpart of the interlaminar space.
The sagittal scan routine begins by locating the sacrum as a flat hyperechoic structure witha large acoustic shadow anteriorly (Figs. 8-45 to 8-47, details in Chapter 9). When thetransducer is gently manipulated in a cranial direction, a gap is seen between the sacrum andthe lamina of the L5 vertebra, which is the L5 to S1 interlaminar space, also referred to as theL5 to S1 gap (Fig. 8-46).13,24 The L3 to L4 and L4 to L5 interlaminar spaces can now belocated by moving the transducer cranially and counting upward (Figs. 8-45 and 8-47).13,14
The erector spinae muscles are hypoechoic and lie superficial to the laminae. The laminaappears hyperechoic and is the first osseous structure visualized (Figs. 8-47 and 8-48).Because bone impedes the penetration of ultrasound, there is an acoustic shadow anterior toeach lamina. The sonographic appearance of the lamina produces a pattern that resembles thehead and neck of a horse (the “horse head sign”) (Fig. 8-52).13 The interlaminar space is thegap between the adjoining lamina (Fig. 8-48) and is the “acoustic window” through which theneuraxial structures are visualized within the spinal canal. The ligamentum flavum appears asa hyperechoic band across adjacent lamina (Figs. 8-47 to 8-50). The posterior dura is theadjoining hyperechoic structure anterior to the ligamentum flavum, and the epidural space isthe hypoechoic area (a few millimeters wide) between the ligamentum flavum and theposterior dura (Figs. 8-47 and 8-48). The ligamentum flavum and posterior dura may also beseen as a single linear hyperechoic structure, which is referred to as the “posteriorcomplex”11 or “ligamentum flavum-posterior dura complex.”25 The posterior dura isgenerally more hyperechoic than the ligamentum flavum.13 The thecal sac with thecerebrospinal fluid is the anechoic space anterior to the posterior dura (Fig. 8-53). The caudaequina, which is located within the thecal sac, may also be seen as multiple horizontal,hyperechoic shadows within the anechoic thecal sac. Pulsations of the cauda equina are alsoidentified in some individuals.13,14 The anterior dura is also hyperechoic, but it is oftendifficult to differentiate it from the posterior longitudinal ligament and the posterior surfaceof the vertebral body because they are of similar echogenicity (isoechoic) and closelyapposed to each other. What results is a single, composite, hyperechoic reflection anteriorly,which is referred to as the “anterior complex” (Figs. 8-53 and 8-54).13,14
If the transducer is now slid laterally from the level of the lamina, the paramedian sagittalarticular process view (Figs. 8-56 and 8-57) is seen. The articular processes of the vertebraeappear as one continuous, hyperechoic wavy line with no intervening gaps (Figs. 8-56 to 8-
398

61).12,13 This produces a sonographic pattern that resembles multiple camel humps—the“camel hump sign” (Fig. 8-59).12,13 A sagittal scan lateral to the articular processes bringsthe transverse processes of the L3 to L5 vertebrae into view and produces the paramediansagittal transverse process view (Figs. 8-62 and 8-63). The transverse processes (Figs. 8-62 to67) are recognized by their crescent-shaped, hyperechoic reflections and fingerlike acousticshadows anteriorly (Figs. 8-62 and 8-63).13,26 This produces a sonographic pattern that isreferred to as the “trident sign” because of its resemblance to the trident (Latin tridens ortridentis) that is often associated with Poseidon, the god of the sea in Greek mythology, andthe Trishula of the Hindu God Shiva.26
References1.Cook TM, Counsell D, Wildsmith JA. Major complications of central neuraxial block:
report on the Third National Audit Project of the Royal College of Anaesthetists. Br JAnaesth. 2009;102:179–190.
2.Stiffler KA, Jwayyed S, Wilber ST, Robinson A. The use of ultrasound to identifypertinent landmarks for lumbar puncture. Am J Emerg Med. 2007;25:331–334.
3.Hogan QH. Tuffier’s line: the normal distribution of anatomic parameters. Anesth Analg.1994;78:194–195.
4.Broadbent CR, Maxwell WB, Ferrie R, Wilson DJ, Gawne-Cain M, Russell R. Ability ofanaesthetists to identify a marked lumbar interspace. Anaesthesia. 2000;55:1122–1126.
5.Furness G, Reilly MP, Kuchi S. An evaluation of ultrasound imaging for identification oflumbar intervertebral level. Anaesthesia. 2002;57:277–280.
6.Holmaas G, Frederiksen D, Ulvik A, Vingsnes SO, Ostgaard G, Nordli H. Identification ofthoracic intervertebral spaces by means of surface anatomy: a magnetic resonanceimaging study. Acta Anaesthesiol Scand. 2006;50:368–373.
7.Reynolds F. Damage to the conus medullaris following spinal anaesthesia. Anaesthesia.2001;56:238–247.
8.Hamandi K, Mottershead J, Lewis T, Ormerod IC, Ferguson IT. Irreversible damage to thespinal cord following spinal anesthesia. Neurology. 2002;59:624–626.
9.Seeberger MD, Lang ML, Drewe J, Schneider M, Hauser E, Hruby J. Comparison ofspinal and epidural anesthesia for patients younger than 50 years of age. Anesth Analg.1994;78:667–673.
10.Tarkkila P, Huhtala J, Salminen U. Difficulties in spinal needle use. Insertioncharacteristics and failure rates associated with 25-, 27- and 29-gauge Quincke-typespinal needles. Anaesthesia. 1994;49:723–725.
11.Chin KJ, Karmakar MK, Peng P. Ultrasonography of the adult thoracic and lumbar spinefor central neuraxial blockade. Anesthesiology. 2011;114:1459–1485.
12.Karmakar MK. Ultrasound for central neuraxial blocks. Tech Reg Anesth Pain Manag.2009;13:161–170.
13.Karmakar MK, Li X, Kwok WH, Ho AM, Ngan Kee WD. Sonoanatomy relevant forultrasound-guided central neuraxial blocks via the paramedian approach in the lumbarregion. Br J Radiol. 2012;85:e262–e269.
14.Karmakar MK, Li X, Ho AM, Kwok WH, Chui PT. Real-time ultrasound-guidedparamedian epidural access: evaluation of a novel in-plane technique. Br J Anaesth.2009;102:845–854.
15.Carvalho JC. Ultrasound-facilitated epidurals and spinals in obstetrics. Anesthesiol Clin.
399

2008;26:145–158.16.Chin KJ, Ramlogan R, Arzola C, Singh M, Chan V. The utility of ultrasound imaging in
predicting ease of performance of spinal anesthesia in an orthopedic patient population.Reg Anesth Pain Med. 2013;38:34–38.
17.Grau T, Leipold RW, Conradi R, Martin E. Ultrasound control for presumed difficultepidural puncture. Acta Anaesthesiol Scand. 2001;45:766–771.
18.Grau T, Leipold RW, Conradi R, Martin E, Motsch J. Ultrasound imaging facilitateslocalization of the epidural space during combined spinal and epidural anesthesia. RegAnesth Pain Med. 2001;26:64–67.
19.Grau T, Leipold RW, Conradi R, Martin E, Motsch J. Efficacy of ultrasound imaging inobstetric epidural anesthesia. J Clin Anesth. 2002;14:169–175.
20.Grau T, Leipold RW, Fatehi S, Martin E, Motsch J. Real-time ultrasonic observation ofcombined spinal-epidural anaesthesia. Eur J Anaesthesiol. 2004;21:25–31.
21.Perlas A, Chaparro LE, Chin KJ. Lumbar neuraxial ultrasound for spinal and epiduralanesthesia: a systematic review and meta-analysis. Reg Anesth Pain Med. 2016;41:251–260.
22.Shaikh F, Brzezinski J, Alexander S, et al. Ultrasound imaging for lumbar punctures andepidural catheterisations: systematic review and meta-analysis. BMJ. 2013;346:f1720.
23.Suzuki S, Yamamuro T, Shikata J, Shimizu K, Iida H. Ultrasound measurement ofvertebral rotation in idiopathic scoliosis. J Bone Joint Surg Br. 1989;71:252–255.
24.Furness G, Reilly MP, Kuchi S. An evaluation of ultrasound imaging for identification oflumbar intervertebral level. Anaesthesia. 2002;57:277–280.
25.Avramescu S, Arzola C, Tharmaratnam U, Chin KJ, Balki M. Sonoanatomy of the thoracicspine in adult volunteers. Reg Anesth Pain Med. 2012;37:349–353.
26.Karmakar MK, Ho AM, Li X, Kwok WH, Tsang K, Kee WD. Ultrasound-guided lumbarplexus block through the acoustic window of the lumbar ultrasound trident. Br J Anaesth.2008;100:533–537.
400

CHAPTER 9
Ultrasound Imaging of Sacrum and LumbosacralJunction for Central Neuraxial Blocks
IntroductionUltrasound imaging of the sacrum1,2 and lumbosacral (L5–S1) interlaminar space3–7 isfrequently performed to identify the sonoanatomy relevant for central neuraxial blocks, thatis, spinal and epidural (lumbar and caudal) injection.1–7 Because the lumbosacralinterlaminar space and sacrum are relatively superficial structures, they lend themselves wellto ultrasound imaging.3–5,7 This chapter briefly outlines the anatomy, technique of ultrasoundimaging, and sonoanatomy of the sacrum and lumbosacral interlaminar space relevant forcentral neuraxial blocks.
Basic Anatomy of the SacrumThe sacrum is a large, triangular bone formed by the fusion of the five sacral vertebrae (Figs.9-1 and 9-2). It makes up the posterior aspect of the bony pelvis and articulates with thecorresponding hip bones laterally at the sacroiliac junctions. Because it is triangular in shapeit has a base, an apex, and four surfaces (right and left lateral surfaces, dorsal and ventral orpelvic surface). Anatomically the pelvic surface of the sacrum faces downwards and forward,whereas the dorsal surface faces backwards and slightly upwards. The sacrum is divided by arow of foramina on either side of the midline into a median section and a pair of lateralmasses (Fig. 9-1). The median section is traversed by the sacral canal, which contains adiposetissue, cauda equina nerves (including the filum terminale), epidural space, spinal meninges(dura and arachnoid), and the thecal sac. The thecal sac ends at the level of the S2 but canvary from S1 to S3. The sacral canal also contains the epidural venous plexus, whichgenerally ends at the level of the S4 but may extend more caudally. The lateral masses areformed by fusion of the transverse processes posteriorly and the costal elements anteriorly.The base is formed by the superior surface of the body of the S1 vertebra, which is large,lumbar in type, and articulates with the L5 vertebra at the lumbosacral junction. The vertebralforamen of the S1 vertebra is triangular in shape and continuous cranially with the lumbarspinal canal and caudally with the sacral canal. The spine of the S1 vertebra forms the firstspinous tubercle. The apex of the sacrum is formed by the body of the S5 vertebra (inferiorsurface) that articulates with the coccyx (Figs. 9-1 and 9-2).
401
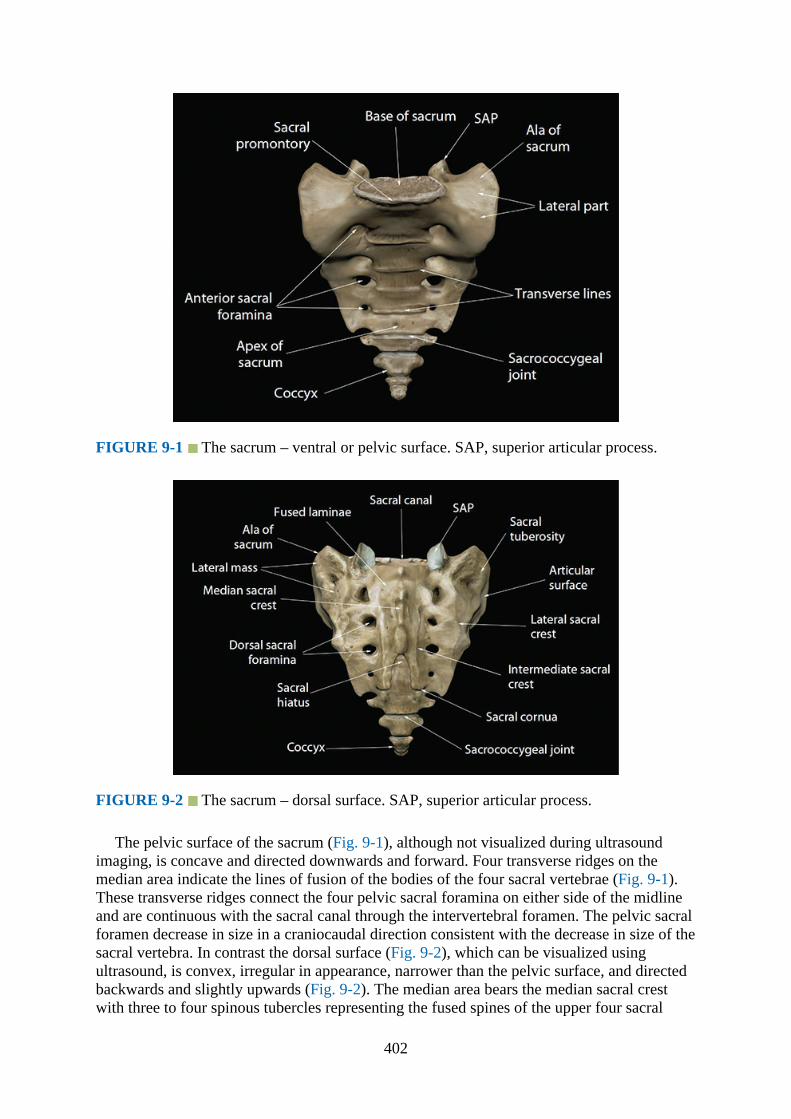
FIGURE 9-1 The sacrum – ventral or pelvic surface. SAP, superior articular process.
FIGURE 9-2 The sacrum – dorsal surface. SAP, superior articular process.
The pelvic surface of the sacrum (Fig. 9-1), although not visualized during ultrasoundimaging, is concave and directed downwards and forward. Four transverse ridges on themedian area indicate the lines of fusion of the bodies of the four sacral vertebrae (Fig. 9-1).These transverse ridges connect the four pelvic sacral foramina on either side of the midlineand are continuous with the sacral canal through the intervertebral foramen. The pelvic sacralforamen decrease in size in a craniocaudal direction consistent with the decrease in size of thesacral vertebra. In contrast the dorsal surface (Fig. 9-2), which can be visualized usingultrasound, is convex, irregular in appearance, narrower than the pelvic surface, and directedbackwards and slightly upwards (Fig. 9-2). The median area bears the median sacral crestwith three to four spinous tubercles representing the fused spines of the upper four sacral
402

vertebrae (Fig. 9-2). A ridge joining the articular tubercles forms the intermediate sacral crest.Four dorsal sacral foramina lie lateral to the intermediate sacral crest (Fig. 9-2) andcommunicate with the sacral canal through the intervertebral foramina (Fig. 9-3). The lateralsacral crest lies lateral to the dorsal sacral foramina. Below the fourth sacral tubercle there isan inverted U-shaped defect on the posterior aspect of the sacrum: the “sacral hiatus” (Fig. 9-2). This results from a failure of fusion of the laminae of the fourth and fifth sacral vertebrae.The inferior articular processes of the fifth sacral vertebra form the sacral cornua and lielateral to the sacral hiatus (Fig. 9-2). The sacral hiatus is roofed by a firm elastic membrane,the sacrococcygeal ligament, which is an extension of the ligamentum flavum. The terminalend of the filum terminale exits through the sacral hiatus and traverses the dorsal surface ofthe S5 vertebra and sacrococcygeal joint to end at the coccyx. The fifth spinal nerve also exitsthrough the sacral hiatus lying medial to the sacral cornua.
FIGURE 9-3 Sagittal section of the sacrum showing the sacral canal and the sacralforaminae.
Gross Anatomy of the Sacrum
Fig. 9-4
403
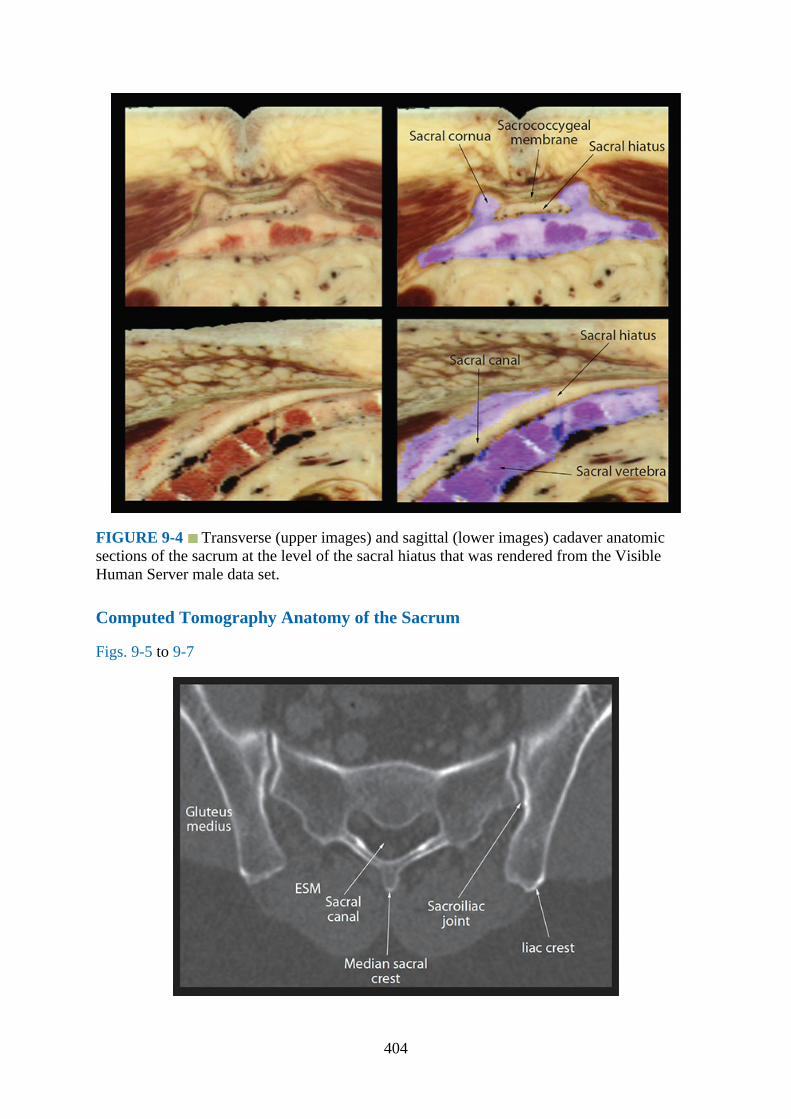
FIGURE 9-4 Transverse (upper images) and sagittal (lower images) cadaver anatomicsections of the sacrum at the level of the sacral hiatus that was rendered from the VisibleHuman Server male data set.
Computed Tomography Anatomy of the Sacrum
Figs. 9-5 to 9-7
404
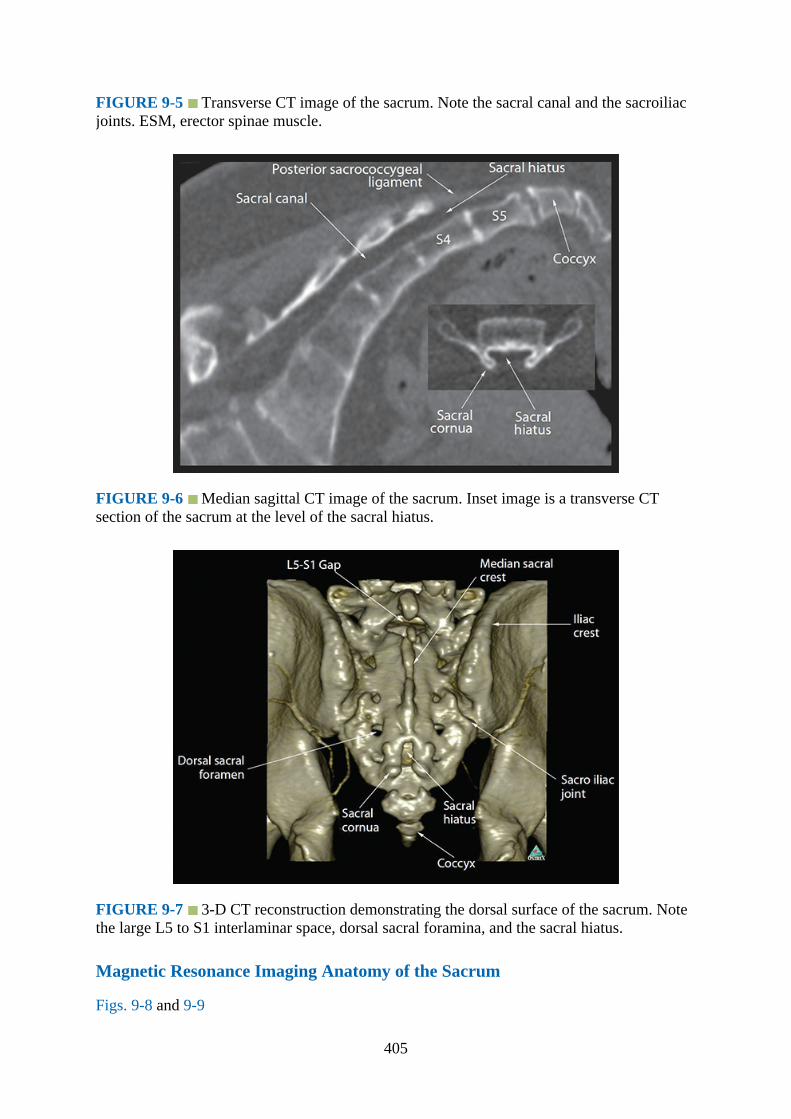
FIGURE 9-5 Transverse CT image of the sacrum. Note the sacral canal and the sacroiliacjoints. ESM, erector spinae muscle.
FIGURE 9-6 Median sagittal CT image of the sacrum. Inset image is a transverse CTsection of the sacrum at the level of the sacral hiatus.
FIGURE 9-7 3-D CT reconstruction demonstrating the dorsal surface of the sacrum. Notethe large L5 to S1 interlaminar space, dorsal sacral foramina, and the sacral hiatus.
Magnetic Resonance Imaging Anatomy of the Sacrum
Figs. 9-8 and 9-9
405
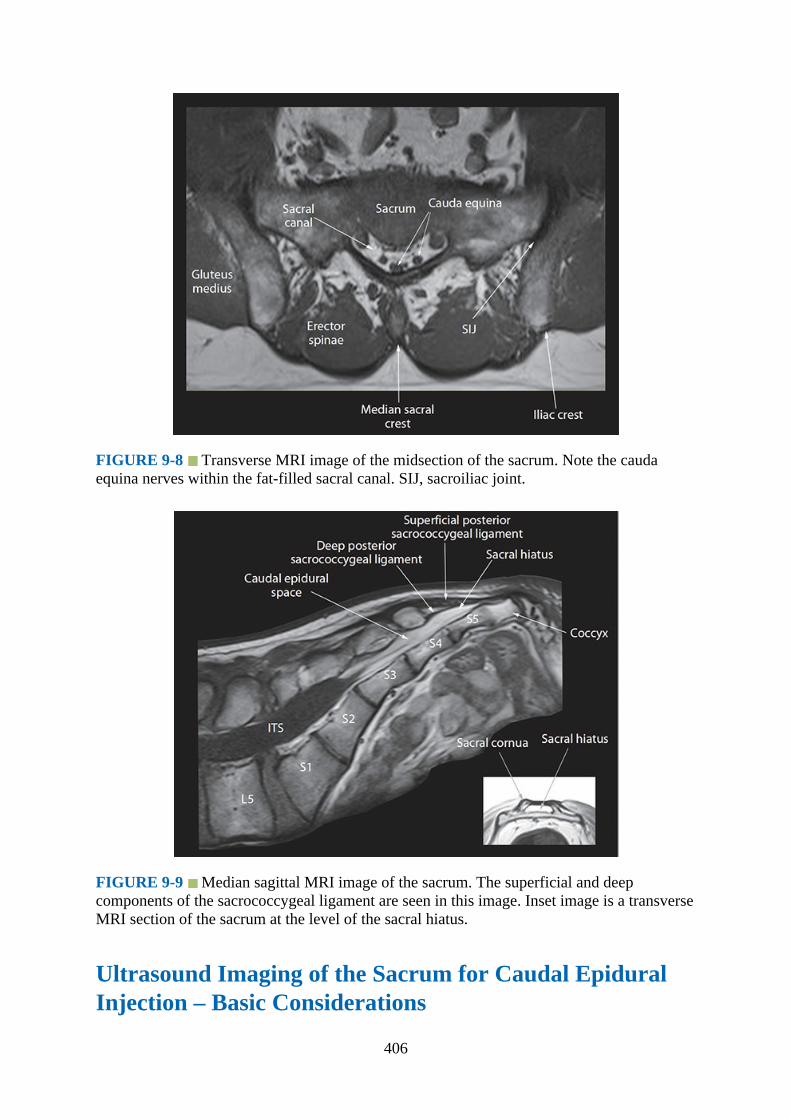
FIGURE 9-8 Transverse MRI image of the midsection of the sacrum. Note the caudaequina nerves within the fat-filled sacral canal. SIJ, sacroiliac joint.
FIGURE 9-9 Median sagittal MRI image of the sacrum. The superficial and deepcomponents of the sacrococcygeal ligament are seen in this image. Inset image is a transverseMRI section of the sacrum at the level of the sacral hiatus.
Ultrasound Imaging of the Sacrum for Caudal EpiduralInjection – Basic Considerations
406

The caudal epidural space is the continuation of the lumbar epidural space and can beaccessed via the sacral hiatus. Ultrasound imaging of the sacrum and sacral hiatus can beperformed in the transverse or sagittal axis (Fig. 9-10).1,2,5 Because the sacral hiatus is asuperficial structure, it can be imaged using a high-frequency linear transducer (12–5MHz).1,2,5 Ultrasound imaging of the sacrum for a caudal epidural injection produces atypical sonographic appearance of the osseous structures that are illustrated in Fig. 9-11.
FIGURE 9-10 Figure illustrating the position of the ultrasound transducer during a (A)transverse and (B) sagittal scan of the sacrum.
FIGURE 9-11 Sonograms of the sacral hiatus (A, sagittal view and B, transverse view)
407

and lumbosacral interlaminar space (L5–S1 gap, sagittal view) from the water-based spinephantom. SS, sagittal scan; TS, transverse scan.
Ultrasound Imaging of the Sacrum for Caudal EpiduralInjection1.Position:
a.Patient: The patient is positioned in the lateral decubitus position for a caudal epiduralinjection (Fig. 9-12). When fluoroscopy is used in conjunction with ultrasound for thecaudal epidural injection, as in chronic pain medicine, then the patient may bepositioned in the prone position with a pillow under the abdomen.
FIGURE 9-12 (A) Transverse sonogram of the sacrum at the level of the sacral hiatus thatwas acquired with the patient in the (B) lateral position.
b.Operator and ultrasound machine: The operator stands behind the patient, and theultrasound machine is placed directly in front of the patient.
2.Transducer selection: High-frequency linear transducer (12–5 MHz).3.Scanning technique: Ultrasound scan for the sacral hiatus is commenced by placing the
ultrasound transducer at the lower end of the sacrum and over the coccyx. Thereafter thetransducer is gradually moved cranially until the sacral cornua and hiatus are visualized(Fig. 9-12).
4.Sonoanatomy: The sacral hiatus is covered by the sacrococcygeal ligament. Its lateralmargins are formed by the two sacral cornua. On a transverse sonogram of the sacrum atthe level of the sacral hiatus, the sacral cornua are seen as two hyperechoic reversed U-shaped structures, one on either side of the midline (Figs. 9-12 and 9-13). Connecting thetwo sacral cornua and deep to the skin and subcutaneous tissue is a hyperechoic band, thesacrococcygeal ligament (Figs. 9-12 and 9-13). Anterior to the sacrococcygeal ligament isanother hyperechoic linear structure, which represents the dorsal surface of the sacrum(Fig. 9-12). The hypoechoic space between the sacrococcygeal ligament and the bony
408
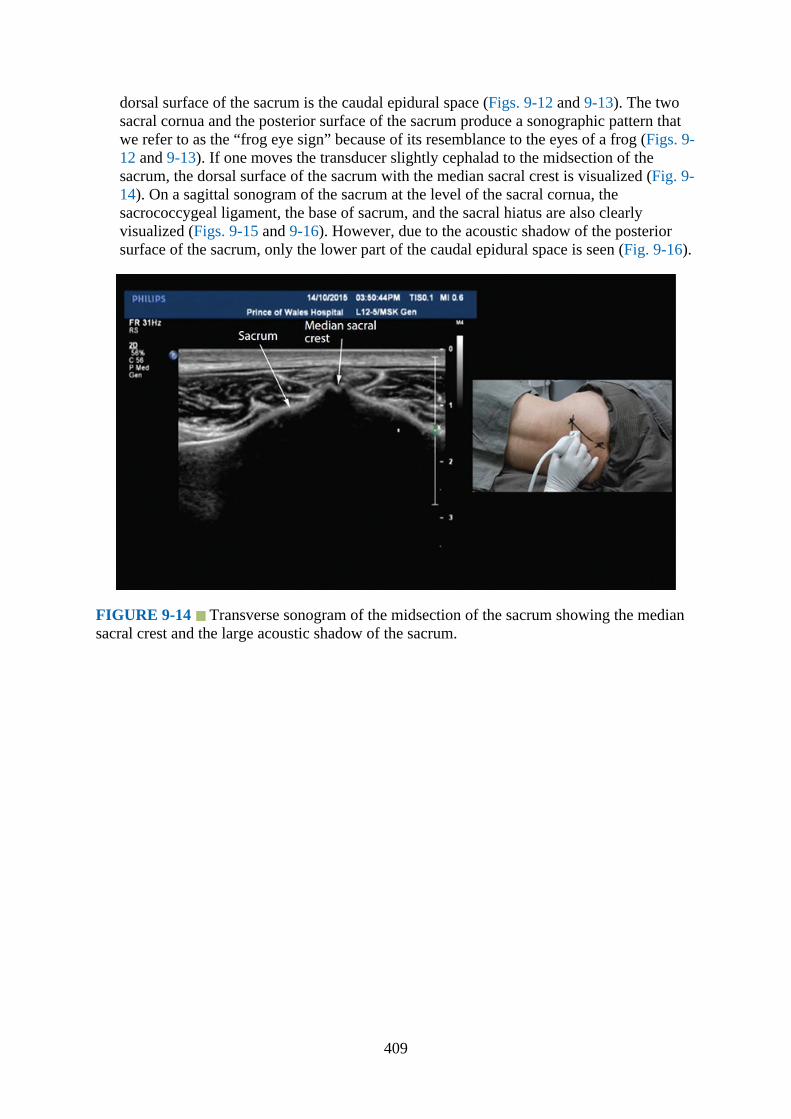
dorsal surface of the sacrum is the caudal epidural space (Figs. 9-12 and 9-13). The twosacral cornua and the posterior surface of the sacrum produce a sonographic pattern thatwe refer to as the “frog eye sign” because of its resemblance to the eyes of a frog (Figs. 9-12 and 9-13). If one moves the transducer slightly cephalad to the midsection of thesacrum, the dorsal surface of the sacrum with the median sacral crest is visualized (Fig. 9-14). On a sagittal sonogram of the sacrum at the level of the sacral cornua, thesacrococcygeal ligament, the base of sacrum, and the sacral hiatus are also clearlyvisualized (Figs. 9-15 and 9-16). However, due to the acoustic shadow of the posteriorsurface of the sacrum, only the lower part of the caudal epidural space is seen (Fig. 9-16).
FIGURE 9-14 Transverse sonogram of the midsection of the sacrum showing the mediansacral crest and the large acoustic shadow of the sacrum.
409
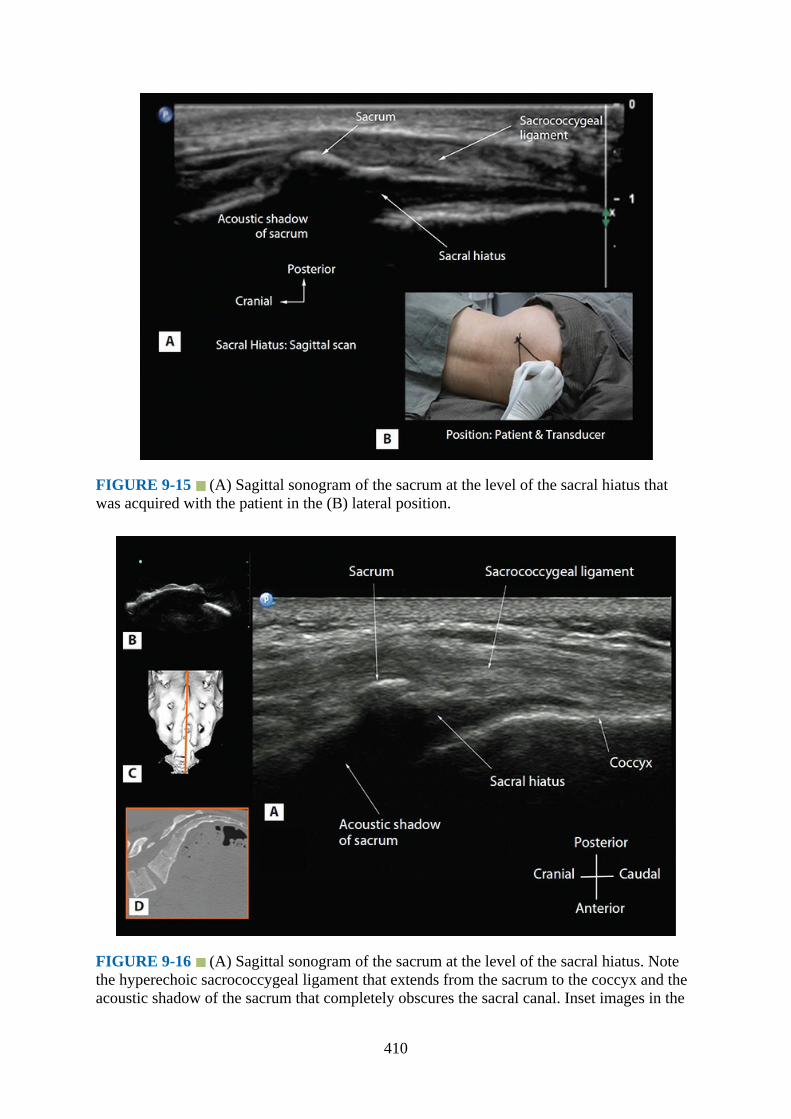
FIGURE 9-15 (A) Sagittal sonogram of the sacrum at the level of the sacral hiatus thatwas acquired with the patient in the (B) lateral position.
FIGURE 9-16 (A) Sagittal sonogram of the sacrum at the level of the sacral hiatus. Notethe hyperechoic sacrococcygeal ligament that extends from the sacrum to the coccyx and theacoustic shadow of the sacrum that completely obscures the sacral canal. Inset images in the
410
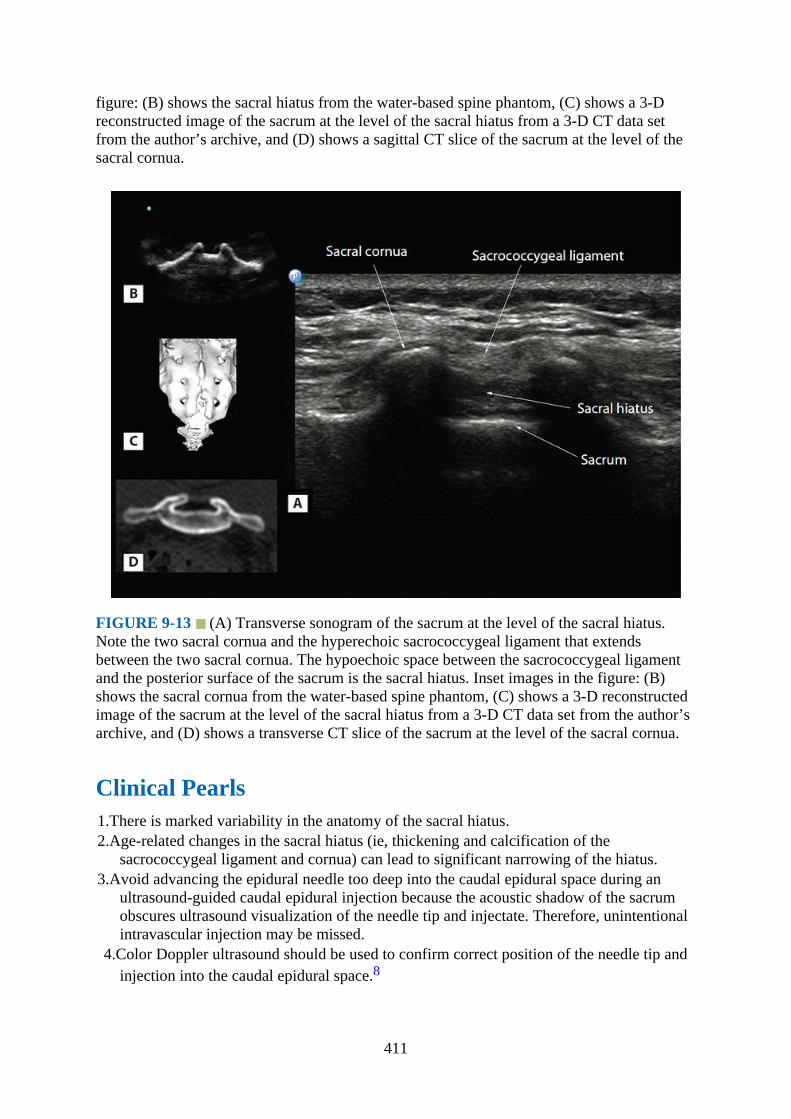
figure: (B) shows the sacral hiatus from the water-based spine phantom, (C) shows a 3-Dreconstructed image of the sacrum at the level of the sacral hiatus from a 3-D CT data setfrom the author’s archive, and (D) shows a sagittal CT slice of the sacrum at the level of thesacral cornua.
FIGURE 9-13 (A) Transverse sonogram of the sacrum at the level of the sacral hiatus.Note the two sacral cornua and the hyperechoic sacrococcygeal ligament that extendsbetween the two sacral cornua. The hypoechoic space between the sacrococcygeal ligamentand the posterior surface of the sacrum is the sacral hiatus. Inset images in the figure: (B)shows the sacral cornua from the water-based spine phantom, (C) shows a 3-D reconstructedimage of the sacrum at the level of the sacral hiatus from a 3-D CT data set from the author’sarchive, and (D) shows a transverse CT slice of the sacrum at the level of the sacral cornua.
Clinical Pearls1.There is marked variability in the anatomy of the sacral hiatus.2.Age-related changes in the sacral hiatus (ie, thickening and calcification of the
sacrococcygeal ligament and cornua) can lead to significant narrowing of the hiatus.3.Avoid advancing the epidural needle too deep into the caudal epidural space during an
ultrasound-guided caudal epidural injection because the acoustic shadow of the sacrumobscures ultrasound visualization of the needle tip and injectate. Therefore, unintentionalintravascular injection may be missed.
4.Color Doppler ultrasound should be used to confirm correct position of the needle tip andinjection into the caudal epidural space.8
411

Basic Anatomy of the Lumbosacral Interlaminar SpaceThe lumbosacral (L5–S1) interlaminar space, also referred to as the L5 to S1 gap,5,7 is theintervertebral space between the lamina of L5 and S1 vertebrae (Fig. 9-17). It is one of theroutes (paramedian approach) for needle insertion during central neuraxial blocks (CNBs,spinal and epidural injection), and spinal injections via the L5 to S1 interlaminar spaceoriginally described by Taylor in 1940.9 However, a review of the literature indicates thatCNBs are most frequently performed via the L3 to L4 or L4 to L5 intervertebral space andrarely via the L5 to S1 interlaminar space. The exact reason for this practice is not known,although the interlaminar space at the L5 to S1 is wider than that at the other lumbarintervertebral levels.10 This may be due to a poor understanding of the anatomy of the L5 toS1 interlaminar space or a lack of data comparing CNBs via the L3 to L4 or L4 to L5 and L5to S1 intervertebral spaces. However, with recent improvements in our understanding of thesonoanatomy of the spine,3,7 there are several reports on the use of ultrasound for CNB viathe L5 to S1 interlaminar space in patients with difficult spine (eg, scoliosis, instrumented oroperated backs).11,12 Ultrasound has also been successfully used to accurately locate thelumbar intervertebral (L3–L4 or L4–L5) space during CNB.6,7,13 This method relies onidentifying the L5 to S1 interlaminar space or the L5 to S1 gap in a paramedian sagittal scanand then sliding the transducer cephalad to locate the lamina of the L3, L4, and L5vertebrae3,6,7,13 and thereby the L4 to L5 and L3 to L4 intervertebral spaces.3,6,7,13
FIGURE 9-17 The lumbosacral spine – dorsal view. IAP, inferior articular process; SAP,superior articular process.
There are certain peculiarities in the anatomy of the L5 to S1 interlaminar space thatdeserve attention as a route for CNB. As described earlier, the L5 to S1 interlaminar space iswider than the interlaminar spaces at the L4 to L5 and L3 to L4 intervertebral levels.10 Also,because the dorsal surface of the sacrum is directed backwards and slightly upwards in vivo
412

(Figs. 9-7, 9-18, and 9-19), the L5 to S1 interlaminar space may be closer to the skin than theL4 to L5 intervertebral space. At the L5 to S1 intervertebral level, the ligamentum flavum isalso relatively thinner, there is a lack of posterior epidural fat,14 and there is a greater amountof epidural fat in the midline superficial (external) to the epidural space,14 when compared tothat at the other lumbar intervertebral spaces.
FIGURE 9-18 Cadaver anatomic section showing the lumbosacral interlaminar space (L5–S1 gap) in the (A) transverse, (B) median (sagittal), and (C) paramedian sagittal axis. IVD,intervertebral disc; ILS, interlaminar space; ITS, intrathecal space; CE, cauda equina.
413
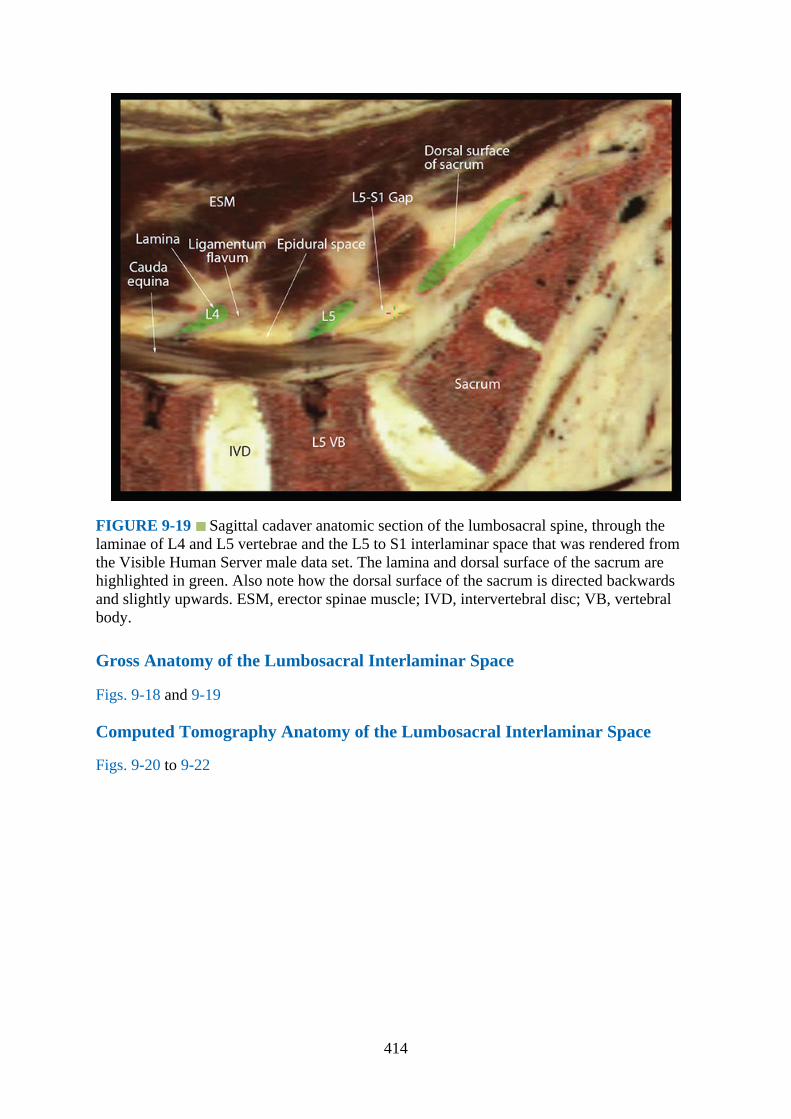
FIGURE 9-19 Sagittal cadaver anatomic section of the lumbosacral spine, through thelaminae of L4 and L5 vertebrae and the L5 to S1 interlaminar space that was rendered fromthe Visible Human Server male data set. The lamina and dorsal surface of the sacrum arehighlighted in green. Also note how the dorsal surface of the sacrum is directed backwardsand slightly upwards. ESM, erector spinae muscle; IVD, intervertebral disc; VB, vertebralbody.
Gross Anatomy of the Lumbosacral Interlaminar Space
Figs. 9-18 and 9-19
Computed Tomography Anatomy of the Lumbosacral Interlaminar Space
Figs. 9-20 to 9-22
414
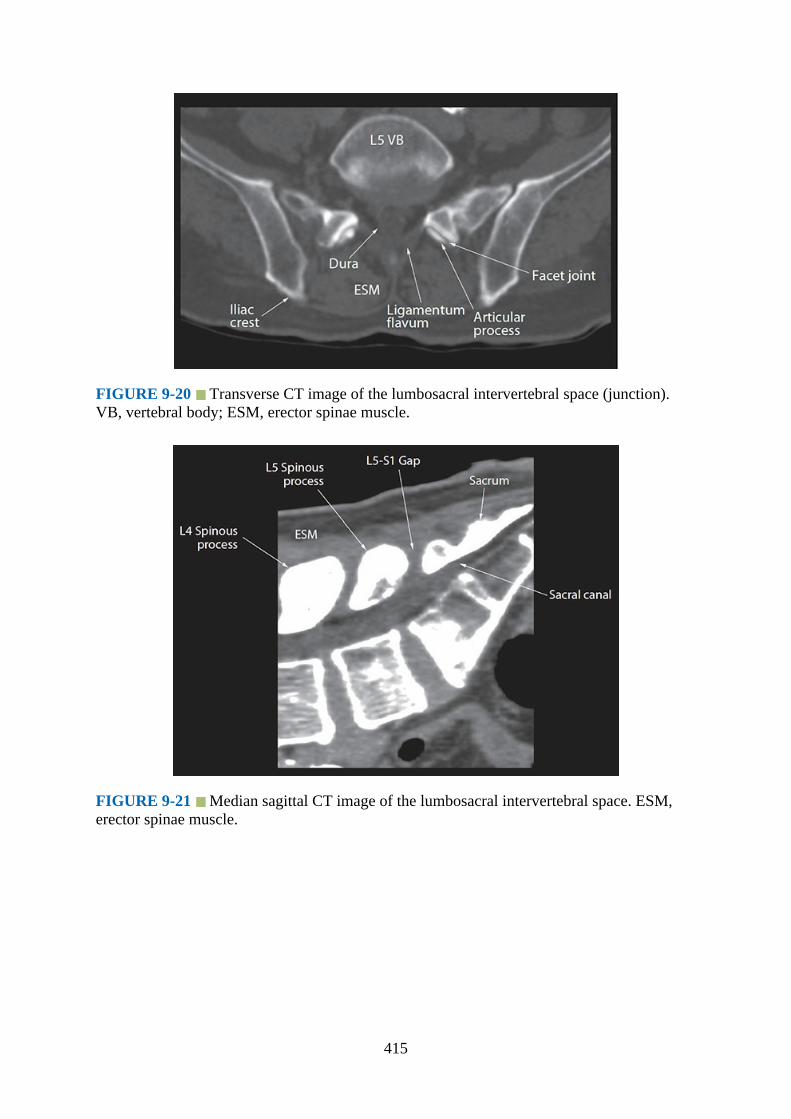
FIGURE 9-20 Transverse CT image of the lumbosacral intervertebral space (junction).VB, vertebral body; ESM, erector spinae muscle.
FIGURE 9-21 Median sagittal CT image of the lumbosacral intervertebral space. ESM,erector spinae muscle.
415
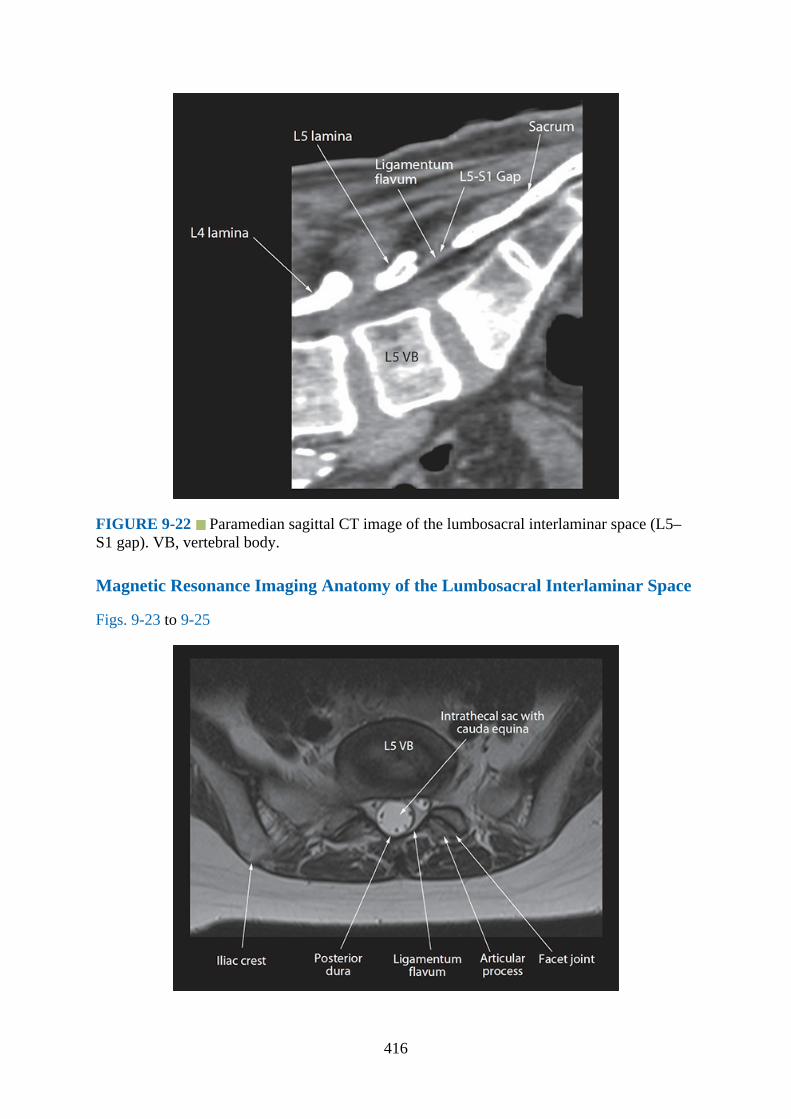
FIGURE 9-22 Paramedian sagittal CT image of the lumbosacral interlaminar space (L5–S1 gap). VB, vertebral body.
Magnetic Resonance Imaging Anatomy of the Lumbosacral Interlaminar Space
Figs. 9-23 to 9-25
416

FIGURE 9-23 Transverse MRI image of the lumbosacral interverebral space. VB,vertebral body.
FIGURE 9-24 Median sagittal MRI image of the lumbosacral spine. Note the taperedthecal sac and its termination at the level of S1 in this subject. Also note the cauda equinanerves within the thecal sac. ITS, intrathecal sac. SP, spinous process.
417
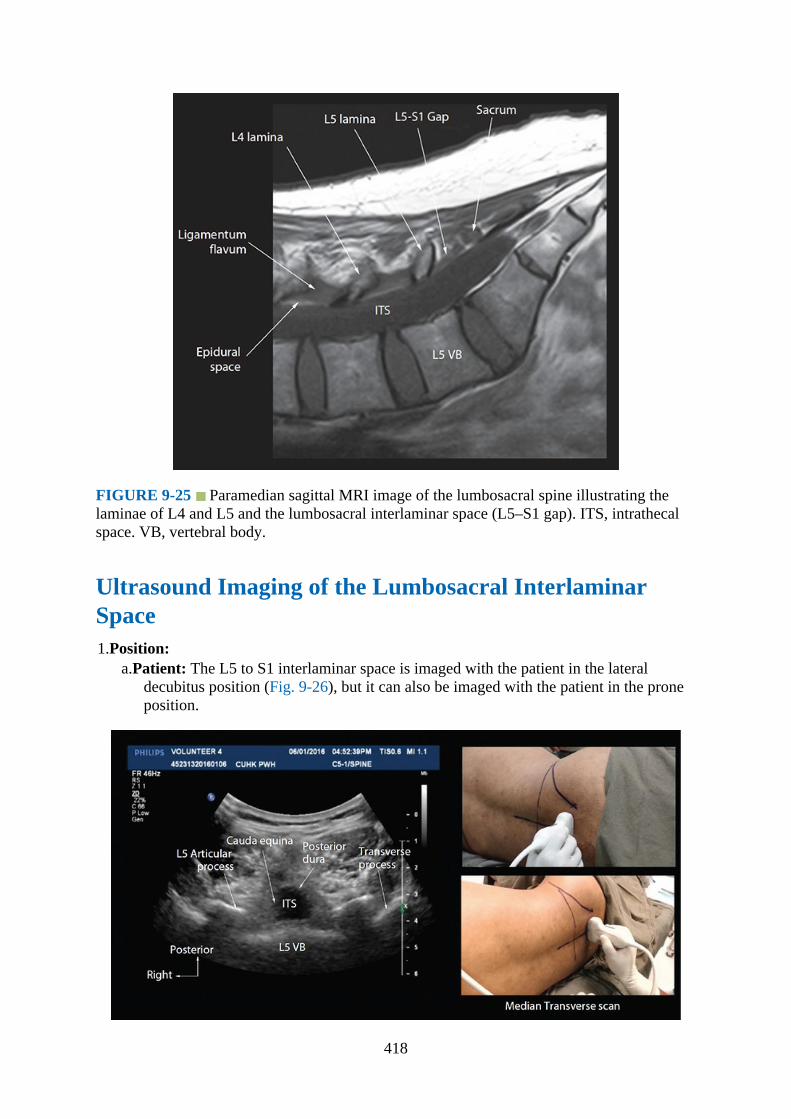
FIGURE 9-25 Paramedian sagittal MRI image of the lumbosacral spine illustrating thelaminae of L4 and L5 and the lumbosacral interlaminar space (L5–S1 gap). ITS, intrathecalspace. VB, vertebral body.
Ultrasound Imaging of the Lumbosacral InterlaminarSpace1.Position:
a.Patient: The L5 to S1 interlaminar space is imaged with the patient in the lateraldecubitus position (Fig. 9-26), but it can also be imaged with the patient in the proneposition.
418
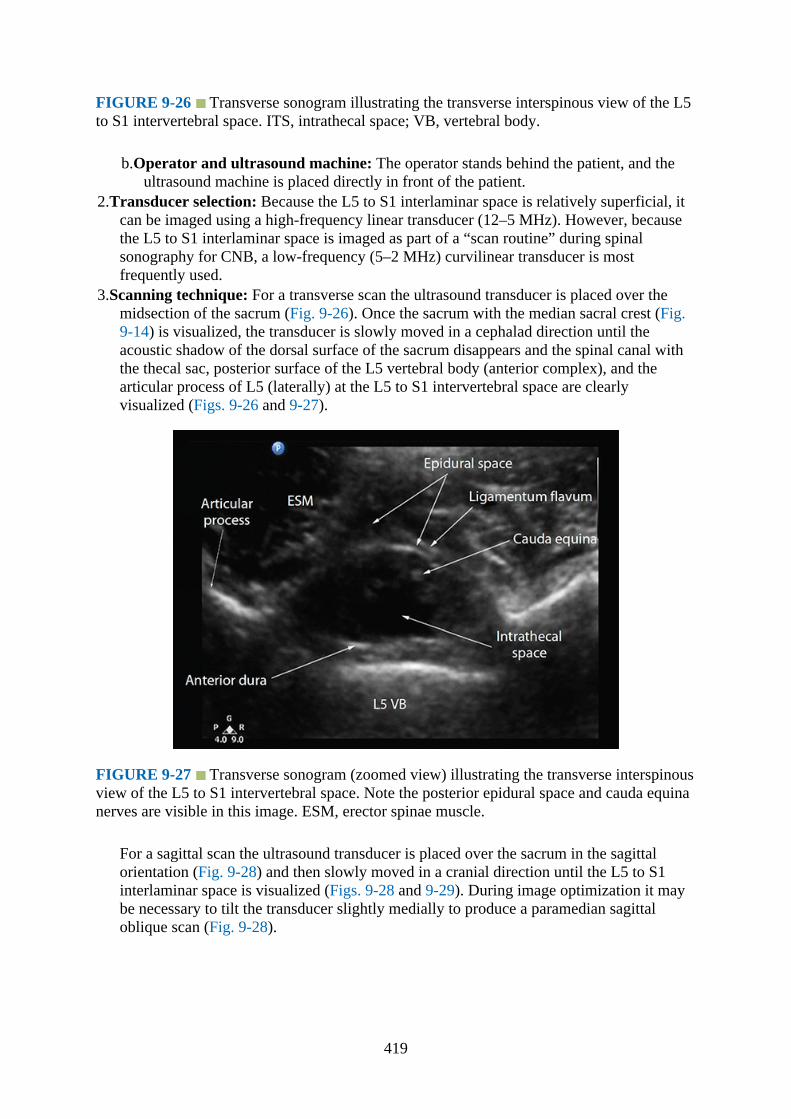
FIGURE 9-26 Transverse sonogram illustrating the transverse interspinous view of the L5to S1 intervertebral space. ITS, intrathecal space; VB, vertebral body.
b.Operator and ultrasound machine: The operator stands behind the patient, and theultrasound machine is placed directly in front of the patient.
2.Transducer selection: Because the L5 to S1 interlaminar space is relatively superficial, itcan be imaged using a high-frequency linear transducer (12–5 MHz). However, becausethe L5 to S1 interlaminar space is imaged as part of a “scan routine” during spinalsonography for CNB, a low-frequency (5–2 MHz) curvilinear transducer is mostfrequently used.
3.Scanning technique: For a transverse scan the ultrasound transducer is placed over themidsection of the sacrum (Fig. 9-26). Once the sacrum with the median sacral crest (Fig.9-14) is visualized, the transducer is slowly moved in a cephalad direction until theacoustic shadow of the dorsal surface of the sacrum disappears and the spinal canal withthe thecal sac, posterior surface of the L5 vertebral body (anterior complex), and thearticular process of L5 (laterally) at the L5 to S1 intervertebral space are clearlyvisualized (Figs. 9-26 and 9-27).
FIGURE 9-27 Transverse sonogram (zoomed view) illustrating the transverse interspinousview of the L5 to S1 intervertebral space. Note the posterior epidural space and cauda equinanerves are visible in this image. ESM, erector spinae muscle.
For a sagittal scan the ultrasound transducer is placed over the sacrum in the sagittalorientation (Fig. 9-28) and then slowly moved in a cranial direction until the L5 to S1interlaminar space is visualized (Figs. 9-28 and 9-29). During image optimization it maybe necessary to tilt the transducer slightly medially to produce a paramedian sagittaloblique scan (Fig. 9-28).
419
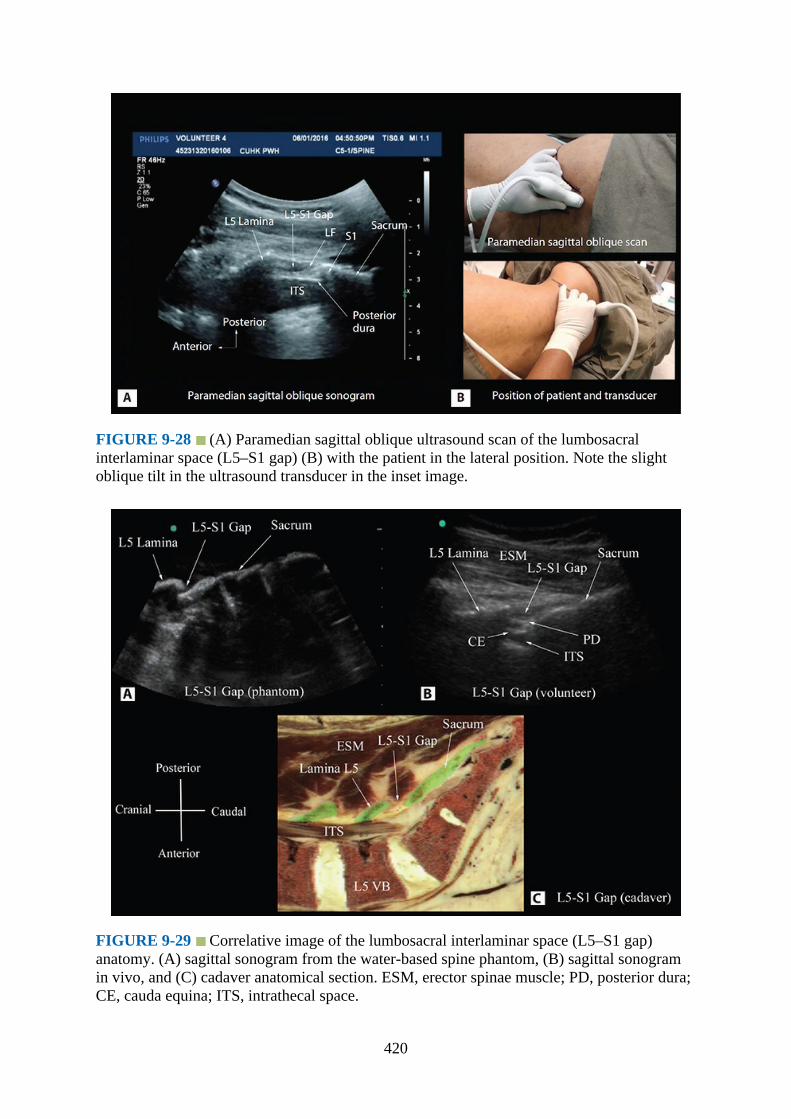
FIGURE 9-28 (A) Paramedian sagittal oblique ultrasound scan of the lumbosacralinterlaminar space (L5–S1 gap) (B) with the patient in the lateral position. Note the slightoblique tilt in the ultrasound transducer in the inset image.
FIGURE 9-29 Correlative image of the lumbosacral interlaminar space (L5–S1 gap)anatomy. (A) sagittal sonogram from the water-based spine phantom, (B) sagittal sonogramin vivo, and (C) cadaver anatomical section. ESM, erector spinae muscle; PD, posterior dura;CE, cauda equina; ITS, intrathecal space.
420
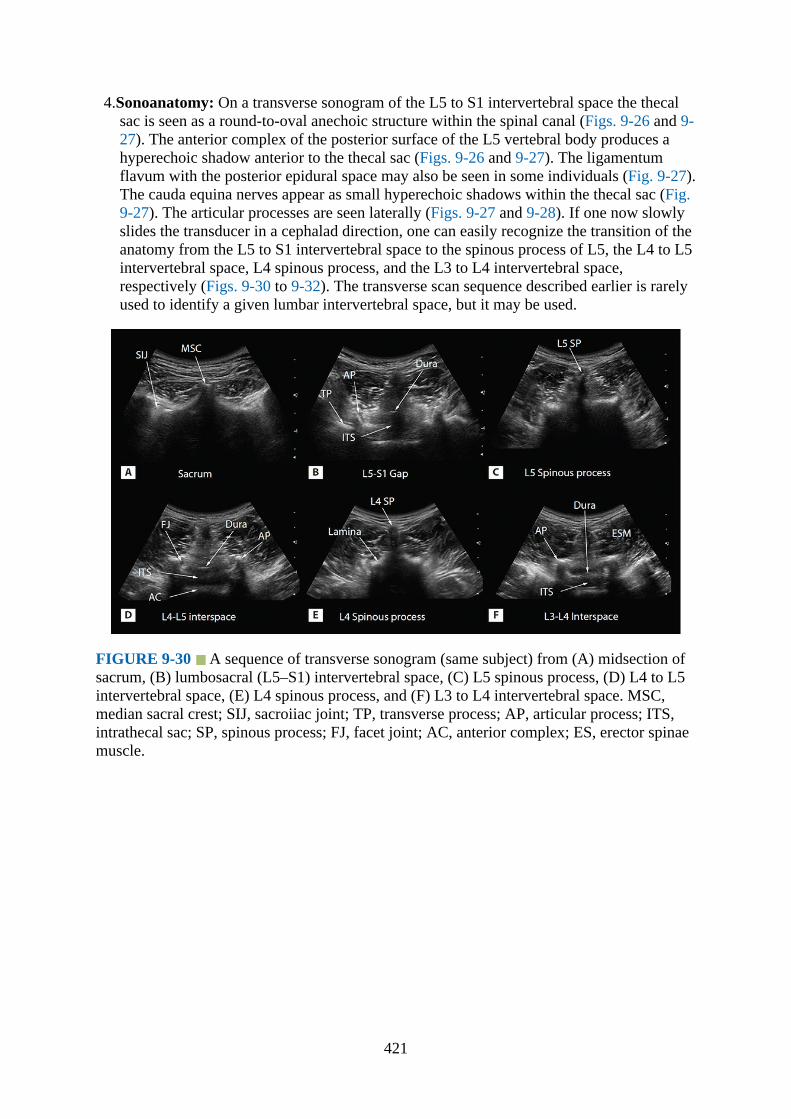
4.Sonoanatomy: On a transverse sonogram of the L5 to S1 intervertebral space the thecalsac is seen as a round-to-oval anechoic structure within the spinal canal (Figs. 9-26 and 9-27). The anterior complex of the posterior surface of the L5 vertebral body produces ahyperechoic shadow anterior to the thecal sac (Figs. 9-26 and 9-27). The ligamentumflavum with the posterior epidural space may also be seen in some individuals (Fig. 9-27).The cauda equina nerves appear as small hyperechoic shadows within the thecal sac (Fig.9-27). The articular processes are seen laterally (Figs. 9-27 and 9-28). If one now slowlyslides the transducer in a cephalad direction, one can easily recognize the transition of theanatomy from the L5 to S1 intervertebral space to the spinous process of L5, the L4 to L5intervertebral space, L4 spinous process, and the L3 to L4 intervertebral space,respectively (Figs. 9-30 to 9-32). The transverse scan sequence described earlier is rarelyused to identify a given lumbar intervertebral space, but it may be used.
FIGURE 9-30 A sequence of transverse sonogram (same subject) from (A) midsection ofsacrum, (B) lumbosacral (L5–S1) intervertebral space, (C) L5 spinous process, (D) L4 to L5intervertebral space, (E) L4 spinous process, and (F) L3 to L4 intervertebral space. MSC,median sacral crest; SIJ, sacroiiac joint; TP, transverse process; AP, articular process; ITS,intrathecal sac; SP, spinous process; FJ, facet joint; AC, anterior complex; ES, erector spinaemuscle.
421
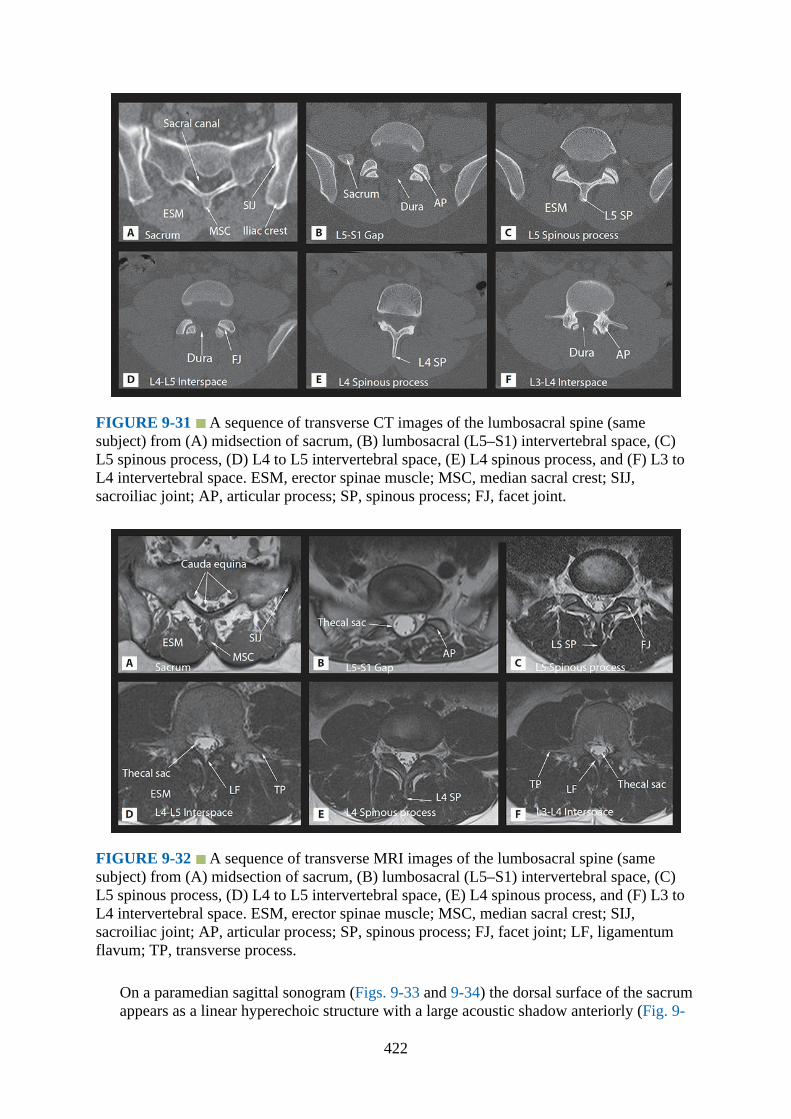
FIGURE 9-31 A sequence of transverse CT images of the lumbosacral spine (samesubject) from (A) midsection of sacrum, (B) lumbosacral (L5–S1) intervertebral space, (C)L5 spinous process, (D) L4 to L5 intervertebral space, (E) L4 spinous process, and (F) L3 toL4 intervertebral space. ESM, erector spinae muscle; MSC, median sacral crest; SIJ,sacroiliac joint; AP, articular process; SP, spinous process; FJ, facet joint.
FIGURE 9-32 A sequence of transverse MRI images of the lumbosacral spine (samesubject) from (A) midsection of sacrum, (B) lumbosacral (L5–S1) intervertebral space, (C)L5 spinous process, (D) L4 to L5 intervertebral space, (E) L4 spinous process, and (F) L3 toL4 intervertebral space. ESM, erector spinae muscle; MSC, median sacral crest; SIJ,sacroiliac joint; AP, articular process; SP, spinous process; FJ, facet joint; LF, ligamentumflavum; TP, transverse process.
On a paramedian sagittal sonogram (Figs. 9-33 and 9-34) the dorsal surface of the sacrumappears as a linear hyperechoic structure with a large acoustic shadow anteriorly (Fig. 9-
422

33). The osseous structure visualized immediately cranial to the sacrum is the lamina(horse-head appearance) of the L5 vertebra, and the intervening gap is the L5 to S1interlaminar space (Figs. 9-33 and 9-34). One must not confuse this with a median sagittalscan through the L5 to S1 intervertebral space when the spinous processes of the L5 andS1 are visualized (Fig. 9-35). At the L5 to S1 interlaminar space and within the acousticwindow, the following structures are visualized in a posterior-to-anterior direction:erector spinae muscle, ligamentum flavum, posterior epidural space, posterior dura, thecalsac, and the anterior complex, respectively (Figs. 9-33 and 9-34). Occasionally thetapered distal end of the thecal sac can be seen. The cauda equina nerves may also be seenas hyperechoic streaks within the anechoic cerebrospinal fluid–filled thecal sac (Fig. 9-33).
FIGURE 9-33 Paramedian sagittal oblique sonogram of the lumbosacral (L5–S1)interlaminar space. Note the wide interlaminar space, and correspondingly, the wide acousticwindow for ultrasound imaging at this level. The posterior surface of the sacrum is identifiedas a flat hyperechoeic structure with a large acoustic shadow anterior to it. The dip or gapbetween the sacrum and the lamina of L5 is the L5 to S1 intervertebral space or the L5 to S1gap. ESM, erector spinae muscle.
423
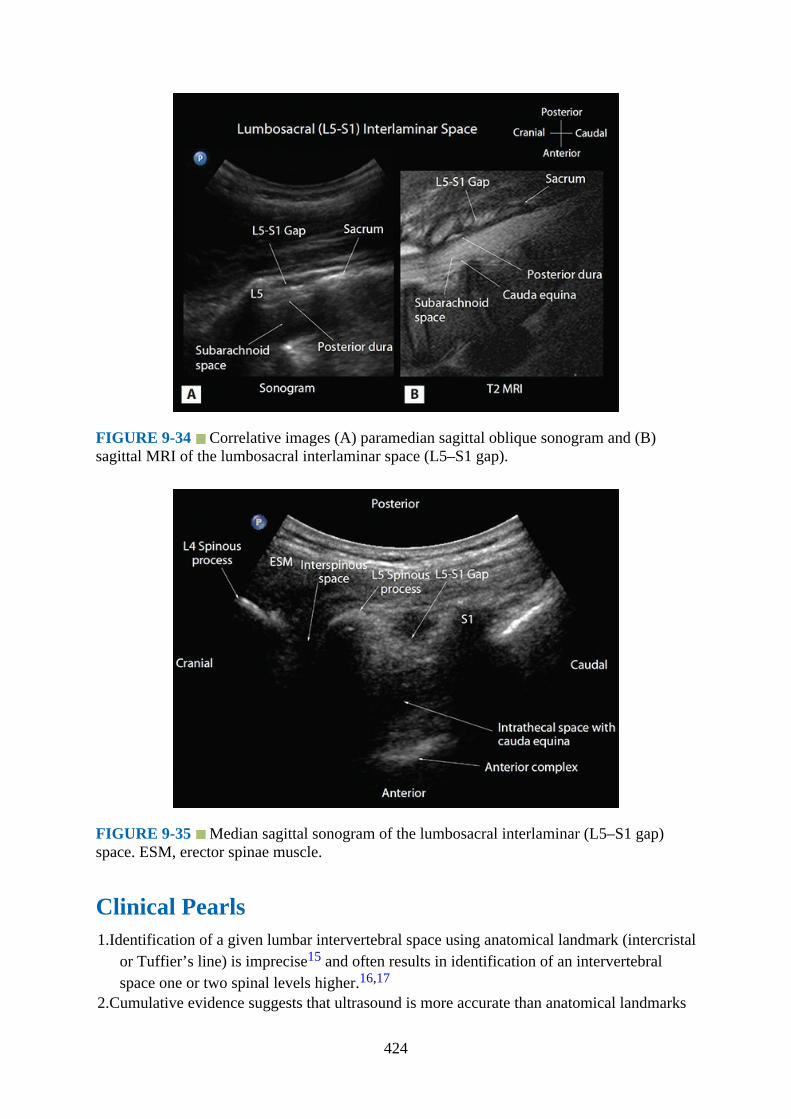
FIGURE 9-34 Correlative images (A) paramedian sagittal oblique sonogram and (B)sagittal MRI of the lumbosacral interlaminar space (L5–S1 gap).
FIGURE 9-35 Median sagittal sonogram of the lumbosacral interlaminar (L5–S1 gap)space. ESM, erector spinae muscle.
Clinical Pearls1.Identification of a given lumbar intervertebral space using anatomical landmark (intercristal
or Tuffier’s line) is imprecise15 and often results in identification of an intervertebralspace one or two spinal levels higher.16,17
2.Cumulative evidence suggests that ultrasound is more accurate than anatomical landmarks
424
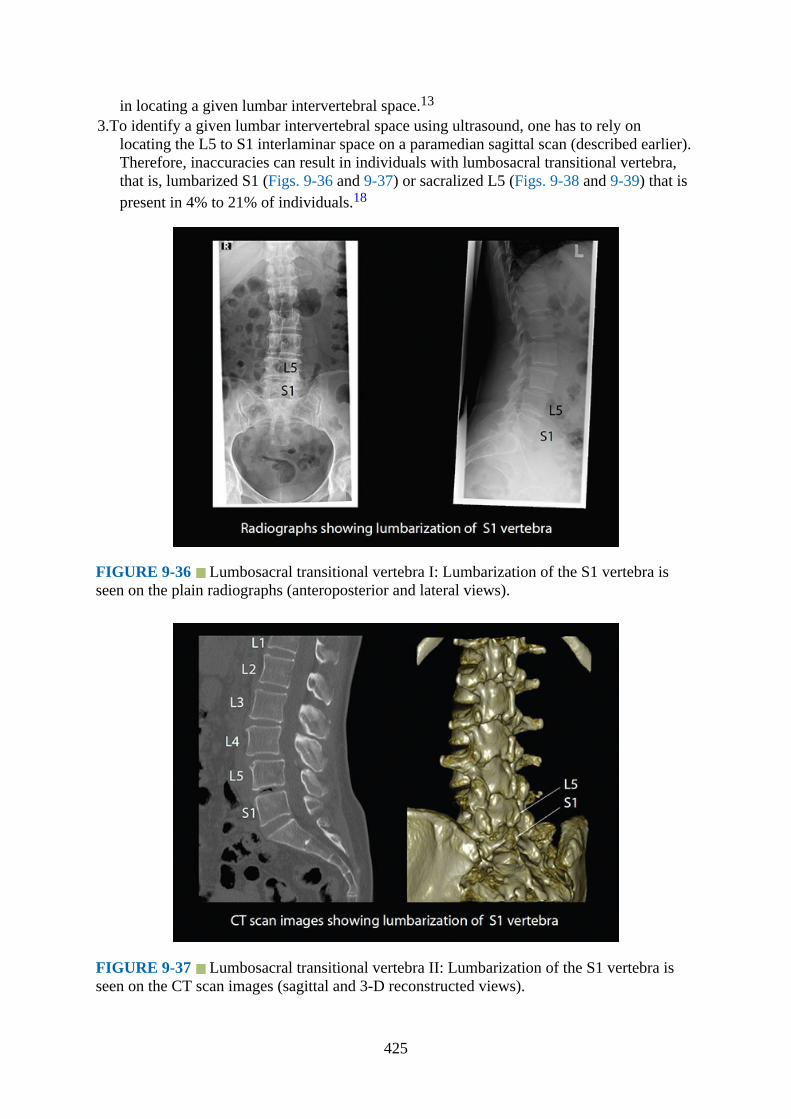
in locating a given lumbar intervertebral space.13
3.To identify a given lumbar intervertebral space using ultrasound, one has to rely onlocating the L5 to S1 interlaminar space on a paramedian sagittal scan (described earlier).Therefore, inaccuracies can result in individuals with lumbosacral transitional vertebra,that is, lumbarized S1 (Figs. 9-36 and 9-37) or sacralized L5 (Figs. 9-38 and 9-39) that ispresent in 4% to 21% of individuals.18
FIGURE 9-36 Lumbosacral transitional vertebra I: Lumbarization of the S1 vertebra isseen on the plain radiographs (anteroposterior and lateral views).
FIGURE 9-37 Lumbosacral transitional vertebra II: Lumbarization of the S1 vertebra isseen on the CT scan images (sagittal and 3-D reconstructed views).
425
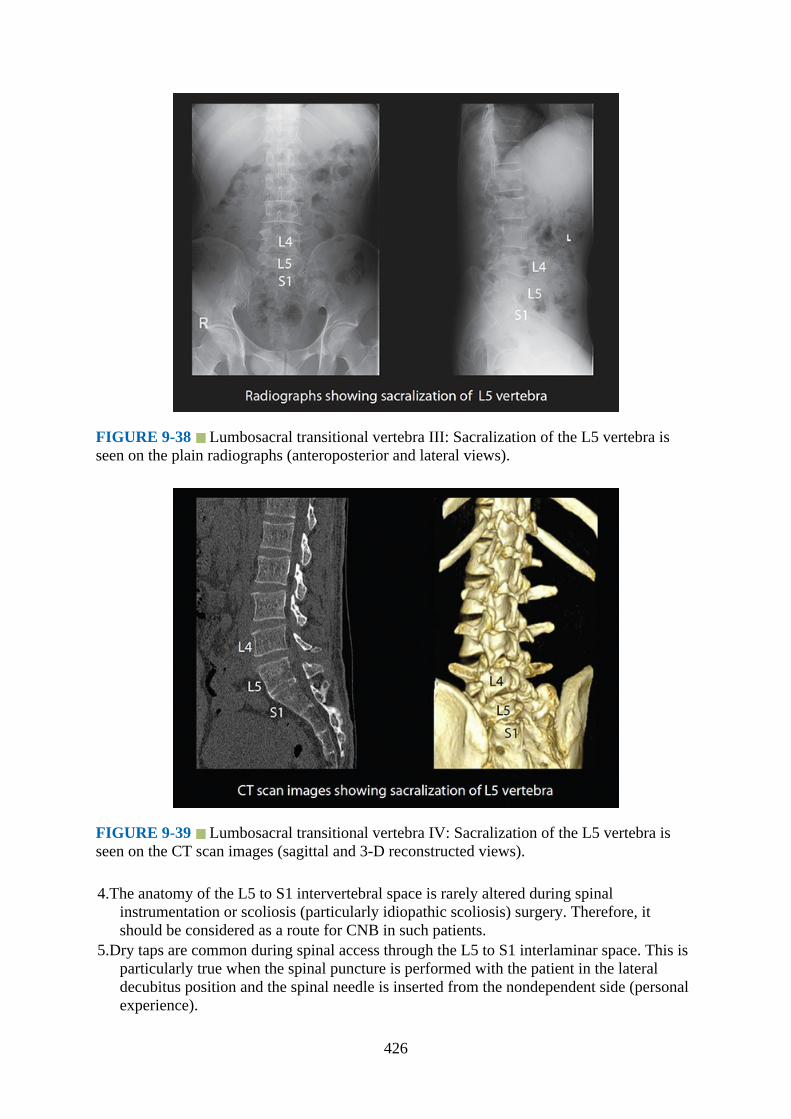
FIGURE 9-38 Lumbosacral transitional vertebra III: Sacralization of the L5 vertebra isseen on the plain radiographs (anteroposterior and lateral views).
FIGURE 9-39 Lumbosacral transitional vertebra IV: Sacralization of the L5 vertebra isseen on the CT scan images (sagittal and 3-D reconstructed views).
4.The anatomy of the L5 to S1 intervertebral space is rarely altered during spinalinstrumentation or scoliosis (particularly idiopathic scoliosis) surgery. Therefore, itshould be considered as a route for CNB in such patients.
5.Dry taps are common during spinal access through the L5 to S1 interlaminar space. This isparticularly true when the spinal puncture is performed with the patient in the lateraldecubitus position and the spinal needle is inserted from the nondependent side (personalexperience).
426
References1.Chen CP, Tang SF, Hsu TC, et al. Ultrasound guidance in caudal epidural needle
placement. Anesthesiology. 2004;101:181–184.2.Chen CP, Wong AM, Hsu CC, et al. Ultrasound as a screening tool for proceeding with
caudal epidural injections. Arch Phys Med Rehabil. 2010;91:358–363.3.Chin KJ, Karmakar MK, Peng P. Ultrasonography of the adult thoracic and lumbar spine
for central neuraxial blockade. Anesthesiology. 2011;114:1459–1485.4.Karmakar MK. Ultrasound for central neuraxial blocks. Tech Reg Anesth Pain Manag.
2009;13:161–170.5.Karmakar MK. Ultrasound guided central neuraxial blocks. In: Narouze S, ed. Atlas of
Ultrasound Guided Procedures in Interventional Pain Management. New York:Springer; 2010.
6.Karmakar MK, Li X, Ho AM, Kwok WH, Chui PT. Real-time ultrasound-guidedparamedian epidural access: evaluation of a novel in-plane technique. Br J Anaesth.2009;102:845–854.
7.Karmakar MK, Li X, Kwok WH, Ho AM, Ngan Kee WD. Sonoanatomy relevant forultrasound-guided central neuraxial blocks via the paramedian approach in the lumbarregion. Br J Radiol. 2012;85:e262–e269.
8.Yoon JS, Sim KH, Kim SJ, Kim WS, Koh SB, Kim BJ. The feasibility of color dopplerultrasonography for caudal epidural steroid injection. Pain. 2005;118:210–214.
9.Taylor JA. Lumbosacral subarachnoid tap. J Urology. 1940;43:561–564.10.Ebraheim NA, Miller RM, Xu R, Yeasting RA. The location of the intervertebral lumbar
disc on the posterior aspect of the spine. Surg Neurol. 1997;48:232–236.11.Costello JF, Balki M. Cesarean delivery under ultrasound-guided spinal anesthesia
[corrected] in a parturient with poliomyelitis and harrington instrumentation. Can JAnaesth. 2008;55:606–611.
12.Yamauchi M, Honma E, Mimura M, Yamamoto H, Takahashi E, Namiki A. Identificationof the lumbar intervertebral level using ultrasound imaging in a post-laminectomypatient. J Anesth. 2006;20:231–233.
13.Furness G, Reilly MP, Kuchi S. An evaluation of ultrasound imaging for identification oflumbar intervertebral level. Anaesthesia. 2002;57:277–280.
14.Hameed F, Hunter DJ, Rainville J, Li L, Suri P. Prevalence of anatomic impediments tointerlaminar lumbar epidural steroid injection. Arch Phys Med Rehabil. 2012;93:339–343.
15.Broadbent CR, Maxwell WB, Ferrie R, Wilson DJ, Gawne-Cain M, Russell R. Ability ofanaesthetists to identify a marked lumbar interspace. Anaesthesia. 2000;55:1122–1126.
16.Whitty R, Moore M, Macarthur A. Identification of the lumbar interspinous spaces:Palpation versus ultrasound. Anesth Analg. 2008;106:538–540, table.
17.Pysyk CL, Persaud D, Bryson GL, Lui A. Ultrasound assessment of the vertebral level ofthe palpated intercristal (Tuffier’s) line. Can J Anaesth. 2010;57:46–49.
18.Hughes RJ, Saifuddin A. Imaging of lumbosacral transitional vertebrae. Clin Radiol.2004;59:984–991.
427

CHAPTER 10
Sonoanatomy Relevant for Thoracic Interfascial NerveBlocks: Pectoral Nerve Block and Serratus Plane Block
IntroductionBlanco and colleagues1–3 have recently described novel ultrasound-guided thoracicinterfascial nerve blocks, the pectoral nerve block (PECS)1,2 and serratus plane block (SPB),3
for anesthesia and/or analgesia of the anterior/anterolateral chest wall.1–4 The SPB may alsoanesthetize the axilla via blockade of the intercostobrachial nerve.3 These blocks wereoriginally developed for breast surgery in an attempt to avoid some of the rare but seriouscomplications of thoracic paravertebral and neuraxial blocks. During a PECS-I block, thelocal anesthetic (0.4 mL/kg or approximately 20–30 ml)1 is injected as a single injection intothe myofascial plane between the pectoralis major and minor muscle, aiming to block themedial and lateral pectoral nerves.1 PECS-II block is a modification of the PECS-I block(modified PECS-I block) and involves two injections.2 The first injection is the same as thatfor a PECS-I block (but with 10 mL of local anesthetic),2 but the second injection isperformed deep to the pectoralis minor muscle, at the level of the third and fourth rib, into theinterfascial plane between the pectoralis minor and serratus anterior muscle (with 20 mL oflocal anesthetic).2 The aim of the PECS-II block is to anesthetize the pectoral nerves,intercostobrachial nerve, third to sixth intercostal nerves, and the long thoracic nerve.2,4 ThePECS-II block is therefore used for more extensive breast surgery, including mastectomywith or without axillary clearance.2 The SPB3 is a more recent addition to the family ofthoracic interfascial nerve blocks and involves a single injection of 0.4 mL/kg of localanesthetic into the myofascial plane between the latissimus dorsi and the serratus anteriormuscle more posteriorly and at the level of the fifth rib.3 Local anesthetic spreads in theserratus plane, deep to the latissimus dorsi, and along the lateral chest wall to affect the lateralcutaneous branches of the second to ninth intercostal nerves and possibly the long thoracicand thoracodorsal nerves.3,4 A clear understanding of the sonoanatomy of the thoracic wall isa prerequisite to effectively using a PECS or SPB. The following section describes the grossanatomy, ultrasound scan technique, and sonoanatomy of the thoracic wall relevant for thethoracic interfascial nerve blocks. Because these blocks are frequently used for breastsurgery, a brief description of the innervation of the breast is also included.
Gross Anatomy1.Muscles: Muscles involved with thoracic interfascial nerve blocks are pectoralis major,
pectoralis minor, serratus anterior, intercostal muscles, and the latissimus dorsi.
428

a.Pectoralis major: The pectoralis major muscle is a triangular, fan-shaped muscle thatmakes up the bulk of the anterior chest wall (Figs. 10-1 and 10-2). It has two parts:the clavicular head and the sternocostal head (Fig. 10-1). The clavicular headoriginates from the medial half of the clavicle, and the sternocostal head arises fromthe anterior surface of the lateral margin of the sternum, the first seven costalcartilages, and aponeurosis of the external oblique muscle. Muscle fibers from the twoheads converge laterally to form a flat tendon that is inserted into the lateral lip of thebicipital groove (intertubercular sulcus) of the humerus. It also forms the anterior foldof the axilla. The pectoralis major muscle receives its innervation from the lateral andmedial pectoral nerves of the brachial plexus. The clavicular head is innervated by thelateral pectoral nerve, and the sternocostal head is innervated by both the lateral andmedial pectoral nerve. It is involved with flexion, adduction, and medial rotation ofthe humerus; depression of the arm and shoulder; and elevation of the ribs.
FIGURE 10-1 Figure showing the anatomy of the anterior chest wall and arrangement ofthe lateral and medial mammary branches of the lateral cutaneous and anterior cutaneousbranches of the intercostal nerve (ICN), respectively.
429
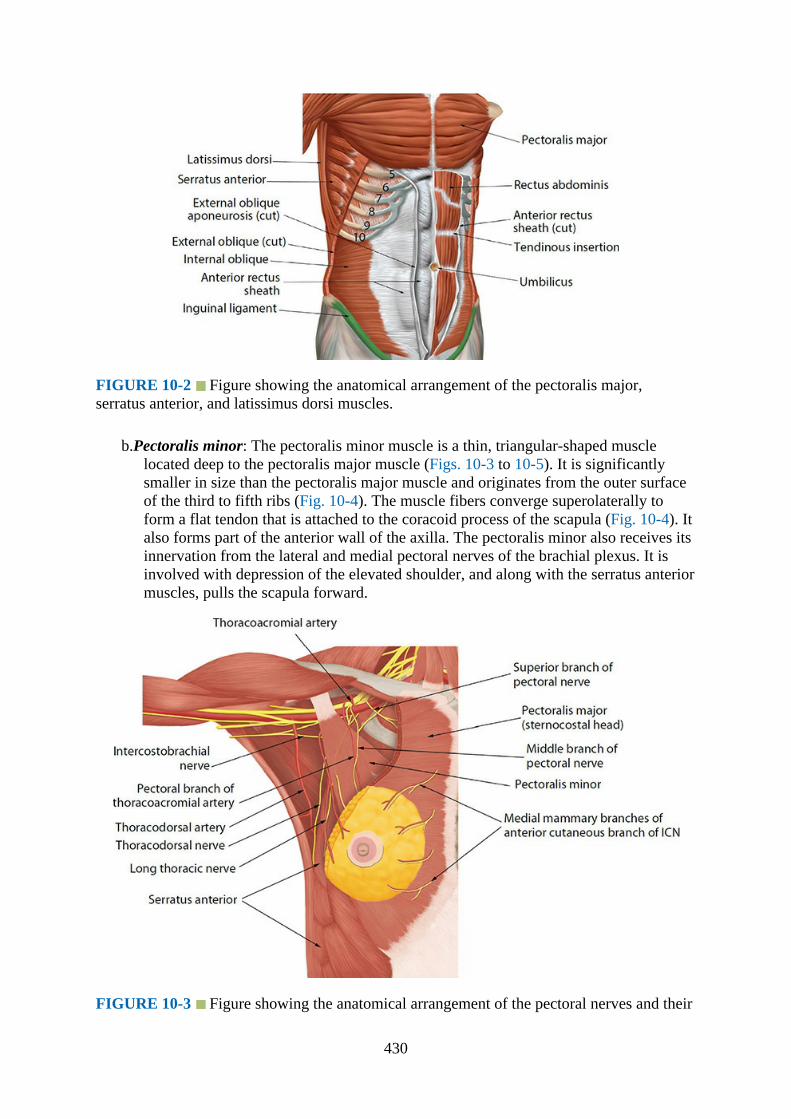
FIGURE 10-2 Figure showing the anatomical arrangement of the pectoralis major,serratus anterior, and latissimus dorsi muscles.
b.Pectoralis minor: The pectoralis minor muscle is a thin, triangular-shaped musclelocated deep to the pectoralis major muscle (Figs. 10-3 to 10-5). It is significantlysmaller in size than the pectoralis major muscle and originates from the outer surfaceof the third to fifth ribs (Fig. 10-4). The muscle fibers converge superolaterally toform a flat tendon that is attached to the coracoid process of the scapula (Fig. 10-4). Italso forms part of the anterior wall of the axilla. The pectoralis minor also receives itsinnervation from the lateral and medial pectoral nerves of the brachial plexus. It isinvolved with depression of the elevated shoulder, and along with the serratus anteriormuscles, pulls the scapula forward.
FIGURE 10-3 Figure showing the anatomical arrangement of the pectoral nerves and their
430
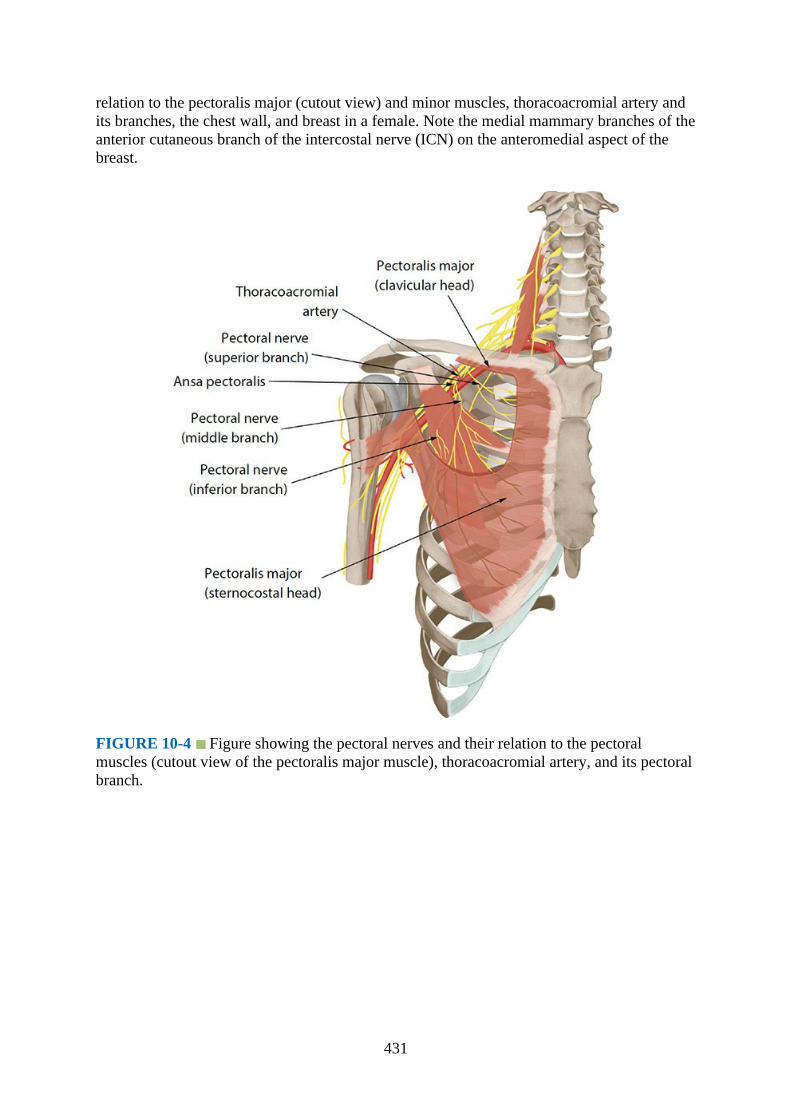
relation to the pectoralis major (cutout view) and minor muscles, thoracoacromial artery andits branches, the chest wall, and breast in a female. Note the medial mammary branches of theanterior cutaneous branch of the intercostal nerve (ICN) on the anteromedial aspect of thebreast.
FIGURE 10-4 Figure showing the pectoral nerves and their relation to the pectoralmuscles (cutout view of the pectoralis major muscle), thoracoacromial artery, and its pectoralbranch.
431
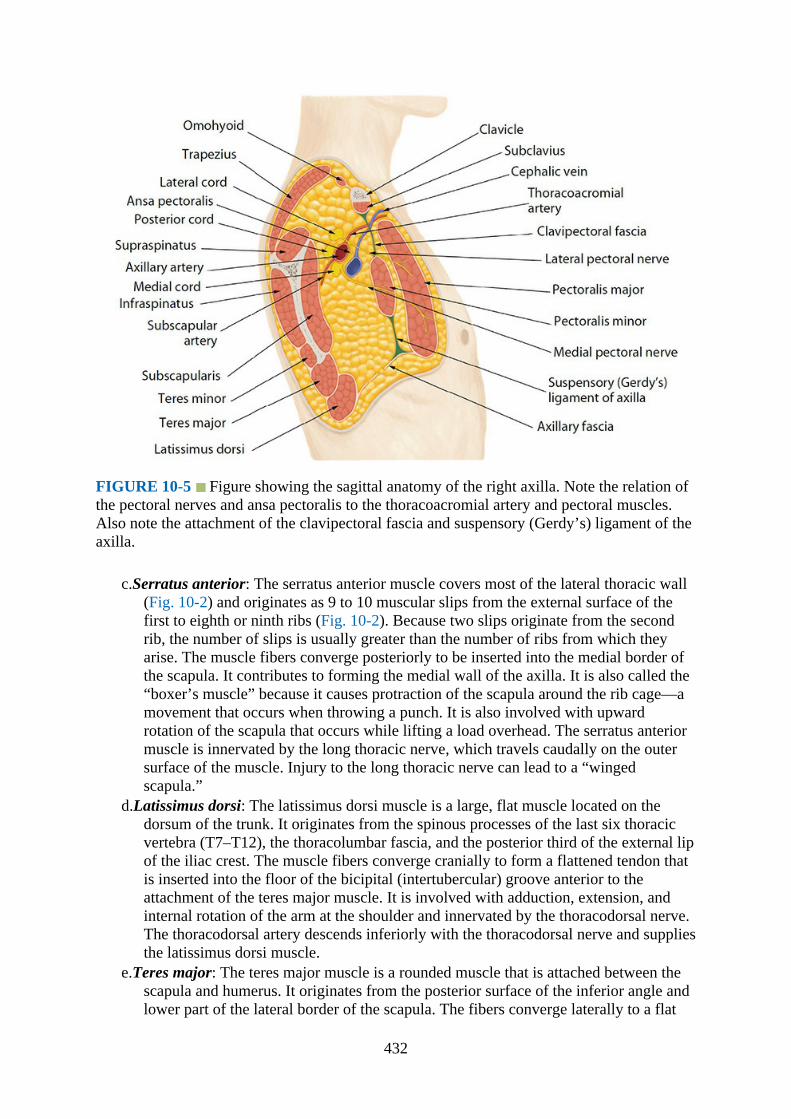
FIGURE 10-5 Figure showing the sagittal anatomy of the right axilla. Note the relation ofthe pectoral nerves and ansa pectoralis to the thoracoacromial artery and pectoral muscles.Also note the attachment of the clavipectoral fascia and suspensory (Gerdy’s) ligament of theaxilla.
c.Serratus anterior: The serratus anterior muscle covers most of the lateral thoracic wall(Fig. 10-2) and originates as 9 to 10 muscular slips from the external surface of thefirst to eighth or ninth ribs (Fig. 10-2). Because two slips originate from the secondrib, the number of slips is usually greater than the number of ribs from which theyarise. The muscle fibers converge posteriorly to be inserted into the medial border ofthe scapula. It contributes to forming the medial wall of the axilla. It is also called the“boxer’s muscle” because it causes protraction of the scapula around the rib cage—amovement that occurs when throwing a punch. It is also involved with upwardrotation of the scapula that occurs while lifting a load overhead. The serratus anteriormuscle is innervated by the long thoracic nerve, which travels caudally on the outersurface of the muscle. Injury to the long thoracic nerve can lead to a “wingedscapula.”
d.Latissimus dorsi: The latissimus dorsi muscle is a large, flat muscle located on thedorsum of the trunk. It originates from the spinous processes of the last six thoracicvertebra (T7–T12), the thoracolumbar fascia, and the posterior third of the external lipof the iliac crest. The muscle fibers converge cranially to form a flattened tendon thatis inserted into the floor of the bicipital (intertubercular) groove anterior to theattachment of the teres major muscle. It is involved with adduction, extension, andinternal rotation of the arm at the shoulder and innervated by the thoracodorsal nerve.The thoracodorsal artery descends inferiorly with the thoracodorsal nerve and suppliesthe latissimus dorsi muscle.
e.Teres major: The teres major muscle is a rounded muscle that is attached between thescapula and humerus. It originates from the posterior surface of the inferior angle andlower part of the lateral border of the scapula. The fibers converge laterally to a flat
432

tendon that is inserted into the medial lip of the bicipital groove. The teres major islocated superior to the latissimus dorsi, and the muscle fibers run parallel to eachother to its insertion in the humerus. It is innervated by the lower subscapular andthoracodorsal nerves, which are branches of the posterior cord of the brachial plexus,and receives spinal contributions from the C5 to C8 spinal nerves. It is involved withextension and medial rotation of the humerus.
2.Nerves: The nerves involved with thoracic interfascial nerve blocks are intercostal nerves,pectoral nerves, long thoracic nerve, and thoracodorsal nerve.a.Intercostal nerve: The intercostal nerves are the anterior primary rami of the spinal
nerves T1 to T11. The anterior primary rami of the 12th spinal nerve form thesubcostal nerve. The first and second intercostal nerve, in addition to supplying theintercostal spaces, provide innervation to the upper limb. The lower five intercostalnerves (T7–T11) also supply the abdominal wall and are therefore called thethoracoabdominal nerves. The intercostal nerves. T3 to T6 are typical intercostalnerves because they only supply the thoracic wall. The anterior division of the firstthoracic spinal nerve divides into two branches: a larger branch that exits the thoraxclose to the neck of the first rib, and a smaller branch, the first intercostal nerve, thatruns through the intercostal space and ends close to the sternum as the anteriorcutaneous branch of T1. The first intercostal nerve also receives a smallcommunication from the second intercostal nerve posteriorly along the neck of therib. This is the “nerve of Kuntz,” which is present in 40% to 80% of individuals.
Each typical intercostal nerve (Fig. 10-6) passes below the neck of the rib (with thesame number) to enter the costal groove. At the posterior part of the costal groove, theintercostal nerve lies between the parietal pleura (with the endothoracic fascia) and theinternal intercostal membrane (Fig. 10-6). Otherwise, throughout its course throughthe intercostal space, the intercostal nerve lies between the innermost intercostal andthe internal intercostal muscle (Figs. 10-6 and 10-7). The lateral cutaneous branchpierces the intercostal and serratus anterior muscle complex at the level of themidaxillary line and gives off its anterior and posterior branches (Figs. 10-6, 10-8, and10-9). The anterior branch (T2–T6) courses forward and supplies the skin on thelateral and anterior aspect of the chest wall (Figs. 10-1, 10-6, and 10-9). In femalesthey form the lateral mammary branches of the intercostal nerve (same number) andsupply the breast (Figs. 10-6 and 10-10). The posterior branch courses backwards andsupplies the skin over the scapula and the latissimus dorsi muscle. The anteriorcutaneous branch of the intercostal nerve (ie, the main intercostal nerve) coursesforward through the intercostal space and emerges close to the sternum by crossinganterior to the internal thoracic (mammary) artery (Fig. 10-6). It then pierces theinternal intercostal muscle, the external intercostal membrane, and the pectoralis majormuscle to terminate as the anterior cutaneous nerve of the thorax and innervate theoverlying skin after dividing into its medial and lateral branches (Fig. 10-6). Thelateral branch supplies the medial and anterior aspect of the chest wall and in femalesthe medial and anterior aspect of the breast and thus is referred to as the medialmammary nerves (T2–T6) (Figs. 10-3, 10-6, and 10-10). The intercostobrachial nerve,which corresponds to the lateral cutaneous branch of the second intercostal nerve (T2),emerges from the intercostal space and runs oblique towards the arm to supply theaxilla and upper part of the medial aspect of the arm (Figs. 10-3, 10-8, and 10-10). Theintercostobrachial nerve may also receive contributions from the first, third, and fourthintercostal nerves.5
433

FIGURE 10-6 Transverse section of the thorax showing a typical intercostal nerve and itsrelation to the intercostal and pectoral muscles. Note the formation of the medial and lateralmammary nerves from the intercostal nerve (ICN).
FIGURE 10-7 Figure showing the anatomy of the intercostal space.
434
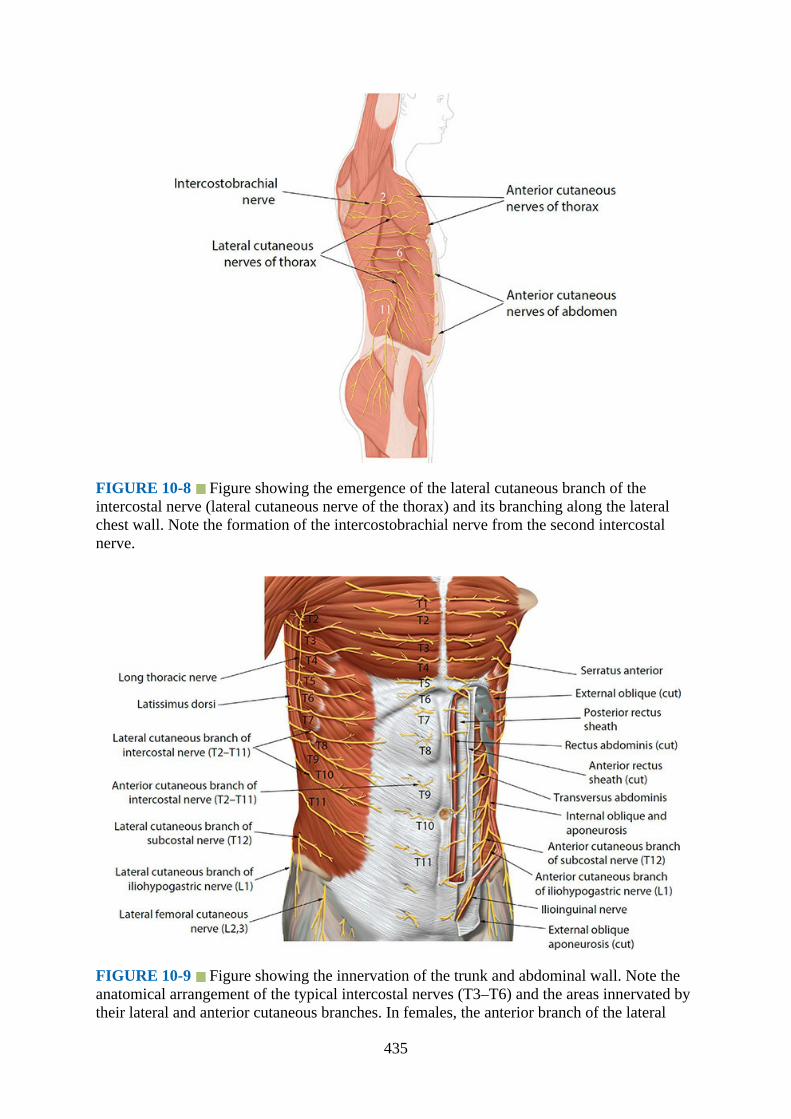
FIGURE 10-8 Figure showing the emergence of the lateral cutaneous branch of theintercostal nerve (lateral cutaneous nerve of the thorax) and its branching along the lateralchest wall. Note the formation of the intercostobrachial nerve from the second intercostalnerve.
FIGURE 10-9 Figure showing the innervation of the trunk and abdominal wall. Note theanatomical arrangement of the typical intercostal nerves (T3–T6) and the areas innervated bytheir lateral and anterior cutaneous branches. In females, the anterior branch of the lateral
435
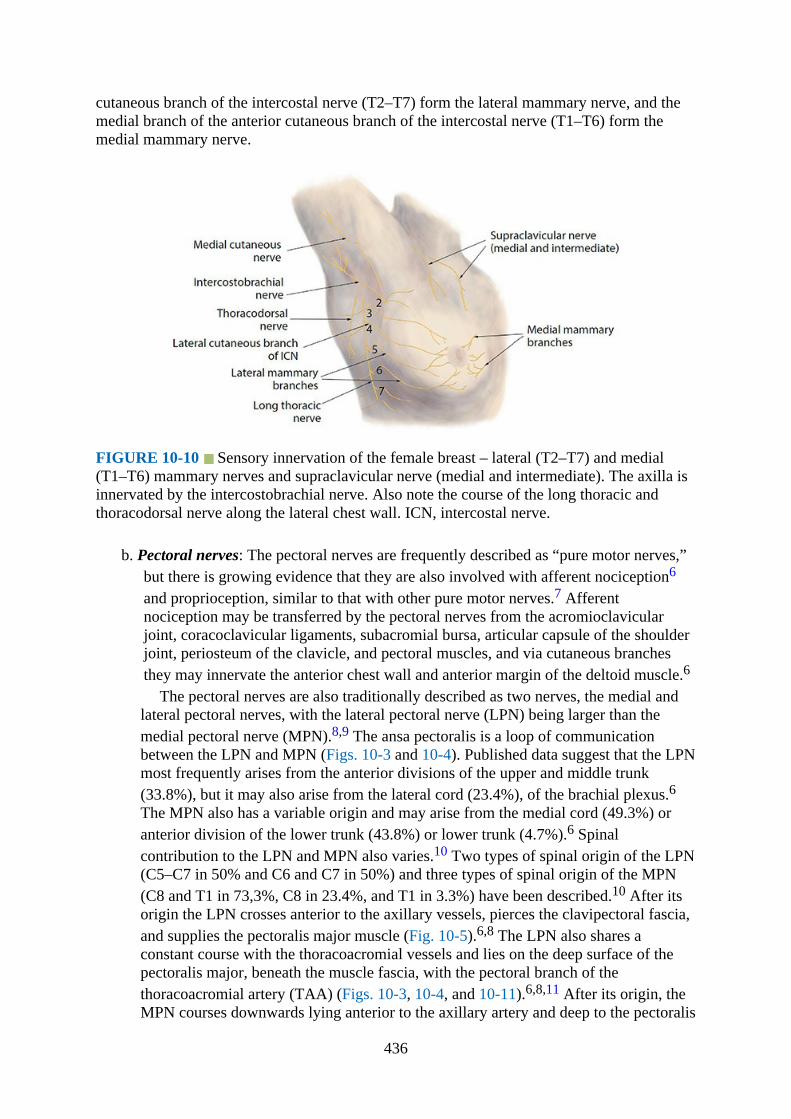
cutaneous branch of the intercostal nerve (T2–T7) form the lateral mammary nerve, and themedial branch of the anterior cutaneous branch of the intercostal nerve (T1–T6) form themedial mammary nerve.
FIGURE 10-10 Sensory innervation of the female breast – lateral (T2–T7) and medial(T1–T6) mammary nerves and supraclavicular nerve (medial and intermediate). The axilla isinnervated by the intercostobrachial nerve. Also note the course of the long thoracic andthoracodorsal nerve along the lateral chest wall. ICN, intercostal nerve.
b. Pectoral nerves: The pectoral nerves are frequently described as “pure motor nerves,”but there is growing evidence that they are also involved with afferent nociception6
and proprioception, similar to that with other pure motor nerves.7 Afferentnociception may be transferred by the pectoral nerves from the acromioclavicularjoint, coracoclavicular ligaments, subacromial bursa, articular capsule of the shoulderjoint, periosteum of the clavicle, and pectoral muscles, and via cutaneous branchesthey may innervate the anterior chest wall and anterior margin of the deltoid muscle.6
The pectoral nerves are also traditionally described as two nerves, the medial andlateral pectoral nerves, with the lateral pectoral nerve (LPN) being larger than themedial pectoral nerve (MPN).8,9 The ansa pectoralis is a loop of communicationbetween the LPN and MPN (Figs. 10-3 and 10-4). Published data suggest that the LPNmost frequently arises from the anterior divisions of the upper and middle trunk(33.8%), but it may also arise from the lateral cord (23.4%), of the brachial plexus.6The MPN also has a variable origin and may arise from the medial cord (49.3%) oranterior division of the lower trunk (43.8%) or lower trunk (4.7%).6 Spinalcontribution to the LPN and MPN also varies.10 Two types of spinal origin of the LPN(C5–C7 in 50% and C6 and C7 in 50%) and three types of spinal origin of the MPN(C8 and T1 in 73,3%, C8 in 23.4%, and T1 in 3.3%) have been described.10 After itsorigin the LPN crosses anterior to the axillary vessels, pierces the clavipectoral fascia,and supplies the pectoralis major muscle (Fig. 10-5).6,8 The LPN also shares aconstant course with the thoracoacromial vessels and lies on the deep surface of thepectoralis major, beneath the muscle fascia, with the pectoral branch of thethoracoacromial artery (TAA) (Figs. 10-3, 10-4, and 10-11).6,8,11 After its origin, theMPN courses downwards lying anterior to the axillary artery and deep to the pectoralis
436
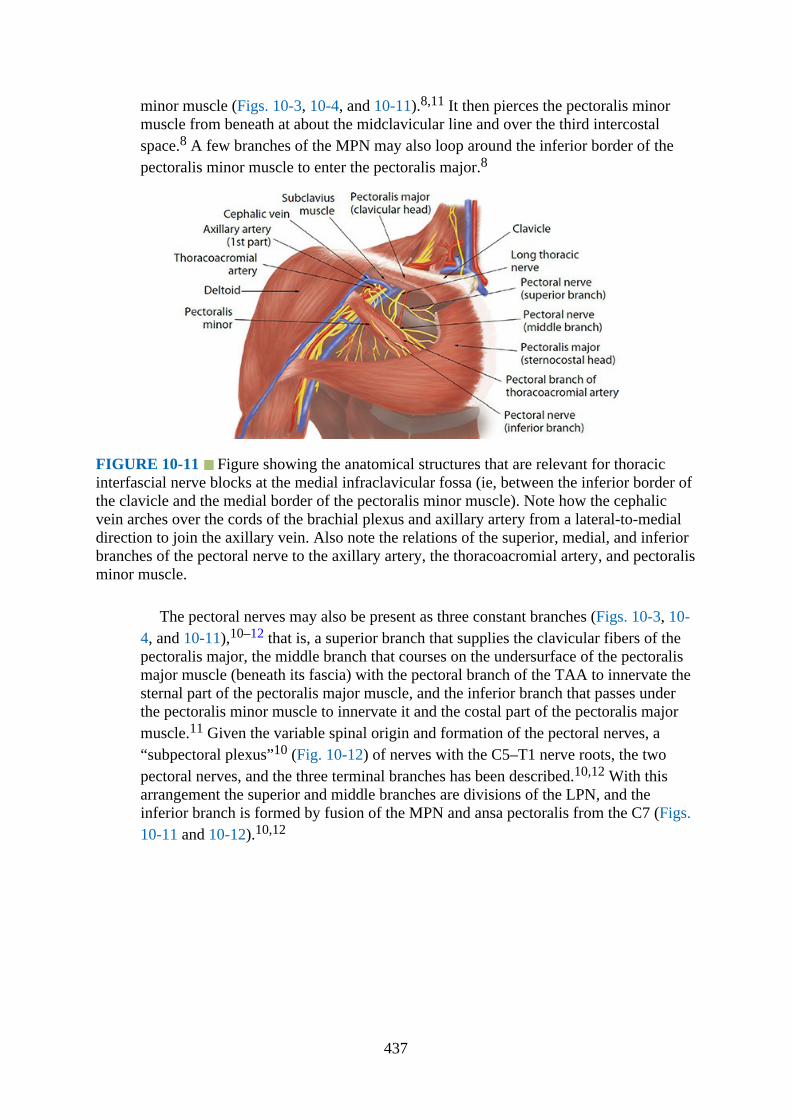
minor muscle (Figs. 10-3, 10-4, and 10-11).8,11 It then pierces the pectoralis minormuscle from beneath at about the midclavicular line and over the third intercostalspace.8 A few branches of the MPN may also loop around the inferior border of thepectoralis minor muscle to enter the pectoralis major.8
FIGURE 10-11 Figure showing the anatomical structures that are relevant for thoracicinterfascial nerve blocks at the medial infraclavicular fossa (ie, between the inferior border ofthe clavicle and the medial border of the pectoralis minor muscle). Note how the cephalicvein arches over the cords of the brachial plexus and axillary artery from a lateral-to-medialdirection to join the axillary vein. Also note the relations of the superior, medial, and inferiorbranches of the pectoral nerve to the axillary artery, the thoracoacromial artery, and pectoralisminor muscle.
The pectoral nerves may also be present as three constant branches (Figs. 10-3, 10-4, and 10-11),10–12 that is, a superior branch that supplies the clavicular fibers of thepectoralis major, the middle branch that courses on the undersurface of the pectoralismajor muscle (beneath its fascia) with the pectoral branch of the TAA to innervate thesternal part of the pectoralis major muscle, and the inferior branch that passes underthe pectoralis minor muscle to innervate it and the costal part of the pectoralis majormuscle.11 Given the variable spinal origin and formation of the pectoral nerves, a“subpectoral plexus”10 (Fig. 10-12) of nerves with the C5–T1 nerve roots, the twopectoral nerves, and the three terminal branches has been described.10,12 With thisarrangement the superior and middle branches are divisions of the LPN, and theinferior branch is formed by fusion of the MPN and ansa pectoralis from the C7 (Figs.10-11 and 10-12).10,12
437

FIGURE 10-12 Schematic diagram showing the formation of the “subpectoral plexus”10
of nerves with both the medial and lateral pectoral nerve and the three terminal branches (ie,the superior, middle, and inferior branches). The superior and middle branches are derivedfrom the lateral pectoral nerve, and the inferior branch is derived from the ansa pectoralis (C7spinal nerve root) and medial pectoral nerve.
c.Long thoracic nerve: The long thoracic nerve, also known as the Bell’s nerve,originates from the ventral rami of the C5, C6, and C7 and descends to the lateralthoracic wall (Fig. 10-9) where it innervates the serratus anterior muscle.
d.Thoracodorsal nerve: The thoracodorsal nerve originates from the posterior cord of thebrachial plexus with spinal contributions from the C6 to C8. As it descends along theposterior wall of the axilla, it is accompanied by the thoracodorsal artery andinnervates the latissimus dorsi muscle.
3.Blood vessels: The following blood vessels are of interest while performing thoracicinterfascial nerve blocks: axillary, thoracoacromial, and thoracodorsal artery.a.Axillary artery: The axillary artery is a continuation of the subclavian artery into the
axilla. It begins at the lateral border of the first rib and ends at the lower border of theteres major muscle after which it continues distally as the brachial artery. It has threeparts: the first part lies between the lateral border of the first rib and the medial borderof the pectoralis minor muscle and gives off the superior thoracic artery; the secondpart lies deep to the pectoralis minor muscle and gives off the lateral thoracic andTAA; the third part lies between the lateral border of the pectoralis minor muscle andthe lower border of the teres major muscle and gives off three branches: thesubscapular artery, the anterior circumflex humeral artery, and the posteriorcircumflex humeral artery.
b.Thoracoacromial artery: The TAA, after its origin (Figs. 10-3 and 10-4), runs a shortcourse along the upper margin of the pectoralis minor muscle, penetrates theclavipectoral fascia (Fig. 10-5), and divides into its terminal branches: the clavicular,
438

acromial, deltoid, and pectoral branches. The TAA is important for a PECS blockbecause, as described earlier, the pectoral nerves and the ansa pectoralis have aconstant relationship with the artery (Fig. 10-11).8,9 The LPN also runs parallel to thepectoral branch of the TAA in the myofascial plane between the pectoralis major andminor muscles (Figs. 10-4 and 10-11), lying deep to the muscle fascia.8,9 The ansapectoralis nerve is also formed immediately distal to the origin of the TAA (Fig. 10-4).6
c.Thoracodorsal artery: The thoracodorsal artery (Fig. 10-3) is a branch of thesubscapular artery and travels inferiorly along the lateral chest wall (Fig. 10-3), lyingdeep to the latissimus dorsi muscle initially and then on the external surface of theserratus anterior muscle. It is accompanied by the thoracodorsal nerve (Fig. 10-3) andsupplies the latissimus dorsi.
4.Fasciaa.Clavipectoral fascia: This is a fascial layer that is interposed between the clavicle and
upper border of the pectoralis minor muscle (Fig. 10-5). The portion of theclavipectoral fascia that is attached between the first costosternal articulation and thecoracoid process is usually denser than the rest and is referred to as the “costocoracoidligament.” Inferiorly it is thin, and at the upper border of the pectoralis minor muscleit splits to invest the muscle (Fig. 10-5). Below the inferior border of the pectoralisminor muscle the clavipectoral fascia continues downwards as a single layer, thesuspensory ligament of axilla, or Gerdy’s ligament, and attaches to the axillary fascia(Fig. 10-5). The clavipectoral fascia is pierced by the cephalic vein, lateral pectoralnerve, TAA, and lymphatics (Fig. 10-5).
Innervation of the BreastThe sensory and glandular innervation of the female breast comes from multiple sources.Medially it is innervated by the anterior cutaneous branches (medial mammary nerves) of thefirst to sixth intercostal nerves (Figs. 10-6 and 10-13) and laterally by the lateral cutaneousbranches (lateral mammary nerves) of the second to seventh intercostal nerves (Fig. 10-10).13
The nipple–areola complex is supplied mainly by the anterior and lateral cutaneous branchesof the fourth intercostal nerve (Fig. 10-13), with additional contributions from the cutaneousbranches of the third and fifth intercostal nerves.13 The skin of the superior part of the breast(infraclavicular region) receives innervation from the superficial cervical plexus via themedial and intermediate supraclavicular nerves (C3 and C4, Figs. 10-10 and 10-14). Thelateral supraclavicular nerve mainly provides sensory supply to the upper and posterior aspectof the shoulder, but may also contribute to sensory innervation of the breast (Fig. 10-14).Sympathetic nerves reach the breast via the somatic nerves (described earlier) and bloodvessels. There is no parasympathetic nerve supply to the breast. When breast surgery involvesthe axilla (eg, axillary dissection) and pectoral muscles (eg, modified radical mastectomy),the intercostobrachial and pectoral nerves (LPN and MPN) may also be involved in afferentnociception (discussed earlier).
439
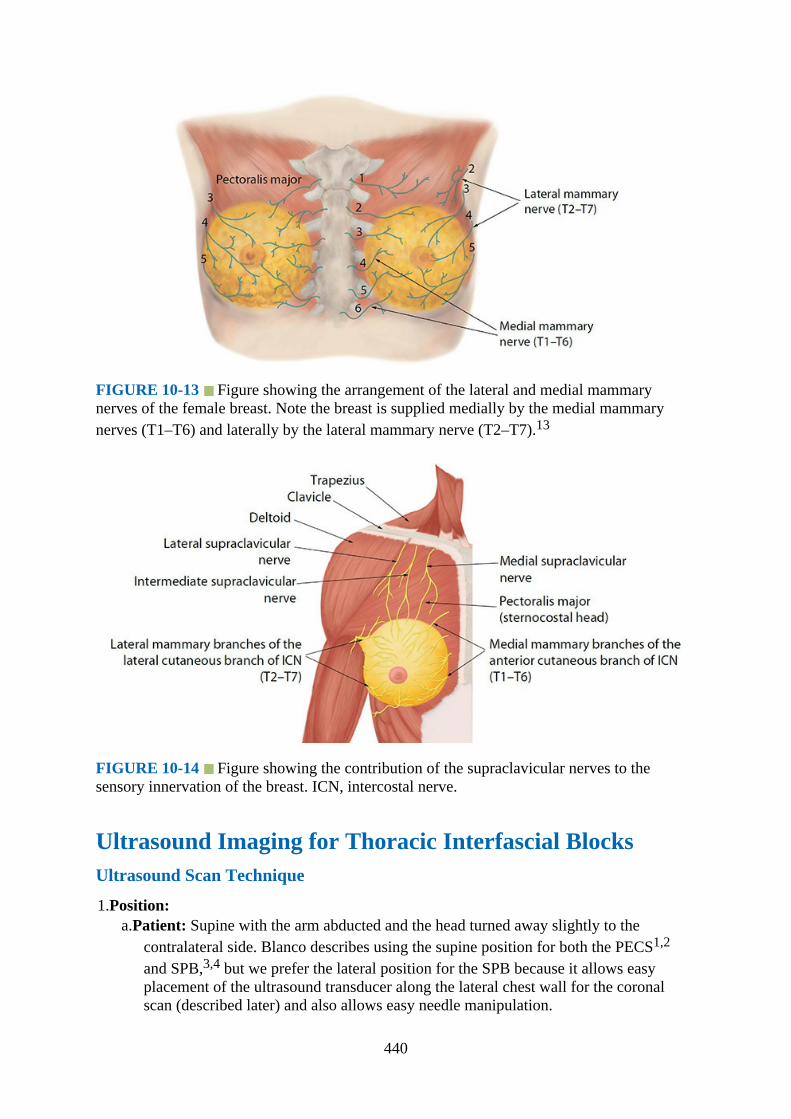
FIGURE 10-13 Figure showing the arrangement of the lateral and medial mammarynerves of the female breast. Note the breast is supplied medially by the medial mammarynerves (T1–T6) and laterally by the lateral mammary nerve (T2–T7).13
FIGURE 10-14 Figure showing the contribution of the supraclavicular nerves to thesensory innervation of the breast. ICN, intercostal nerve.
Ultrasound Imaging for Thoracic Interfascial BlocksUltrasound Scan Technique
1.Position:a.Patient: Supine with the arm abducted and the head turned away slightly to the
contralateral side. Blanco describes using the supine position for both the PECS1,2
and SPB,3,4 but we prefer the lateral position for the SPB because it allows easyplacement of the ultrasound transducer along the lateral chest wall for the coronalscan (described later) and also allows easy needle manipulation.
440
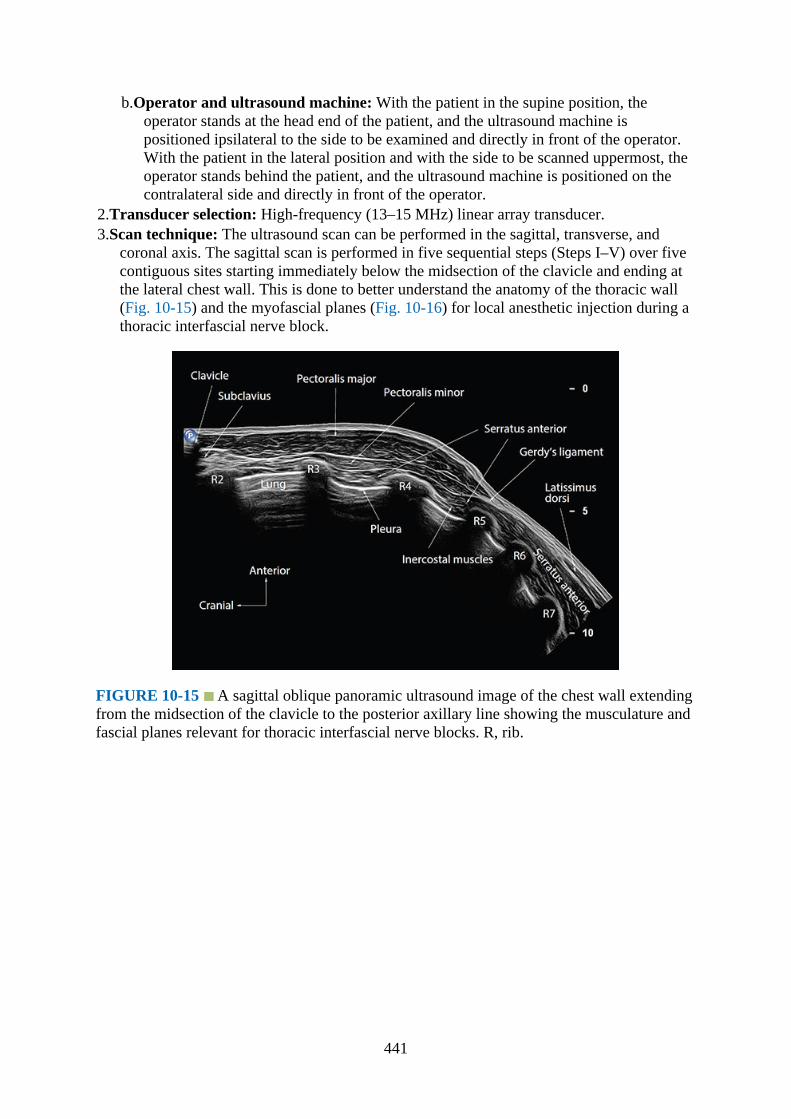
b.Operator and ultrasound machine: With the patient in the supine position, theoperator stands at the head end of the patient, and the ultrasound machine ispositioned ipsilateral to the side to be examined and directly in front of the operator.With the patient in the lateral position and with the side to be scanned uppermost, theoperator stands behind the patient, and the ultrasound machine is positioned on thecontralateral side and directly in front of the operator.
2.Transducer selection: High-frequency (13–15 MHz) linear array transducer.3.Scan technique: The ultrasound scan can be performed in the sagittal, transverse, and
coronal axis. The sagittal scan is performed in five sequential steps (Steps I–V) over fivecontiguous sites starting immediately below the midsection of the clavicle and ending atthe lateral chest wall. This is done to better understand the anatomy of the thoracic wall(Fig. 10-15) and the myofascial planes (Fig. 10-16) for local anesthetic injection during athoracic interfascial nerve block.
FIGURE 10-15 A sagittal oblique panoramic ultrasound image of the chest wall extendingfrom the midsection of the clavicle to the posterior axillary line showing the musculature andfascial planes relevant for thoracic interfascial nerve blocks. R, rib.
441
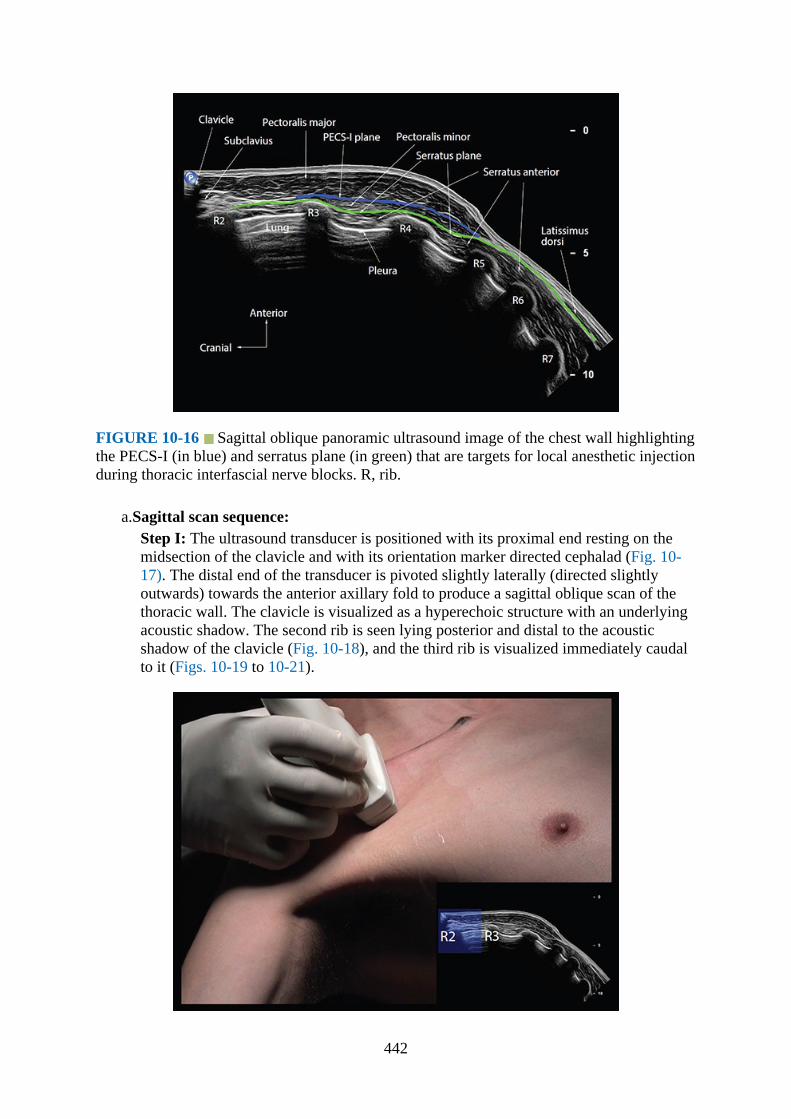
FIGURE 10-16 Sagittal oblique panoramic ultrasound image of the chest wall highlightingthe PECS-I (in blue) and serratus plane (in green) that are targets for local anesthetic injectionduring thoracic interfascial nerve blocks. R, rib.
a.Sagittal scan sequence:Step I: The ultrasound transducer is positioned with its proximal end resting on themidsection of the clavicle and with its orientation marker directed cephalad (Fig. 10-17). The distal end of the transducer is pivoted slightly laterally (directed slightlyoutwards) towards the anterior axillary fold to produce a sagittal oblique scan of thethoracic wall. The clavicle is visualized as a hyperechoic structure with an underlyingacoustic shadow. The second rib is seen lying posterior and distal to the acousticshadow of the clavicle (Fig. 10-18), and the third rib is visualized immediately caudalto it (Figs. 10-19 to 10-21).
442

FIGURE 10-17 Figure showing the position of the patient and ultrasound transducerduring Step I of the sagittal scan sequence. Inset sagittal sonogram shows the plane ofultrasound imaging (blue color) over the second intercostal space. R, rib.
FIGURE 10-18 A. Sagittal oblique sonogram of the medial infraclavicular fossa (MICF),near the midsection of the clavicle, acquired during Step I of the sagittal scan sequence. Notethe second rib lies immediately posteroinferior to the clavicle, and the medial border of thepectoralis minor muscle extends to the upper border of the third rib. B. Position of patient andultrasound transducer during Step I of the sagittal scan sequence. R, rib.
443

FIGURE 10-19 A. Sagittal oblique sonogram of the anterior chest wall with the ultrasoundtransducer positioned slightly lateral to that in Fig. 10-18. The axillary artery (AA) isvisualized deep to the subclavius muscle and cranial to the axillary vein (AV). Also note howthe cephalic vein (CV) joins the axillary vein from above in the medial infraclavicular fossa(MICF). B. Position of patient and ultrasound transducer during the sagittal oblique scan. R,rib.
444

FIGURE 10-20 A. Sagittal oblique sonogram of the anterior chest wall acquired duringStep I of the sagittal scan sequence with the ultrasound transducer positioned over the axillaryartery (midclavicular point). Note the cords of the brachial plexus are clustered togethercranial to the axillary artery and within the costoclavicular space (CCS), which is between theclavicular head of the pectoralis major and subclavius muscle anteriorly and the upper slips ofthe serratus anterior muscle overlying the second rib posteriorly. The axillary vein (AV) liescaudal to the axillary artery in this sonogram. Also note parts of the thoracoacromial artery(TAA) can be seen near the upper border of the pectoralis minor muscle. B. Position of thepatient and ultrasound transducer during the scan. R, rib; PC, posterior cord; MC, medialcord; LA, lateral cord.
445

FIGURE 10-21 Sagittal oblique sonogram of the anterior chest wall acquired during Step Iof the sagittal scan sequence with the ultrasound transducer lying parallel to the axillaryartery. Note the origin of the thoracoacromial artery from the anterior wall of the first part ofthe axillary artery in this subject. R, rib.
FIGURE 10-22 Figure showing the position of the patient and ultrasound transducerduring Step II of the sagittal scan sequence. The inset sagittal sonogram shows the plane ofultrasound imaging (green) over the third intercostal space. R, rib.
446
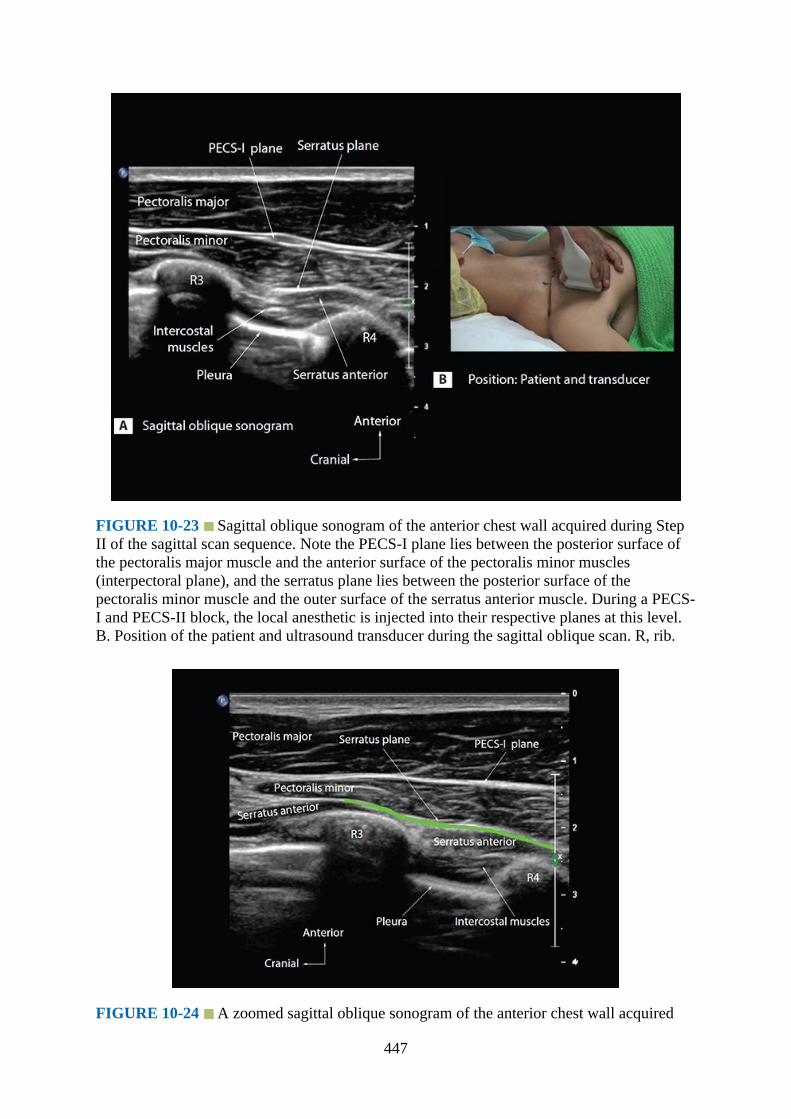
FIGURE 10-23 Sagittal oblique sonogram of the anterior chest wall acquired during StepII of the sagittal scan sequence. Note the PECS-I plane lies between the posterior surface ofthe pectoralis major muscle and the anterior surface of the pectoralis minor muscles(interpectoral plane), and the serratus plane lies between the posterior surface of thepectoralis minor muscle and the outer surface of the serratus anterior muscle. During a PECS-I and PECS-II block, the local anesthetic is injected into their respective planes at this level.B. Position of the patient and ultrasound transducer during the sagittal oblique scan. R, rib.
FIGURE 10-24 A zoomed sagittal oblique sonogram of the anterior chest wall acquired
447
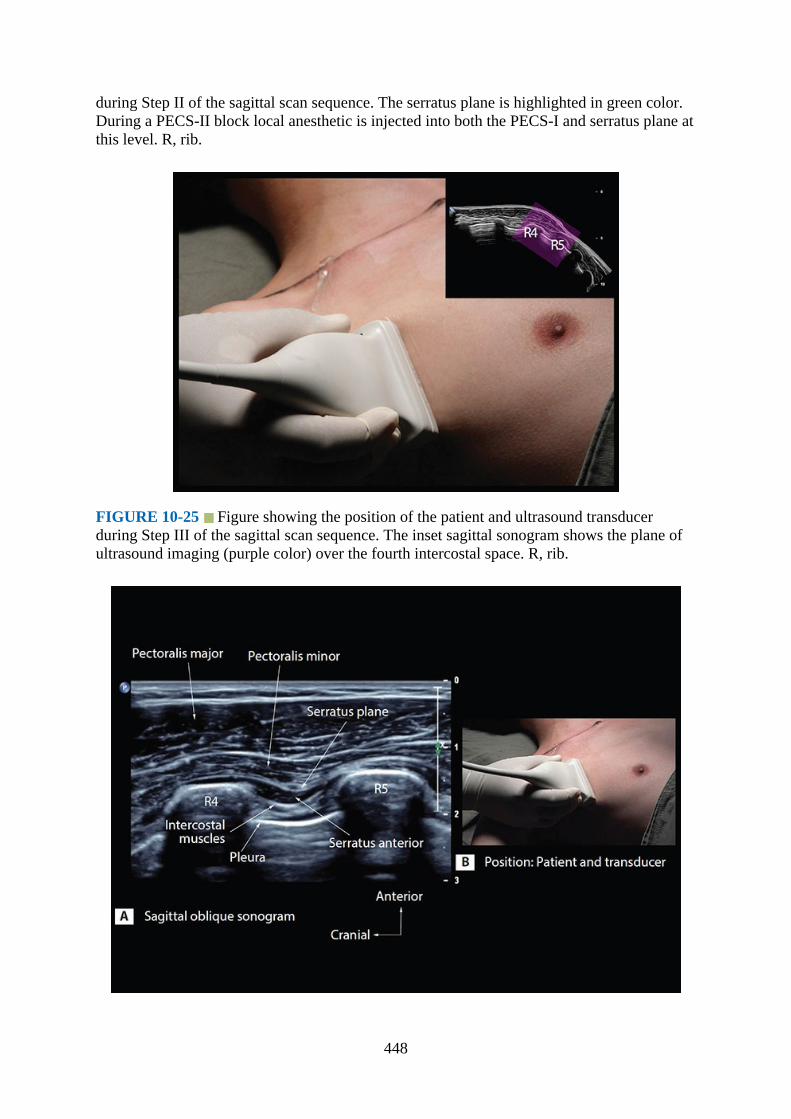
during Step II of the sagittal scan sequence. The serratus plane is highlighted in green color.During a PECS-II block local anesthetic is injected into both the PECS-I and serratus plane atthis level. R, rib.
FIGURE 10-25 Figure showing the position of the patient and ultrasound transducerduring Step III of the sagittal scan sequence. The inset sagittal sonogram shows the plane ofultrasound imaging (purple color) over the fourth intercostal space. R, rib.
448
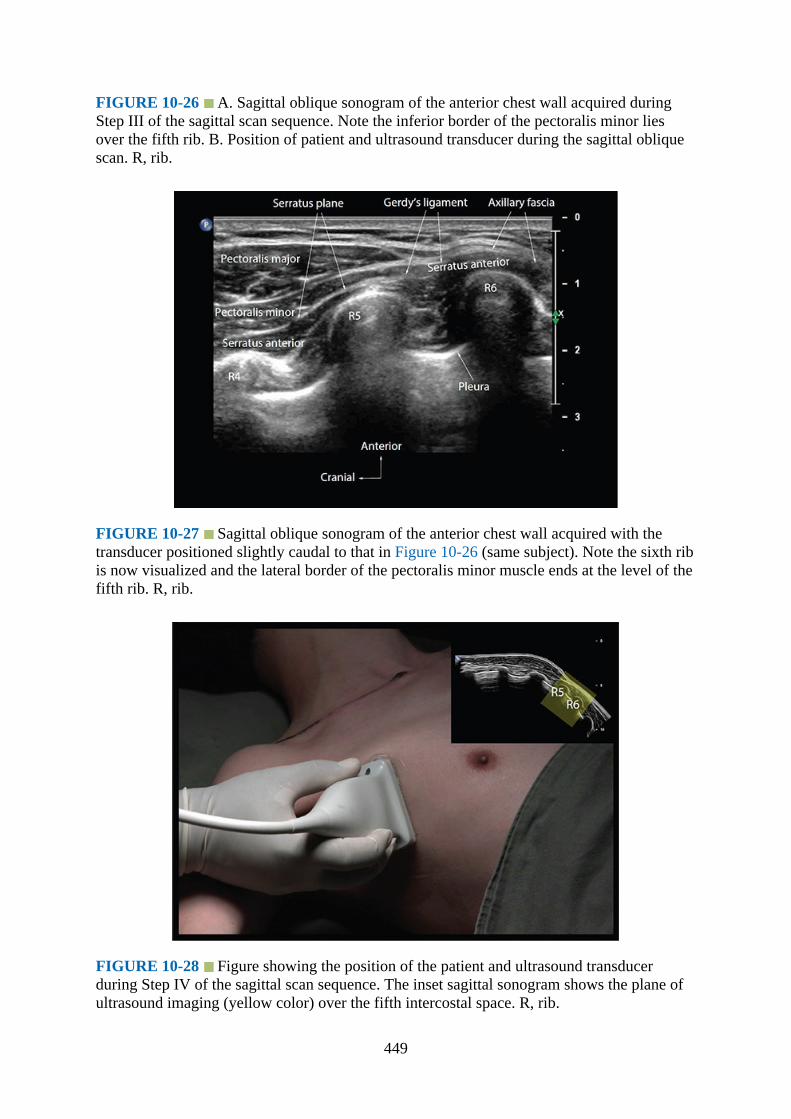
FIGURE 10-26 A. Sagittal oblique sonogram of the anterior chest wall acquired duringStep III of the sagittal scan sequence. Note the inferior border of the pectoralis minor liesover the fifth rib. B. Position of patient and ultrasound transducer during the sagittal obliquescan. R, rib.
FIGURE 10-27 Sagittal oblique sonogram of the anterior chest wall acquired with thetransducer positioned slightly caudal to that in Figure 10-26 (same subject). Note the sixth ribis now visualized and the lateral border of the pectoralis minor muscle ends at the level of thefifth rib. R, rib.
FIGURE 10-28 Figure showing the position of the patient and ultrasound transducerduring Step IV of the sagittal scan sequence. The inset sagittal sonogram shows the plane ofultrasound imaging (yellow color) over the fifth intercostal space. R, rib.
449
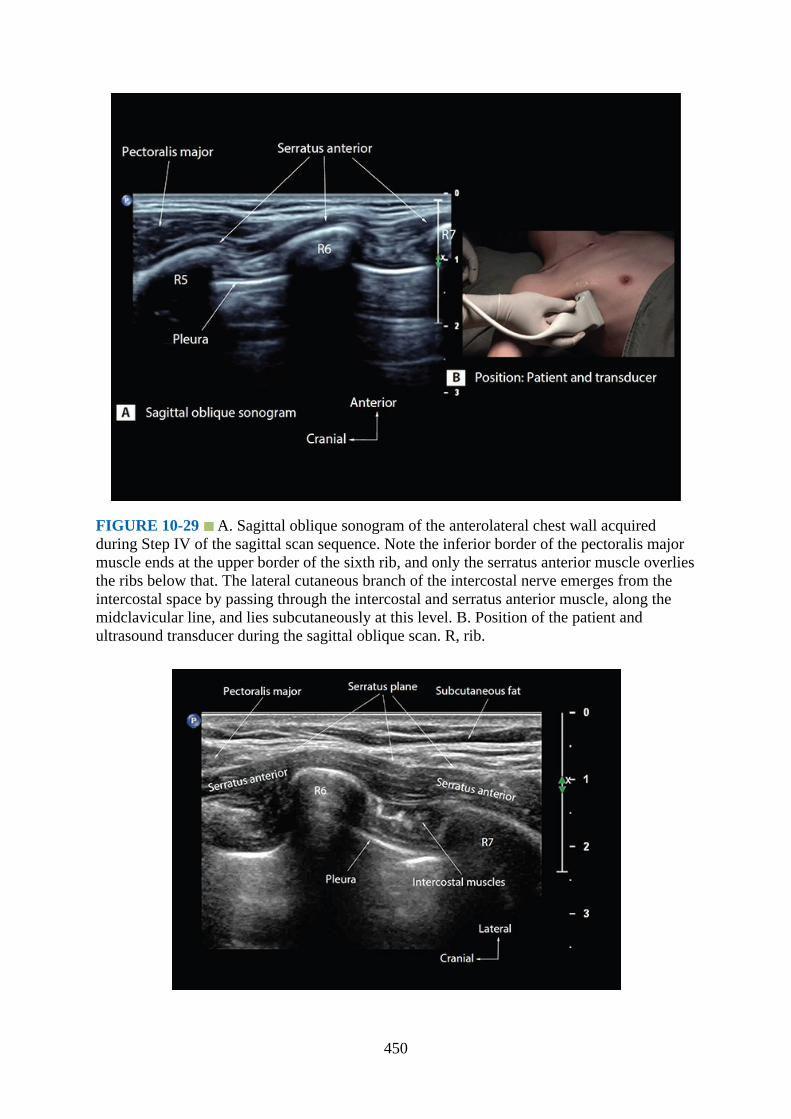
FIGURE 10-29 A. Sagittal oblique sonogram of the anterolateral chest wall acquiredduring Step IV of the sagittal scan sequence. Note the inferior border of the pectoralis majormuscle ends at the upper border of the sixth rib, and only the serratus anterior muscle overliesthe ribs below that. The lateral cutaneous branch of the intercostal nerve emerges from theintercostal space by passing through the intercostal and serratus anterior muscle, along themidclavicular line, and lies subcutaneously at this level. B. Position of the patient andultrasound transducer during the sagittal oblique scan. R, rib.
450
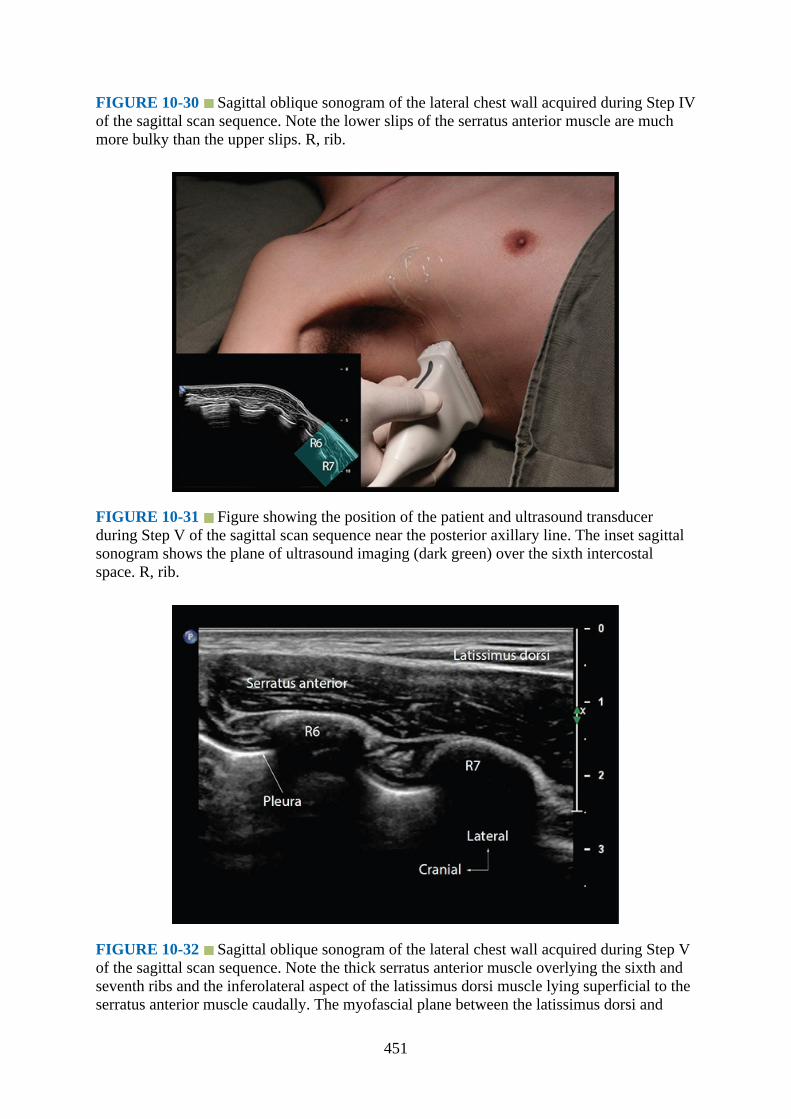
FIGURE 10-30 Sagittal oblique sonogram of the lateral chest wall acquired during Step IVof the sagittal scan sequence. Note the lower slips of the serratus anterior muscle are muchmore bulky than the upper slips. R, rib.
FIGURE 10-31 Figure showing the position of the patient and ultrasound transducerduring Step V of the sagittal scan sequence near the posterior axillary line. The inset sagittalsonogram shows the plane of ultrasound imaging (dark green) over the sixth intercostalspace. R, rib.
FIGURE 10-32 Sagittal oblique sonogram of the lateral chest wall acquired during Step Vof the sagittal scan sequence. Note the thick serratus anterior muscle overlying the sixth andseventh ribs and the inferolateral aspect of the latissimus dorsi muscle lying superficial to theserratus anterior muscle caudally. The myofascial plane between the latissimus dorsi and
451

serratus anterior muscle is the serratus anterior plane posteriorly.
FIGURE 10-33 A. Doppler ultrasound demonstrating the thoracodorsal artery in themyofascial plane between the latissimus dorsi and the serratus anterior muscle close to theposterior axillary line. The thoracodorsal nerve accompanies the thoracodorsal artery at thislevel, but is more difficult to delineate with current ultrasound technology. B. Position of thepatient and ultrasound transducer during the sagittal scan. R, rib.
Steps II to V: From the earlier position the ultrasound transducer is moved laterally insmall steps until the anatomy of the thoracic wall at the level of the third to fourth(Figs. 10-22 to 10-24), fourth to fifth (Figs. 10-25 to 10-27), fifth to sixth (Figs. 10-28to 10-30), and seventh to eighth (Figs. 10-31 to 10-33) ribs is visualized.
b.Coronal scan sequence: The coronal scan is performed at the lateral chest wall and foran SPB. The ultrasound transducer is placed in the coronal orientation over the lateralchest wall (Fig. 10-34) and close to the posterior–axillary line. The aim at this stage isto identify the underlying ribs and the overlying serratus anterior muscle (Fig. 10-35).The transducer is then gently moved posteriorly until the inferolateral margin of thelatissimus dorsi muscle is seen overlying the serratus anterior muscle (Fig. 10-36).The thoracodorsal artery is consistently seen in the myofascial plane between thelatissimus dorsi and serratus anterior muscle at this level (Fig. 10-37). The ultrasoundimage is optimized, after which the transducer is gently moved cranially along thesame coronal plane until the inferolateral margin of the teres major muscle and theserratus plane (Fig. 10-38), between the latissimus dorsi and serratus anterior muscle,are clearly visualized. This is the target ultrasound window for a SPB.4
452
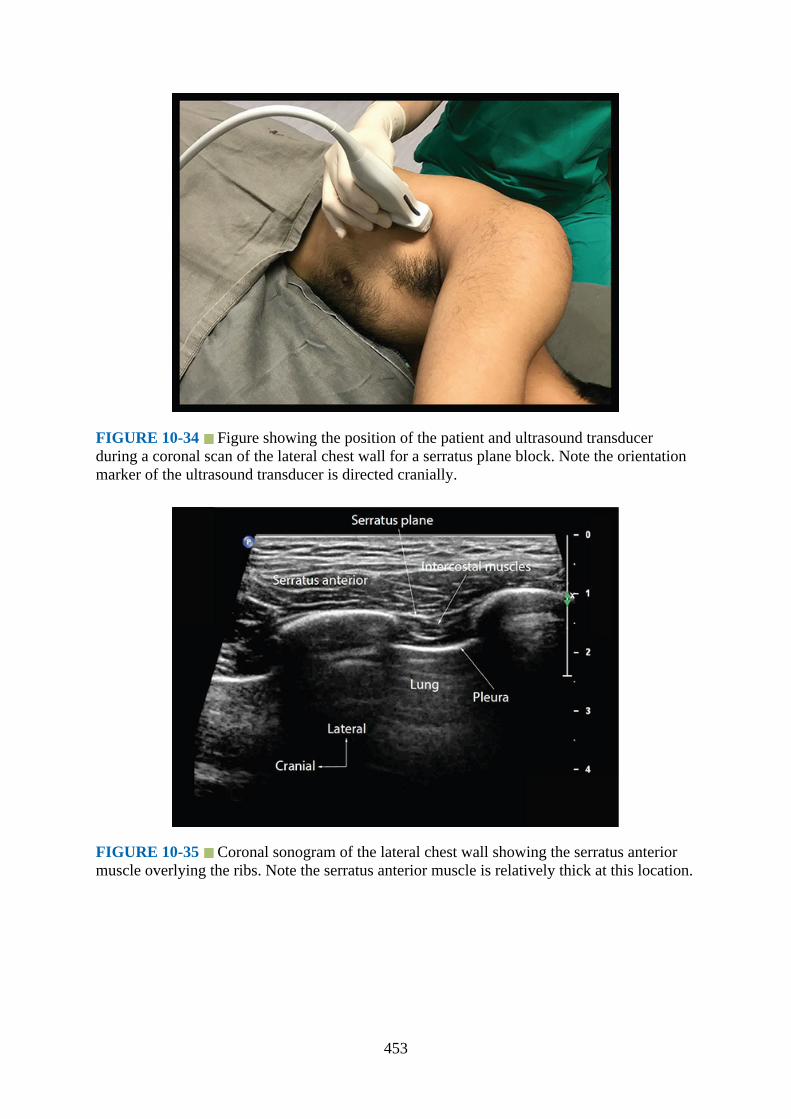
FIGURE 10-34 Figure showing the position of the patient and ultrasound transducerduring a coronal scan of the lateral chest wall for a serratus plane block. Note the orientationmarker of the ultrasound transducer is directed cranially.
FIGURE 10-35 Coronal sonogram of the lateral chest wall showing the serratus anteriormuscle overlying the ribs. Note the serratus anterior muscle is relatively thick at this location.
453

FIGURE 10-36 A. Coronal sonogram of the lateral chest wall with the transducerpositioned slightly posterior to that in Fig. 10-35. The inferolateral border of the latissimusdorsi muscle is now seen lying superficial to the serratus anterior muscle at the cranial end ofthe sonogram. The thoracodorsal artery is also seen lying superficial to the serratus anteriormuscle in this sonogram. B. Position of the patient and ultrasound transducer during thecoronal scan.
FIGURE 10-37 Color Doppler sonogram showing the thoracodorsal artery in themyofascial plane between the latissimus dorsi and serratus anterior muscle along the lateral
454
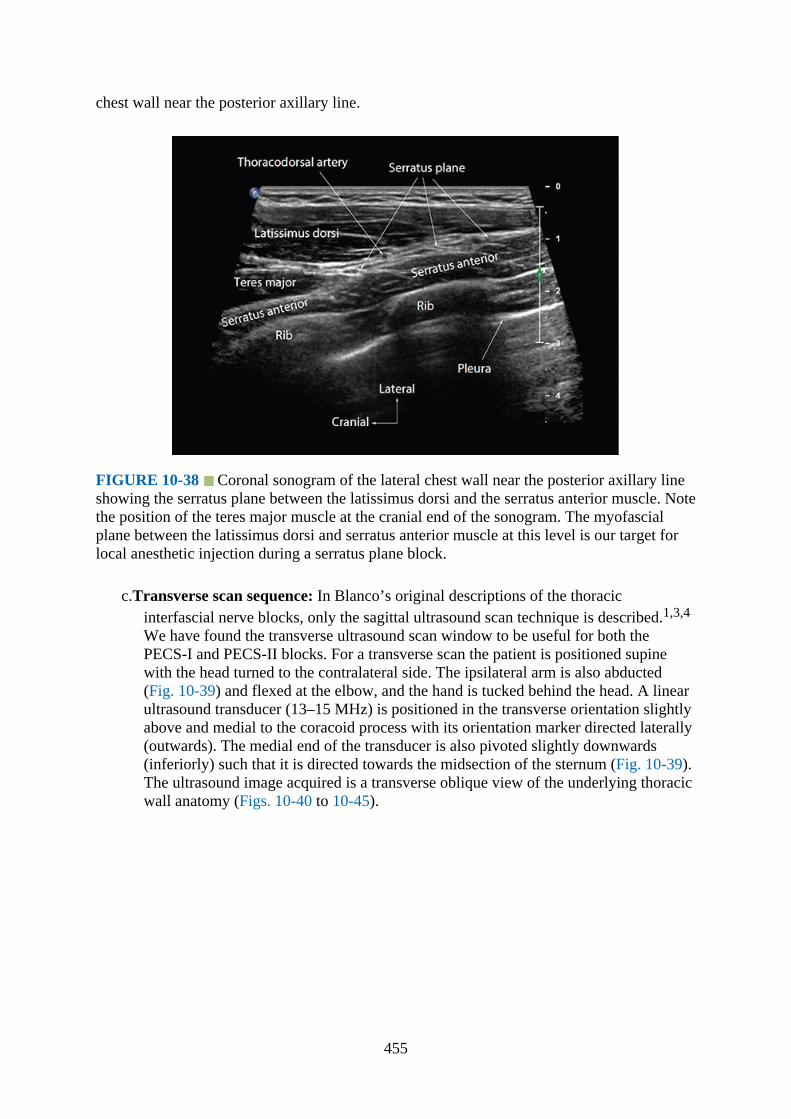
chest wall near the posterior axillary line.
FIGURE 10-38 Coronal sonogram of the lateral chest wall near the posterior axillary lineshowing the serratus plane between the latissimus dorsi and the serratus anterior muscle. Notethe position of the teres major muscle at the cranial end of the sonogram. The myofascialplane between the latissimus dorsi and serratus anterior muscle at this level is our target forlocal anesthetic injection during a serratus plane block.
c.Transverse scan sequence: In Blanco’s original descriptions of the thoracicinterfascial nerve blocks, only the sagittal ultrasound scan technique is described.1,3,4
We have found the transverse ultrasound scan window to be useful for both thePECS-I and PECS-II blocks. For a transverse scan the patient is positioned supinewith the head turned to the contralateral side. The ipsilateral arm is also abducted(Fig. 10-39) and flexed at the elbow, and the hand is tucked behind the head. A linearultrasound transducer (13–15 MHz) is positioned in the transverse orientation slightlyabove and medial to the coracoid process with its orientation marker directed laterally(outwards). The medial end of the transducer is also pivoted slightly downwards(inferiorly) such that it is directed towards the midsection of the sternum (Fig. 10-39).The ultrasound image acquired is a transverse oblique view of the underlying thoracicwall anatomy (Figs. 10-40 to 10-45).
455
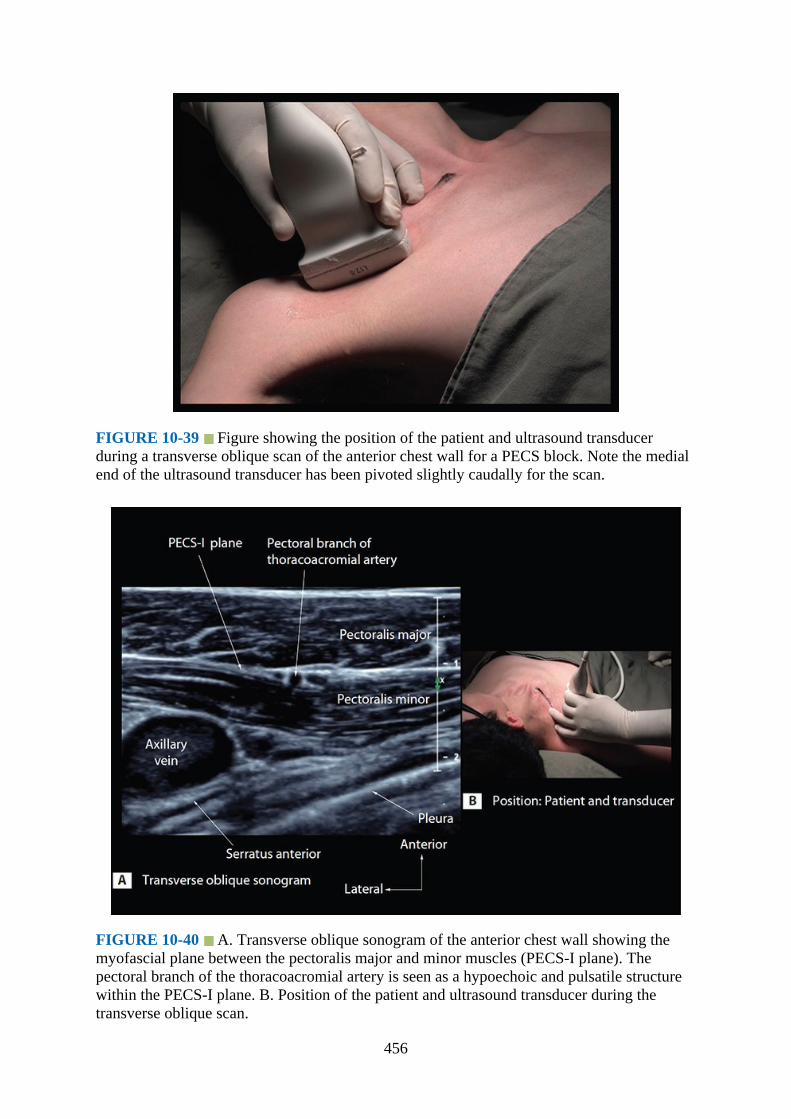
FIGURE 10-39 Figure showing the position of the patient and ultrasound transducerduring a transverse oblique scan of the anterior chest wall for a PECS block. Note the medialend of the ultrasound transducer has been pivoted slightly caudally for the scan.
FIGURE 10-40 A. Transverse oblique sonogram of the anterior chest wall showing themyofascial plane between the pectoralis major and minor muscles (PECS-I plane). Thepectoral branch of the thoracoacromial artery is seen as a hypoechoic and pulsatile structurewithin the PECS-I plane. B. Position of the patient and ultrasound transducer during thetransverse oblique scan.
456
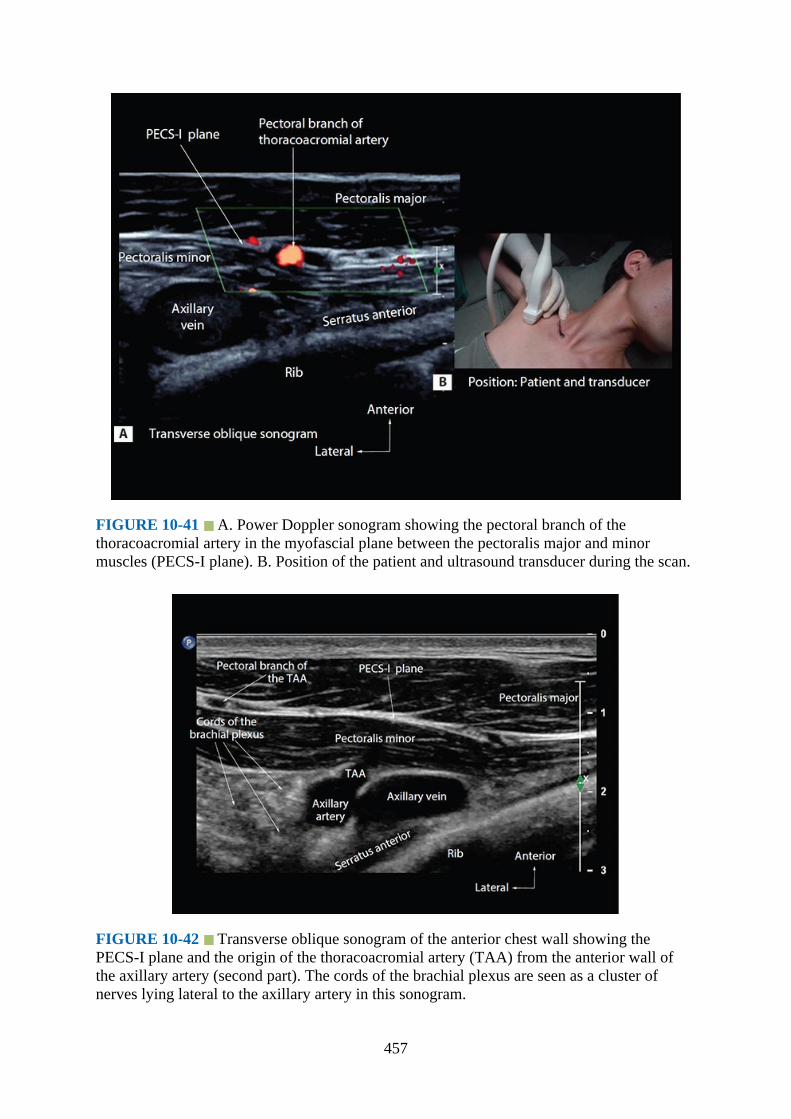
FIGURE 10-41 A. Power Doppler sonogram showing the pectoral branch of thethoracoacromial artery in the myofascial plane between the pectoralis major and minormuscles (PECS-I plane). B. Position of the patient and ultrasound transducer during the scan.
FIGURE 10-42 Transverse oblique sonogram of the anterior chest wall showing thePECS-I plane and the origin of the thoracoacromial artery (TAA) from the anterior wall ofthe axillary artery (second part). The cords of the brachial plexus are seen as a cluster ofnerves lying lateral to the axillary artery in this sonogram.
457
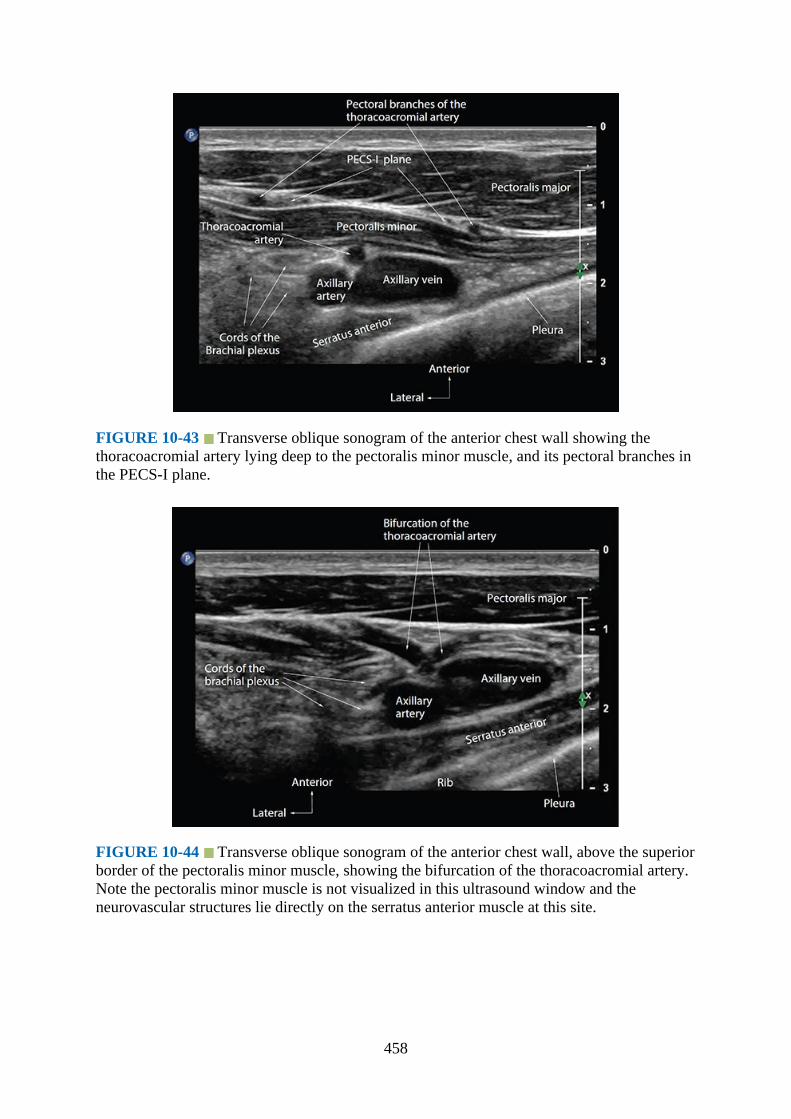
FIGURE 10-43 Transverse oblique sonogram of the anterior chest wall showing thethoracoacromial artery lying deep to the pectoralis minor muscle, and its pectoral branches inthe PECS-I plane.
FIGURE 10-44 Transverse oblique sonogram of the anterior chest wall, above the superiorborder of the pectoralis minor muscle, showing the bifurcation of the thoracoacromial artery.Note the pectoralis minor muscle is not visualized in this ultrasound window and theneurovascular structures lie directly on the serratus anterior muscle at this site.
458
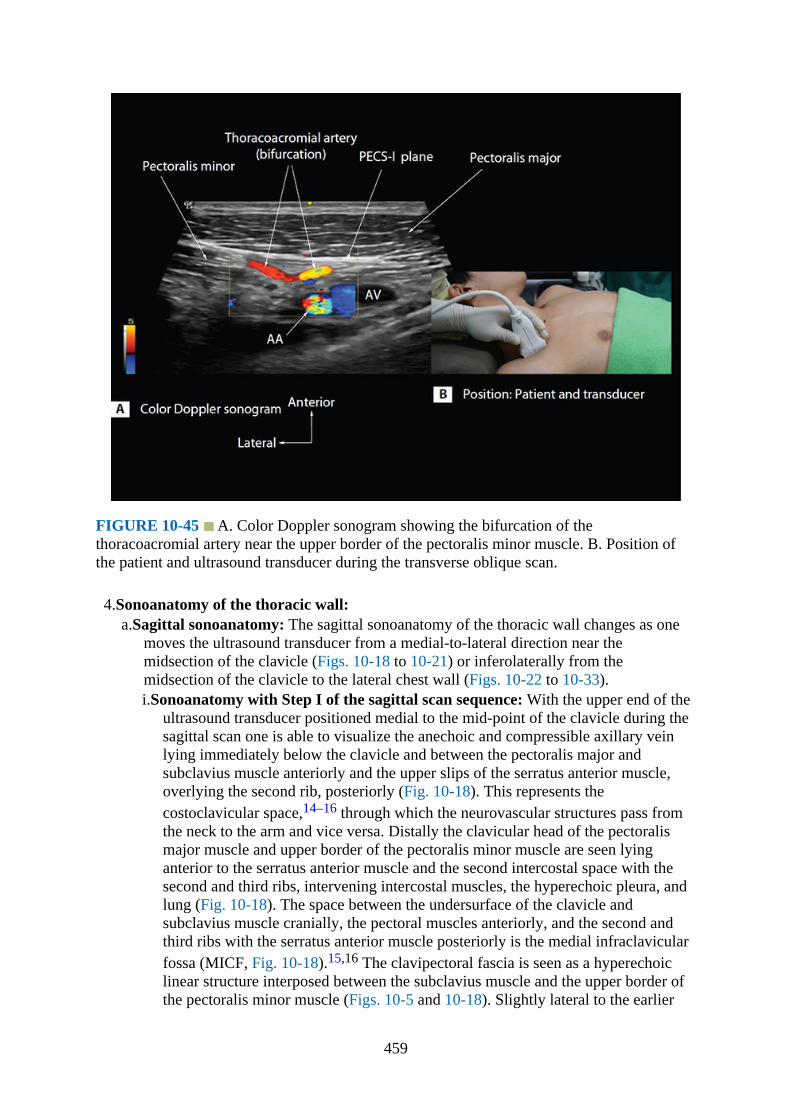
FIGURE 10-45 A. Color Doppler sonogram showing the bifurcation of thethoracoacromial artery near the upper border of the pectoralis minor muscle. B. Position ofthe patient and ultrasound transducer during the transverse oblique scan.
4.Sonoanatomy of the thoracic wall:a.Sagittal sonoanatomy: The sagittal sonoanatomy of the thoracic wall changes as one
moves the ultrasound transducer from a medial-to-lateral direction near themidsection of the clavicle (Figs. 10-18 to 10-21) or inferolaterally from themidsection of the clavicle to the lateral chest wall (Figs. 10-22 to 10-33).i.Sonoanatomy with Step I of the sagittal scan sequence: With the upper end of the
ultrasound transducer positioned medial to the mid-point of the clavicle during thesagittal scan one is able to visualize the anechoic and compressible axillary veinlying immediately below the clavicle and between the pectoralis major andsubclavius muscle anteriorly and the upper slips of the serratus anterior muscle,overlying the second rib, posteriorly (Fig. 10-18). This represents thecostoclavicular space,14–16 through which the neurovascular structures pass fromthe neck to the arm and vice versa. Distally the clavicular head of the pectoralismajor muscle and upper border of the pectoralis minor muscle are seen lyinganterior to the serratus anterior muscle and the second intercostal space with thesecond and third ribs, intervening intercostal muscles, the hyperechoic pleura, andlung (Fig. 10-18). The space between the undersurface of the clavicle andsubclavius muscle cranially, the pectoral muscles anteriorly, and the second andthird ribs with the serratus anterior muscle posteriorly is the medial infraclavicularfossa (MICF, Fig. 10-18).15,16 The clavipectoral fascia is seen as a hyperechoiclinear structure interposed between the subclavius muscle and the upper border ofthe pectoralis minor muscle (Figs. 10-5 and 10-18). Slightly lateral to the earlier
459
position (ie, at the midclavicular point), the axillary artery is visualized as ananechoic and pulsatile structure within the costoclavicular space (Fig. 10-19).15,16
The cephalic vein joins the axillary vein from above within the MICF (Fig. 10-19).Lateral to the midpoint of the clavicle the cords of the brachial plexus are seen asmultiple round-to-oval structures, each with a hyperechoic rim, within thecostoclavicular space and lying superior to the pulsatile axillary artery (Fig. 10-20).The axillary vein is located caudal to the axillary artery (Fig. 10-20). Branches ofthe TAA are also seen close to the upper border of the pectoralis minor muscle(Fig. 10-20). The TAA in most cases originates from the axillary artery deep to thepectoralis minor muscles, but it may also originate above the medial border of thepectoralis minor muscle (Fig. 10-21). Deep to the serratus anterior muscle, outlinesof the anterior intercostal space with the hyperechoic parietal pleura are clearlydelineated (Fig. 10-20). The arrangement of the brachial plexus in the sagittalsonogram is also consistent with the lateral cord lying anterior to the medial cordand the posterior cord lying superior to the lateral and medial cord (Fig. 10-20).15,16
ii.Sonoanatomy with Step II of the sagittal scan sequence: During Step II of thesagittal scan sequence, the ultrasound transducer is placed over the third intercostalspace (Fig. 10-22). The third and fourth ribs with the intercostal muscles, pleura,and lung are clearly delineated (Fig. 10-23). The pectoralis major and minormuscles overlie the serratus anterior muscle, and the latter is closely attached to theadjoining ribs (Fig. 10-23). The myofascial plane between the pectoralis major andminor muscles at the level of the fourth rib may be referred to as the PECS-I plane(Fig. 10-24) because it is the target site for local anesthetic injection during aPECS-I block.1
iii.Sonoanatomy with Step III of the sagittal scan sequence: During Step III of thesagittal scan sequence, the ultrasound transducer is placed over the fourthintercostal space (Fig. 10-25) and the fourth and fifth ribs are clearly visualized(Fig. 10-26). As seen during Step II (described earlier), the pectoralis major andminor muscles overlie the serratus anterior muscle (Figs. 10-26 and 10-27). Themyofascial plane between the pectoralis minor and the serratus anterior muscle isthe target site for local anesthetic injection during a PECS-II injection.2 The inferiorborder of the pectoralis minor muscle can also be defined at the level of the fifth rib(Fig. 10-27). Distal to that and at the level of the sixth rib there is a hyperechoiclayer of connective tissue which probably represents the Gerdy’s ligament(suspensory ligament of the axilla) fusing with the axillary fascia (Fig. 10-5).
iv.Sonoanatomy with Step IV of the sagittal scan sequence: During Step IV of thesagittal scan sequence, the ultrasound transducer overlies the fifth intercostal spacealong the lateral chest wall (Fig. 10-28) and at the level of the anterior axillary line.With the lower border of the pectoralis minor muscle having attached to the fifthrib, only the pectoralis major and serratus anterior muscles are seen overlying thefifth rib (Fig. 10-29), and only the serratus anterior muscle overlies the sixth rib(Fig. 10-29). The lateral branches of the intercostal nerves pierce the intercostal andserratus anterior muscle complex and emerge to lie subcutaneously at this locationand along the midaxillary line (Fig. 10-6). Slightly more inferolaterally, the serratusanterior muscle becomes thicker and is the only muscle overlying the lateral chestwall (Fig. 10-30).
v.Sonoanatomy with Step V of the sagittal scan sequence: During Step V of thesagittal scan sequence, the transducer overlies the sixth intercostal space close to
460
the posterior axillary line (Fig. 10-31). The inferolateral aspect of the latissimusdorsi muscle overlies the thick serratus anterior muscle (Fig. 10-32), and thethoracodorsal artery lies in the myofascial plane between the latissimus dorsi andserratus anterior muscle (Fig. 10-33). The thoracodorsal nerve, which innervatesthe latissimus dorsi muscle, accompanies the thoracodorsal artery (Fig. 10-3).
b.Sonoanatomy of the thoracic wall: Coronal sonoanatomy: During the coronal scan(Fig. 10-34) the ultrasound transducer is placed along the lateral chest wall and nearthe posterior–axillary line. The serratus anterior muscle is seen overlying the ribs (Fig.10-35). As one gently moves the transducer posteriorly, the inferolateral border of thelatissimus dorsi muscle is seen lying superficial to the serratus anterior muscle at thecranial end of the sonogram (Fig. 10-36). The thoracodorsal artery is consistentlyvisualized in the serratus plane between the latissimus dorsi and serratus anteriormuscle (Figs. 10-36 and 10-37). The myofascial plane between the latissimus dorsiand the serratus anterior muscle at the level of the fifth rib (Fig. 10-38) is the targetsite for local anesthetic injection during a SPB.3
c.Sonoanatomy of the thoracic wall: Transverse sonoanatomy: On the transversesonogram the pectoralis major and minor muscles lie anterior to the axillary vein,serratus anterior muscle, and the pleura (Fig. 10-40) or the third to fourth ribs (Fig.10-40) medially. The pectoral branch of the TAA lies in the myofascial plane betweenthe pectoral major and minor muscles (Figs. 10-40 and 10-41). With the transducerpositioned slightly lateral to the earlier position, the axillary artery is also visualizeddeep to the pectoral muscles and lateral to the axillary vein (Fig. 10-42). The cords ofthe brachial plexus are clustered together lateral to the axillary artery (Fig. 10-42).The origin of the TAA from the axillary artery (Figs. 10-42 and 10-43) and itsbifurcation (Figs. 10-44 and 10-45) can also be visualized near the upper border of thepectoralis minor muscle. The TAA is an important anatomical landmark because theLPN, MPN, and ansa pectoralis are all closely related to the artery (Fig. 10-11).8,9
Clinical Pearls1.Locating the second rib under the clavicle on the sagittal scan (Figs. 10-15 and 10-18) is a
useful sonographic landmark for counting the ribs along the anterior and anterolateralchest wall.
2.Due to the complex spinal origin and anatomical arrangement of the pectoral nerves (notedearlier), a single injection of local anesthetic into the myofascial plane between thepectoralis major and minor muscles (PECS-I plane) is unlikely to consistently block allthe pectoral nerves or the “subpectoral plexus” of nerves. Cadaver data suggest that a 10-mL injection at three sites: (a) deep and lateral aspect of the pectoralis minor muscle (3.3mL), (b) in between the pectoralis major and minor muscle (3.3 mL), and (c) superficialto the posterior fascia of the pectoralis major muscle (3.4 mL), is adequate in affecting allthe pectoral nerves.17 However, this observation has not been clinically validated, andthere are no data evaluating pectoral nerve block dynamics after a PECS-I and or PECS-IIblock. Future research in this area is warranted.
3.Age-related changes in musculoskeletal structures18 can make it difficult to accuratelydefine the PECS-I plane in the elderly. Doppler (Color or Power) ultrasound helps locatethe pectoral branch of the TAA (Fig. 10-41) and facilitates accurate injection of localanesthetic into the PECS-I plane during a PECS-I block.
4.Doppler ultrasound can also be used to locate the thoracodorsal artery in the serratus plane
461
during a SPB.5.A SPB affects the lateral cutaneous branches of the ipsilateral T2 to T9 intercostal nerves
and possibly also the long thoracic and thoracodorsal nerves.3,4 However, it does notaffect the anterior cutaneous branch of the main intercostal nerve, and therefore theanteromedial aspect of the thorax, or the breast in females, is spared by an SPB.
6.The long thoracic and thoracodorsal nerve may be anesthetized by an SPB, but their role inafferent nociception after major breast or thoracic surgery is still not known.
References1.Blanco R. The ‘pecs block’: a novel technique for providing analgesia after breast surgery.
Anaesthesia. 2011;66:847–848.2.Blanco R, Fajardo M, Parras MT. Ultrasound description of Pecs II (modified Pecs I): a
novel approach to breast surgery. Rev Esp Anestesiol Reanim. 2012;59:470–475.3.Blanco R, Parras T, McDonnell JG, Prats-Galino A. Serratus plane block: a novel
ultrasound-guided thoracic wall nerve block. Anaesthesia. 2013;68:1107–1113.4.Blanco R. Thoracic interfascial nerve blocks: PECS (I and II) and serratus plane block,
musculoskeletal ultrasound for regional anaesthesia and pain medicine. In: KarmakarMK, ed. 2nd ed. Hong Kong: Department of Anaesthesia and Intensive Care, TheChinese University of Hong Kong; 2016:377–82.
5.Loukas M, Hullett J, Louis RG Jr., Holdman S, Holdman D. The gross anatomy of theextrathoracic course of the intercostobrachial nerve. Clin Anat. 2006;19:106–111.
6.Porzionato A, Macchi V, Stecco C, Loukas M, Tubbs RS, De CR. Surgical anatomy of thepectoral nerves and the pectoral musculature. Clin Anat. 2012;25:559–575.
7.Bremner-Smith AT, Unwin AJ, Williams WW. Sensory pathways in the spinal accessorynerve. J Bone Joint Surg Br. 1999;81:226–228.
8.Macchi V, Tiengo C, Porzionato A, Parenti A, Stecco C, Mazzoleni F, De CR. Medial andlateral pectoral nerves: course and branches. Clin Anat. 2007;20:157–162.
9.Kg P, K S. Anatomical study of pectoral nerves and its implications in surgery. J ClinDiagn Res. 2014;8:AC01–AC05.
10.Lee KS. Anatomic variation of the spinal origins of lateral and medial pectoral nerves. ClinAnat. 2007;20:915–918.
11.David S, Balaguer T, Baque P, Peretti F, Valla M, Lebreton E, Chignon-Sicard B. Theanatomy of the pectoral nerves and its significance in breast augmentation, axillarydissection and pectoral muscle flaps. J Plast Reconst Aesthet Surg. 2012;65:1193–1198.
12.Aszmann OC, Rab M, Kamolz L, Frey M. The anatomy of the pectoral nerves and theirsignificance in brachial plexus reconstruction. J Hand Surg Am. 2000;25:942–947.
13.Jaspars JJ, Posma AN, van Immerseel AA, Gittenberger-de Groot AC. The cutaneousinnervation of the female breast and nipple-areola complex: implications for surgery. BrJ Plast Surg. 1997;50:249–259.
14.Demondion X, Herbinet P, Boutry N, Fontaine C, Francke JP, Cotten A. Sonographicmapping of the normal brachial plexus. AJNR Am J Neuroradiol. 2003;24:1303–1309.
15.Karmakar MK, Sala-Blanch X, Songthamwat B, Tsui BC. Benefits of the costoclavicularspace for ultrasound-guided infraclavicular brachial plexus block: description of acostoclavicular approach. Reg Anesth Pain Med. 2015;40:287–288.
16.Sala-Blanch X, Reina MA, Pangthipampai P, Karmakar MK. Anatomic basis for brachialplexus block at the costoclavicular space: a cadaver anatomic study. Reg Anesth PainMed. 2016;41(3):387–391.
462

17.Desroches J, Grabs U, Grabs D. Selective ultrasound guided pectoral nerve targeting inbreast augmentation: How to spare the brachial plexus cords? Clin Anat. 2013;26(1):49–55.
18.Li X, Karmakar MK, Lee A, Kwok WH, Critchley LA, Gin T. Quantitative evaluation ofthe echo intensity of the median nerve and flexor muscles of the forearm in the youngand the elderly. Br J Radiol. 2012;85:e140–e145.
463
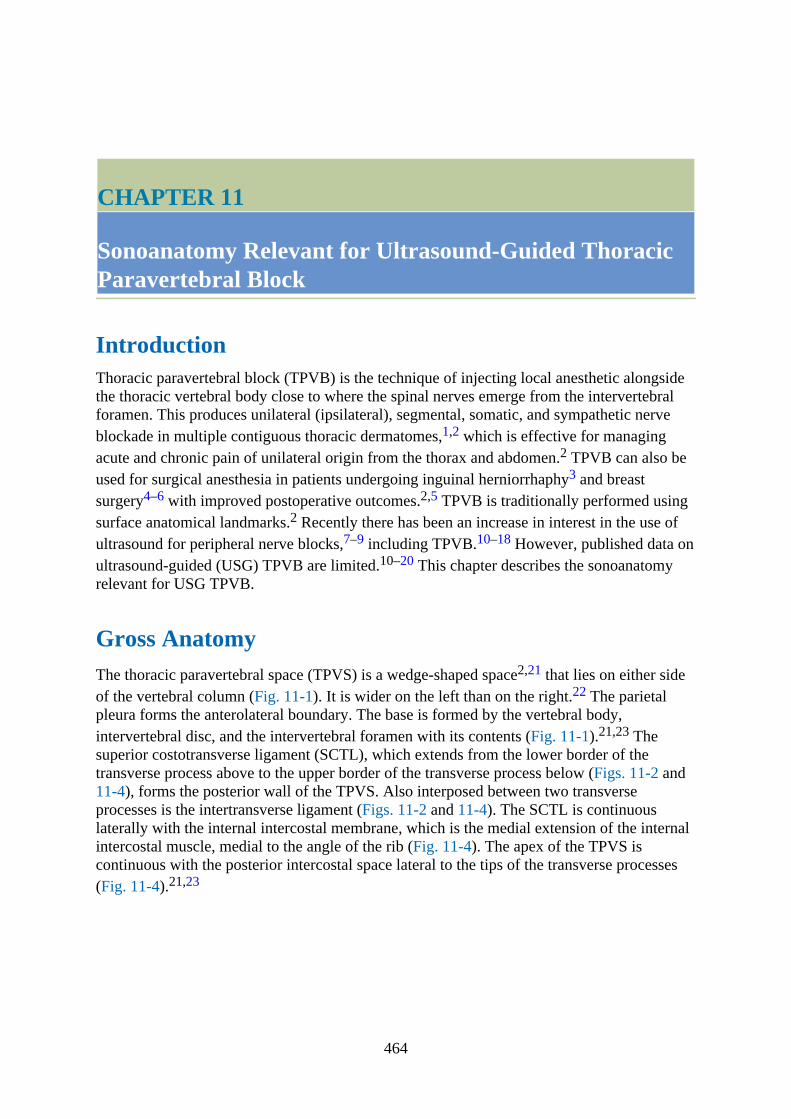
CHAPTER 11
Sonoanatomy Relevant for Ultrasound-Guided ThoracicParavertebral Block
IntroductionThoracic paravertebral block (TPVB) is the technique of injecting local anesthetic alongsidethe thoracic vertebral body close to where the spinal nerves emerge from the intervertebralforamen. This produces unilateral (ipsilateral), segmental, somatic, and sympathetic nerveblockade in multiple contiguous thoracic dermatomes,1,2 which is effective for managingacute and chronic pain of unilateral origin from the thorax and abdomen.2 TPVB can also beused for surgical anesthesia in patients undergoing inguinal herniorrhaphy3 and breastsurgery4–6 with improved postoperative outcomes.2,5 TPVB is traditionally performed usingsurface anatomical landmarks.2 Recently there has been an increase in interest in the use ofultrasound for peripheral nerve blocks,7–9 including TPVB.10–18 However, published data onultrasound-guided (USG) TPVB are limited.10–20 This chapter describes the sonoanatomyrelevant for USG TPVB.
Gross AnatomyThe thoracic paravertebral space (TPVS) is a wedge-shaped space2,21 that lies on either sideof the vertebral column (Fig. 11-1). It is wider on the left than on the right.22 The parietalpleura forms the anterolateral boundary. The base is formed by the vertebral body,intervertebral disc, and the intervertebral foramen with its contents (Fig. 11-1).21,23 Thesuperior costotransverse ligament (SCTL), which extends from the lower border of thetransverse process above to the upper border of the transverse process below (Figs. 11-2 and11-4), forms the posterior wall of the TPVS. Also interposed between two transverseprocesses is the intertransverse ligament (Figs. 11-2 and 11-4). The SCTL is continuouslaterally with the internal intercostal membrane, which is the medial extension of the internalintercostal muscle, medial to the angle of the rib (Fig. 11-4). The apex of the TPVS iscontinuous with the posterior intercostal space lateral to the tips of the transverse processes(Fig. 11-4).21,23
464
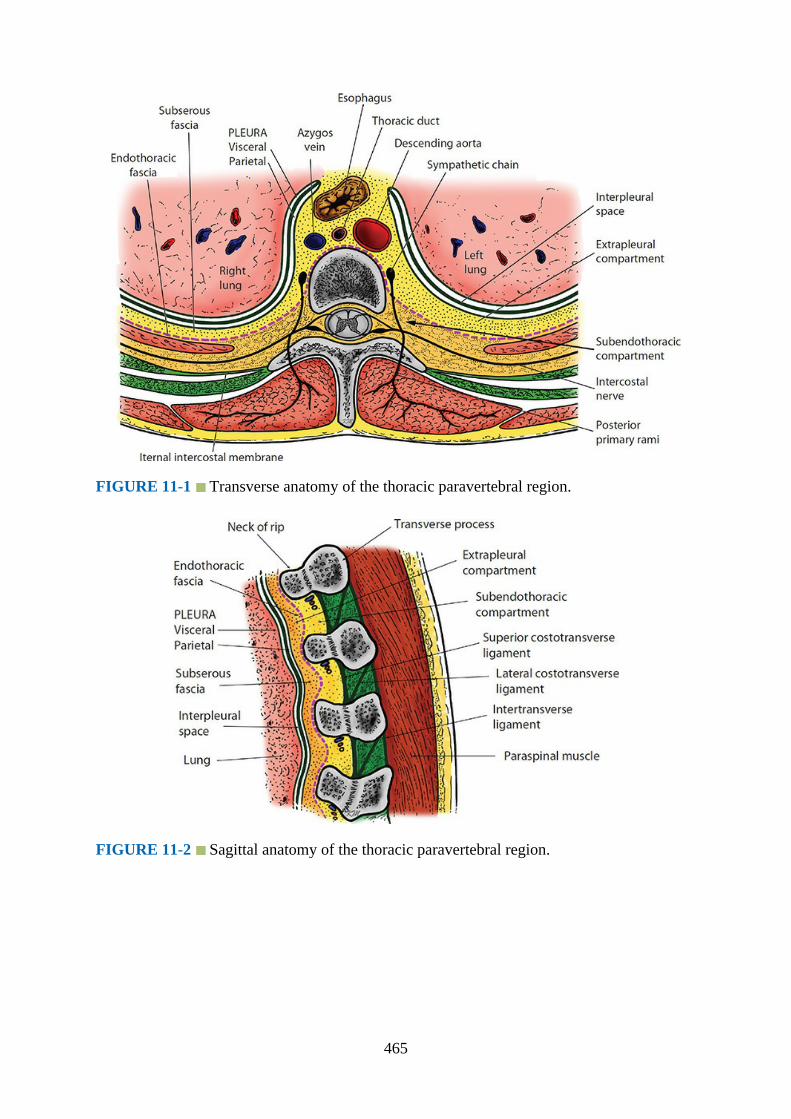
FIGURE 11-1 Transverse anatomy of the thoracic paravertebral region.
FIGURE 11-2 Sagittal anatomy of the thoracic paravertebral region.
465
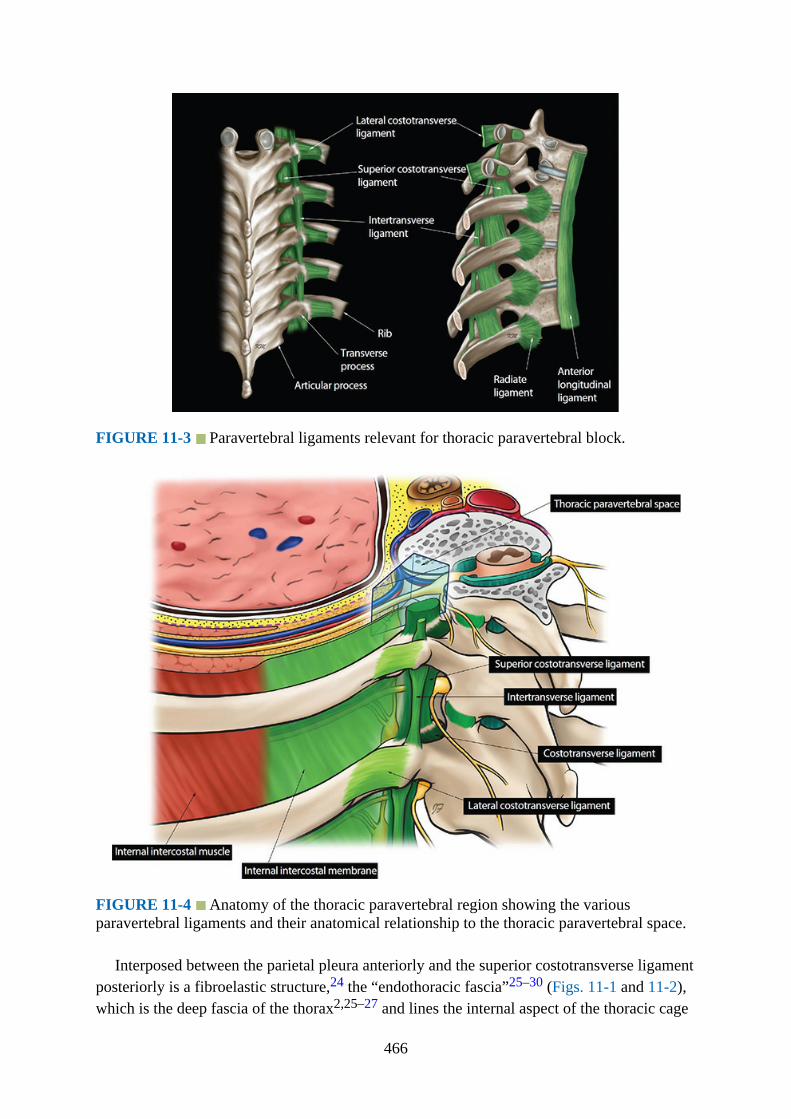
FIGURE 11-3 Paravertebral ligaments relevant for thoracic paravertebral block.
FIGURE 11-4 Anatomy of the thoracic paravertebral region showing the variousparavertebral ligaments and their anatomical relationship to the thoracic paravertebral space.
Interposed between the parietal pleura anteriorly and the superior costotransverse ligamentposteriorly is a fibroelastic structure,24 the “endothoracic fascia”25–30 (Figs. 11-1 and 11-2),which is the deep fascia of the thorax2,25–27 and lines the internal aspect of the thoracic cage
466
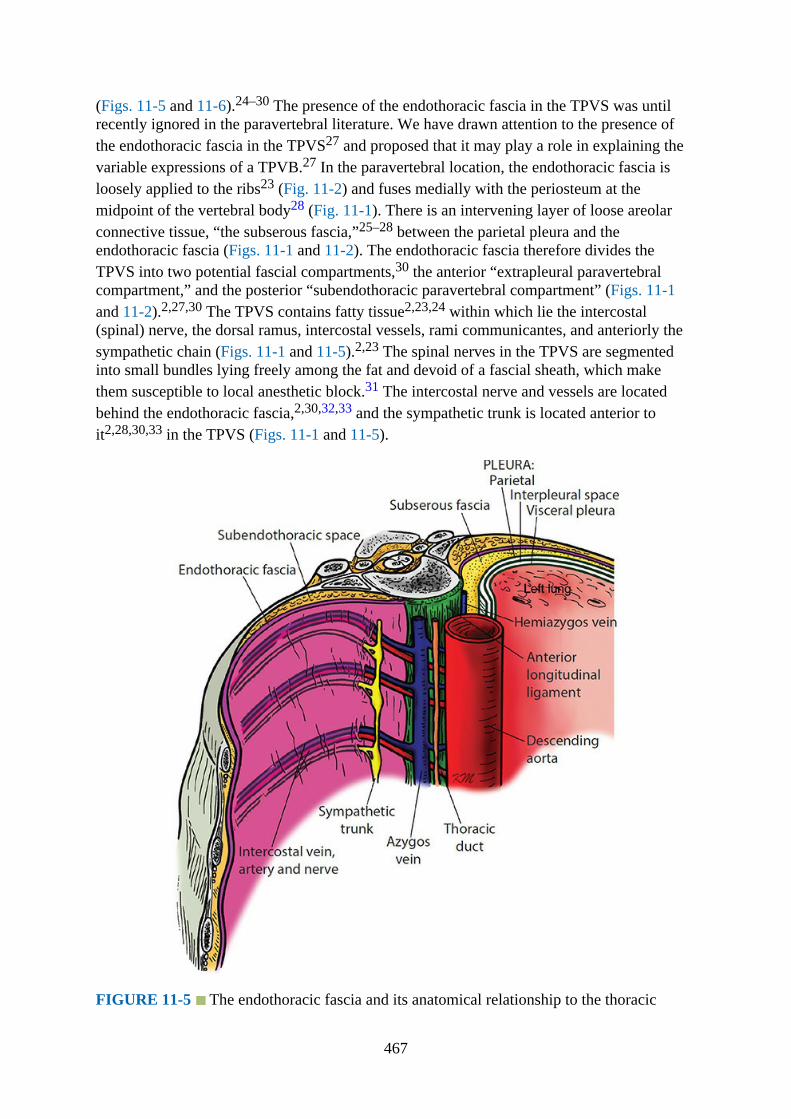
(Figs. 11-5 and 11-6).24–30 The presence of the endothoracic fascia in the TPVS was untilrecently ignored in the paravertebral literature. We have drawn attention to the presence ofthe endothoracic fascia in the TPVS27 and proposed that it may play a role in explaining thevariable expressions of a TPVB.27 In the paravertebral location, the endothoracic fascia isloosely applied to the ribs23 (Fig. 11-2) and fuses medially with the periosteum at themidpoint of the vertebral body28 (Fig. 11-1). There is an intervening layer of loose areolarconnective tissue, “the subserous fascia,”25–28 between the parietal pleura and theendothoracic fascia (Figs. 11-1 and 11-2). The endothoracic fascia therefore divides theTPVS into two potential fascial compartments,30 the anterior “extrapleural paravertebralcompartment,” and the posterior “subendothoracic paravertebral compartment” (Figs. 11-1and 11-2).2,27,30 The TPVS contains fatty tissue2,23,24 within which lie the intercostal(spinal) nerve, the dorsal ramus, intercostal vessels, rami communicantes, and anteriorly thesympathetic chain (Figs. 11-1 and 11-5).2,23 The spinal nerves in the TPVS are segmentedinto small bundles lying freely among the fat and devoid of a fascial sheath, which makethem susceptible to local anesthetic block.31 The intercostal nerve and vessels are locatedbehind the endothoracic fascia,2,30,32,33 and the sympathetic trunk is located anterior toit2,28,30,33 in the TPVS (Figs. 11-1 and 11-5).
FIGURE 11-5 The endothoracic fascia and its anatomical relationship to the thoracic
467
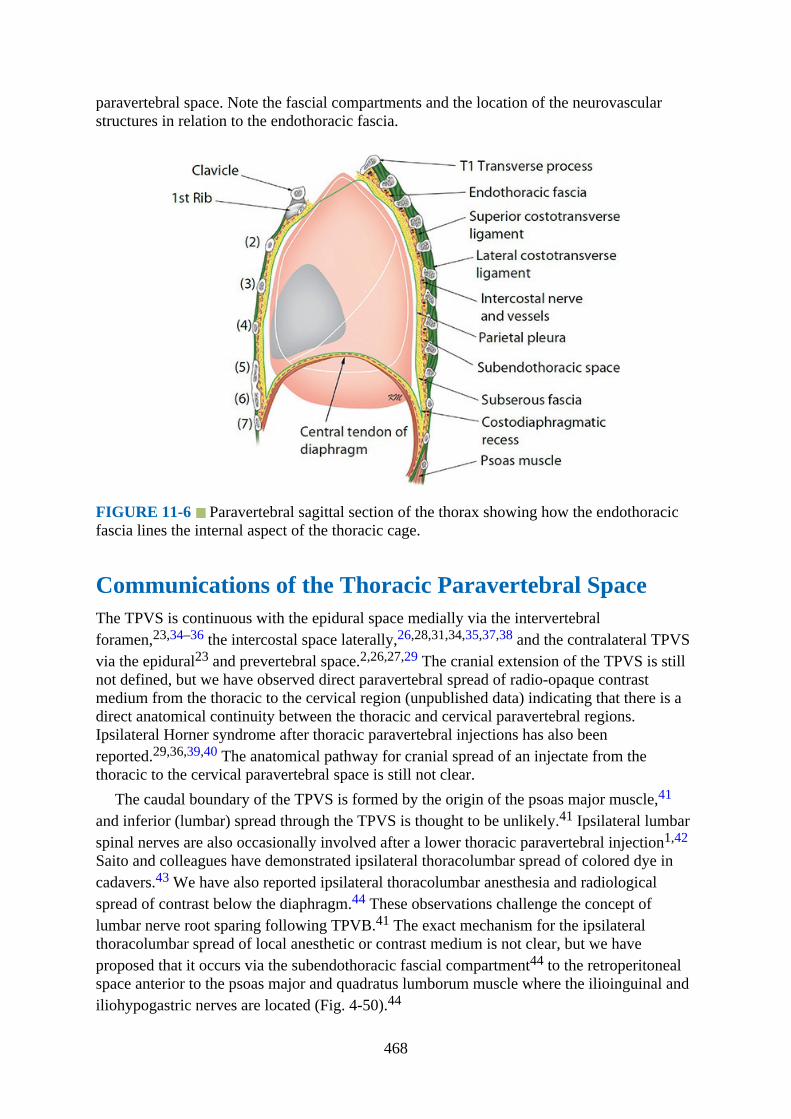
paravertebral space. Note the fascial compartments and the location of the neurovascularstructures in relation to the endothoracic fascia.
FIGURE 11-6 Paravertebral sagittal section of the thorax showing how the endothoracicfascia lines the internal aspect of the thoracic cage.
Communications of the Thoracic Paravertebral SpaceThe TPVS is continuous with the epidural space medially via the intervertebralforamen,23,34–36 the intercostal space laterally,26,28,31,34,35,37,38 and the contralateral TPVSvia the epidural23 and prevertebral space.2,26,27,29 The cranial extension of the TPVS is stillnot defined, but we have observed direct paravertebral spread of radio-opaque contrastmedium from the thoracic to the cervical region (unpublished data) indicating that there is adirect anatomical continuity between the thoracic and cervical paravertebral regions.Ipsilateral Horner syndrome after thoracic paravertebral injections has also beenreported.29,36,39,40 The anatomical pathway for cranial spread of an injectate from thethoracic to the cervical paravertebral space is still not clear.
The caudal boundary of the TPVS is formed by the origin of the psoas major muscle,41
and inferior (lumbar) spread through the TPVS is thought to be unlikely.41 Ipsilateral lumbarspinal nerves are also occasionally involved after a lower thoracic paravertebral injection1,42
Saito and colleagues have demonstrated ipsilateral thoracolumbar spread of colored dye incadavers.43 We have also reported ipsilateral thoracolumbar anesthesia and radiologicalspread of contrast below the diaphragm.44 These observations challenge the concept oflumbar nerve root sparing following TPVB.41 The exact mechanism for the ipsilateralthoracolumbar spread of local anesthetic or contrast medium is not clear, but we haveproposed that it occurs via the subendothoracic fascial compartment44 to the retroperitonealspace anterior to the psoas major and quadratus lumborum muscle where the ilioinguinal andiliohypogastric nerves are located (Fig. 4-50).44
468
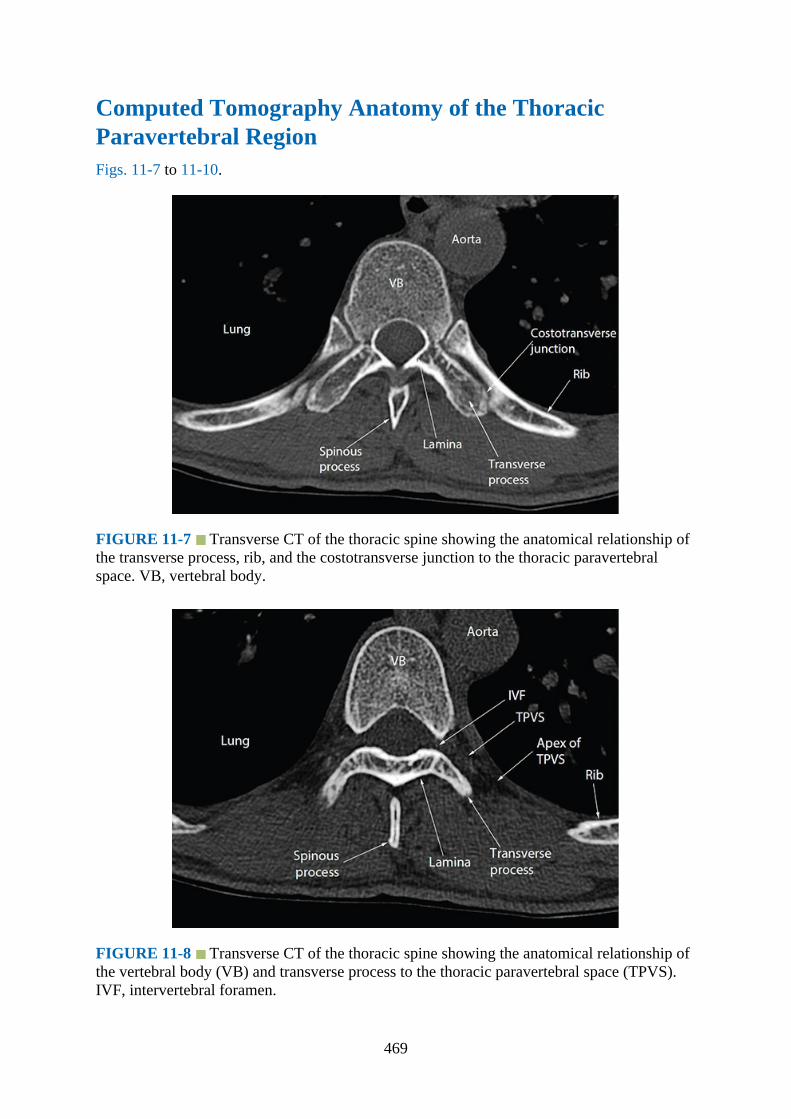
Computed Tomography Anatomy of the ThoracicParavertebral RegionFigs. 11-7 to 11-10.
FIGURE 11-7 Transverse CT of the thoracic spine showing the anatomical relationship ofthe transverse process, rib, and the costotransverse junction to the thoracic paravertebralspace. VB, vertebral body.
FIGURE 11-8 Transverse CT of the thoracic spine showing the anatomical relationship ofthe vertebral body (VB) and transverse process to the thoracic paravertebral space (TPVS).IVF, intervertebral foramen.
469
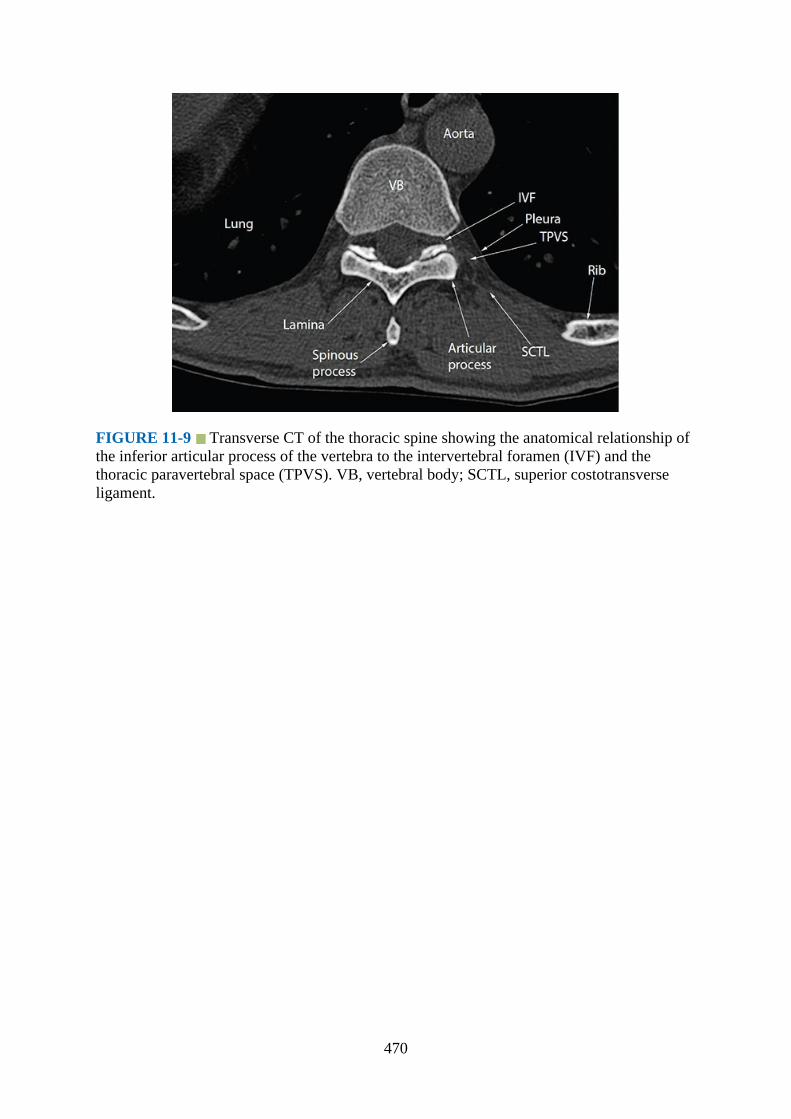
FIGURE 11-9 Transverse CT of the thoracic spine showing the anatomical relationship ofthe inferior articular process of the vertebra to the intervertebral foramen (IVF) and thethoracic paravertebral space (TPVS). VB, vertebral body; SCTL, superior costotransverseligament.
470

FIGURE 11-10 Sagittal CT of the thorax through the thoracic paravertebral space (TPVS).Note the anatomical relationship of the neck of the rib to the transverse process (TP) and thecostotransverse junction (CTJ). SCTL, superior costotransverse ligament.
Magnetic Resonance Imaging Anatomy of the ThoracicParavertebral RegionFigs. 11-11 to 11-14.
471
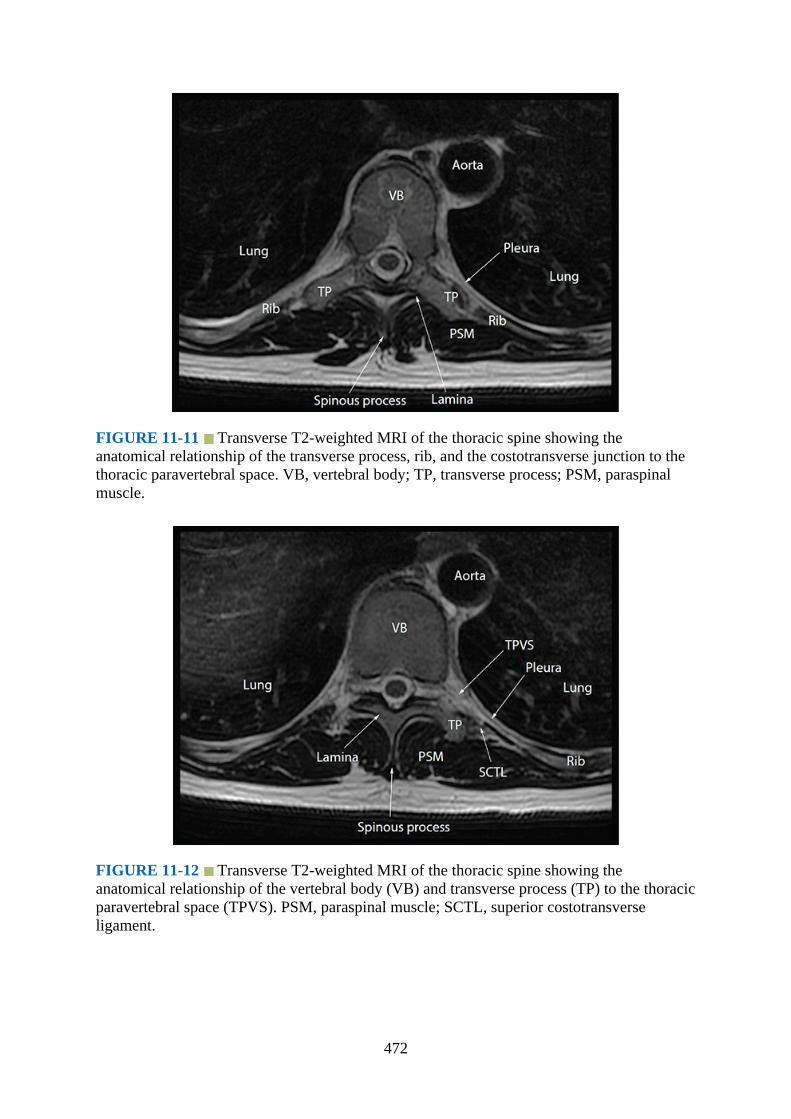
FIGURE 11-11 Transverse T2-weighted MRI of the thoracic spine showing theanatomical relationship of the transverse process, rib, and the costotransverse junction to thethoracic paravertebral space. VB, vertebral body; TP, transverse process; PSM, paraspinalmuscle.
FIGURE 11-12 Transverse T2-weighted MRI of the thoracic spine showing theanatomical relationship of the vertebral body (VB) and transverse process (TP) to the thoracicparavertebral space (TPVS). PSM, paraspinal muscle; SCTL, superior costotransverseligament.
472
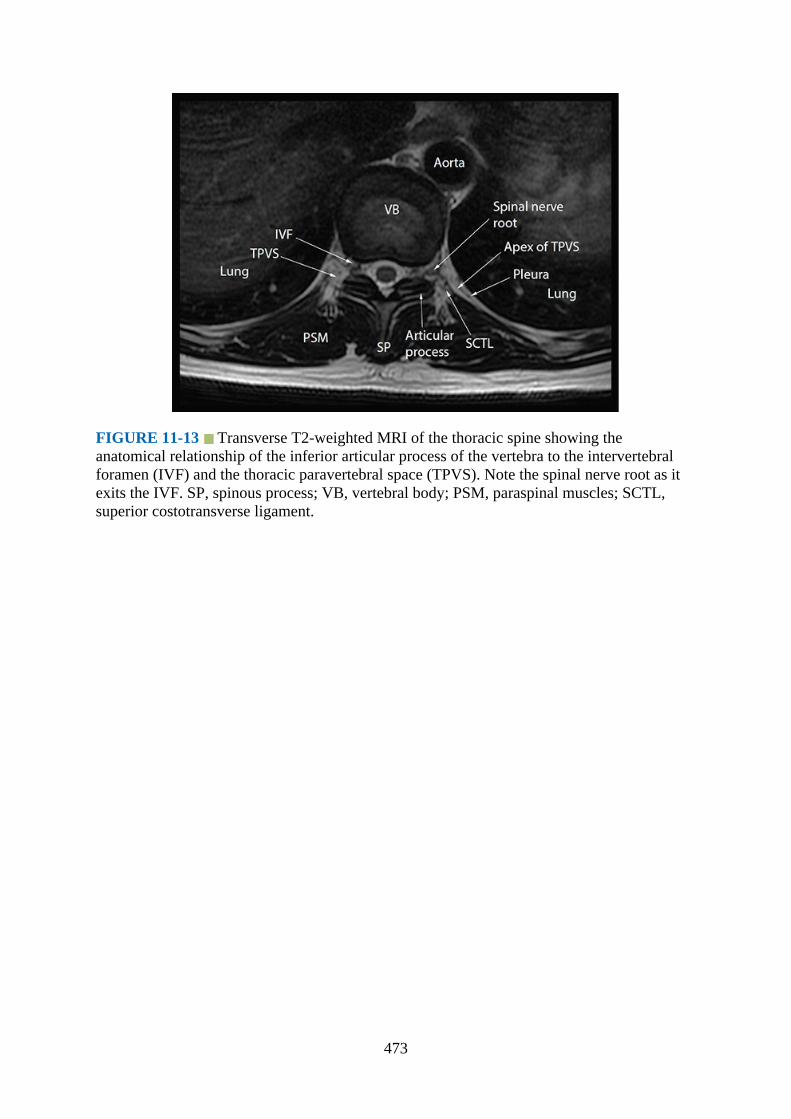
FIGURE 11-13 Transverse T2-weighted MRI of the thoracic spine showing theanatomical relationship of the inferior articular process of the vertebra to the intervertebralforamen (IVF) and the thoracic paravertebral space (TPVS). Note the spinal nerve root as itexits the IVF. SP, spinous process; VB, vertebral body; PSM, paraspinal muscles; SCTL,superior costotransverse ligament.
473
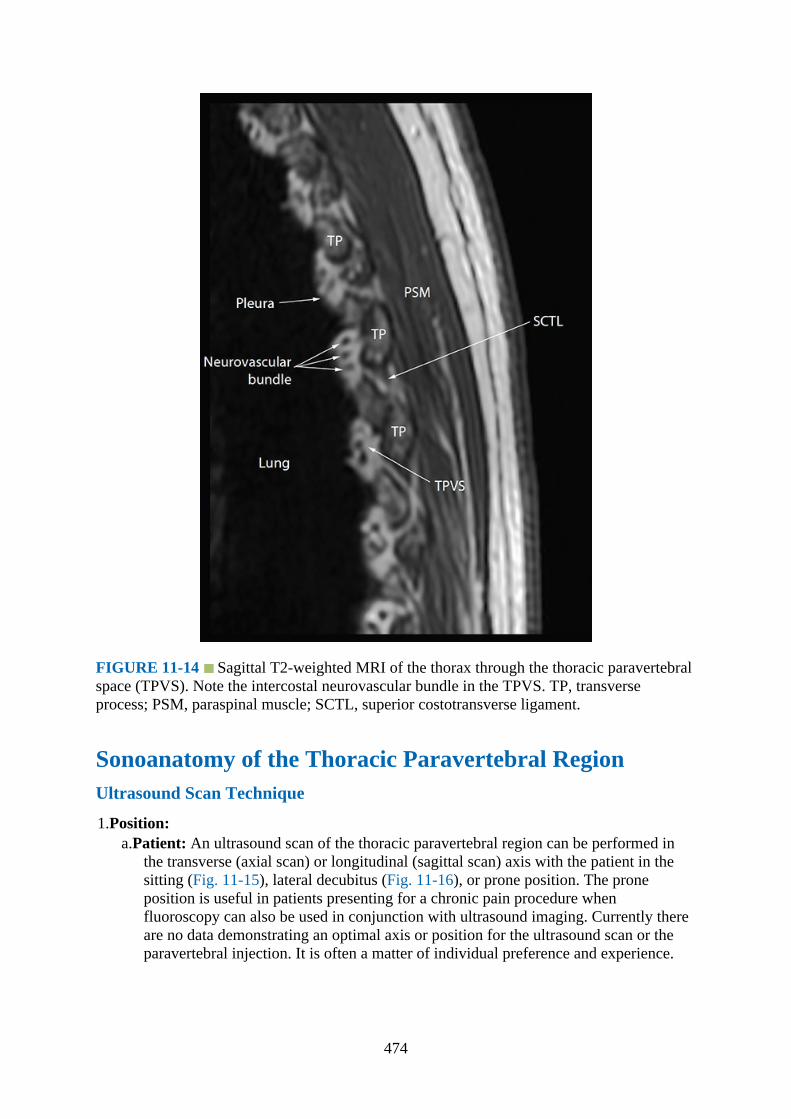
FIGURE 11-14 Sagittal T2-weighted MRI of the thorax through the thoracic paravertebralspace (TPVS). Note the intercostal neurovascular bundle in the TPVS. TP, transverseprocess; PSM, paraspinal muscle; SCTL, superior costotransverse ligament.
Sonoanatomy of the Thoracic Paravertebral RegionUltrasound Scan Technique
1.Position:a.Patient: An ultrasound scan of the thoracic paravertebral region can be performed in
the transverse (axial scan) or longitudinal (sagittal scan) axis with the patient in thesitting (Fig. 11-15), lateral decubitus (Fig. 11-16), or prone position. The proneposition is useful in patients presenting for a chronic pain procedure whenfluoroscopy can also be used in conjunction with ultrasound imaging. Currently thereare no data demonstrating an optimal axis or position for the ultrasound scan or theparavertebral injection. It is often a matter of individual preference and experience.
474
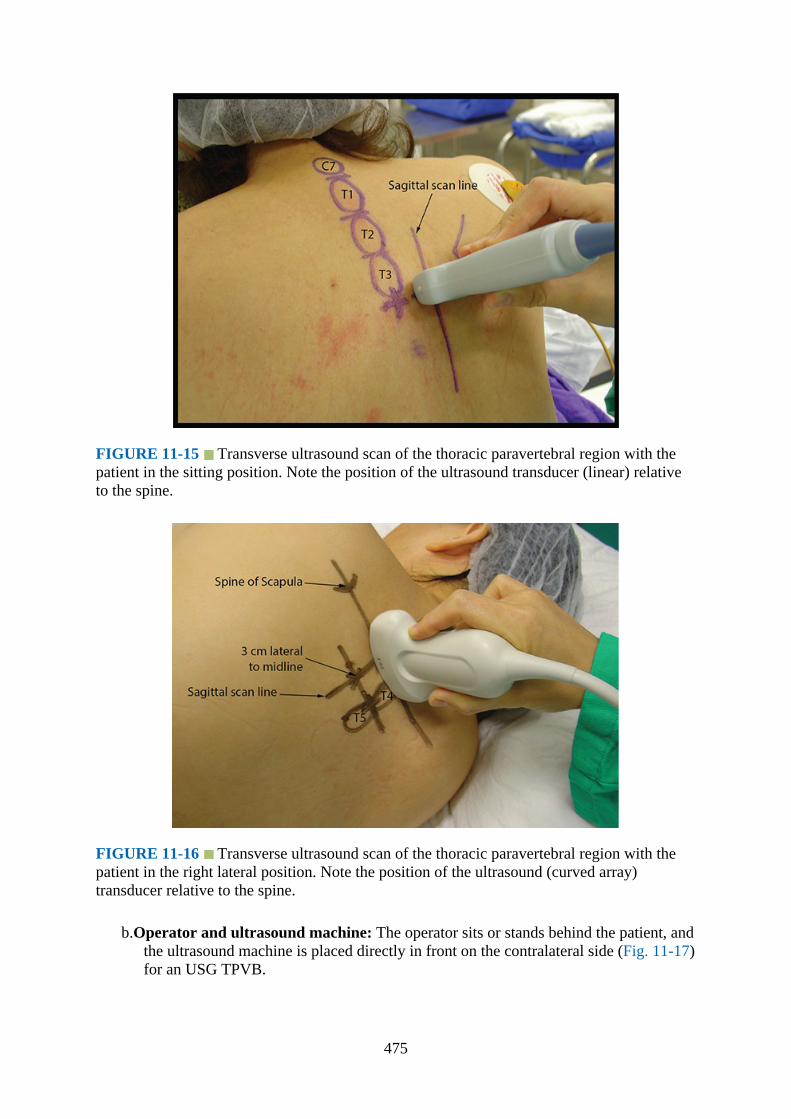
FIGURE 11-15 Transverse ultrasound scan of the thoracic paravertebral region with thepatient in the sitting position. Note the position of the ultrasound transducer (linear) relativeto the spine.
FIGURE 11-16 Transverse ultrasound scan of the thoracic paravertebral region with thepatient in the right lateral position. Note the position of the ultrasound (curved array)transducer relative to the spine.
b.Operator and ultrasound machine: The operator sits or stands behind the patient, andthe ultrasound machine is placed directly in front on the contralateral side (Fig. 11-17)for an USG TPVB.
475

FIGURE 11-17 Figure demonstrating the ergonomics during an ultrasound scan of thethoracic paravertebral region with the patient in the right lateral position. Note a low-frequency curved array transducer is being used for the ultrasound scan.
2.Transducer selection: The transducer used for the ultrasound scan depends on the bodyhabitus of the patient. High-frequency ultrasound provides better resolution than low-frequency ultrasound, but its penetration is poor. Moreover if one has to scan at a depthusing high-frequency ultrasound, then the field of vision is also significantly narrow.Under such circumstances it may be preferable to use a low-frequency curved arraytransducer (5–2 MHz) with a divergent beam and a wider field of vision. Published datasuggest that a high-frequency linear transducer (13–6 MHz) is frequently used forscanning the thoracic paravertebral region.10,11,14,18 This may be because the transverseprocess, costotransverse ligament, and the pleura in the midthoracic region are located ata relatively shallow depth and lend themselves to ideal conditions for imaging with ahigh-frequency linear array transducer. However, ultrasound imaging of the TPVS is notsimilar at all thoracic levels, and high-frequency transducers are generally not suitable inthe upper thoracic region. Recently we have used a low-frequency curved arraytransducer (5–2 MHz) to perform a transverse scan of the thoracic paravertebral region (atall levels) with great success (Fig. 11-17, see details later).
3.Sonoanatomy:a.Transverse sonoanatomy of the thoracic paravertebral region:
A transverse scan of the thoracic paravertebral region can be performed using a linear(high-frequency) or curved (low-frequency) array transducer. In slim individuals ahigh-frequency linear array transducer will suffice, but in those with a larger bodyhabitus, a curved array transducer is preferable. The high-frequency linear arraytransducer is positioned lateral to the thoracic spinous process at the target level (Figs.11-15 and 11-18). On a transverse sonogram the paraspinal muscles are clearlydelineated and lie superficial to the transverse process (Figs. 11-19 to 11-21). Thetransverse process is seen as a hyperechoic structure, anterior to which there is a darkacoustic shadow that completely obscures the TPVS (Figs. 11-19 and 11-20). Lateral
476
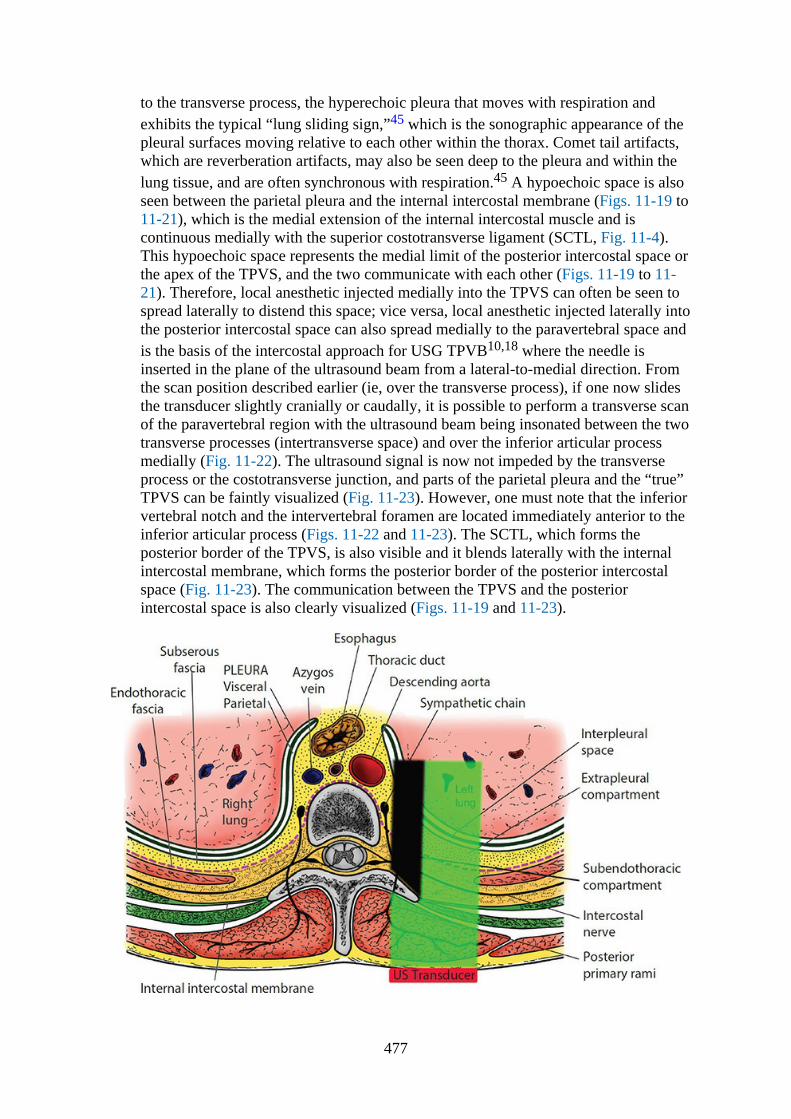
to the transverse process, the hyperechoic pleura that moves with respiration andexhibits the typical “lung sliding sign,”45 which is the sonographic appearance of thepleural surfaces moving relative to each other within the thorax. Comet tail artifacts,which are reverberation artifacts, may also be seen deep to the pleura and within thelung tissue, and are often synchronous with respiration.45 A hypoechoic space is alsoseen between the parietal pleura and the internal intercostal membrane (Figs. 11-19 to11-21), which is the medial extension of the internal intercostal muscle and iscontinuous medially with the superior costotransverse ligament (SCTL, Fig. 11-4).This hypoechoic space represents the medial limit of the posterior intercostal space orthe apex of the TPVS, and the two communicate with each other (Figs. 11-19 to 11-21). Therefore, local anesthetic injected medially into the TPVS can often be seen tospread laterally to distend this space; vice versa, local anesthetic injected laterally intothe posterior intercostal space can also spread medially to the paravertebral space andis the basis of the intercostal approach for USG TPVB10,18 where the needle isinserted in the plane of the ultrasound beam from a lateral-to-medial direction. Fromthe scan position described earlier (ie, over the transverse process), if one now slidesthe transducer slightly cranially or caudally, it is possible to perform a transverse scanof the paravertebral region with the ultrasound beam being insonated between the twotransverse processes (intertransverse space) and over the inferior articular processmedially (Fig. 11-22). The ultrasound signal is now not impeded by the transverseprocess or the costotransverse junction, and parts of the parietal pleura and the “true”TPVS can be faintly visualized (Fig. 11-23). However, one must note that the inferiorvertebral notch and the intervertebral foramen are located immediately anterior to theinferior articular process (Figs. 11-22 and 11-23). The SCTL, which forms theposterior border of the TPVS, is also visible and it blends laterally with the internalintercostal membrane, which forms the posterior border of the posterior intercostalspace (Fig. 11-23). The communication between the TPVS and the posteriorintercostal space is also clearly visualized (Figs. 11-19 and 11-23).
477

FIGURE 11-18 Figure illustrating the orientation of the ultrasound transducer and how theultrasound beam is insonated during a transverse scan of the thoracic paravertebral regionwith a linear transducer. The TP (transverse process) usually casts an acoustic shadow(represented in black), which obscures the ultrasound visibility of the thoracic paravertebralspace.
FIGURE 11-19 Transverse sonogram of the right thoracic paravertebral region using ahigh-frequency linear transducer with the ultrasound beam being insonated over thetransverse process. Note how the acoustic shadow of the transverse process (TP) obscures thethoracic paravertebral space (TPVS). The hypoechoic space posterior to the parietal pleuraand anterolateral to the TP is the apex of the TPVS, or the medial limit of the posteriorintercostal space.
478
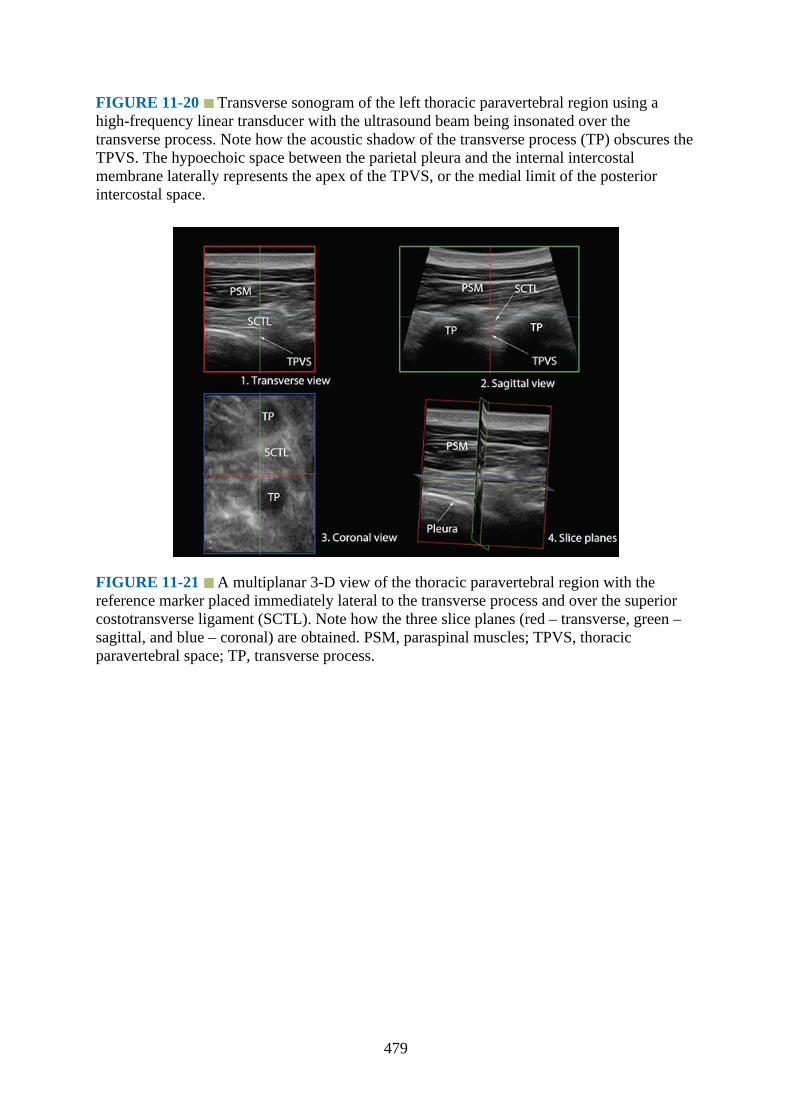
FIGURE 11-20 Transverse sonogram of the left thoracic paravertebral region using ahigh-frequency linear transducer with the ultrasound beam being insonated over thetransverse process. Note how the acoustic shadow of the transverse process (TP) obscures theTPVS. The hypoechoic space between the parietal pleura and the internal intercostalmembrane laterally represents the apex of the TPVS, or the medial limit of the posteriorintercostal space.
FIGURE 11-21 A multiplanar 3-D view of the thoracic paravertebral region with thereference marker placed immediately lateral to the transverse process and over the superiorcostotransverse ligament (SCTL). Note how the three slice planes (red – transverse, green –sagittal, and blue – coronal) are obtained. PSM, paraspinal muscles; TPVS, thoracicparavertebral space; TP, transverse process.
479
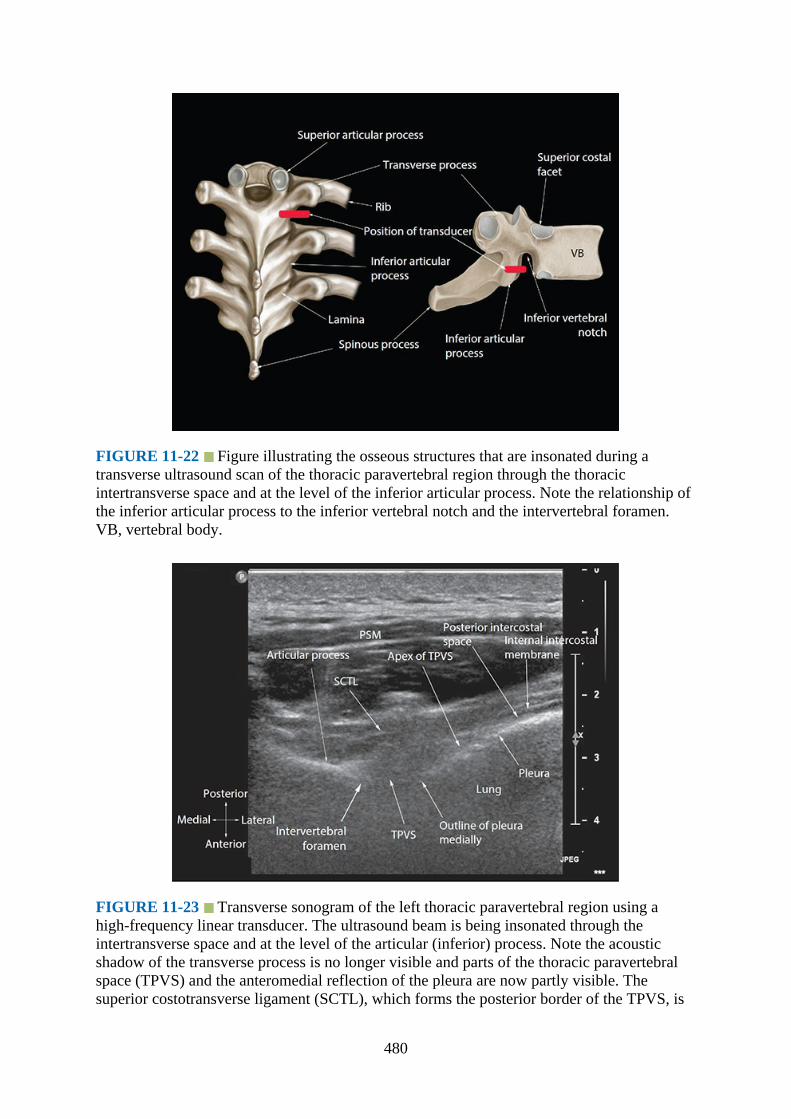
FIGURE 11-22 Figure illustrating the osseous structures that are insonated during atransverse ultrasound scan of the thoracic paravertebral region through the thoracicintertransverse space and at the level of the inferior articular process. Note the relationship ofthe inferior articular process to the inferior vertebral notch and the intervertebral foramen.VB, vertebral body.
FIGURE 11-23 Transverse sonogram of the left thoracic paravertebral region using ahigh-frequency linear transducer. The ultrasound beam is being insonated through theintertransverse space and at the level of the articular (inferior) process. Note the acousticshadow of the transverse process is no longer visible and parts of the thoracic paravertebralspace (TPVS) and the anteromedial reflection of the pleura are now partly visible. Thesuperior costotransverse ligament (SCTL), which forms the posterior border of the TPVS, is
480
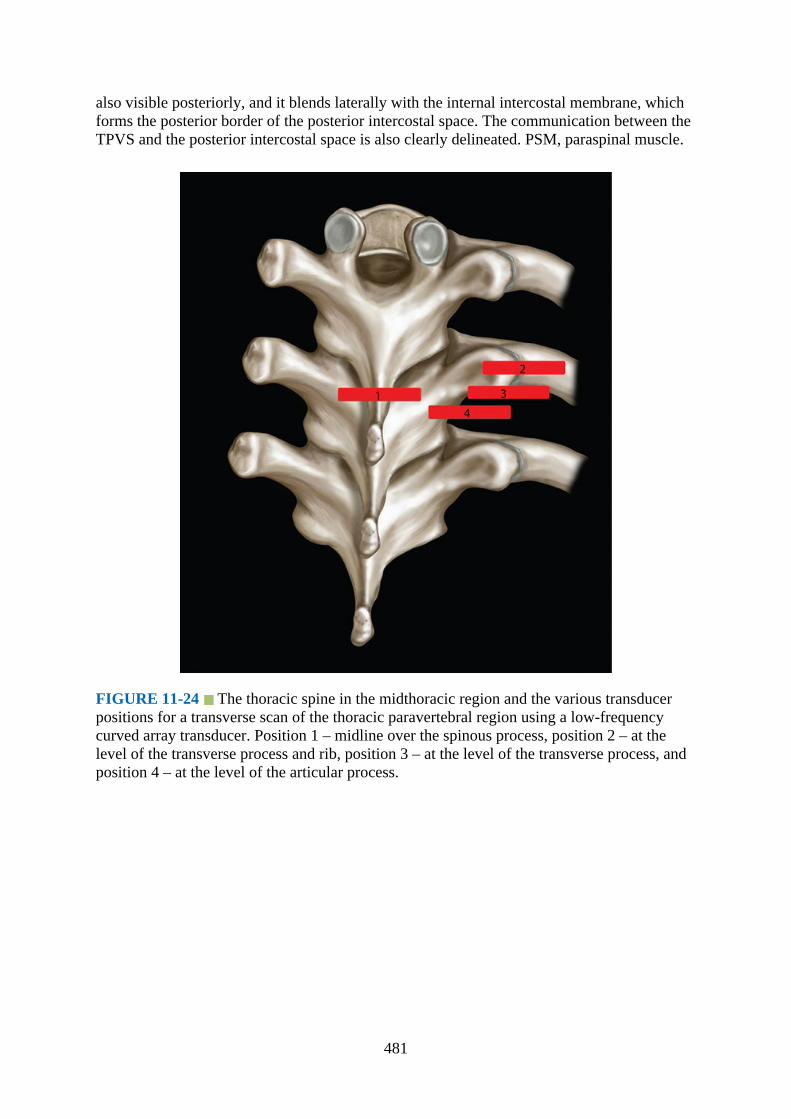
also visible posteriorly, and it blends laterally with the internal intercostal membrane, whichforms the posterior border of the posterior intercostal space. The communication between theTPVS and the posterior intercostal space is also clearly delineated. PSM, paraspinal muscle.
FIGURE 11-24 The thoracic spine in the midthoracic region and the various transducerpositions for a transverse scan of the thoracic paravertebral region using a low-frequencycurved array transducer. Position 1 – midline over the spinous process, position 2 – at thelevel of the transverse process and rib, position 3 – at the level of the transverse process, andposition 4 – at the level of the articular process.
481
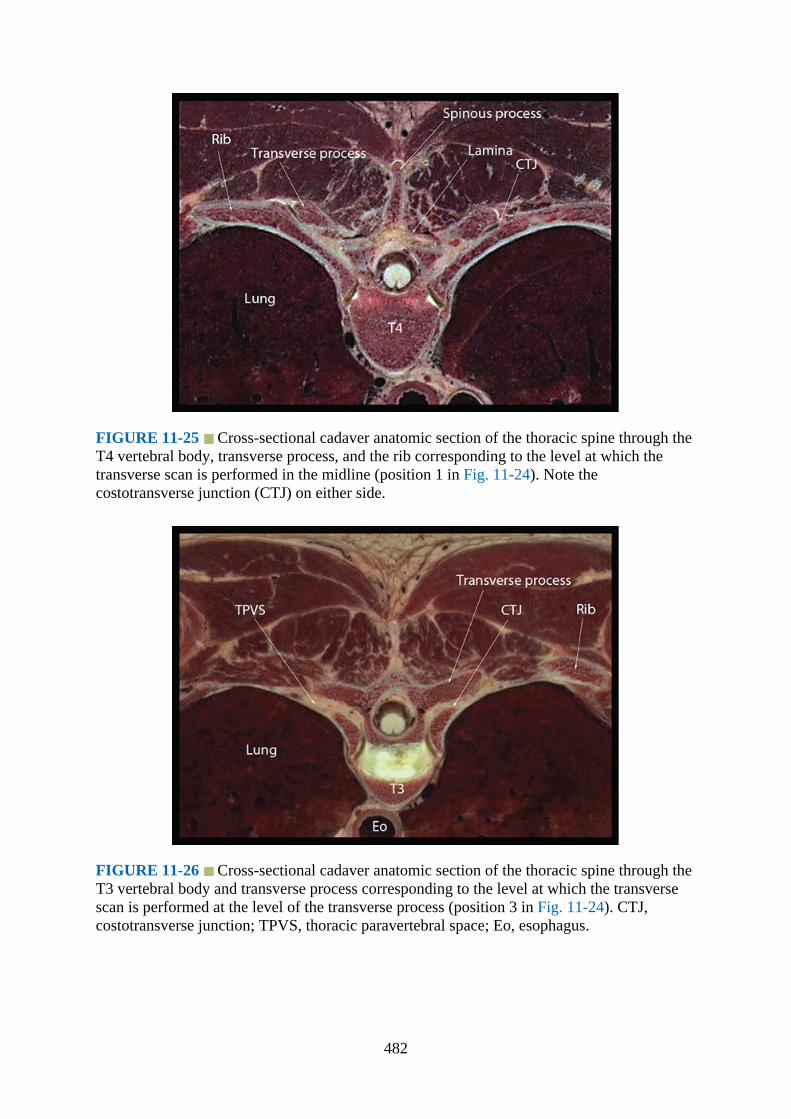
FIGURE 11-25 Cross-sectional cadaver anatomic section of the thoracic spine through theT4 vertebral body, transverse process, and the rib corresponding to the level at which thetransverse scan is performed in the midline (position 1 in Fig. 11-24). Note thecostotransverse junction (CTJ) on either side.
FIGURE 11-26 Cross-sectional cadaver anatomic section of the thoracic spine through theT3 vertebral body and transverse process corresponding to the level at which the transversescan is performed at the level of the transverse process (position 3 in Fig. 11-24). CTJ,costotransverse junction; TPVS, thoracic paravertebral space; Eo, esophagus.
482
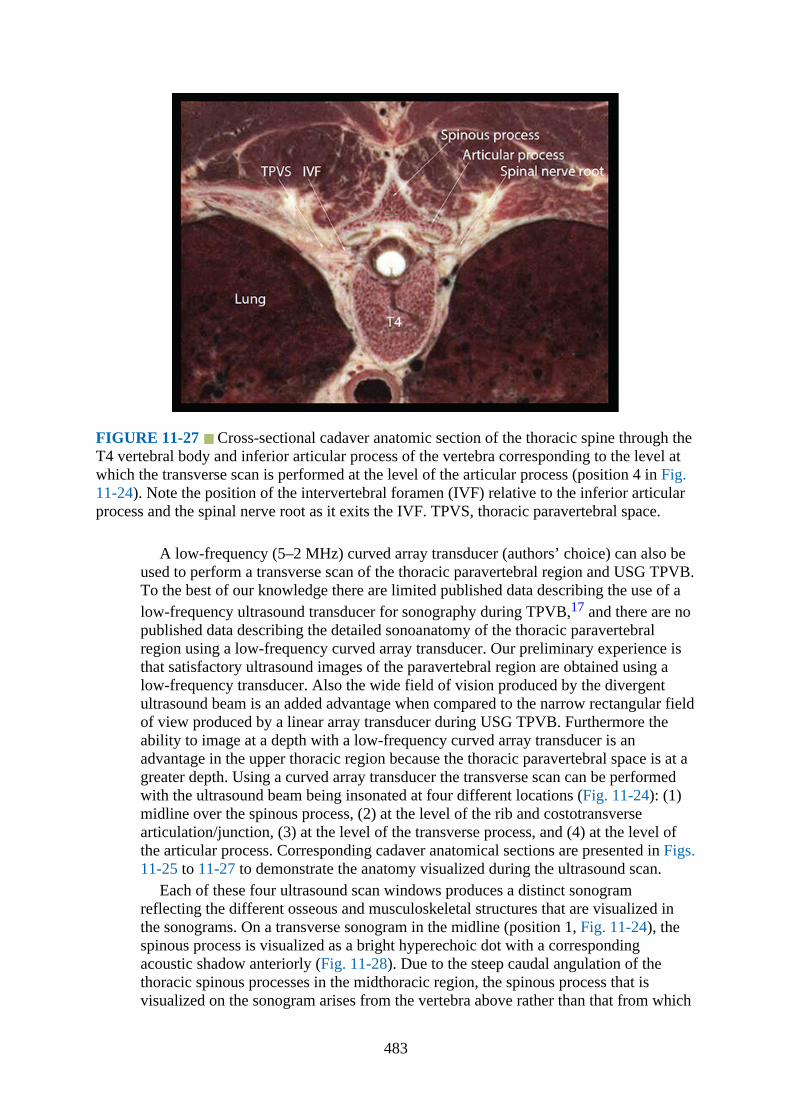
FIGURE 11-27 Cross-sectional cadaver anatomic section of the thoracic spine through theT4 vertebral body and inferior articular process of the vertebra corresponding to the level atwhich the transverse scan is performed at the level of the articular process (position 4 in Fig.11-24). Note the position of the intervertebral foramen (IVF) relative to the inferior articularprocess and the spinal nerve root as it exits the IVF. TPVS, thoracic paravertebral space.
A low-frequency (5–2 MHz) curved array transducer (authors’ choice) can also beused to perform a transverse scan of the thoracic paravertebral region and USG TPVB.To the best of our knowledge there are limited published data describing the use of alow-frequency ultrasound transducer for sonography during TPVB,17 and there are nopublished data describing the detailed sonoanatomy of the thoracic paravertebralregion using a low-frequency curved array transducer. Our preliminary experience isthat satisfactory ultrasound images of the paravertebral region are obtained using alow-frequency transducer. Also the wide field of vision produced by the divergentultrasound beam is an added advantage when compared to the narrow rectangular fieldof view produced by a linear array transducer during USG TPVB. Furthermore theability to image at a depth with a low-frequency curved array transducer is anadvantage in the upper thoracic region because the thoracic paravertebral space is at agreater depth. Using a curved array transducer the transverse scan can be performedwith the ultrasound beam being insonated at four different locations (Fig. 11-24): (1)midline over the spinous process, (2) at the level of the rib and costotransversearticulation/junction, (3) at the level of the transverse process, and (4) at the level ofthe articular process. Corresponding cadaver anatomical sections are presented in Figs.11-25 to 11-27 to demonstrate the anatomy visualized during the ultrasound scan.
Each of these four ultrasound scan windows produces a distinct sonogramreflecting the different osseous and musculoskeletal structures that are visualized inthe sonograms. On a transverse sonogram in the midline (position 1, Fig. 11-24), thespinous process is visualized as a bright hyperechoic dot with a correspondingacoustic shadow anteriorly (Fig. 11-28). Due to the steep caudal angulation of thethoracic spinous processes in the midthoracic region, the spinous process that isvisualized on the sonogram arises from the vertebra above rather than that from which
483

the transverse process, lamina, and the articular process arise (Fig. 11-29). Because thespinous process and transverse process cast a large acoustic shadow, visualization ofthe paravertebral anatomy is limited in this ultrasound scan window. Also the acousticshadow of the spinous process, lamina, transverse process, and ribs produce asonographic pattern that we refer to as the “flying swan sign” due to its closeresemblance to a swan in flight (Fig. 11-30).
FIGURE 11-28 Median transverse scan of the thoracic spine (midthoracic region) using alow-frequency curved array transducer with the ultrasound beam being insonated over thespinous process (position 1 in Fig. 11-24). Note the hyperechoic spinous process with itsacoustic shadow in the midline. The hyperechoic lamina and the posteriorly directedtransverse process (TP) are also seen laterally on either side of the midline. The acousticshadow of the SP, TP, and the lamina produces a sonographic pattern that resembles a “flyingswan” (details in text) and completely obscures the spinal canal and the paravertebral space.
484

FIGURE 11-29 Figure illustrating the structures that are insonated during a mediantransverse scan of the midthoracic spine. Note the posteriorly directed transverse processes.Also due to the acute caudal angulation of the thoracic spinous processes, the posteriorelements of the vertebra (ie, the lamina and transverse process), which are insonated, arefrom the vertebra one level below.
FIGURE 11-30 Figure demonstrating the outlines of the bony elements that are insonatedduring a median transverse ultrasound scan of the thoracic spine and how the acousticshadow produced resembles a swan in flight (“flying swan sign”).
485

With the ultrasound transducer positioned slightly laterally (position 2, Fig. 11-24),the hyperechoic outlines of the lamina, transverse process, and the rib with theircorresponding acoustic shadows are clearly delineated (Fig. 11-31). However, unlikethe transverse process of the lumbar vertebra, which are more or less at right angles tothe vertebral body, the transverse processes in the thoracic spine are directedposteriorly (Fig. 11-32), and this posterior angulation can be clearly delineated in thetransverse sonogram (Fig. 11-31). Once the transverse process, costotransversearticulation, and the rib are identified, one can gently slide or tilt the transducercaudally until the acoustic shadow of the rib is no longer visualized (position 3, Fig.11-24), and the hyperechoic outline of the lamina and transverse process with theiracoustic shadow are seen (Fig. 11-33). Lateral to the transverse process, thehyperechoic pleura and lung are visualized anteriorly, the thick hyperechoic SCTLposteriorly, and the hypoechoic apical part of the TPVS is interposed between the two(Fig. 11-33). If one now gently slides or tilts the ultrasound transducer slightlycaudally (position 4, Fig. 11-24), the acoustic shadow of the transverse processdisappears, and the hyperechoic articular process (inferior) with its acoustic shadow isseen medially (Fig. 11-34). As in the ultrasound scan at the level of the transverseprocess (Fig. 11-33), the SCTL, parietal pleura, lung, and the apical part of theparavertebral space are also clearly delineated. However, because the acoustic shadowof the transverse process is no longer present, outlines of the true TPVS can now bevisualized (Fig. 11-34). Currently the majority of the published data describing the useof a transverse scan for TPVB have used the ultrasound scan window at the level ofthe transverse process (position 3, Fig. 11-24),17,18,20 and there are limited publisheddata describing the use of the transverse ultrasound scan window at the level of thearticular process for TPVB. Because there is less bony obstruction through theintertransverse space and at the level of the articular process (position 4, Fig. 11-24), itis our preferred route for imaging and needle insertion during an USG TPVB.However, ultrasound visibility of the paravertebral anatomy is more challenging in theupper thoracic region (Figs. 11-35 to 11-37). This may be related to the increaseddepth to the paravertebral space and anisotropy, from the pleura reflecting away fromthe paravertebral space, in the upper thoracic region (Fig. 11-36). Despite some ofthese limitations, it is possible to perform a transverse scan of the TPVS at allsegments of the thoracic spine for TPVB (Figs. 11-35 to 11-44). We have successfullyused this approach for both single-injection and multi-injection TPVB at all levels ofthe thoracic spine.
486

FIGURE 11-31 Paramedian transverse scan of the right thoracic paravertebral region usinga low-frequency curved array transducer with the ultrasound beam being insonated over thetransverse process (TP) and the rib (position 2 in Fig. 11-24). Note the posteriorly directedTP and how the acoustic shadow of the TP and rib completely obscures the underlyingparavertebral anatomy.
FIGURE 11-32 Figure showing the difference in the size, shape, and orientation of thetransverse process (TP) of a thoracic and lumbar vertebra. Note how the TP of a thoracicvertebra is directed posteriorly. SP, spinous process; AP, articular process; TP, transverseprocess; SC, spinal canal; VB, vertebral body.
487

FIGURE 11-33 Paramedian transverse scan of the right thoracic paravertebral region usinga low-frequency curved array transducer with the ultrasound beam being insonated over thetransverse process (TP, position 3 in Fig. 11-24). Note the hyperechoic TP and its acousticshadow. The apex of the thoracic paravertebral space (TPVS), parietal pleura, and thesuperior costotransverse ligament are seen lateral to the TP. SCTL, superior costotransverseligament.
FIGURE 11-34 Paramedian transverse scan of the right thoracic paravertebral region usinga low-frequency curved array transducer with the ultrasound beam being insonated throughthe intertransverse space, that is, between two adjoining thoracic transverse processes(position 4 in Fig. 11-24). Note the hyperechoic inferior articular process and its acousticshadow medially, which obscures the underlying intervertebral foramen (IVF). As with theparamedian transverse scan at position 3, the apex of the thoracic paravertebral space
488
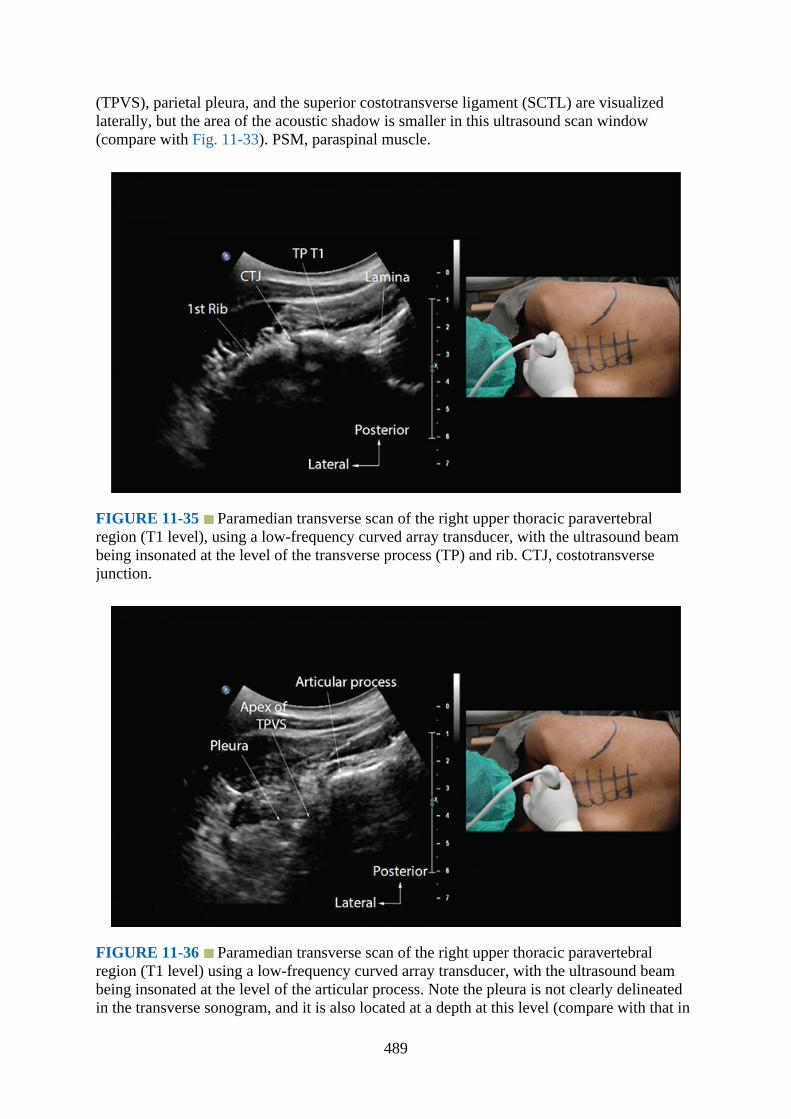
(TPVS), parietal pleura, and the superior costotransverse ligament (SCTL) are visualizedlaterally, but the area of the acoustic shadow is smaller in this ultrasound scan window(compare with Fig. 11-33). PSM, paraspinal muscle.
FIGURE 11-35 Paramedian transverse scan of the right upper thoracic paravertebralregion (T1 level), using a low-frequency curved array transducer, with the ultrasound beambeing insonated at the level of the transverse process (TP) and rib. CTJ, costotransversejunction.
FIGURE 11-36 Paramedian transverse scan of the right upper thoracic paravertebralregion (T1 level) using a low-frequency curved array transducer, with the ultrasound beambeing insonated at the level of the articular process. Note the pleura is not clearly delineatedin the transverse sonogram, and it is also located at a depth at this level (compare with that in
489

the midthoracic region, Fig. 11-41). TPVS, thoracic paravertebral space.
FIGURE 11-37 Paramedian transverse scan of the right upper thoracic paravertebralregion (T1 level) using a low-frequency curved array transducer with the ultrasound beambeing insonated at the level of the transverse process (TP). Note the slight caudal orientationof the ultrasound transducer. SCTL, superior costotransverse ligament.
FIGURE 11-38 Paramedian transverse scan of the right upper thoracic paravertebralregion (T1 level) using a low-frequency curved array transducer with the ultrasound beambeing insonated at the level of the articular process. Once again, note the slight caudalorientation of the ultrasound transducer. SCTL, superior costotransverse ligament; TPVS,thoracic paravertebral space.
490
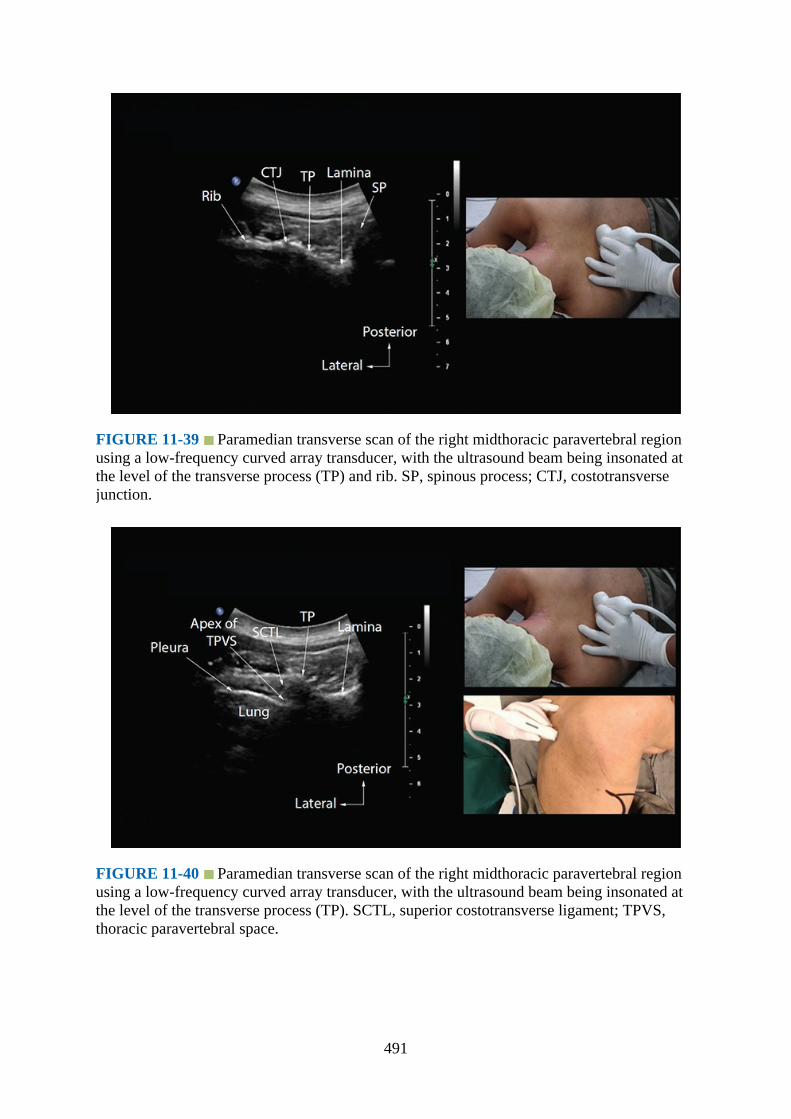
FIGURE 11-39 Paramedian transverse scan of the right midthoracic paravertebral regionusing a low-frequency curved array transducer, with the ultrasound beam being insonated atthe level of the transverse process (TP) and rib. SP, spinous process; CTJ, costotransversejunction.
FIGURE 11-40 Paramedian transverse scan of the right midthoracic paravertebral regionusing a low-frequency curved array transducer, with the ultrasound beam being insonated atthe level of the transverse process (TP). SCTL, superior costotransverse ligament; TPVS,thoracic paravertebral space.
491
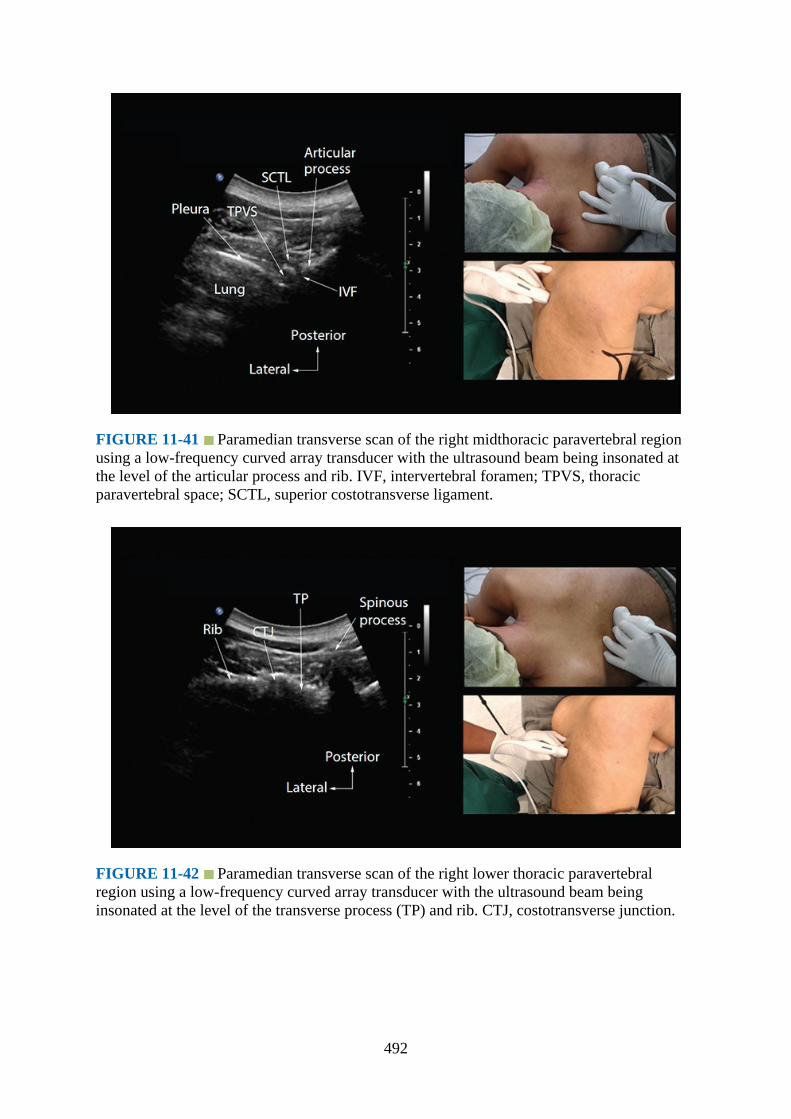
FIGURE 11-41 Paramedian transverse scan of the right midthoracic paravertebral regionusing a low-frequency curved array transducer with the ultrasound beam being insonated atthe level of the articular process and rib. IVF, intervertebral foramen; TPVS, thoracicparavertebral space; SCTL, superior costotransverse ligament.
FIGURE 11-42 Paramedian transverse scan of the right lower thoracic paravertebralregion using a low-frequency curved array transducer with the ultrasound beam beinginsonated at the level of the transverse process (TP) and rib. CTJ, costotransverse junction.
492
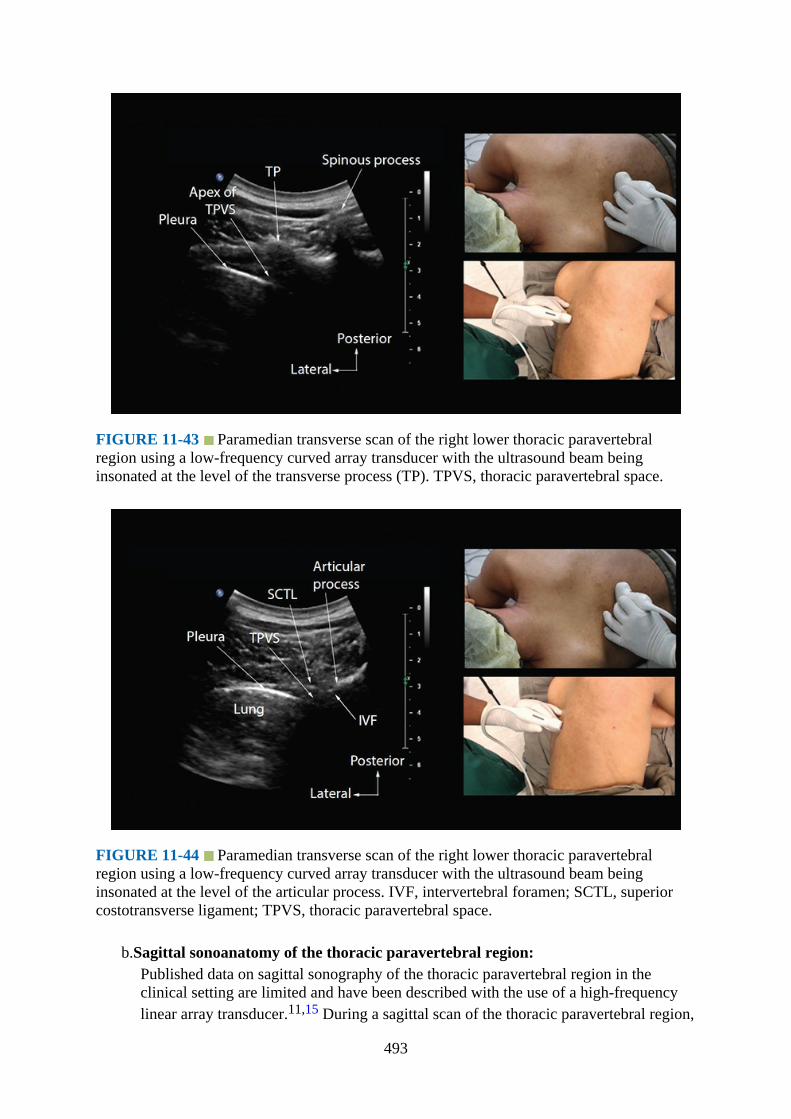
FIGURE 11-43 Paramedian transverse scan of the right lower thoracic paravertebralregion using a low-frequency curved array transducer with the ultrasound beam beinginsonated at the level of the transverse process (TP). TPVS, thoracic paravertebral space.
FIGURE 11-44 Paramedian transverse scan of the right lower thoracic paravertebralregion using a low-frequency curved array transducer with the ultrasound beam beinginsonated at the level of the articular process. IVF, intervertebral foramen; SCTL, superiorcostotransverse ligament; TPVS, thoracic paravertebral space.
b.Sagittal sonoanatomy of the thoracic paravertebral region:Published data on sagittal sonography of the thoracic paravertebral region in theclinical setting are limited and have been described with the use of a high-frequencylinear array transducer.11,15 During a sagittal scan of the thoracic paravertebral region,
493

the ultrasound transducer is positioned 2 to 3 cm lateral to the midline (paramedian)with its orientation marker directed cranially (Figs. 11-45 to 11-47). On a sagittalsonogram the transverse processes are seen as hyperechoic and rounded structuresdeep to the paraspinal muscles, and they cast an acoustic shadow anteriorly (Fig. 11-48). In between the acoustic shadows of two adjacent transverse processes, an acousticwindow is produced by reflections from the SCTL and intertransverse ligaments, theparavertebral space and its contents, the parietal pleura, and lung tissue (in a posterior-to-anterior direction) (Fig. 11-48).
FIGURE 11-45 Figure demonstrating the position of the patient (lateral in this image) andhow the ultrasound transducer is oriented during a paramedian sagittal scan of the thoracicparavertebral region.
FIGURE 11-46 Figure showing how the ultrasound beam is insonated during a
494
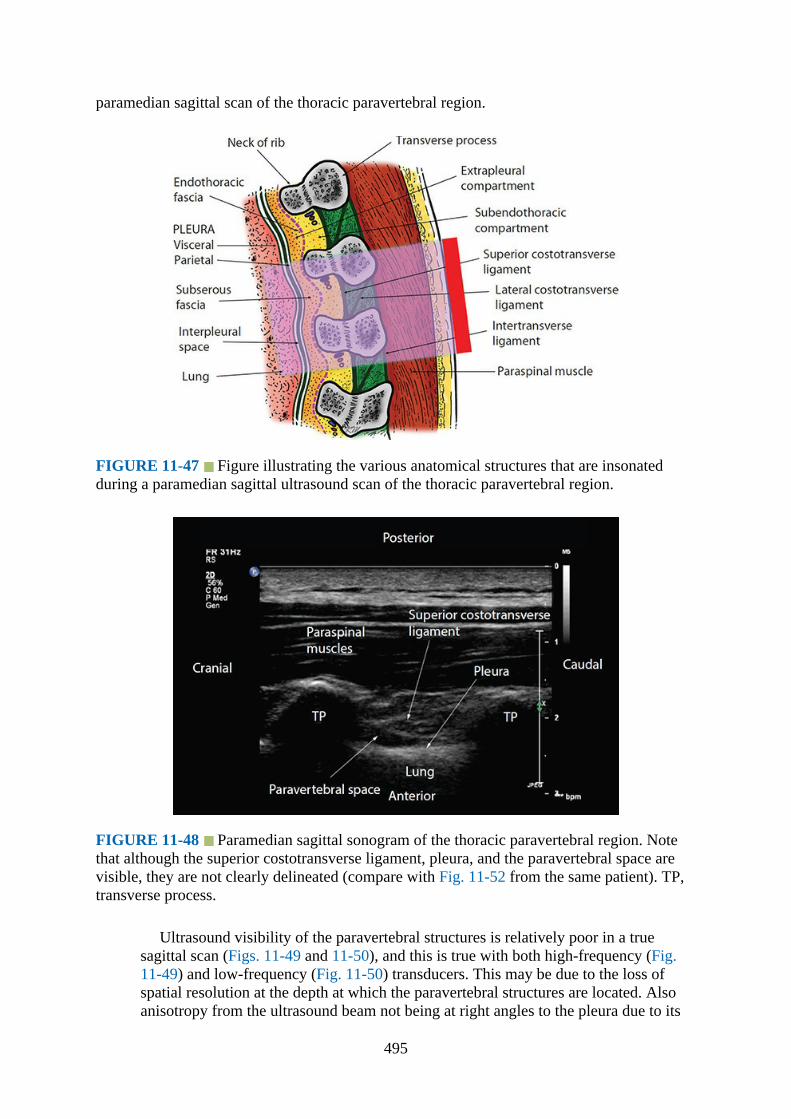
paramedian sagittal scan of the thoracic paravertebral region.
FIGURE 11-47 Figure illustrating the various anatomical structures that are insonatedduring a paramedian sagittal ultrasound scan of the thoracic paravertebral region.
FIGURE 11-48 Paramedian sagittal sonogram of the thoracic paravertebral region. Notethat although the superior costotransverse ligament, pleura, and the paravertebral space arevisible, they are not clearly delineated (compare with Fig. 11-52 from the same patient). TP,transverse process.
Ultrasound visibility of the paravertebral structures is relatively poor in a truesagittal scan (Figs. 11-49 and 11-50), and this is true with both high-frequency (Fig.11-49) and low-frequency (Fig. 11-50) transducers. This may be due to the loss ofspatial resolution at the depth at which the paravertebral structures are located. Alsoanisotropy from the ultrasound beam not being at right angles to the pleura due to its
495
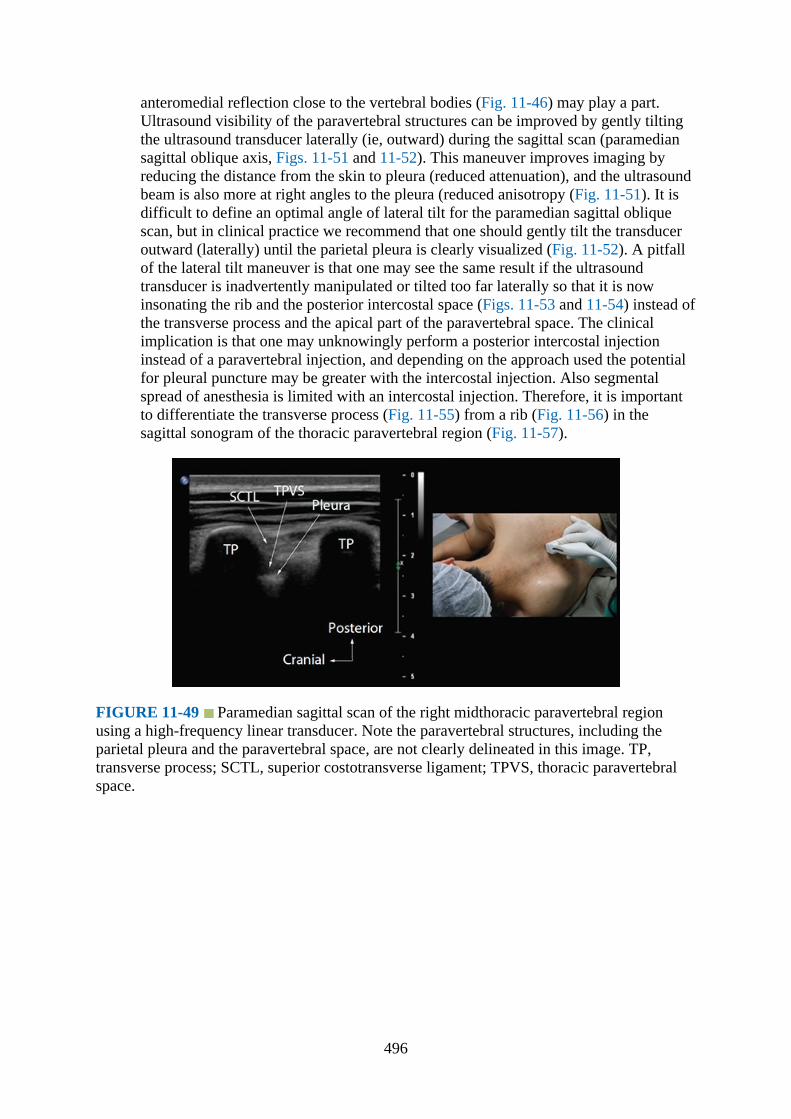
anteromedial reflection close to the vertebral bodies (Fig. 11-46) may play a part.Ultrasound visibility of the paravertebral structures can be improved by gently tiltingthe ultrasound transducer laterally (ie, outward) during the sagittal scan (paramediansagittal oblique axis, Figs. 11-51 and 11-52). This maneuver improves imaging byreducing the distance from the skin to pleura (reduced attenuation), and the ultrasoundbeam is also more at right angles to the pleura (reduced anisotropy (Fig. 11-51). It isdifficult to define an optimal angle of lateral tilt for the paramedian sagittal obliquescan, but in clinical practice we recommend that one should gently tilt the transduceroutward (laterally) until the parietal pleura is clearly visualized (Fig. 11-52). A pitfallof the lateral tilt maneuver is that one may see the same result if the ultrasoundtransducer is inadvertently manipulated or tilted too far laterally so that it is nowinsonating the rib and the posterior intercostal space (Figs. 11-53 and 11-54) instead ofthe transverse process and the apical part of the paravertebral space. The clinicalimplication is that one may unknowingly perform a posterior intercostal injectioninstead of a paravertebral injection, and depending on the approach used the potentialfor pleural puncture may be greater with the intercostal injection. Also segmentalspread of anesthesia is limited with an intercostal injection. Therefore, it is importantto differentiate the transverse process (Fig. 11-55) from a rib (Fig. 11-56) in thesagittal sonogram of the thoracic paravertebral region (Fig. 11-57).
FIGURE 11-49 Paramedian sagittal scan of the right midthoracic paravertebral regionusing a high-frequency linear transducer. Note the paravertebral structures, including theparietal pleura and the paravertebral space, are not clearly delineated in this image. TP,transverse process; SCTL, superior costotransverse ligament; TPVS, thoracic paravertebralspace.
496

FIGURE 11-50 Paramedian sagittal scan of the right midthoracic paravertebral regionusing a low-frequency curvilinear transducer. Note the paravertebral structures, including theparietal pleura and the paravertebral space, are not clearly delineated in the sagittal sonogram.TP, transverse process; SCTL, superior costotransverse ligament; TPVS, thoracicparavertebral space.
FIGURE 11-51 Figure illustrating how the ultrasound beam is insonated during aparamedian sagittal oblique scan of the thoracic paravertebral region.
497
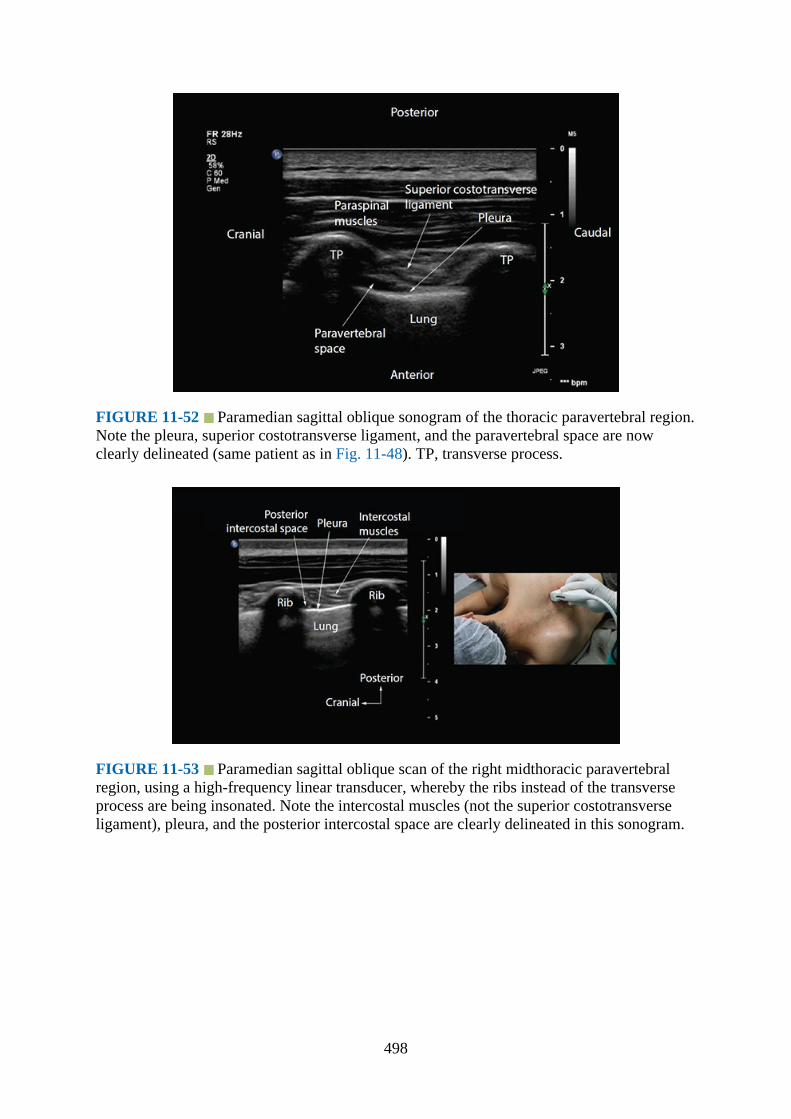
FIGURE 11-52 Paramedian sagittal oblique sonogram of the thoracic paravertebral region.Note the pleura, superior costotransverse ligament, and the paravertebral space are nowclearly delineated (same patient as in Fig. 11-48). TP, transverse process.
FIGURE 11-53 Paramedian sagittal oblique scan of the right midthoracic paravertebralregion, using a high-frequency linear transducer, whereby the ribs instead of the transverseprocess are being insonated. Note the intercostal muscles (not the superior costotransverseligament), pleura, and the posterior intercostal space are clearly delineated in this sonogram.
498
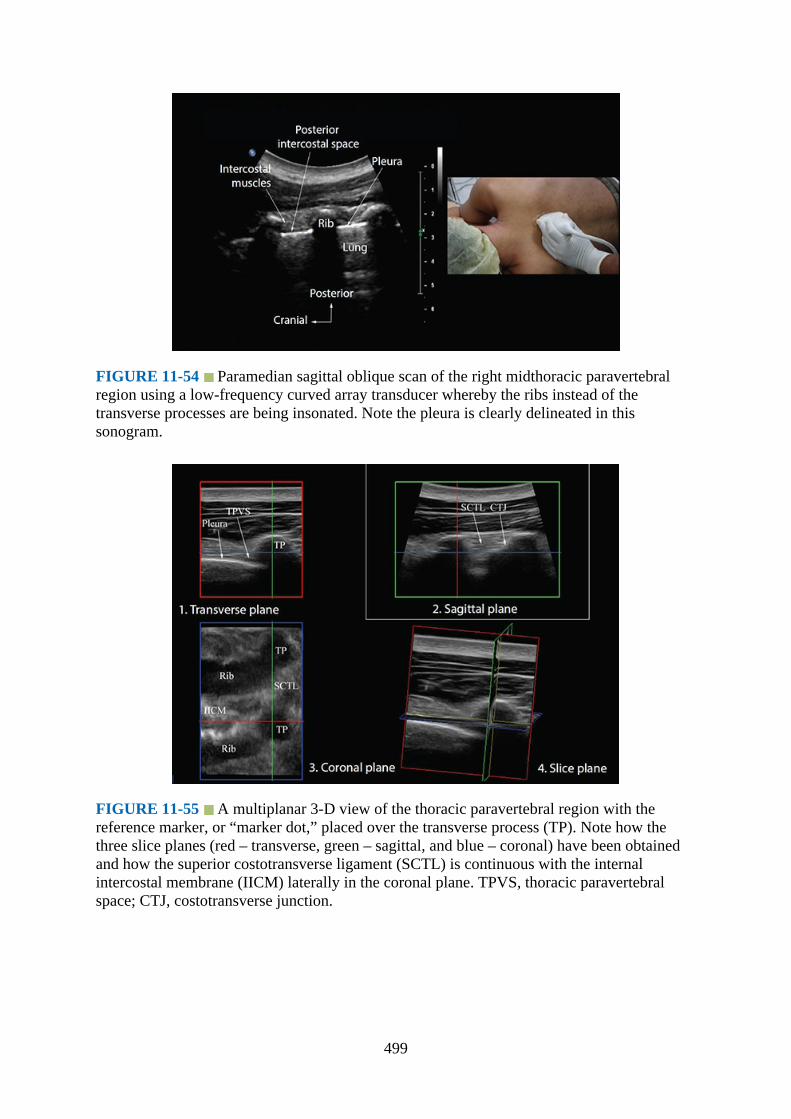
FIGURE 11-54 Paramedian sagittal oblique scan of the right midthoracic paravertebralregion using a low-frequency curved array transducer whereby the ribs instead of thetransverse processes are being insonated. Note the pleura is clearly delineated in thissonogram.
FIGURE 11-55 A multiplanar 3-D view of the thoracic paravertebral region with thereference marker, or “marker dot,” placed over the transverse process (TP). Note how thethree slice planes (red – transverse, green – sagittal, and blue – coronal) have been obtainedand how the superior costotransverse ligament (SCTL) is continuous with the internalintercostal membrane (IICM) laterally in the coronal plane. TPVS, thoracic paravertebralspace; CTJ, costotransverse junction.
499

FIGURE 11-56 A multiplanar 3-D view of the thoracic paravertebral region in color (sepiatone) with the reference marker, or “marker dot,” placed over the apex of the thoracicparavertebral space (TPVS). Note the hyperechoic pleura in the coronal plane. SCTL,superior costotransverse ligament; TPVS, thoracic paravertebral space; TP, transverseprocess.
FIGURE 11-57 A sequence of sagittal sonograms of the thoracic paravertebral region(from the same subject) showing the transition of the anatomy from the level of the lamina tothe ribs. Note the difference in the sonographic appearance of the lamina, transverse process(TP), and the ribs. Also note the relative depths at which each structure is located. Thearticulation of the rib with the transverse process at the CTJ (costotransverse junction) is
500

clearly delineated in Fig. 11-57D. Also note that the pleura is not clearly visualized at thelevel of the TP, but it is at the level of the ribs. ES, epidural space; ILS, interlaminar space;LF, ligamentum flavum; SCTL, superior costotransverse ligament; TPVS, thoracicparavertebral space; ICM, intercostal muscles; ICS, intercostal space.
We are not aware of any published data validating the sonoanatomy of the thoracicparavertebral region, but it is our experience that there is good correlation betweenstructures that are visualized in a thoracic paravertebral sonogram and that incorresponding anatomical sections, CT, and MRI images of the thoracic paravertebralregion (Figs. 11-58 to Fig. 11-60). However, irrespective of the plane of ultrasoundimaging, we still have not been able to delineate the intercostal nerve or its brancheswith currently available ultrasound technology. The intercostal blood vessels are morereadily visualized close to the inferior border of the transverse process using Color orPower Doppler ultrasound (Figs. 11-61 and 11-62).
FIGURE 11-58 Correlative transverse cadaver anatomic (Fig. 11-58A), CT (Fig. 11-58B),MRI (T2-weighted, Fig. 11-58C), and ultrasound (Fig. 11-58D) images of the thoracicparavertebral region from the level of the thoracic vertebral body, transverse process, and therib corresponding to the level at which the transverse scan was performed in the midline(position 1, Fig. 11-24). PSM, paraspinal muscle; VB, vertebral body; TP, transverse process.
501
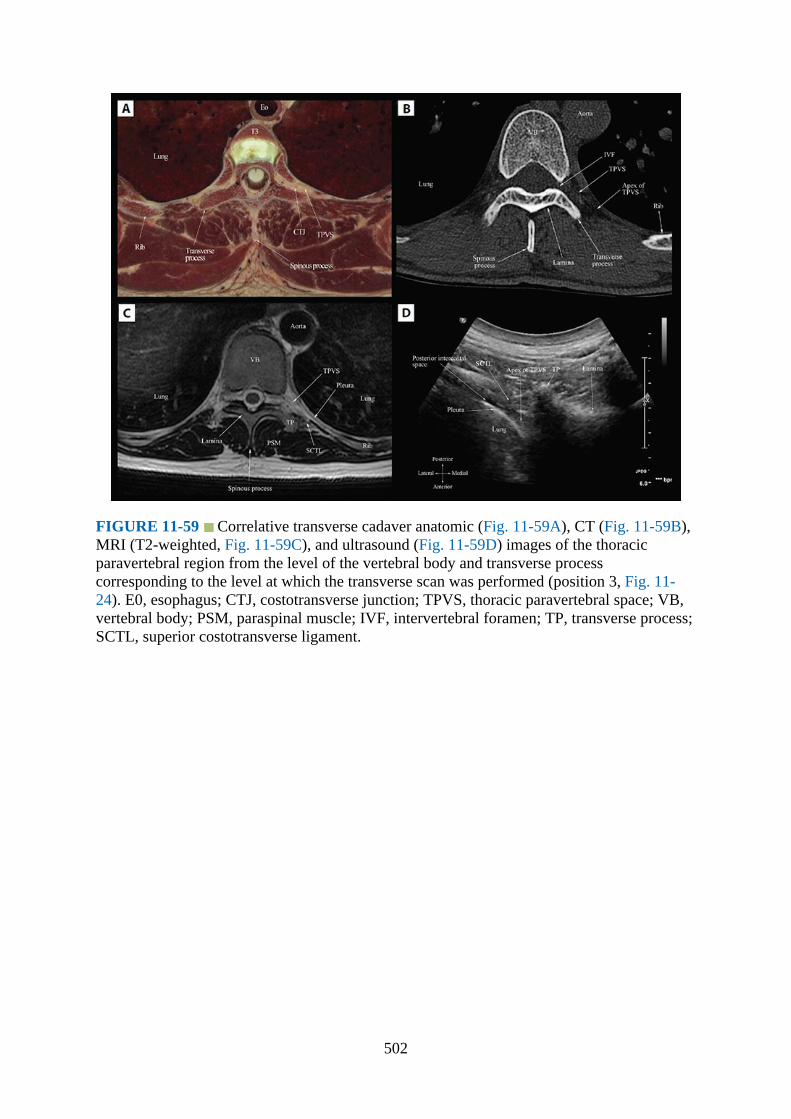
FIGURE 11-59 Correlative transverse cadaver anatomic (Fig. 11-59A), CT (Fig. 11-59B),MRI (T2-weighted, Fig. 11-59C), and ultrasound (Fig. 11-59D) images of the thoracicparavertebral region from the level of the vertebral body and transverse processcorresponding to the level at which the transverse scan was performed (position 3, Fig. 11-24). E0, esophagus; CTJ, costotransverse junction; TPVS, thoracic paravertebral space; VB,vertebral body; PSM, paraspinal muscle; IVF, intervertebral foramen; TP, transverse process;SCTL, superior costotransverse ligament.
502

FIGURE 11-60 Correlative transverse cadaver anatomic (Fig. 11-60A), CT (Fig. 11-60B),MRI (T2-weighted, Fig. 11-60C), and ultrasound (Fig. 11-60D) images of the thoracicparavertebral region from the level of the vertebral body and inferior articular processcorresponding to the level at which the transverse scan was performed (position 4, Fig. 11-24). TPVS, thoracic paravertebral space; IVF, intervertebral foramen; SCTL, superiorcostotransverse ligament; VB, vertebral body; PSM, paraspinal muscle; SP, spinous process.
FIGURE 11-61 Paramedian sagittal oblique sonogram of the thoracic paravertebral regionshowing the Color Doppler signal from the intercostal artery at the apex of the paravertebralspace. TP, transverse process.
503
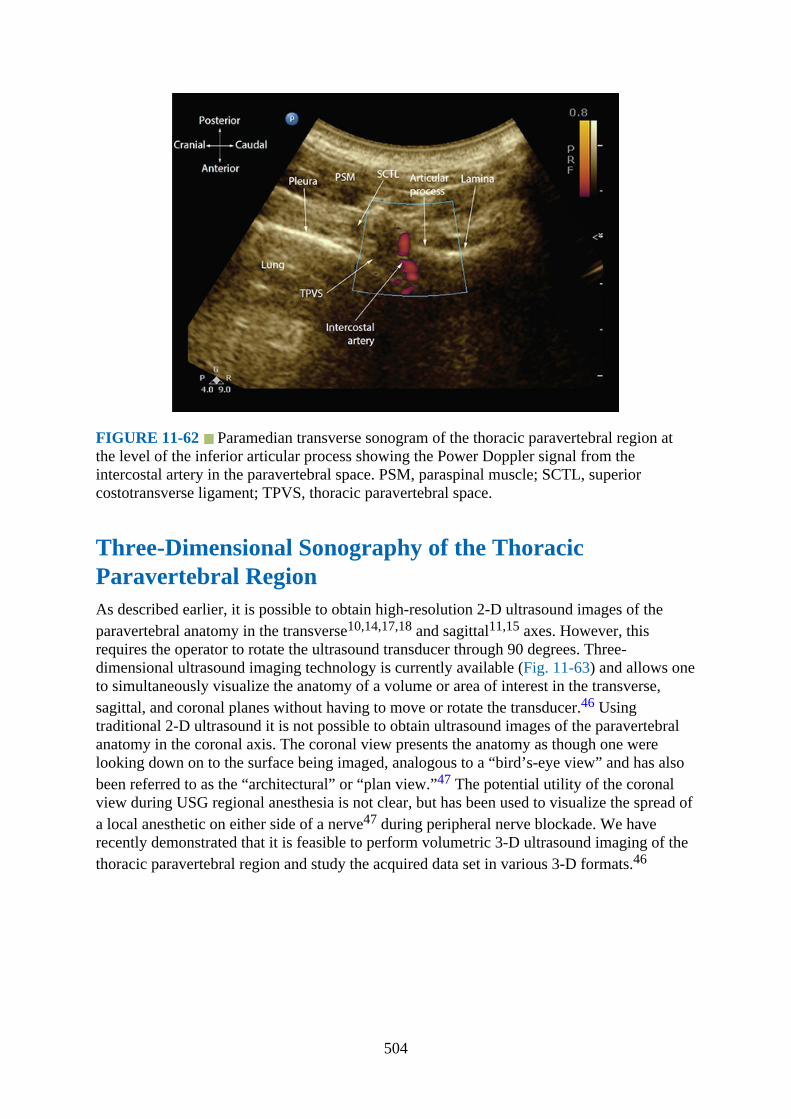
FIGURE 11-62 Paramedian transverse sonogram of the thoracic paravertebral region atthe level of the inferior articular process showing the Power Doppler signal from theintercostal artery in the paravertebral space. PSM, paraspinal muscle; SCTL, superiorcostotransverse ligament; TPVS, thoracic paravertebral space.
Three-Dimensional Sonography of the ThoracicParavertebral RegionAs described earlier, it is possible to obtain high-resolution 2-D ultrasound images of theparavertebral anatomy in the transverse10,14,17,18 and sagittal11,15 axes. However, thisrequires the operator to rotate the ultrasound transducer through 90 degrees. Three-dimensional ultrasound imaging technology is currently available (Fig. 11-63) and allows oneto simultaneously visualize the anatomy of a volume or area of interest in the transverse,sagittal, and coronal planes without having to move or rotate the transducer.46 Usingtraditional 2-D ultrasound it is not possible to obtain ultrasound images of the paravertebralanatomy in the coronal axis. The coronal view presents the anatomy as though one werelooking down on to the surface being imaged, analogous to a “bird’s-eye view” and has alsobeen referred to as the “architectural” or “plan view.”47 The potential utility of the coronalview during USG regional anesthesia is not clear, but has been used to visualize the spread ofa local anesthetic on either side of a nerve47 during peripheral nerve blockade. We haverecently demonstrated that it is feasible to perform volumetric 3-D ultrasound imaging of thethoracic paravertebral region and study the acquired data set in various 3-D formats.46
504
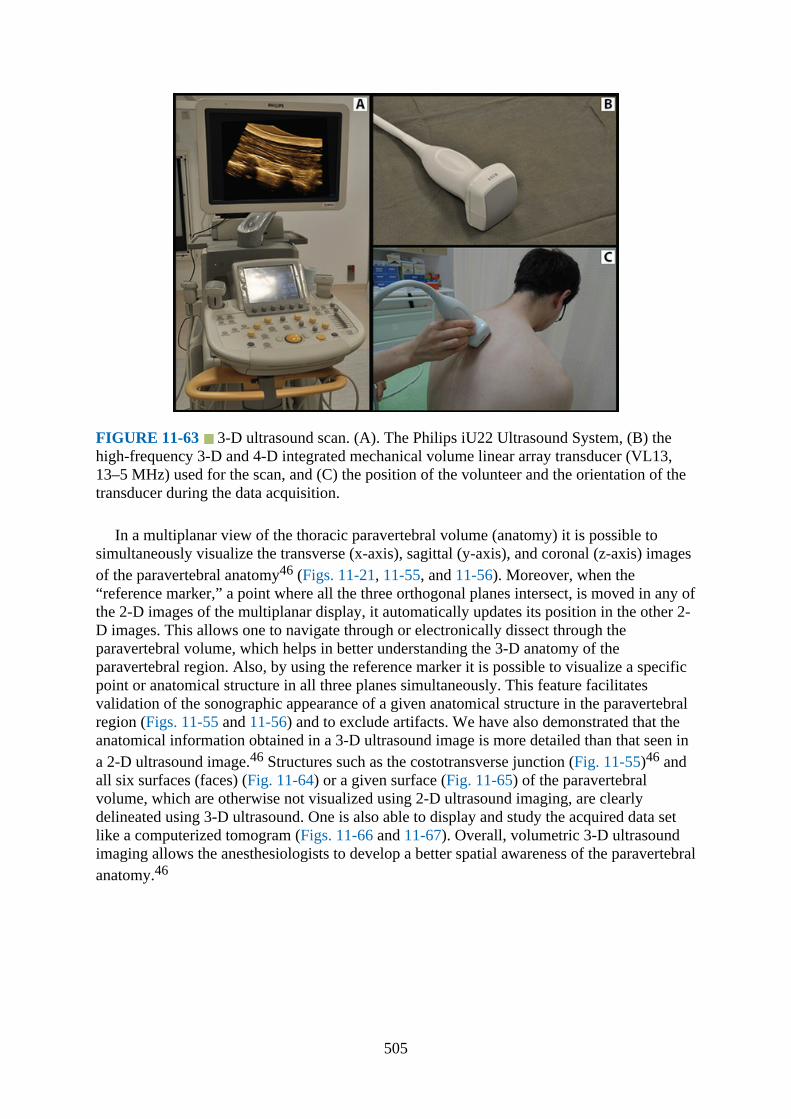
FIGURE 11-63 3-D ultrasound scan. (A). The Philips iU22 Ultrasound System, (B) thehigh-frequency 3-D and 4-D integrated mechanical volume linear array transducer (VL13,13–5 MHz) used for the scan, and (C) the position of the volunteer and the orientation of thetransducer during the data acquisition.
In a multiplanar view of the thoracic paravertebral volume (anatomy) it is possible tosimultaneously visualize the transverse (x-axis), sagittal (y-axis), and coronal (z-axis) imagesof the paravertebral anatomy46 (Figs. 11-21, 11-55, and 11-56). Moreover, when the“reference marker,” a point where all the three orthogonal planes intersect, is moved in any ofthe 2-D images of the multiplanar display, it automatically updates its position in the other 2-D images. This allows one to navigate through or electronically dissect through theparavertebral volume, which helps in better understanding the 3-D anatomy of theparavertebral region. Also, by using the reference marker it is possible to visualize a specificpoint or anatomical structure in all three planes simultaneously. This feature facilitatesvalidation of the sonographic appearance of a given anatomical structure in the paravertebralregion (Figs. 11-55 and 11-56) and to exclude artifacts. We have also demonstrated that theanatomical information obtained in a 3-D ultrasound image is more detailed than that seen ina 2-D ultrasound image.46 Structures such as the costotransverse junction (Fig. 11-55)46 andall six surfaces (faces) (Fig. 11-64) or a given surface (Fig. 11-65) of the paravertebralvolume, which are otherwise not visualized using 2-D ultrasound imaging, are clearlydelineated using 3-D ultrasound. One is also able to display and study the acquired data setlike a computerized tomogram (Figs. 11-66 and 11-67). Overall, volumetric 3-D ultrasoundimaging allows the anesthesiologists to develop a better spatial awareness of the paravertebralanatomy.46
505
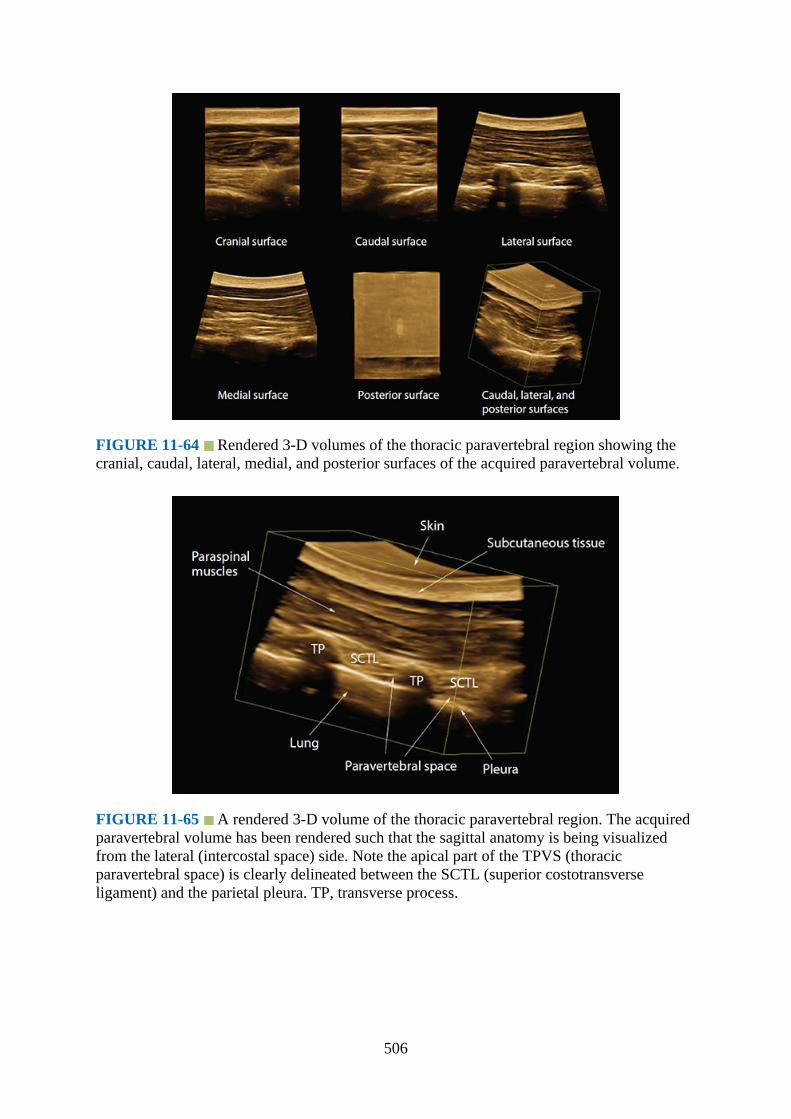
FIGURE 11-64 Rendered 3-D volumes of the thoracic paravertebral region showing thecranial, caudal, lateral, medial, and posterior surfaces of the acquired paravertebral volume.
FIGURE 11-65 A rendered 3-D volume of the thoracic paravertebral region. The acquiredparavertebral volume has been rendered such that the sagittal anatomy is being visualizedfrom the lateral (intercostal space) side. Note the apical part of the TPVS (thoracicparavertebral space) is clearly delineated between the SCTL (superior costotransverseligament) and the parietal pleura. TP, transverse process.
506
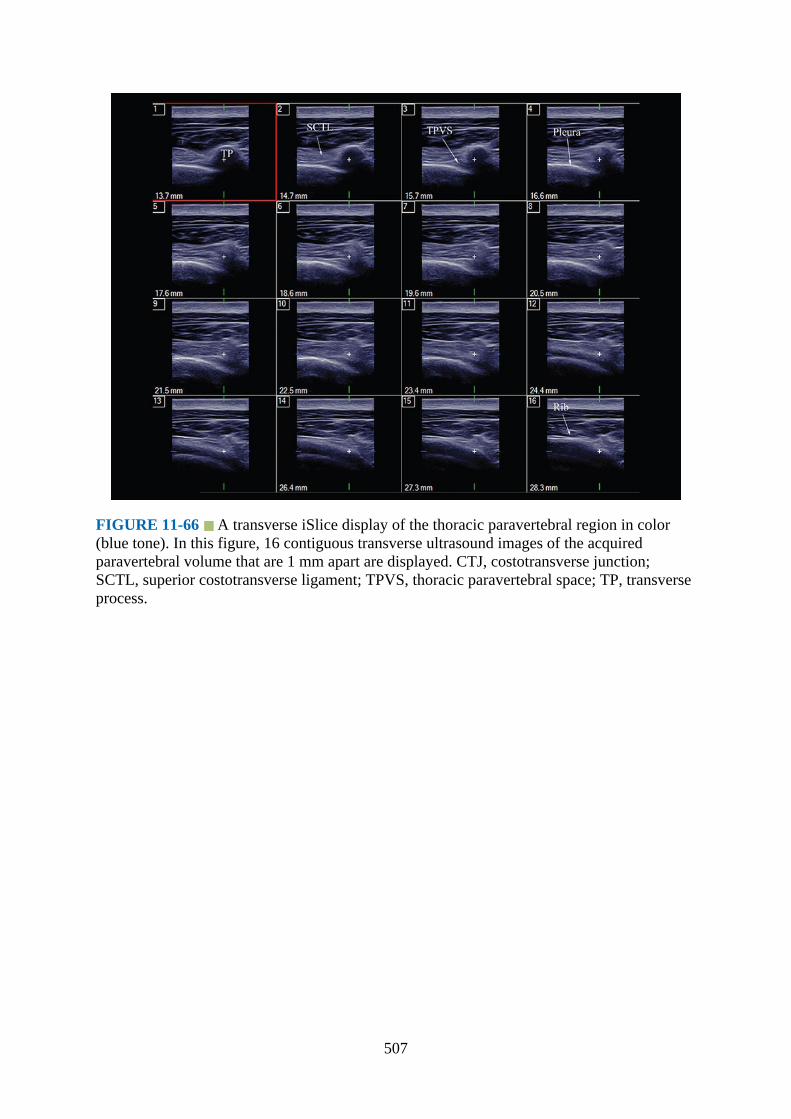
FIGURE 11-66 A transverse iSlice display of the thoracic paravertebral region in color(blue tone). In this figure, 16 contiguous transverse ultrasound images of the acquiredparavertebral volume that are 1 mm apart are displayed. CTJ, costotransverse junction;SCTL, superior costotransverse ligament; TPVS, thoracic paravertebral space; TP, transverseprocess.
507
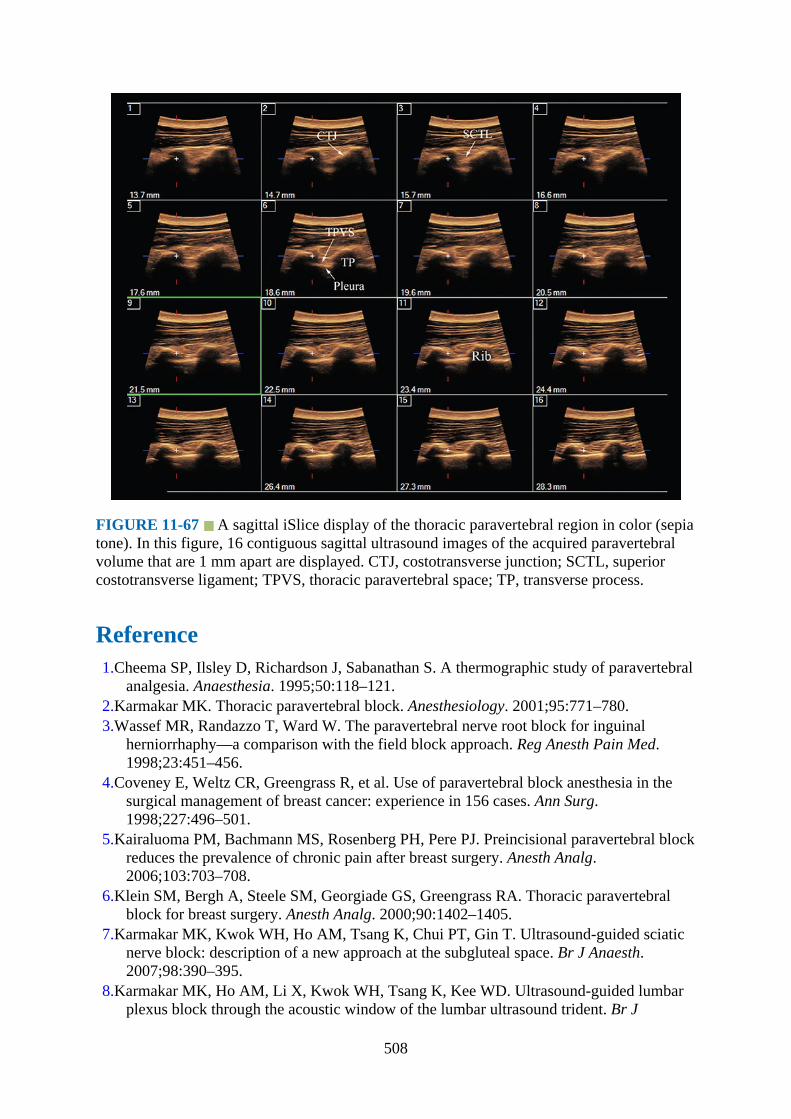
FIGURE 11-67 A sagittal iSlice display of the thoracic paravertebral region in color (sepiatone). In this figure, 16 contiguous sagittal ultrasound images of the acquired paravertebralvolume that are 1 mm apart are displayed. CTJ, costotransverse junction; SCTL, superiorcostotransverse ligament; TPVS, thoracic paravertebral space; TP, transverse process.
Reference1.Cheema SP, Ilsley D, Richardson J, Sabanathan S. A thermographic study of paravertebral
analgesia. Anaesthesia. 1995;50:118–121.2.Karmakar MK. Thoracic paravertebral block. Anesthesiology. 2001;95:771–780.3.Wassef MR, Randazzo T, Ward W. The paravertebral nerve root block for inguinal
herniorrhaphy—a comparison with the field block approach. Reg Anesth Pain Med.1998;23:451–456.
4.Coveney E, Weltz CR, Greengrass R, et al. Use of paravertebral block anesthesia in thesurgical management of breast cancer: experience in 156 cases. Ann Surg.1998;227:496–501.
5.Kairaluoma PM, Bachmann MS, Rosenberg PH, Pere PJ. Preincisional paravertebral blockreduces the prevalence of chronic pain after breast surgery. Anesth Analg.2006;103:703–708.
6.Klein SM, Bergh A, Steele SM, Georgiade GS, Greengrass RA. Thoracic paravertebralblock for breast surgery. Anesth Analg. 2000;90:1402–1405.
7.Karmakar MK, Kwok WH, Ho AM, Tsang K, Chui PT, Gin T. Ultrasound-guided sciaticnerve block: description of a new approach at the subgluteal space. Br J Anaesth.2007;98:390–395.
8.Karmakar MK, Ho AM, Li X, Kwok WH, Tsang K, Kee WD. Ultrasound-guided lumbarplexus block through the acoustic window of the lumbar ultrasound trident. Br J
508
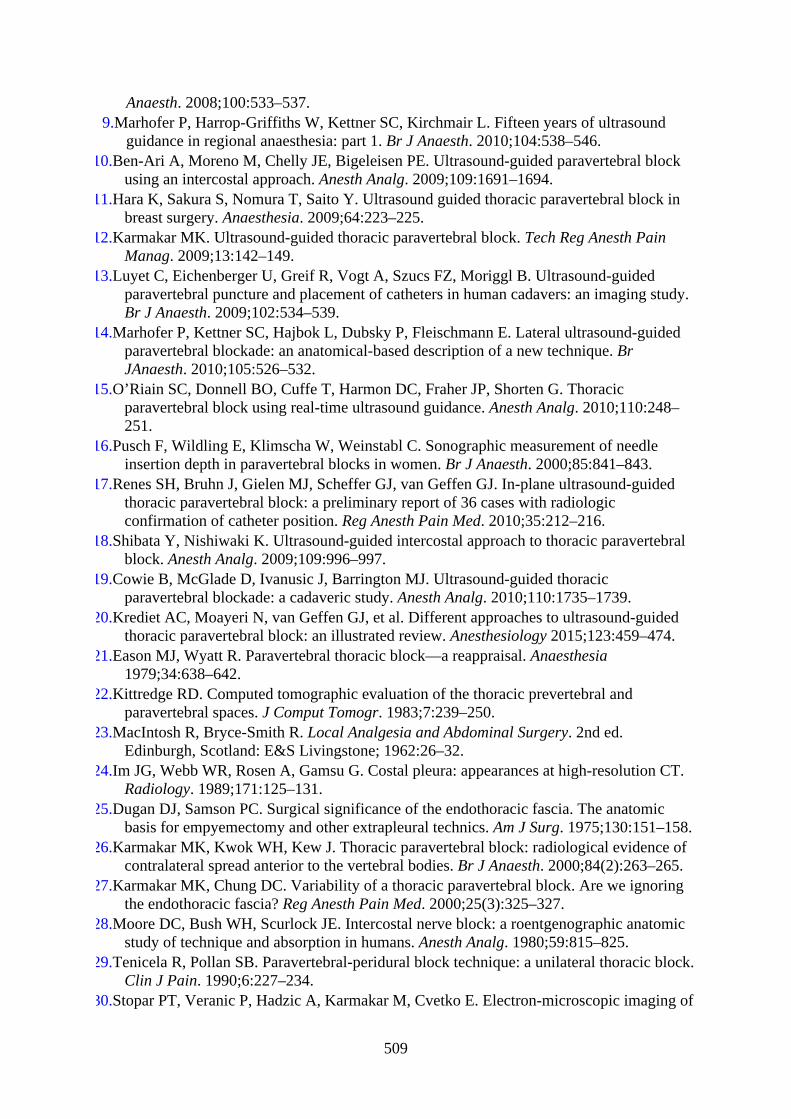
Anaesth. 2008;100:533–537.9.Marhofer P, Harrop-Griffiths W, Kettner SC, Kirchmair L. Fifteen years of ultrasound
guidance in regional anaesthesia: part 1. Br J Anaesth. 2010;104:538–546.10.Ben-Ari A, Moreno M, Chelly JE, Bigeleisen PE. Ultrasound-guided paravertebral block
using an intercostal approach. Anesth Analg. 2009;109:1691–1694.11.Hara K, Sakura S, Nomura T, Saito Y. Ultrasound guided thoracic paravertebral block in
breast surgery. Anaesthesia. 2009;64:223–225.12.Karmakar MK. Ultrasound-guided thoracic paravertebral block. Tech Reg Anesth Pain
Manag. 2009;13:142–149.13.Luyet C, Eichenberger U, Greif R, Vogt A, Szucs FZ, Moriggl B. Ultrasound-guided
paravertebral puncture and placement of catheters in human cadavers: an imaging study.Br J Anaesth. 2009;102:534–539.
14.Marhofer P, Kettner SC, Hajbok L, Dubsky P, Fleischmann E. Lateral ultrasound-guidedparavertebral blockade: an anatomical-based description of a new technique. BrJAnaesth. 2010;105:526–532.
15.O’Riain SC, Donnell BO, Cuffe T, Harmon DC, Fraher JP, Shorten G. Thoracicparavertebral block using real-time ultrasound guidance. Anesth Analg. 2010;110:248–251.
16.Pusch F, Wildling E, Klimscha W, Weinstabl C. Sonographic measurement of needleinsertion depth in paravertebral blocks in women. Br J Anaesth. 2000;85:841–843.
17.Renes SH, Bruhn J, Gielen MJ, Scheffer GJ, van Geffen GJ. In-plane ultrasound-guidedthoracic paravertebral block: a preliminary report of 36 cases with radiologicconfirmation of catheter position. Reg Anesth Pain Med. 2010;35:212–216.
18.Shibata Y, Nishiwaki K. Ultrasound-guided intercostal approach to thoracic paravertebralblock. Anesth Analg. 2009;109:996–997.
19.Cowie B, McGlade D, Ivanusic J, Barrington MJ. Ultrasound-guided thoracicparavertebral blockade: a cadaveric study. Anesth Analg. 2010;110:1735–1739.
20.Krediet AC, Moayeri N, van Geffen GJ, et al. Different approaches to ultrasound-guidedthoracic paravertebral block: an illustrated review. Anesthesiology 2015;123:459–474.
21.Eason MJ, Wyatt R. Paravertebral thoracic block—a reappraisal. Anaesthesia1979;34:638–642.
22.Kittredge RD. Computed tomographic evaluation of the thoracic prevertebral andparavertebral spaces. J Comput Tomogr. 1983;7:239–250.
23.MacIntosh R, Bryce-Smith R. Local Analgesia and Abdominal Surgery. 2nd ed.Edinburgh, Scotland: E&S Livingstone; 1962:26–32.
24.Im JG, Webb WR, Rosen A, Gamsu G. Costal pleura: appearances at high-resolution CT.Radiology. 1989;171:125–131.
25.Dugan DJ, Samson PC. Surgical significance of the endothoracic fascia. The anatomicbasis for empyemectomy and other extrapleural technics. Am J Surg. 1975;130:151–158.
26.Karmakar MK, Kwok WH, Kew J. Thoracic paravertebral block: radiological evidence ofcontralateral spread anterior to the vertebral bodies. Br J Anaesth. 2000;84(2):263–265.
27.Karmakar MK, Chung DC. Variability of a thoracic paravertebral block. Are we ignoringthe endothoracic fascia? Reg Anesth Pain Med. 2000;25(3):325–327.
28.Moore DC, Bush WH, Scurlock JE. Intercostal nerve block: a roentgenographic anatomicstudy of technique and absorption in humans. Anesth Analg. 1980;59:815–825.
29.Tenicela R, Pollan SB. Paravertebral-peridural block technique: a unilateral thoracic block.Clin J Pain. 1990;6:227–234.
30.Stopar PT, Veranic P, Hadzic A, Karmakar M, Cvetko E. Electron-microscopic imaging of
509

endothoracic fascia in the thoracic paravertebral space in rats. Reg Anesth Pain Med.2012;37:215–218.
31.Nunn JF, Slavin G. Posterior intercostal nerve block for pain relief after cholecystectomy.Anatomical basis and efficacy. Br J Anaesth. 1980;52:253–260.
32.Moore DC. Intercostal nerve block: spread of india ink injected to the rib’s costal groove.Br J Anaesth. 1981;53:325–329.
33.Pernkopf E. Thorax, abdomen and extremities. In: Baltimore FH, ed. Atlas ofTopographical and Applied Human Anatomy. 2nd ed. Urban and Schwarzenberg;1980:127–129.
34.Conacher ID, Kokri M. Postoperative paravertebral blocks for thoracic surgery. Aradiological appraisal. Br J Anaesth. 1987;59:155–161.
35.Conacher ID. Resin injection of thoracic paravertebral spaces. Br J Anaesth. 1988;61:657–661.
36.Purcell-Jones G, Pither CE, Justins DM. Paravertebral somatic nerve block: a clinical,radiographic, and computed tomographic study in chronic pain patients. Anesth Analg.1989;68:32–39.
37.Mowbray A, Wong KK, Murray JM. Intercostal catheterisation. An alternative approach tothe paravertebral space. Anaesthesia. 1987;42:958–961.
38.Murphy DF. Continuous intercostal nerve blockade. An anatomical study to elucidate itsmode of action. Br J Anaesth. 1984;56:627–630.
39.Karmakar MK, Critchley LA, Ho AM, Gin T, Lee TW, Yim AP. Continuous thoracicparavertebral infusion of bupivacaine for pain management in patients with multiplefractured ribs. Chest. 2003;123:424–431.
40.Pusch F, Freitag H, Weinstabl C, Obwegeser R, Huber E, Wildling E. Single-injectionparavertebral block compared to general anaesthesia in breast surgery. Acta AnaesthesiolScand. 1999;43:770–774.
41.Lönnqvist PA, Hildingsson U. The caudal boundary of the thoracic paravertebral space. Astudy in human cadavers. Anaesthesia. 1992;47:1051–1052.
42.Richardson J, Jones J, Atkinson R. The effect of thoracic paravertebral blockade onintercostal somatosensory evoked potentials. Anesth Analg. 1998;87:373–376.
43.Saito T, Den S, Tanuma K, Tanuma Y, Carney E, Carlsson C. Anatomical bases forparavertebral anesthetic block: fluid communication between the thoracic and lumbarparavertebral regions. Surg Radiol Anat. 1999;21:359–363.
44.Karmakar MK, Gin T, Ho AM. Ipsilateral thoraco-lumbar anaesthesia and paravertebralspread after low thoracic paravertebral injection. Br J Anaesth. 2001;87:312–316.
45.Lichtenstein DA, Menu Y. A bedside ultrasound sign ruling out pneumothorax in thecritically ill. Lung sliding. Chest. 1995;108:1345–1348.
46.Karmakar MK, Li X, Li J, Hadzic A. Volumetric three-dimensional ultrasound imaging ofthe anatomy relevant for thoracic paravertebral block. Anesth Analg. 2012;115(5): 1246–1250.
47.Foxall GL, Hardman JG, Bedforth NM. Three-dimensional, multiplanar, ultrasound-guided, radial nerve block. Reg Anesth Pain Med. 2007;32:516–521.
510
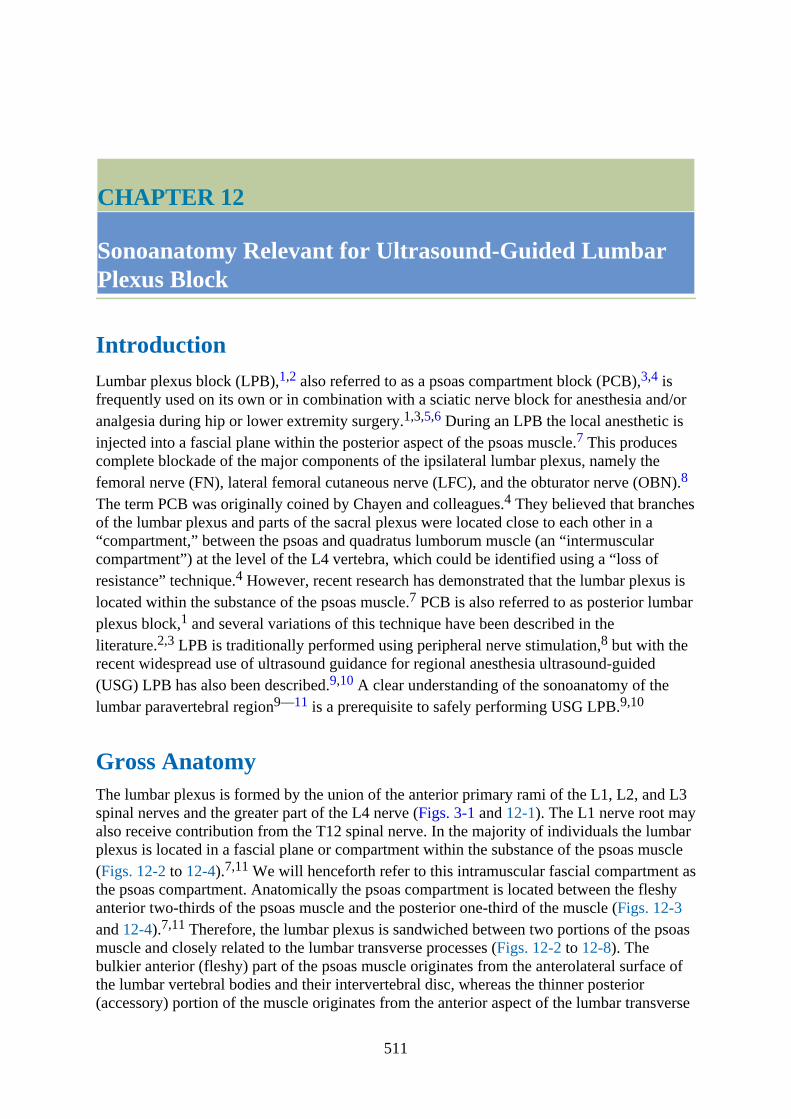
CHAPTER 12
Sonoanatomy Relevant for Ultrasound-Guided LumbarPlexus Block
IntroductionLumbar plexus block (LPB),1,2 also referred to as a psoas compartment block (PCB),3,4 isfrequently used on its own or in combination with a sciatic nerve block for anesthesia and/oranalgesia during hip or lower extremity surgery.1,3,5,6 During an LPB the local anesthetic isinjected into a fascial plane within the posterior aspect of the psoas muscle.7 This producescomplete blockade of the major components of the ipsilateral lumbar plexus, namely thefemoral nerve (FN), lateral femoral cutaneous nerve (LFC), and the obturator nerve (OBN).8
The term PCB was originally coined by Chayen and colleagues.4 They believed that branchesof the lumbar plexus and parts of the sacral plexus were located close to each other in a“compartment,” between the psoas and quadratus lumborum muscle (an “intermuscularcompartment”) at the level of the L4 vertebra, which could be identified using a “loss ofresistance” technique.4 However, recent research has demonstrated that the lumbar plexus islocated within the substance of the psoas muscle.7 PCB is also referred to as posterior lumbarplexus block,1 and several variations of this technique have been described in theliterature.2,3 LPB is traditionally performed using peripheral nerve stimulation,8 but with therecent widespread use of ultrasound guidance for regional anesthesia ultrasound-guided(USG) LPB has also been described.9,10 A clear understanding of the sonoanatomy of thelumbar paravertebral region9––11 is a prerequisite to safely performing USG LPB.9,10
Gross AnatomyThe lumbar plexus is formed by the union of the anterior primary rami of the L1, L2, and L3spinal nerves and the greater part of the L4 nerve (Figs. 3-1 and 12-1). The L1 nerve root mayalso receive contribution from the T12 spinal nerve. In the majority of individuals the lumbarplexus is located in a fascial plane or compartment within the substance of the psoas muscle(Figs. 12-2 to 12-4).7,11 We will henceforth refer to this intramuscular fascial compartment asthe psoas compartment. Anatomically the psoas compartment is located between the fleshyanterior two-thirds of the psoas muscle and the posterior one-third of the muscle (Figs. 12-3and 12-4).7,11 Therefore, the lumbar plexus is sandwiched between two portions of the psoasmuscle and closely related to the lumbar transverse processes (Figs. 12-2 to 12-8). Thebulkier anterior (fleshy) part of the psoas muscle originates from the anterolateral surface ofthe lumbar vertebral bodies and their intervertebral disc, whereas the thinner posterior(accessory) portion of the muscle originates from the anterior aspect of the lumbar transverse
511
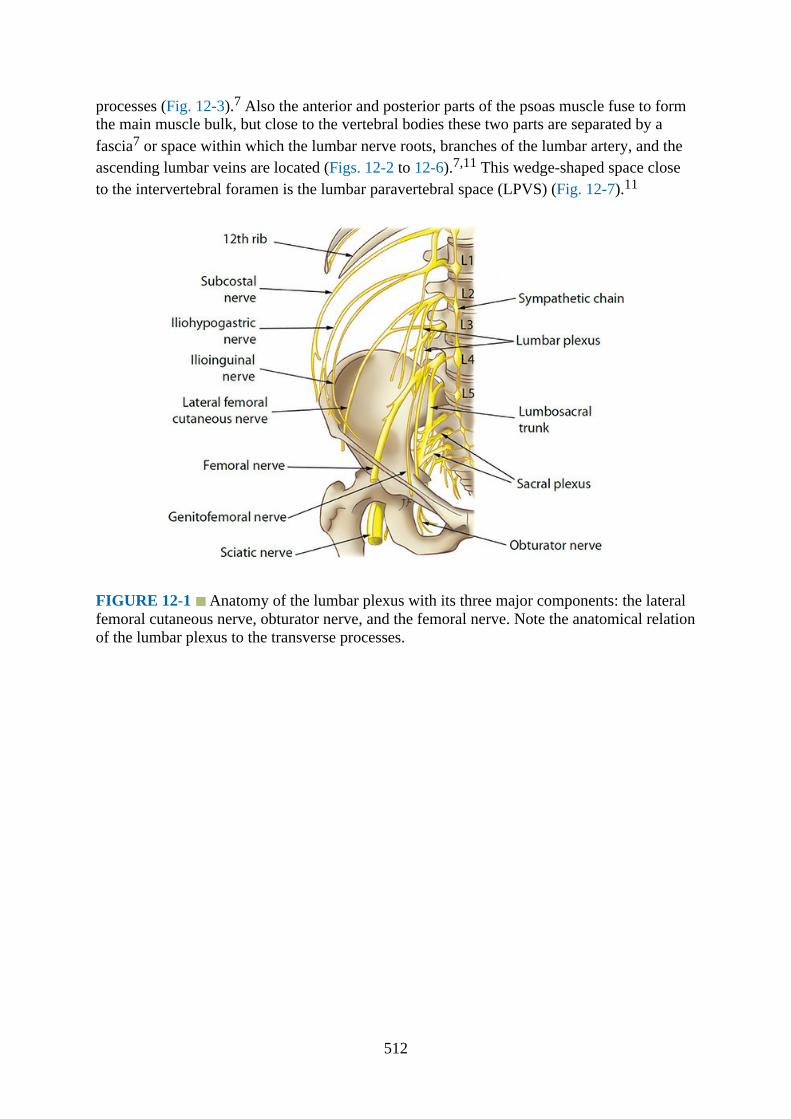
processes (Fig. 12-3).7 Also the anterior and posterior parts of the psoas muscle fuse to formthe main muscle bulk, but close to the vertebral bodies these two parts are separated by afascia7 or space within which the lumbar nerve roots, branches of the lumbar artery, and theascending lumbar veins are located (Figs. 12-2 to 12-6).7,11 This wedge-shaped space closeto the intervertebral foramen is the lumbar paravertebral space (LPVS) (Fig. 12-7).11
FIGURE 12-1 Anatomy of the lumbar plexus with its three major components: the lateralfemoral cutaneous nerve, obturator nerve, and the femoral nerve. Note the anatomical relationof the lumbar plexus to the transverse processes.
512

FIGURE 12-2 Figure showing the anatomical relation of the lumbar plexus to the psoasmuscle and how the nerves of the lumbar plexus (iliohypogastric, ilioinguinal, lateral femoralcutaneous, femoral, and obturator) emerge from the psoas muscle.
FIGURE 12-3 Location of the lumbar nerve root within the substance of the psoas muscleand their relation to the transverse process.
513

FIGURE 12-4 Transverse anatomy of the lumbar paravertebral region at the L4 vertebrallevel. Note the origin and branching of the lumbar artery. Ao, aorta; IVC, inferior vena cava;RPS, retroperitoneal space; EOM, external oblique muscle; IOM, internal oblique muscle;TAM, transversus abdominis muscle; PM, psoas muscle; QLM, quadratus lumborum muscle;IVF, intervertebral foramen; DBLA, dorsal branch of lumbar artery; LPVS, lumbarparavertebral space; NR, nerve root; PC, psoas compartment; LPlx, lumbar plexus; VB,vertebral body; AP, articular process; ESM, erector spinae muscle.
FIGURE 12-5 Cadaver dissection image showing the lumbar plexus nerves within thesubstance of the psoas muscle. The psoas muscle has been split longitudinally to expose thelumbar plexus nerves within the posterior aspect of the muscle.
514
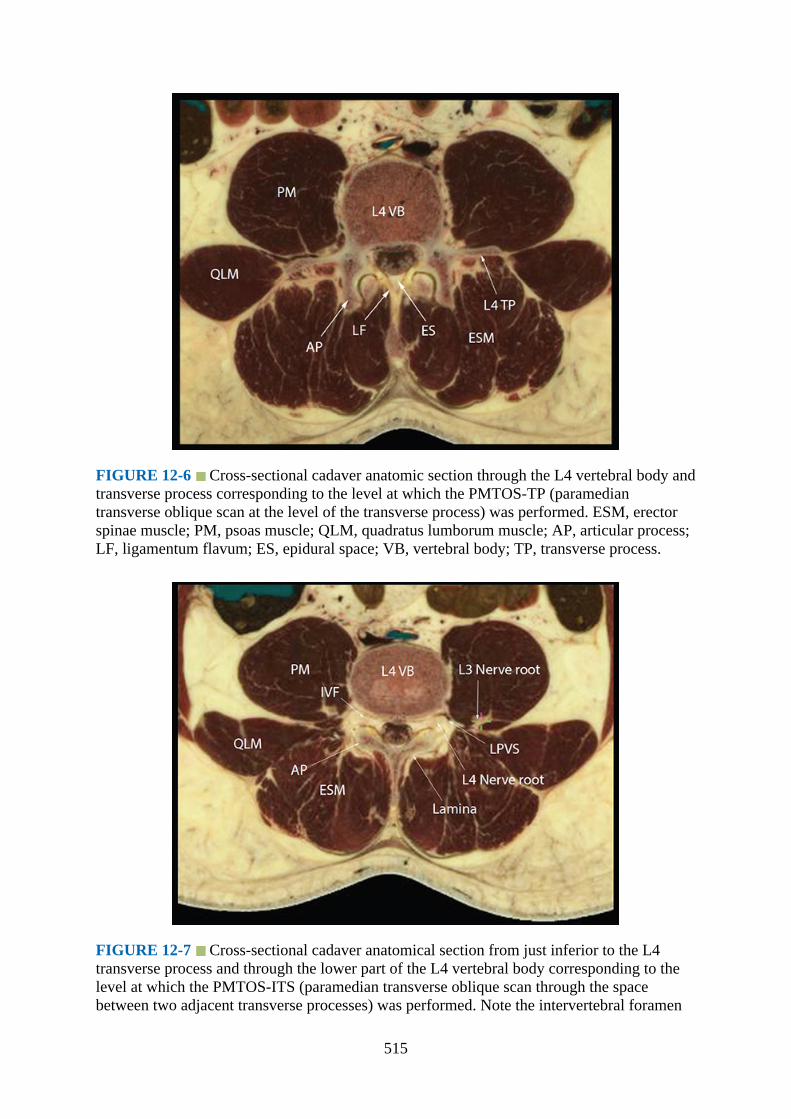
FIGURE 12-6 Cross-sectional cadaver anatomic section through the L4 vertebral body andtransverse process corresponding to the level at which the PMTOS-TP (paramediantransverse oblique scan at the level of the transverse process) was performed. ESM, erectorspinae muscle; PM, psoas muscle; QLM, quadratus lumborum muscle; AP, articular process;LF, ligamentum flavum; ES, epidural space; VB, vertebral body; TP, transverse process.
FIGURE 12-7 Cross-sectional cadaver anatomical section from just inferior to the L4transverse process and through the lower part of the L4 vertebral body corresponding to thelevel at which the PMTOS-ITS (paramedian transverse oblique scan through the spacebetween two adjacent transverse processes) was performed. Note the intervertebral foramen
515
(IVF) and the L4 spinal nerve root as it exits the IVF to enter the lumbar paravertebral space(LPVS). Also note the relation of the L3 nerve of the lumbar plexus to the L4 nerve rootclose to the L4 IVF. This is because the L3 lumbar nerve root after it exits the IVF takes asteep caudal course through the posterior part of the psoas muscle. PM, psoas muscle; QLM,quadratus lumborum muscle; IVF, intervertebral foramen; AP, articular process; LPVS,lumbar paravertebral space; ESM, erector spinae muscle; VB, vertebral body.
FIGURE 12-8 Sagittal cadaver anatomic section showing the relation of the lumbar plexusto the transverse process (TP) and the psoas muscle (PM). The reference marker of the Javaapplication, seen in this figure as a green cross-hair, is over the L3 nerve of the lumbar plexus(same as in Fig. 8-7). The L3 nerve of the lumbar plexus is seen in a fat-filled “intramuscularcompartment,” that is, the psoas compartment between the thick fleshy anterior and a thinposterior part of the psoas muscle between the L3 and L4 TP. ESM, erector spinae muscle.
The lumbar nerve root after it exits the intervertebral foramen enters the fat-filled LPVS(Fig. 12-7). However, the lumbar nerve root, instead of entering the psoas muscle at the samevertebral level, takes a steep caudal course and enters the substance of the psoas muscle at thevertebral level below (Fig. 12-9). This explains why the L3 nerve of the lumbar plexus liesopposite the L4 intervertebral foramen and the L4 nerve root (Fig. 12-7). Also as seen in thesagittal anatomic section (Fig. 12-8), the L3 nerve of the lumbar plexus is located in anintramuscular compartment (ie, the psoas compartment) between the thick fleshy anterior anda thin posterior part of the psoas muscle. Outlines of the psoas compartment with the lumbarplexus can also be delineated in the transverse anatomic section (Fig. 12-7). Once the plexusis formed it displays a triangular shape, narrow in its superior portion and wider in its lowerportion (Fig. 12-1). The nerves that originate from the plexus also exhibit a fanned-out
516
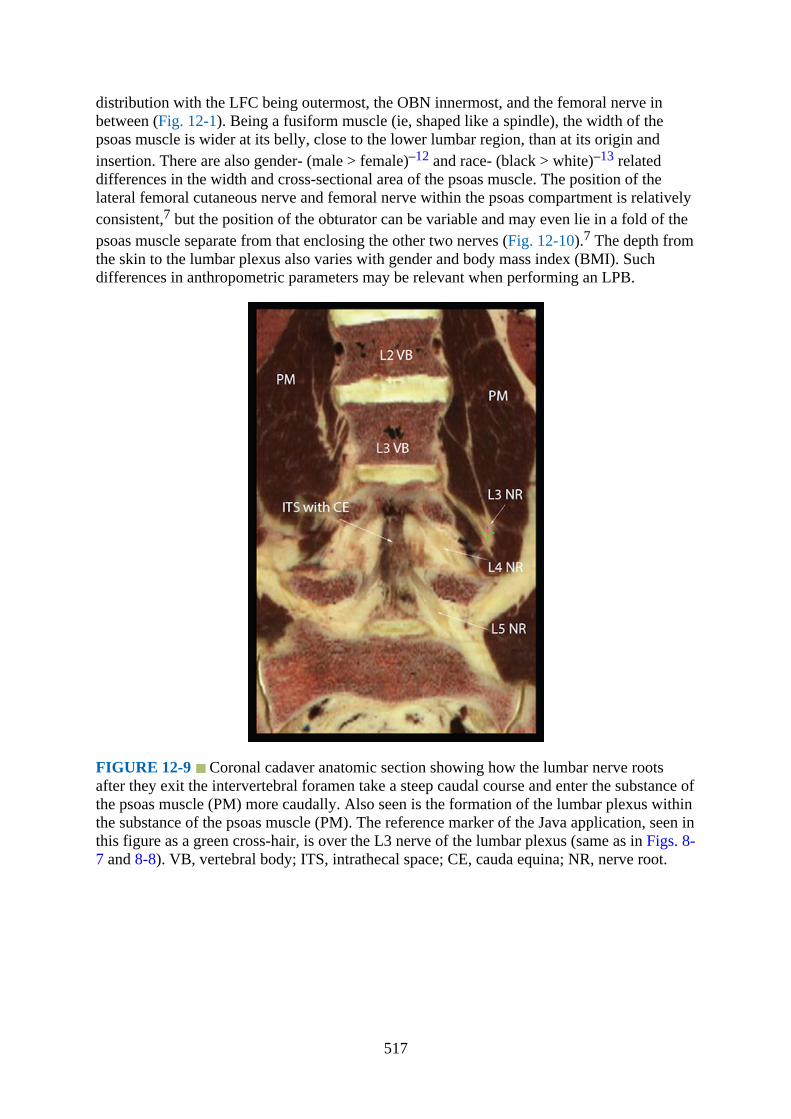
distribution with the LFC being outermost, the OBN innermost, and the femoral nerve inbetween (Fig. 12-1). Being a fusiform muscle (ie, shaped like a spindle), the width of thepsoas muscle is wider at its belly, close to the lower lumbar region, than at its origin andinsertion. There are also gender- (male > female)–12 and race- (black > white)–13 relateddifferences in the width and cross-sectional area of the psoas muscle. The position of thelateral femoral cutaneous nerve and femoral nerve within the psoas compartment is relativelyconsistent,7 but the position of the obturator can be variable and may even lie in a fold of thepsoas muscle separate from that enclosing the other two nerves (Fig. 12-10).7 The depth fromthe skin to the lumbar plexus also varies with gender and body mass index (BMI). Suchdifferences in anthropometric parameters may be relevant when performing an LPB.
FIGURE 12-9 Coronal cadaver anatomic section showing how the lumbar nerve rootsafter they exit the intervertebral foramen take a steep caudal course and enter the substance ofthe psoas muscle (PM) more caudally. Also seen is the formation of the lumbar plexus withinthe substance of the psoas muscle (PM). The reference marker of the Java application, seen inthis figure as a green cross-hair, is over the L3 nerve of the lumbar plexus (same as in Figs. 8-7 and 8-8). VB, vertebral body; ITS, intrathecal space; CE, cauda equina; NR, nerve root.
517

FIGURE 12-10 Figure showing the position of the (1) lateral femoral cutaneous nerve, (2)femoral nerve, and (3) obturator nerve in the psoas compartment. Note that whereas theposition of 1 and 2 are fairly consistent, the position of 3 can vary and may even lie in aseparate intramuscular fold (C) or compartment separate from the psoas compartment (D).
Computed Tomography Anatomy of the Lumbar Paravertebral Region
Figs. 12-11 and 12-12
FIGURE 12-11 Transverse CT of the abdomen at the level of the body and transverseprocess of the L4 vertebra corresponding to the level at which the PMTOS-TP (paramediantransverse oblique scan at the level of the transverse process) is performed. Note the positionof the inferior vena cava and the aorta relative to the vertebral body. VB, vertebral body.
518
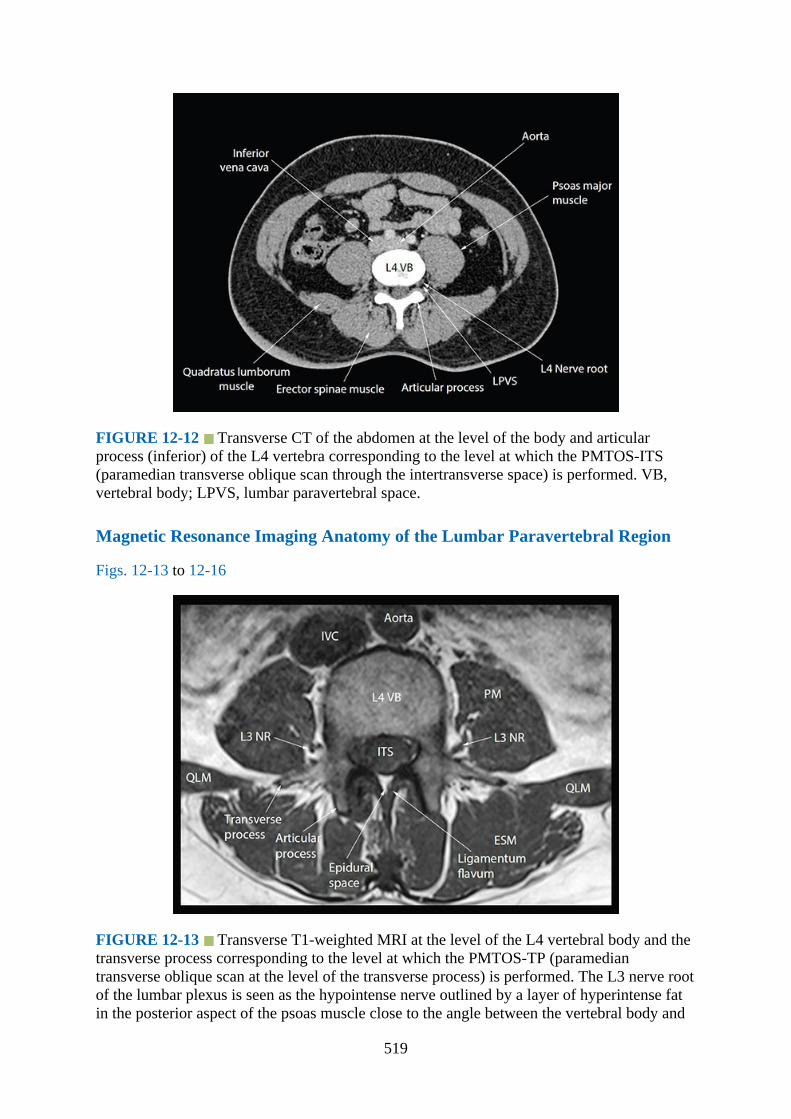
FIGURE 12-12 Transverse CT of the abdomen at the level of the body and articularprocess (inferior) of the L4 vertebra corresponding to the level at which the PMTOS-ITS(paramedian transverse oblique scan through the intertransverse space) is performed. VB,vertebral body; LPVS, lumbar paravertebral space.
Magnetic Resonance Imaging Anatomy of the Lumbar Paravertebral Region
Figs. 12-13 to 12-16
FIGURE 12-13 Transverse T1-weighted MRI at the level of the L4 vertebral body and thetransverse process corresponding to the level at which the PMTOS-TP (paramediantransverse oblique scan at the level of the transverse process) is performed. The L3 nerve rootof the lumbar plexus is seen as the hypointense nerve outlined by a layer of hyperintense fatin the posterior aspect of the psoas muscle close to the angle between the vertebral body and
519
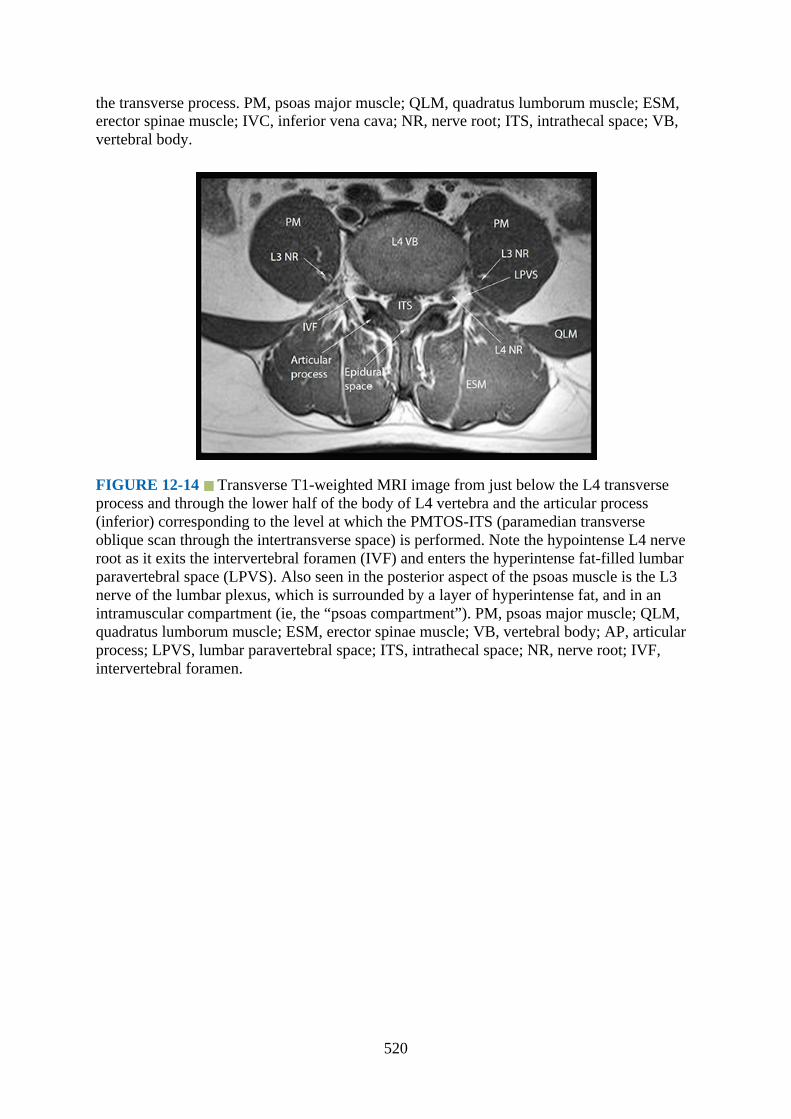
the transverse process. PM, psoas major muscle; QLM, quadratus lumborum muscle; ESM,erector spinae muscle; IVC, inferior vena cava; NR, nerve root; ITS, intrathecal space; VB,vertebral body.
FIGURE 12-14 Transverse T1-weighted MRI image from just below the L4 transverseprocess and through the lower half of the body of L4 vertebra and the articular process(inferior) corresponding to the level at which the PMTOS-ITS (paramedian transverseoblique scan through the intertransverse space) is performed. Note the hypointense L4 nerveroot as it exits the intervertebral foramen (IVF) and enters the hyperintense fat-filled lumbarparavertebral space (LPVS). Also seen in the posterior aspect of the psoas muscle is the L3nerve of the lumbar plexus, which is surrounded by a layer of hyperintense fat, and in anintramuscular compartment (ie, the “psoas compartment”). PM, psoas major muscle; QLM,quadratus lumborum muscle; ESM, erector spinae muscle; VB, vertebral body; AP, articularprocess; LPVS, lumbar paravertebral space; ITS, intrathecal space; NR, nerve root; IVF,intervertebral foramen.
520
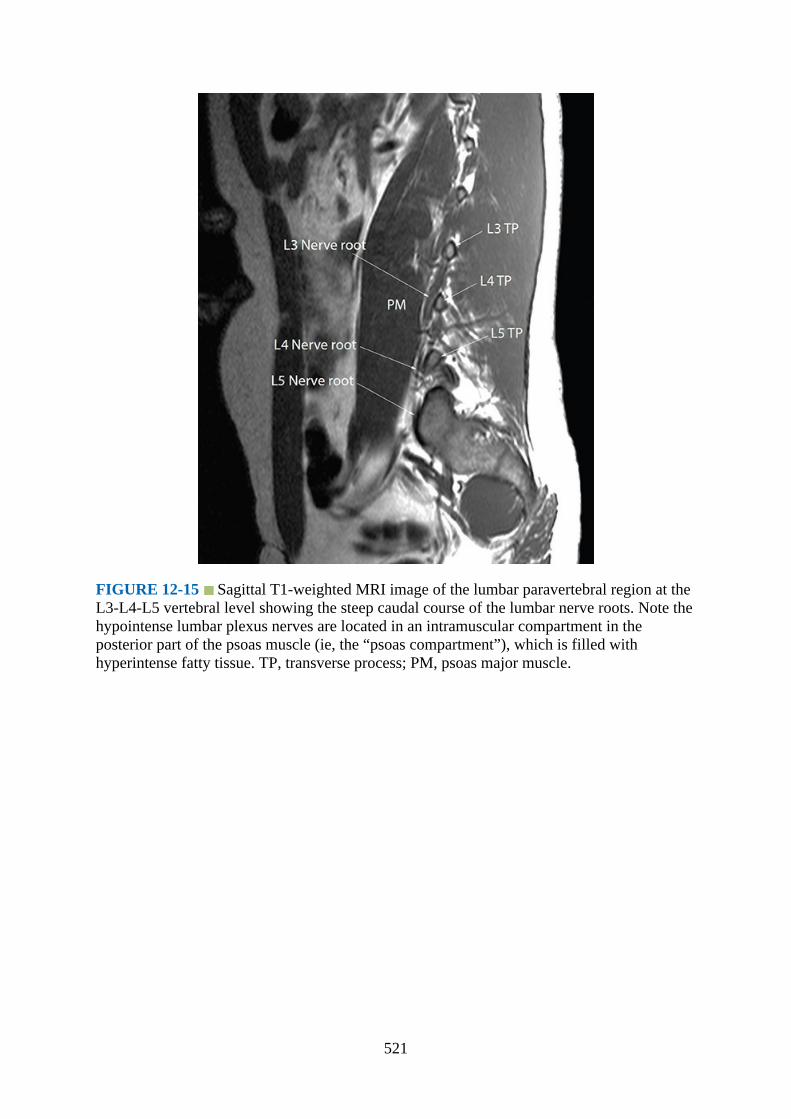
FIGURE 12-15 Sagittal T1-weighted MRI image of the lumbar paravertebral region at theL3-L4-L5 vertebral level showing the steep caudal course of the lumbar nerve roots. Note thehypointense lumbar plexus nerves are located in an intramuscular compartment in theposterior part of the psoas muscle (ie, the “psoas compartment”), which is filled withhyperintense fatty tissue. TP, transverse process; PM, psoas major muscle.
521
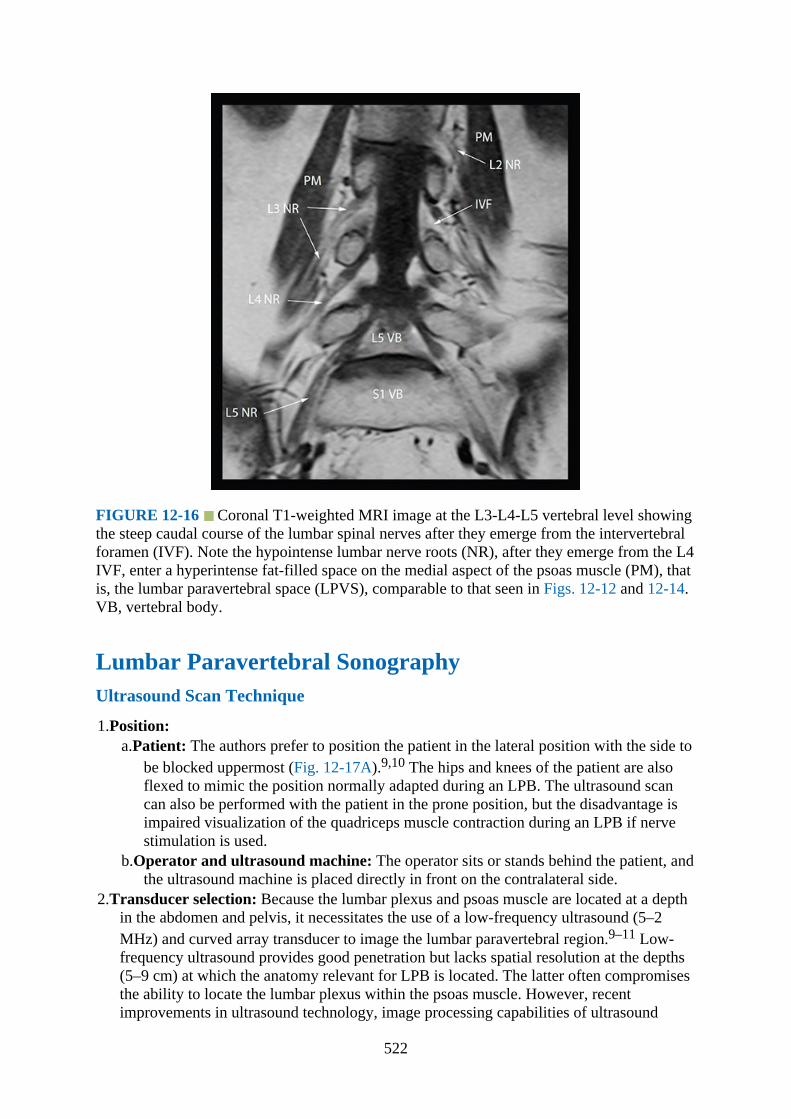
FIGURE 12-16 Coronal T1-weighted MRI image at the L3-L4-L5 vertebral level showingthe steep caudal course of the lumbar spinal nerves after they emerge from the intervertebralforamen (IVF). Note the hypointense lumbar nerve roots (NR), after they emerge from the L4IVF, enter a hyperintense fat-filled space on the medial aspect of the psoas muscle (PM), thatis, the lumbar paravertebral space (LPVS), comparable to that seen in Figs. 12-12 and 12-14.VB, vertebral body.
Lumbar Paravertebral SonographyUltrasound Scan Technique
1.Position:a.Patient: The authors prefer to position the patient in the lateral position with the side to
be blocked uppermost (Fig. 12-17A).9,10 The hips and knees of the patient are alsoflexed to mimic the position normally adapted during an LPB. The ultrasound scancan also be performed with the patient in the prone position, but the disadvantage isimpaired visualization of the quadriceps muscle contraction during an LPB if nervestimulation is used.
b.Operator and ultrasound machine: The operator sits or stands behind the patient, andthe ultrasound machine is placed directly in front on the contralateral side.
2.Transducer selection: Because the lumbar plexus and psoas muscle are located at a depthin the abdomen and pelvis, it necessitates the use of a low-frequency ultrasound (5–2MHz) and curved array transducer to image the lumbar paravertebral region.9–11 Low-frequency ultrasound provides good penetration but lacks spatial resolution at the depths(5–9 cm) at which the anatomy relevant for LPB is located. The latter often compromisesthe ability to locate the lumbar plexus within the psoas muscle. However, recentimprovements in ultrasound technology, image processing capabilities of ultrasound
522

machines, the availability of compound imaging and tissue harmonic imaging (THI), andthe use of new scan protocols have significantly improved our ability to image the lumbarparavertebral region. Today, we are not only able to accurately delineate the lumbarplexus, but also the adjoining paravertebral anatomy.9–11
FIGURE 12-17 Position of the volunteer (Fig. 12-17A) and the plane of ultrasoundimaging during a sagittal and transverse scan of the lumbar paravertebral region. A picture ofthe ultrasound transducer and the plane of the ultrasound beam (green pane) has beensuperimposed onto the transverse cadaver anatomic sections to illustrate how the ultrasoundbeam was insonated during the sagittal (Fig. 12-17B), PMTOS-TP (paramedian transverseoblique scan at the level of the transverse process, Fig. 12-17C), and PMTOS-ITS(paramedian transverse oblique scan through the intertransverse space, Fig. 12-17D). A –midline, B – intercristal line, C – sagittal scan line, X – a point 4 cm from the midline alongthe intercristal line.
3.Scan technique: An ultrasound scan of the lumbar paravertebral region for USG LPB canbe performed in the sagittal (Fig. 12-17B)9,–14 or transverse (Figs. 12-15C and 12-15D)10,11,14 axis. The following anatomical landmarks are identified and marked on theskin of the nondependent side of the back using a skin marking pen: posterior superioriliac spine, iliac crest, lumbar spinous processes (midline, line A, Fig. 12-17A) and theintercristal line (line B, Fig. 12-17A). Thereafter a line (line C) parallel to the midline andwhich intersects the intercristal line (line B) at a point 4 cm lateral to the midline,corresponding to the point of needle insertion during a landmark-based LPB, is alsomarked (sagittal scan line) (Fig. 12-17A). The target vertebral level for the ultrasoundscan (L3-L4-L5) is then identified as previously described.–15,–16 This involvesvisualizing the lumbosacral junction (L5–S1 gap) on a sagittal sonogram and thencounting cranially to locate the lamina and transverse processes of the L3, L4, and L5vertebrae. For a sagittal scan, the ultrasound transducer is positioned over the sagittal scanline (Fig. 12-18) with its orientation marker directed cranially. For a transverse scan theultrasound transducer, with its orientation marker directed laterally, is positioned 4 cm
523
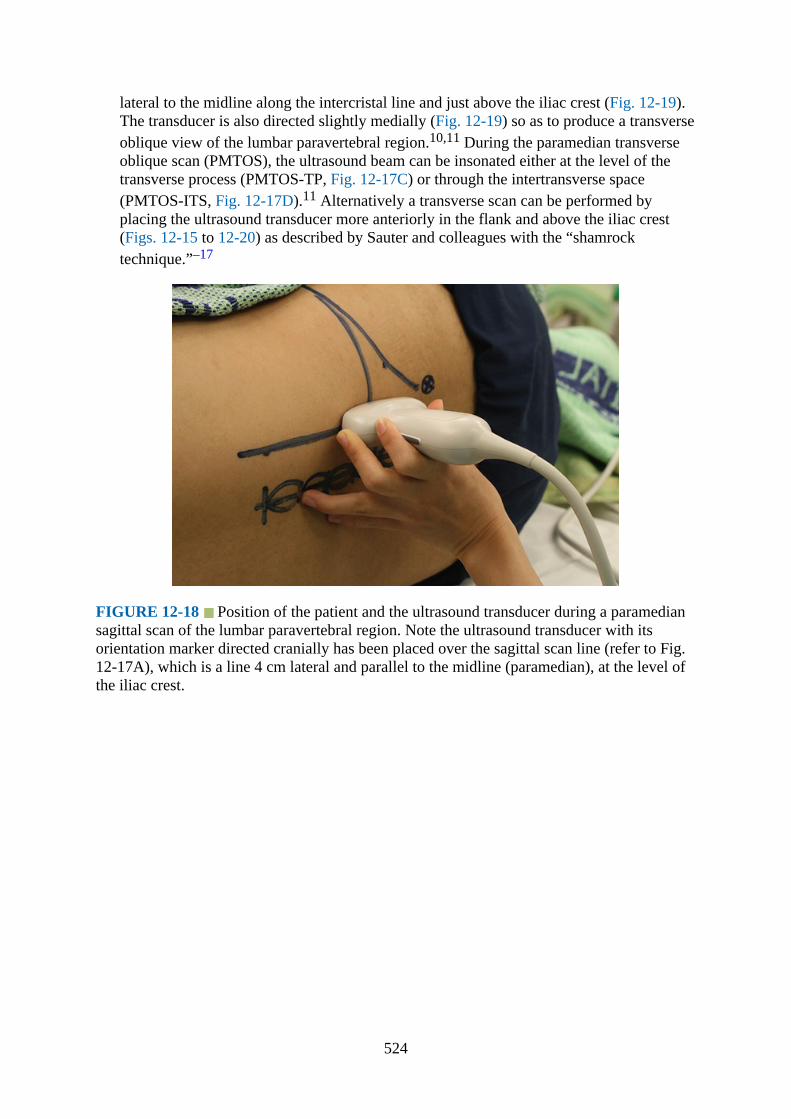
lateral to the midline along the intercristal line and just above the iliac crest (Fig. 12-19).The transducer is also directed slightly medially (Fig. 12-19) so as to produce a transverseoblique view of the lumbar paravertebral region.10,11 During the paramedian transverseoblique scan (PMTOS), the ultrasound beam can be insonated either at the level of thetransverse process (PMTOS-TP, Fig. 12-17C) or through the intertransverse space(PMTOS-ITS, Fig. 12-17D).11 Alternatively a transverse scan can be performed byplacing the ultrasound transducer more anteriorly in the flank and above the iliac crest(Figs. 12-15 to 12-20) as described by Sauter and colleagues with the “shamrocktechnique.”–17
FIGURE 12-18 Position of the patient and the ultrasound transducer during a paramediansagittal scan of the lumbar paravertebral region. Note the ultrasound transducer with itsorientation marker directed cranially has been placed over the sagittal scan line (refer to Fig.12-17A), which is a line 4 cm lateral and parallel to the midline (paramedian), at the level ofthe iliac crest.
524

FIGURE 12-19 Position of the patient and the ultrasound transducer during a paramediantransverse oblique scan of the lumbar paravertebral region. The ultrasound transducer hasbeen placed lateral to the sagittal scan line and over the intercristal line with its orientationmarker directed laterally (outward). Also note how the transducer is angled medially for theultrasound scan.
FIGURE 12-20 The shamrock method of ultrasound imaging of the lumbar paravertebralregion for lumbar plexus block. (A) Position of the patient and the ultrasound transducer. (B)The plane of ultrasound imaging during the shamrock method. A picture of the ultrasoundtransducer and the plane of the ultrasound beam (green pane) have been superimposed ontothe transverse cadaver anatomic section of the lumbar region to illustrate how the ultrasound
525

beam is insonated during the scan.
4.Sonoanatomy:a.Sagittal sonoanatomy:
On a sagittal sonogram the transverse processes of the lumbar vertebrae (L3-L4-L5)are identified by their hyperechoic reflection and their corresponding acoustic shadowanteriorly (Fig. 12-21).9 This produces a sonographic pattern that we refer to as thelumbar ultrasound trident or the “trident sign”9 because of its similarity to the trident(Latin for tridens or tridentis) that is often associated with Poseidon (the god of the seain Greek mythology) and the Trishula of the Hindu god Shiva. However one must bearin mind that because the L5 transverse process is the shortest of the lumbar transverseprocesses, it may be more difficult to locate and may require some degree of medialorientation of the transducer until the ultrasound trident is visible. The psoas muscle isseen in the acoustic window of the lumbar ultrasound trident (Fig. 12-21) as multiplelongitudinal hyperechoic striations against a hypoechoic background typical of muscle(Fig. 12-22).9 The lumbar plexus may also be visualized in the posterior aspect of thepsoas muscle (Fig. 12-22).9 It appears hyperechoic (Fig. 12-22), is sonographicallydistinct from the muscle fibers, and is more posterior in location than theintramuscular tendons of the psoas muscle.9 The lumbar plexus nerves are also thickerthan the muscle fibers (Fig. 12-22) and take an oblique course through the psoasmuscle.9 A laterally positioned ultrasound transducer will produce a suboptimal viewwithout the ultrasound trident, but may visualize the lower pole of the kidney, whichlies anterior to the quadratus lumborum muscle (QLM), and can reach the L3 to L4vertebral level in some individuals.
FIGURE 12-22 Sagittal sonogram of the lumbar paravertebral region showing the lumbarplexus as a hyperechoic structure in the posterior aspect of the psoas muscle (PM) betweenthe L4 and L5 transverse processes. Also note the hyperechoic intramuscular tendons withinthe substance of the psoas muscle. ESM, erector spinae muscle; IM, intramuscular.
526
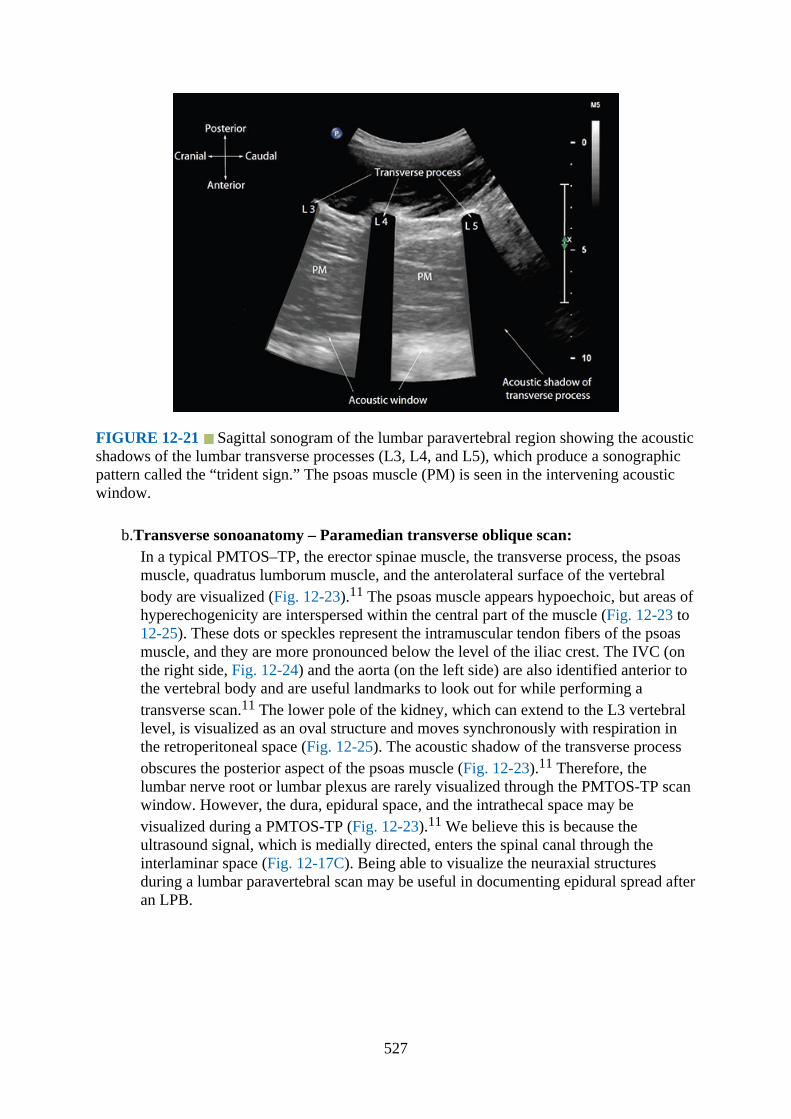
FIGURE 12-21 Sagittal sonogram of the lumbar paravertebral region showing the acousticshadows of the lumbar transverse processes (L3, L4, and L5), which produce a sonographicpattern called the “trident sign.” The psoas muscle (PM) is seen in the intervening acousticwindow.
b.Transverse sonoanatomy – Paramedian transverse oblique scan:In a typical PMTOS–TP, the erector spinae muscle, the transverse process, the psoasmuscle, quadratus lumborum muscle, and the anterolateral surface of the vertebralbody are visualized (Fig. 12-23).11 The psoas muscle appears hypoechoic, but areas ofhyperechogenicity are interspersed within the central part of the muscle (Fig. 12-23 to12-25). These dots or speckles represent the intramuscular tendon fibers of the psoasmuscle, and they are more pronounced below the level of the iliac crest. The IVC (onthe right side, Fig. 12-24) and the aorta (on the left side) are also identified anterior tothe vertebral body and are useful landmarks to look out for while performing atransverse scan.11 The lower pole of the kidney, which can extend to the L3 vertebrallevel, is visualized as an oval structure and moves synchronously with respiration inthe retroperitoneal space (Fig. 12-25). The acoustic shadow of the transverse processobscures the posterior aspect of the psoas muscle (Fig. 12-23).11 Therefore, thelumbar nerve root or lumbar plexus are rarely visualized through the PMTOS-TP scanwindow. However, the dura, epidural space, and the intrathecal space may bevisualized during a PMTOS-TP (Fig. 12-23).11 We believe this is because theultrasound signal, which is medially directed, enters the spinal canal through theinterlaminar space (Fig. 12-17C). Being able to visualize the neuraxial structuresduring a lumbar paravertebral scan may be useful in documenting epidural spread afteran LPB.
527
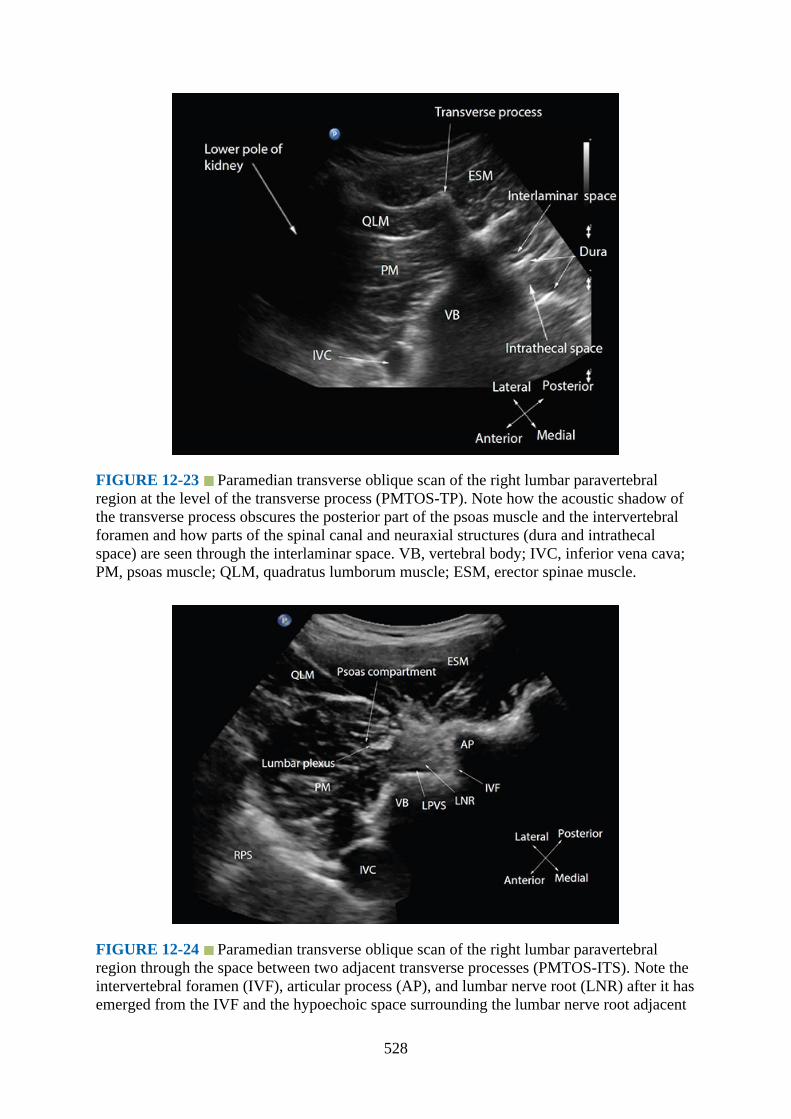
FIGURE 12-23 Paramedian transverse oblique scan of the right lumbar paravertebralregion at the level of the transverse process (PMTOS-TP). Note how the acoustic shadow ofthe transverse process obscures the posterior part of the psoas muscle and the intervertebralforamen and how parts of the spinal canal and neuraxial structures (dura and intrathecalspace) are seen through the interlaminar space. VB, vertebral body; IVC, inferior vena cava;PM, psoas muscle; QLM, quadratus lumborum muscle; ESM, erector spinae muscle.
FIGURE 12-24 Paramedian transverse oblique scan of the right lumbar paravertebralregion through the space between two adjacent transverse processes (PMTOS-ITS). Note theintervertebral foramen (IVF), articular process (AP), and lumbar nerve root (LNR) after it hasemerged from the IVF and the hypoechoic space surrounding the lumbar nerve root adjacent
528

to the IVF (ie, the LPVS: lumbar paravertebral space). The lumbar plexus is also seen in aseparate hypoechoic intramuscular compartment, which is the psoas compartment, in theposterior part of the psoas muscle (PM). VB, vertebral body; PM, psoas muscle; QLM,quadratus lumborum muscle; ESM, erector spinae muscle; RPS, retroperitoneal space; IVC,inferior vena cava.
FIGURE 12-25 Paramedian transverse oblique scan of the right lumbar paravertebralregion through the space between two adjacent transverse processes (PMTOS-ITS). Thelumbar nerve root is seen emerging from the intervertebral foramen, and the lumbar plexus(hyperechoic) is located within a hypoechoic space (psoas compartment) in the posterioraspect of the psoas muscle. Also note the lower pole of the right kidney is seen anterior to thepsoas muscle in this sonogram. ESM, erector spinae muscle; AP, articular process; VB,vertebral body; IVF, intervertebral foramen; IVC, inferior vena cava.
In the PMTOS-ITS11 apart from the erector spinae, psoas, and quadratus lumborummuscles, the intervertebral foramen, articular process, and the lumbar spinal nerve rootare clearly delineated (Figs. 12-24 to 12-26).11 The LPVS is also seen as a hypoechoicspace adjacent to the intervertebral foramen (Figs. 12-24 to 12-26), and the lumbarspinal nerve root can be seen exiting the foramen (Figs. 12-24 and 12-25).11 The latterdoes not enter the psoas muscle directly opposite the intervertebral foramen fromwhich it emerges (Figs. 12-24 and 12-25), but takes a caudal course as seen in the CT(Fig. 12-12), MRI (Figs. 12-14 to 12-16), and cadaver anatomical section (Fig. 12-9).In some individuals an additional hyperechoic structure surrounded by a hypoechoicspace (Figs. 12-24 to 12-26) is seen in the posterior aspect of the psoas muscle.11
Based on our observation in the anatomical sections (Fig. 12-7) and MRI images (Fig.12-14) we believe this represents the lumbar plexus within the psoas compartment.11
Currently there are limited data validating the transverse sonoanatomy of the lumbarparavertebral region, but it is our experience that there is good correlation betweenstructures that are visualized in a lumbar paravertebral sonogram and that incorresponding cadaver anatomical sections, CT, and MRI images of the lumbar
529
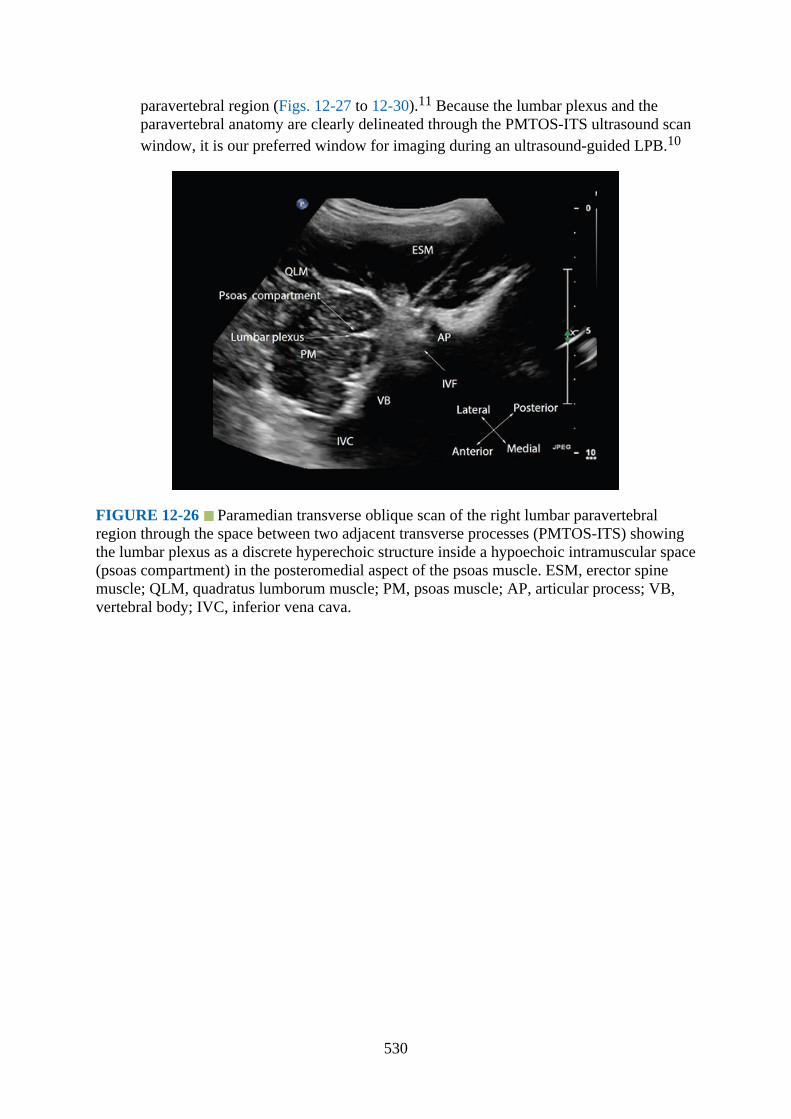
paravertebral region (Figs. 12-27 to 12-30).11 Because the lumbar plexus and theparavertebral anatomy are clearly delineated through the PMTOS-ITS ultrasound scanwindow, it is our preferred window for imaging during an ultrasound-guided LPB.10
FIGURE 12-26 Paramedian transverse oblique scan of the right lumbar paravertebralregion through the space between two adjacent transverse processes (PMTOS-ITS) showingthe lumbar plexus as a discrete hyperechoic structure inside a hypoechoic intramuscular space(psoas compartment) in the posteromedial aspect of the psoas muscle. ESM, erector spinemuscle; QLM, quadratus lumborum muscle; PM, psoas muscle; AP, articular process; VB,vertebral body; IVC, inferior vena cava.
530
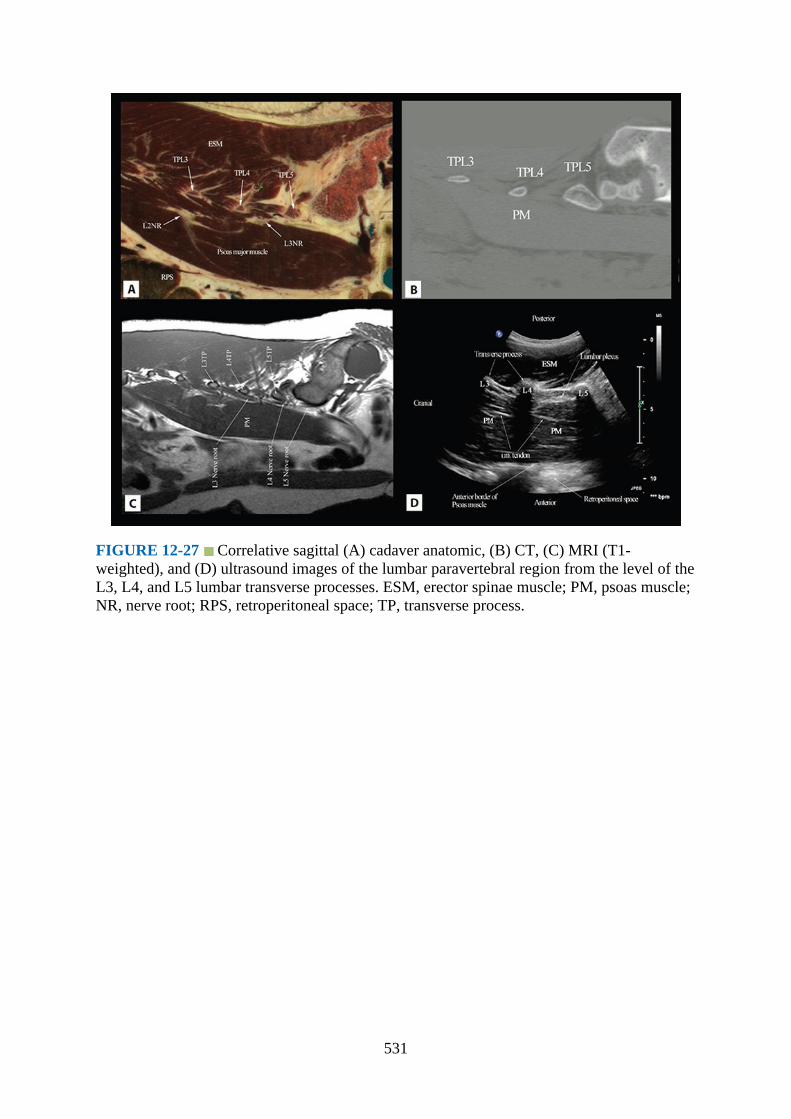
FIGURE 12-27 Correlative sagittal (A) cadaver anatomic, (B) CT, (C) MRI (T1-weighted), and (D) ultrasound images of the lumbar paravertebral region from the level of theL3, L4, and L5 lumbar transverse processes. ESM, erector spinae muscle; PM, psoas muscle;NR, nerve root; RPS, retroperitoneal space; TP, transverse process.
531
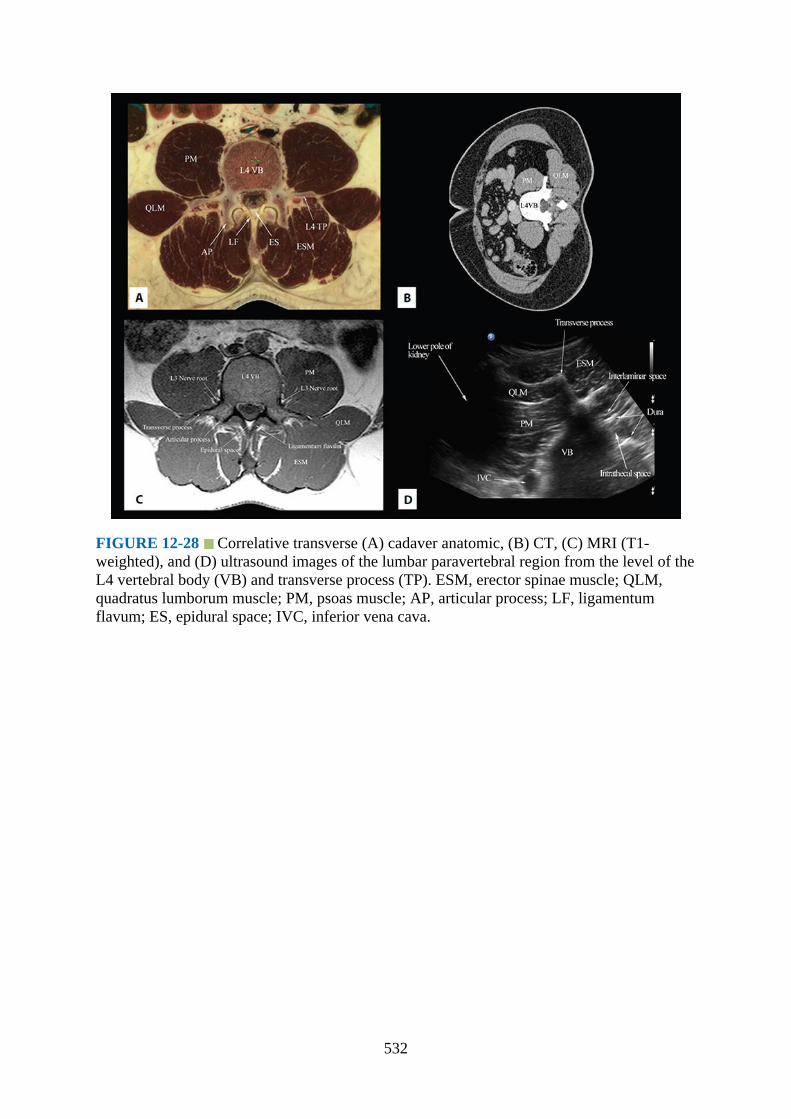
FIGURE 12-28 Correlative transverse (A) cadaver anatomic, (B) CT, (C) MRI (T1-weighted), and (D) ultrasound images of the lumbar paravertebral region from the level of theL4 vertebral body (VB) and transverse process (TP). ESM, erector spinae muscle; QLM,quadratus lumborum muscle; PM, psoas muscle; AP, articular process; LF, ligamentumflavum; ES, epidural space; IVC, inferior vena cava.
532

FIGURE 12-29 Correlative transverse (A) cadaver anatomic, (B) CT, (C) MRI (T1-weighted), and (D) ultrasound images of the lumbar paravertebral region from the level of theL4 vertebral body (VB) and articular process (AP). ESM, erector spinae muscle; QLM,quadratus lumborum muscle; PM, psoas muscle; AP, articular process; LPVS, lumbarparavertebral space; VB, vertebral body; IVC, inferior vena cava.
533
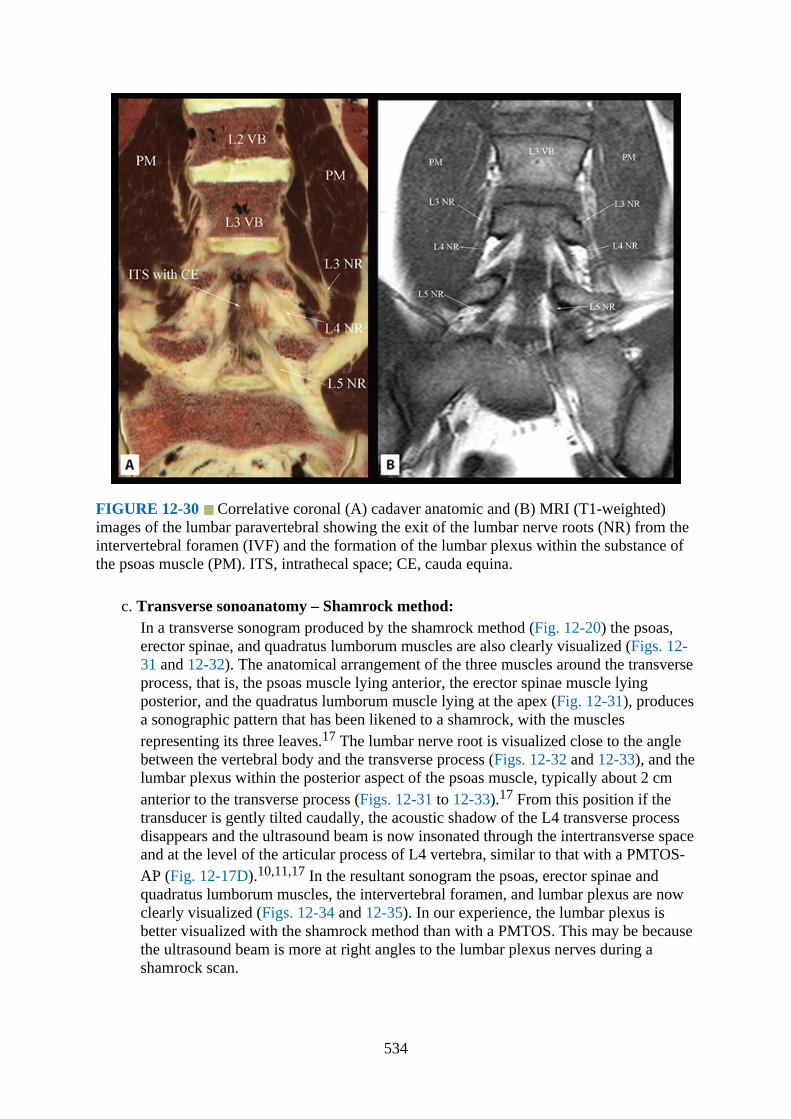
FIGURE 12-30 Correlative coronal (A) cadaver anatomic and (B) MRI (T1-weighted)images of the lumbar paravertebral showing the exit of the lumbar nerve roots (NR) from theintervertebral foramen (IVF) and the formation of the lumbar plexus within the substance ofthe psoas muscle (PM). ITS, intrathecal space; CE, cauda equina.
c. Transverse sonoanatomy – Shamrock method:In a transverse sonogram produced by the shamrock method (Fig. 12-20) the psoas,erector spinae, and quadratus lumborum muscles are also clearly visualized (Figs. 12-31 and 12-32). The anatomical arrangement of the three muscles around the transverseprocess, that is, the psoas muscle lying anterior, the erector spinae muscle lyingposterior, and the quadratus lumborum muscle lying at the apex (Fig. 12-31), producesa sonographic pattern that has been likened to a shamrock, with the musclesrepresenting its three leaves.17 The lumbar nerve root is visualized close to the anglebetween the vertebral body and the transverse process (Figs. 12-32 and 12-33), and thelumbar plexus within the posterior aspect of the psoas muscle, typically about 2 cmanterior to the transverse process (Figs. 12-31 to 12-33).17 From this position if thetransducer is gently tilted caudally, the acoustic shadow of the L4 transverse processdisappears and the ultrasound beam is now insonated through the intertransverse spaceand at the level of the articular process of L4 vertebra, similar to that with a PMTOS-AP (Fig. 12-17D).10,11,17 In the resultant sonogram the psoas, erector spinae andquadratus lumborum muscles, the intervertebral foramen, and lumbar plexus are nowclearly visualized (Figs. 12-34 and 12-35). In our experience, the lumbar plexus isbetter visualized with the shamrock method than with a PMTOS. This may be becausethe ultrasound beam is more at right angles to the lumbar plexus nerves during ashamrock scan.
534
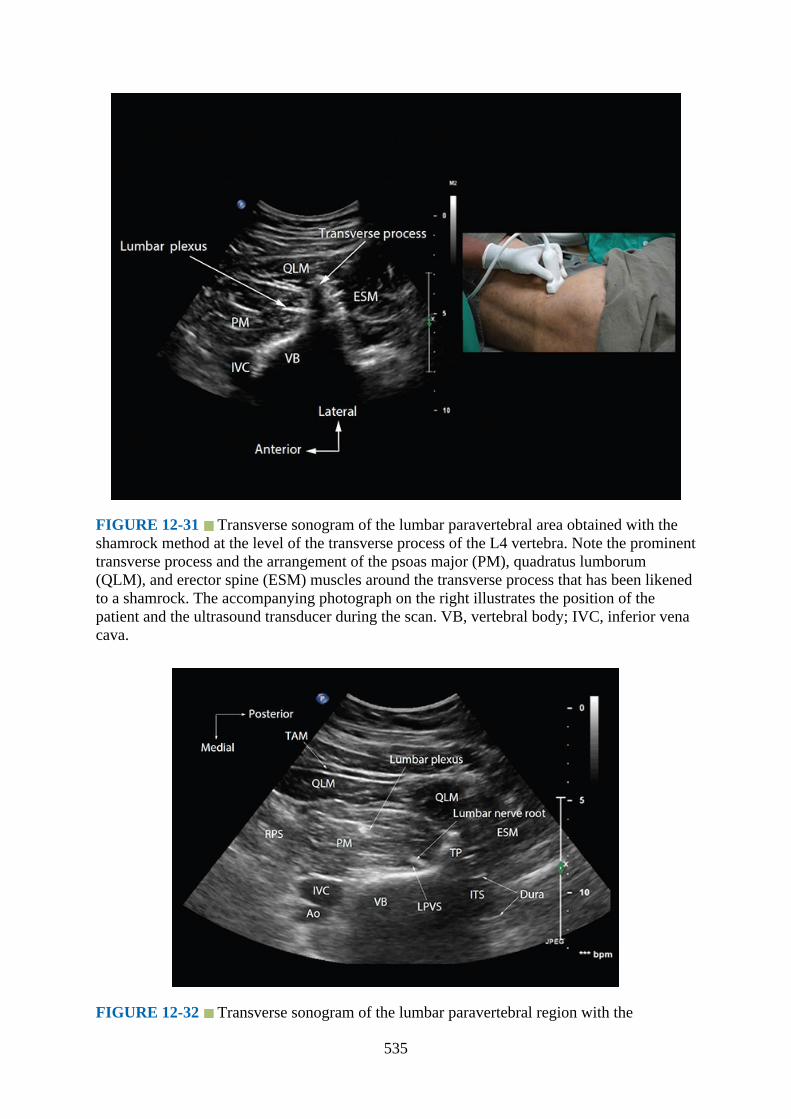
FIGURE 12-31 Transverse sonogram of the lumbar paravertebral area obtained with theshamrock method at the level of the transverse process of the L4 vertebra. Note the prominenttransverse process and the arrangement of the psoas major (PM), quadratus lumborum(QLM), and erector spine (ESM) muscles around the transverse process that has been likenedto a shamrock. The accompanying photograph on the right illustrates the position of thepatient and the ultrasound transducer during the scan. VB, vertebral body; IVC, inferior venacava.
FIGURE 12-32 Transverse sonogram of the lumbar paravertebral region with the
535

ultrasound beam being insonated at the level of the transverse process during the shamrockmethod. Note the lumbar nerve root is visualized close to the angle between the vertebralbody and the transverse process and the lumbar plexus nerve is located within the substanceof the psoas muscle. TAM, transversus abdominis muscle; ESM, erector spine muscle; PM,psoas major muscle; QLM, quadratus lumborum muscle; RPS, retroperitoneal space; IVC,inferior vena cava; Ao, abdominal aorta; VB, vertebral body; LPVS, lumbar paravertebralspace; ITS, intrathecal space; TP, transverse process.
FIGURE 12-33 Biplanar ultrasound image of the lumbar paravertebral region obtainedwith the shamrock method and with the ultrasound beam being insonated through the lumbarintertransverse space and at the level of the articular process. Note the transverse axis (A) isthe primary data acquisition plane and the corresponding image along the secondary dataacquisition plane (x-plane – dotted line with blue arrow head in A) is a coronal view showingthe lumbar plexus nerves within the psoas muscle. PM, psoas muscle; VB, vertebral body;ITS, intrathecal space; AP, articular process.
536

FIGURE 12-34 Transverse sonogram of the lumbar paravertebral region with theultrasound beam being insonated through the lumbar intertransverse space and at the level ofthe articular process (AP) during the shamrock method. The lumbar plexus nerves are clearlydelineated in the posterior aspect of the psoas major (PM) muscle. The accompanyingphotograph on the right illustrates the position of the patient and the ultrasound transducerduring the scan. VB, vertebral body; IVC, inferior vena cava; ESM, erector spine muscle;PM, psoas major muscle; QLM, quadratus lumborum muscle; IVC, inferior vena cava; VB,vertebral body; IVF, intervertebral foramen.
FIGURE 12-35 Transverse sonogram of the lumbar paravertebral region with theultrasound beam being insonated through the lumbar intertransverse space and at the level ofthe articular process of the lumbar vertebra during the shamrock scan. ESM, erector spinemuscle; PM, psoas major muscle; QLM, quadratus lumborum muscle; IVC, inferior venacava; VB, vertebral body; ITS, intrathecal space.
537

Clinical Pearls1.The lumbar paravertebral region is highly vascular and contains the ascending lumbar veins
and the lumbar arteries (Fig. 12-36), which can be visualized using Color and PowerDoppler ultrasound (Figs. 12-37 and 12-38). There is also a rich network of blood vessels(arteries and veins) within the substance of the psoas muscle. The dorsal branch of thelumbar artery is also closely related to the transverse process and the posterior part of thepsoas muscle (Fig. 12-38) where the lumbar plexus is located. Therefore, it may be at riskfor needle-related injury during an LPB, as it is directly in the path of the advancingneedle. Considering the rich vascularity of the lumbar paravertebral region, it is notsurprising that inadvertent intravascular injection of local anesthetic,2,3,–18 psoashematoma,–19 lumbar plexopathy,19 and delayed retroperitoneal hematoma–20,–21 haveall been reported after an LPB. It is for the same reason, and because the psoas musclelies in an incompressible area, that we recommend one must avoid LPB in patients withcoagulopathy.
FIGURE 12-36 Three-dimensional reconstruction of a CT angiogram showing the originof the lumbar artery from the abdominal aorta and how it is closely related to the anterolateralsurface of the lumbar vertebral body. The spinal artery, which is a branch of the lumbarartery, is also seen entering the spinal canal through the intervertebral foramen (C).
538

FIGURE 12-37 Color Doppler ultrasound image of the right lumbar paravertebral regionshowing the lumbar artery and the ascending lumbar vein close to the anterolateral surface ofthe lumbar vertebra and medial to the psoas muscle. QLM, quadratus lumborum muscle;ESM, erector spinae muscle; PM, psoas muscle; VB, vertebral body; IVC, inferior vena cava.
FIGURE 12-38 Color Doppler ultrasound images of the lumbar paravertebral region in thetransverse (A and B) and sagittal (C and D) scan planes. Note the dorsal branch of the lumbar
539
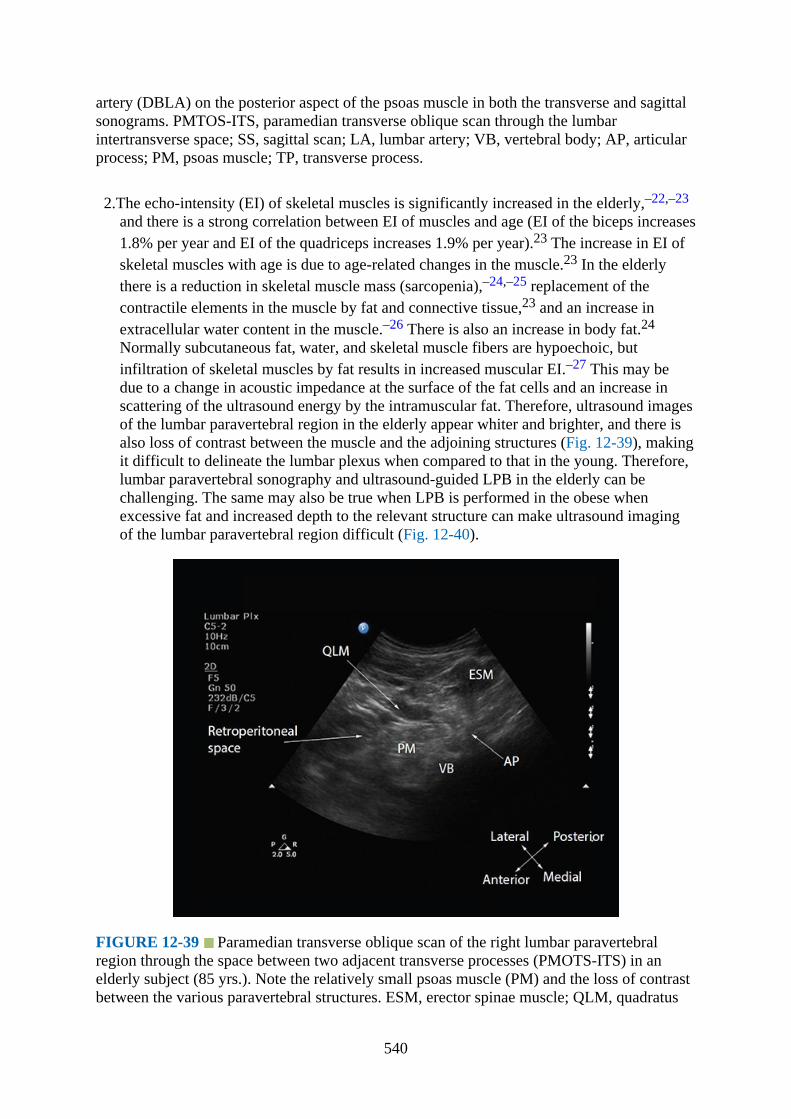
artery (DBLA) on the posterior aspect of the psoas muscle in both the transverse and sagittalsonograms. PMTOS-ITS, paramedian transverse oblique scan through the lumbarintertransverse space; SS, sagittal scan; LA, lumbar artery; VB, vertebral body; AP, articularprocess; PM, psoas muscle; TP, transverse process.
2.The echo-intensity (EI) of skeletal muscles is significantly increased in the elderly,–22,–23
and there is a strong correlation between EI of muscles and age (EI of the biceps increases1.8% per year and EI of the quadriceps increases 1.9% per year).23 The increase in EI ofskeletal muscles with age is due to age-related changes in the muscle.23 In the elderlythere is a reduction in skeletal muscle mass (sarcopenia),–24,–25 replacement of thecontractile elements in the muscle by fat and connective tissue,23 and an increase inextracellular water content in the muscle.–26 There is also an increase in body fat.24
Normally subcutaneous fat, water, and skeletal muscle fibers are hypoechoic, butinfiltration of skeletal muscles by fat results in increased muscular EI.–27 This may bedue to a change in acoustic impedance at the surface of the fat cells and an increase inscattering of the ultrasound energy by the intramuscular fat. Therefore, ultrasound imagesof the lumbar paravertebral region in the elderly appear whiter and brighter, and there isalso loss of contrast between the muscle and the adjoining structures (Fig. 12-39), makingit difficult to delineate the lumbar plexus when compared to that in the young. Therefore,lumbar paravertebral sonography and ultrasound-guided LPB in the elderly can bechallenging. The same may also be true when LPB is performed in the obese whenexcessive fat and increased depth to the relevant structure can make ultrasound imagingof the lumbar paravertebral region difficult (Fig. 12-40).
FIGURE 12-39 Paramedian transverse oblique scan of the right lumbar paravertebralregion through the space between two adjacent transverse processes (PMOTS-ITS) in anelderly subject (85 yrs.). Note the relatively small psoas muscle (PM) and the loss of contrastbetween the various paravertebral structures. ESM, erector spinae muscle; QLM, quadratus
540

lumborum muscle; VB, vertebral body; AP, articular process.
FIGURE 12-40 Sagittal sonogram of the lumbar paravertebral region in a morbidly obesepatient (BMI = 50 kg·m−2). Note the transverse processes (TP) of the lumbar vertebra arebarely recognizable in this ultrasound image. There is also a marked loss of contrast betweenthe various lumbar paravertebral structures. ESM, erector spinae muscle.
References1.Awad IT, Duggan EM. Posterior lumbar plexus block: anatomy, approaches, and
techniques. Reg Anesth Pain Med. 2005;30:143–149.2.Capdevila X, Coimbra C, Choquet O. Approaches to the lumbar plexus: success, risks, and
outcome. Reg Anesth Pain Med. 2005;30:150–162.3.de Leeuw MA, Zuurmond WW, Perez RS. The psoas compartment block for hip surgery:
the past, present, and future. Anesthesiol Res Pract. 2011;2011:159541.4.Chayen D, Nathan H, Chayen M. The psoas compartment block. Anesthesiology.
1976;45:95–99.5.Farny J, Girard M, Drolet P. Posterior approach to the lumbar plexus combined with a
sciatic nerve block using lidocaine. Can J Anaesth. 1994;41:486–491.6.Ho AM, Karmakar MK. Combined paravertebral lumbar plexus and parasacral sciatic
nerve block for reduction of hip fracture in a patient with severe aortic stenosis. Can JAnaesth. 2002;49:946–950.
7.Farny J, Drolet P, Girard M. Anatomy of the posterior approach to the lumbar plexusblock. Can J Anaesth. 1994;41:480–485.
8.Parkinson SK, Mueller JB, Little WL, Bailey SL. Extent of blockade with variousapproaches to the lumbar plexus. Anesth Analg. 1989;68:243–248.
9.Karmakar MK, Ho AM, Li X, Kwok WH, Tsang K, Kee WD. Ultrasound-guided lumbarplexus block through the acoustic window of the lumbar ultrasound trident. Br JAnaesth. 2008;100:533–537.
10.Karmakar MK, Li JW, Kwok WH, Hadzic A. Ultrasound-guided lumbar plexus block
541

using a transverse scan through the lumbar intertransverse space: a prospective caseseries. Reg Anesth Pain Med. 2015;40:75–81.
11.Karmakar MK, Li JW, Kwok WH, Soh E, Hadzic A. Sonoanatomy relevant for lumbarplexus block in volunteers correlated with cross-sectional anatomic and magneticresonance images. Reg Anesth Pain Med. 2013;38:391–397.
12.Ikezoe T, Mori N, Nakamura M, Ichihashi N. Atrophy of the lower limbs in elderlywomen: Is it related to walking ability? Eur J Appl Physiol. 2011;111:989–995.
13.Hanson P, Magnusson SP, Sorensen H, Simonsen EB. Anatomical differences in the psoasmuscles in young black and white men. J Anat. 1999;194(Pt 2):303–307.
14.Kirchmair L, Entner T, Kapral S, Mitterschiffthaler G. Ultrasound guidance for the psoascompartment block: an imaging study. Anesth Analg. 2002;94:706–710.
15.Karmakar MK. Ultrasound for central neuraxial blocks. Tech Reg Anesth Pain Manag.2009;13:161–170.
16.Karmakar MK, Li X, Kwok WH, Ho AM, Ngan Kee WD. Sonoanatomy relevant forultrasound-guided central neuraxial blocks via the paramedian approach in the lumbarregion. Br J Radiol. 2012;85:e262–e269.
17.Sauter AR, Ullensvang K, Bendtsen TF, Boerglum J. The “Shamrock Method” — a newand promising technique for ultrasound guided lumbar plexus blocks. Br J Anaesth. 2013(http://bja.oxfordjournals.org/forum/topic/brjana_el%3B9814). Accessed March 15,2015.
18.Huet O, Eyrolle LJ, Mazoit JX, Ozier YM. Cardiac arrest after injection of ropivacaine forposterior lumbar plexus blockade. Anesthesiology 2003;99:1451–1453.
19.Klein SM, D’Ercole F, Greengrass RA, Warner DS. Enoxaparin associated with psoashematoma and lumbar plexopathy after lumbar plexus block. Anesthesiology1997;87:1576–1579.
20.Aveline C, Bonnet F. Delayed retroperitoneal haematoma after failed lumbar plexus block.Br J Anaesth. 2004;93:589–591.
21.Weller RS, Gerancher JC, Crews JC, Wade KL. Extensive retroperitoneal hematomawithout neurologic deficit in two patients who underwent lumbar plexus block and werelater anticoagulated. Anesthesiology 2003;98:581–585.
22.Li X, Karmakar MK, Lee A, Kwok WH, Critchley LA, Gin T. Quantitative evaluation ofthe echo intensity of the median nerve and flexor muscles of the forearm in the youngand the elderly. Br J Radiol. 2012;85:e140–e145.
23.Maurits NM, Bollen AE, Windhausen A, De Jager AE, Van Der Hoeven JH. Muscleultrasound analysis: normal values and differentiation between myopathies andneuropathies. Ultrasound Med Biol. 2003;29:215–225.
24.Evans WJ. Exercise, Nutrition and Aging. Journal of Nutrition. 1992;122:796–801.25.Gallagher D, Visser M, deMeersman RE, Sepulveda D, Baumgartner RN, Pierson RN,
Harris T, Heymsfield SB. Appendicular skeletal muscle mass: Effects of age, gender,and ethnicity. Journal of Applied Physiology. 1997;83:229–239.
26.Tsubahara A, Chino N, Akaboshi K, Okajima Y, Takahashi H. Age-related changes ofwater and fat content in muscles estimated by magnetic resonance (MR) imaging.Disabil Rehabil. 1995;17:298–304.
27.Reimers K, Reimers CD, Wagner S, Paetzke I, Pongratz DE. Skeletal-Muscle Sonography— A Correlative Study of Echogenicity and Morphology. J Ultrasound Med.1993;12:73–77.
542

543
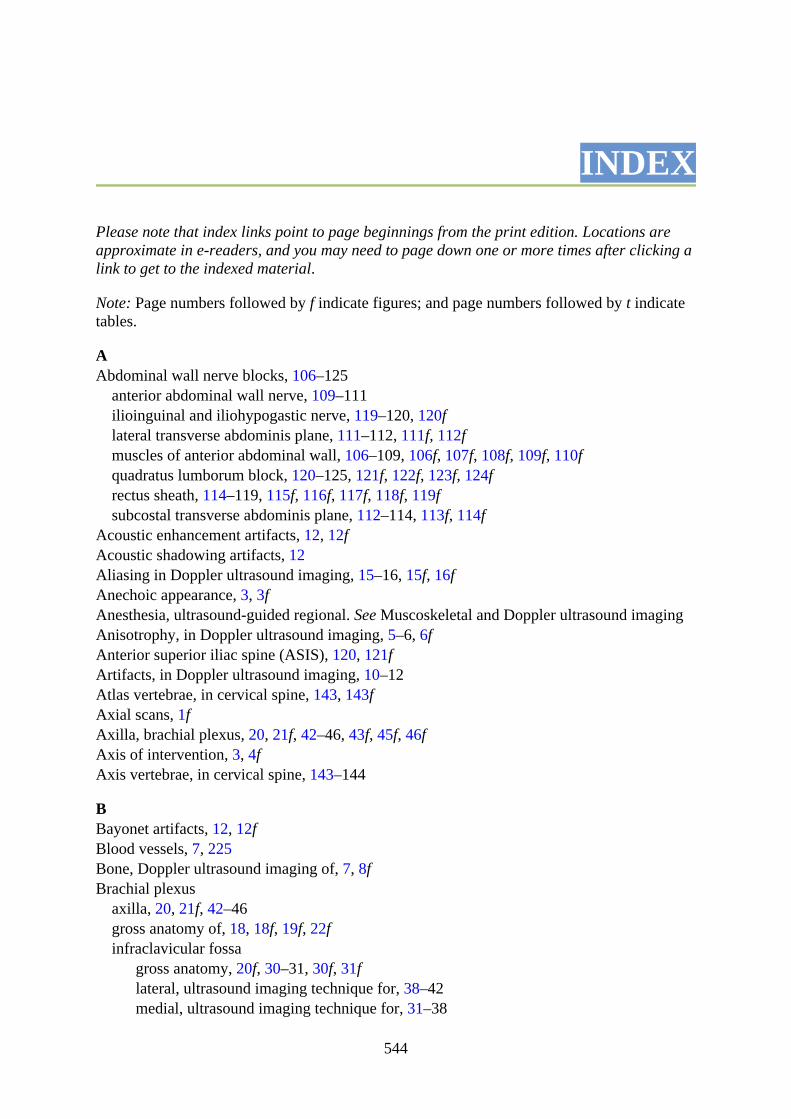
INDEX
Please note that index links point to page beginnings from the print edition. Locations areapproximate in e-readers, and you may need to page down one or more times after clicking alink to get to the indexed material.
Note: Page numbers followed by f indicate figures; and page numbers followed by t indicatetables.
AAbdominal wall nerve blocks, 106–125
anterior abdominal wall nerve, 109–111ilioinguinal and iliohypogastic nerve, 119–120, 120flateral transverse abdominis plane, 111–112, 111f, 112fmuscles of anterior abdominal wall, 106–109, 106f, 107f, 108f, 109f, 110fquadratus lumborum block, 120–125, 121f, 122f, 123f, 124frectus sheath, 114–119, 115f, 116f, 117f, 118f, 119fsubcostal transverse abdominis plane, 112–114, 113f, 114f
Acoustic enhancement artifacts, 12, 12fAcoustic shadowing artifacts, 12Aliasing in Doppler ultrasound imaging, 15–16, 15f, 16fAnechoic appearance, 3, 3fAnesthesia, ultrasound-guided regional. See Muscoskeletal and Doppler ultrasound imagingAnisotrophy, in Doppler ultrasound imaging, 5–6, 6fAnterior superior iliac spine (ASIS), 120, 121fArtifacts, in Doppler ultrasound imaging, 10–12Atlas vertebrae, in cervical spine, 143, 143fAxial scans, 1fAxilla, brachial plexus, 20, 21f, 42–46, 43f, 45f, 46fAxis of intervention, 3, 4fAxis vertebrae, in cervical spine, 143–144
BBayonet artifacts, 12, 12fBlood vessels, 7, 225Bone, Doppler ultrasound imaging of, 7, 8fBrachial plexus
axilla, 20, 21f, 42–46gross anatomy of, 18, 18f, 19f, 22finfraclavicular fossa
gross anatomy, 20f, 30–31, 30f, 31flateral, ultrasound imaging technique for, 38–42medial, ultrasound imaging technique for, 31–38
544
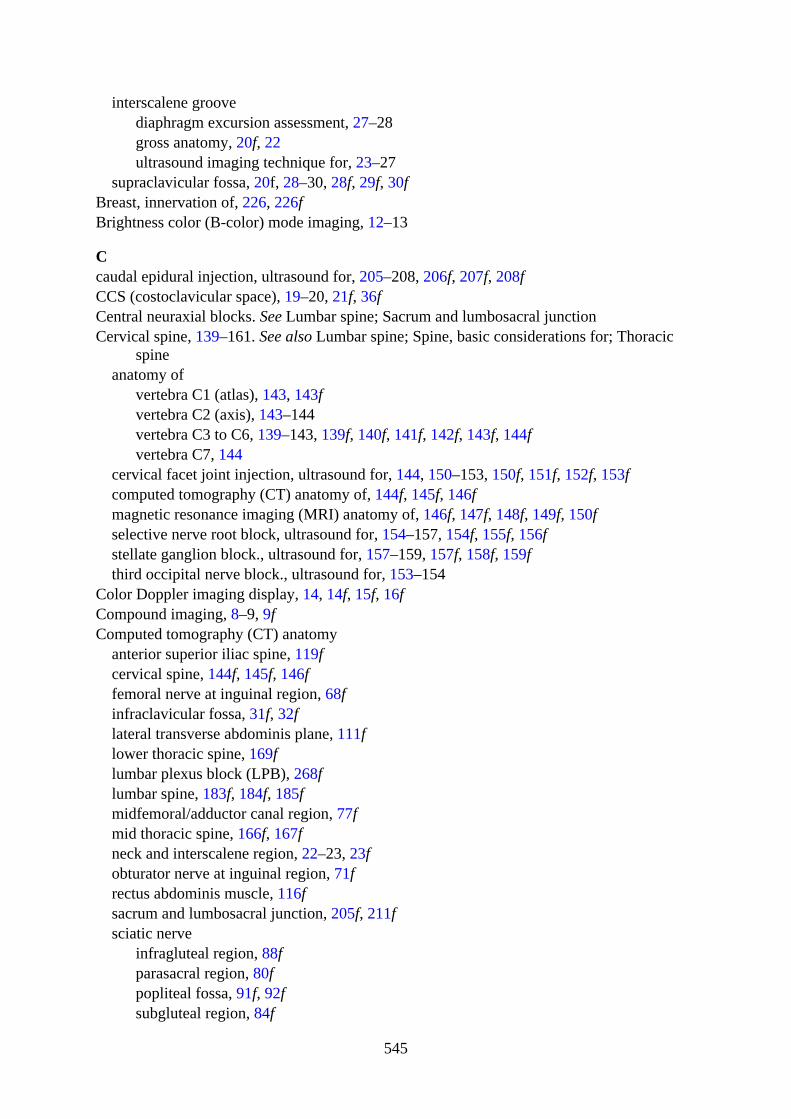
interscalene groovediaphragm excursion assessment, 27–28gross anatomy, 20f, 22ultrasound imaging technique for, 23–27
supraclavicular fossa, 20f, 28–30, 28f, 29f, 30fBreast, innervation of, 226, 226fBrightness color (B-color) mode imaging, 12–13
Ccaudal epidural injection, ultrasound for, 205–208, 206f, 207f, 208fCCS (costoclavicular space), 19–20, 21f, 36fCentral neuraxial blocks. See Lumbar spine; Sacrum and lumbosacral junctionCervical spine, 139–161. See also Lumbar spine; Spine, basic considerations for; Thoracic
spineanatomy of
vertebra C1 (atlas), 143, 143fvertebra C2 (axis), 143–144vertebra C3 to C6, 139–143, 139f, 140f, 141f, 142f, 143f, 144fvertebra C7, 144
cervical facet joint injection, ultrasound for, 144, 150–153, 150f, 151f, 152f, 153fcomputed tomography (CT) anatomy of, 144f, 145f, 146fmagnetic resonance imaging (MRI) anatomy of, 146f, 147f, 148f, 149f, 150fselective nerve root block, ultrasound for, 154–157, 154f, 155f, 156fstellate ganglion block., ultrasound for, 157–159, 157f, 158f, 159fthird occipital nerve block., ultrasound for, 153–154
Color Doppler imaging display, 14, 14f, 15f, 16fCompound imaging, 8–9, 9fComputed tomography (CT) anatomy
anterior superior iliac spine, 119fcervical spine, 144f, 145f, 146ffemoral nerve at inguinal region, 68finfraclavicular fossa, 31f, 32flateral transverse abdominis plane, 111flower thoracic spine, 169flumbar plexus block (LPB), 268flumbar spine, 183f, 184f, 185fmidfemoral/adductor canal region, 77fmid thoracic spine, 166f, 167fneck and interscalene region, 22–23, 23fobturator nerve at inguinal region, 71frectus abdominis muscle, 116fsacrum and lumbosacral junction, 205f, 211fsciatic nerve
infragluteal region, 88fparasacral region, 80fpopliteal fossa, 91f, 92fsubgluteal region, 84f
545
thigh–anterior approach, 95fsubcostal transverse abdominis plane, 113fterminal nerves in leg, 101fthoracic paravertebral blocks, 242f, 243fupper thoracic spine, 165f
Contact artifacts, 11Coronal anatomical plane, 130, 130fCostoclavicular space (CCS), 19–20, 21f, 36fCurved array transducers, 5, 5f
DDiaphragmatic excursion assessment, 27–28, 28fDoppler gain in ultrasound imaging, 16–17, 17fDoppler shift, 14, 14fDoppler ultrasound imaging. See Muscoskeletal and Doppler ultrasound imaging
EEchogenicity, in Doppler ultrasound imaging, 3, 7f, 8f, 13fEcho-intensity of skeletal muscles, 278Elbow region: median, ulnar, and radial nerves
gross anatomy, 52–54, 54f, 55f, 56f, 57f, 58fultrasound scan technique for, 54–58
Elderly patientsDoppler ultrasound imaging of, 12, 13fecho-intensity of skeletal muscles increased in, 278sacral hiatus changes in, 209spinal changes of, 132–133
Epidural injections, thoracic. See Thoracic spineEquation, Doppler, 13–14, 13fExternal oblique muscle (EOM), 106–107, 106f, 107f, 108f
FFascia
Doppler ultrasound imaging of, 7in thoracic interfacial nerve blocks, 225
Femoral nerve at inguinal regioncomputed tomography (CT) anatomy of, 68fgross anatomy, 66–67, 67fmagnetic resonance imaging (MRI) anatomy of, 68fultrasound scan technique for, 67–70
Field of view (FOV), in Doppler ultrasound imaging, 3–5, 5f
HHyperechoic appearance, 3, 3fHypoechoic appearance, 3, 3f
IIlioinguinal and iliohypogastic nerve, 119–120, 120f
546
Image orientation, 2, 2fImaging, ultrasound. See Muscoskeletal and Doppler ultrasound imagingInfraclavicular fossa
gross anatomy, 20f, 30–31, 30f, 31flateral, ultrasound imaging technique for, 38–42, 38f, 39f, 41f, 42fmedial, ultrasound imaging technique for, 31–38, 33f, 34f, 35f, 36f, 37f, 38f, 39f, 40fscan of, 5f
Inguinal region. See Femoral nerve at inguinal region; Obturator nerve at inguinal regionInnervation of breast, 226, 226fInterlaminar space anatomy. See Sacrum and lumbosacral junctionIxternal oblique muscle (IOM), 106–108Internal oblique muscle (IOM), 106, 107f, 108f, 115Interscalene groove
Diaphragmatic excursion assessment, 27–28gross anatomy, 20f, 22ultrasound imaging technique for, 23–27
Intervertebral spaces identified by ultrasound, 177Isoechoic appearance, 3, 3f
LLateral cutaneous nerve of thigh
gross anatomy, 73–74magnetic resonance imaging (MRI) anatomy of, 74fultrasound scan technique for, 74–75
Lateral transverse abdominis plane, 111–112, 112fLigaments, Doppler ultrasound imaging of, 8fLinear array transducers, 5, 5fLongitudinal scans, 1–2, 1fLower extremity nerve blocks, 64–105
femoral nerve at inguinal regioncomputed tomography (CT) anatomy of, 68fgross anatomy, 66–67, 67fmagnetic resonance imaging (MRI) anatomy of, 68fultrasound scan technique for, 67–70, 68f, 69f
gross anatomy of, 64–66, 64f, 65f, 66flateral cutaneous nerve of thigh
gross anatomy, 73–74magnetic resonance imaging (MRI) anatomy of, 74fultrasound scan technique for, 74–75, 74f, 75f
midfemoral/adductor canal regioncomputed tomography (CT) anatomy of, 77fmagnetic resonance imaging (MRI) anatomy of, 77fultrasound scan technique for, 77–79, 78f, 79f
obturator nerve at inguinal regioncomputed tomography (CT) anatomy of, 71fgross anatomy, 70, 70f
547
magnetic resonance imaging (MRI) anatomy of, 71fultrasound scan technique for, 71–73, 71f, 72f, 73f
saphenous nerve at adductor canal, 75–77, 76fsciatic nerve at infragluteal region
computed tomography (CT) anatomy of, 88fgross anatomy, 86–87, 88fmagnetic resonance imaging (MRI) anatomy of, 88fultrasound scan technique for, 87–89, 88f, 89f
sciatic nerve at parasacral regioncomputed tomography (CT) anatomy of, 80fgross anatomy, 79–80magnetic resonance imaging (MRI) anatomy of, 80fultrasound scan technique for, 80–83, 81f, 82f, 83f
sciatic nerve at popliteal fossacomputed tomography (CT) anatomy of, 91f, 92fgross anatomy, 90–91, 90f, 91fmagnetic resonance imaging (MRI) anatomy of, 91f, 92fultrasound scan technique for, 92–94, 93f, 94f, 95f
sciatic nerve at subgluteal regioncomputed tomography (CT) anatomy of, 84fgross anatomy, 83–84, 84fmagnetic resonance imaging (MRI) anatomy of, 84fultrasound scan technique for, 84–86, 84f, 85f, 86f
sciatic nerve at thigh--anterior approachcomputed tomography (CT) anatomy of, 95fgross anatomy, 94–95, 95fmagnetic resonance imaging (MRI) anatomy of, 95fultrasound scan technique for, 95–97, 96f, 97f
terminal nerves in legcomputed tomography (CT) anatomy of, 101fgross anatomy, 97–100, 98f, 99f, 100fmagnetic resonance imaging (MRI) anatomy of, 101fultrasound scan technique for, 101–104, 101f, 102f, 103f
Lumbar plexus block (LPB), 265–283anatomy, 265–268, 265f, 266f, 267f, 268fcomputed tomography (CT) anatomy of, 268fmagnetic resonance imaging (MRI) anatomy of, 268f, 269fultrasound technique for
overview, 269–270, 270fparamedian transverse oblique scan, 272–275, 273f, 274f, 275f, 279fsagittal sonoanatomy, 271–272, 271fshamrock method for transverse sonoanatomy, 275–277, 275f, 276f, 277f
Lumbar spine, 179–203. See also Cervical spine; Sacrum and lumbosacral junction; Spine,basic considerations for; Thoracic spine
anatomy of, 179–183, 179f, 180f, 181f, 182f, 183fcomputed tomography (CT) anatomy of, 183f, 184f
548

magnetic resonance imaging (MRI) anatomy of, 184f, 185f, 186fsagittal ultrasound imaging of, 199–202, 200f, 201ftransverse ultrasound imaging of, 196–199, 197f, 198f, 199fultrasound imaging of, 186–196, 186f, 187f, 188f, 189f, 190f, 191f, 192f, 193f, 194f, 195f,
196fLumbosacral junction. See Sacrum and lumbosacral junctionLungs, Doppler ultrasound imaging of, 8f
MMagnetic resonance imaging (MRI) anatomy
anterior superior iliac spine, 119faxilla, 44fbrachial plexus, 29fcervical spine, 146f, 147f, 148f, 149f, 150felbow region, 55ffemoral nerve at inguinal region, 68finfraclavicular fossa, 32flateral transverse abdominis plane, 111flower thoracic spine, 169flumbar plexus block (LPB), 268f, 269flumbar spine, 184f, 185f, 186fmidfemoral/adductor canal region, 77fmidforearm region, 59fmidhumeral region, 50f, 51fmid thoracic spine, 166f, 167fneck and interscalene region, 24fobturator nerve at inguinal region, 71frectus abdominis muscle, 116fsacrum and lumbosacral junction, 205f, 211f, 212fsciatic nerve
infragluteal region, 88fparasacral region, 80fpopliteal fossa, 91f, 92fsubgluteal region, 84fthigh–anterior approach, 95f
subcostal transverse abdominis plane, 113fterminal nerves in leg, 101fthoracic paravertebral blocks, 243f, 244fupper thoracic spine, 165f, 166f
Magnetic resonance neurography (MRN) imaging, 18fMedian anatomical plane, 130, 130fMedian nerve
elbow region, 52–58, 54f, 55f, 56f, 58fmidforearm region, 58–62, 59f, 60f, 61f, 62fmidhumeral region, 46–49
Midfemoral/adductor canal regioncomputed tomography (CT) anatomy of, 77f
549

magnetic resonance imaging (MRI) anatomy of, 77fultrasound scan technique for, 77–79, 78f, 79f
Midforearm region: median, ulnar, and radial nerves, 58–62, 59f, 60f, 61f, 62fMidhumeral region
median and ulnar nerve, 46–49, 46f, 47f, 48f, 50f, 51f, 52fradial nerve, 48f, 49–52, 50f, 51f, 53f
Mirror image artifacts, 11, 11fMRI (magnetic resonance imaging) anatomy. See Magnetic resonance imaging (MRI)
anatomyMRN (magnetic resonance neurography) imaging, 18fMuscles
of anterior abdominal wall, 106–109, 106f, 107f, 108f, 109f, 110fDoppler ultrasound imaging of, 6, 7fecho-intensity of skeletal, 278in thoracic interfacial nerve blocks, 219–222, 219f, 220f, 221f
Muscoskeletal and Doppler ultrasound imaging, 1–17aliasing in, 15–16, 15f, 16fanisotrophy, 5–6, 6fartifacts in, 10–12, 11f, 12faxis of intervention, 3, 4fbasic steps for, 17display of, 14–15Doppler gain in, 16–17, 17fechogenicity, 3, 3fof elderly patients, 12, 13ffield of view and needle visibility, 3–5, 5fnormal structures identification
blood vessels, 7bone, 7, 8ffascia, 7muscles, 6–7, 7fnerves, 6, 7fpleura, 7, 8fsubutaneous fat, 7tendons, 6
of obese patients, 12–13optimization of, 2–3scanning plane, 1–2, 1f, 2fscience of, 13–14, 13f, 14f, 15fspecial features
compound imaging, 8–9, 10fpanoramic imaging, 9, 9fthree-dimensional ultrasound, 9–10, 10ftissue harmonic imaging, 7–8
spectral broadening in, 16transducer and image orientation, 2, 2f
550

ultrasound transducer frequency, 1
NNeck and interscalene region
computed tomography (CT) anatomy of, 22–23magnetic resonance imaging (MRI) of, 24fsagittal sonogram of, 27ftransverse sonogram of, 25f, 26f, 27f
Needle visibility, in Doppler ultrasound imaging, 3–5Nerve blocks. See Abdominal wall nerve blocks; Lower extremity nerve blocks; Thoracic
interfacial nerve blocks; Upper extremity nerve blocksNerves
of anterior abdominal wall, 109–111Doppler ultrasound imaging of, 6, 7fin thoracic interfacial nerve blocks, 222–225, 222f, 223f, 224f, 225f
Neuraxial blocks, central. See Lumbar spine; Sacrum and lumbosacral junction
OObese patients
Doppler ultrasound imaging of, 12–13lumbar paravertebral region sonogram of, 279f
Obturator nerve at inguinal regioncomputed tomography (CT) anatomy of, 71fgross anatomy, 70magnetic resonance imaging (MRI) anatomy of, 71fultrasound scan technique for, 71–73, 71f, 72f, 73f
Osseous elements of spine, 131–137, 132f, 133f, 134f, 135f, 136f, 137f
PPanoramic imaging, 9, 9fParamedian sagittal oblique scan (PMSOS), 131, 131f, 132f, 137f, 199Paramedian transverse oblique scan, 272–275, 273f, 274f, 275f, 279fPectoral nerve blocks. See Thoracic interfacial nerve blocksPleura, Doppler ultrasound imaging of, 7, 8fPower Doppler imaging display, 14–15, 15fPropagation speed artifacts, 11–12, 12fPsoas compartment block (PCB). See Lumbar plexus block (LPB)
QQuadratus lumborum block (QLB), 120–125, 121f, 122f, 123f, 124f
RRadial nerve
elbow region, 52–58, 54f, 55f, 56f, 58fmidforearm region, 58–62, 59f, 62fmidhumeral region, 49–52, 50f, 51f, 52f, 53f
Rectus abdominis muscle (RAM), 106, 107f, 108f, 109, 115–116, 117f, 118f, 119fRectus sheath, 106f, 114–119, 115f, 116f, 117f, 118f, 119f
551

Reverberation artifacts, 11, 11f
SSacrum and lumbosacral junction, 203–219
anatomy of, 203–204, 203f, 204fcaudal epidural injections, ultrasound for, 205–208, 206f, 207f, 208fcomputed tomography (CT) anatomy of, 205f, 211finterlaminar space anatomy, 209–210, 209f, 210f, 211f, 212fmagnetic resonance imaging (MRI) anatomy of, 205f, 211f, 212fultrasound of interlaminar space in, 211–216, 212f, 213f, 214f, 215f, 216f, 217f
Sagittal scans, 1–2, 1fSagittal sonoanatomy, 271–272, 271fSaphenous nerve at adductor canal, 75–77, 76fScalene muscles, brachial plexus relation to, 19fScanning plane, in Doppler ultrasound imaging, 1–2Sciatic nerve
infragluteal regioncomputed tomography (CT) anatomy of, 88fgross anatomy, 86–87, 88fmagnetic resonance imaging (MRI) anatomy of, 88fultrasound scan technique for, 87–89, 88f, 89f
parasacral regioncomputed tomography (CT) anatomy of, 80fgross anatomy, 79–80magnetic resonance imaging (MRI) anatomy of, 80fultrasound scan technique for, 80–83, 81f, 82f, 83f
popliteal fossacomputed tomography (CT) anatomy of, 91f, 92fgross anatomy, 90–91, 90f, 91fmagnetic resonance imaging (MRI) anatomy of, 91f, 92fultrasound scan technique for, 92–94, 93f, 94f, 95f
subgluteal regioncomputed tomography (CT) anatomy of, 84fgross anatomy, 83–84, 84fmagnetic resonance imaging (MRI) anatomy of, 84fultrasound scan technique for, 84–86, 84f, 85f, 86f
thigh–anterior approachcomputed tomography (CT) anatomy of, 95fgross anatomy, 94–95, 95fmagnetic resonance imaging (MRI) anatomy of, 95fultrasound scan technique for, 95–97, 96f, 97f
SCTL (superior costotransverse ligament), 240Selective nerve root block, ultrasound for, 154–157, 154f, 155f, 156fSerratus plane block. See Thoracic interfascial nerve blocksShamrock method for transverse sonoanatomy, 275–277, 275f, 276f, 277fSpectral broadening in Doppler ultrasound imaging, 16, 16f, 17f
552

Spectral Doppler imaging display, 15, 15fSpine. See also Cervical spine; Lumbar spine; Sacrum and lumbosacral junction; Thoracic
spinebasic considerations for, 126–139anatomy of, 126–129, 126f, 127f, 128f, 129fosseous element sonoanatomy, 131–137, 132f, 133f, 134f, 135f, 136f, 137fsonography of, 129–131, 129f, 130f, 131f
Stellate ganglion block, ultrasound for, 157–159, 157f, 158f, 159fSubcostal transverse abdominis plane, 112–114, 113f, 114fSubcutaneous fat, Doppler ultrasound imaging of, 7Superior costotransverse ligament (SCTL), 240Supraclavicular fossa, of brachial plexus, 20f, 28–30, 28f, 29f, 30f
TTAM (transverse abdominis muscle), 106, 107f, 108, 108f, 112TAP (transverse abdominis plane), 110–112, 111f, 122fTendons, Doppler ultrasound imaging of, 6Terminal nerves in leg
computed tomography (CT) anatomy of, 101fgross anatomy, 97–100, 98f, 99f, 100fmagnetic resonance imaging (MRI) anatomy of, 101fultrasound scan technique for, 101f, 102f, 103f
TGC (time gain compensation), 3THI (tissue harmonic imaging), 7–8, 8f, 12Third occipital nerve block., ultrasound for, 153–154Thoracic interfacial nerve blocks, 219–240
anatomyblood vessels, 225fascia, 225muscles, 219–222, 219f, 220f, 221fnerves, 222–225, 222f, 223f, 224f, 225f
innervation of breast, 226, 226foverview, 219ultrasound for, 226–238, 227f, 228f, 229f, 230f, 231f, 232f, 233f, 234f, 235f, 236f, 237f,
238fThoracic paravertebral block (TPVB), 240–265
anatomy of, 240–242, 240f, 241f, 242fcommunications of thoracic paravertebral space, 242computed tomography (CT) anatomy of, 242f, 243fmagnetic resonance imaging (MRI) anatomy of, 243f, 244fthree-dimensional sonography of, 260–262, 261f, 262fultrasound scan technique for, 244–260, 245f, 246f, 247f, 248f, 249f, 250f, 251f, 252f, 253f,
254f, 255f, 256f, 257f, 258f, 259f, 260fThoracic spine, 161–179. See also Cervical spine; Spine, basic considerations for
anatomy of, 161–164, 161f, 162f, 163f, 164f, 166f, 168fcomputed tomography (CT) anatomy
lower, 168f, 169f
553
mid, 166f, 167fupper, 165f
magnetic resonance imaging (MRI) anatomylower, 169fmid, 166f, 167fupper, 165f, 166f
ultrasound ofintervertebral spaces identified by, 177lower, 175–177, 176f, 177fmid, 173–175, 174f, 175foverview, 169–171, 170f, 171fupper, 171–173, 172f, 173f
Three-dimensional sonography of thoracic paravertebral blocks, 260–262, 261f, 262fThree-dimensional ultrasound, 9–10, 10fTime gain compensation (TGC), 3Tissue harmonic imaging (THI), 7–8, 8f, 12TPVB (thoracic paravertebral block). See Thoracic paravertebral block (TPVB)Transducers. See also ultrasound descriptions for various body regions
curved array, 5, 5ffrequency of ultrasound, 1linear array, 5, 5forientation of, 2, 2f
Transverse abdominis muscle (TAM), 106, 107f, 108, 108f, 112Transverse abdominis plane (TAP), 110–112, 111f, 122fTransverse anatomical plane, 130, 130fTransverse scans, 1, 1f, 2f
UUlnar nerve
elbow region, 52–58, 54f, 55f, 57fmidforearm region, 58–62, 59f, 61f, 62fmidhumeral region, 46–49
Ultrasound-guided regional anesthesia (USGRA). See Muscoskeletal and Doppler ultrasoundimaging
Ultrasound imaging. See Muscoskeletal and Doppler ultrasound imagingUltrasound transducer frequency, 1Uncovertebral joint osteophytes, 140Upper extremity nerve blocks, 18–63
brachial plexus: axilla, 42–46, 43f, 44f, 45f, 46fbrachial plexus: infraclavicular fossa
gross anatomy, 30–31, 30f, 31flateral, ultrasound imaging technique for, 38–42, 38f, 39f, 40f, 41f, 42fmedial, ultrasound imaging technique for, 31–38, 32f, 33f, 34f, 35f, 36f, 37f
brachial plexus: interscalene groove, 22–28diaphragmatic excursion assessment, 27–28, 28fgross anatomy, 22, 23fultrasound imaging technique for, 23–27, 24f, 25f, 26f, 27f
554
brachial plexus: supraclavicular fossa, 28–30, 28f, 29f, 30felbow region: median, ulnar, and radial nerves
gross anatomy, 52–54ultrasound scan technique for, 54–58
gross anatomy of, 18–22, 18f, 19f, 20f, 21f, 22fmidforearm region: median, ulnar, and radial nerves, 58–62midhumeral region
median and ulnar nerve, 46–49radial nerve, 49–52
USGRA (ultrasound-guided regional anesthesia). See Muscoskeletal and Doppler ultrasoundimaging
VVertebrae. See Cervical spine; Lumbar spine; Spine, basic considerations for; Thoracic spine
555

Mục lục
COVER 1TITLE 3COPYRIGHT 4CONTENTS 6PREFACE 7ACKNOWLEDGMENTS 81. Basics of Musculoskeletal and Doppler Ultrasound Imaging forRegional Anesthesia and Pain Medicine 9
Ultrasound Transducer Frequency 9Scanning Plane 9Transducer and Image Orientation 10Image Optimization 11Echogenicity 12Axis of Intervention 12Field of View and Needle Visibility 14Anisotropy 15Identification of Normal Structures 16
Nerve 16Tendon 17Muscle 17
Subcutaneous Fat 17Bone 17Fascia 18Blood Vessel 18Pleura 18
Special Ultrasound Features 18Tissue Harmonic Imaging 18Compound Imaging 19Panoramic Imaging 20Three-Dimensional Ultrasound 20
Artifacts 22Imaging the Challenging Patient 25
The Elderly Patient 25The Obese Patient 26
Doppler Ultrasound: The Basics 26Doppler Display 28
Color Doppler 28Power Doppler 29Spectral Doppler 30
556
Other Technical Considerations 30Aliasing 30Spectral Broadening 31Doppler Gain 32
Basic Steps for Doppler Imaging 32Suggested Reading 33
2. Sonoanatomy Relevant for Ultrasound-Guided Upper Extremity NerveBlocks 35
Introduction 35Gross Anatomy 35Brachial Plexus: Interscalene Groove 44Gross Anatomy 44
Computed Tomography Anatomy of the Neck and Interscalene Region 46Magnetic Resonance Imaging Anatomy of the Neck and Interscalene Region 47Technique of Ultrasound Imaging of the Brachial Plexus at the InterscaleneGroove 49
Assessment of Diaphragm Excursions 56Brachial Plexus: Supraclavicular Fossa 57Gross Anatomy 57
Computed Tomography Anatomy of the Supraclavicular Fossa 58Magnetic Resonance Imaging Anatomy of the Supraclavicular Fossa 59Technique of Ultrasound Imaging of the Brachial Plexus at the SupraclavicularFossa 59
Brachial Plexus: Infraclavicular Fossa 62Gross Anatomy 62
Computed Tomography Anatomy of the Infraclavicular Fossa 64Magnetic Resonance Imaging Anatomy of the Infraclavicular Fossa 65Technique of Ultrasound Imaging of the Brachial Plexus at the MedialInfraclavicular Fossa 68
Ultrasound Imaging of the Brachial Plexus at the Lateral Infraclavicular Fossa 81Brachial Plexus: Axilla 85Gross Anatomy 85
Magnetic Resonance Imaging Anatomy of the Axilla 87Technique of Ultrasound Imaging of the Brachial Plexus at the Axilla 87
Midhumeral Region – Median and Ulnar Nerve 93Gross Anatomy 93
Magnetic Resonance Imaging Anatomy of the Midhumeral Region 96Technique of Ultrasound Imaging for the Median and Ulnar Nerve at theMidhumeral Region 97
Midhumeral Region – Radial Nerve 100Gross Anatomy 100
Magnetic Resonance Imaging of the Midhumeral Region (Radial Nerve) 101Ultrasound Scan Technique for Radial Nerve at the Radial Groove 102
557
Ultrasound Scan Technique for Radial Nerve at the Lateral Aspect of the Arm 105Elbow Region – Median, Ulnar, and Radial Nerves 107Gross Anatomy 107
Magnetic Resonance Imaging of the Elbow Region 109Elbow Region Ultrasound Scan Technique 111
Midforearm Region – Median, Ulnar, and Radial Nerves 117Gross Anatomy 117
Magnetic Resonance Imaging Anatomy of the Midforearm 118Midforearm Ultrasound Scan Technique 119
References 1263. Sonoanatomy Relevant for Ultrasound-Guided Lower ExtremityNerve Blocks 129
Introduction 129Gross Anatomy 129Femoral Nerve at the Inguinal Region 133Gross Anatomy 133
Computed Tomography Anatomy of the Inguinal Region 136Magnetic Resonance Imaging Anatomy of the Inguinal Region 136Femoral Nerve Ultrasound Scan Technique 137
Obturator Nerve at the Inguinal Region 141Gross Anatomy 141
Computed Tomography Anatomy of the Upper Thigh 142Magnetic Resonance Imaging Anatomy of the Upper Thigh 143Obturator Nerve Ultrasound Scan Technique 143
Lateral Cutaneous Nerve of the Thigh 147Gross Anatomy 147
Magnetic Resonance Imaging Anatomy of the Lateral Cutaneous Nerve of theThigh 149
Lateral Cutaneous Nerve of the Thigh Ultrasound Scan Technique 149Saphenous Nerve at the Adductor Canal 152Gross Anatomy 152
Computed Tomography Anatomy of the Midfemoral/Adductor Canal Region 155Magnetic Resonance Imaging Anatomy of the Midfemoral/Adductor CanalRegion 155
Midfemoral/Adductor Canal Region Ultrasound Scan Technique 156Sciatic Nerve at the Parasacral Region 160Gross Anatomy 160
Computed Tomography Anatomy of the Sciatic Nerve – Parasacral Region 162Magnetic Resonance Imaging Anatomy of the Sciatic Nerve – ParasacralRegion 162
Sciatic Nerve – Parasacral Region Ultrasound Scan Technique 163Sciatic Nerve – At the Subgluteal Region 169Gross Anatomy 169
558

Computed Tomography Anatomy of the Sciatic Nerve – Subgluteal Region 169Magnetic Resonance Imaging Anatomy of the Sciatic Nerve – SubglutealRegion 170
Sciatic Nerve at the Subgluteal Region – Ultrasound Scan Technique 171Sciatic Nerve at the Infragluteal Region 176Gross Anatomy 176
Computed Tomography Anatomy of the Sciatic Nerve – Infragluteal Region 178Magnetic Resonance Anatomy of the Sciatic Nerve – Infragluteal Region 178Sciatic Nerve at the Infragluteal Region – Ultrasound Scan Technique 179
Sciatic Nerve at the Popliteal Fossa 182Gross Anatomy 182
Computed Tomography Anatomy of the Popliteal Fossa 184Magnetic Resonance Imaging Anatomy of the Popliteal Fossa 186Sciatic Nerve at the Popliteal Fossa – Ultrasound Scan Technique 188
Sciatic Nerve at the Thigh – Anterior Approach 194Gross Anatomy 194
Computed Tomography Anatomy of the Sciatic Nerve at the Thigh 195Magnetic Resonance Imaging Anatomy of the Sciatic Nerve at the Thigh 195Sciatic Nerve at the Thigh – Anterior Approach Ultrasound Scan Technique 196
Terminal Nerves in the Leg 198Gross Anatomy 198
Computed Tomography Anatomy of the Terminal Nerves of the Leg 204Magnetic Resonance Imaging Anatomy of the Terminal Nerves of the Leg 205Terminal Nerves of the Leg – Ultrasound Scan Technique 206
References 2124. Sonoanatomy Relevant for Ultrasound-Guided Abdominal Wall NerveBlocks 214
Introduction 214Gross Anatomy 214Muscles of the Anterior Abdominal Wall 214
Nerves of the Anterior Abdominal Wall 221Lateral (Midaxillary) Transverse Abdominis Plane 223Gross Anatomy 223
Computed Tomography Abdomen Showing the Lateral (Midaxillary)Transverse Abdominis Plane 223
Magnetic Resonance Imaging Abdomen Showing the Lateral (Midaxillary)Transverse Abdominis Plane 224
Ultrasound Scan Technique 224Subcostal Transverse Abdominis Plane 227Gross Anatomy 227
Computed Tomography Abdomen Showing the Subcostal TransverseAbdominis Plane 227
Magnetic Resonance Imaging Abdomen Showing the Subcostal Transverse
559
Abdominis PlaneUltrasound Scan Technique 228
Rectus Sheath 231Gross Anatomy 231
Computed Tomography Abdomen Showing the Rectus Abdominis Muscle 232Magnetic Resonance Imaging Abdomen Showing the Rectus Abdominis Muscle 233Ultrasound Scan Technique 234
Ilioinguinal and Iliohypogastric Nerve 239Gross Anatomy 240
Computed Tomography Abdomen – Transverse View at the Level of theAnterior Superior Iliac Spine 240
MRI Abdomen – Transverse View at the Level of the Anterior Superior IliacSpine 241
Ultrasound Scan Technique 242Quadratus Lumborum Block 244Gross Anatomy 244
Ultrasound Scan Technique 246References 250
5. Ultrasound Imaging of the Spine: Basic Considerations 252Introduction 252Basics of Spine Anatomy 252Spinal Sonography – Basic Consideration 258
Ultrasound Scan Planes 258Sonoanatomy of the Osseous Elements of the Spine 262
References 2736. Sonoanatomy Relevant for Ultrasound-Guided Injections of theCervical Spine 276
Introduction 276Basic Cervical Spine Anatomy 276
Typical Cervical Vertebra (C3 to C6) 278Atlas (C1) 284Axis (C2) 285Seventh Cervical Vertebra (C7) 285Computed Tomography Anatomy of the Cervical Spine 285Magnetic Resonance Anatomy of the Cervical Spine 290
Ultrasound for Cervical Facet Joint Injection 298Ultrasound Scan Technique 298Ultrasound for Third Occipital Nerve Block 305Gross Anatomy of the Third Occipital Nerve 305
Ultrasound Scan Technique 305Ultrasound for Selective Nerve Root Block 307Ultrasound Scan Technique 307Ultrasound for Stellate Ganglion (Cervical Sympathetic Chain) Block 313
560

Ultrasound for Stellate Ganglion (Cervical Sympathetic Chain) Block 313Gross Anatomy 313
Ultrasound Scan Technique 313References 316
7. Ultrasound of the Thoracic Spine for Thoracic Epidural Injections 318Introduction 318Basic Anatomy of the Thoracic Spine 318
Typical Thoracic Vertebrae 321Gross Anatomy of the Upper Thoracic Spine (T1–T4) 323Computed Tomography Anatomy of the Upper Thoracic Spine (T1–T4) 324Magnetic Resonance Imaging Anatomy of the Upper Thoracic Spine (T1–T4) 326Gross Anatomy of the Midthoracic Spine (T5–T8) 328Computed Tomography Anatomy of the Midthoracic Spine (T5–T8) 329Magnetic Resonance Imaging Anatomy of the Midthoracic Spine (T5–T8) 331Gross Anatomy of the Lower Thoracic Spine (T9–T12) 333Computed Tomography Anatomy of the Lower Thoracic Spine (T9–T12) 334Magnetic Resonance Imaging Anatomy of the Lower Thoracic Spine (T9–T12) 336
Ultrasound Imaging of the Thoracic Spine – Basic Considerations 338Ultrasound Imaging of the Upper Thoracic Spine (T1–T4) 343Ultrasound Imaging of the Midthoracic Spine (T5-T8) 347Ultrasound Imaging of the Lower Thoracic Spine (T9–T12) 353Identification of Thoracic Intervertebral Spaces Using Ultrasound 355Clinical Pearls 356References 356
8. Ultrasound Imaging of the Lumbar Spine for Central Neuraxial Blocks 358Introduction 358Basic Lumbar Spine Anatomy 358
Typical Lumbar Vertebra 359Fifth Lumbar Vertebra (L5) 361Gross Anatomy of the Lumbar Spine 362Computed Tomography Anatomy of the Lumbar Spine 366Magnetic Resonance Imaging Anatomy of the Lumbar Spine 369
Ultrasound Imaging of the Lumbar Spine 373Transverse Ultrasound Imaging of the Lumbar Spine 397Sagittal Ultrasound Imaging of the Lumbar Spine 398
References 3999. Ultrasound Imaging of Sacrum and Lumbosacral Junction for CentralNeuraxial Blocks 401
Introduction 401Basic Anatomy of the Sacrum 401
Gross Anatomy of the Sacrum 403Computed Tomography Anatomy of the Sacrum 404
561

Ultrasound Imaging of the Sacrum for Caudal Epidural Injection – BasicConsiderations 406
Ultrasound Imaging of the Sacrum for Caudal Epidural Injection 408Clinical Pearls 411Basic Anatomy of the Lumbosacral Interlaminar Space 412
Gross Anatomy of the Lumbosacral Interlaminar Space 414Computed Tomography Anatomy of the Lumbosacral Interlaminar Space 414Magnetic Resonance Imaging Anatomy of the Lumbosacral Interlaminar Space 416
Ultrasound Imaging of the Lumbosacral Interlaminar Space 418Clinical Pearls 424References 427
10. Sonoanatomy Relevant for Thoracic Interfascial Nerve Blocks:Pectoral Nerve Block and Serratus Plane Block 428
Introduction 428Gross Anatomy 428Innervation of the Breast 439Ultrasound Imaging for Thoracic Interfascial Blocks 440Ultrasound Scan Technique 440Clinical Pearls 461References 462
11. Sonoanatomy Relevant for Ultrasound-Guided ThoracicParavertebral Block 464
Introduction 464Gross Anatomy 464Communications of the Thoracic Paravertebral Space 468Computed Tomography Anatomy of the Thoracic Paravertebral Region 469Magnetic Resonance Imaging Anatomy of the Thoracic Paravertebral Region 471Sonoanatomy of the Thoracic Paravertebral Region 474Ultrasound Scan Technique 474Three-Dimensional Sonography of the Thoracic Paravertebral Region 504Reference 508
12. Sonoanatomy Relevant for Ultrasound-Guided Lumbar Plexus Block 511Introduction 511Gross Anatomy 511
Computed Tomography Anatomy of the Lumbar Paravertebral Region 518Magnetic Resonance Imaging Anatomy of the Lumbar Paravertebral Region 519
Lumbar Paravertebral Sonography 522Ultrasound Scan Technique 522Clinical Pearls 538References 541
INDEX 544
562

563
Related Documents