ATLASATLASATLASATLASA TLASATLASATLASATLASAT LASATLASATLASATLASATL ASATLASATLASATLASATLA SATLASATLASATLASATLAS ATLASATLASATLASATLASA TLASATLASATLASATLASAT LASATLASATLASATLASATL ASATLASATLASATLASATLA SATLASATLASATLASATLAS ATLASATLASATLASATLASA TLASATLASATLASATLASAT LASATLASATLASATLASATL ASATLASATLASATLASATLA ATLASATLASATLASATLASA TLASATLASATLASATLASAT LASATLASATLASATLASATL ASATLASATLASATLASATLA SATLASATLASATLASATLAS ATLASATLASATLASATLASA TLASATLASATLASATLASAT LASATLASATLASATLASATL ASATLASATLASATLASATLA SATLASATLASATLASATLAS ATLASATLASATLASATLASA TLASATLASATLASATLASAT LASATLASATLASATLASATL ASATLASATLASATLASATLA TRIPLE - A in cooperation with Regional Development and Poverty Reduction Program - RDPRP ATLAS M A I N R E P O R T 31 M A R CH 2005 F I N A L Bantul Regency BANTUL REGENCY

Atlas Kabupaten Bantul
Nov 07, 2014
Atlas Kabupaten Bantul adalah subuah buku tentang profil dan potensi Kabupaten bantul, dilengkapi dengan peta dan data
Welcome message from author
This document is posted to help you gain knowledge. Please leave a comment to let me know what you think about it! Share it to your friends and learn new things together.
Transcript
ATLASATLASATLASATLASATLASATLASATLASATLASATLASATLASATLASATLASATLASATLASATLASATLASATLASATLASATLASATLASATLASATLASATLASATLASATLASATLASATLASATLASATLASATLASATLASATLASATLASATLASATLASATLASATLASATLASATLASATLASATLASATLASATLASATLASATLASATLASATLASATLASATLASATLASATLASATLASATLASATLASATLASATLASATLASATLASATLA
ATLASATLASATLASATLASATLASATLASATLASATLASATLASATLASATLASATLASATLASATLASATLASATLASATLASATLASATLASATLASATLASATLASATLASATLASATLASATLASATLASATLASATLASATLASATLASATLASATLASATLASATLASATLASATLASATLASATLASATLASATLASATLASATLASATLASATLASATLASATLASATLASATLASATLASATLASATLASATLASATLASATLASATLASATLASATLASATLATRIPLE - A
in cooperation with Regional Development and Poverty Reduction Program - RDPRP
ATLAS
M A I N R E P O R T3 1 M A R C H 2 0 0 5
F I N A L
Bantul Regency
BANTUL REGENCY
TRIPLE - Ain cooperation with
Regional Development and Poverty Reduction Program - RDPRP
ATLAS
M A I N R E P O R T3 1 M A R C H 2 0 0 5
F I N A L
Bantul Regency
BANTUL REGENCY
Main Report ATLAS Bantul Regency
Triple-A TABLE OF CONTENTS
TABLE OF CONTENTS
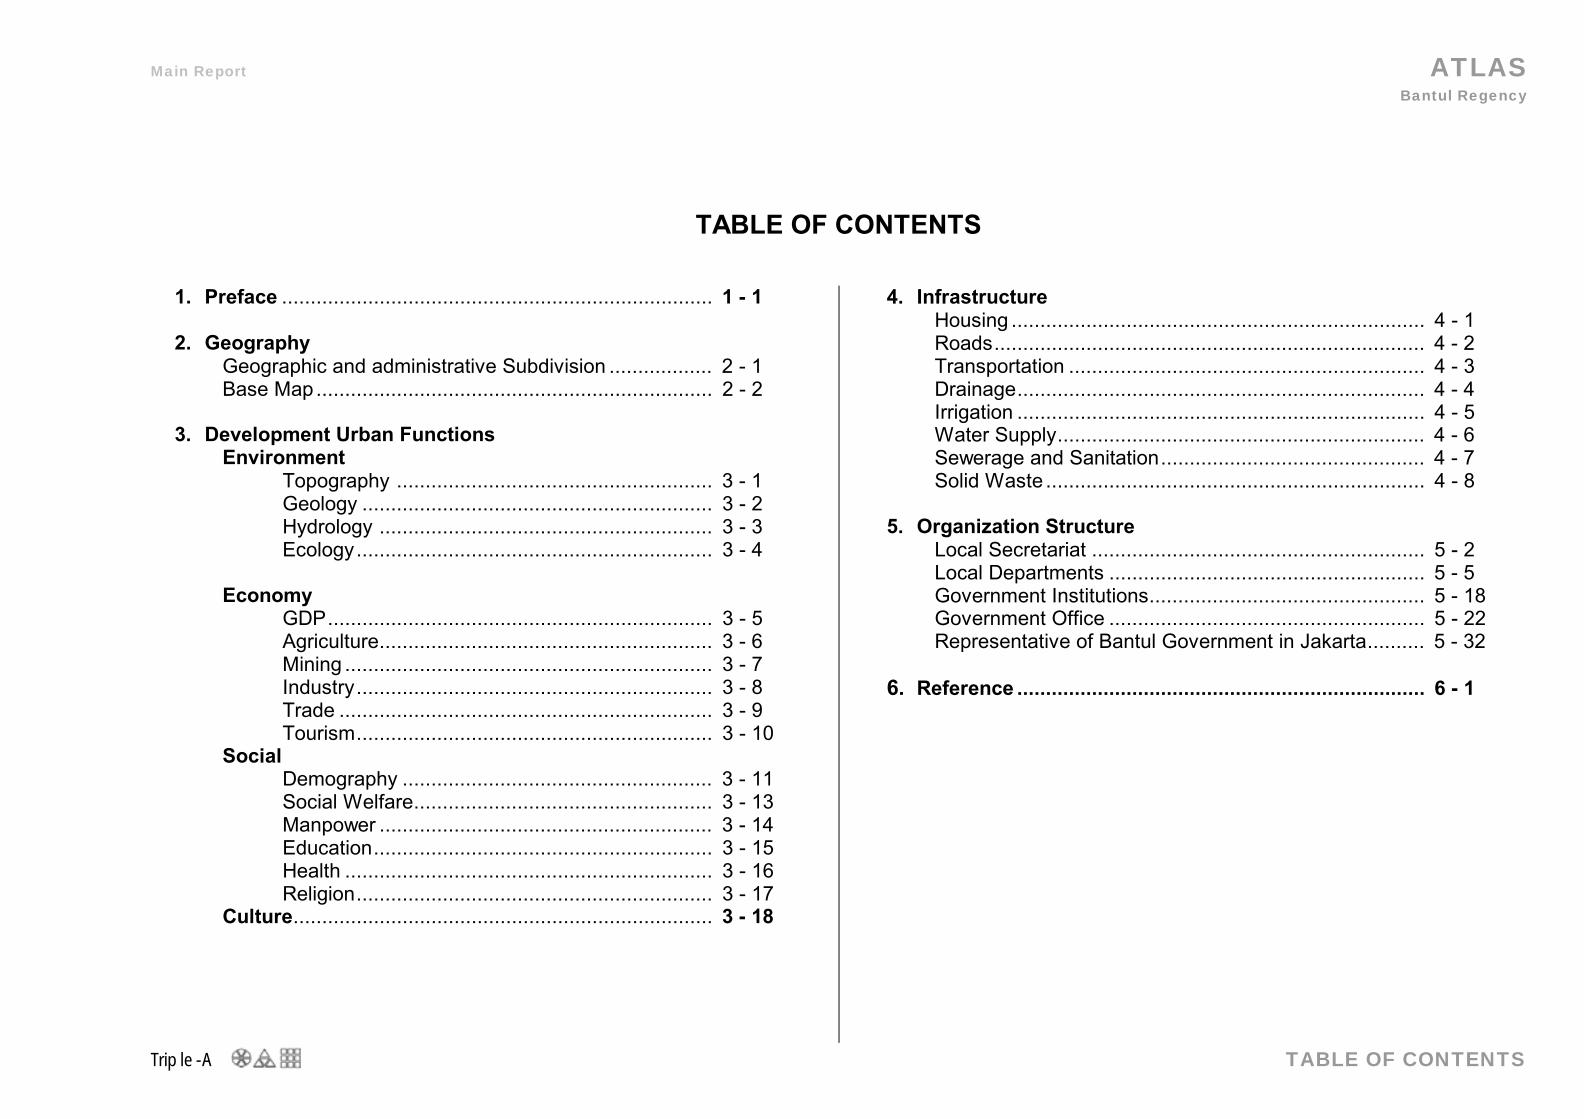
1. Preface ........................................................................... 1 - 1 2. Geography
Geographic and administrative Subdivision .................. 2 - 1 Base Map..................................................................... 2 - 2
3. Development Urban Functions
Environment Topography ....................................................... 3 - 1 Geology ............................................................. 3 - 2 Hydrology .......................................................... 3 - 3 Ecology.............................................................. 3 - 4
Economy GDP................................................................... 3 - 5 Agriculture.......................................................... 3 - 6 Mining ................................................................ 3 - 7 Industry.............................................................. 3 - 8 Trade ................................................................. 3 - 9 Tourism.............................................................. 3 - 10
Social Demography ...................................................... 3 - 11 Social Welfare.................................................... 3 - 13 Manpower .......................................................... 3 - 14 Education........................................................... 3 - 15 Health ................................................................ 3 - 16 Religion.............................................................. 3 - 17
Culture......................................................................... 3 - 18
4. Infrastructure Housing ........................................................................ 4 - 1 Roads........................................................................... 4 - 2 Transportation .............................................................. 4 - 3 Drainage....................................................................... 4 - 4 Irrigation ....................................................................... 4 - 5 Water Supply................................................................ 4 - 6 Sewerage and Sanitation.............................................. 4 - 7 Solid Waste .................................................................. 4 - 8
5. Organization Structure Local Secretariat .......................................................... 5 - 2 Local Departments ....................................................... 5 - 5 Government Institutions................................................ 5 - 18 Government Office ....................................................... 5 - 22 Representative of Bantul Government in Jakarta.......... 5 - 32
6. Reference ....................................................................... 6 - 1
ATLAS Bantul Regency
Triple-A PREFACE 1 – 1
Main Report
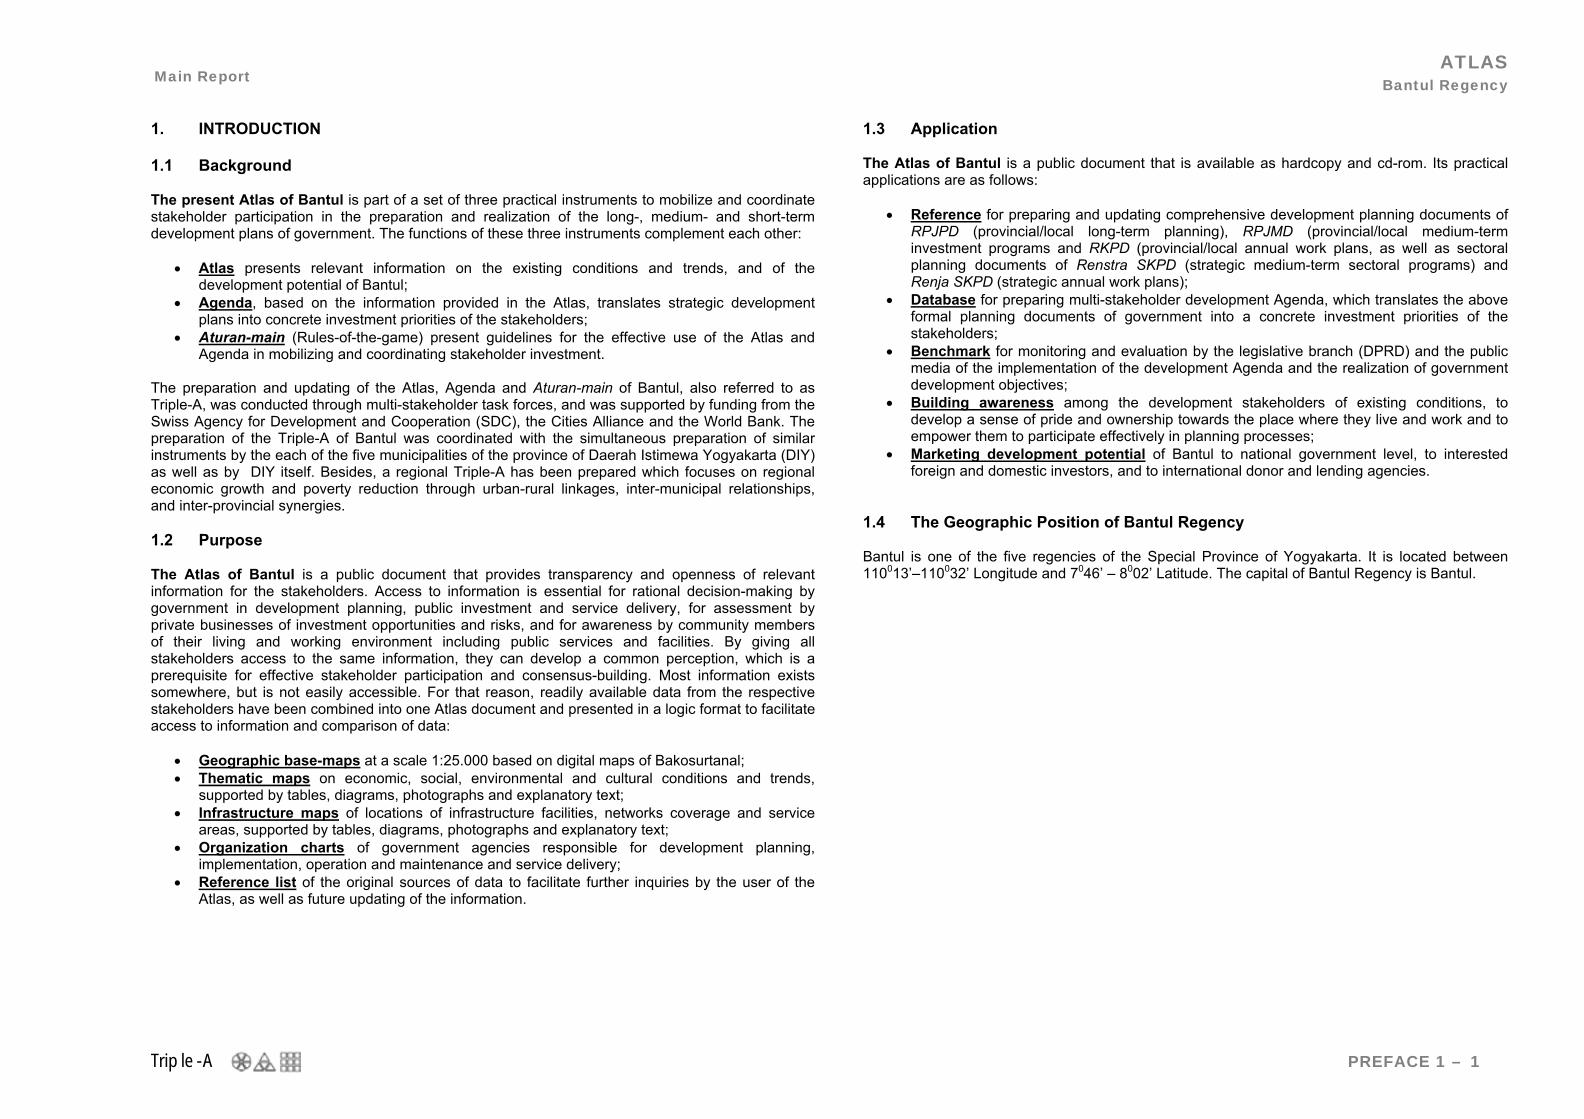
1. INTRODUCTION 1.1 Background The present Atlas of Bantul is part of a set of three practical instruments to mobilize and coordinate stakeholder participation in the preparation and realization of the long-, medium- and short-term development plans of government. The functions of these three instruments complement each other:
• Atlas presents relevant information on the existing conditions and trends, and of the development potential of Bantul;
• Agenda, based on the information provided in the Atlas, translates strategic development plans into concrete investment priorities of the stakeholders;
• Aturan-main (Rules-of-the-game) present guidelines for the effective use of the Atlas and Agenda in mobilizing and coordinating stakeholder investment.
The preparation and updating of the Atlas, Agenda and Aturan-main of Bantul, also referred to as Triple-A, was conducted through multi-stakeholder task forces, and was supported by funding from the Swiss Agency for Development and Cooperation (SDC), the Cities Alliance and the World Bank. The preparation of the Triple-A of Bantul was coordinated with the simultaneous preparation of similar instruments by the each of the five municipalities of the province of Daerah Istimewa Yogyakarta (DIY) as well as by DIY itself. Besides, a regional Triple-A has been prepared which focuses on regional economic growth and poverty reduction through urban-rural linkages, inter-municipal relationships, and inter-provincial synergies. 1.2 Purpose The Atlas of Bantul is a public document that provides transparency and openness of relevant information for the stakeholders. Access to information is essential for rational decision-making by government in development planning, public investment and service delivery, for assessment by private businesses of investment opportunities and risks, and for awareness by community members of their living and working environment including public services and facilities. By giving all stakeholders access to the same information, they can develop a common perception, which is a prerequisite for effective stakeholder participation and consensus-building. Most information exists somewhere, but is not easily accessible. For that reason, readily available data from the respective stakeholders have been combined into one Atlas document and presented in a logic format to facilitate access to information and comparison of data:
• Geographic base-maps at a scale 1:25.000 based on digital maps of Bakosurtanal; • Thematic maps on economic, social, environmental and cultural conditions and trends,
supported by tables, diagrams, photographs and explanatory text; • Infrastructure maps of locations of infrastructure facilities, networks coverage and service
areas, supported by tables, diagrams, photographs and explanatory text; • Organization charts of government agencies responsible for development planning,
implementation, operation and maintenance and service delivery; • Reference list of the original sources of data to facilitate further inquiries by the user of the
Atlas, as well as future updating of the information.
1.3 Application The Atlas of Bantul is a public document that is available as hardcopy and cd-rom. Its practical applications are as follows:
• Reference for preparing and updating comprehensive development planning documents of RPJPD (provincial/local long-term planning), RPJMD (provincial/local medium-term investment programs and RKPD (provincial/local annual work plans, as well as sectoral planning documents of Renstra SKPD (strategic medium-term sectoral programs) and Renja SKPD (strategic annual work plans);
• Database for preparing multi-stakeholder development Agenda, which translates the above formal planning documents of government into a concrete investment priorities of the stakeholders;
• Benchmark for monitoring and evaluation by the legislative branch (DPRD) and the public media of the implementation of the development Agenda and the realization of government development objectives;
• Building awareness among the development stakeholders of existing conditions, to develop a sense of pride and ownership towards the place where they live and work and to empower them to participate effectively in planning processes;
• Marketing development potential of Bantul to national government level, to interested foreign and domestic investors, and to international donor and lending agencies.
1.4 The Geographic Position of Bantul Regency Bantul is one of the five regencies of the Special Province of Yogyakarta. It is located between 110013’–110032’ Longitude and 7046’ – 8002’ Latitude. The capital of Bantul Regency is Bantul.
Main Report ATLAS Bantul Regency
GEOGRAPHY Triple – A Basemap 2 - 1
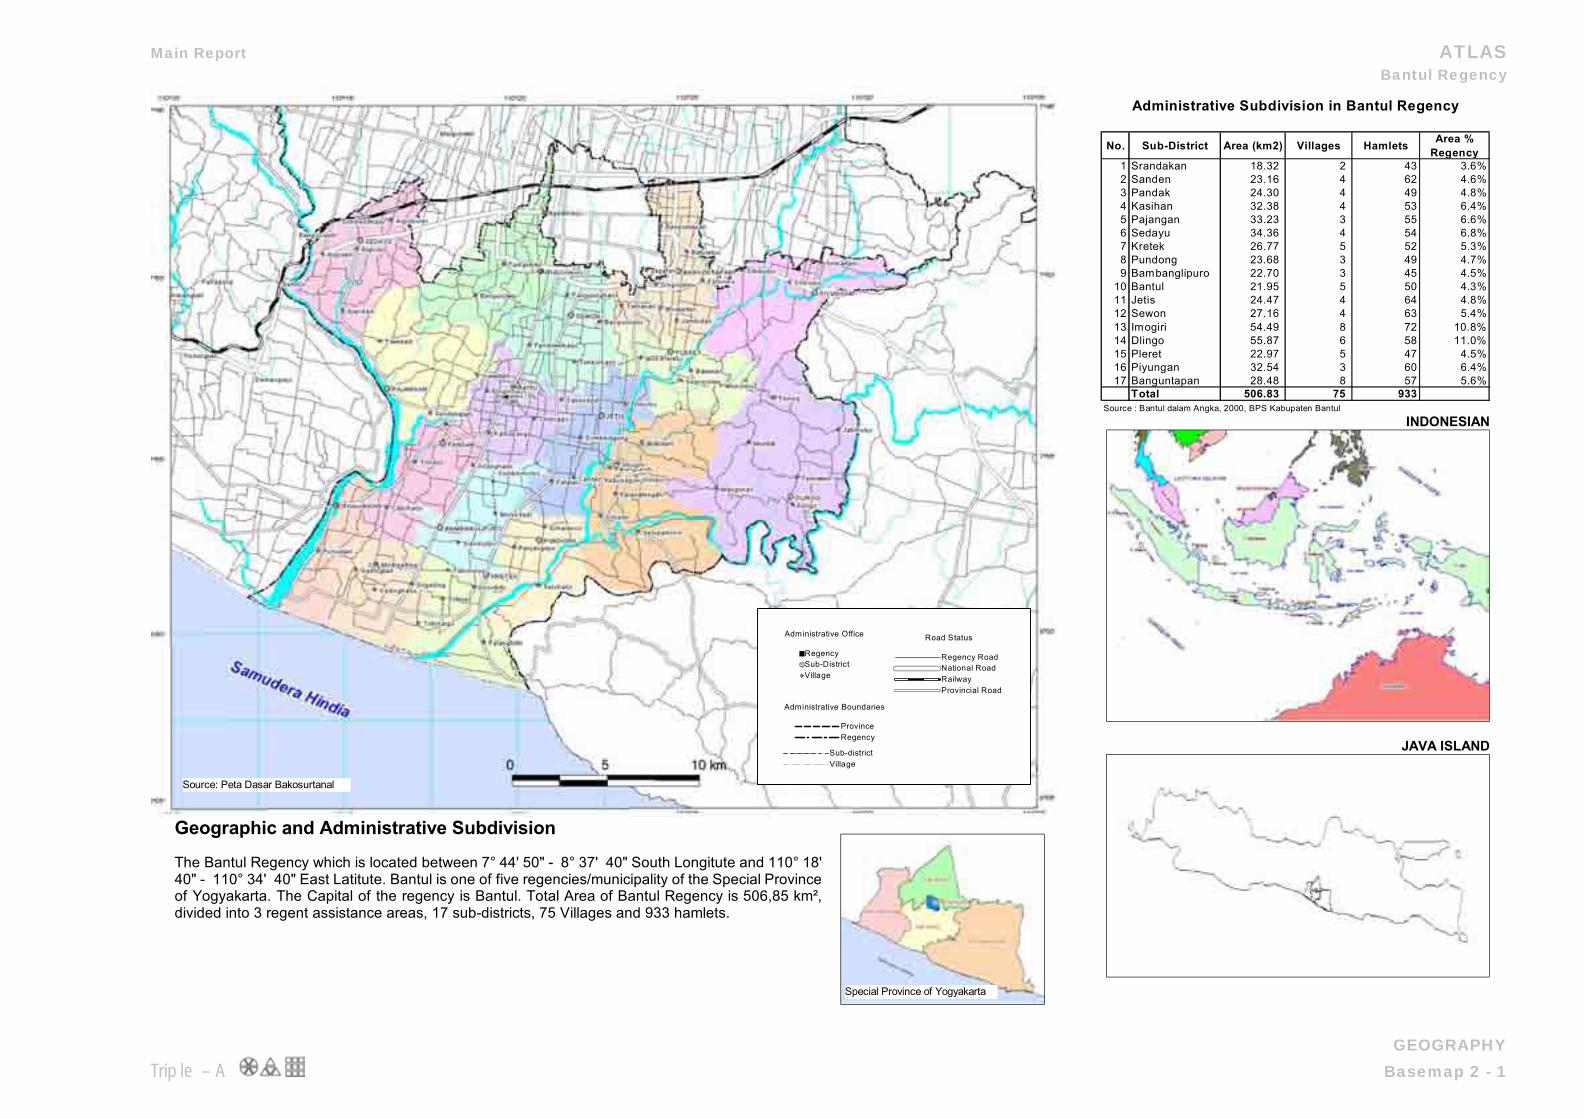
Geographic and Administrative Subdivision The Bantul Regency which is located between 7° 44' 50" - 8° 37' 40" South Longitute and 110° 18' 40" - 110° 34' 40" East Latitute. Bantul is one of five regencies/municipality of the Special Province of Yogyakarta. The Capital of the regency is Bantul. Total Area of Bantul Regency is 506,85 km², divided into 3 regent assistance areas, 17 sub-districts, 75 Villages and 933 hamlets.
No. Sub-District Area (km2) Villages Hamlets Area % Regency
1 Srandakan 18.32 2 43 3.6%2 Sanden 23.16 4 62 4.6%3 Pandak 24.30 4 49 4.8%4 Kasihan 32.38 4 53 6.4%5 Pajangan 33.23 3 55 6.6%6 Sedayu 34.36 4 54 6.8%7 Kretek 26.77 5 52 5.3%8 Pundong 23.68 3 49 4.7%9 Bambanglipuro 22.70 3 45 4.5%
10 Bantul 21.95 5 50 4.3%11 Jetis 24.47 4 64 4.8%12 Sewon 27.16 4 63 5.4%13 Imogiri 54.49 8 72 10.8%14 Dlingo 55.87 6 58 11.0%15 Pleret 22.97 5 47 4.5%16 Piyungan 32.54 3 60 6.4%17 Banguntapan 28.48 8 57 5.6%
Total 506.83 75 933Source : Bantul dalam Angka, 2000, BPS Kabupaten Bantul
Administrative Subdivision in Bantul Regency
INDONESIAN
JAVA ISLAND
Road Status
Regency RoadNational RoadRailwayProvincial Road
Administrative Boundaries
ProvinceRegency
Administrative Office
RegencySub-DistrictVillage
Sub-districtVillage
Source: Peta Dasar Bakosurtanal
Special Province of Yogyakarta
Main Report/Laporan Utama ATLAS Bantul Regency
1:50 000
0 1250m
Administrative Office/ Kantor Administratif
Governor / GubernurRegency / KabupatenSub-district / KecamatanVillage / Kelurahan
Administrative Boundaries/ Batas AdministratifProvincial Boundary / Batas PropinsiRegency Boundary / Batas KabupatenSub-district Boundary / Batas KecamatanVillage Boundary / Batas Kelurahan
Landuse / Tata Guna Lahan
��������
Water Inland / Sungai, Waduk
��������
��������Bush / Semak - Semak��������
Plantation / Perkebunan
��������
��������Build-Up Area / Permukiman��������
Grass Land / Padang Rumput��������
Rice Field Irrigated / Sawah Irigasi
��������
��������Rice Field Rainfed / Sawah Hujan����
Dry Land / Tegalan
Elevation / Elevasi50m Contour / Kontur 50m12,5m Contour / Kontur 12,5m
Type of Road / Kewenangan JalanRailway / PerumkaNational Road / Jalan NasionalProvincial Road / Jalan PropinsiKabupaten Road / Jalan KabupatenLocal Road / Jalan Lokal
Projection UTM zone 49( Ellipsoid WGS 84 )
500
Legend/Legenda :
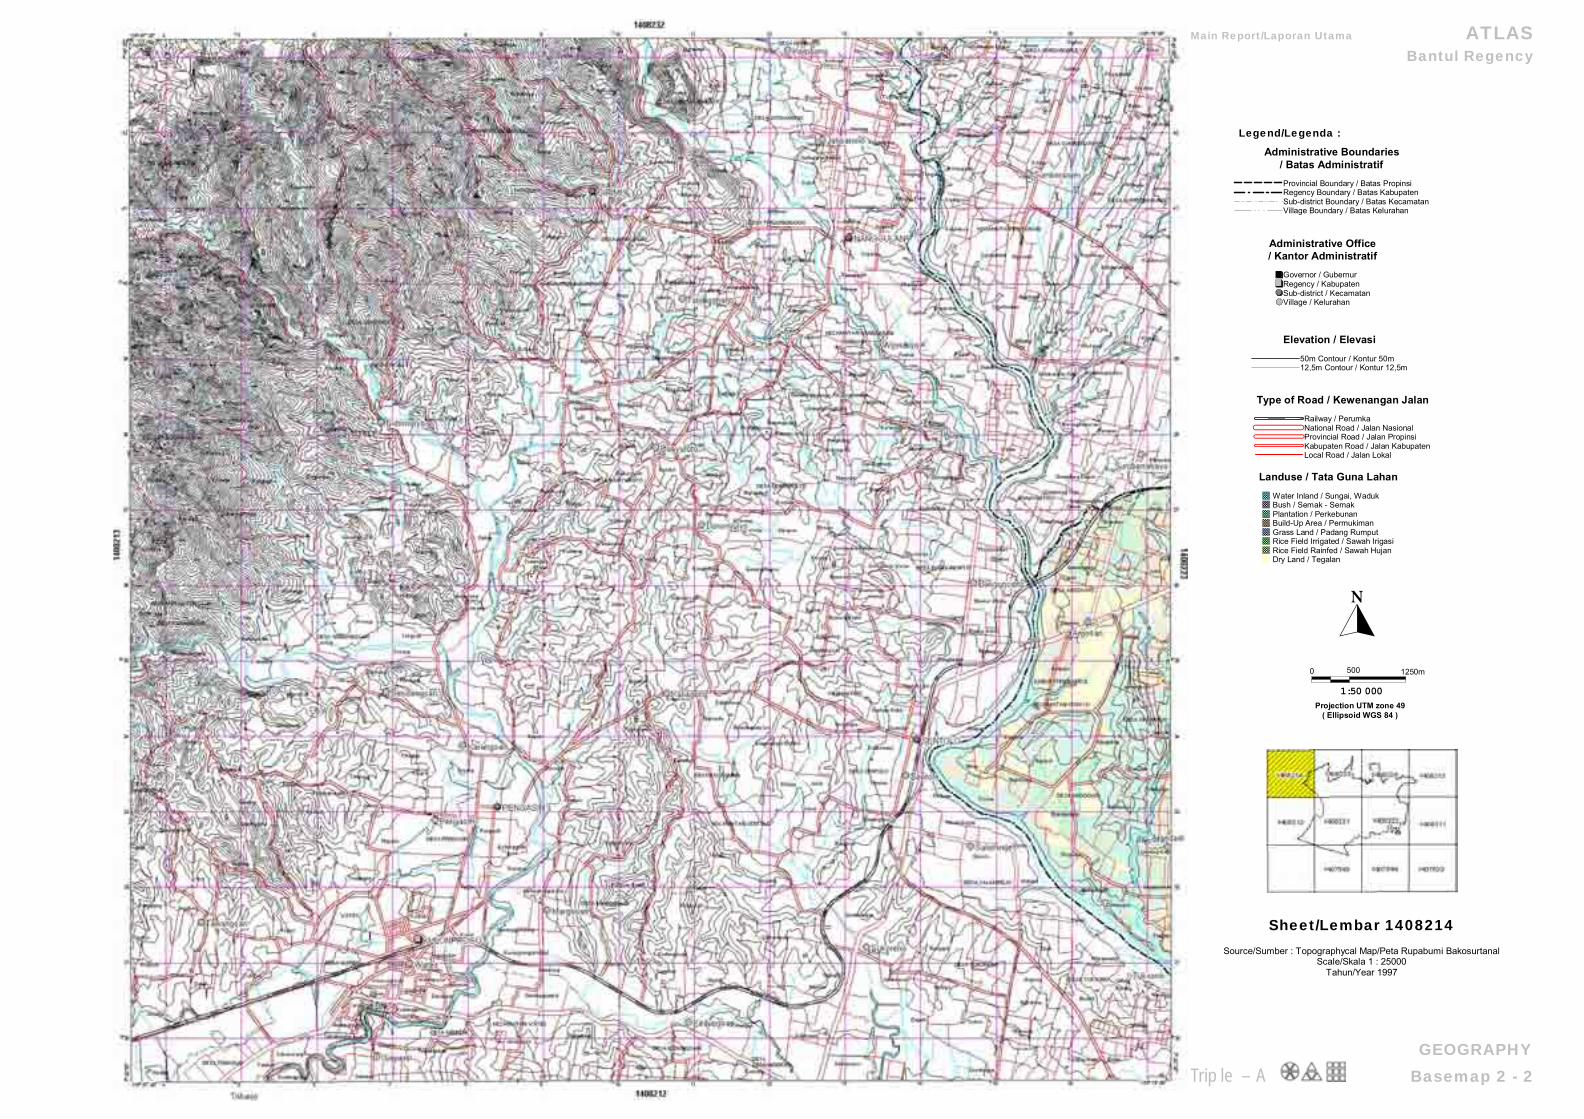
Sheet/Lembar 1408214
Source/Sumber : Topographycal Map/Peta Rupabumi Bakosurtanal Scale/Skala 1 : 25000
Tahun/Year 1997
GEOGRAPHYTriple – A Basemap 2 - 2
Main Report/Laporan Utama ATLAS Bantul Regency
1:50 000
0 1250m
Administrative Office/ Kantor Administratif
Governor / GubernurRegency / KabupatenSub-district / KecamatanVillage / Kelurahan
Administrative Boundaries/ Batas AdministratifProvincial Boundary / Batas PropinsiRegency Boundary / Batas KabupatenSub-district Boundary / Batas KecamatanVillage Boundary / Batas Kelurahan
Landuse / Tata Guna Lahan
��������
Water Inland / Sungai, Waduk
��������
��������Bush / Semak - Semak��������
Plantation / Perkebunan
��������
��������Build-Up Area / Permukiman��������
Grass Land / Padang Rumput��������
Rice Field Irrigated / Sawah Irigasi
��������
��������Rice Field Rainfed / Sawah Hujan����
Dry Land / Tegalan
Elevation / Elevasi50m Contour / Kontur 50m12,5m Contour / Kontur 12,5m
Type of Road / Kewenangan JalanRailway / PerumkaNational Road / Jalan NasionalProvincial Road / Jalan PropinsiKabupaten Road / Jalan KabupatenLocal Road / Jalan Lokal
Projection UTM zone 49( Ellipsoid WGS 84 )
500
Legend/Legenda :
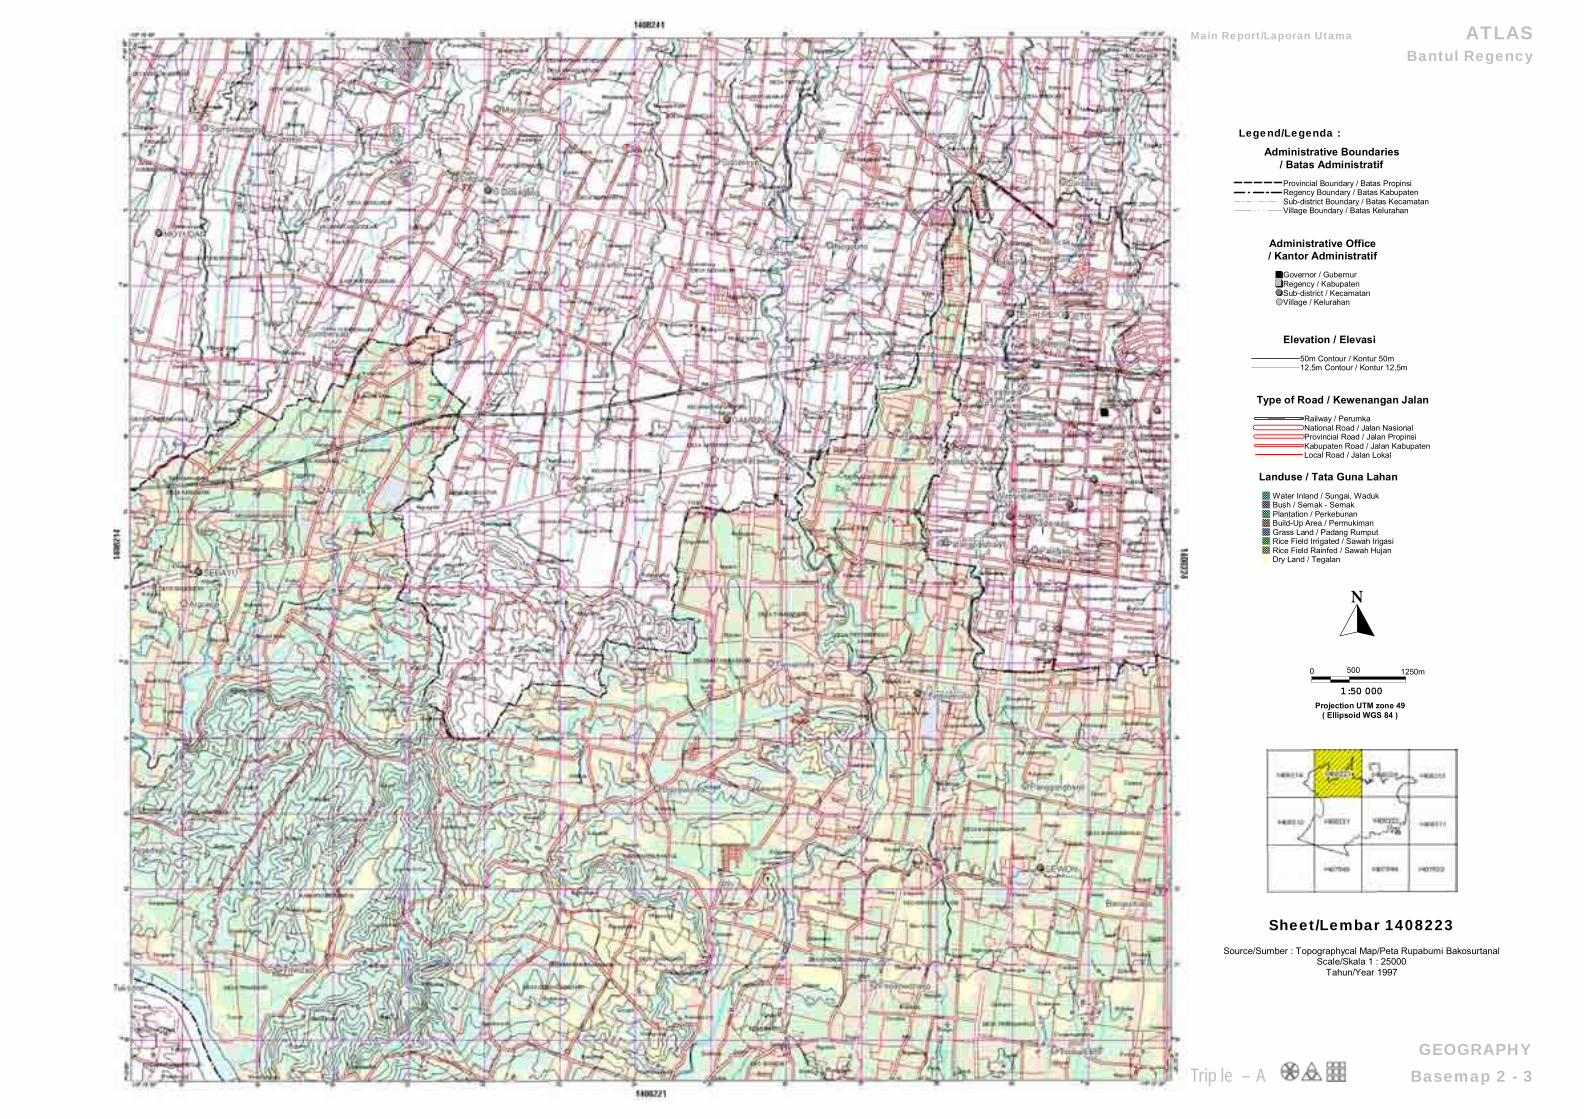
Sheet/Lembar 1408223
Source/Sumber : Topographycal Map/Peta Rupabumi Bakosurtanal Scale/Skala 1 : 25000
Tahun/Year 1997
GEOGRAPHYTriple – A Basemap 2 - 3
Main Report/Laporan Utama ATLAS Bantul Regency
1:50 000
0 1250m
Administrative Office/ Kantor Administratif
Governor / GubernurRegency / KabupatenSub-district / KecamatanVillage / Kelurahan
Administrative Boundaries/ Batas AdministratifProvincial Boundary / Batas PropinsiRegency Boundary / Batas KabupatenSub-district Boundary / Batas KecamatanVillage Boundary / Batas Kelurahan
Landuse / Tata Guna Lahan
��������
Water Inland / Sungai, Waduk
��������
��������Bush / Semak - Semak��������
Plantation / Perkebunan
��������
��������Build-Up Area / Permukiman��������
Grass Land / Padang Rumput��������
Rice Field Irrigated / Sawah Irigasi
��������
��������Rice Field Rainfed / Sawah Hujan����
Dry Land / Tegalan
Elevation / Elevasi50m Contour / Kontur 50m12,5m Contour / Kontur 12,5m
Type of Road / Kewenangan JalanRailway / PerumkaNational Road / Jalan NasionalProvincial Road / Jalan PropinsiKabupaten Road / Jalan KabupatenLocal Road / Jalan Lokal
Projection UTM zone 49( Ellipsoid WGS 84 )
500
Legend/Legenda :
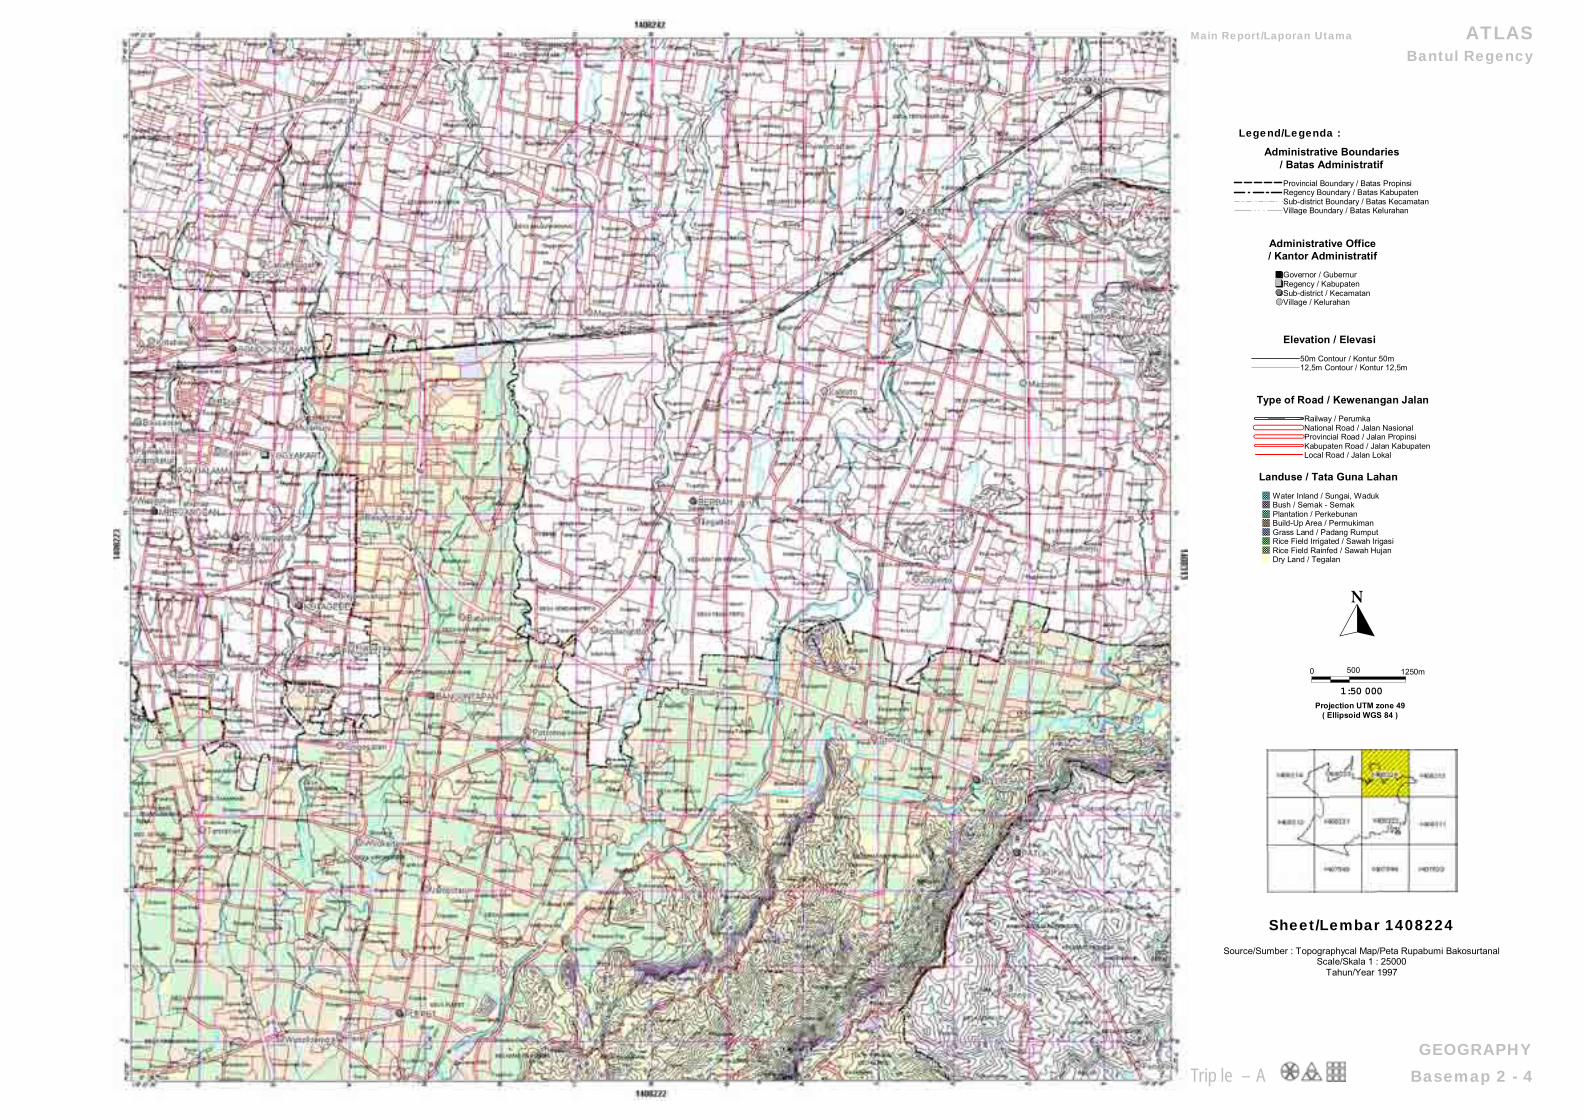
Sheet/Lembar 1408224
Source/Sumber : Topographycal Map/Peta Rupabumi Bakosurtanal Scale/Skala 1 : 25000
Tahun/Year 1997
GEOGRAPHYTriple – A Basemap 2 - 4
Main Report/Laporan Utama ATLAS Bantul Regency
1:50 000
0 1250m
Administrative Office/ Kantor Administratif
Governor / GubernurRegency / KabupatenSub-district / KecamatanVillage / Kelurahan
Administrative Boundaries/ Batas AdministratifProvincial Boundary / Batas PropinsiRegency Boundary / Batas KabupatenSub-district Boundary / Batas KecamatanVillage Boundary / Batas Kelurahan
Landuse / Tata Guna Lahan
��������
Water Inland / Sungai, Waduk
��������
��������Bush / Semak - Semak��������
Plantation / Perkebunan
��������
��������Build-Up Area / Permukiman��������
Grass Land / Padang Rumput��������
Rice Field Irrigated / Sawah Irigasi
��������
��������Rice Field Rainfed / Sawah Hujan����
Dry Land / Tegalan
Elevation / Elevasi50m Contour / Kontur 50m12,5m Contour / Kontur 12,5m
Type of Road / Kewenangan JalanRailway / PerumkaNational Road / Jalan NasionalProvincial Road / Jalan PropinsiKabupaten Road / Jalan KabupatenLocal Road / Jalan Lokal
Projection UTM zone 49( Ellipsoid WGS 84 )
500
Legend/Legenda :
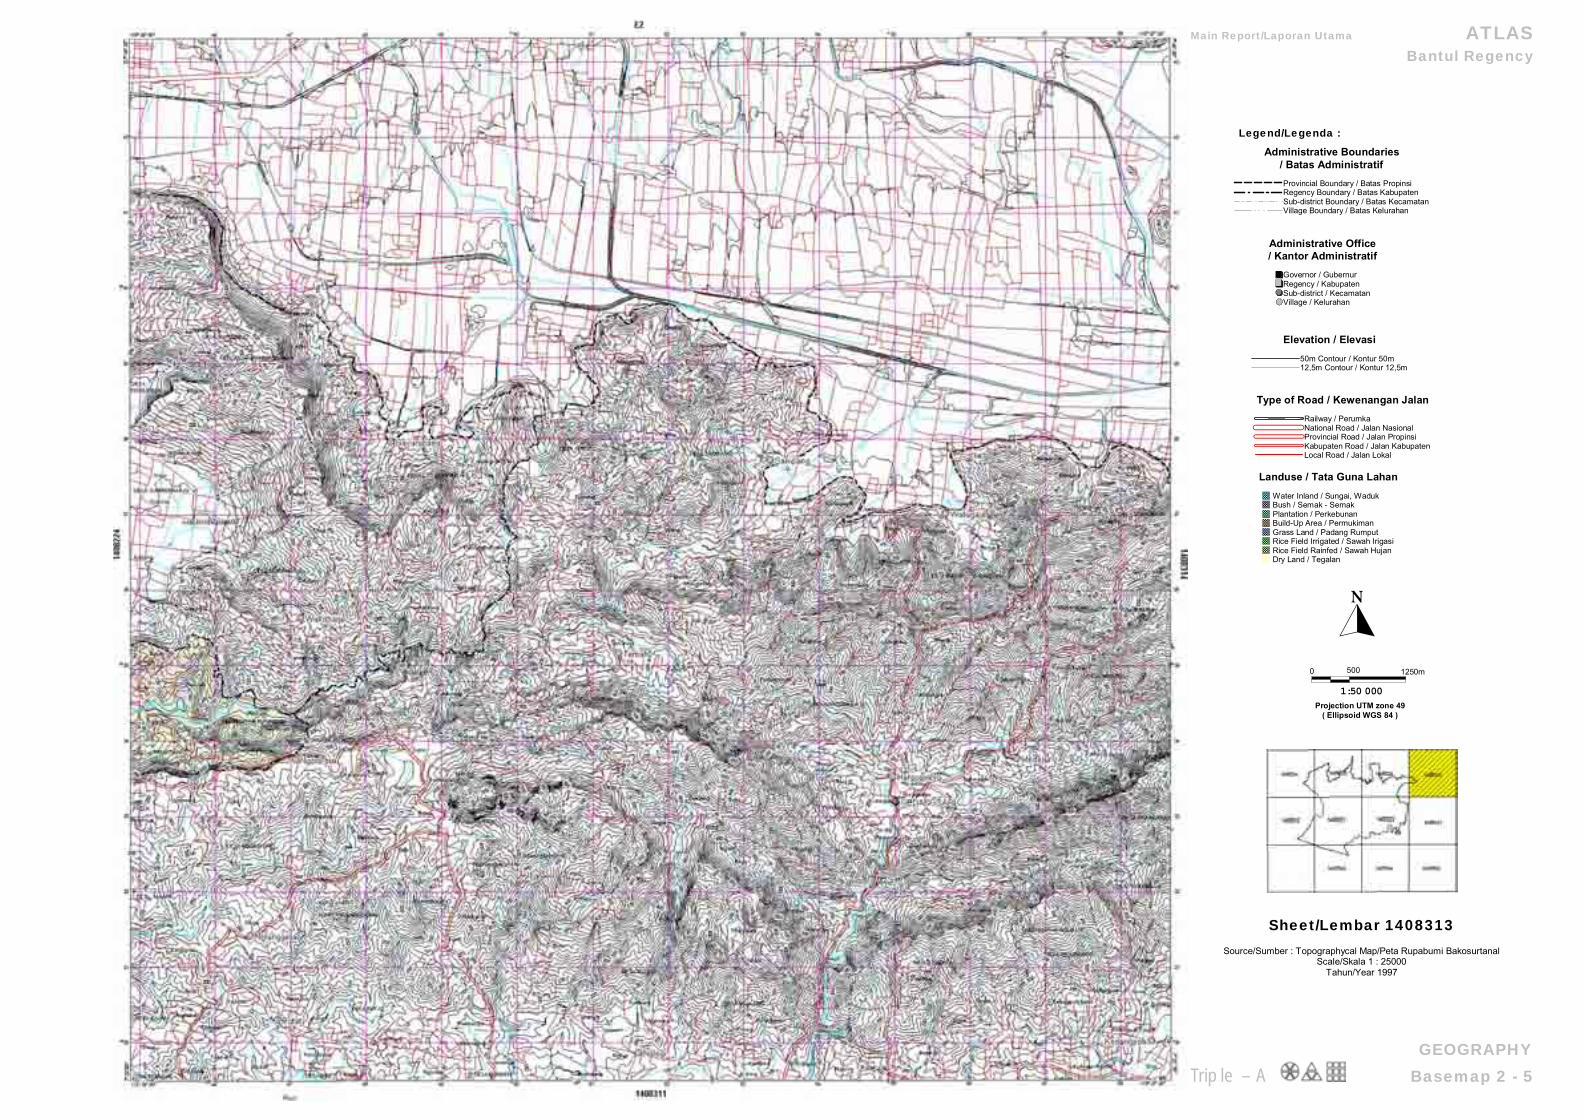
Sheet/Lembar 1408313
Source/Sumber : Topographycal Map/Peta Rupabumi Bakosurtanal Scale/Skala 1 : 25000
Tahun/Year 1997
GEOGRAPHYTriple – A Basemap 2 - 5
Main Report/Laporan Utama ATLAS Bantul Regency
1:50 000
0 1250m
Administrative Office/ Kantor Administratif
Governor / GubernurRegency / KabupatenSub-district / KecamatanVillage / Kelurahan
Administrative Boundaries/ Batas AdministratifProvincial Boundary / Batas PropinsiRegency Boundary / Batas KabupatenSub-district Boundary / Batas KecamatanVillage Boundary / Batas Kelurahan
Landuse / Tata Guna Lahan
��������
Water Inland / Sungai, Waduk
��������
��������Bush / Semak - Semak��������
Plantation / Perkebunan
��������
��������Build-Up Area / Permukiman��������
Grass Land / Padang Rumput��������
Rice Field Irrigated / Sawah Irigasi
��������
��������Rice Field Rainfed / Sawah Hujan����
Dry Land / Tegalan
Elevation / Elevasi50m Contour / Kontur 50m12,5m Contour / Kontur 12,5m
Type of Road / Kewenangan JalanRailway / PerumkaNational Road / Jalan NasionalProvincial Road / Jalan PropinsiKabupaten Road / Jalan KabupatenLocal Road / Jalan Lokal
Projection UTM zone 49( Ellipsoid WGS 84 )
500
Legend/Legenda :
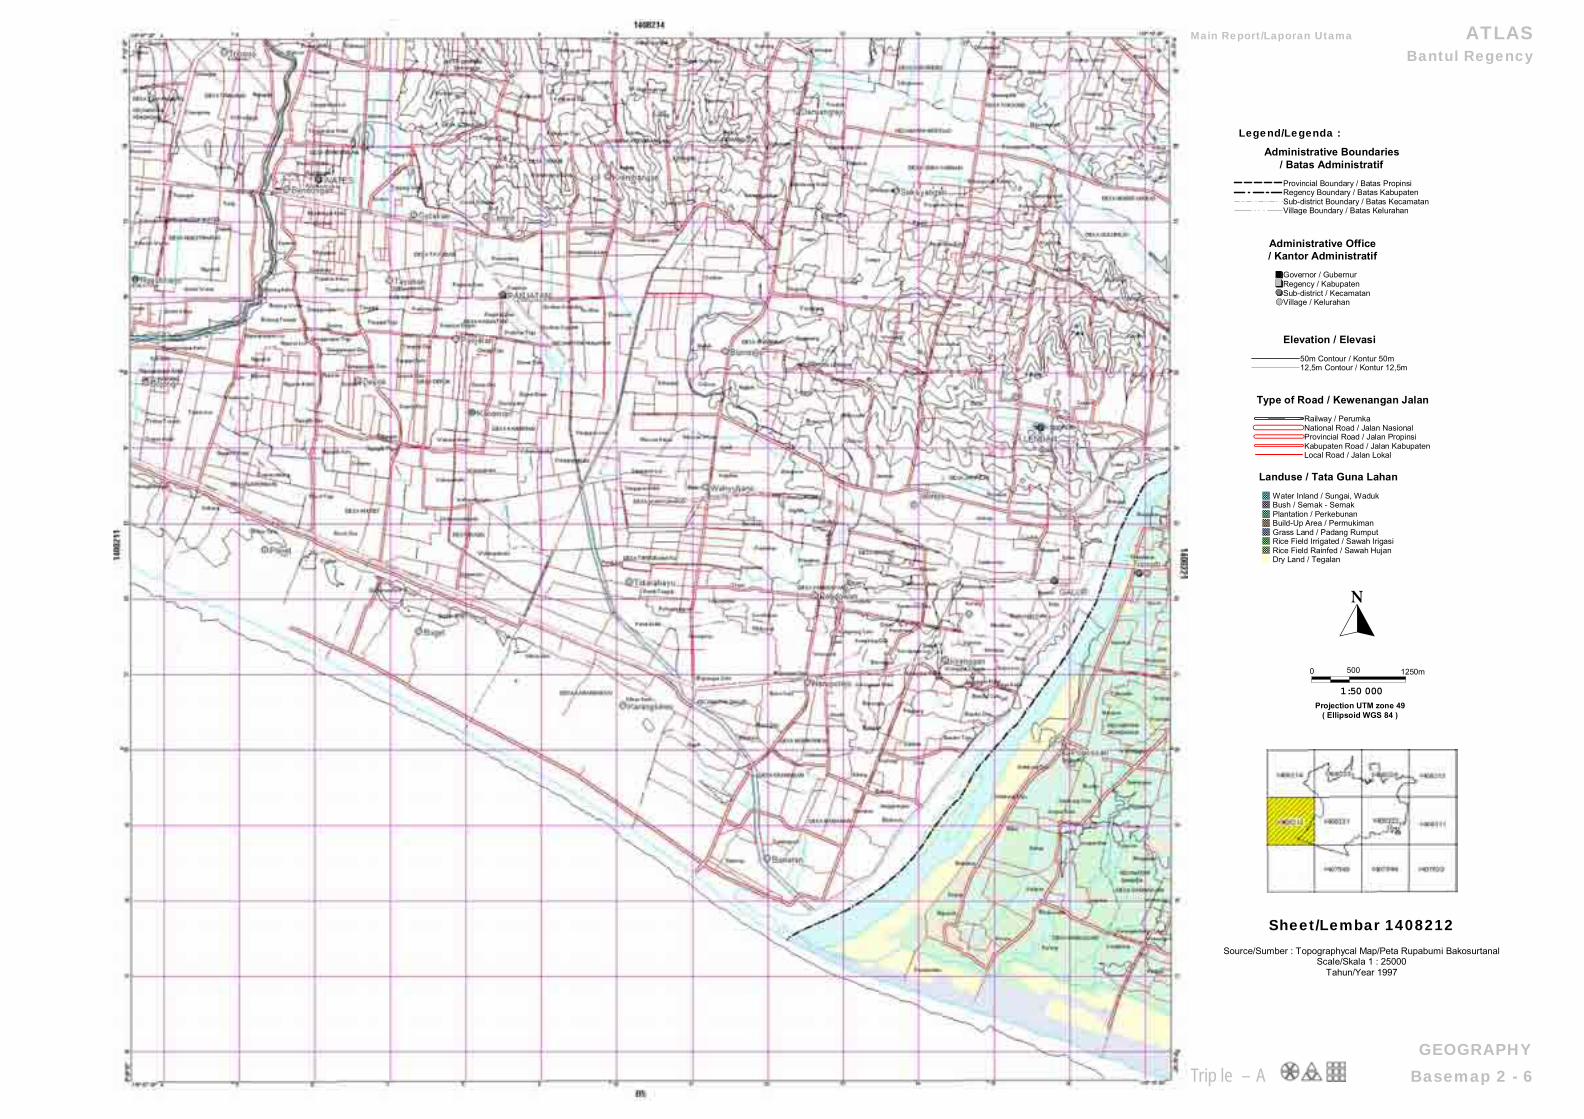
Sheet/Lembar 1408212
Source/Sumber : Topographycal Map/Peta Rupabumi Bakosurtanal Scale/Skala 1 : 25000
Tahun/Year 1997
GEOGRAPHYTriple – A Basemap 2 - 6
Main Report/Laporan Utama ATLAS Bantul Regency
1:50 000
0 1250m
Administrative Office/ Kantor Administratif
Governor / GubernurRegency / KabupatenSub-district / KecamatanVillage / Kelurahan
Administrative Boundaries/ Batas AdministratifProvincial Boundary / Batas PropinsiRegency Boundary / Batas KabupatenSub-district Boundary / Batas KecamatanVillage Boundary / Batas Kelurahan
Landuse / Tata Guna Lahan
��������
Water Inland / Sungai, Waduk
��������
��������Bush / Semak - Semak��������
Plantation / Perkebunan
��������
��������Build-Up Area / Permukiman��������
Grass Land / Padang Rumput��������
Rice Field Irrigated / Sawah Irigasi
��������
��������Rice Field Rainfed / Sawah Hujan����
Dry Land / Tegalan
Elevation / Elevasi50m Contour / Kontur 50m12,5m Contour / Kontur 12,5m
Type of Road / Kewenangan JalanRailway / PerumkaNational Road / Jalan NasionalProvincial Road / Jalan PropinsiKabupaten Road / Jalan KabupatenLocal Road / Jalan Lokal
Projection UTM zone 49( Ellipsoid WGS 84 )
500
Legend/Legenda :
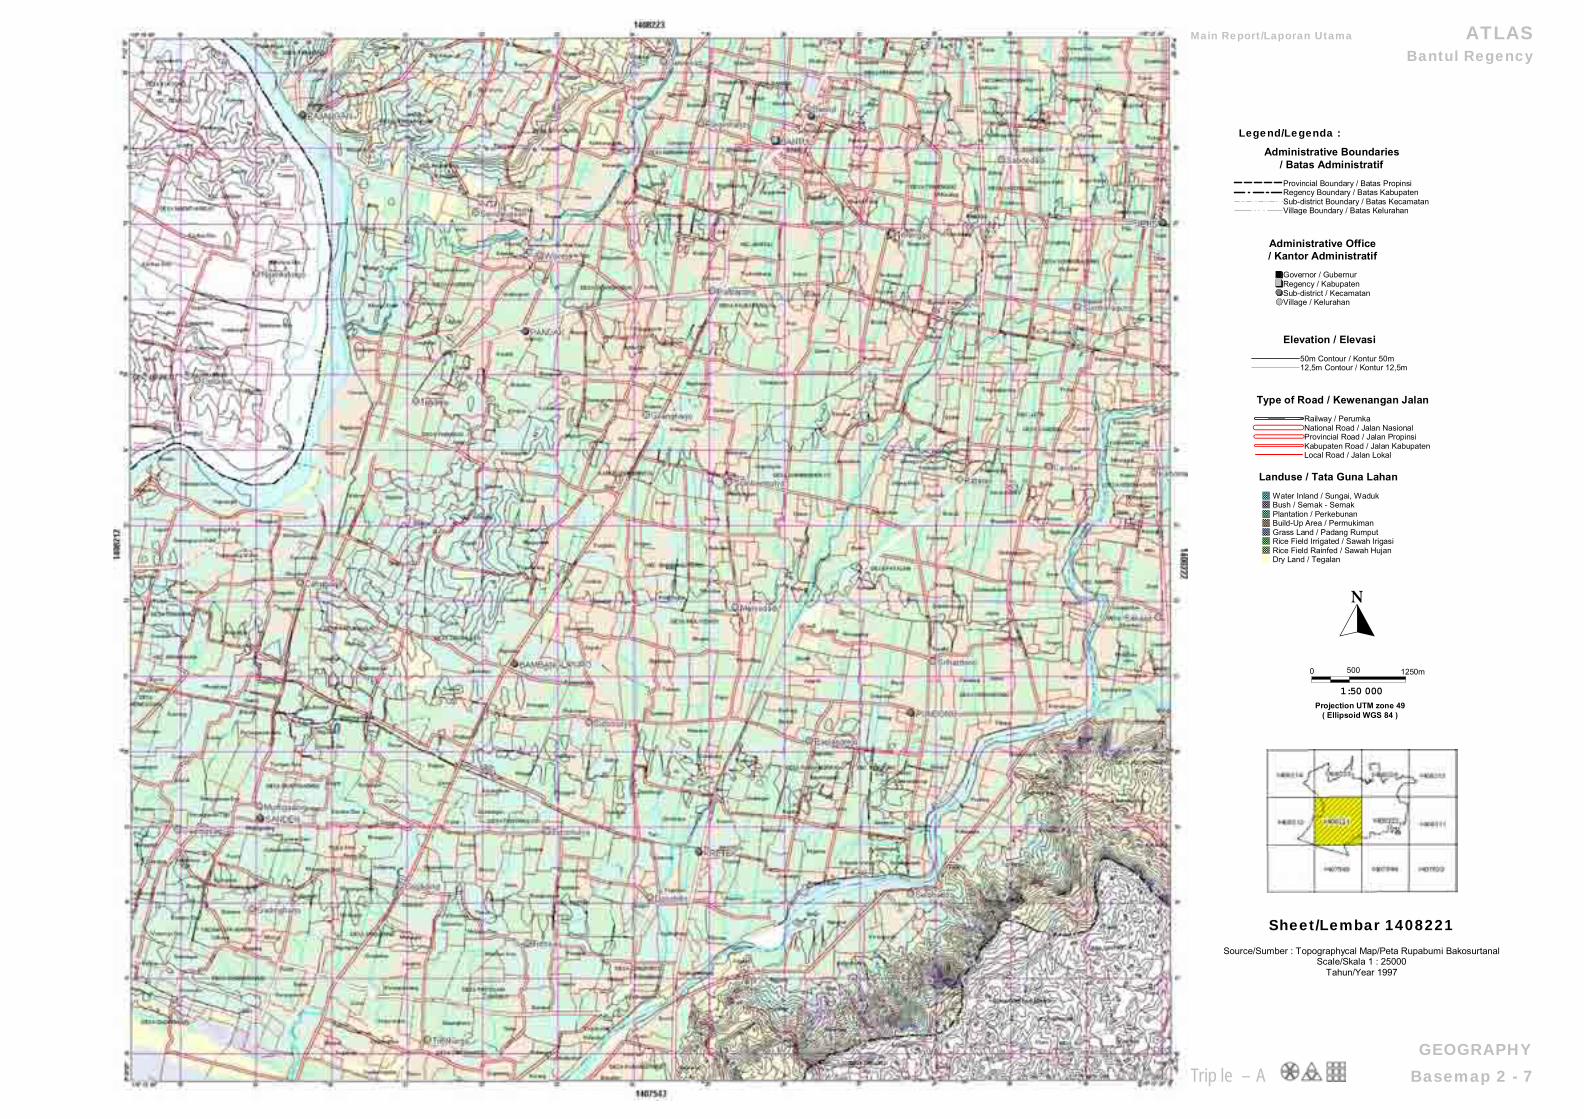
Sheet/Lembar 1408221
Source/Sumber : Topographycal Map/Peta Rupabumi Bakosurtanal Scale/Skala 1 : 25000
Tahun/Year 1997
GEOGRAPHYTriple – A Basemap 2 - 7
Main Report/Laporan Utama ATLAS Bantul Regency
1:50 000
0 1250m
Administrative Office/ Kantor Administratif
Governor / GubernurRegency / KabupatenSub-district / KecamatanVillage / Kelurahan
Administrative Boundaries/ Batas AdministratifProvincial Boundary / Batas PropinsiRegency Boundary / Batas KabupatenSub-district Boundary / Batas KecamatanVillage Boundary / Batas Kelurahan
Landuse / Tata Guna Lahan
��������
Water Inland / Sungai, Waduk
��������
��������Bush / Semak - Semak��������
Plantation / Perkebunan
��������
��������Build-Up Area / Permukiman��������
Grass Land / Padang Rumput��������
Rice Field Irrigated / Sawah Irigasi
��������
��������Rice Field Rainfed / Sawah Hujan����
Dry Land / Tegalan
Elevation / Elevasi50m Contour / Kontur 50m12,5m Contour / Kontur 12,5m
Type of Road / Kewenangan JalanRailway / PerumkaNational Road / Jalan NasionalProvincial Road / Jalan PropinsiKabupaten Road / Jalan KabupatenLocal Road / Jalan Lokal
Projection UTM zone 49( Ellipsoid WGS 84 )
500
Legend/Legenda :
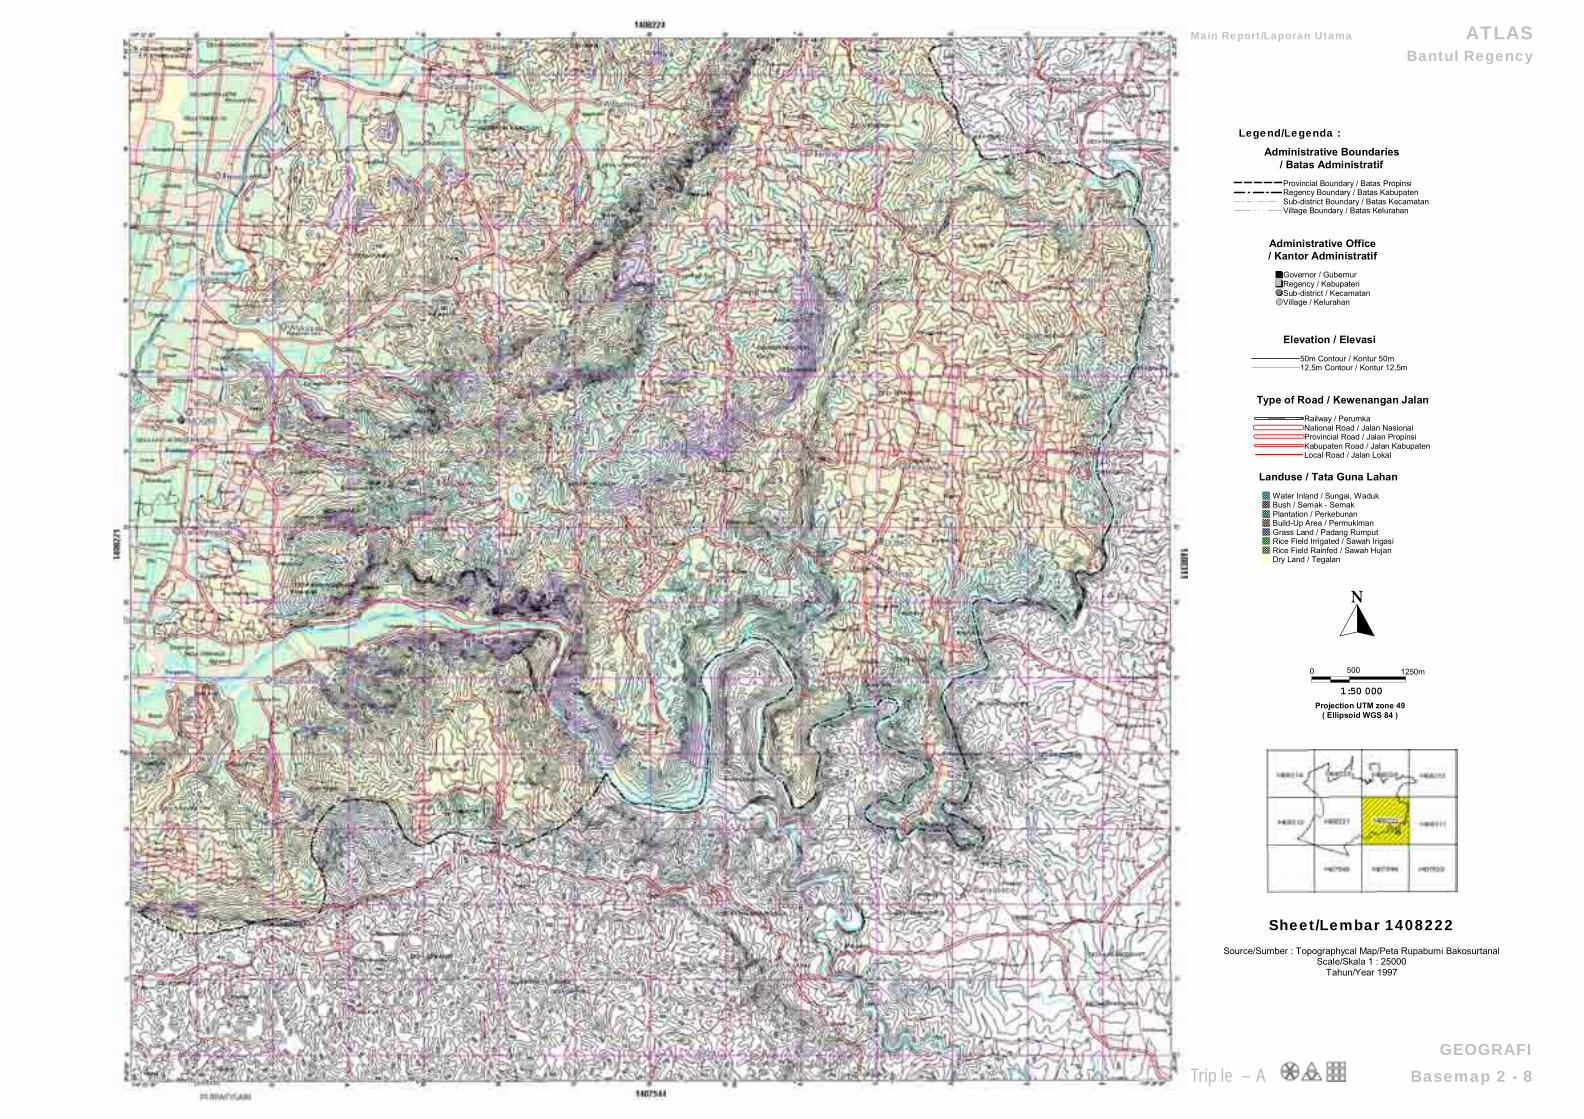
Sheet/Lembar 1408222
Source/Sumber : Topographycal Map/Peta Rupabumi Bakosurtanal Scale/Skala 1 : 25000
Tahun/Year 1997
GEOGRAFITriple – A Basemap 2 - 8
Main Report/Laporan Utama ATLAS Bantul Regency
1:50 000
0 1250m
Administrative Office/ Kantor Administratif
Governor / GubernurRegency / KabupatenSub-district / KecamatanVillage / Kelurahan
Administrative Boundaries/ Batas AdministratifProvincial Boundary / Batas PropinsiRegency Boundary / Batas KabupatenSub-district Boundary / Batas KecamatanVillage Boundary / Batas Kelurahan
Landuse / Tata Guna Lahan
��������
Water Inland / Sungai, Waduk
��������
��������Bush / Semak - Semak��������
Plantation / Perkebunan
��������
��������Build-Up Area / Permukiman��������
Grass Land / Padang Rumput��������
Rice Field Irrigated / Sawah Irigasi
��������
��������Rice Field Rainfed / Sawah Hujan����
Dry Land / Tegalan
Elevation / Elevasi50m Contour / Kontur 50m12,5m Contour / Kontur 12,5m
Type of Road / Kewenangan JalanRailway / PerumkaNational Road / Jalan NasionalProvincial Road / Jalan PropinsiKabupaten Road / Jalan KabupatenLocal Road / Jalan Lokal
Projection UTM zone 49( Ellipsoid WGS 84 )
500
Legend/Legenda :
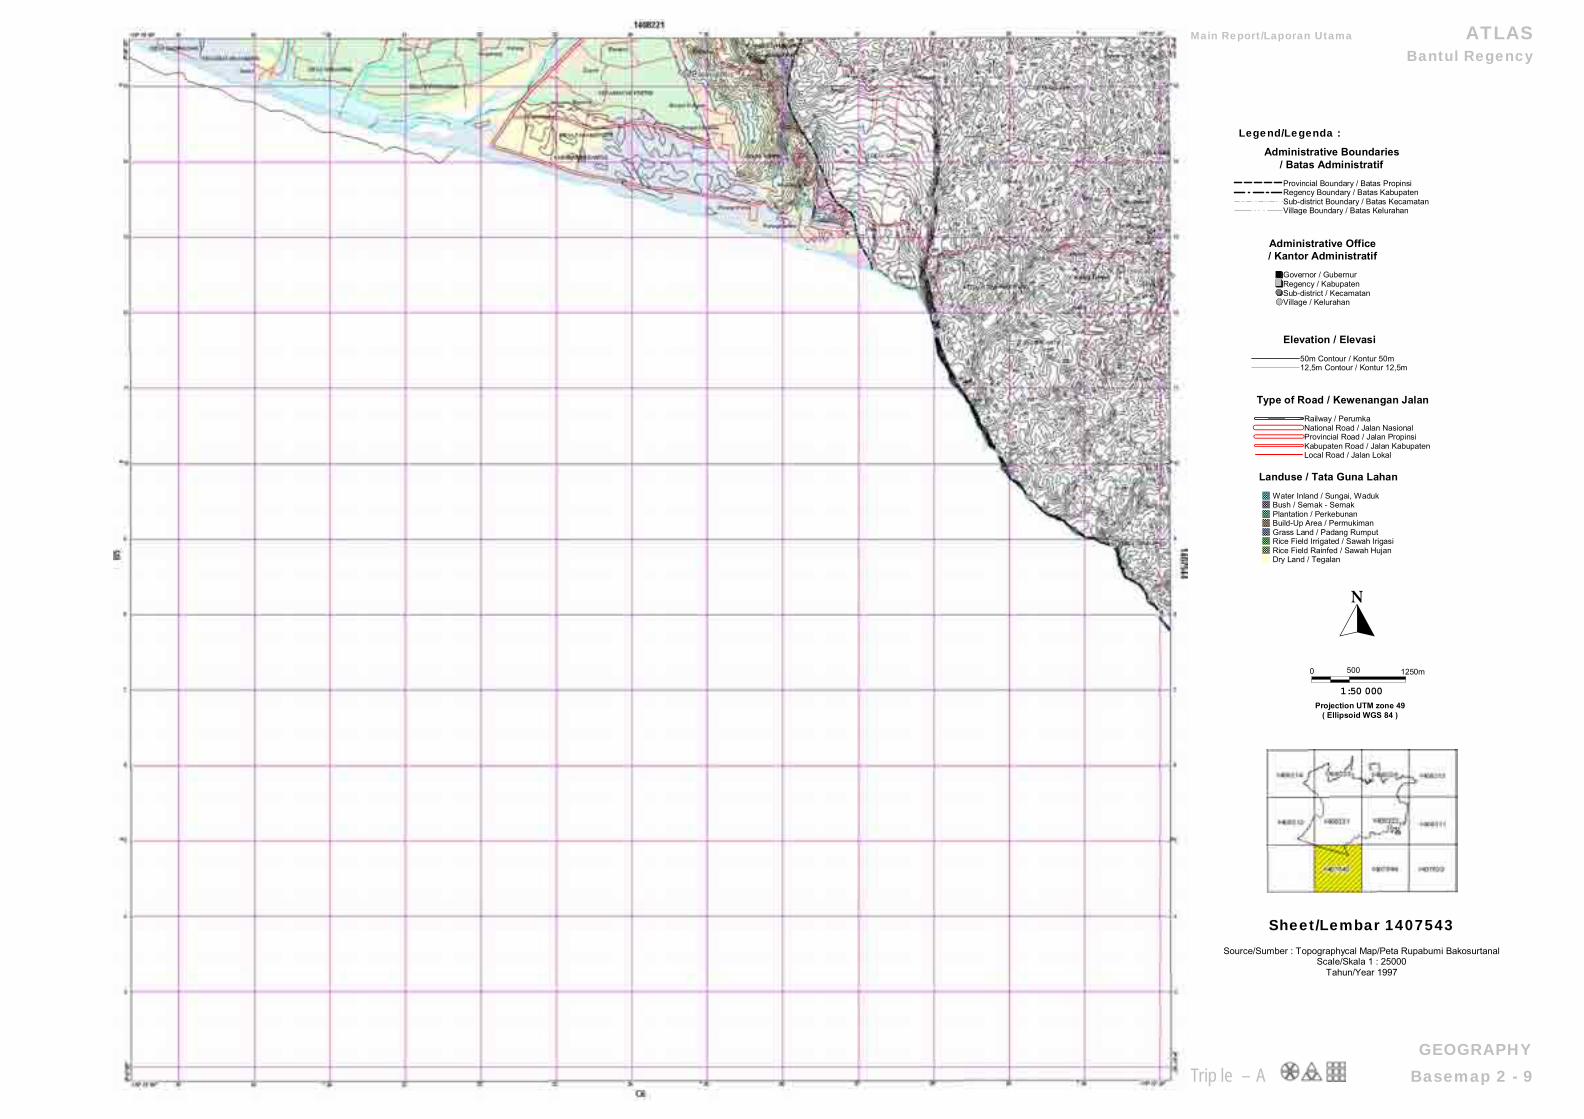
Sheet/Lembar 1407543
Source/Sumber : Topographycal Map/Peta Rupabumi Bakosurtanal Scale/Skala 1 : 25000
Tahun/Year 1997
GEOGRAPHYTriple – A Basemap 2 - 9
Main Report/Laporan Utama ATLAS Bantul Regency
1:50 000
0 1250m
Administrative Office/ Kantor Administratif
Governor / GubernurRegency / KabupatenSub-district / KecamatanVillage / Kelurahan
Administrative Boundaries/ Batas AdministratifProvincial Boundary / Batas PropinsiRegency Boundary / Batas KabupatenSub-district Boundary / Batas KecamatanVillage Boundary / Batas Kelurahan
Landuse / Tata Guna Lahan
��������
Water Inland / Sungai, Waduk
��������
��������Bush / Semak - Semak��������
Plantation / Perkebunan
��������
��������Build-Up Area / Permukiman��������
Grass Land / Padang Rumput��������
Rice Field Irrigated / Sawah Irigasi
��������
��������Rice Field Rainfed / Sawah Hujan����
Dry Land / Tegalan
Elevation / Elevasi50m Contour / Kontur 50m12,5m Contour / Kontur 12,5m
Type of Road / Kewenangan JalanRailway / PerumkaNational Road / Jalan NasionalProvincial Road / Jalan PropinsiKabupaten Road / Jalan KabupatenLocal Road / Jalan Lokal
Projection UTM zone 49( Ellipsoid WGS 84 )
500
Legend/Legenda :
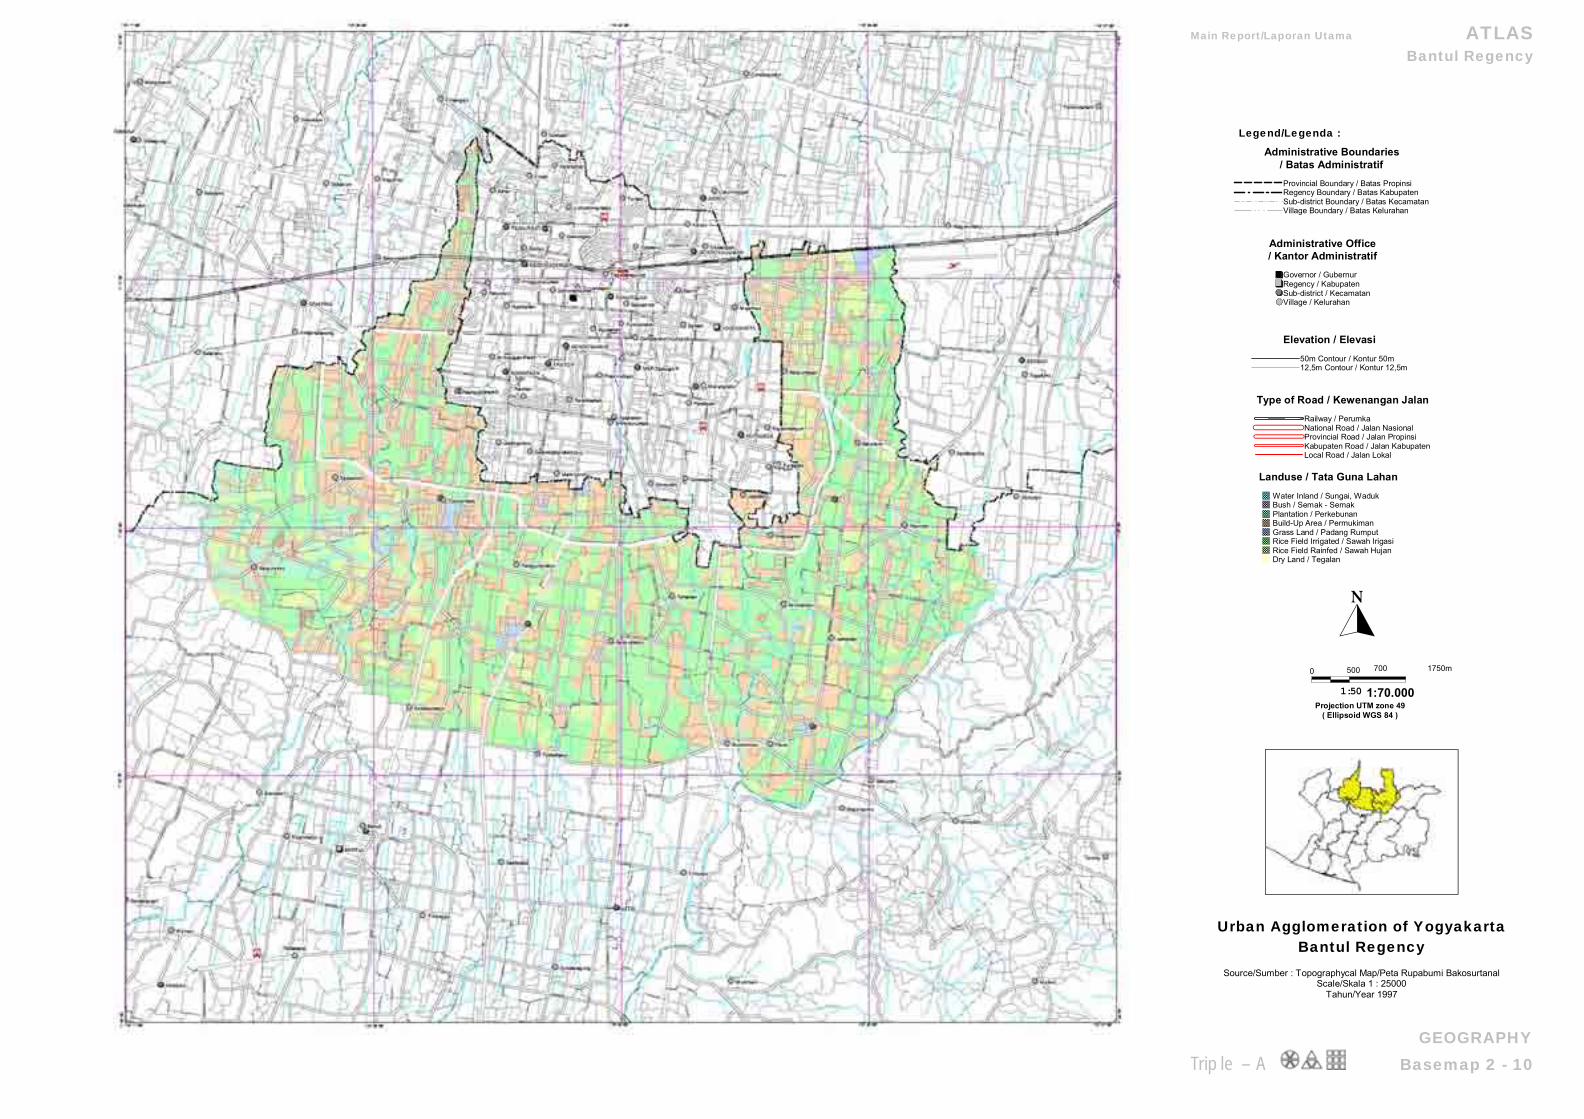
Urban Agglomeration of Yogyakarta Bantul Regency
Source/Sumber : Topographycal Map/Peta Rupabumi Bakosurtanal
Scale/Skala 1 : 25000 Tahun/Year 1997
GEOGRAPHY
Triple – A Basemap 2 - 10
1:70.000
700 1750m
Main Report ATLAS Bantul Regency
ENVIRONMENT Triple – A Topography 3 - 1
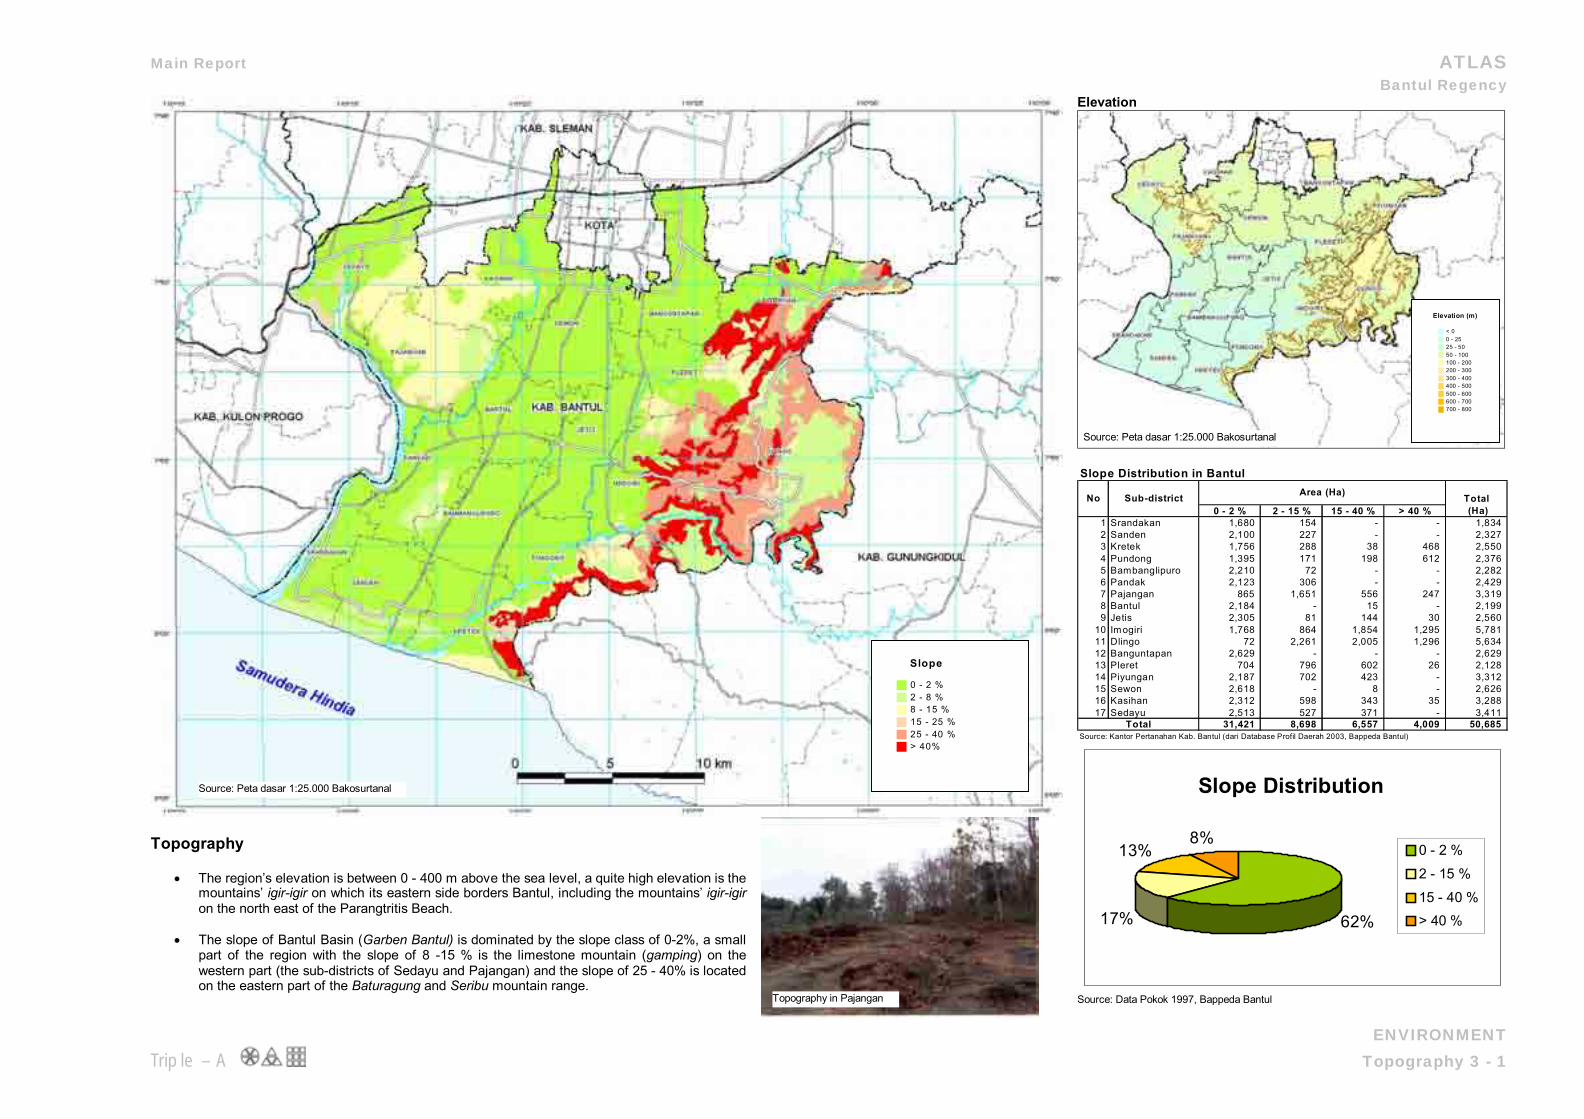
Topography
• The region’s elevation is between 0 - 400 m above the sea level, a quite high elevation is the mountains’ igir-igir on which its eastern side borders Bantul, including the mountains’ igir-igir on the north east of the Parangtritis Beach.
• The slope of Bantul Basin (Garben Bantul) is dominated by the slope class of 0-2%, a small
part of the region with the slope of 8 -15 % is the limestone mountain (gamping) on the western part (the sub-districts of Sedayu and Pajangan) and the slope of 25 - 40% is located on the eastern part of the Baturagung and Seribu mountain range.
Elevation
Slope Distribution in Bantul
0 - 2 % 2 - 15 % 15 - 40 % > 40 %1 Srandakan 1,680 154 - - 1,834 2 Sanden 2,100 227 - - 2,327 3 Kretek 1,756 288 38 468 2,550 4 Pundong 1,395 171 198 612 2,376 5 Bambanglipuro 2,210 72 - - 2,282 6 Pandak 2,123 306 - - 2,429 7 Pajangan 865 1,651 556 247 3,319 8 Bantul 2,184 - 15 - 2,199 9 Jetis 2,305 81 144 30 2,560
10 Imogiri 1,768 864 1,854 1,295 5,781 11 Dlingo 72 2,261 2,005 1,296 5,634 12 Banguntapan 2,629 - - - 2,629 13 Pleret 704 796 602 26 2,128 14 Piyungan 2,187 702 423 - 3,312 15 Sewon 2,618 - 8 - 2,626 16 Kasihan 2,312 598 343 35 3,288 17 Sedayu 2,513 527 371 - 3,411
31,421 8,698 6,557 4,009 50,685 Source: Kantor Pertanahan Kab. Bantul (dari Database Profil Daerah 2003, Bappeda Bantul)
Area (Ha) Total (Ha)
Total
No Sub-district
Slope Distribution
62%17%
13%8%
0 - 2 %2 - 15 %15 - 40 %> 40 %
Source: Data Pokok 1997, Bappeda Bantul
Elevation (m)
< 00 - 2525 - 5050 - 100100 - 200200 - 300300 - 400400 - 500500 - 600600 - 700700 - 800
Slope
0 - 2 %2 - 8 %8 - 15 %15 - 25 %25 - 40 %> 40%
Source: Peta dasar 1:25.000 Bakosurtanal
Source: Peta dasar 1:25.000 Bakosurtanal
Topography in Pajangan
Main Report ATLAS Bantul Regency
ENVIRONMENT Triple – A Geology 3 - 2
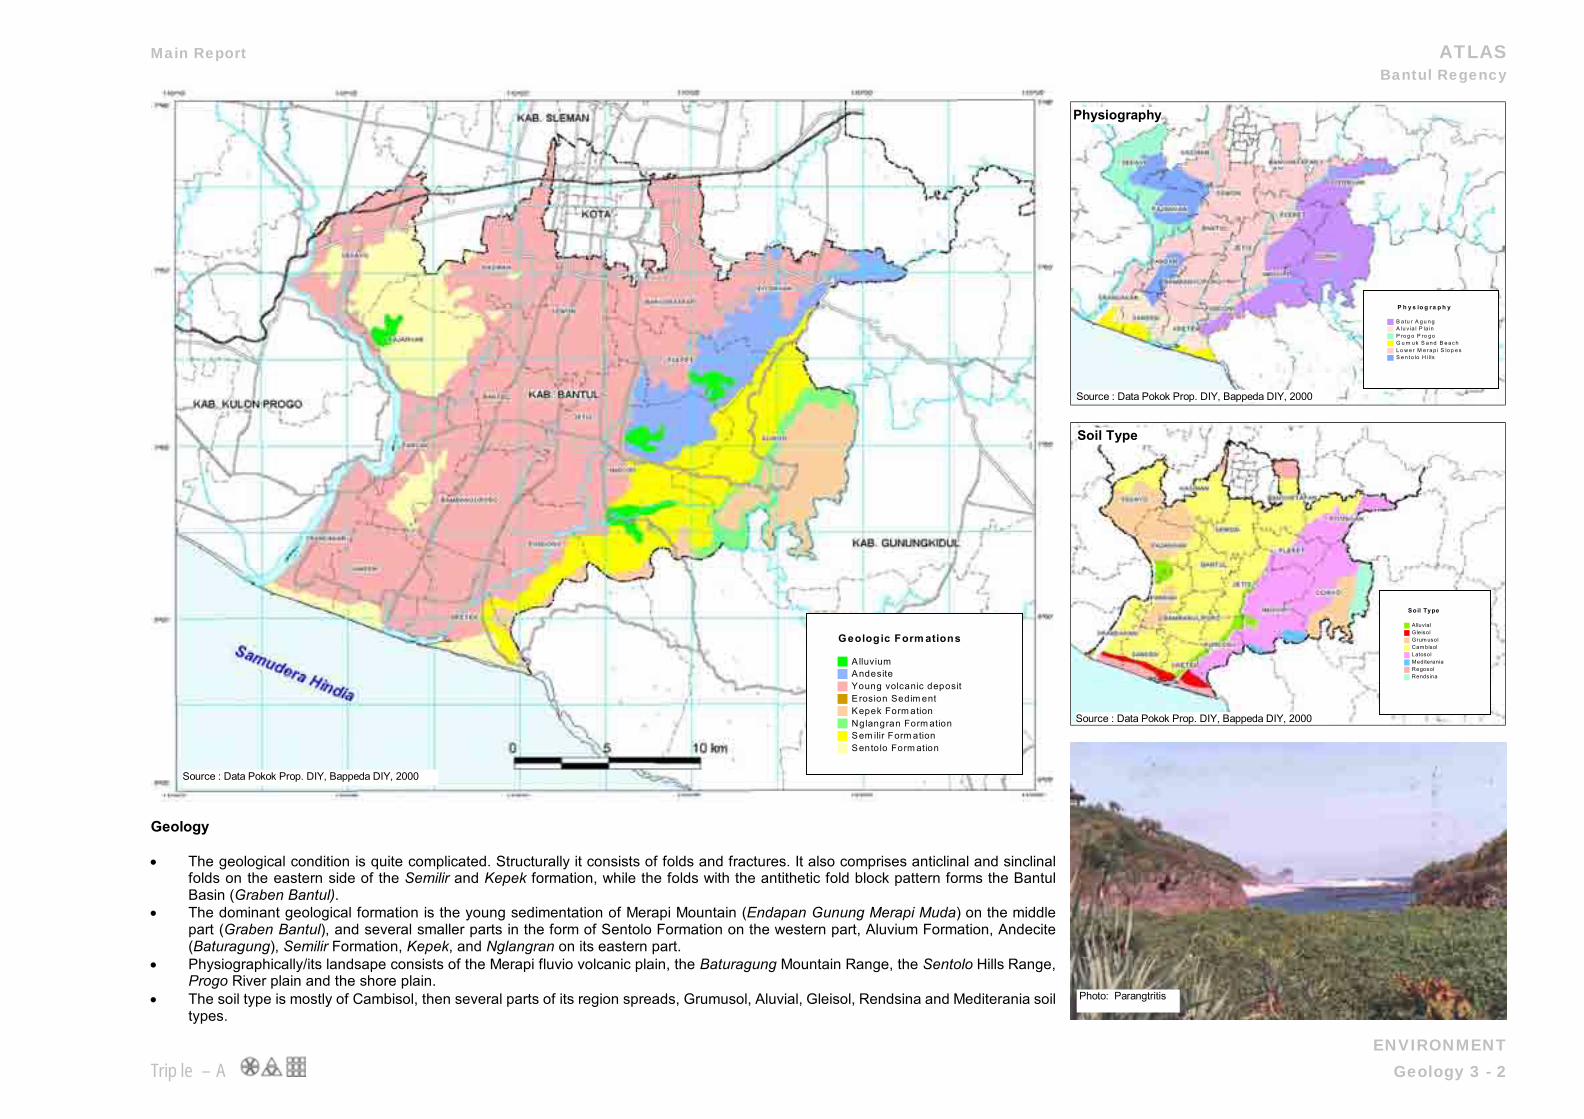
Geology • The geological condition is quite complicated. Structurally it consists of folds and fractures. It also comprises anticlinal and sinclinal
folds on the eastern side of the Semilir and Kepek formation, while the folds with the antithetic fold block pattern forms the Bantul Basin (Graben Bantul).
• The dominant geological formation is the young sedimentation of Merapi Mountain (Endapan Gunung Merapi Muda) on the middle part (Graben Bantul), and several smaller parts in the form of Sentolo Formation on the western part, Aluvium Formation, Andecite (Baturagung), Semilir Formation, Kepek, and Nglangran on its eastern part.
• Physiographically/its landsape consists of the Merapi fluvio volcanic plain, the Baturagung Mountain Range, the Sentolo Hills Range, Progo River plain and the shore plain.
• The soil type is mostly of Cambisol, then several parts of its region spreads, Grumusol, Aluvial, Gleisol, Rendsina and Mediterania soil types.
Geologic Form ations
AlluviumAndesiteYoung volcanic depositE rosion Sedim entKepek Form ationNglangran Form ationSem ilir Form ationSentolo Form ation
Soil Type
AlluvialGleisolGrum usolCambisolLatosolMediteraniaRegosolRendsina
P h y s io g ra p h y
B a tu r A g u n gA lu v ia l P la inP ro g o P ro g oG u m u k S a n d B e a c hL o w e r M e ra p i S lo p e sS e n to lo H ills
Source : Data Pokok Prop. DIY, Bappeda DIY, 2000
Source : Data Pokok Prop. DIY, Bappeda DIY, 2000
Photo: Parangtritis
Source : Data Pokok Prop. DIY, Bappeda DIY, 2000
Soil Type
Physiography
Main Report ATLAS Bantul Regency
ENVIRONMENT Triple – A Hydrology 3 - 3
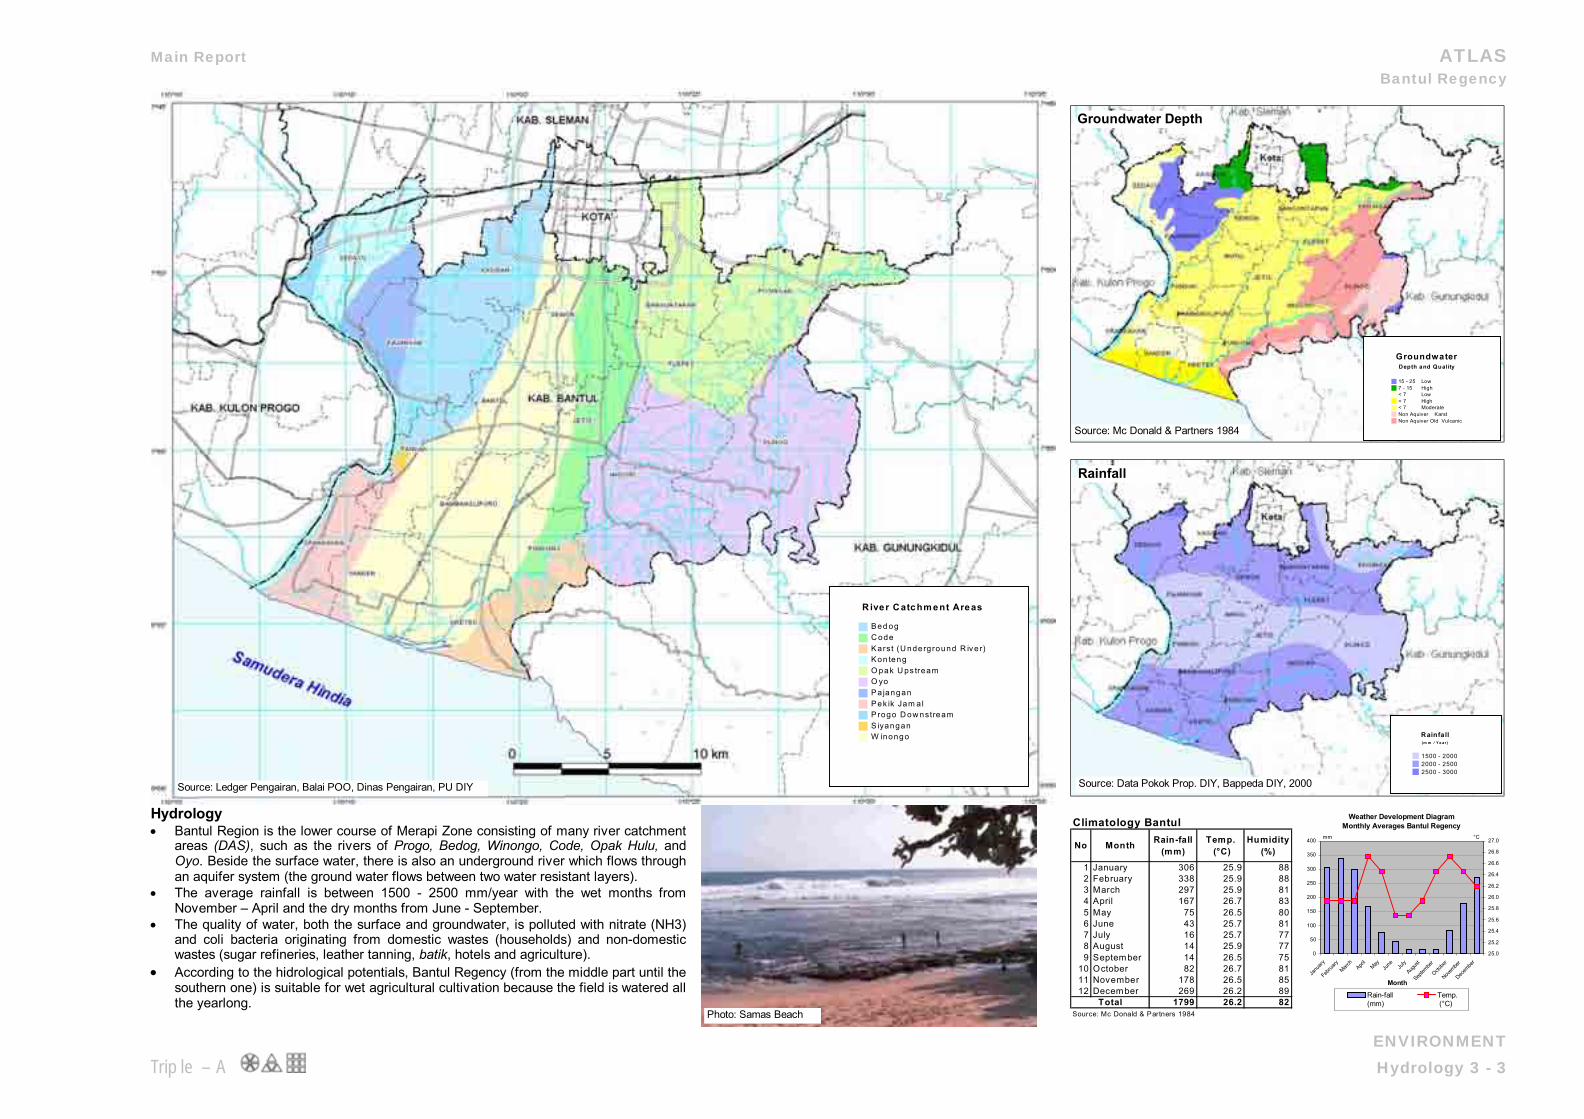
Hydrology • Bantul Region is the lower course of Merapi Zone consisting of many river catchment
areas (DAS), such as the rivers of Progo, Bedog, Winongo, Code, Opak Hulu, and Oyo. Beside the surface water, there is also an underground river which flows through an aquifer system (the ground water flows between two water resistant layers).
• The average rainfall is between 1500 - 2500 mm/year with the wet months from November – April and the dry months from June - September.
• The quality of water, both the surface and groundwater, is polluted with nitrate (NH3) and coli bacteria originating from domestic wastes (households) and non-domestic wastes (sugar refineries, leather tanning, batik, hotels and agriculture).
• According to the hidrological potentials, Bantul Regency (from the middle part until the southern one) is suitable for wet agricultural cultivation because the field is watered all the yearlong.
Climatology Bantul
No Month Rain-fall(mm)
Temp. (°C)
Humidity(%)
1 January 306 25.9 882 February 338 25.9 883 March 297 25.9 814 April 167 26.7 835 May 75 26.5 806 June 43 25.7 817 July 16 25.7 778 August 14 25.9 779 September 14 26.5 75
10 October 82 26.7 8111 November 178 26.5 8512 December 269 26.2 89
1799 26.2 82Source: Mc Donald & Partners 1984
Total
Weather Development DiagramMonthly Averages Bantul Regency
0
50
100
150
200
250
300
350
400
Janu
aryFeb
ruary
March
April
MayJu
ne July
Augus
tSep
tembe
rOcto
ber
Novem
ber
Decem
ber
Month
25.0
25.2
25.4
25.6
25.8
26.0
26.2
26.4
26.6
26.8
27.0
Rain-fall(mm)
Temp. (°C)
°Cmm
R iver C atchm ent Areas
Bed ogC odeKarst (U nderground R iv er)Kon tengO pak U ps treamO yoPa janganPek ik Jam alP rogo D ow nstreamSiyanganW inongo Rainfall
(m m / Y e ar)
1500 - 20002000 - 25002500 - 3000
GroundwaterDepth and Quality
15 - 25 Low7 - 15 High< 7 Low< 7 High< 7 ModerateNon Aquiver KarstNon Aquiver Old Vulcanic
Source: Ledger Pengairan, Balai POO, Dinas Pengairan, PU DIY Source: Data Pokok Prop. DIY, Bappeda DIY, 2000
Source: Mc Donald & Partners 1984
Photo: Samas Beach
Groundwater Depth
Rainfall
Main Report ATLAS Bantul Regency
ENVIRONMENT Triple – A Ecology 3 - 4
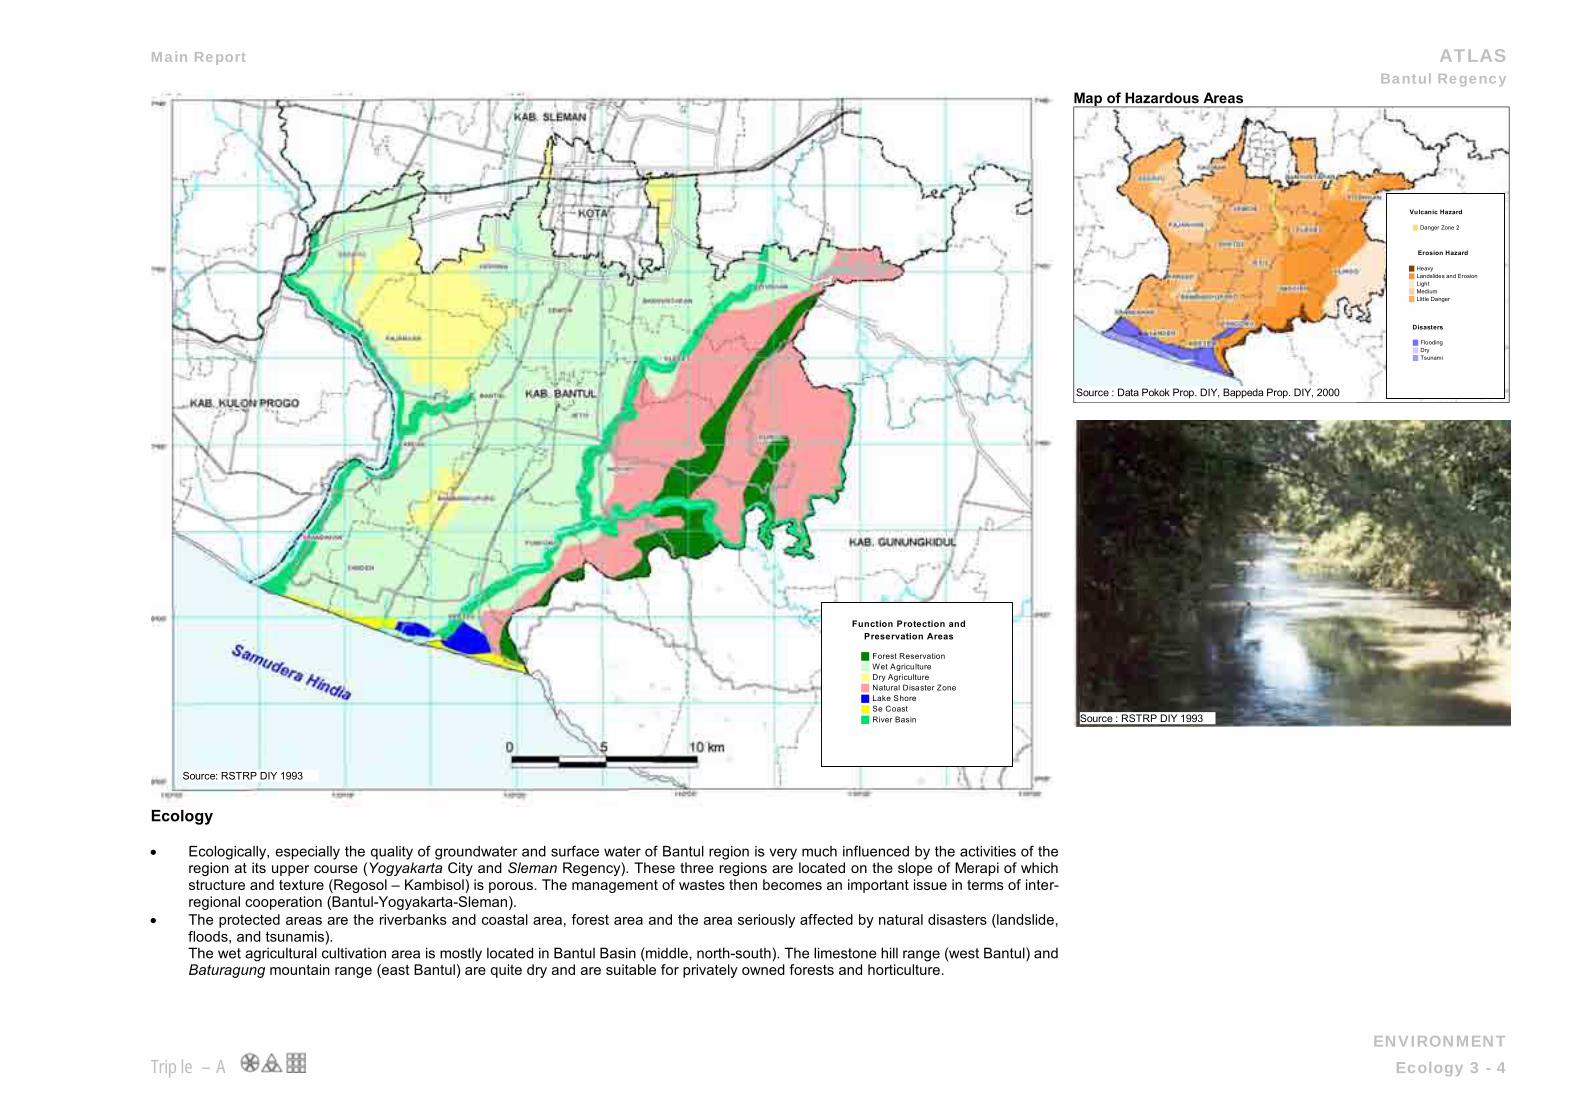
Ecology • Ecologically, especially the quality of groundwater and surface water of Bantul region is very much influenced by the activities of the
region at its upper course (Yogyakarta City and Sleman Regency). These three regions are located on the slope of Merapi of which structure and texture (Regosol – Kambisol) is porous. The management of wastes then becomes an important issue in terms of inter-regional cooperation (Bantul-Yogyakarta-Sleman).
• The protected areas are the riverbanks and coastal area, forest area and the area seriously affected by natural disasters (landslide, floods, and tsunamis). The wet agricultural cultivation area is mostly located in Bantul Basin (middle, north-south). The limestone hill range (west Bantul) and Baturagung mountain range (east Bantul) are quite dry and are suitable for privately owned forests and horticulture.
Map of Hazardous Areas
Vulcanic Hazard
Danger Zone 2
Erosion Hazard
HeavyLandslides and ErosionLightMediumLittle Danger
Disasters
FloodingDryTsunami
Function Protection andPreservation Areas
Forest ReservationWet AgricultureDry AgricultureNatural Disaster ZoneLake ShoreSe CoastRiver Basin
Source: RSTRP DIY 1993
Source : RSTRP DIY 1993
Source : Data Pokok Prop. DIY, Bappeda Prop. DIY, 2000
Main Report ATLAS Bantul Regency
ECONOMY Triple – A GDP 3 - 5
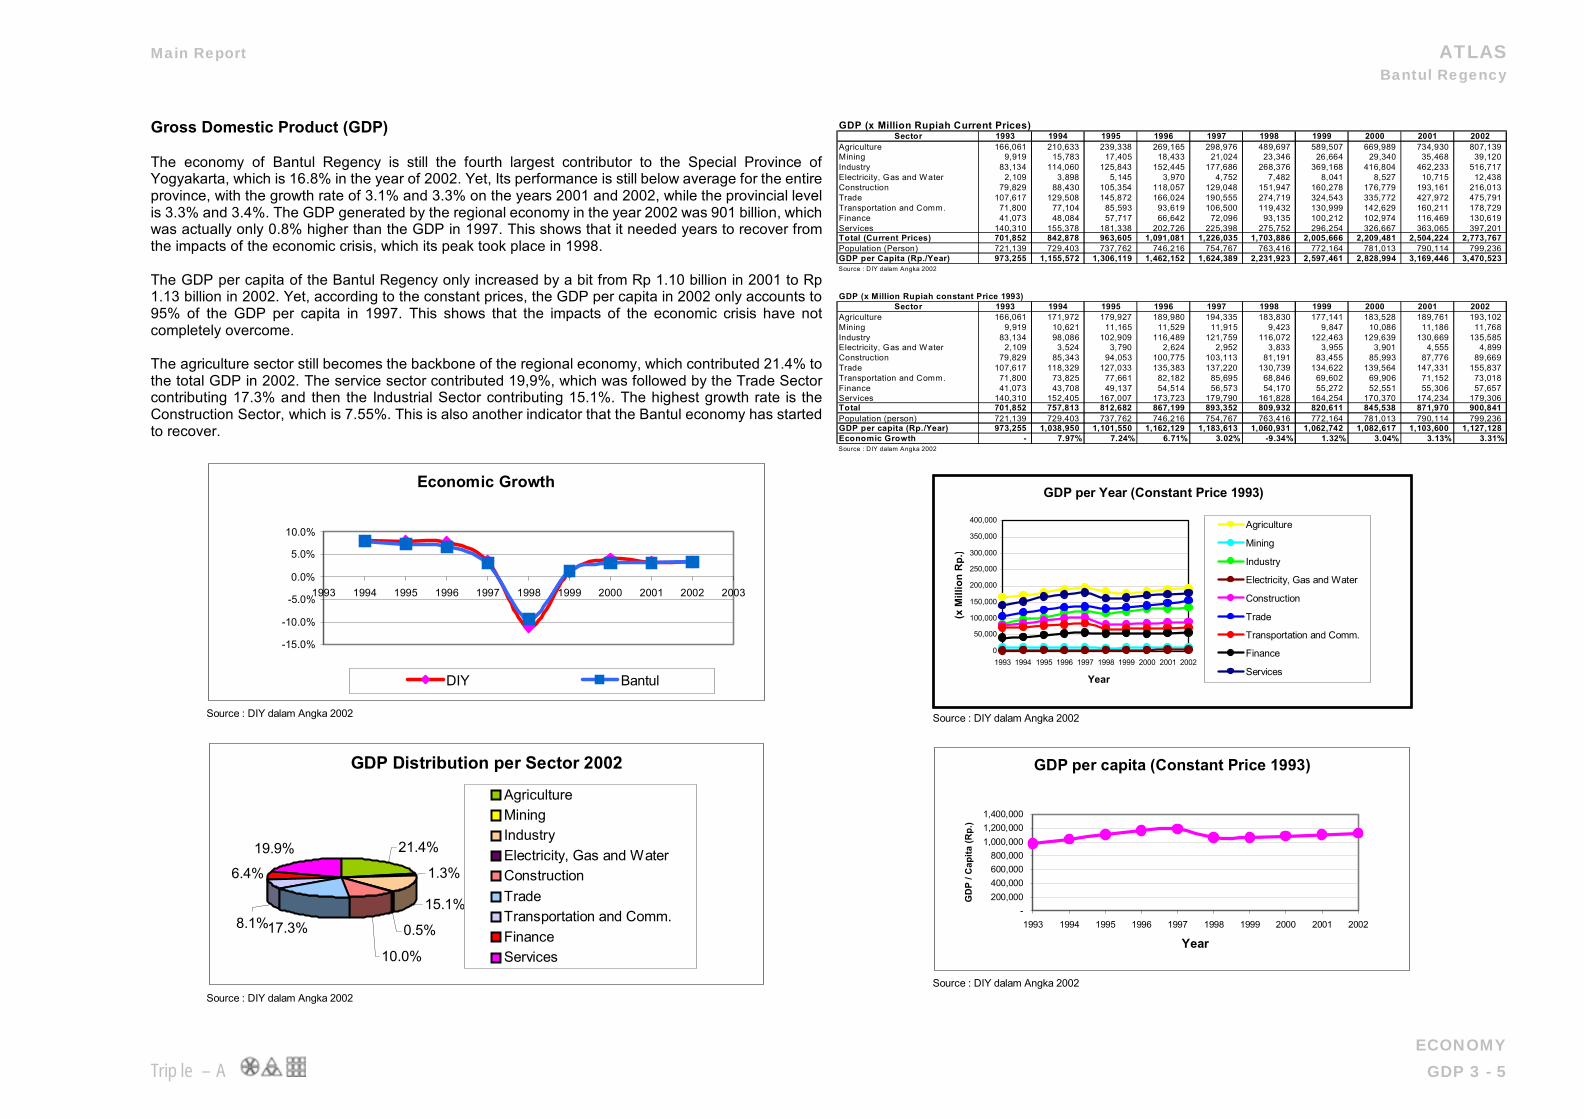
Gross Domestic Product (GDP) The economy of Bantul Regency is still the fourth largest contributor to the Special Province of Yogyakarta, which is 16.8% in the year of 2002. Yet, Its performance is still below average for the entire province, with the growth rate of 3.1% and 3.3% on the years 2001 and 2002, while the provincial level is 3.3% and 3.4%. The GDP generated by the regional economy in the year 2002 was 901 billion, which was actually only 0.8% higher than the GDP in 1997. This shows that it needed years to recover from the impacts of the economic crisis, which its peak took place in 1998. The GDP per capita of the Bantul Regency only increased by a bit from Rp 1.10 billion in 2001 to Rp 1.13 billion in 2002. Yet, according to the constant prices, the GDP per capita in 2002 only accounts to 95% of the GDP per capita in 1997. This shows that the impacts of the economic crisis have not completely overcome. The agriculture sector still becomes the backbone of the regional economy, which contributed 21.4% to the total GDP in 2002. The service sector contributed 19,9%, which was followed by the Trade Sector contributing 17.3% and then the Industrial Sector contributing 15.1%. The highest growth rate is the Construction Sector, which is 7.55%. This is also another indicator that the Bantul economy has started to recover.
Economic Growth
-15.0%
-10.0%
-5.0%
0.0%
5.0%
10.0%
1993 1994 1995 1996 1997 1998 1999 2000 2001 2002 2003
DIY Bantul
Source : DIY dalam Angka 2002
GDP Distribution per Sector 2002
21.4%
1.3%
15.1%
0.5%
10.0%
17.3%
6.4%
19.9%
8.1%
AgricultureMiningIndustryElectricity, Gas and WaterConstructionTradeTransportation and Comm.FinanceServices
Source : DIY dalam Angka 2002
GDP (x Million Rupiah Current Prices)
Sector 1993 1994 1995 1996 1997 1998 1999 2000 2001 2002Agriculture 166,061 210,633 239,338 269,165 298,976 489,697 589,507 669,989 734,930 807,139 Mining 9,919 15,783 17,405 18,433 21,024 23,346 26,664 29,340 35,468 39,120 Industry 83,134 114,060 125,843 152,445 177,686 268,376 369,168 416,804 462,233 516,717 Electricity, Gas and Water 2,109 3,898 5,145 3,970 4,752 7,482 8,041 8,527 10,715 12,438 Construction 79,829 88,430 105,354 118,057 129,048 151,947 160,278 176,779 193,161 216,013 Trade 107,617 129,508 145,872 166,024 190,555 274,719 324,543 335,772 427,972 475,791 Transportation and Comm. 71,800 77,104 85,593 93,619 106,500 119,432 130,999 142,629 160,211 178,729 Finance 41,073 48,084 57,717 66,642 72,096 93,135 100,212 102,974 116,469 130,619 Services 140,310 155,378 181,338 202,726 225,398 275,752 296,254 326,667 363,065 397,201 Total (Current Prices) 701,852 842,878 963,605 1,091,081 1,226,035 1,703,886 2,005,666 2,209,481 2,504,224 2,773,767 Population (Person) 721,139 729,403 737,762 746,216 754,767 763,416 772,164 781,013 790,114 799,236 GDP per Capita (Rp./Year) 973,255 1,155,572 1,306,119 1,462,152 1,624,389 2,231,923 2,597,461 2,828,994 3,169,446 3,470,523 Source : DIY dalam Angka 2002 GDP (x Million Rupiah constant Price 1993)
Sector 1993 1994 1995 1996 1997 1998 1999 2000 2001 2002Agriculture 166,061 171,972 179,927 189,980 194,335 183,830 177,141 183,528 189,761 193,102 Mining 9,919 10,621 11,165 11,529 11,915 9,423 9,847 10,086 11,186 11,768 Industry 83,134 98,086 102,909 116,489 121,759 116,072 122,463 129,639 130,669 135,585 Electricity, Gas and Water 2,109 3,524 3,790 2,624 2,952 3,833 3,955 3,901 4,555 4,899 Construction 79,829 85,343 94,053 100,775 103,113 81,191 83,455 85,993 87,776 89,669 Trade 107,617 118,329 127,033 135,383 137,220 130,739 134,622 139,564 147,331 155,837 Transportation and Comm. 71,800 73,825 77,661 82,182 85,695 68,846 69,602 69,906 71,152 73,018 Finance 41,073 43,708 49,137 54,514 56,573 54,170 55,272 52,551 55,306 57,657 Services 140,310 152,405 167,007 173,723 179,790 161,828 164,254 170,370 174,234 179,306 Total 701,852 757,813 812,682 867,199 893,352 809,932 820,611 845,538 871,970 900,841 Population (person) 721,139 729,403 737,762 746,216 754,767 763,416 772,164 781,013 790,114 799,236 GDP per capita (Rp./Year) 973,255 1,038,950 1,101,550 1,162,129 1,183,613 1,060,931 1,062,742 1,082,617 1,103,600 1,127,128 Economic Growth - 7.97% 7.24% 6.71% 3.02% -9.34% 1.32% 3.04% 3.13% 3.31%Source : DIY dalam Angka 2002
GDP per Year (Constant Price 1993)
0
50,000
100,000
150,000
200,000
250,000
300,000
350,000
400,000
1993 1994 1995 1996 1997 1998 1999 2000 2001 2002
Year
(x M
illio
n R
p.)
Agriculture
Mining
Industry
Electricity, Gas and Water
Construction
Trade
Transportation and Comm.
Finance
Services
Source : DIY dalam Angka 2002
GDP per capita (Constant Price 1993)
-200,000400,000600,000800,000
1,000,0001,200,0001,400,000
1993 1994 1995 1996 1997 1998 1999 2000 2001 2002
Year
GD
P / C
apita
(Rp.
)
Source : DIY dalam Angka 2002

Main Report ATLAS Bantul Regency
ECONOMY Triple – A Agriculture 3 - 6
Agriculture The relationship of the agricultural sector with the economic sector in forming the GDP of Bantul Regency is that the agricultural sector in 2002 remains as the first largest contributor (21.4% - Constant Price 1993). Looking from its stucture, the largest contribution from the Agricultural Sector is the agricultural foods (81.5%), and consecutively is followed by animal husbandry and its products (13.0%), plantation (3.6%), forestry (0.94%) and the smallest is the fishery (0.93%). Even though there has been a small decline in the contribution towards the Bantul Regency’s economy, this sector still absorbs most work force in almost all the sub-districts in Bantul Regency with a total of 181,729 people (29.96) according to the Sub-district Recapitulation of Monographic Data in the entire Bantul Regency on Semester II / 2002. The contribution of the agricultural sector comes from the five sub-sectors of food crops, plantation, animal husbandry and its products, forestry, and fishery.
GDP of Agriculture, Bantul (Constant Price 1993)
1993 1994 1995 1996 1997 1998 1999 2000 2001Cash Crops 132,830 135,975 143,470 152,452 155,277 151,400 145,551 150,279 155,054Plantation 8,016 8,624 7,868 8,324 8,403 7,911 6,616 6,689 6,877Animal Husbandry 23,448 25,141 26,137 26,833 28,230 21,572 22,006 23,424 24,424Forestry 738 990 1,136 975 949 1,617 1,398 1,505 1,698Fishery 1,029 1,242 1,316 1,396 1,476 1,330 1,570 1,631 1,708GDP of Agriculture 166,061 171,972 179,927 189,980 194,335 183,830 177,141 183,528 189,761Total GDP 701,852 757,813 812,682 867,199 893,352 809,932 820,611 845,538 871,970GDP of Agriculture, DIY 781,341 800,457 833,000 884,859 914,604 865,395 817,810 901,380 886,990GDP Total DIY 4,135,529 4,466,309 4,822,585 5,195,997 5,378,525 4,777,199 4,824,445 5,017,710 5,182,543Agri/Tot Bantul (%) 23.7% 22.7% 22.1% 21.9% 21.8% 22.7% 21.6% 21.7% 21.8%Agri/Tot. DIY (%) 18.9% 17.9% 17.3% 17.0% 17.0% 18.1% 17.0% 18.0% 17.1%Agri Bantul/Agri DIY (%) 21.3% 21.5% 21.6% 21.5% 21.2% 21.2% 21.7% 20.4% 21.4%Source : D IY dalam Angka 2002
GDPBusiness Unit
GDP Agriculture ( Constant Price 1993)
025,00050,00075,000
100,000125,000150,000175,000
1993 1994 1995 1996 1997 1998 1999 2000 2001 2002
Year
GD
P (x
mill
ion
Rp.
)
Cash Crops Plantation Animal Husbandry Forestry Fishery
Source : DIY dalam Angka 2002
Source: Bantul Dalam Angka Tahun 2002
PRODUCTIVITY OF FOOD CROPSBANTUL REGENCY, 2002
164,846889
19,127
35,644
430
7,504
5,740 Wetland PaddyDryland PaddyMaizeCassavaSweet PotatoesPeanutsSoyabeans
Source: Bantul Dalam Angka Tahun 2002
Legend
Forest
Rice Fields
Source : Data Pokok Pembangunan Bappeda DIY
Rice Fields in Bantul
NUMBER OF LIVESTOCK BY TYPEBANTUL REGENCY, 2002
484
42,309
24,581
15,877
3,490
9818
Horse Cattle
Milk Cow Buffalo
Goat Sheep
Pig
Main Report ATLAS Bantul Regency
ECONOMY Triple – A Mining 3 - 7
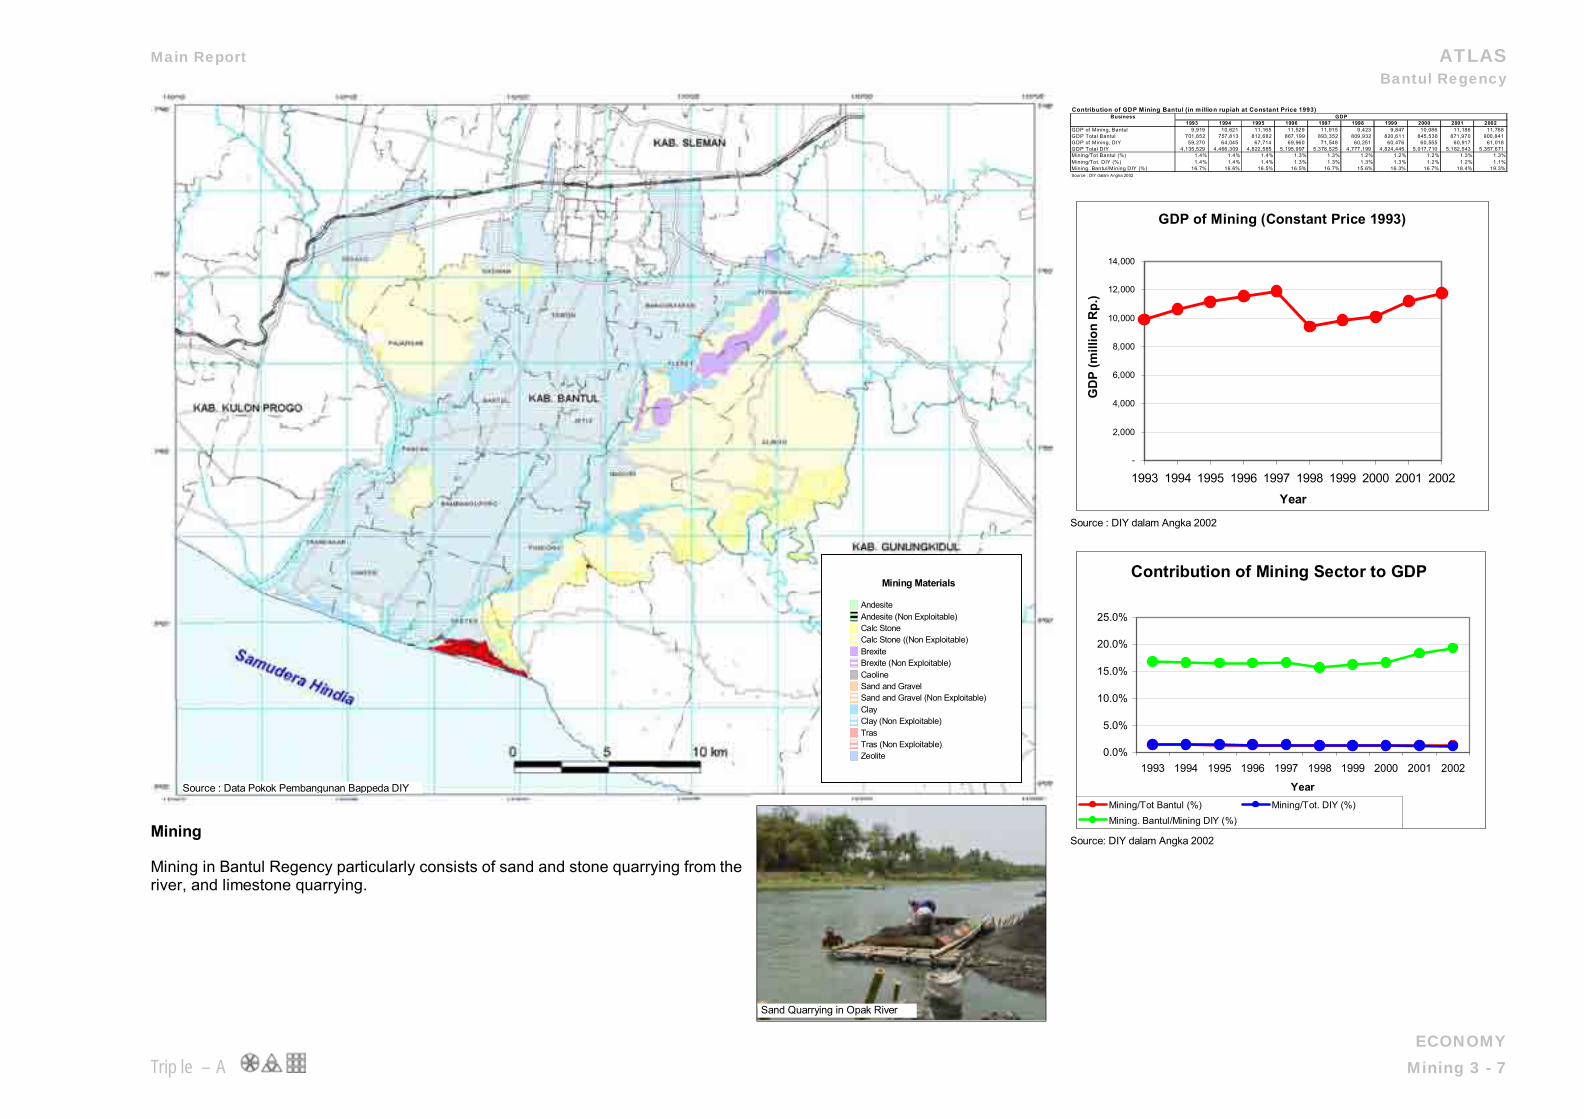
Mining Mining in Bantul Regency particularly consists of sand and stone quarrying from the river, and limestone quarrying.
Contribution of GDP Mining Bantul (in million rupiah at Constant Price 1993)
Business1993 1994 1995 1996 1997 1998 1999 2000 2001 2002
GDP of Mining, Bantul 9,919 10,621 11,165 11,529 11,915 9,423 9,847 10,086 11,186 11,768 GDP Total Bantul 701,852 757,813 812,682 867,199 893,352 809,932 820,611 845,538 871,970 900,841 GDP of Mining, DIY 59,270 64,045 67,714 69,960 71,548 60,251 60,476 60,555 60,917 61,018 GDP Total DIY 4,135,529 4,466,309 4,822,585 5,195,997 5,378,525 4,777,199 4,824,445 5,017,710 5,182,543 5,357,671 Mining/Tot Bantul (%) 1.4% 1.4% 1.4% 1.3% 1.3% 1.2% 1.2% 1.2% 1.3% 1.3%Mining/Tot. DIY (%) 1.4% 1.4% 1.4% 1.3% 1.3% 1.3% 1.3% 1.2% 1.2% 1.1%Mining. Bantul/Mining DIY (%) 16.7% 16.6% 16.5% 16.5% 16.7% 15.6% 16.3% 16.7% 18.4% 19.3%Source : DIY dalam Angka 2002
GDP
GDP of Mining (Constant Price 1993)
-
2,000
4,000
6,000
8,000
10,000
12,000
14,000
1993 1994 1995 1996 1997 1998 1999 2000 2001 2002Year
GD
P (m
illio
n R
p.)
Source : DIY dalam Angka 2002
Contribution of Mining Sector to GDP
0.0%
5.0%
10.0%
15.0%
20.0%
25.0%
1993 1994 1995 1996 1997 1998 1999 2000 2001 2002
YearMining/Tot Bantul (%) Mining/Tot. DIY (%)Mining. Bantul/Mining DIY (%)
Source: DIY dalam Angka 2002
Mining Materials
Andesite
������
������
Andesite (Non Exploitable)Calc Stone���
��� Calc Stone ((Non Exploitable)Brexite
������
Brexite (Non Exploitable)CaolineSand and Gravel���
Sand and Gravel (Non Exploitable)Clay
������ Clay (Non Exploitable)
Tras���Tras (Non Exploitable)Zeolite
Source : Data Pokok Pembangunan Bappeda DIY
Sand Quarrying in Opak River
Main Report ATLAS Bantul Regency
ECONOMY Triple – A Industry 3 - 8
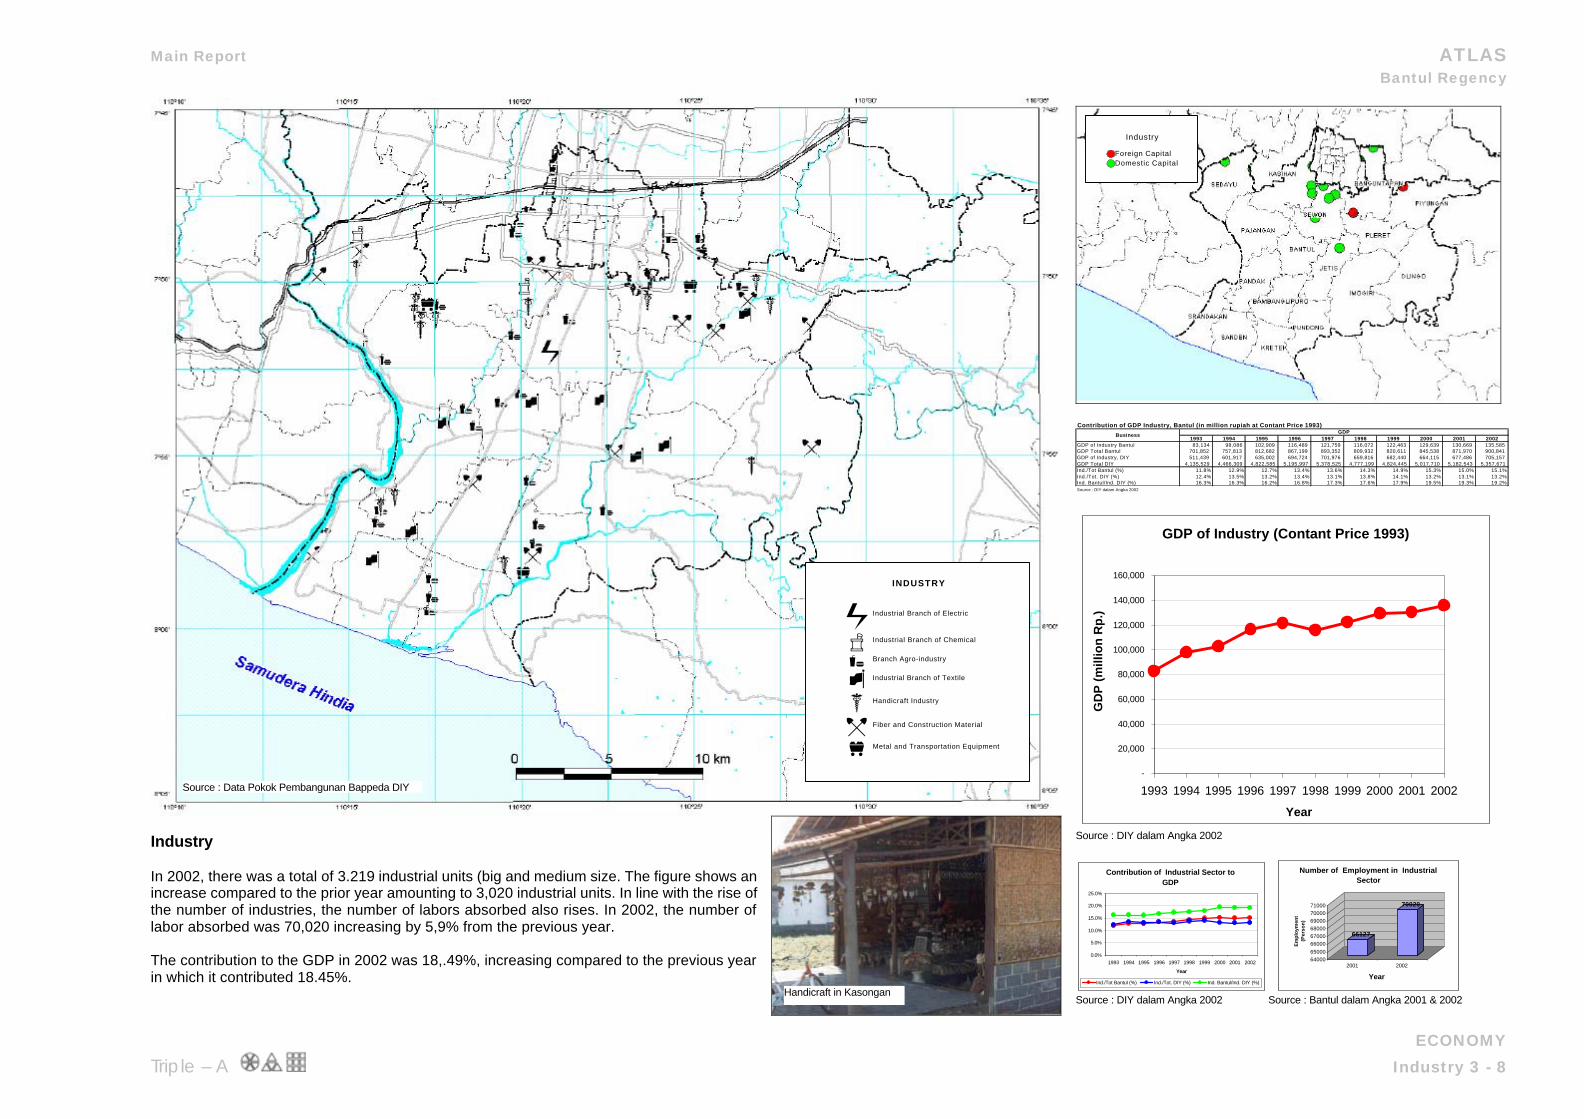
Industry In 2002, there was a total of 3.219 industrial units (big and medium size. The figure shows an increase compared to the prior year amounting to 3,020 industrial units. In line with the rise of the number of industries, the number of labors absorbed also rises. In 2002, the number of labor absorbed was 70,020 increasing by 5,9% from the previous year. The contribution to the GDP in 2002 was 18,.49%, increasing compared to the previous year in which it contributed 18.45%.
Contribution of GDP Industry, Bantul (in million rupiah at Contant Price 1993)
1993 1994 1995 1996 1997 1998 1999 2000 2001 2002GDP of Industry Bantul 83,134 98,086 102,909 116,489 121,759 116,072 122,463 129,639 130,669 135,585 GDP Total Bantul 701,852 757,813 812,682 867,199 893,352 809,932 820,611 845,538 871,970 900,841 GDP of Industry, DIY 511,439 601,917 635,002 694,724 701,976 659,816 682,440 664,115 677,486 705,157 GDP Total DIY 4,135,529 4,466,309 4,822,585 5,195,997 5,378,525 4,777,199 4,824,445 5,017,710 5,182,543 5,357,671 Ind./Tot Bantul (%) 11.8% 12.9% 12.7% 13.4% 13.6% 14.3% 14.9% 15.3% 15.0% 15.1%Ind./Tot. DIY (%) 12.4% 13.5% 13.2% 13.4% 13.1% 13.8% 14.1% 13.2% 13.1% 13.2%Ind. Bantul/Ind. DIY (%) 16.3% 16.3% 16.2% 16.8% 17.3% 17.6% 17.9% 19.5% 19.3% 19.2%Source : DIY dalam Angka 2002
GDPBusiness
GDP of Industry (Contant Price 1993)
-
20,000
40,000
60,000
80,000
100,000
120,000
140,000
160,000
1993 1994 1995 1996 1997 1998 1999 2000 2001 2002
Year
GD
P (
mill
ion
Rp
.)
Source : DIY dalam Angka 2002
Contribution of Industrial Sector to GDP
0.0%
5.0%
10.0%
15.0%
20.0%
25.0%
1993 1994 1995 1996 1997 1998 1999 2000 2001 2002
Year
Ind./Tot Bantul (%) Ind./Tot. DIY (%) Ind. Bantul/Ind. DIY (%)
66127
70020
6400065000
660006700068000690007000071000
Em
plo
ymen
t (P
erso
n)
2001 2002
Year
Number of Employment in Industrial Sector
Source : DIY dalam Angka 2002 Source : Bantul dalam Angka 2001 & 2002
INDUSTRY
HHHHHHHHHHHHHHHHHHHHHHHHHHHHHHHHHHHHHHHHHHHHHHHHHHHHHHHHHHHHHHHHHIndustrial Branch of Electric
¹¹¹¹¹¹¹¹¹¹¹¹¹¹¹¹¹¹¹¹¹¹¹¹¹¹¹¹¹¹¹¹¹¹¹¹¹¹¹¹¹¹¹¹¹¹¹¹¹ Industrial Branch of Chemical
5555555555555555555555555555555555555555555555555 Branch Agro-industry
∫∫∫∫∫∫∫∫∫∫∫∫∫∫∫∫∫∫∫∫∫∫∫∫∫∫∫∫∫∫∫∫∫∫∫∫∫∫∫∫∫∫∫∫∫∫∫∫∫ Industrial Branch of Textile
²²²²²²²²²²²²²²²²²²²²²²²²²²²²²²²²²²²²²²²²²²²²²²²²² Handicraft Industry
&&&&&&&&&&&&&&&&&&&&&&&&&&&&&&&&&&&&&&&&&&&&&&&&& Fiber and Construction Material
¾¾¾¾¾¾¾¾¾¾¾¾¾¾¾¾¾¾¾¾¾¾¾¾¾¾¾¾¾¾¾¾¾¾¾¾¾¾¾¾¾¾¾¾¾¾¾¾¾ Metal and Transportation Equipment
Industry
Foreign CapitalDomestic Capital
Source : Data Pokok Pembangunan Bappeda DIY
Handicraft in Kasongan
Main Report ATLAS Bantul Regency
ECONOMY Triple – A Trade 3 - 9
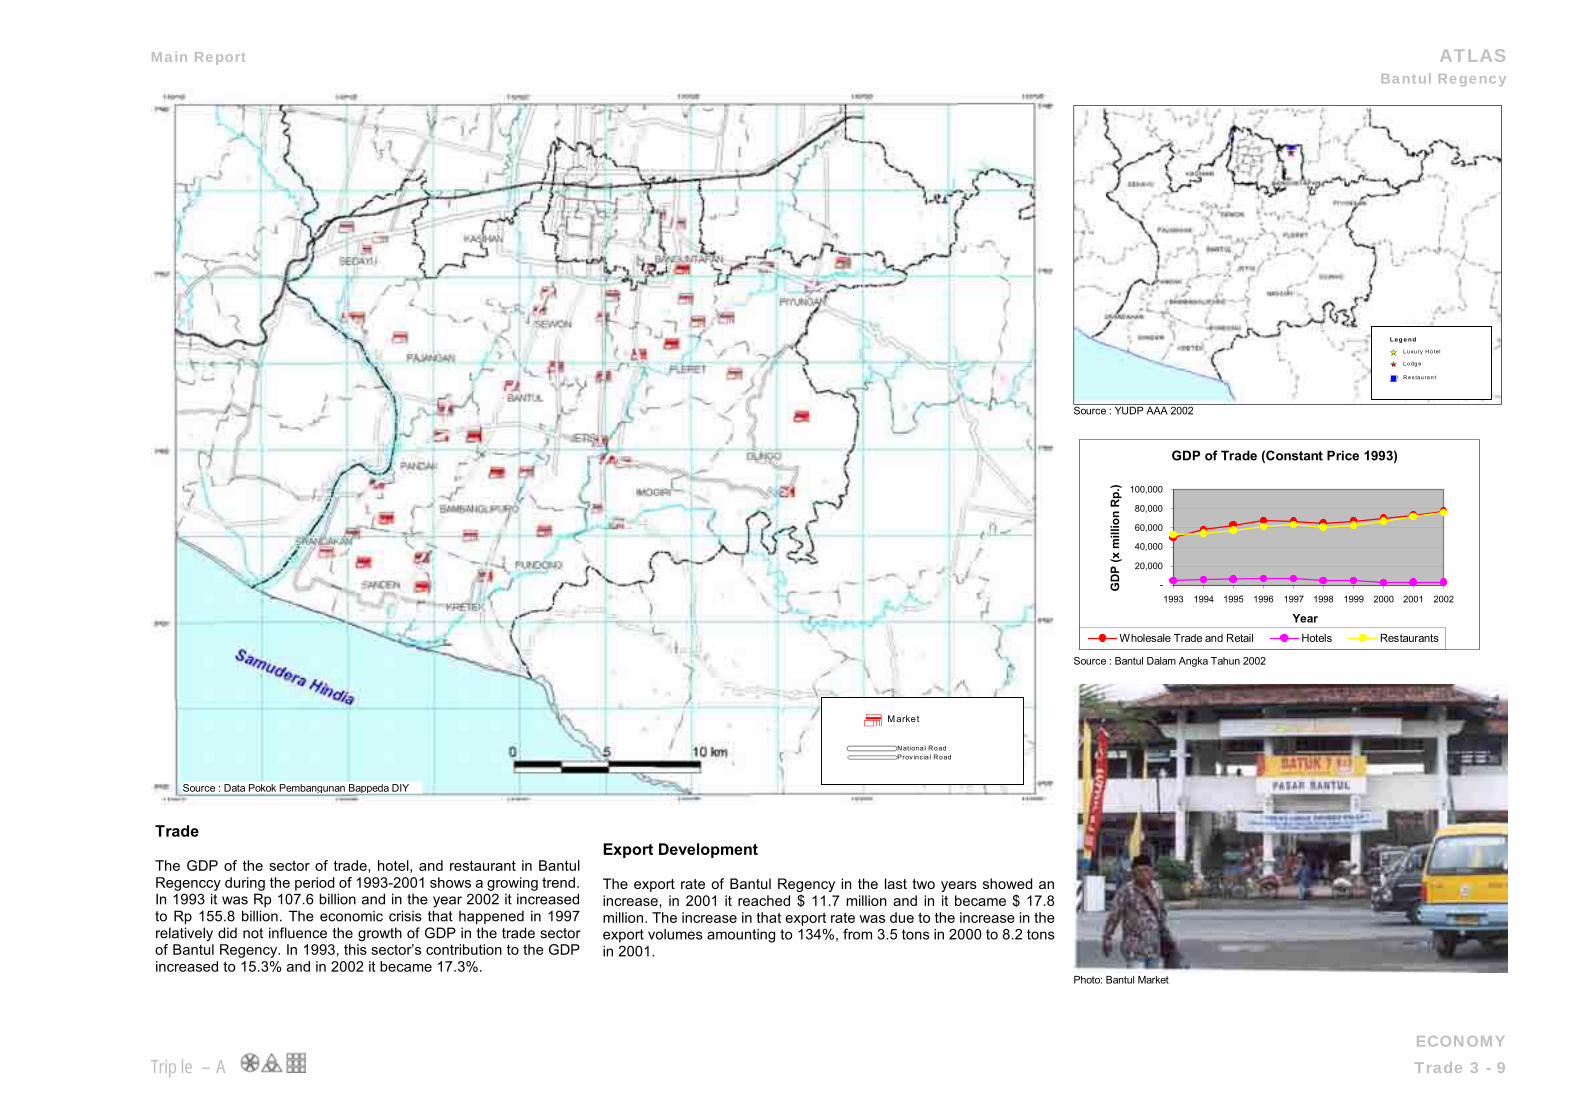
Trade The GDP of the sector of trade, hotel, and restaurant in Bantul Regenccy during the period of 1993-2001 shows a growing trend. In 1993 it was Rp 107.6 billion and in the year 2002 it increased to Rp 155.8 billion. The economic crisis that happened in 1997 relatively did not influence the growth of GDP in the trade sector of Bantul Regency. In 1993, this sector’s contribution to the GDP increased to 15.3% and in 2002 it became 17.3%.
Export Development The export rate of Bantul Regency in the last two years showed an increase, in 2001 it reached $ 11.7 million and in it became $ 17.8 million. The increase in that export rate was due to the increase in the export volumes amounting to 134%, from 3.5 tons in 2000 to 8.2 tons in 2001.
Source : YUDP AAA 2002
GDP of Trade (Constant Price 1993)
-
20,000
40,000
60,000
80,000
100,000
1993 1994 1995 1996 1997 1998 1999 2000 2001 2002
Year
GD
P (x
mill
ion
Rp.
)
Wholesale Trade and Retail Hotels Restaurants
Source : Bantul Dalam Angka Tahun 2002
Photo: Bantul Market
National RoadProv incia l Road
fl Market
h
L eg e nd
R e s tau ra n t
L o dg e
L u xu ry H o tel
Source : Data Pokok Pembangunan Bappeda DIY
Main Report ATLAS Bantul Regency
ECONOMY Triple – A Tourism 3 - 10
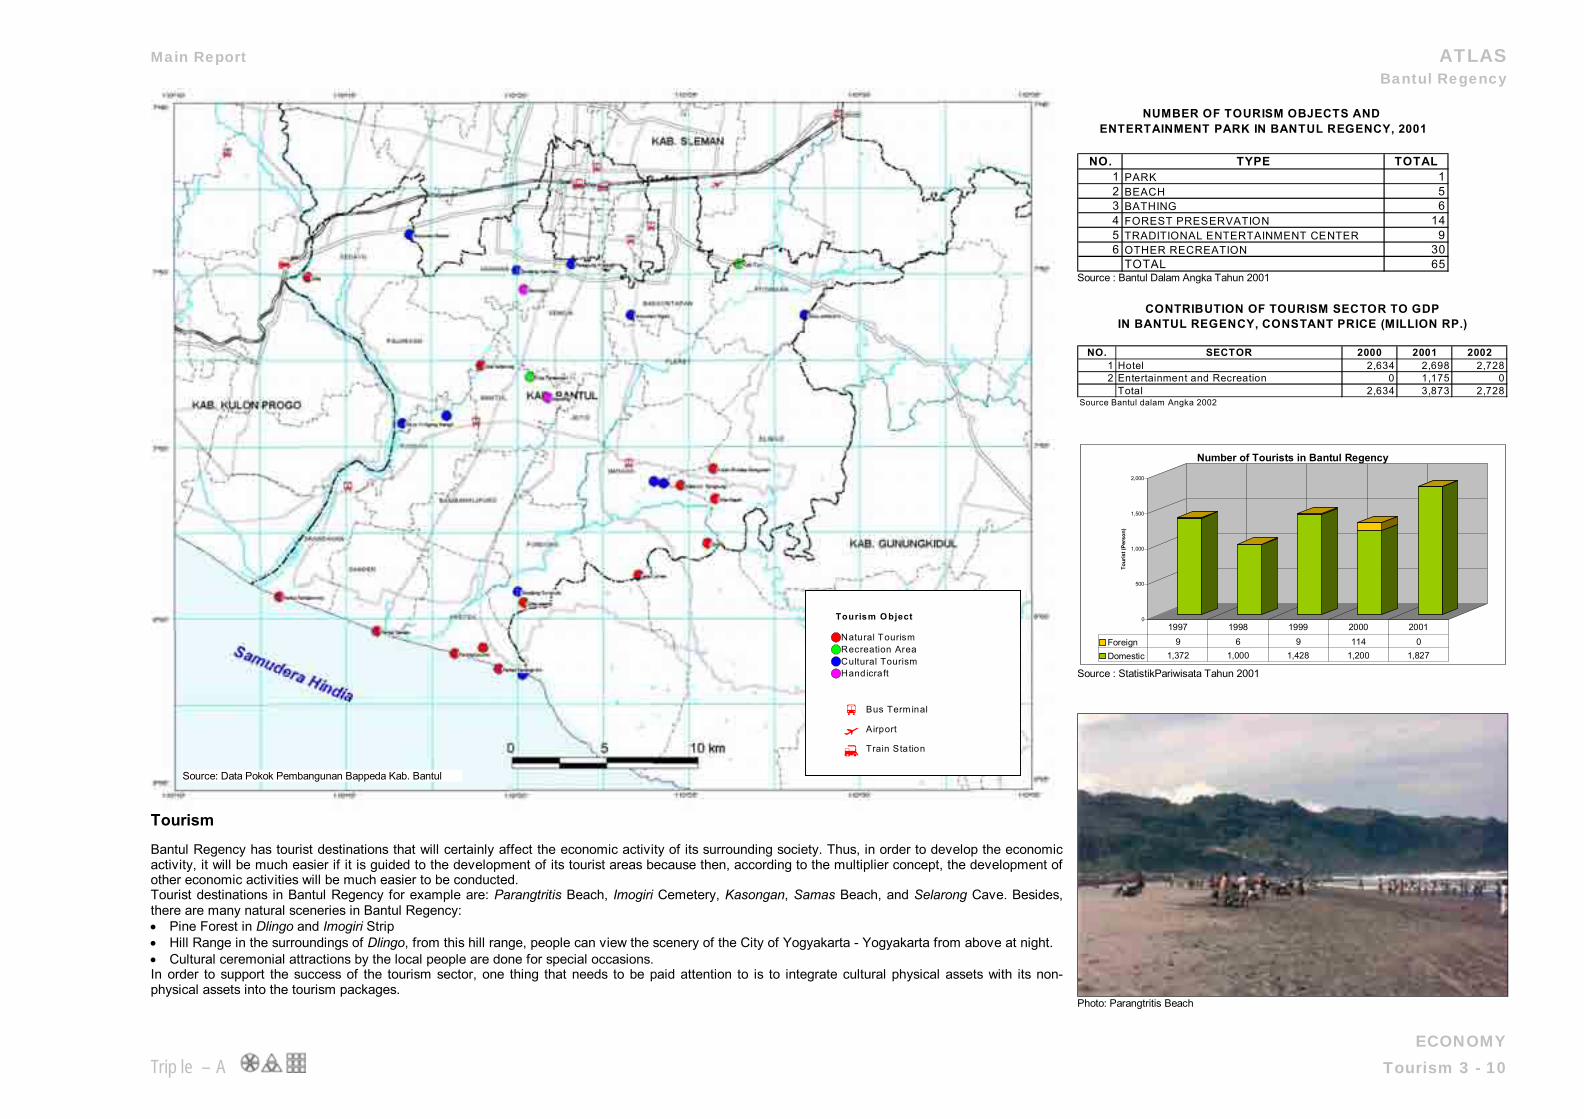
Tourism Bantul Regency has tourist destinations that will certainly affect the economic activity of its surrounding society. Thus, in order to develop the economic activity, it will be much easier if it is guided to the development of its tourist areas because then, according to the multiplier concept, the development of other economic activities will be much easier to be conducted. Tourist destinations in Bantul Regency for example are: Parangtritis Beach, Imogiri Cemetery, Kasongan, Samas Beach, and Selarong Cave. Besides, there are many natural sceneries in Bantul Regency: • Pine Forest in Dlingo and Imogiri Strip • Hill Range in the surroundings of Dlingo, from this hill range, people can view the scenery of the City of Yogyakarta - Yogyakarta from above at night. • Cultural ceremonial attractions by the local people are done for special occasions. In order to support the success of the tourism sector, one thing that needs to be paid attention to is to integrate cultural physical assets with its non-physical assets into the tourism packages.
NO. TYPE TOTAL1 PARK 12 BEACH 53 BATHING 64 FOREST PRESERVATION 145 TRADITIONAL ENTERTAINMENT CENTER 96 OTHER RECREATION 30
TOTAL 65
ENTERTAINMENT PARK IN BANTUL REGENCY, 2001NUMBER OF TOURISM OBJECTS AND
Source : Bantul Dalam Angka Tahun 2001
NO. SECTOR 2000 2001 20021 Hotel 2,634 2,698 2,7282 Entertainment and Recreation 0 1,175 0
Total 2,634 3,873 2,728Source Bantul dalam Angka 2002
IN BANTUL REGENCY, CONSTANT PRICE (MILLION RP.)CONTRIBUTION OF TOURISM SECTOR TO GDP
0
500
1,000
1,500
2,000
Tour
ist (
Pers
on)
Number of Tourists in Bantul Regency
Foreign 9 6 9 114 0Domestic 1,372 1,000 1,428 1,200 1,827
1997 1998 1999 2000 2001
Source : StatistikPariwisata Tahun 2001
Photo: Parangtritis Beach
îîîîîîîîîîîîîîîîîîîîîîîîîîîîîîîîîîîîîîîîîîîîîîîîî´́́́́́́́́́́́́́́́́́́́́́́́́́́́́́́́́́́́́́́́́́́́́́́́́«««««««««««««««««««««««««««««««««««««««««««««««««
Tourism O bject
Natural TourismRecreation AreaCultural TourismHandicraft
Bus Term inal
Airport
Train Station
Source: Data Pokok Pembangunan Bappeda Kab. Bantul
Main Report ATLAS Bantul Regency
SOCIAL Triple – A Demography 3 – 11
Population Growth
Demography
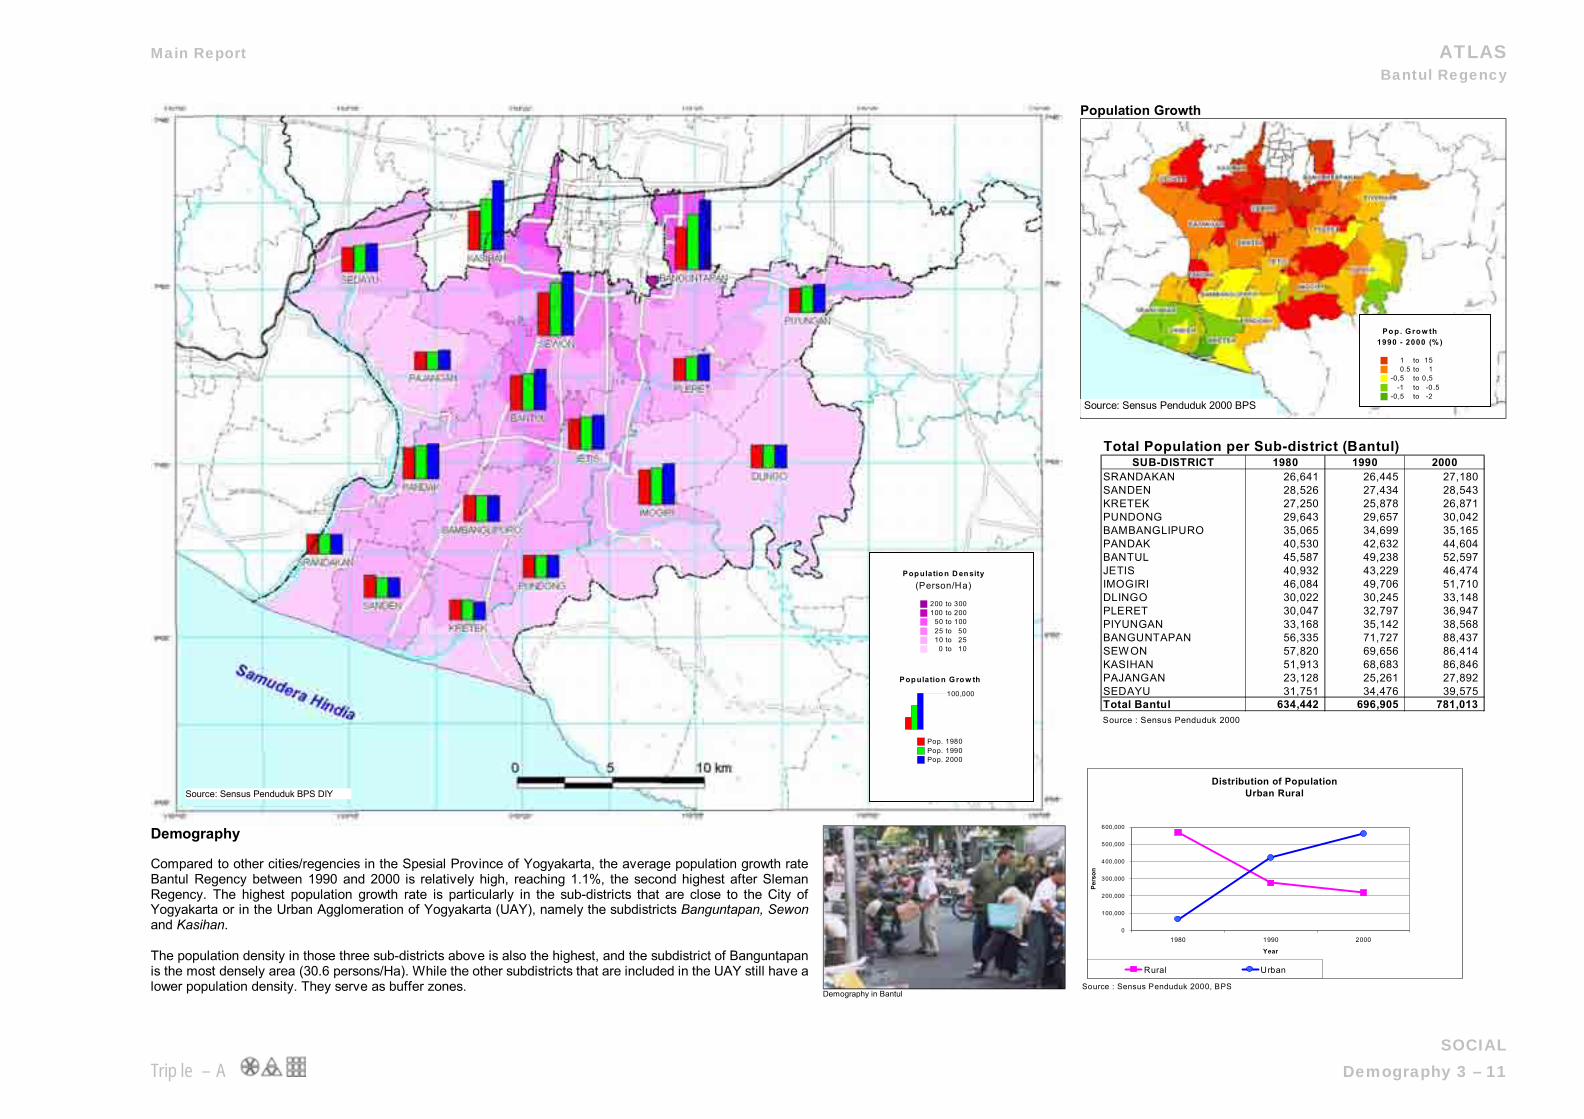
Compared to other cities/regencies in the Spesial Province of Yogyakarta, the average population growth rate Bantul Regency between 1990 and 2000 is relatively high, reaching 1.1%, the second highest after Sleman Regency. The highest population growth rate is particularly in the sub-districts that are close to the City of Yogyakarta or in the Urban Agglomeration of Yogyakarta (UAY), namely the subdistricts Banguntapan, Sewon and Kasihan. The population density in those three sub-districts above is also the highest, and the subdistrict of Banguntapan is the most densely area (30.6 persons/Ha). While the other subdistricts that are included in the UAY still have a lower population density. They serve as buffer zones.
Demography in Bantul
Total Population per Sub-district (Bantul)SUB-DISTRICT 1980 1990 2000
SRANDAKAN 26,641 26,445 27,180 SANDEN 28,526 27,434 28,543 KRETEK 27,250 25,878 26,871 PUNDONG 29,643 29,657 30,042 BAMBANGLIPURO 35,065 34,699 35,165 PANDAK 40,530 42,632 44,604 BANTUL 45,587 49,238 52,597 JETIS 40,932 43,229 46,474 IMOGIRI 46,084 49,706 51,710 DLINGO 30,022 30,245 33,148 PLERET 30,047 32,797 36,947 PIYUNGAN 33,168 35,142 38,568 BANGUNTAPAN 56,335 71,727 88,437 SEW ON 57,820 69,656 86,414 KASIHAN 51,913 68,683 86,846 PAJANGAN 23,128 25,261 27,892 SEDAYU 31,751 34,476 39,575 Total Bantul 634,442 696,905 781,013 Source : Sensus Penduduk 2000
Sumber : BKKBN Kabupaten Bantul 2002
Source : Sensus Penduduk 2000, BPS
Distribution of PopulationUrban Rural
0
100,000
200,000
300,000
400,000
500,000
600,000
1980 1990 2000
Year
Pers
on
Rural Urban
Pop ulatio n G ro w th
100,000
Pop. 1980Pop. 1990Pop. 2000
Pop ulatio n D en sity(Person/Ha)
200 to 300100 to 200
50 to 10025 to 5010 to 25
0 to 10
Po p . G ro w th1990 - 2000 (% )
1 to 150.5 to 1
-0,5 to 0,5-1 to -0 .5
-0,5 to -2
Source: Sensus Penduduk BPS DIY
Source: Sensus Penduduk 2000 BPS
Main Report ATLAS Bantul Regency
SOCIAL Triple – A Demography 3 – 12
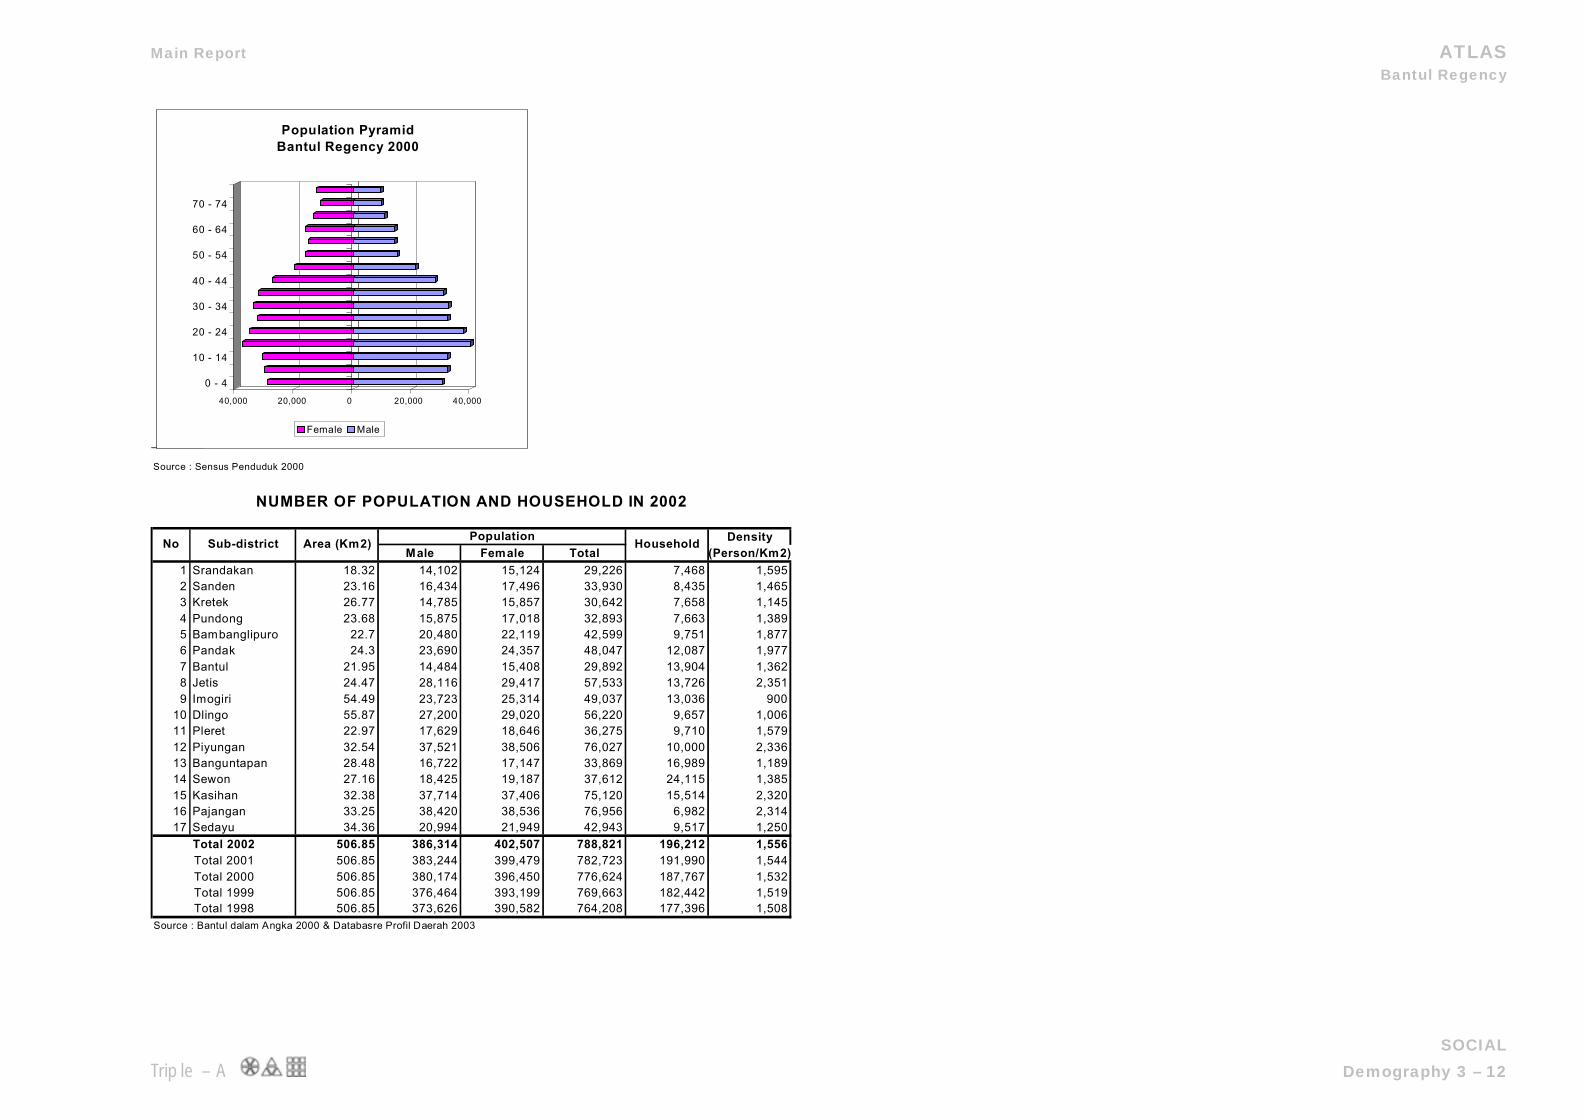
Source : Sensus Penduduk 2000
40,000 20,000 0 20,000 40,000
0 - 4
10 - 14
20 - 24
30 - 34
40 - 44
50 - 54
60 - 64
70 - 74
Population PyramidBantul Regency 2000
Female Male
DensityMale Female Total (Person/Km2)
1 Srandakan 18.32 14,102 15,124 29,226 7,468 1,5952 Sanden 23.16 16,434 17,496 33,930 8,435 1,4653 Kretek 26.77 14,785 15,857 30,642 7,658 1,1454 Pundong 23.68 15,875 17,018 32,893 7,663 1,3895 Bambanglipuro 22.7 20,480 22,119 42,599 9,751 1,8776 Pandak 24.3 23,690 24,357 48,047 12,087 1,9777 Bantul 21.95 14,484 15,408 29,892 13,904 1,3628 Jetis 24.47 28,116 29,417 57,533 13,726 2,3519 Imogiri 54.49 23,723 25,314 49,037 13,036 900
10 Dlingo 55.87 27,200 29,020 56,220 9,657 1,00611 Pleret 22.97 17,629 18,646 36,275 9,710 1,57912 Piyungan 32.54 37,521 38,506 76,027 10,000 2,33613 Banguntapan 28.48 16,722 17,147 33,869 16,989 1,18914 Sewon 27.16 18,425 19,187 37,612 24,115 1,38515 Kasihan 32.38 37,714 37,406 75,120 15,514 2,32016 Pajangan 33.25 38,420 38,536 76,956 6,982 2,31417 Sedayu 34.36 20,994 21,949 42,943 9,517 1,250
506.85 386,314 402,507 788,821 196,212 1,556506.85 383,244 399,479 782,723 191,990 1,544506.85 380,174 396,450 776,624 187,767 1,532506.85 376,464 393,199 769,663 182,442 1,519506.85 373,626 390,582 764,208 177,396 1,508
Source : Bantul dalam Angka 2000 & Databasre Profil Daerah 2003
Total 2000Total 1999Total 1998
Total 2001
NUMBER OF POPULATION AND HOUSEHOLD IN 2002
HouseholdPopulation
Total 2002
No Sub-district Area (Km2)
Main Report ATLAS Bantul Regency
SOCIAL Triple – A Social Welfare 3 - 13
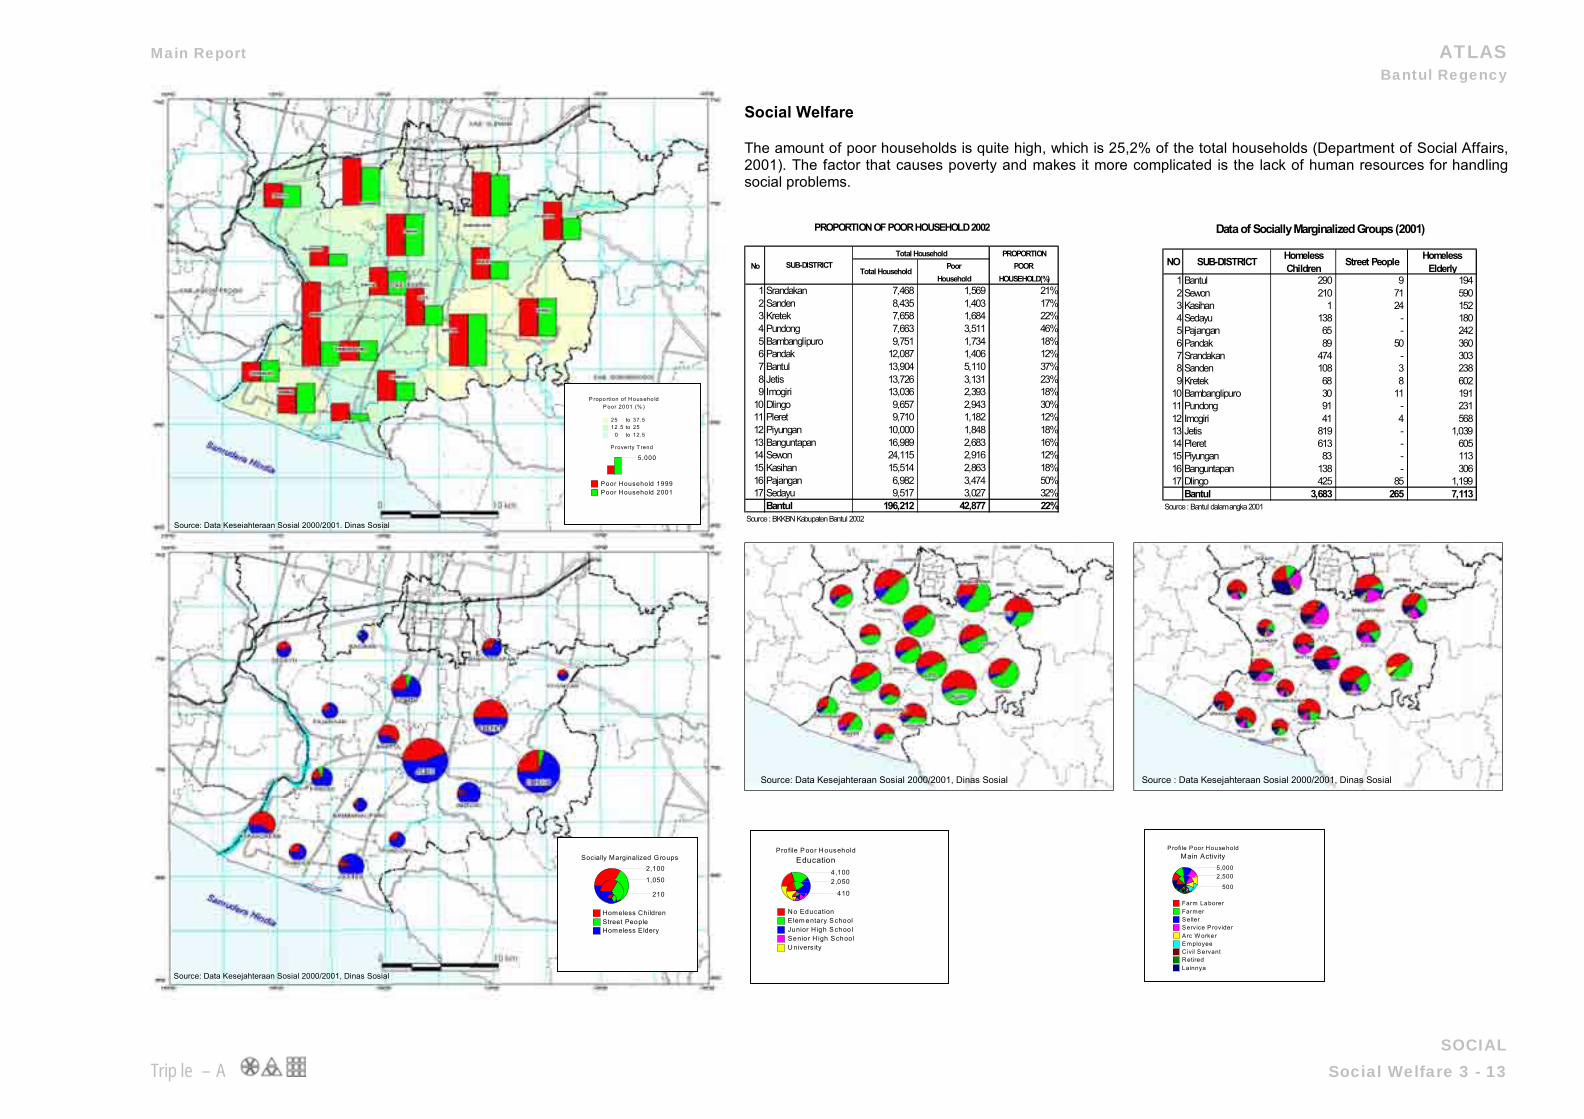
Social Welfare The amount of poor households is quite high, which is 25,2% of the total households (Department of Social Affairs, 2001). The factor that causes poverty and makes it more complicated is the lack of human resources for handling social problems.
PROPORTIONNo Poor POOR
Household HOUSEHOLD(%)1 Srandakan 7,468 1,569 21%2 Sanden 8,435 1,403 17%3 Kretek 7,658 1,684 22%4 Pundong 7,663 3,511 46%5 Bambanglipuro 9,751 1,734 18%6 Pandak 12,087 1,406 12%7 Bantul 13,904 5,110 37%8 Jetis 13,726 3,131 23%9 Imogiri 13,036 2,393 18%
10 Dlingo 9,657 2,943 30%11 Pleret 9,710 1,182 12%12 Piyungan 10,000 1,848 18%13 Banguntapan 16,989 2,683 16%14 Sewon 24,115 2,916 12%15 Kasihan 15,514 2,863 18%16 Pajangan 6,982 3,474 50%17 Sedayu 9,517 3,027 32%
Bantul 196,212 42,877 22%
Total Household
Source : BKKBN Kabupaten Bantul 2002
PROPORTION OF POOR HOUSEHOLD 2002
SUB-DISTRICTTotal Household
NO SUB-DISTRICT Homeless Children Street People Homeless
Elderly1 Bantul 290 9 194 2 Sewon 210 71 590 3 Kasihan 1 24 152 4 Sedayu 138 - 180 5 Pajangan 65 - 242 6 Pandak 89 50 360 7 Srandakan 474 - 303 8 Sanden 108 3 238 9 Kretek 68 8 602
10 Bambanglipuro 30 11 191 11 Pundong 91 - 231 12 Imogiri 41 4 568 13 Jetis 819 - 1,039 14 Pleret 613 - 605 15 Piyungan 83 - 113 16 Banguntapan 138 - 306 17 Dlingo 425 85 1,199
Bantul 3,683 265 7,113 Source : Bantul dalam angka 2001
Data of Socially Marginalized Groups (2001)
P roverty T rend
5,000
Poor Household 1999Poor Household 2001
P ropo rtion of H ous eho ldP oor 20 01 (% )
25 to 37.512 .5 to 25
0 to 12.5
Socially Marginalized Groups2,100
1,050
210
Homeless ChildrenStreet PeopleHomeless Eldery
Profile P oor HouseholdEducation
4,1002,050
410
No EducationElem entary S choolJunior H igh S choolSenior H igh S choolUnivers ity
Profile Poor HouseholdMain Activity
5,0002,500
500
Farm LaborerFarmerSellerService ProviderArc W orke rEmployeeCivil ServantRetiredLainnya
Source: Data Kesejahteraan Sosial 2000/2001, Dinas Sosial
Source: Data Kesejahteraan Sosial 2000/2001, Dinas Sosial
Source: Data Kesejahteraan Sosial 2000/2001, Dinas Sosial Source : Data Kesejahteraan Sosial 2000/2001, Dinas Sosial
Main Report ATLAS Bantul Regency
SOCIAL Triple – A Employment 3 - 14
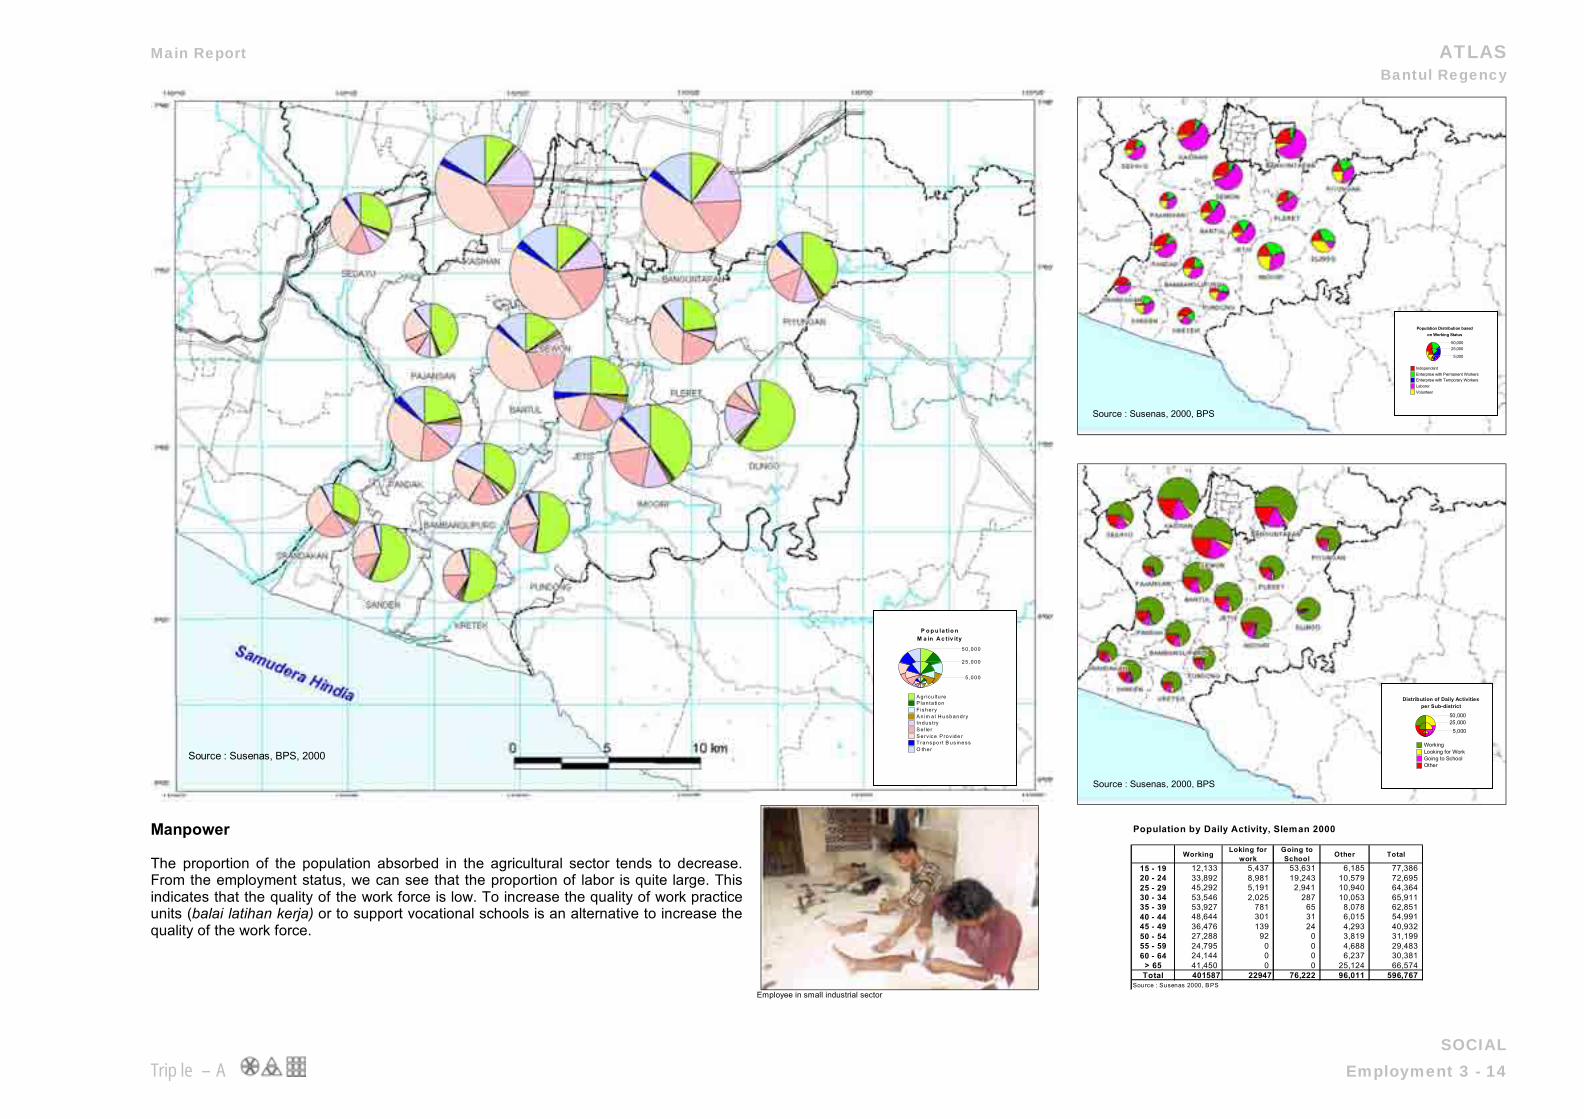
Manpower
The proportion of the population absorbed in the agricultural sector tends to decrease. From the employment status, we can see that the proportion of labor is quite large. This indicates that the quality of the work force is low. To increase the quality of work practice units (balai latihan kerja) or to support vocational schools is an alternative to increase the quality of the work force.
Employee in small industrial sector
Population by Daily Activity, Sleman 2000
Working Loking for work
Going to School Other Total
15 - 19 12,133 5,437 53,631 6,185 77,38620 - 24 33,892 8,981 19,243 10,579 72,69525 - 29 45,292 5,191 2,941 10,940 64,36430 - 34 53,546 2,025 287 10,053 65,91135 - 39 53,927 781 65 8,078 62,85140 - 44 48,644 301 31 6,015 54,99145 - 49 36,476 139 24 4,293 40,93250 - 54 27,288 92 0 3,819 31,19955 - 59 24,795 0 0 4,688 29,48360 - 64 24,144 0 0 6,237 30,381
> 65 41,450 0 0 25,124 66,574Total 401587 22947 76,222 96,011 596,767
Source : Susenas 2000, BPS
Source : Susenas, BPS, 2000
P o p u la tio nM a in A c t iv ity
50 ,000
25 ,000
5 ,000
A gr icu ltu reP lan ta tionF ishe ryA n im a l H u sbandryIndus tryS e lle rS e rv ice P rov ide rT ransport B us inessO the r
Population Distribution basedon Working Status
50,00025,000
5,000
IndependentEnterprise with Permanent WorkersEnterprise with Temporary WorkersLaborerVolunteer
Distribution of Daily Activitiesper Sub-district
50,00025,000
5,000
WorkingLooking for WorkGoing to SchoolOther
Source : Susenas, 2000, BPS
Source : Susenas, 2000, BPS
Main Report ATLAS Bantul Regency
SOCIAL Triple – A Education 3 - 15
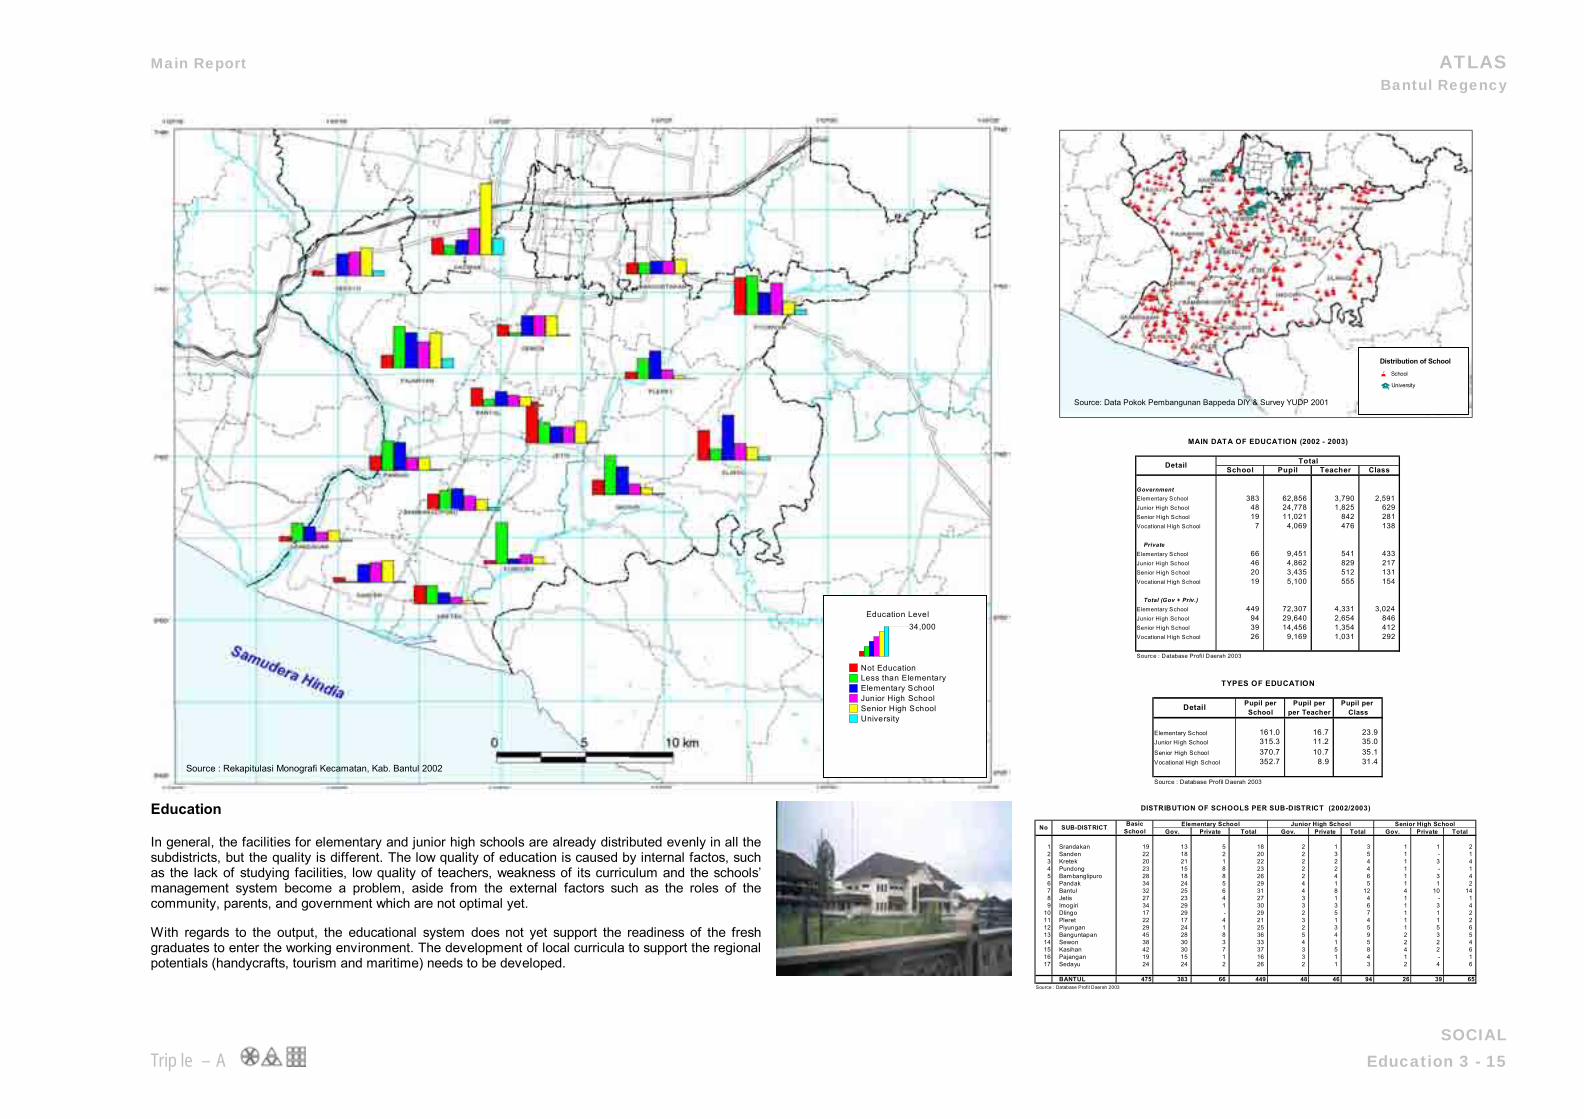
Education
In general, the facilities for elementary and junior high schools are already distributed evenly in all the subdistricts, but the quality is different. The low quality of education is caused by internal factos, such as the lack of studying facilities, low quality of teachers, weakness of its curriculum and the schools’ management system become a problem, aside from the external factors such as the roles of the community, parents, and government which are not optimal yet. With regards to the output, the educational system does not yet support the readiness of the fresh graduates to enter the working environment. The development of local curricula to support the regional potentials (handycrafts, tourism and maritime) needs to be developed.
School Pupil Teacher Class
GovernmentElementary School 383 62,856 3,790 2,591 Junior High School 48 24,778 1,825 629 Senior High School 19 11,021 842 281 Vocational High School 7 4,069 476 138
PrivateElementary School 66 9,451 541 433 Junior High School 46 4,862 829 217 Senior High School 20 3,435 512 131 Vocational High School 19 5,100 555 154
Total (Gov + Priv.)Elementary School 449 72,307 4,331 3,024 Junior High School 94 29,640 2,654 846 Senior High School 39 14,456 1,354 412 Vocational High School 26 9,169 1,031 292
Source : Database Profil Daerah 2003
MAIN DATA OF EDUCATION (2002 - 2003)
TotalDetail
Pupil per Pupil per Pupil per School per Teacher Class
Elementary School 161.0 16.7 23.9 Junior High School 315.3 11.2 35.0 Senior High School 370.7 10.7 35.1 Vocational High School 352.7 8.9 31.4
Source : Database Profil Daerah 2003
Detail
TYPES OF EDUCATION
Gov. Private Total Gov. Private Total Gov. Private Total
1 Srandakan 19 13 5 18 2 1 3 1 1 2 2 Sanden 22 18 2 20 2 3 5 1 - 1 3 Kretek 20 21 1 22 2 2 4 1 3 4 4 Pundong 23 15 8 23 2 2 4 1 - 1 5 Bambanglipuro 28 18 8 26 2 4 6 1 3 4 6 Pandak 34 24 5 29 4 1 5 1 1 2 7 Bantul 32 25 6 31 4 8 12 4 10 14 8 Jetis 27 23 4 27 3 1 4 1 - 1 9 Imogiri 34 29 1 30 3 3 6 1 3 4
10 Dlingo 17 29 - 29 2 5 7 1 1 2 11 Pleret 22 17 4 21 3 1 4 1 1 2 12 Piyungan 29 24 1 25 2 3 5 1 5 6 13 Banguntapan 45 28 8 36 5 4 9 2 3 5 14 Sewon 38 30 3 33 4 1 5 2 2 4 15 Kasihan 42 30 7 37 3 5 8 4 2 6 16 Pajangan 19 15 1 16 3 1 4 1 - 1 17 Sedayu 24 24 2 26 2 1 3 2 4 6
BANTUL 475 383 66 449 48 46 94 26 39 65Source : Database Profil Daerah 2003
Senior High School
DISTRIBUTION OF SCHOOLS PER SUB-DISTRICT (2002/2003)
No Basic School
Junior High SchoolSUB-DISTRICT Elementary School
Source : Rekapitulasi Monografi Kecamatan, Kab. Bantul 2002
Education Level34,000
Not EducationLess than ElementaryElementary SchoolJunior High SchoolSenior High SchoolUniversity
Source: Data Pokok Pembangunan Bappeda DIY & Survey YUDP 2001
G
Distribution of School
University
School
Main Report ATLAS Bantul Regency
SOCIAL Triple – A Health 3 - 16
Health
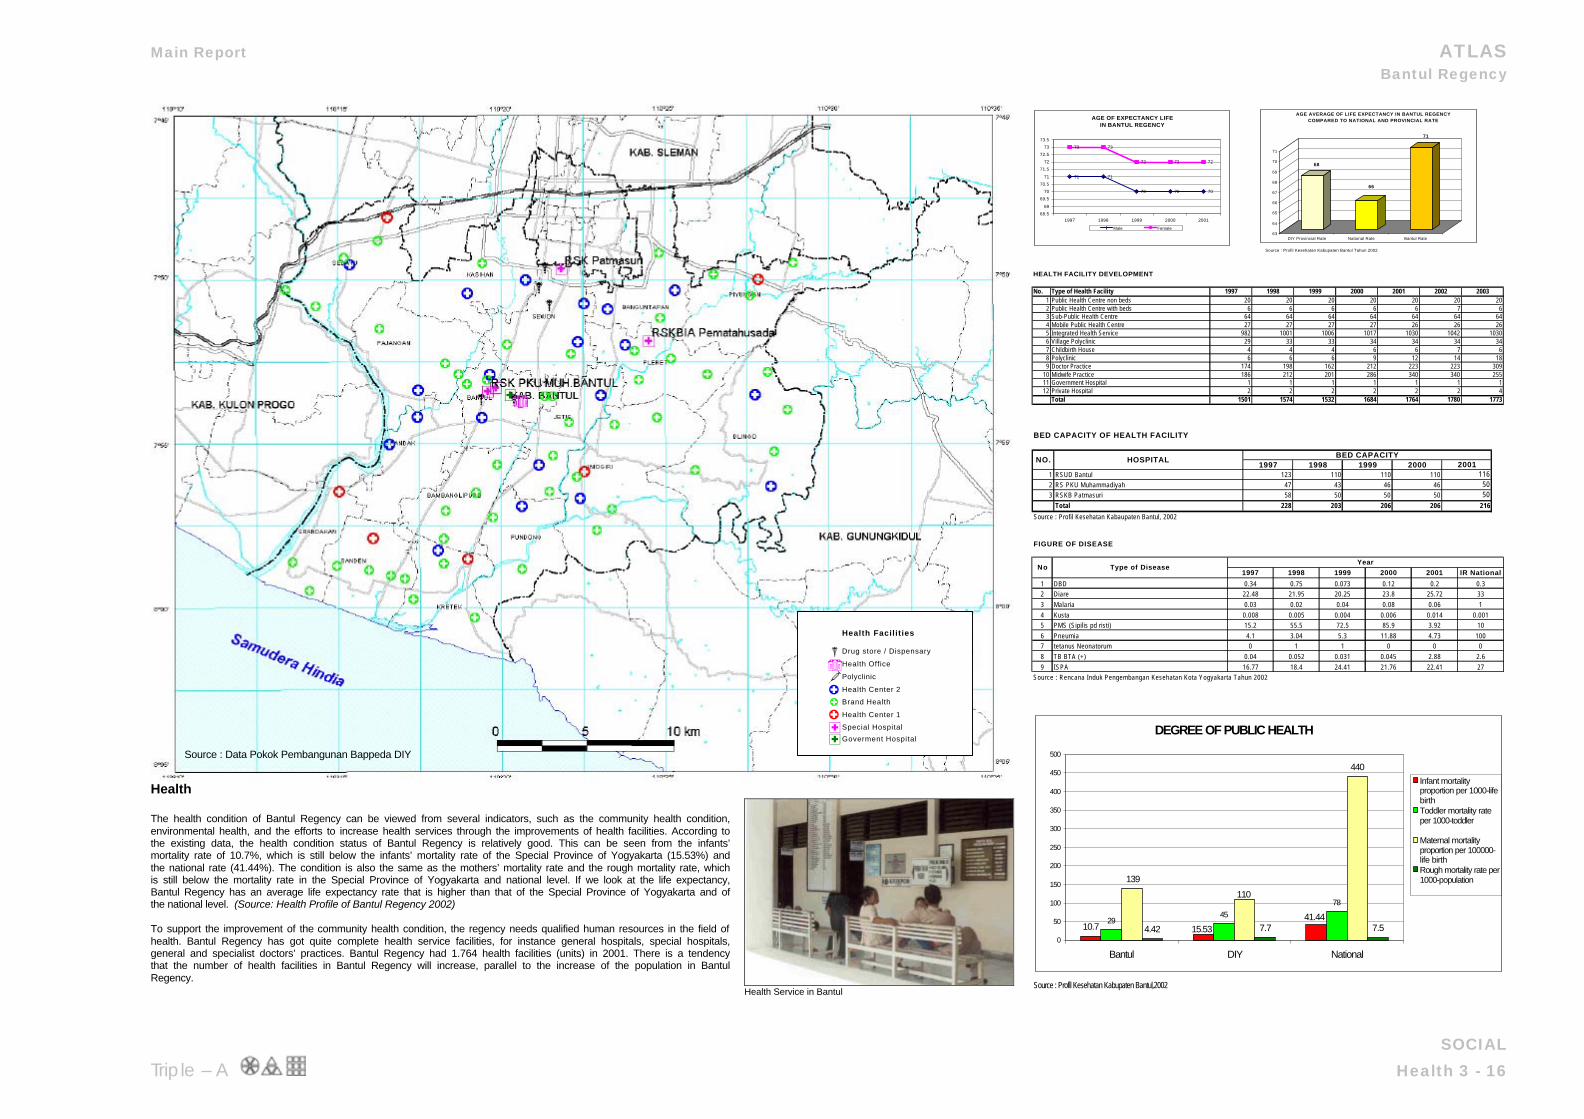
The health condition of Bantul Regency can be viewed from several indicators, such as the community health condition, environmental health, and the efforts to increase health services through the improvements of health facilities. According to the existing data, the health condition status of Bantul Regency is relatively good. This can be seen from the infants’ mortality rate of 10.7%, which is still below the infants’ mortality rate of the Special Province of Yogyakarta (15.53%) and the national rate (41.44%). The condition is also the same as the mothers’ mortality rate and the rough mortality rate, which is still below the mortality rate in the Special Province of Yogyakarta and national level. If we look at the life expectancy, Bantul Regency has an average life expectancy rate that is higher than that of the Special Province of Yogyakarta and of the national level. (Source: Health Profile of Bantul Regency 2002)
To support the improvement of the community health condition, the regency needs qualified human resources in the field of health. Bantul Regency has got quite complete health service facilities, for instance general hospitals, special hospitals, general and specialist doctors’ practices. Bantul Regency had 1.764 health facilities (units) in 2001. There is a tendency that the number of health facilities in Bantul Regency will increase, parallel to the increase of the population in Bantul Regency.
Health Service in Bantul
Source : Profil Kesehatan Kabupaten Bantul Tahun 2002
AGE OF EXPECTANCY LIFE IN BANTUL REGENCY
71 71
70 70 70
73 73
72 72 72
68.5
69
69.5
70
70.5
71
71.5
72
72.5
73
73.5
1997 1998 1999 2000 2001
Male Female
68
66
71
63
64
65
66
67
68
69
70
71
DIY Provincial Rate National Rate Bantul Rate
AGE AVERAGE OF LIFE EXPECTANCY IN BANTUL REGENCYCOMPARED TO NATIONAL AND PROVINCIAL RATE
HEALTH FACILITY DEVELOPMENT
No. Type of Health Facility 1997 1998 1999 2000 2001 2002 20031 Public Health Centre non beds 20 20 20 20 20 20 202 Public Health Centre with beds 6 6 6 6 6 7 63 Sub-Public Health Centre 64 64 64 64 64 64 644 Mobile Public Health Centre 27 27 27 27 26 26 265 Integrated Health Service 982 1001 1006 1017 1030 1042 10306 Village Polyclinic 29 33 33 34 34 34 347 Childbirth House 4 4 4 6 6 7 68 Polyclinic 6 6 6 9 12 14 189 Doctor Practice 174 198 162 212 223 223 309
10 Midwife Practice 186 212 201 286 340 340 25511 Government Hospital 1 1 1 1 1 1 112 Private Hospital 2 2 2 2 2 2 4
Total 1501 1574 1532 1684 1764 1780 1773
BED CAPACITY OF HEALTH FACILITY
1997 1998 1999 2000 20011 RSUD Bantul 123 110 110 110 1162 RS PKU Muhammadiyah 47 43 46 46 503 RSKB Patmasuri 58 50 50 50 50
Total 228 203 206 206 216
Source : Profil Kesehatan Kabaupaten Bantul, 2002
NO. HOSPITALBED CAPACITY
FIGURE OF DISEASE
1997 1998 1999 2000 2001 IR National
1 DBD 0.34 0.75 0.073 0.12 0.2 0.32 Diare 22.48 21.95 20.25 23.8 25.72 333 Malaria 0.03 0.02 0.04 0.08 0.06 14 Kusta 0.008 0.005 0.004 0.006 0.014 0.0015 PMS (Sipilis pd risti) 15.2 55.5 72.5 85.9 3.92 106 Pneumia 4.1 3.04 5.3 11.88 4.73 1007 tetanus Neonatorum 0 1 1 0 0 08 TB BTA (+) 0.04 0.052 0.031 0.045 2.88 2.69 ISPA 16.77 18.4 24.41 21.76 22.41 27
Source : Rencana Induk Pengembangan Kesehatan Kota Yogyakarta Tahun 2002
No Type of DiseaseYear
Source : Profil Kesehatan Kabupaten Bantul,2002
DEGREE OF PUBLIC HEALTH
10.729
45
78
4.42 7.7 7.541.44
15.53
110
440
139
0
50
100
150
200
250
300
350
400
450
500
Bantul DIY National
Infant mortalityproportion per 1000-lifebirthToddler mortality rateper 1000-toddler
Maternal mortalityproportion per 100000-life birthRough mortality rate per1000-population
Health Facilities
²Drug store / Dispensary
DHealth Office
ÕPolyclinic
/ Health Center 2
/ Brand Health
/ Health Center 1
çSpecial Hospital
çGoverment Hospital
Source : Data Pokok Pembangunan Bappeda DIY
Main Report ATLAS Bantul Regency
SOCIAL Triple – A Religion 3 - 17
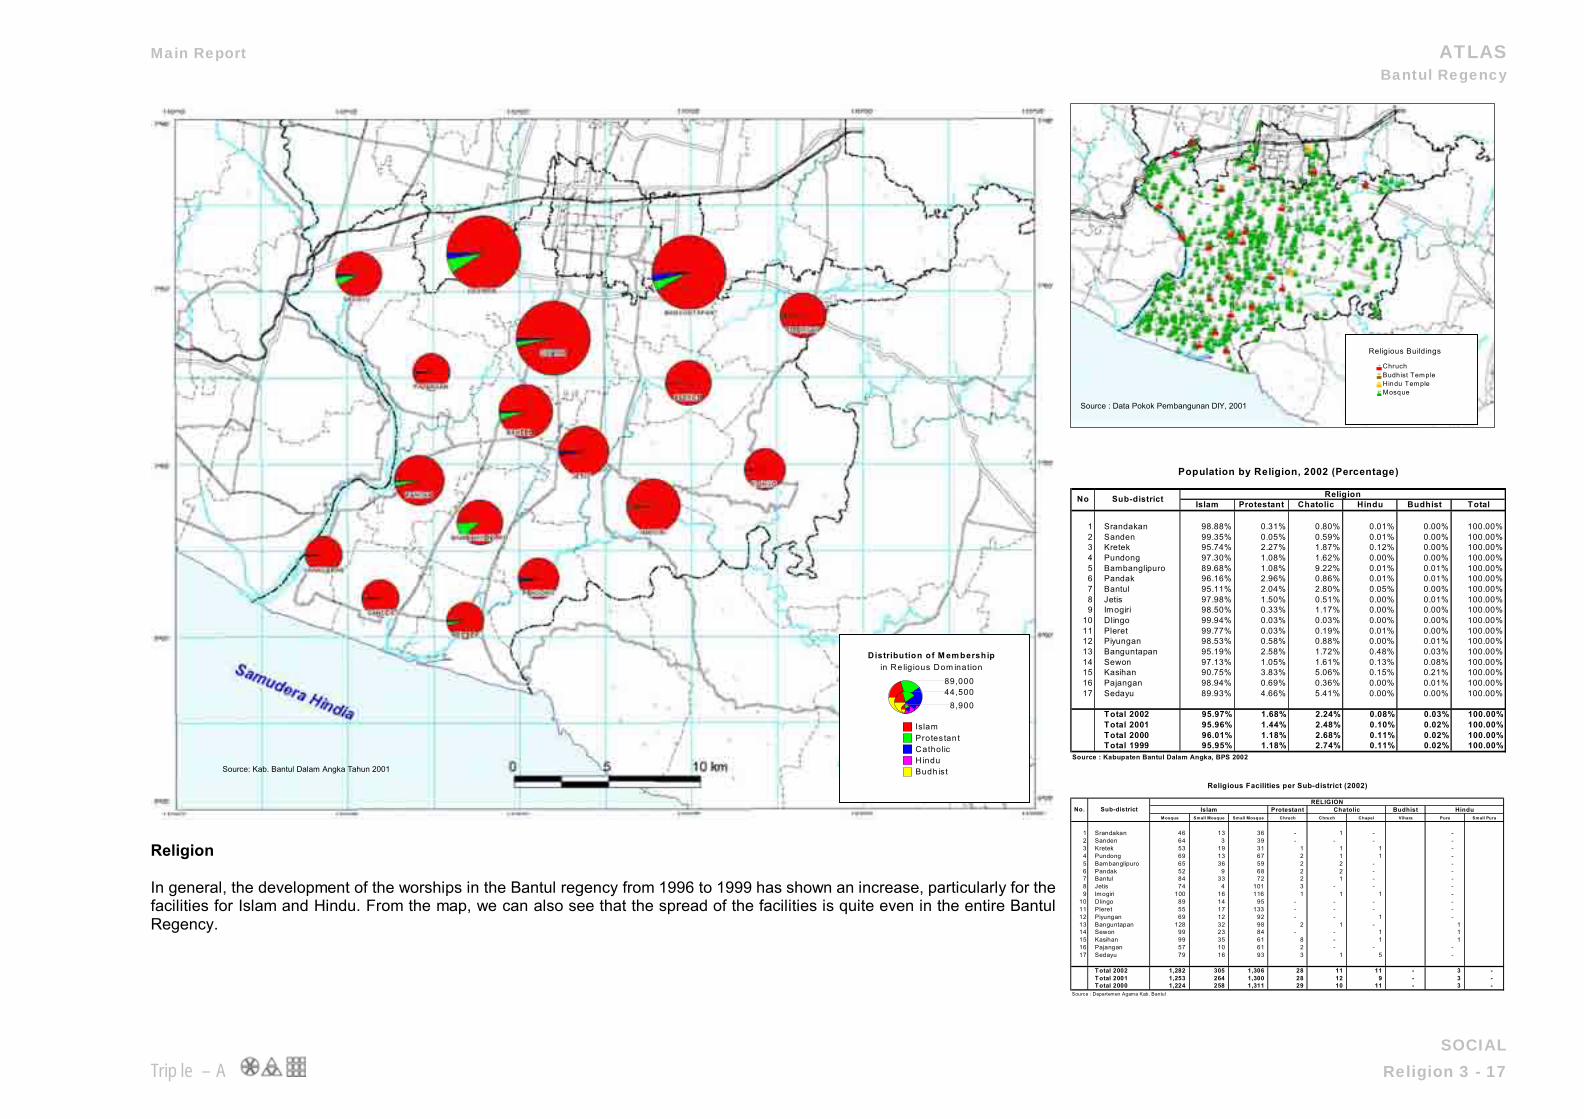
Religion In general, the development of the worships in the Bantul regency from 1996 to 1999 has shown an increase, particularly for the facilities for Islam and Hindu. From the map, we can also see that the spread of the facilities is quite even in the entire Bantul Regency.
Islam Protestant Chatolic Hindu Budhist Total
1 Srandakan 98.88% 0.31% 0.80% 0.01% 0.00% 100.00%2 Sanden 99.35% 0.05% 0.59% 0.01% 0.00% 100.00%3 Kretek 95.74% 2.27% 1.87% 0.12% 0.00% 100.00%4 Pundong 97.30% 1.08% 1.62% 0.00% 0.00% 100.00%5 Bambanglipuro 89.68% 1.08% 9.22% 0.01% 0.01% 100.00%6 Pandak 96.16% 2.96% 0.86% 0.01% 0.01% 100.00%7 Bantul 95.11% 2.04% 2.80% 0.05% 0.00% 100.00%8 Jetis 97.98% 1.50% 0.51% 0.00% 0.01% 100.00%9 Imogiri 98.50% 0.33% 1.17% 0.00% 0.00% 100.00%
10 Dlingo 99.94% 0.03% 0.03% 0.00% 0.00% 100.00%11 Pleret 99.77% 0.03% 0.19% 0.01% 0.00% 100.00%12 Piyungan 98.53% 0.58% 0.88% 0.00% 0.01% 100.00%13 Banguntapan 95.19% 2.58% 1.72% 0.48% 0.03% 100.00%14 Sewon 97.13% 1.05% 1.61% 0.13% 0.08% 100.00%15 Kasihan 90.75% 3.83% 5.06% 0.15% 0.21% 100.00%16 Pajangan 98.94% 0.69% 0.36% 0.00% 0.01% 100.00%17 Sedayu 89.93% 4.66% 5.41% 0.00% 0.00% 100.00%
Total 2002 95.97% 1.68% 2.24% 0.08% 0.03% 100.00%Total 2001 95.96% 1.44% 2.48% 0.10% 0.02% 100.00%Total 2000 96.01% 1.18% 2.68% 0.11% 0.02% 100.00%Total 1999 95.95% 1.18% 2.74% 0.11% 0.02% 100.00%
Source : Kabupaten Bantul Dalam Angka, BPS 2002
Population by Religion, 2002 (Percentage)
No Sub-district Religion
Protestant BudhistM osque Small Mosque Small Mosque Chruch Chruch Chapel Vihara Pura Small Pura
1 Srandakan 46 13 36 - 1 - - 2 Sanden 64 3 39 - - - - 3 Kretek 53 19 31 1 1 1 - 4 Pundong 69 13 67 2 1 1 - 5 Bambanglipuro 65 36 59 2 2 - - 6 Pandak 52 9 68 2 2 - - 7 Bantul 84 33 72 2 1 - - 8 Jetis 74 4 101 3 - - - 9 Imogiri 100 16 116 1 1 1 -
10 Dlingo 89 14 95 - - - - 11 Pleret 55 17 133 - - - - 12 Piyungan 69 12 92 - - 1 - 13 Banguntapan 128 32 98 2 1 - 1 14 Sewon 99 23 84 - - 1 1 15 Kasihan 99 35 61 8 - 1 1 16 Pajangan 57 10 61 2 - - - 17 Sedayu 79 16 93 3 1 5 -
Total 2002 1,282 305 1,306 28 11 11 - 3 - Total 2001 1,253 264 1,300 28 12 9 - 3 - Total 2000 1,224 258 1,311 29 10 11 - 3 -
Source : Departemen Agama Kab. Bantul
RELIGIONIslam ChatolicNo. Sub-district
Religious Facilities per Sub-district (2002)
Hindu
Distribution of M em bershipin Re lig ious Dom ination
89,00044,500
8,900
IslamProtes tan tCatholicH induBudh is t
Religious Buildings
IChruchvBudhist TemplewHindu TempleJMosque
Source : Data Pokok Pembangunan DIY, 2001
Source: Kab. Bantul Dalam Angka Tahun 2001
Main Report ATLAS Bantul Regency
CULTURE Triple – A Culture 3 - 18
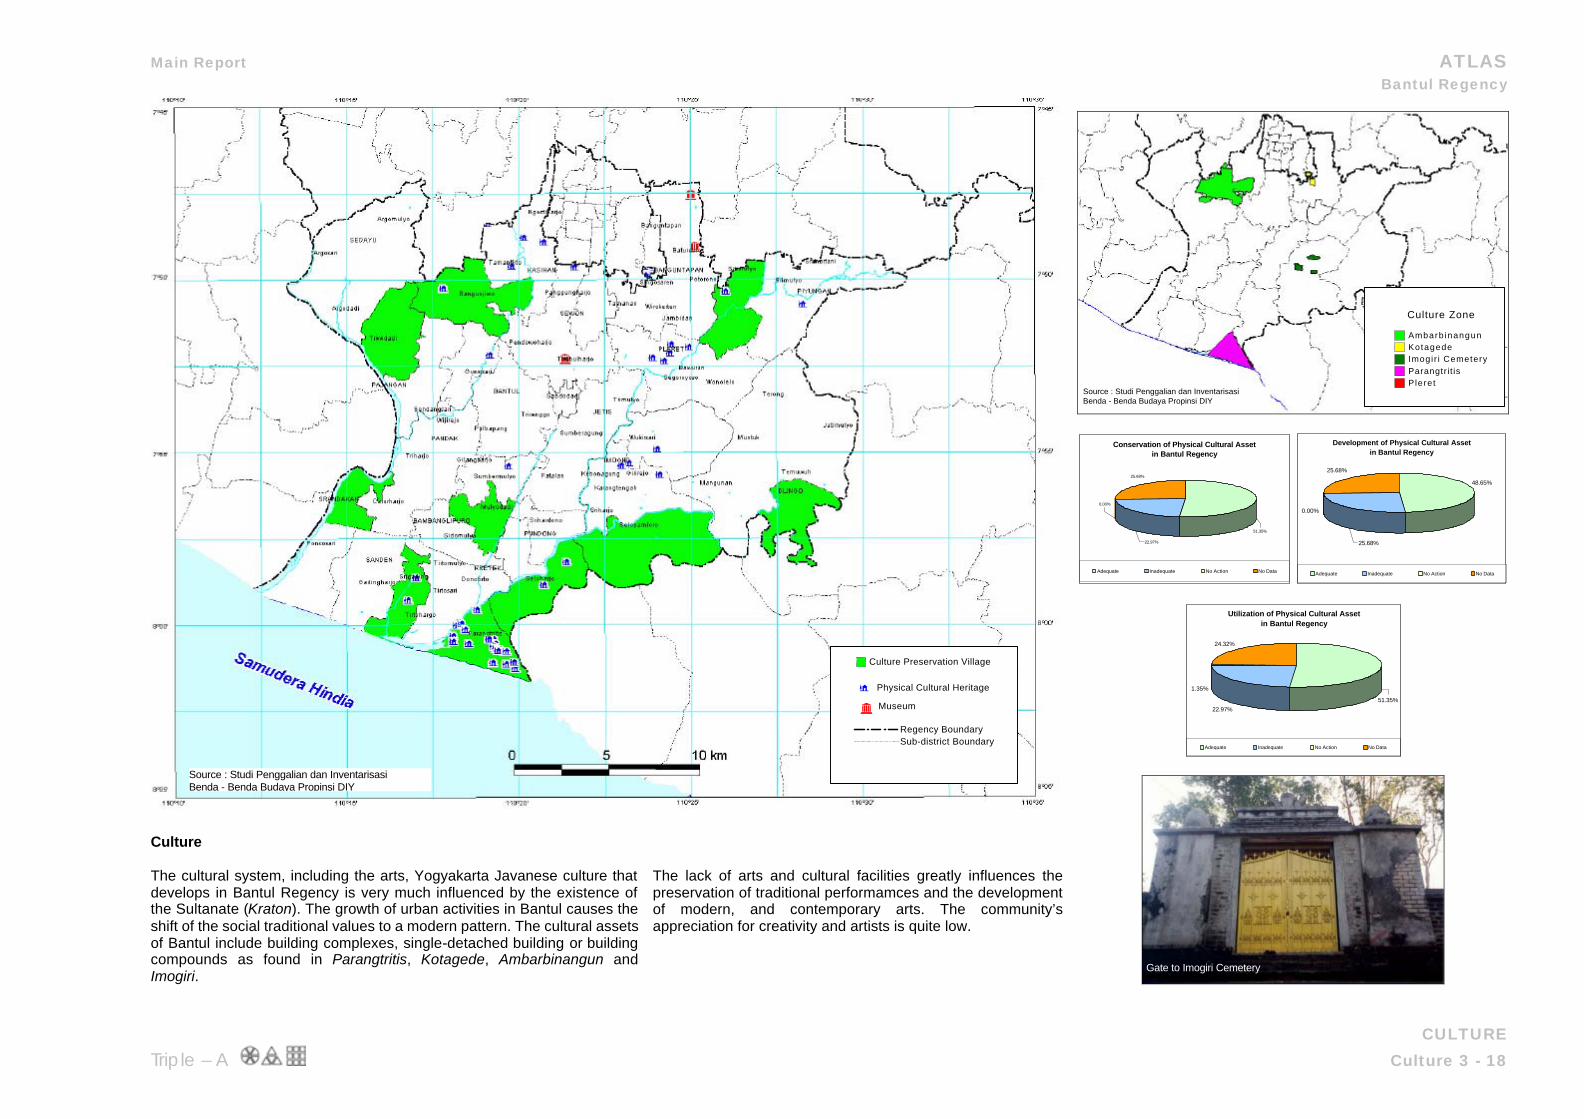
Culture The cultural system, including the arts, Yogyakarta Javanese culture that develops in Bantul Regency is very much influenced by the existence of the Sultanate (Kraton). The growth of urban activities in Bantul causes the shift of the social traditional values to a modern pattern. The cultural assets of Bantul include building complexes, single-detached building or building compounds as found in Parangtritis, Kotagede, Ambarbinangun and Imogiri.
The lack of arts and cultural facilities greatly influences the preservation of traditional performamces and the development of modern, and contemporary arts. The community’s appreciation for creativity and artists is quite low.
Conservation of Physical Cultural Asset in Bantul Regency
0.00%
22.97%
25.68%
51.35%
Adequate Inadequate No Action No Data
Development of Physical Cultural Asset in Bantul Regency
0.00%
48.65%
25.68%
25.68%
Adequate Inadequate No Action No Data
Utilization of Physical Cultural Asset in Bantul Regency
22.97%
1.35%
24.32%
51.35%
Adequate Inadequate No Action No Data
Culture Zone
Ambarb inangunKotagedeImogir i CemeteryParangtri t isPleret
{{{{{{{{{{{{{{{{{{{{{{{{{{{{{{{{{{{{{{{{{{{{{{{{{
†††††††††††††††††††††††††††††††††††††††††††††††††
Culture Preservation Village
Regency BoundarySub-district Boundary
Museum
Physical Cultural Heritage
Source : Studi Penggalian dan Inventarisasi Benda - Benda Budaya Propinsi DIY
Gate to Imogiri Cemetery
Source : Studi Penggalian dan Inventarisasi Benda - Benda Budaya Propinsi DIY
Main Report ATLAS Bantul Regency
INFRASTRUCTURE Triple – A Housing 4 - 1
HOUSING COMPOSITION IN BANTUL REGENCY, 2002
Permanent (A) Semi-Permanent (B)
Temporary (C)
1 Srandakan 5,948 285 2,477 8,710 7132 1.22 6,233 -899 0.872 Sanden 7,529 74 7,603 8385 0.91 7,603 -782 0.913 Kretek 7,439 201 135 7,775 7643 1.02 7,640 -3 1.004 Pundong 5,463 1,381 371 7,215 7659 0.94 6,844 -815 0.895 Bambanglipuro 7,249 1,152 143 8,544 9724 0.88 8,401 -1,323 0.866 Pandak 5,463 1,344 1,601 8,408 12042 0.70 6,807 -5,235 0.577 Pajangan 17,575 1,250 18,825 6969 2.70 18,825 11,856 2.708 Bantul 14,182 5,899 5,686 25,767 13901 1.85 20,081 6,180 1.449 Jetis 12,236 7,089 645 19,970 13697 1.46 19,325 5,628 1.41
10 Imogiri 7,353 1,770 2,657 11,780 12989 0.91 9,123 -3,866 0.7011 Dlingo 423 288 903 1,614 8725 0.18 711 -8,014 0.0812 Banguntapab 6,013 6,010 253 12,276 16949 0.72 12,023 -4,926 0.7113 Pleret 5,200 1,759 611 7,570 10104 0.75 6,959 -3,145 0.6914 Piyungan 4,943 4,726 941 10,610 9974 1.06 9,669 -305 0.9715 Sewon 8,050 6,923 69 15,042 23623 0.64 14,973 -8,650 0.6316 Kasihan 18,016 1,640 2,511 22,167 15482 1.43 19,656 4,174 1.2717 Sedayu 7,139 635 1,040 8,814 9510 0.93 7,774 -1,736 0.82
Total 140,221 42,426 20,043 202,690 194508 1.04 182,647 -11,861 0.94Source : Rekapitulasi Monografi Kecamatan Se Kabupaten Bantul, 2002 semester II, Tapem
No. Sub-districtTotal Housing Units by Building Quality
TotalRasio of Housing
Provision to Household
Total Household
Ratio of Household/
Housing
Total Housing Provision
Back-log
TREND OF HOUSING (2000 - 2002)
1999 2000 2001 2002Permanent/Type A 26,224Semi Permanent/Type B 42,439Temporary/ Type C 25,694Total 94,357
Source: Rekapitulasi Monografi Kecamatan Se Kabupaten Bantul,2000 -2002 semester II, Tapem
No. Housing Quality Trend of Housing
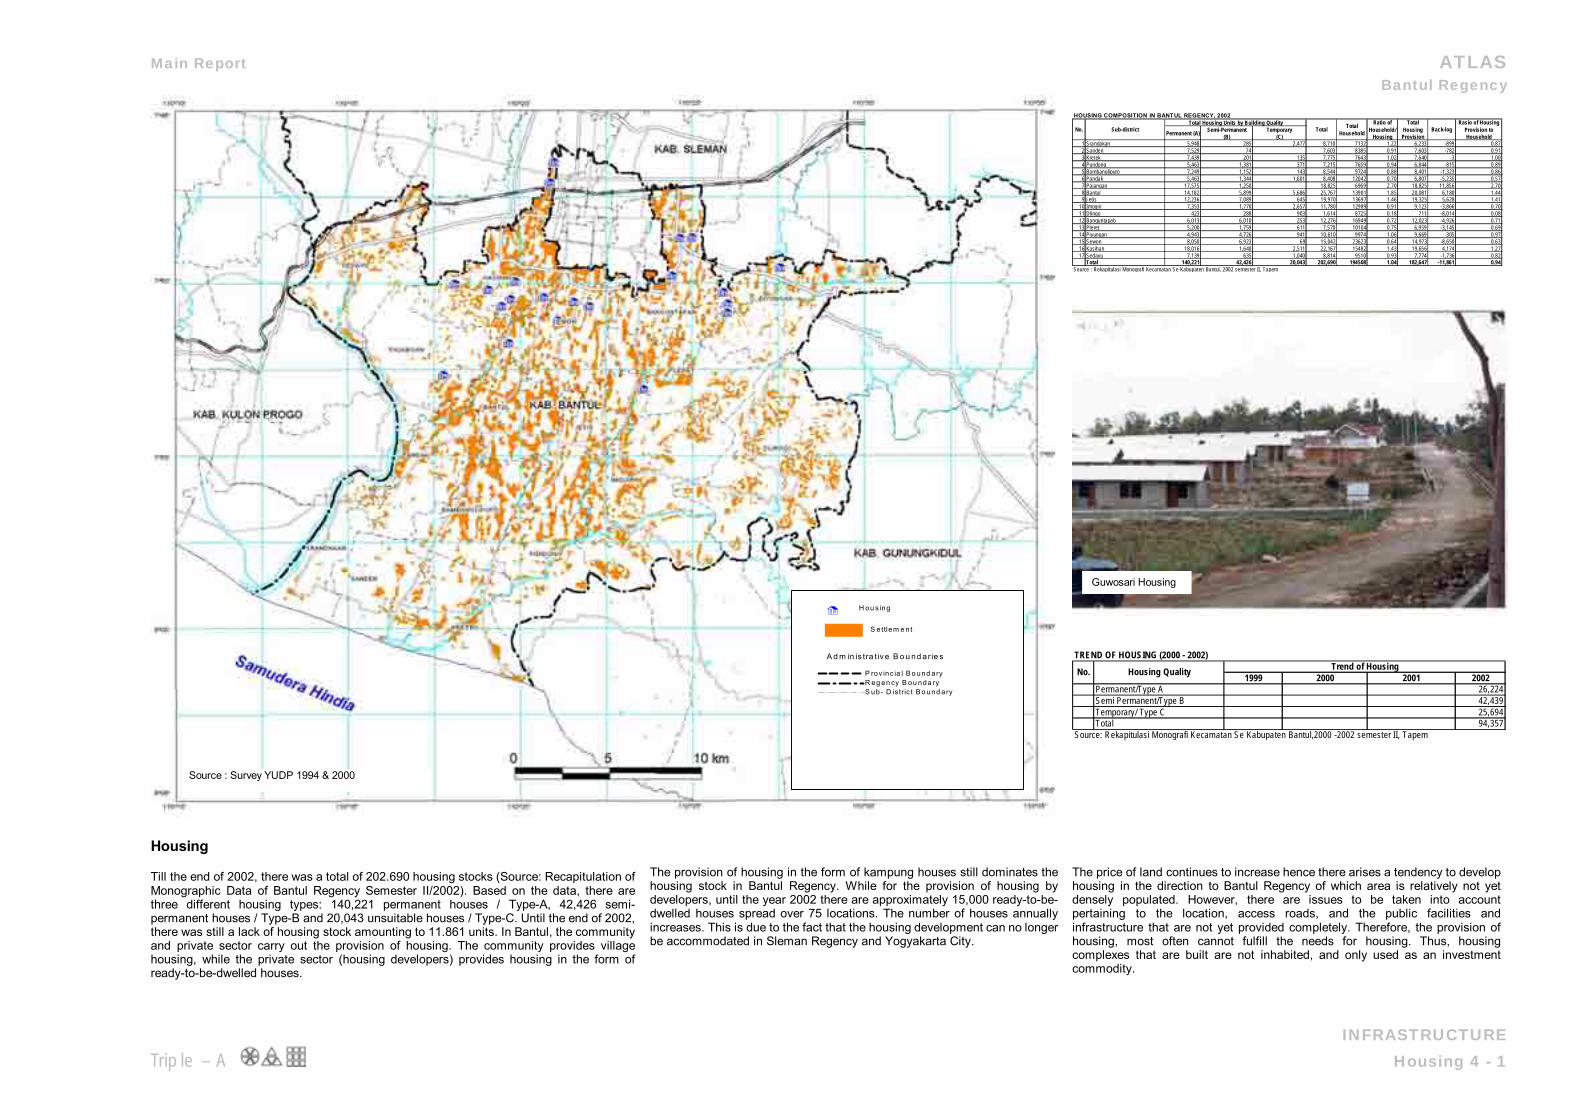
Housing Till the end of 2002, there was a total of 202.690 housing stocks (Source: Recapitulation of Monographic Data of Bantul Regency Semester II/2002). Based on the data, there are three different housing types: 140,221 permanent houses / Type-A, 42,426 semi-permanent houses / Type-B and 20,043 unsuitable houses / Type-C. Until the end of 2002, there was still a lack of housing stock amounting to 11.861 units. In Bantul, the community and private sector carry out the provision of housing. The community provides village housing, while the private sector (housing developers) provides housing in the form of ready-to-be-dwelled houses.
The provision of housing in the form of kampung houses still dominates the housing stock in Bantul Regency. While for the provision of housing by developers, until the year 2002 there are approximately 15,000 ready-to-be-dwelled houses spread over 75 locations. The number of houses annually increases. This is due to the fact that the housing development can no longer be accommodated in Sleman Regency and Yogyakarta City.
The price of land continues to increase hence there arises a tendency to develop housing in the direction to Bantul Regency of which area is relatively not yet densely populated. However, there are issues to be taken into account pertaining to the location, access roads, and the public facilities and infrastructure that are not yet provided completely. Therefore, the provision of housing, most often cannot fulfill the needs for housing. Thus, housing complexes that are built are not inhabited, and only used as an investment commodity.
CCCCCCCCCCCCCCCCCCCCCCCCCCCCCCCCCCCCCCCCCCCCCCCCC
A d m in is tra tiv e B o u nd ar ie s
P rov inc ia l B o und aryR eg en cy B ou nda ryS ub- D istric t B o und ary
H ou s ing
S ettlem e nt
Source : Survey YUDP 1994 & 2000
Guwosari Housing
Main Report ATLAS Bantul Regency
INFRASTRUCTURE Triple – A Transportation 4 – 2
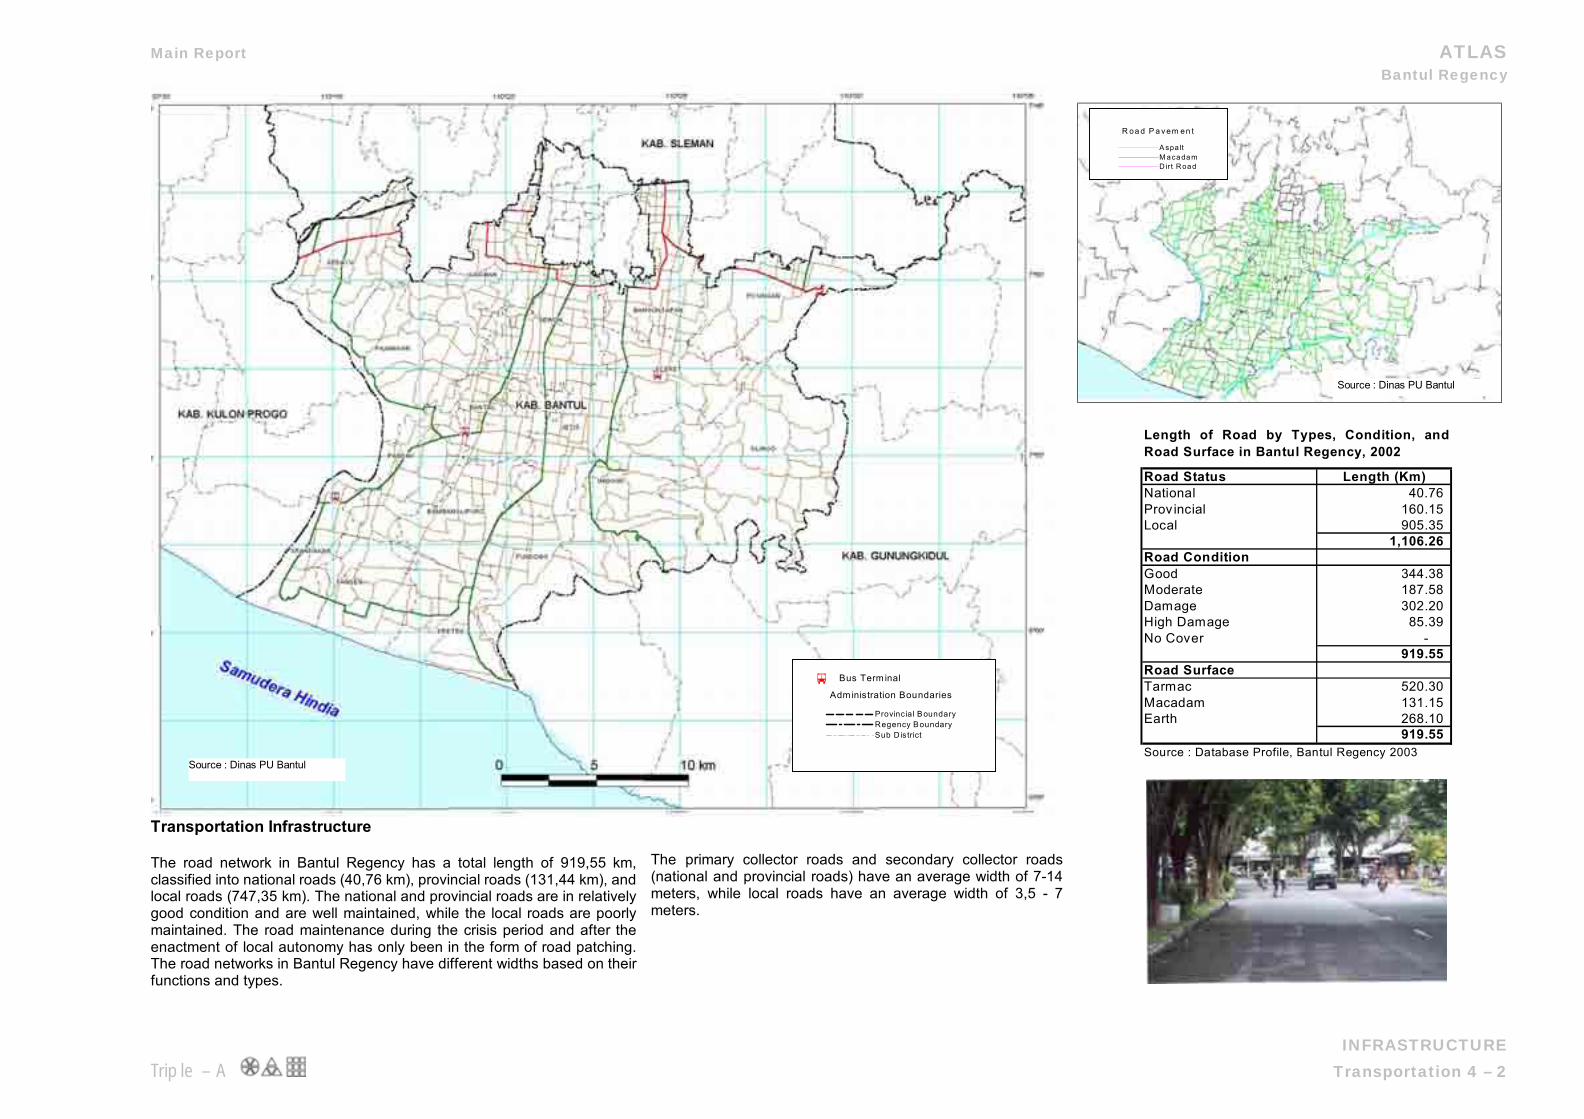
Transportation Infrastructure The road network in Bantul Regency has a total length of 919,55 km, classified into national roads (40,76 km), provincial roads (131,44 km), and local roads (747,35 km). The national and provincial roads are in relatively good condition and are well maintained, while the local roads are poorly maintained. The road maintenance during the crisis period and after the enactment of local autonomy has only been in the form of road patching. The road networks in Bantul Regency have different widths based on their functions and types.
The primary collector roads and secondary collector roads (national and provincial roads) have an average width of 7-14 meters, while local roads have an average width of 3,5 - 7 meters.
Road Status Length (Km)National 40.76 Prov incial 160.15 Local 905.35
1,106.26 Road ConditionGood 344.38 Moderate 187.58 Damage 302.20 High Damage 85.39 No Cover -
919.55 Road SurfaceTarmac 520.30 Macadam 131.15 Earth 268.10 919.55 Source : Database Profile, Bantul Regency 2003
Length of Road by Types, Condition, andRoad Surface in Bantul Regency, 2002
Administration Boundaries
Provincial BoundaryRegency BoundarySub District
îîîîîîîîîîîîîîîîîîîîîîîîîîîîîîîîîîîîîîîîîîîîîîîîî Bus Term inal
Source : Dinas PU Bantul
R oa d P a v em en t
A spa ltM a ca da mD irt R oa d
Source : Dinas PU Bantul
Main Report ATLAS Bantul Regency
INFRASTRUCTURE Triple – A Transportation 4 – 3
Traffic Lights
Public Private Official1 Bus 665 5,678 42 2 Jeep 1,065 20 3 Pick Up 2,746 45 4 Truck 81 1,221 33 5 Motorcycle 109,588 765 6 Ambulance 27
Total 746 120,298 932 Source : Kabupaten Bantul Dalam Angka 2002
Number of Vehicles in Bantul Regency, 2001
No. Type of Vehicle Total (Unit)
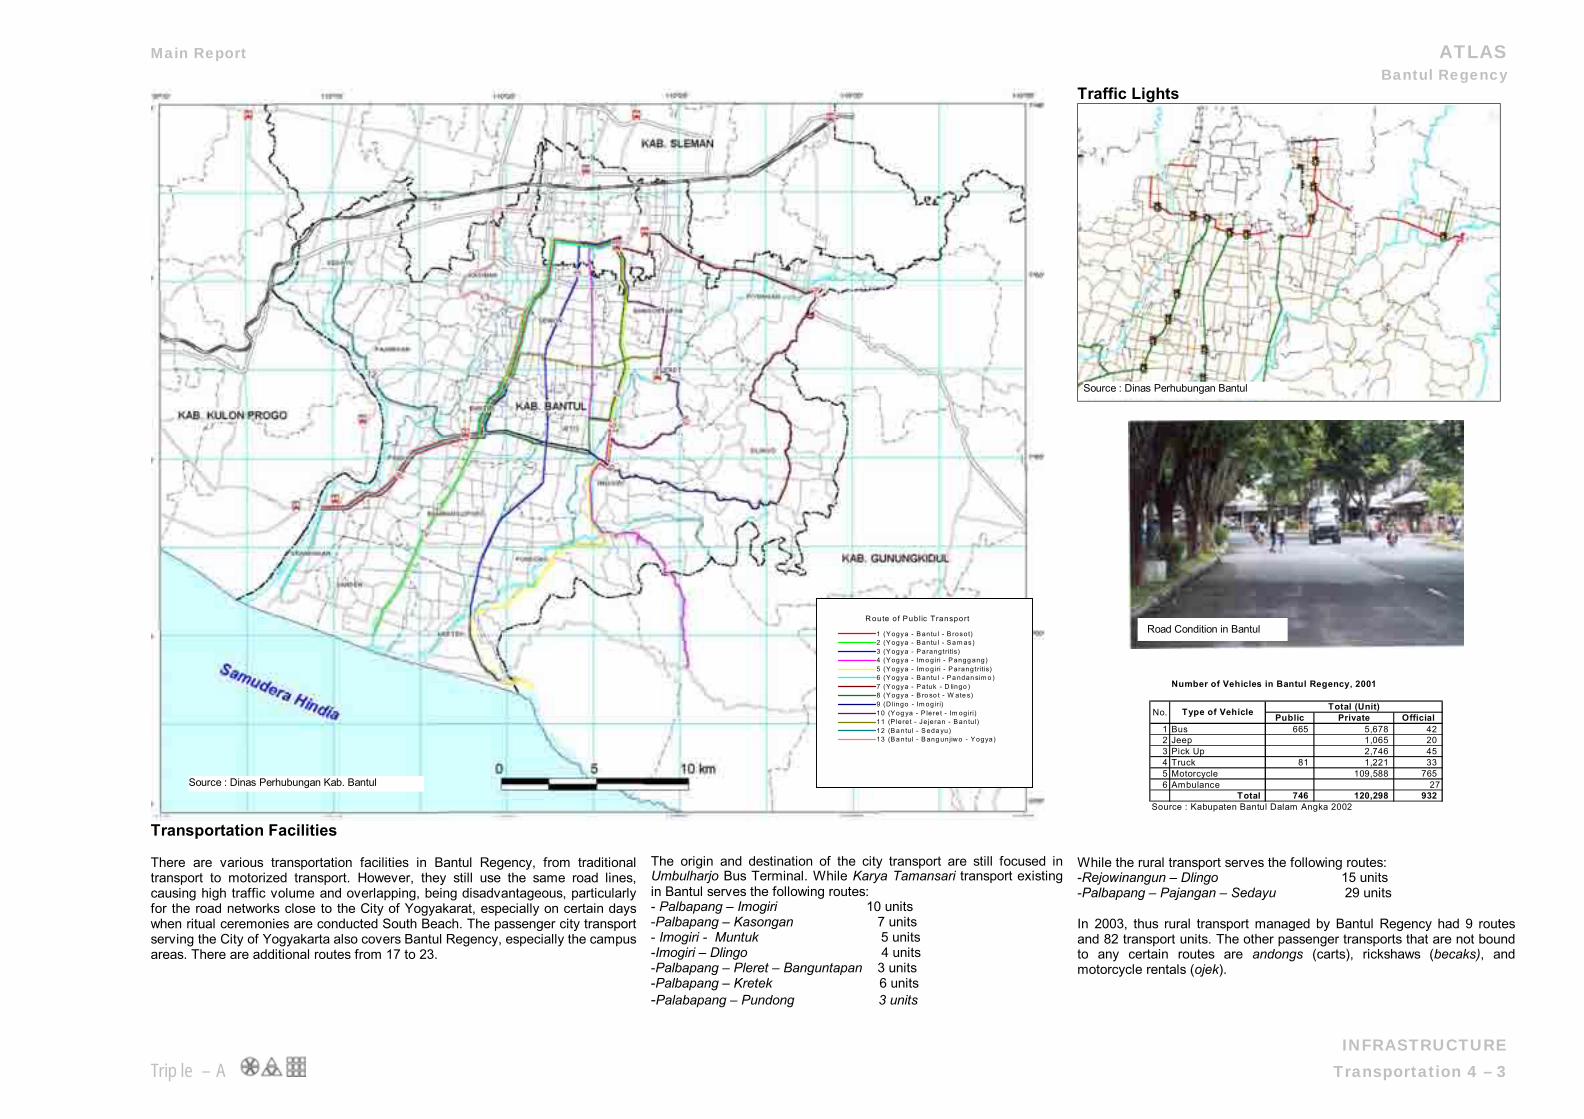
Transportation Facilities There are various transportation facilities in Bantul Regency, from traditional transport to motorized transport. However, they still use the same road lines, causing high traffic volume and overlapping, being disadvantageous, particularly for the road networks close to the City of Yogyakarat, especially on certain days when ritual ceremonies are conducted South Beach. The passenger city transport serving the City of Yogyakarta also covers Bantul Regency, especially the campus areas. There are additional routes from 17 to 23.
The origin and destination of the city transport are still focused in Umbulharjo Bus Terminal. While Karya Tamansari transport existing in Bantul serves the following routes: - Palbapang – Imogiri 10 units -Palbapang – Kasongan 7 units - Imogiri - Muntuk 5 units -Imogiri – Dlingo 4 units -Palbapang – Pleret – Banguntapan 3 units -Palbapang – Kretek 6 units -Palabapang – Pundong 3 units
While the rural transport serves the following routes: -Rejowinangun – Dlingo 15 units -Palbapang – Pajangan – Sedayu 29 units In 2003, thus rural transport managed by Bantul Regency had 9 routes and 82 transport units. The other passenger transports that are not bound to any certain routes are andongs (carts), rickshaws (becaks), and motorcycle rentals (ojek).
R oute of Public Transport
1 (Y ogya - B antu l - B rosot)2 (Y ogya - B antu l - S a m as)3 (Y ogya - P arangtritis)4 (Y ogya - Im o giri - P angg ang)5 (Y ogya - Im o giri - P arangtritis)6 (Y ogya - B antu l - P a ndan sim o )7 (Y ogya - P atuk - D lingo )8 (Y ogya - B ro so t - W ate s)9 (D lingo - Im ogir i)10 (Y og ya - P leret - Im ogiri)11 (P leret - Je jeran - B an tu l)12 (B a ntu l - S eda yu)13 (B a ntu l - B ang unjiwo - Y ogya)
Source : Dinas Perhubungan Kab. Bantul
Road Condition in Bantul
Source : Dinas Perhubungan Bantul
Main Report ATLAS Bantul Regency
INFRASTRUCTURE Triple – A Drainage 4 – 4
Overflow Location
River Catchment Areas
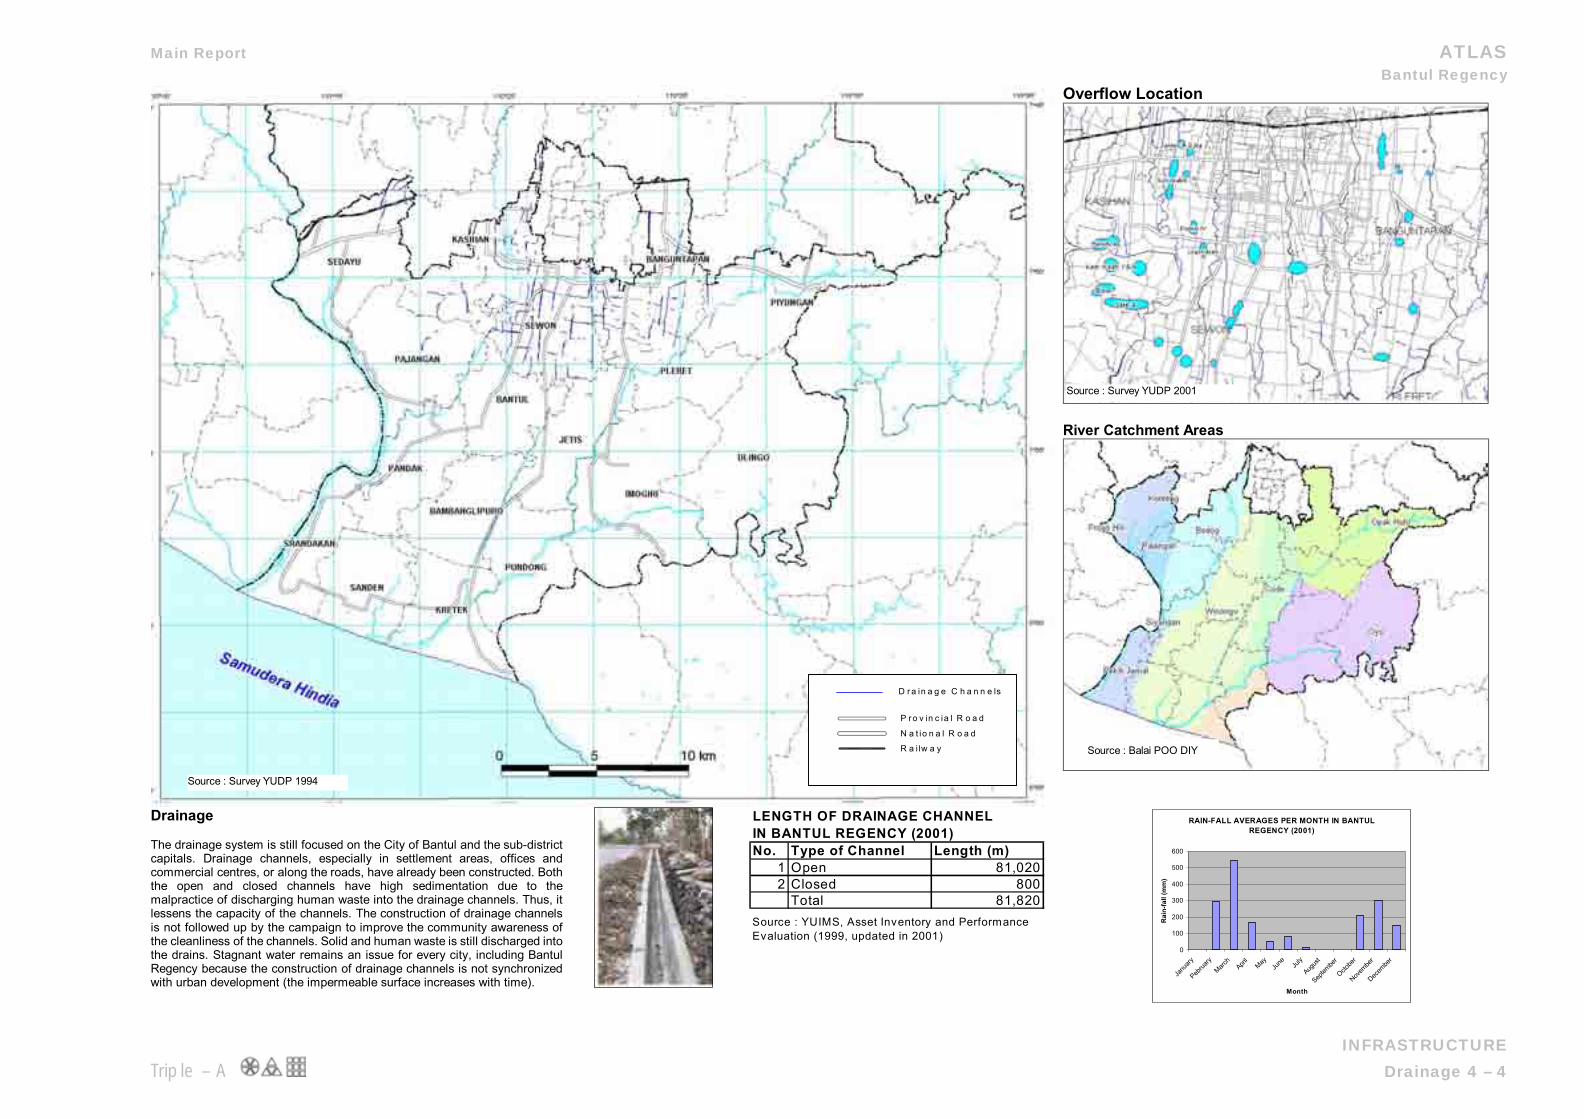
Drainage The drainage system is still focused on the City of Bantul and the sub-district capitals. Drainage channels, especially in settlement areas, offices and commercial centres, or along the roads, have already been constructed. Both the open and closed channels have high sedimentation due to the malpractice of discharging human waste into the drainage channels. Thus, it lessens the capacity of the channels. The construction of drainage channels is not followed up by the campaign to improve the community awareness of the cleanliness of the channels. Solid and human waste is still discharged into the drains. Stagnant water remains an issue for every city, including Bantul Regency because the construction of drainage channels is not synchronized with urban development (the impermeable surface increases with time).
LENGTH OF DRAINAGE CHANNELIN BANTUL REGENCY (2001)No. Type of Channel Length (m)
1 Open 81,0202 Closed 800
Total 81,820Source : YUIMS, Asset Inventory and Performance Evaluation (1999, updated in 2001)
RAIN-FALL AVERAGES PER MONTH IN BANTUL REGENCY (2001)
0
100
200
300
400
500
600
Janu
aryPeb
ruary
March
April
MayJu
ne July
Augus
tSep
tembe
rOcto
ber
Novem
ber
Decem
ber
Month
Rai
n-fa
ll (m
m)
D r a in a g e C h a n n e ls
P r o v in c ia l R o a d
N a t io n a l R o a d
R a i lw a y
Source : Survey YUDP 1994
Source : Balai POO DIY
Source : Survey YUDP 2001
Main Report ATLAS Bantul Regency
Triple – A
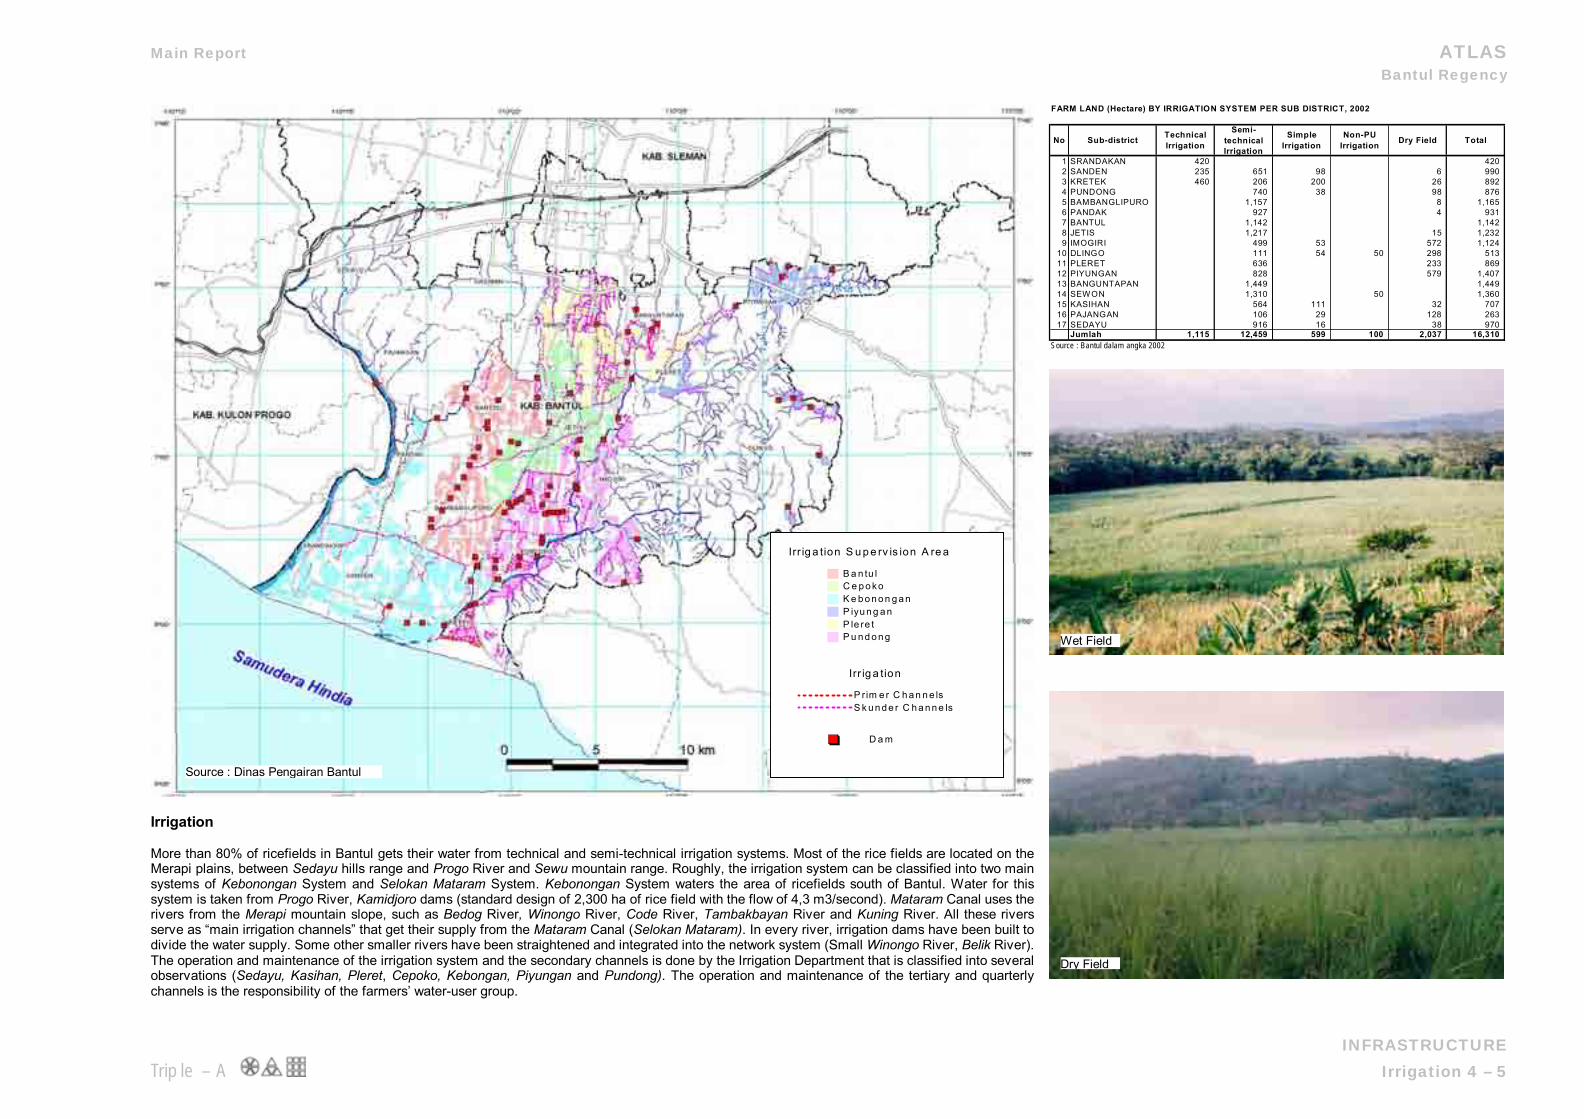
Irrigation More than 80% of ricefields in Bantul gets their water from technical and semi-technical irrigation systems. Most of the rice fields Merapi plains, between Sedayu hills range and Progo River and Sewu mountain range. Roughly, the irrigation system can be classsystems of Kebonongan System and Selokan Mataram System. Kebonongan System waters the area of ricefields south of Bansystem is taken from Progo River, Kamidjoro dams (standard design of 2,300 ha of rice field with the flow of 4,3 m3/second). Matararivers from the Merapi mountain slope, such as Bedog River, Winongo River, Code River, Tambakbayan River and Kuning Riveserve as “main irrigation channels” that get their supply from the Mataram Canal (Selokan Mataram). In every river, irrigation dams divide the water supply. Some other smaller rivers have been straightened and integrated into the network system (Small Winongo RThe operation and maintenance of the irrigation system and the secondary channels is done by the Irrigation Department that is clasobservations (Sedayu, Kasihan, Pleret, Cepoko, Kebongan, Piyungan and Pundong). The operation and maintenance of the tertchannels is the responsibility of the farmers’ water-user group.
FARM LAND (Hectare) BY IRRIGATION SYSTEM PER SUB DISTRICT, 2002
No Sub-district Technical Irrigation
Semi-technical Irrigation
Simple Irrigation
Non-PU Irrigation Dry Field Total
1 SRANDAKAN 420 420 2 SANDEN 235 651 98 6 990 3 KRETEK 460 206 200 26 892 4 PUNDONG 740 38 98 876 5 BAMBANGLIPURO 1,157 8 1,165 6 PANDAK 927 4 931 7 BANTUL 1,142 1,142 8 JETIS 1,217 15 1,232 9 IMOGIRI 499 53 572 1,124
10 DLINGO 111 54 50 298 513 11 PLERET 636 233 869 12 PIYUNGAN 828 579 1,407 13 BANGUNTAPAN 1,449 1,449 14 SEWON 1,310 50 1,360 15 KASIHAN 564 111 32 707 16 PAJANGAN 106 29 128 263 17 SEDAYU 916 16 38 970
Jumlah 1,115 12,459 599 100 2,037 16,310 Source : Bantul dalam angka 2002
Source : Dinas Pengairan Bantul
Irr ig a tion S u p e rv is ion A
B a n tu lC e p o koK e b o n o n g a nP iyu n g a nP le re tP u n d o n g
Irr ig a tion
P rim e r C h a n nS k u n d e r C h a n
D a m
INFRASTRUCTURE Irrigation 4 – 5
are located on the ified into two main tul. Water for this m Canal uses the r. All these rivers have been built to iver, Belik River). sified into several iary and quarterly
Dry Field
Wet Field
re a
e lsn e ls
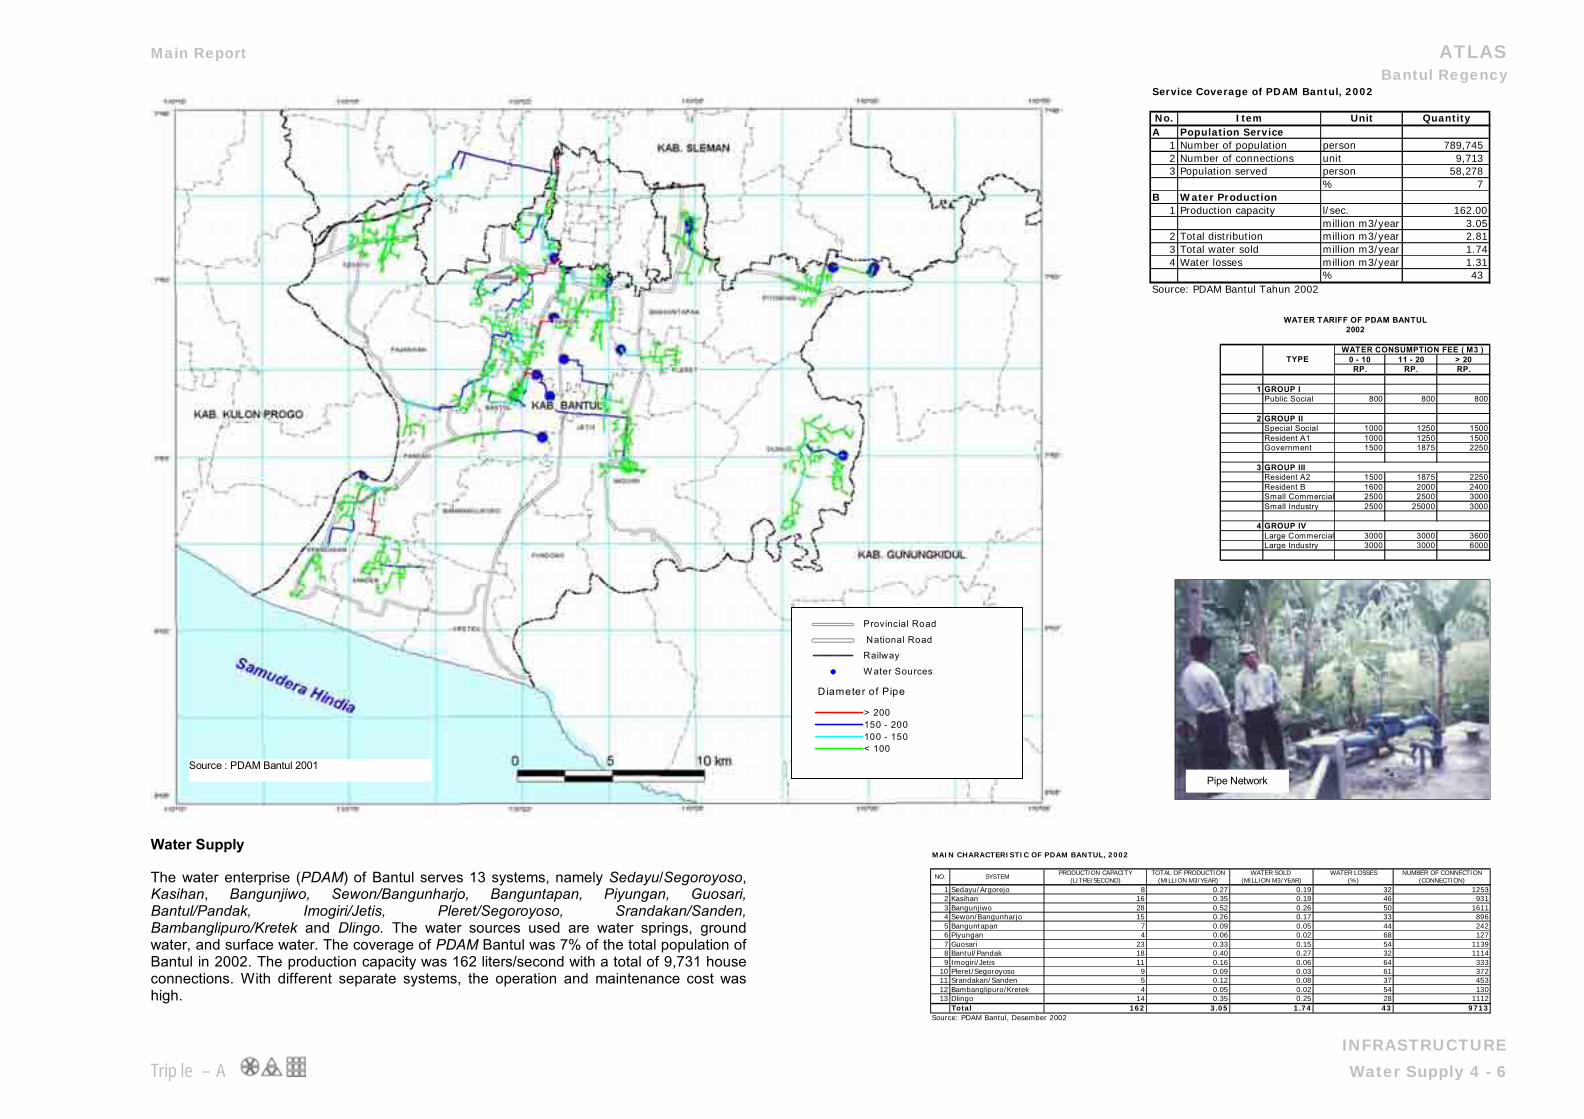
Main Report ATLAS Bantul Regency
INFRASTRUCTURE Triple – A Water Supply 4 - 6
Service Coverage of PDAM Bantul, 2002
No. Item Unit QuantityA Population Service
1 Number of population person 789,745 2 Number of connections unit 9,713 3 Population served person 58,278
% 7 B Water Production
1 Production capacity l/sec. 162.00million m3/year 3.05
2 Total distribution million m3/year 2.813 Total water sold million m3/year 1.744 Water losses million m3/year 1.31
% 43 Source: PDAM Bantul Tahun 2002
0 - 10 11 - 20 > 20RP. RP. RP.
1 GROUP IPublic Social 800 800 800
2 GROUP IISpecial Social 1000 1250 1500Resident A1 1000 1250 1500Government 1500 1875 2250
3 GROUP IIIResident A2 1500 1875 2250Resident B 1600 2000 2400Small Commercial 2500 2500 3000Small Industry 2500 25000 3000
4 GROUP IVLarge Commercial 3000 3000 3600Large Industry 3000 3000 6000
WATER TARIFF OF PDAM BANTUL2002
TYPE WATER CONSUMPTION FEE ( M3 )
Water Supply
The water enterprise (PDAM) of Bantul serves 13 systems, namely Sedayu/Segoroyoso, Kasihan, Bangunjiwo, Sewon/Bangunharjo, Banguntapan, Piyungan, Guosari, Bantul/Pandak, Imogiri/Jetis, Pleret/Segoroyoso, Srandakan/Sanden, Bambanglipuro/Kretek and Dlingo. The water sources used are water springs, ground water, and surface water. The coverage of PDAM Bantul was 7% of the total population of Bantul in 2002. The production capacity was 162 liters/second with a total of 9,731 house connections. With different separate systems, the operation and maintenance cost was high.
MAIN CHARACTERISTIC OF PDAM BANTUL, 2002
PRODUCTION CAPACITY TOTAL OF PRODUCTION WATER SOLD WATER LOSSES NUMBER OF CONNECTION(LITRE/SECOND) (MILLION M3/YEAR) (MILLION M3/YEAR) (%) (CONNECTION)
1 Sedayu/Argorejo 8 0.27 0.19 32 12532 Kasihan 16 0.35 0.19 46 9313 Bangunjiwo 28 0.52 0.26 50 16114 Sewon/Bangunharjo 15 0.26 0.17 33 8965 Banguntapan 7 0.09 0.05 44 2426 Piyungan 4 0.06 0.02 68 1277 Guosari 23 0.33 0.15 54 11398 Bantul/Pandak 18 0.40 0.27 32 11149 Imogiri/Jetis 11 0.16 0.06 64 333
10 Pleret/Segoroyoso 9 0.09 0.03 61 37211 Srandakan/Sanden 5 0.12 0.08 37 45312 Bambanglipuro/Kretek 4 0.05 0.02 54 13013 Dlingo 14 0.35 0.25 28 1112
Total 162 3.05 1.74 43 9713Source: PDAM Bantul, Desember 2002
SYSTEMNO.
D iameter of Pipe
> 200150 - 200100 - 150< 100
W ater Sources
Provincial Road
National RoadRailway
Source : PDAM Bantul 2001 Pipe Network
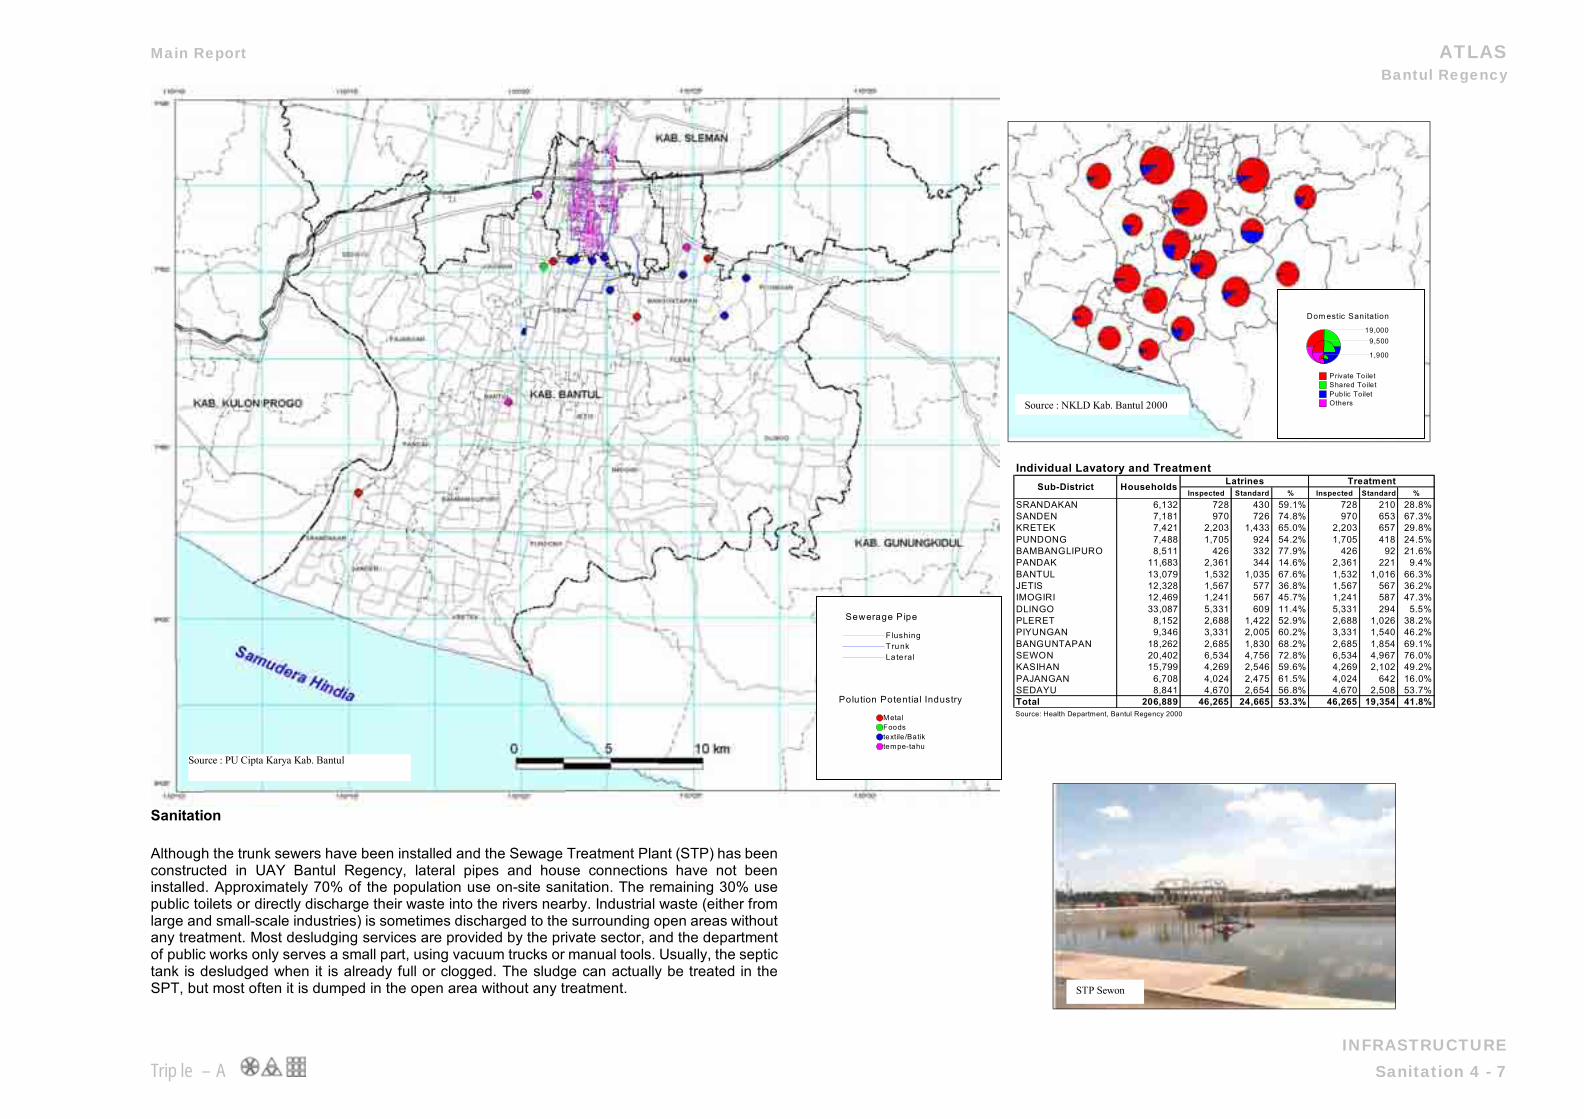
Main Report ATLAS Bantul Regency
INFRASTRUCTURE Triple – A Sanitation 4 - 7
Sanitation Although the trunk sewers have been installed and the Sewage Treatment Plant (STP) has been constructed in UAY Bantul Regency, lateral pipes and house connections have not been installed. Approximately 70% of the population use on-site sanitation. The remaining 30% use public toilets or directly discharge their waste into the rivers nearby. Industrial waste (either from large and small-scale industries) is sometimes discharged to the surrounding open areas without any treatment. Most desludging services are provided by the private sector, and the department of public works only serves a small part, using vacuum trucks or manual tools. Usually, the septic tank is desludged when it is already full or clogged. The sludge can actually be treated in the SPT, but most often it is dumped in the open area without any treatment.
Individual Lavatory and Treatment
Inspected Standard % Inspected Standard %SRANDAKAN 6,132 728 430 59.1% 728 210 28.8%SANDEN 7,181 970 726 74.8% 970 653 67.3%KRETEK 7,421 2,203 1,433 65.0% 2,203 657 29.8%PUNDONG 7,488 1,705 924 54.2% 1,705 418 24.5%BAMBANGLIPURO 8,511 426 332 77.9% 426 92 21.6%PANDAK 11,683 2,361 344 14.6% 2,361 221 9.4%BANTUL 13,079 1,532 1,035 67.6% 1,532 1,016 66.3%JETIS 12,328 1,567 577 36.8% 1,567 567 36.2%IMOGIRI 12,469 1,241 567 45.7% 1,241 587 47.3%DLINGO 33,087 5,331 609 11.4% 5,331 294 5.5%PLERET 8,152 2,688 1,422 52.9% 2,688 1,026 38.2%PIYUNGAN 9,346 3,331 2,005 60.2% 3,331 1,540 46.2%BANGUNTAPAN 18,262 2,685 1,830 68.2% 2,685 1,854 69.1%SEWON 20,402 6,534 4,756 72.8% 6,534 4,967 76.0%KASIHAN 15,799 4,269 2,546 59.6% 4,269 2,102 49.2%PAJANGAN 6,708 4,024 2,475 61.5% 4,024 642 16.0%SEDAYU 8,841 4,670 2,654 56.8% 4,670 2,508 53.7%Total 206,889 46,265 24,665 53.3% 46,265 19,354 41.8%Source: Health Department, Bantul Regency 2000
Sub-District Latrines TreatmentHouseholds
Polution Potentia l Industry
MetalFoodstextile/Batiktempe-tahu
Sewerage P ipe
FlushingTrunkLa te ral
Source : PU Cipta Karya Kab. Bantul
STP Sewon
Dom estic Sanitation
19,0009,500
1,900
Private ToiletShared ToiletPublic ToiletOthersSource : NKLD Kab. Bantul 2000
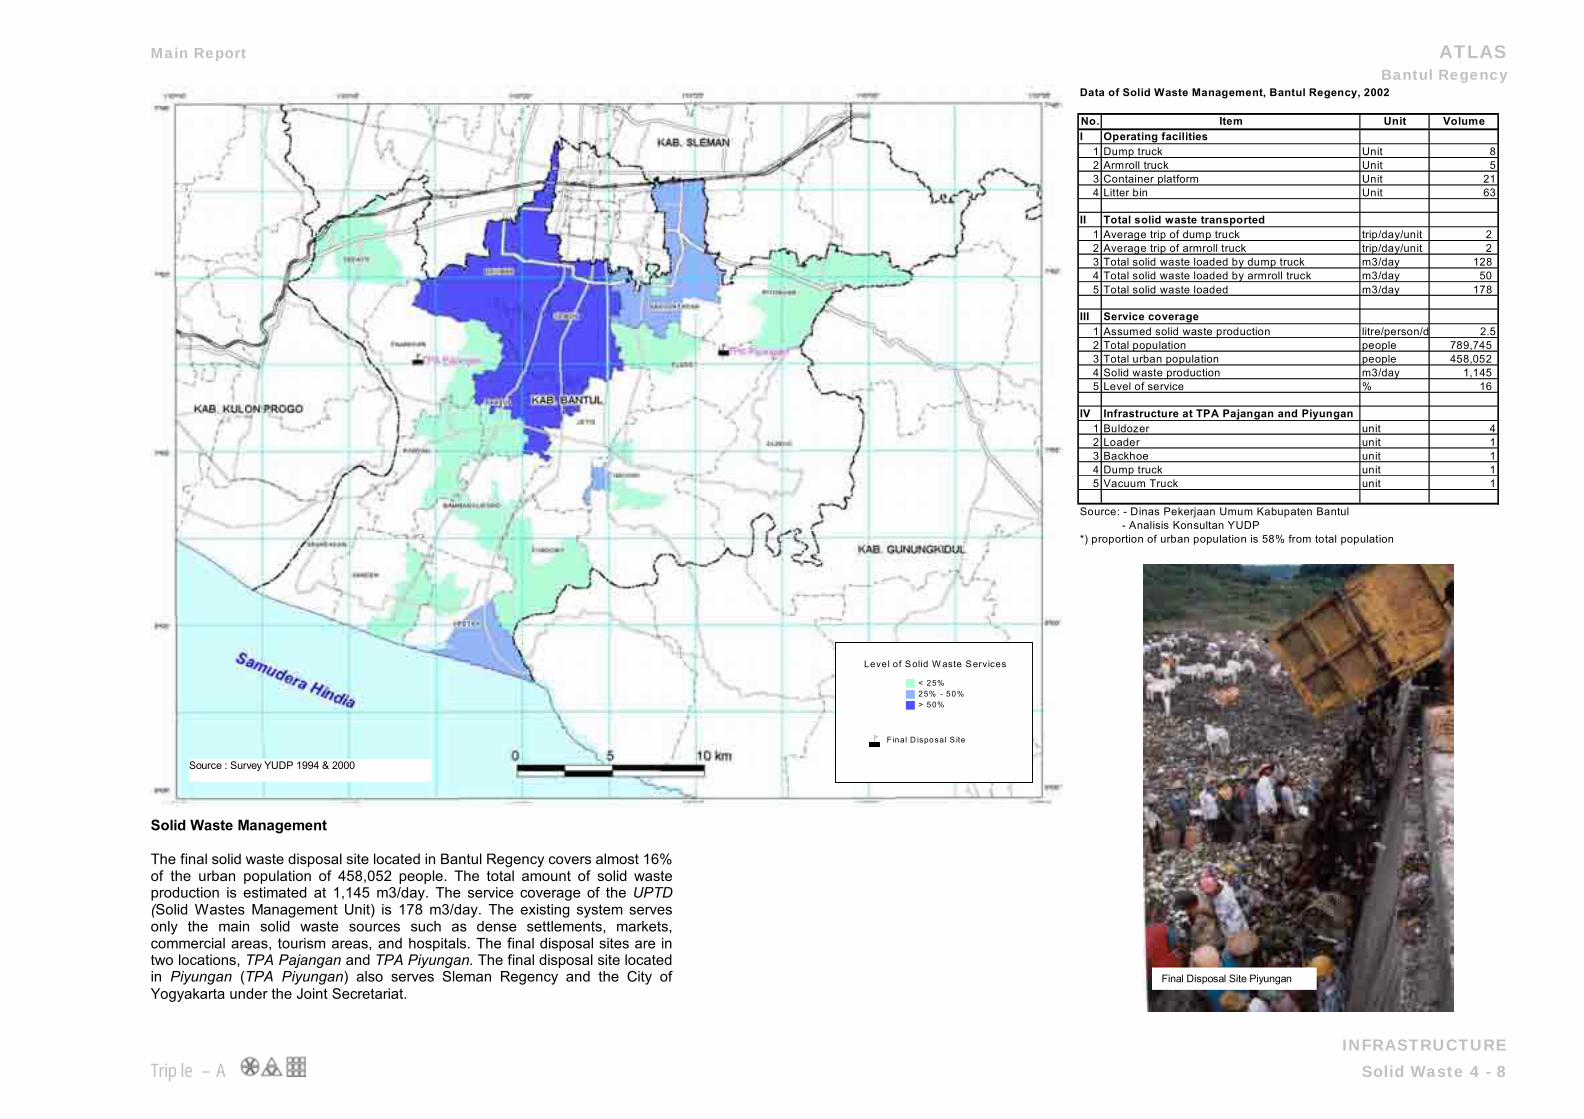
Main Report ATLAS Bantul Regency
INFRASTRUCTURE Triple – A Solid Waste 4 - 8
Solid Waste Management The final solid waste disposal site located in Bantul Regency covers almost 16% of the urban population of 458,052 people. The total amount of solid waste production is estimated at 1,145 m3/day. The service coverage of the UPTD (Solid Wastes Management Unit) is 178 m3/day. The existing system serves only the main solid waste sources such as dense settlements, markets, commercial areas, tourism areas, and hospitals. The final disposal sites are in two locations, TPA Pajangan and TPA Piyungan. The final disposal site located in Piyungan (TPA Piyungan) also serves Sleman Regency and the City of Yogyakarta under the Joint Secretariat.
Data of Solid Waste Management, Bantul Regency, 2002
No. Item Unit VolumeI Operating facilities
1 Dump truck Unit 82 Armroll truck Unit 53 Container platform Unit 214 Litter bin Unit 63
II Total solid waste transported1 Average trip of dump truck trip/day/unit 2 2 Average trip of armroll truck trip/day/unit 2 3 Total solid waste loaded by dump truck m3/day 128 4 Total solid waste loaded by armroll truck m3/day 50 5 Total solid waste loaded m3/day 178
III Service coverage1 Assumed solid waste production litre/person/d 2.52 Total population people 789,745 3 Total urban population people 458,052 4 Solid waste production m3/day 1,145 5 Level of service % 16
IV Infrastructure at TPA Pajangan and Piyungan1 Buldozer unit 42 Loader unit 13 Backhoe unit 14 Dump truck unit 15 Vacuum Truck unit 1
Source: - Dinas Pekerjaan Umum Kabupaten Bantul - Analisis Konsultan YUDP*) proportion of urban population is 58% from total population
Source : Survey YUDP 1994 & 2000
Final Disposal Site Piyungan
Level of Solid W aste Services
< 25%25% - 50%> 50%
F Final D isposa l S ite
ATLAS Bantul Regency
Triple-A ORGANIZATION CHART 5 - 1
Main Report June 2003
Chart 1 Sekretariat Daerah (Local Secretariat) Chart 2 Sekretariat Dewan Perwakilan Rakyat Daerah (Secretariat of Legislative Council) Chart 3 Kecamatan (Sub-District Administration) Chart 4 Dinas Pariwisata dan Kebudayaan (Department of Tourism and Culture) Chart 5 Dinas Kesehatan (Department of Health) Chart 6 Dinas Pertanian dan Kehutanan (Department of Agriculture and Forestry) Chart 7 Dinas Pendapatan Daerah (Department of Local Revenue) Chart 8 Dinas Tenaga Kerja dan Transmigrasi (Department of Manpower and Transmigration) Chart 9 Dinas Pendidikan (Department of Education) Chart 10 Dinas Perhubungan (Department of Transportation) Chart 11 Dinas Perindustrian, Perdagangan dan Koperasi (Department of Industry, Trade and Cooperative) Chart 12 Dinas Pertanahan (Department of Land Administration) Chart 13 Dinas Peternakan, Kelautan dan Perikanan (Department of Husbandry, Marine and Fishery) Chart 14 Dinas Pekerjaan Umum (Department of Public Works) Chart 15 Dinas Pengairan (Department of Irrigation) Chart 16 Dinas Pendaftaran Penduduk (Department of Population Registration) Chart 17 Badan Pengendalian Dampak Lingkungan (Environmental Impact Monitoring and Control Board) Chart 18 Badan Perencanaan Pembangunan Daerah (Planning and Development Board) Chart 19 Badan Pengawasan Daerah (Supervisory Board) Chart 20 Badan Kesejahteraan Keluarga (Family Welfare Board) Chart 21 Kantor Pemberdayaan Masyarakat Desa (Office of Community Empowerment) Chart 22 Kantor Kesatuan Bangsa dan Perlindungan Masyarakat (Office of National Unity and Community Protection) Chart 23 Kantor Pengolahan Data Elektronik (Electronic Data Processing Office) Chart 24 Kantor Perpustakaan Umum (Public Library Office) Chart 25 Kantor Arsip Daerah (Archive Office) Chart 26 Kantor Polisi Pamong Praja (Office of Local Security) Chart 27 Kantor Humas dan Informasi (Public Relation and Information Office) Chart 28 Kantor Pemuda dan Olah Raga (Youth and Sport Office) Chart 29 Unit Pelayanan Terpadu Satu Atap (One-Stop Service Unit) Chart 30 Unit Kerja Pengembangan Industri Piyungan (Piyungan Industrial Development Unit) Chart 31 Perwakilan Pemerintah Kabupaten Bantul di Jakarta (Representative of Bantul Government in Jakarta)
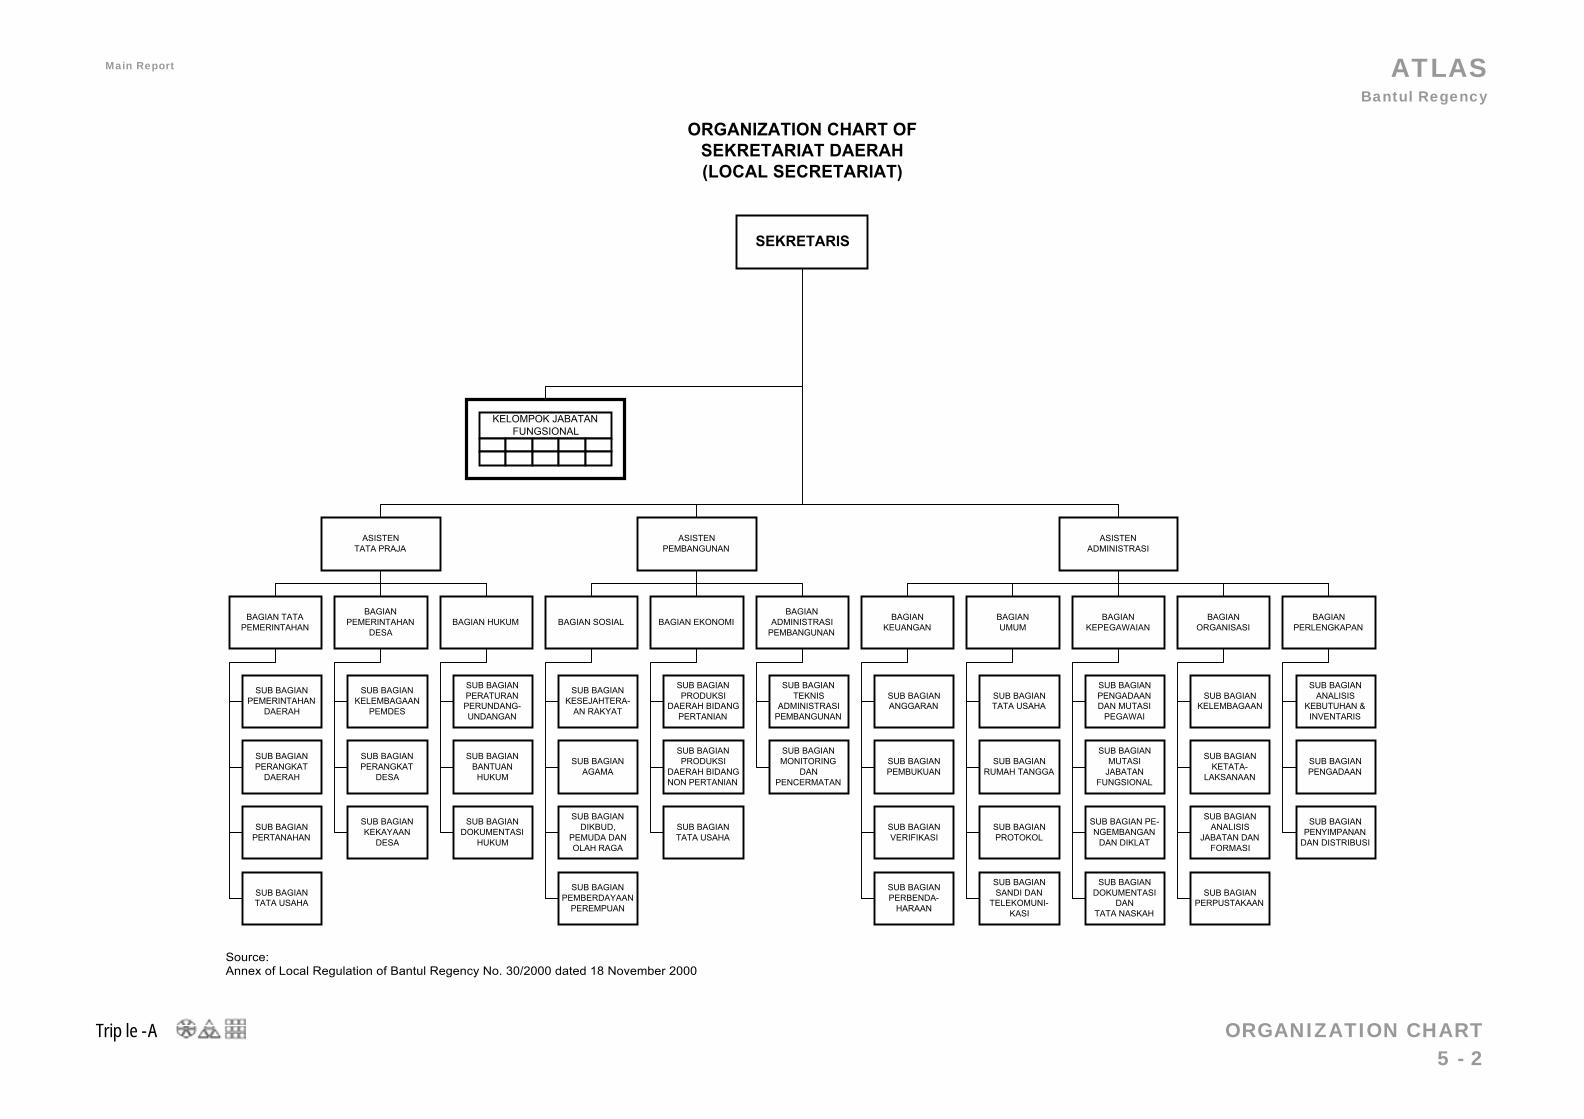
ATLAS Bantul Regency
Triple-A ORGANIZATION CHART 5 - 2
Main Report June 2003
SEKRETARIS
KELOMPOK JABATANFUNGSIONAL
ORGANIZATION CHART OFSEKRETARIAT DAERAH(LOCAL SECRETARIAT)
BAGIANKEUANGAN
SUB BAGIANANGGARAN
SUB BAGIANPEMBUKUAN
SUB BAGIANVERIFIKASI
BAGIANUMUM
SUB BAGIANTATA USAHA
SUB BAGIANRUMAH TANGGA
SUB BAGIANPROTOKOL
BAGIANKEPEGAWAIAN
SUB BAGIANPENGADAANDAN MUTASI
PEGAWAI
SUB BAGIANMUTASI
JABATANFUNGSIONAL
SUB BAGIAN PE-NGEMBANGAN
DAN DIKLAT
BAGIANORGANISASI
SUB BAGIANKELEMBAGAAN
SUB BAGIANKETATA-
LAKSANAAN
SUB BAGIANANALISIS
JABATAN DANFORMASI
BAGIANPERLENGKAPAN
SUB BAGIANANALISIS
KEBUTUHAN &INVENTARIS
SUB BAGIANPENGADAAN
SUB BAGIANPENYIMPANAN
DAN DISTRIBUSI
BAGIANADMINISTRASI
PEMBANGUNAN
SUB BAGIANTEKNIS
ADMINISTRASIPEMBANGUNAN
SUB BAGIANMONITORING
DANPENCERMATAN
BAGIAN EKONOMI
SUB BAGIANPRODUKSI
DAERAH BIDANGPERTANIAN
SUB BAGIANPRODUKSI
DAERAH BIDANGNON PERTANIAN
SUB BAGIANTATA USAHA
BAGIAN SOSIAL
SUB BAGIANKESEJAHTERA-
AN RAKYAT
SUB BAGIANAGAMA
SUB BAGIANDIKBUD,
PEMUDA DANOLAH RAGA
BAGIAN HUKUM
SUB BAGIANPERATURANPERUNDANG-UNDANGAN
SUB BAGIANBANTUANHUKUM
SUB BAGIANDOKUMENTASI
HUKUM
BAGIANPEMERINTAHAN
DESA
SUB BAGIANKELEMBAGAAN
PEMDES
SUB BAGIANPERANGKAT
DESA
SUB BAGIANKEKAYAAN
DESA
BAGIAN TATAPEMERINTAHAN
SUB BAGIANPEMERINTAHAN
DAERAH
SUB BAGIANPERANGKAT
DAERAH
SUB BAGIANPERTANAHAN
ASISTENTATA PRAJA
ASISTENPEMBANGUNAN
ASISTENADMINISTRASI
SUB BAGIANPERPUSTAKAAN
SUB BAGIANDOKUMENTASI
DANTATA NASKAH
SUB BAGIANSANDI DAN
TELEKOMUNI-KASI
SUB BAGIANPERBENDA-
HARAAN
SUB BAGIANPEMBERDAYAAN
PEREMPUAN
SUB BAGIANTATA USAHA
Source:Annex of Local Regulation of Bantul Regency No. 30/2000 dated 18 November 2000
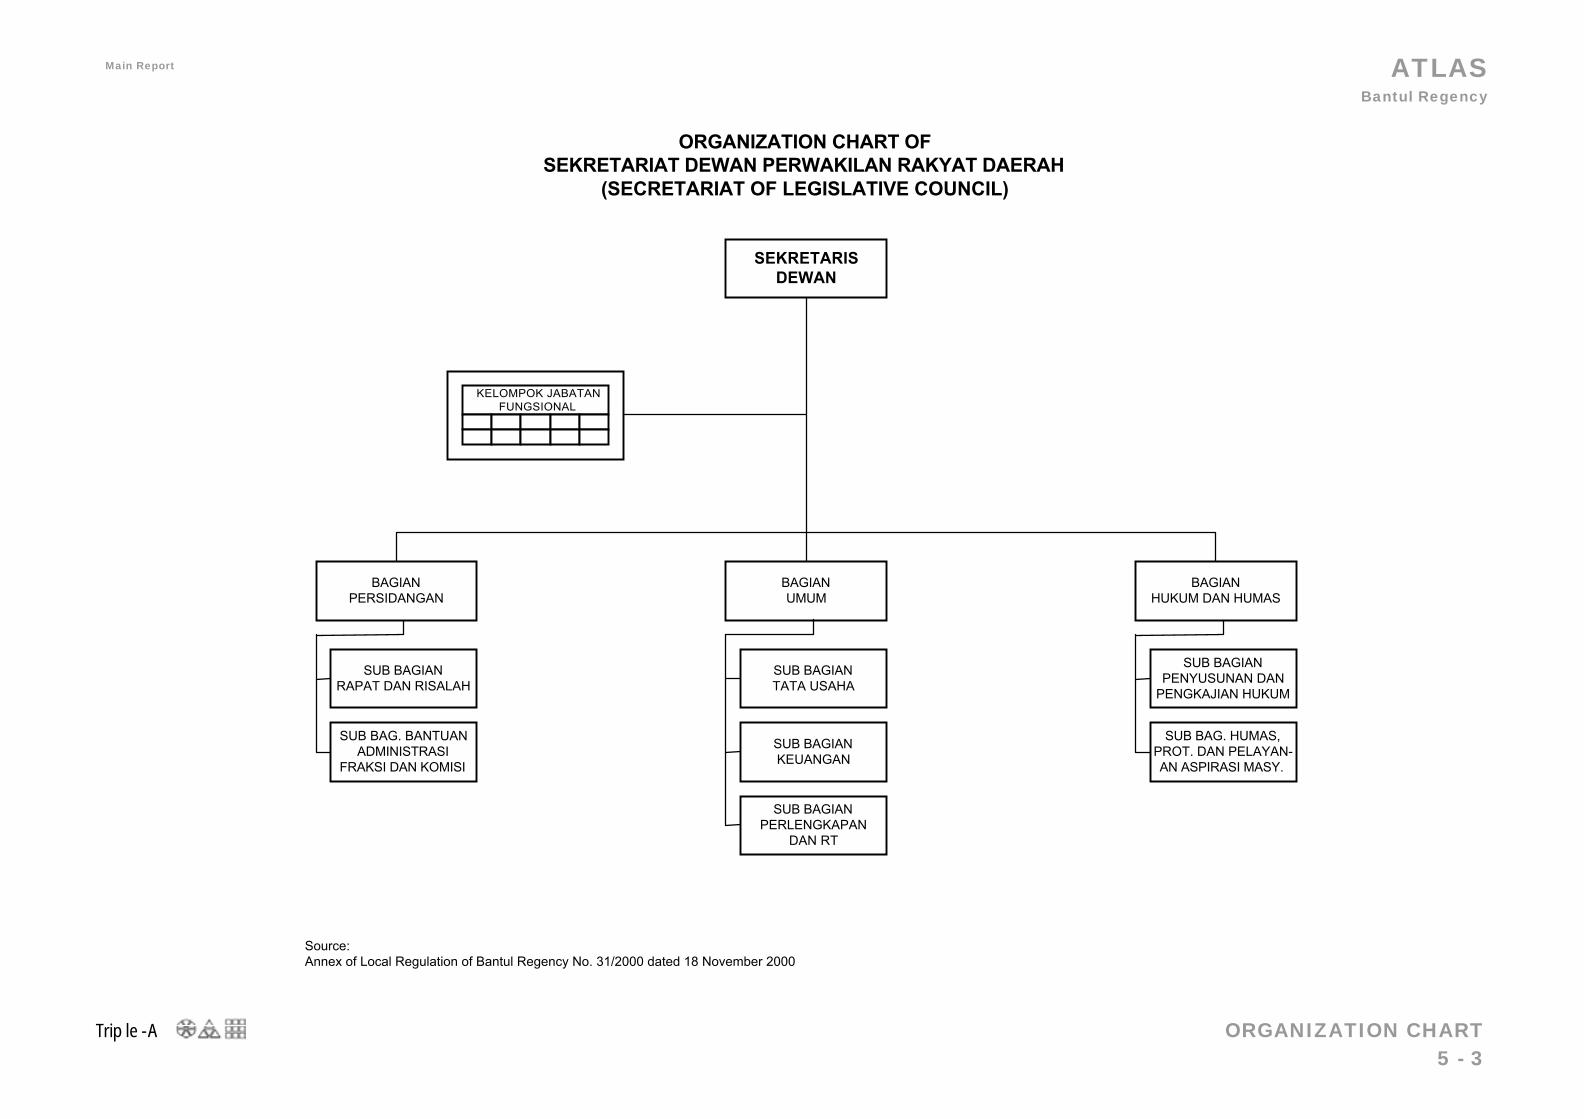
ATLAS Bantul Regency
Triple-A ORGANIZATION CHART 5 - 3
Main Report June 2003
BAGIANPERSIDANGAN
BAGIANUMUM
BAGIANHUKUM DAN HUMAS
SEKRETARISDEWAN
KELOMPOK JABATANFUNGSIONAL
ORGANIZATION CHART OFSEKRETARIAT DEWAN PERWAKILAN RAKYAT DAERAH
(SECRETARIAT OF LEGISLATIVE COUNCIL)
SUB BAGIANRAPAT DAN RISALAH
SUB BAG. BANTUANADMINISTRASI
FRAKSI DAN KOMISI
SUB BAGIANTATA USAHA
SUB BAGIANKEUANGAN
SUB BAGIANPERLENGKAPAN
DAN RT
SUB BAGIANPENYUSUNAN DAN
PENGKAJIAN HUKUM
SUB BAG. HUMAS,PROT. DAN PELAYAN-AN ASPIRASI MASY.
Source:Annex of Local Regulation of Bantul Regency No. 31/2000 dated 18 November 2000
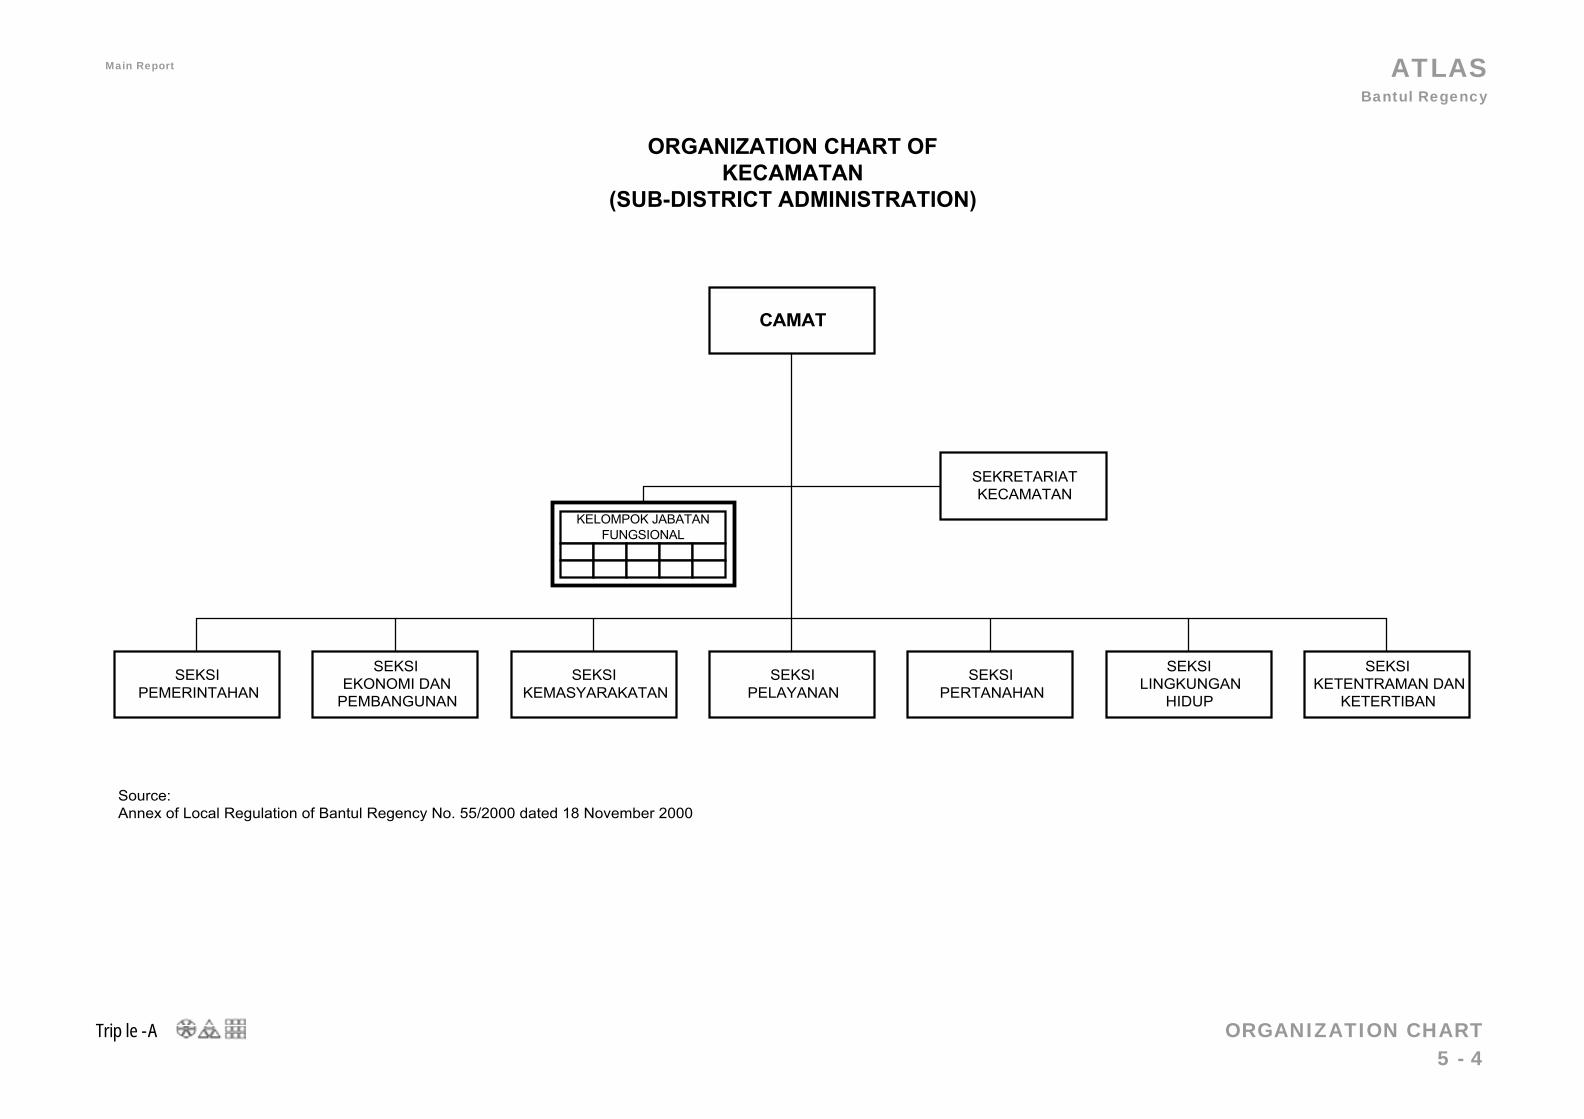
ATLAS Bantul Regency
Triple-A ORGANIZATION CHART 5 - 4
Main Report June 2003
SEKSIPEMERINTAHAN
SEKSIKEMASYARAKATAN
SEKSIPERTANAHAN
CAMAT
KELOMPOK JABATANFUNGSIONAL
ORGANIZATION CHART OFKECAMATAN
(SUB-DISTRICT ADMINISTRATION)
SEKSIEKONOMI DAN
PEMBANGUNAN
SEKSIPELAYANAN
SEKRETARIATKECAMATAN
SEKSILINGKUNGAN
HIDUP
SEKSIKETENTRAMAN DAN
KETERTIBAN
Source:Annex of Local Regulation of Bantul Regency No. 55/2000 dated 18 November 2000
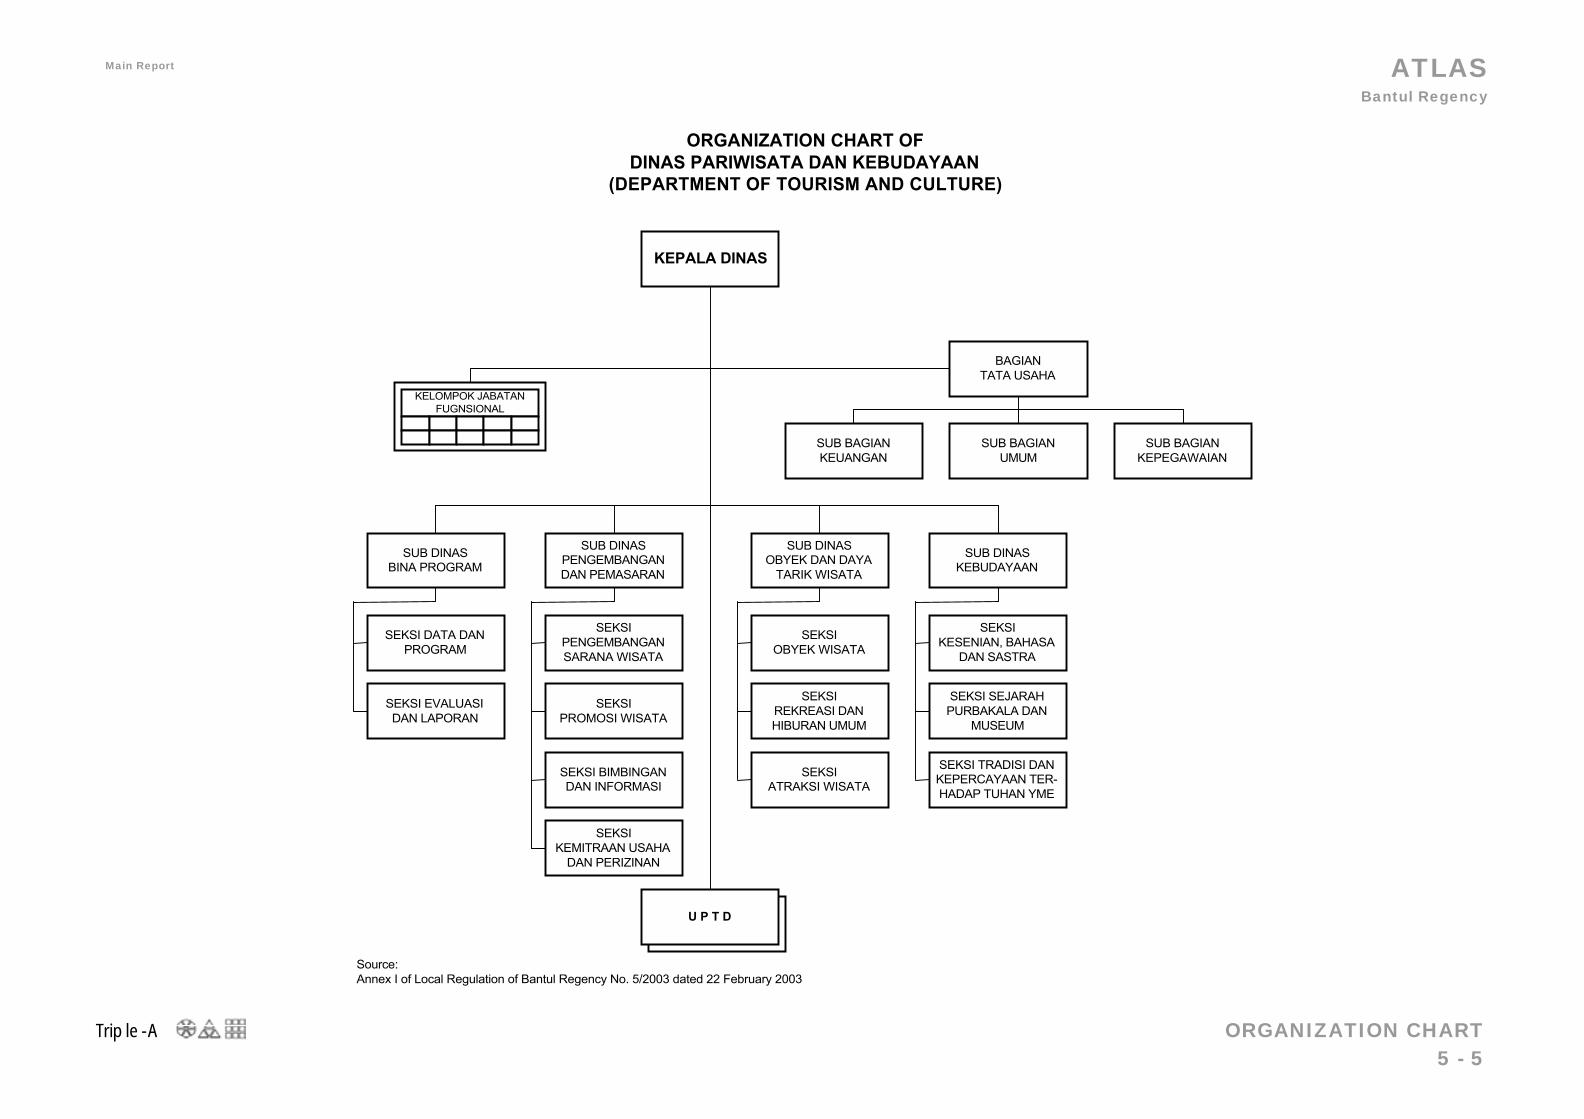
ATLAS Bantul Regency
Triple-A ORGANIZATION CHART 5 - 5
Main Report June 2003
SUB DINASPENGEMBANGANDAN PEMASARAN
KEPALA DINAS
BAGIANTATA USAHA
KELOMPOK JABATANFUGNSIONAL
ORGANIZATION CHART OFDINAS PARIWISATA DAN KEBUDAYAAN
(DEPARTMENT OF TOURISM AND CULTURE)
SUB BAGIANUMUM
SUB BAGIANKEUANGAN
SUB DINASBINA PROGRAM
SUB DINASOBYEK DAN DAYA
TARIK WISATA
SEKSIOBYEK WISATA
SEKSIREKREASI DANHIBURAN UMUM
SEKSIATRAKSI WISATA
SEKSIPENGEMBANGANSARANA WISATA
SEKSIPROMOSI WISATA
SEKSI BIMBINGANDAN INFORMASI
SEKSI DATA DANPROGRAM
SEKSI EVALUASIDAN LAPORAN
U P T D
SUB BAGIANKEPEGAWAIAN
SEKSIKEMITRAAN USAHA
DAN PERIZINAN
SUB DINASKEBUDAYAAN
SEKSIKESENIAN, BAHASA
DAN SASTRA
SEKSI SEJARAHPURBAKALA DAN
MUSEUM
SEKSI TRADISI DANKEPERCAYAAN TER-HADAP TUHAN YME
Source:Annex I of Local Regulation of Bantul Regency No. 5/2003 dated 22 February 2003
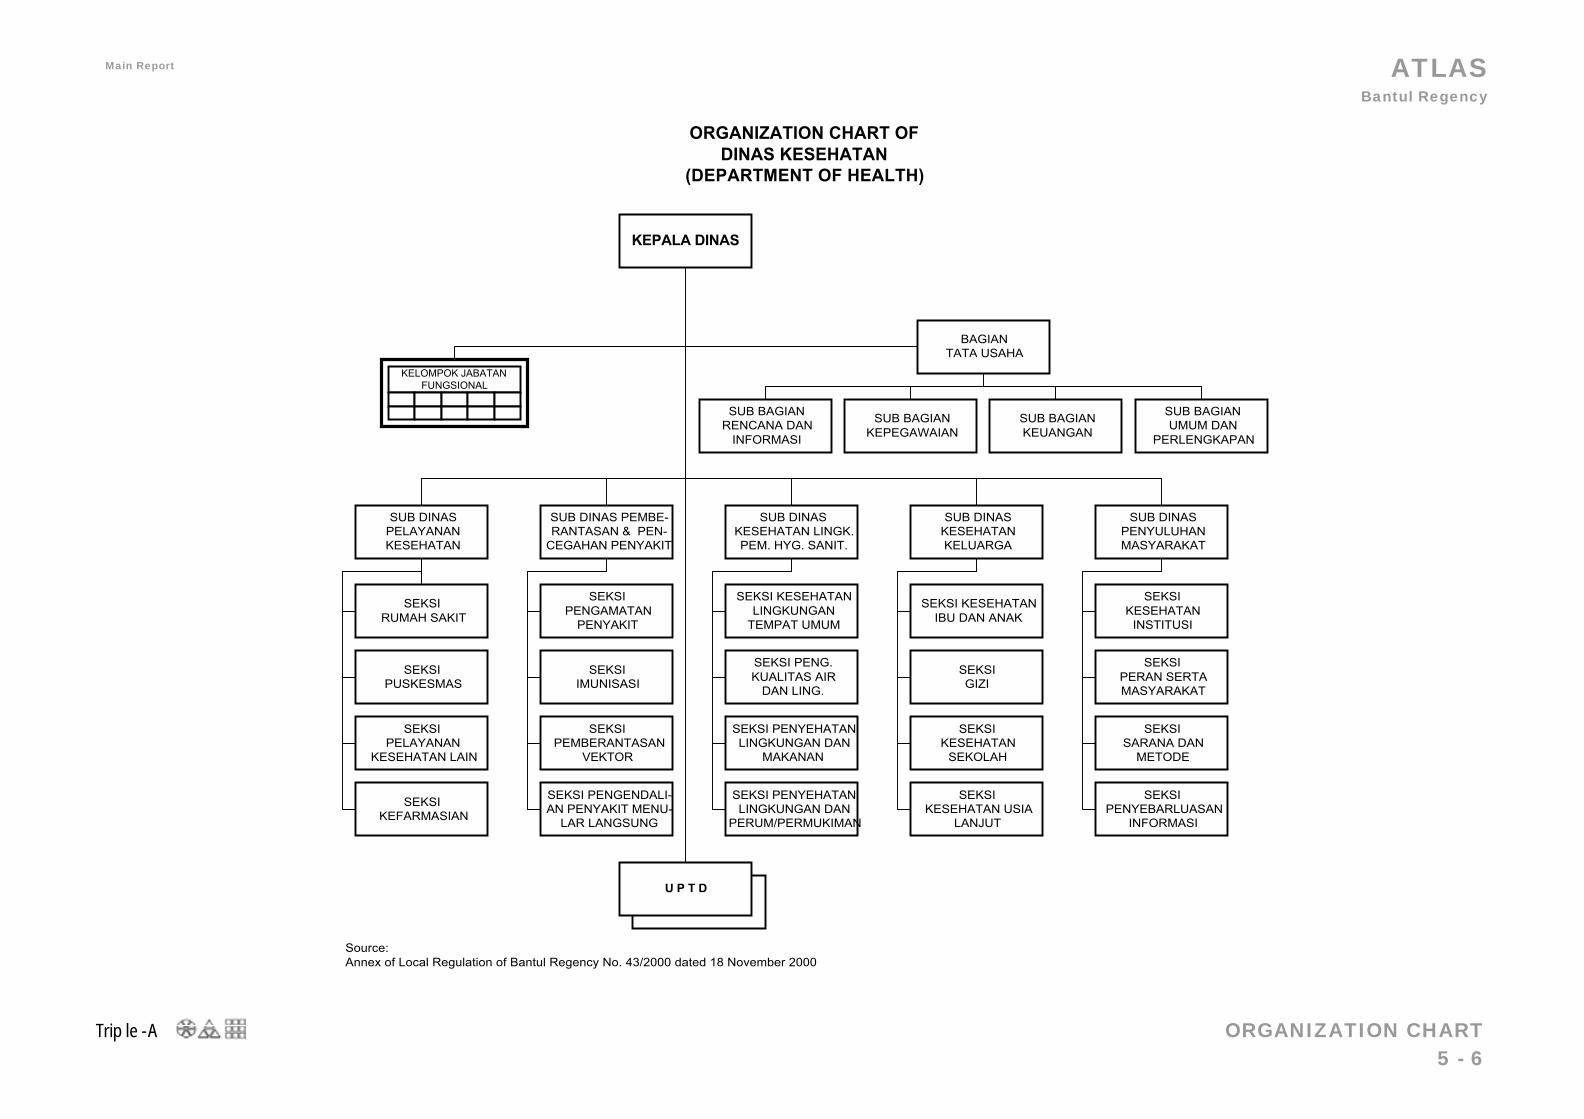
ATLAS Bantul Regency
Triple-A ORGANIZATION CHART 5 - 6
Main Report June 2003
SUB DINAS PEMBE-RANTASAN & PEN-
CEGAHAN PENYAKIT
KEPALA DINAS
BAGIANTATA USAHA
KELOMPOK JABATANFUNGSIONAL
ORGANIZATION CHART OFDINAS KESEHATAN
(DEPARTMENT OF HEALTH)
SUB BAGIANKEPEGAWAIAN
SUB BAGIANRENCANA DAN
INFORMASI
SUB BAGIANKEUANGAN
SUB DINASPELAYANANKESEHATAN
SUB DINASKESEHATAN LINGK.PEM. HYG. SANIT.
SEKSI KESEHATANLINGKUNGAN
TEMPAT UMUM
SEKSI PENG.KUALITAS AIR
DAN LING.
SEKSI PENYEHATANLINGKUNGAN DAN
MAKANAN
SEKSIPENGAMATAN
PENYAKIT
SEKSIIMUNISASI
SEKSIPEMBERANTASAN
VEKTOR
SEKSIRUMAH SAKIT
SEKSIPUSKESMAS
SEKSIPELAYANAN
KESEHATAN LAIN
U P T D
SUB BAGIANUMUM DAN
PERLENGKAPAN
SUB DINASKESEHATANKELUARGA
SEKSI KESEHATANIBU DAN ANAK
SEKSIGIZI
SEKSIKESEHATAN
SEKOLAH
SUB DINASPENYULUHANMASYARAKAT
SEKSIKESEHATAN
INSTITUSI
SEKSIPERAN SERTAMASYARAKAT
SEKSISARANA DAN
METODE
SEKSIKEFARMASIAN
SEKSI PENGENDALI-AN PENYAKIT MENU-
LAR LANGSUNG
SEKSI PENYEHATANLINGKUNGAN DAN
PERUM/PERMUKIMAN
SEKSIKESEHATAN USIA
LANJUT
SEKSIPENYEBARLUASAN
INFORMASI
Source:Annex of Local Regulation of Bantul Regency No. 43/2000 dated 18 November 2000
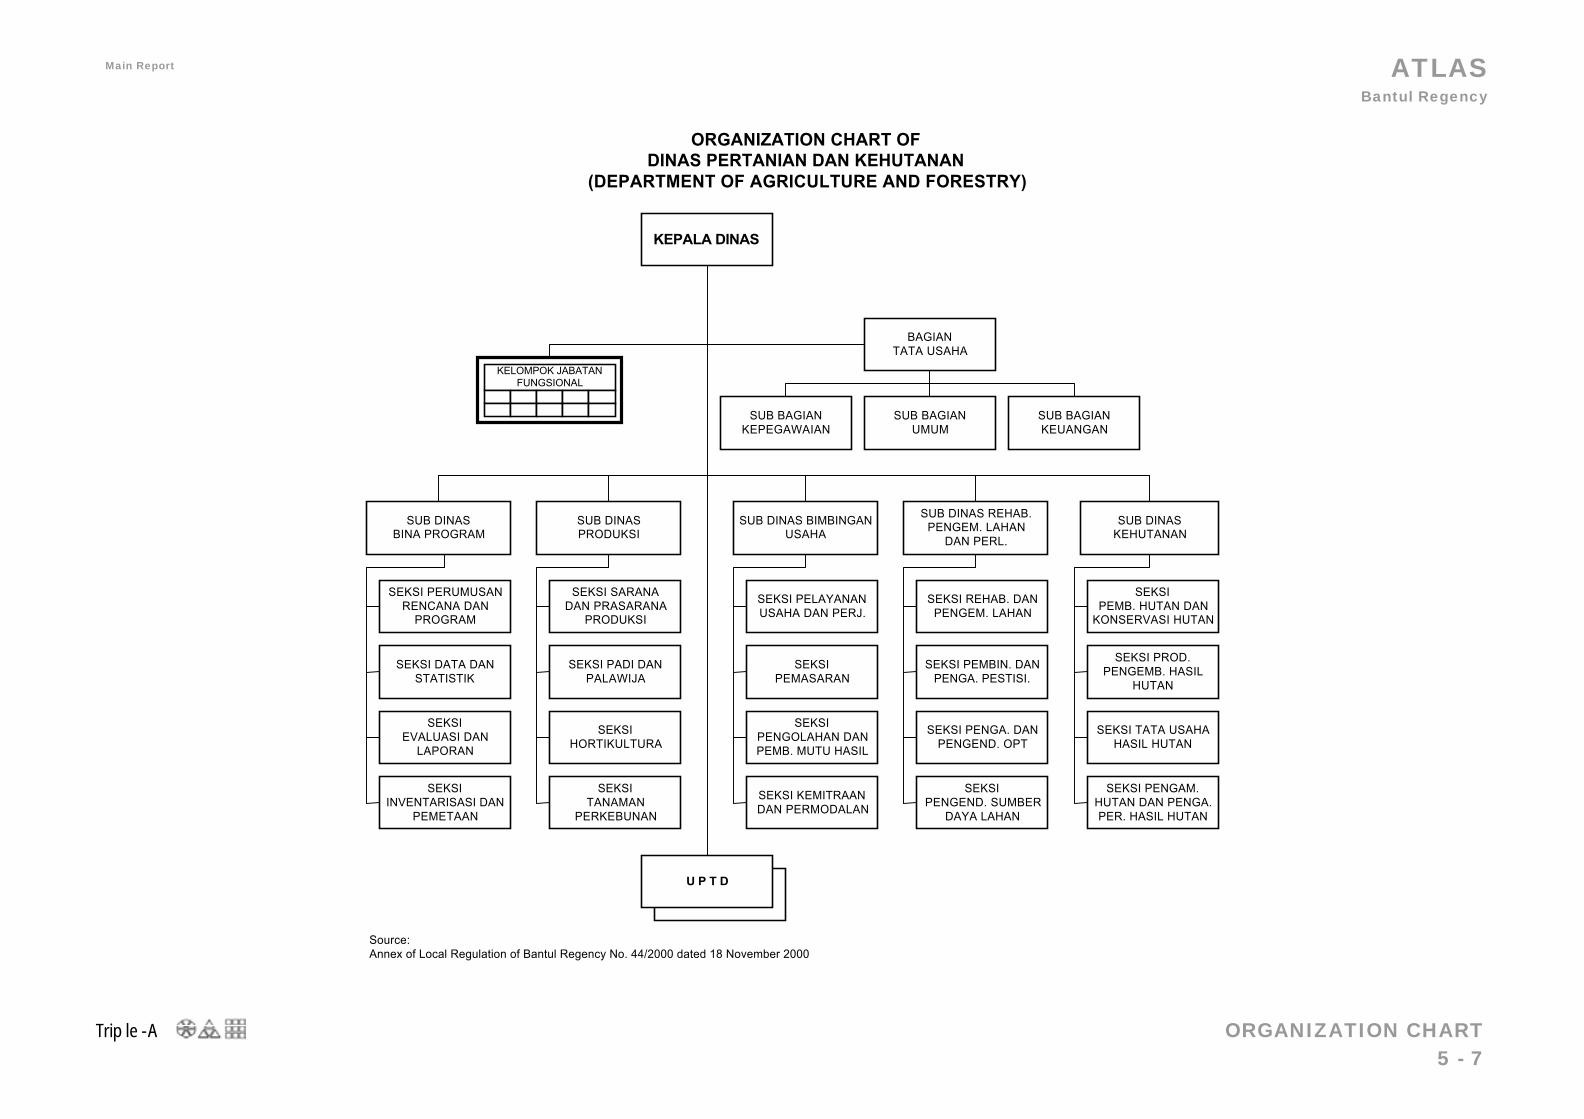
ATLAS Bantul Regency
Triple-A ORGANIZATION CHART 5 - 7
Main Report June 2003
SUB DINASPRODUKSI
KEPALA DINAS
BAGIANTATA USAHA
KELOMPOK JABATANFUNGSIONAL
ORGANIZATION CHART OFDINAS PERTANIAN DAN KEHUTANAN
(DEPARTMENT OF AGRICULTURE AND FORESTRY)
SUB BAGIANUMUM
SUB BAGIANKEPEGAWAIAN
SUB BAGIANKEUANGAN
SUB DINASBINA PROGRAM
SUB DINAS BIMBINGANUSAHA
SEKSI PELAYANANUSAHA DAN PERJ.
SEKSIPEMASARAN
SEKSIPENGOLAHAN DANPEMB. MUTU HASIL
SEKSI SARANADAN PRASARANA
PRODUKSI
SEKSI PADI DANPALAWIJA
SEKSIHORTIKULTURA
SEKSI PERUMUSANRENCANA DAN
PROGRAM
SEKSI DATA DANSTATISTIK
SEKSIEVALUASI DAN
LAPORAN
U P T D
SUB DINAS REHAB.PENGEM. LAHAN
DAN PERL.
SEKSI REHAB. DANPENGEM. LAHAN
SEKSI PEMBIN. DANPENGA. PESTISI.
SEKSI PENGA. DANPENGEND. OPT
SUB DINASKEHUTANAN
SEKSIPEMB. HUTAN DAN
KONSERVASI HUTAN
SEKSI PROD.PENGEMB. HASIL
HUTAN
SEKSI TATA USAHAHASIL HUTAN
SEKSIINVENTARISASI DAN
PEMETAAN
SEKSITANAMAN
PERKEBUNAN
SEKSI KEMITRAANDAN PERMODALAN
SEKSIPENGEND. SUMBER
DAYA LAHAN
SEKSI PENGAM.HUTAN DAN PENGA.PER. HASIL HUTAN
Source:Annex of Local Regulation of Bantul Regency No. 44/2000 dated 18 November 2000
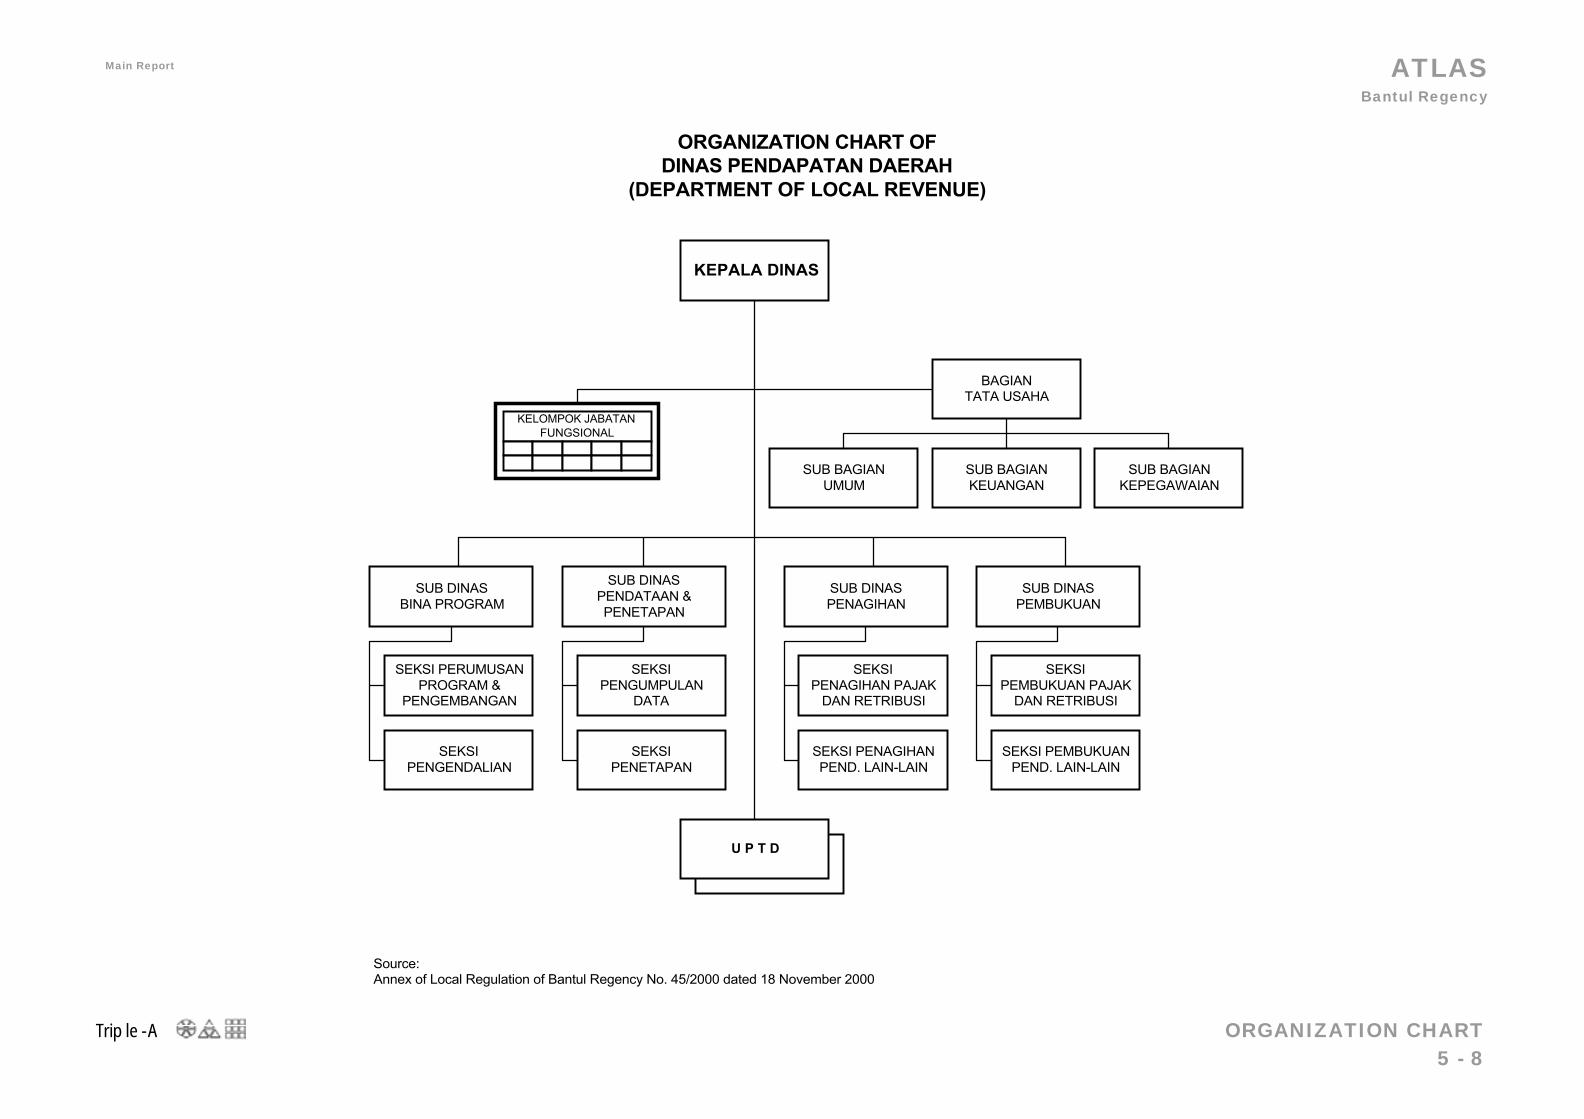
ATLAS Bantul Regency
Triple-A ORGANIZATION CHART 5 - 8
Main Report June 2003
SUB DINASPENDATAAN &PENETAPAN
KEPALA DINAS
BAGIANTATA USAHA
KELOMPOK JABATANFUNGSIONAL
ORGANIZATION CHART OFDINAS PENDAPATAN DAERAH
(DEPARTMENT OF LOCAL REVENUE)
SUB BAGIANKEUANGAN
SUB BAGIANUMUM
SUB BAGIANKEPEGAWAIAN
SUB DINASBINA PROGRAM
SUB DINASPENAGIHAN
SEKSIPENAGIHAN PAJAK
DAN RETRIBUSI
SEKSI PENAGIHANPEND. LAIN-LAIN
SEKSIPENGUMPULAN
DATA
SEKSIPENETAPAN
SEKSI PERUMUSANPROGRAM &
PENGEMBANGAN
SEKSIPENGENDALIAN
U P T D
SUB DINASPEMBUKUAN
SEKSIPEMBUKUAN PAJAK
DAN RETRIBUSI
SEKSI PEMBUKUANPEND. LAIN-LAIN
Source:Annex of Local Regulation of Bantul Regency No. 45/2000 dated 18 November 2000
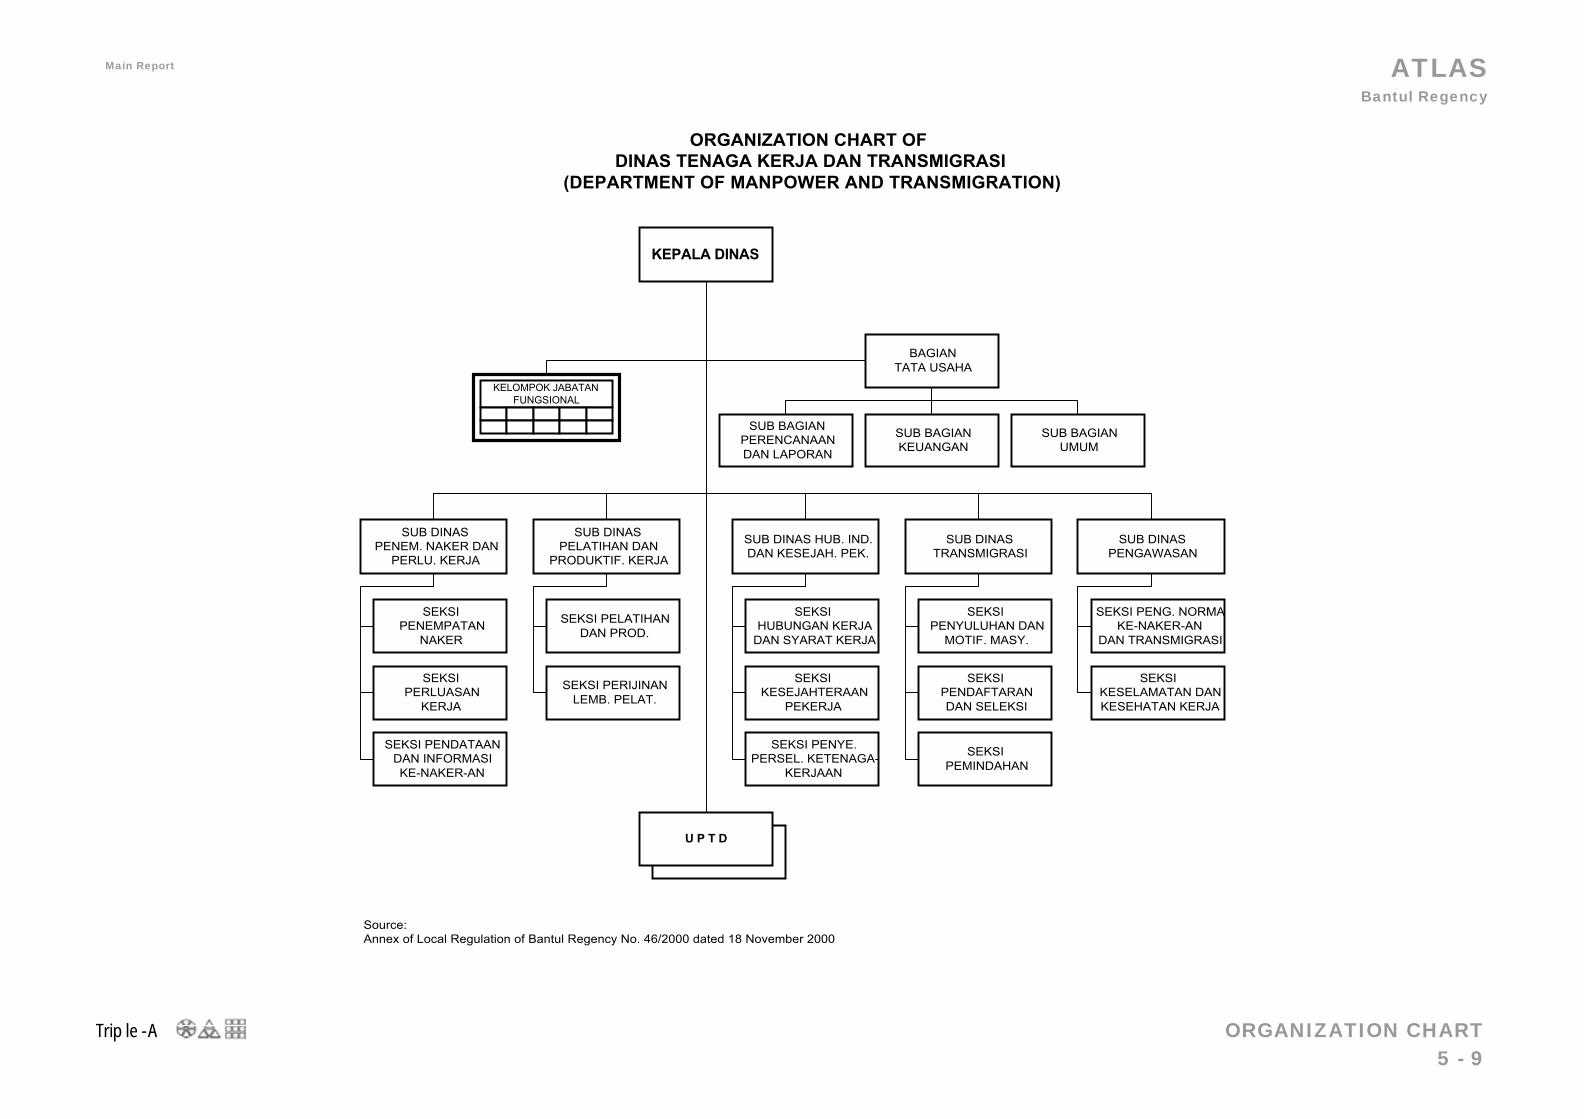
ATLAS Bantul Regency
Triple-A ORGANIZATION CHART 5 - 9
Main Report June 2003
SUB DINASPELATIHAN DAN
PRODUKTIF. KERJA
KEPALA DINAS
BAGIANTATA USAHA
KELOMPOK JABATANFUNGSIONAL
ORGANIZATION CHART OFDINAS TENAGA KERJA DAN TRANSMIGRASI
(DEPARTMENT OF MANPOWER AND TRANSMIGRATION)
SUB BAGIANKEUANGAN
SUB BAGIANPERENCANAANDAN LAPORAN
SUB BAGIANUMUM
SUB DINASPENEM. NAKER DAN
PERLU. KERJA
SUB DINAS HUB. IND.DAN KESEJAH. PEK.
SEKSIHUBUNGAN KERJA
DAN SYARAT KERJA
SEKSIKESEJAHTERAAN
PEKERJA
SEKSI PENYE.PERSEL. KETENAGA-
KERJAAN
SEKSI PELATIHANDAN PROD.
SEKSI PERIJINANLEMB. PELAT.
SEKSIPENEMPATAN
NAKER
SEKSIPERLUASAN
KERJA
SEKSI PENDATAANDAN INFORMASIKE-NAKER-AN
U P T D
SUB DINASTRANSMIGRASI
SEKSIPENYULUHAN DAN
MOTIF. MASY.
SEKSIPENDAFTARANDAN SELEKSI
SEKSIPEMINDAHAN
SUB DINASPENGAWASAN
SEKSI PENG. NORMAKE-NAKER-AN
DAN TRANSMIGRASI
SEKSIKESELAMATAN DANKESEHATAN KERJA
Source:Annex of Local Regulation of Bantul Regency No. 46/2000 dated 18 November 2000
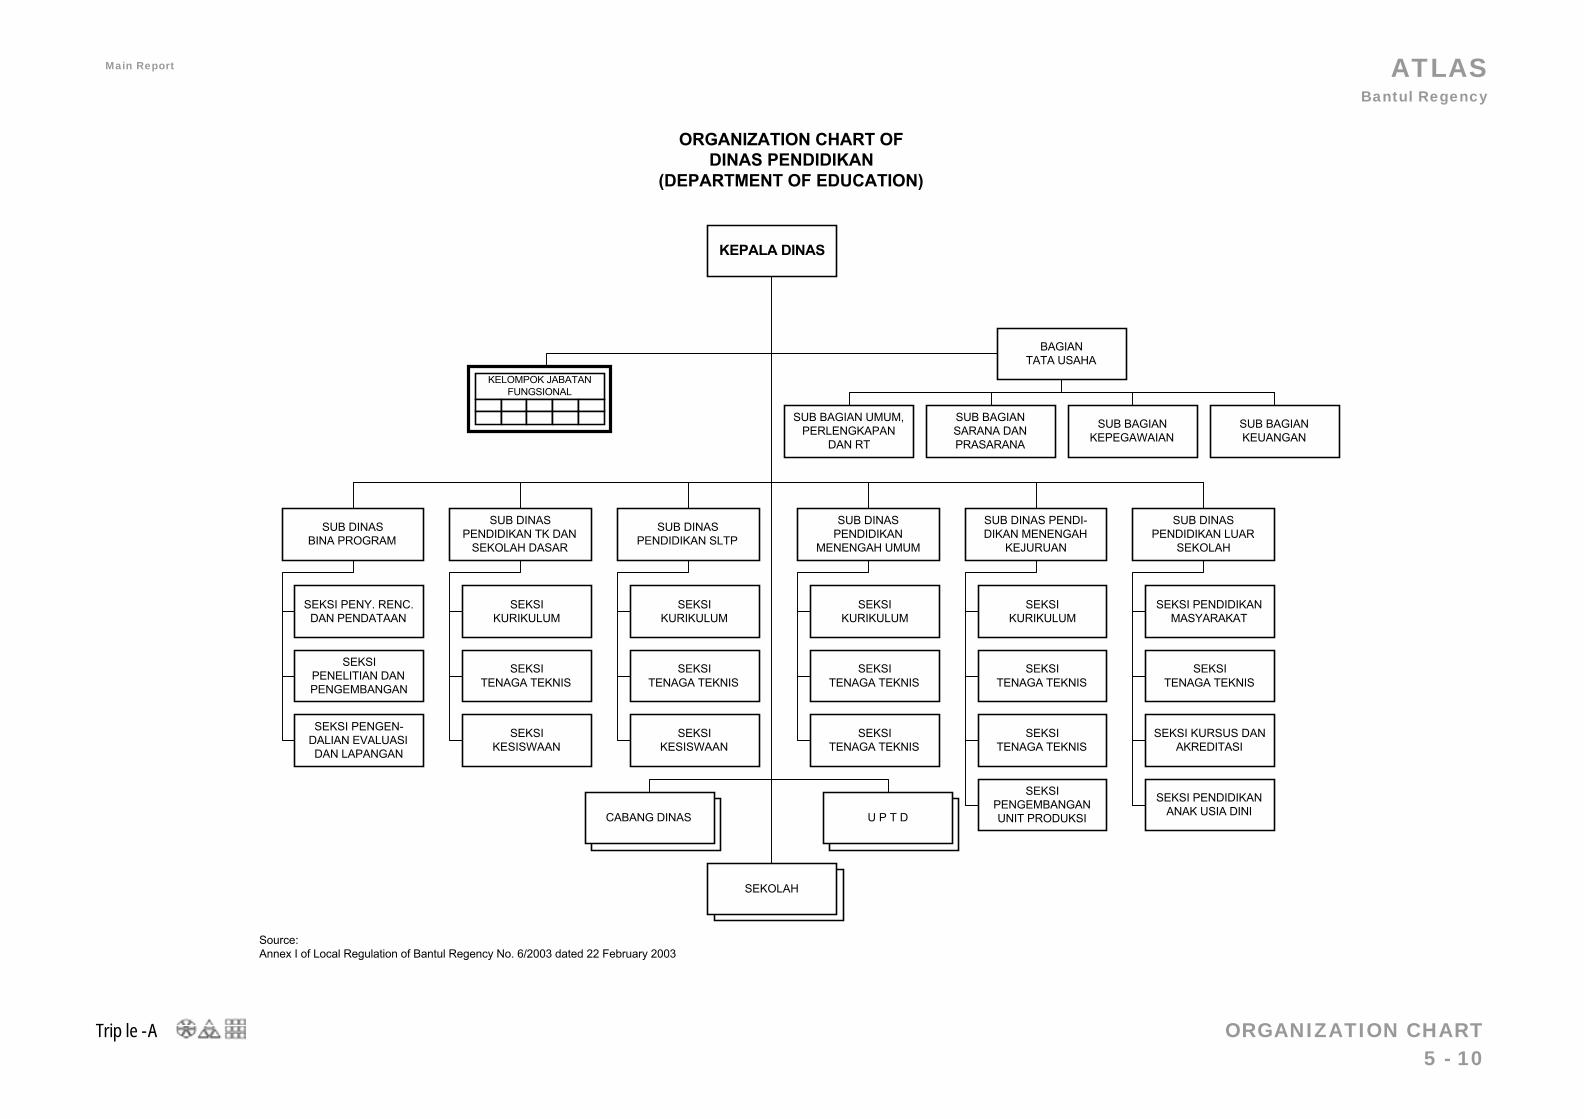
ATLAS Bantul Regency
Triple-A ORGANIZATION CHART 5 - 10
Main Report June 2003
CABANG-CABANGDINAS DI
KECAMATAN
CABANG-CABANGDINAS DI
KECAMATAN
CABANG-CABANGDINAS DI
KECAMATAN
SUB DINASPENDIDIKAN SLTP
KEPALA DINAS
BAGIANTATA USAHA
KELOMPOK JABATANFUNGSIONAL
ORGANIZATION CHART OFDINAS PENDIDIKAN
(DEPARTMENT OF EDUCATION)
SUB BAGIANSARANA DANPRASARANA
SUB BAGIAN UMUM,PERLENGKAPAN
DAN RT
SUB BAGIANKEPEGAWAIAN
SUB DINASPENDIDIKAN TK DAN
SEKOLAH DASAR
SUB DINASPENDIDIKAN
MENENGAH UMUM
SEKSIKURIKULUM
SEKSITENAGA TEKNIS
SEKSITENAGA TEKNIS
SEKSIKURIKULUM
SEKSITENAGA TEKNIS
SEKSIKESISWAAN
SEKSIKURIKULUM
SEKSITENAGA TEKNIS
SEKSIKESISWAAN
SEKOLAH
SUB DINAS PENDI-DIKAN MENENGAH
KEJURUAN
SEKSIKURIKULUM
SEKSITENAGA TEKNIS
SEKSITENAGA TEKNIS
SUB DINASPENDIDIKAN LUAR
SEKOLAH
SEKSI PENDIDIKANMASYARAKAT
SEKSITENAGA TEKNIS
SEKSI KURSUS DANAKREDITASI
SEKSIPENGEMBANGANUNIT PRODUKSI
SUB DINASBINA PROGRAM
SEKSI PENY. RENC.DAN PENDATAAN
SEKSIPENELITIAN DANPENGEMBANGAN
SEKSI PENGEN-DALIAN EVALUASIDAN LAPANGAN
SUB BAGIANKEUANGAN
CABANG DINAS U P T D
SEKSI PENDIDIKANANAK USIA DINI
Source:Annex I of Local Regulation of Bantul Regency No. 6/2003 dated 22 February 2003
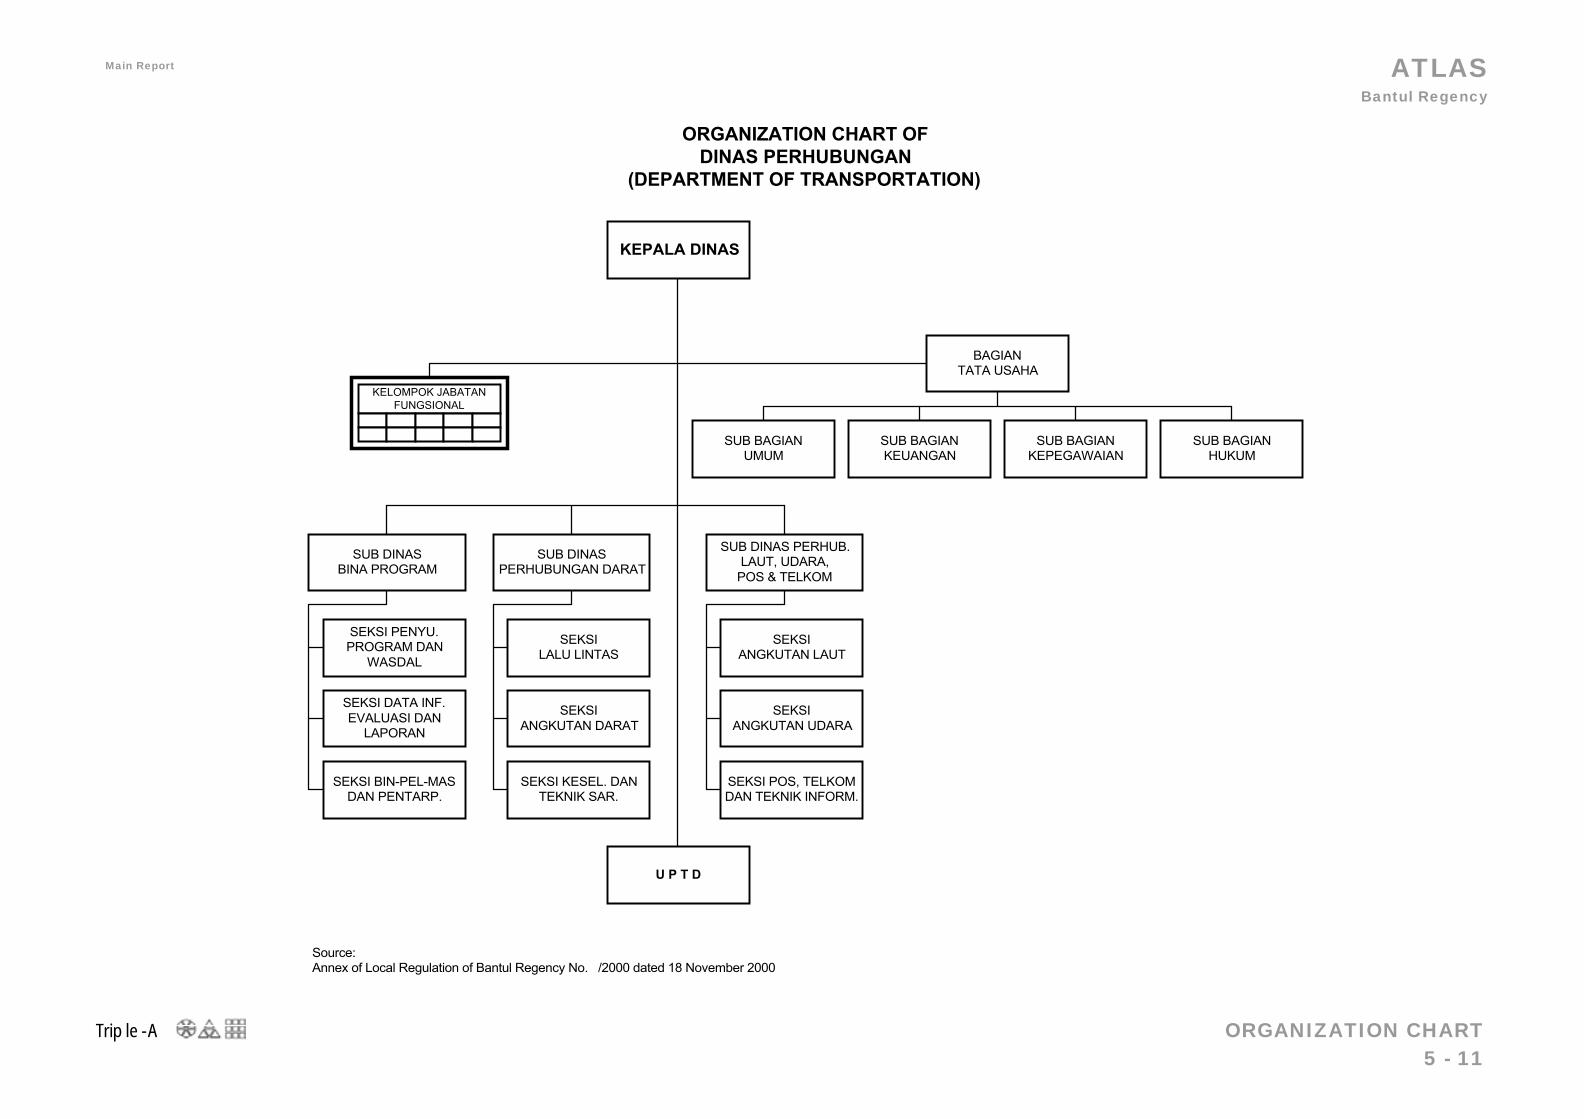
ATLAS Bantul Regency
Triple-A ORGANIZATION CHART 5 - 11
Main Report June 2003
SUB DINASPERHUBUNGAN DARAT
KEPALA DINAS
BAGIANTATA USAHA
KELOMPOK JABATANFUNGSIONAL
ORGANIZATION CHART OFDINAS PERHUBUNGAN
(DEPARTMENT OF TRANSPORTATION)
SUB BAGIANKEUANGAN
SUB BAGIANUMUM
SUB BAGIANKEPEGAWAIAN
SUB DINASBINA PROGRAM
SUB DINAS PERHUB.LAUT, UDARA,
POS & TELKOM
SEKSIANGKUTAN LAUT
SEKSIANGKUTAN UDARA
SEKSI POS, TELKOMDAN TEKNIK INFORM.
SEKSILALU LINTAS
SEKSIANGKUTAN DARAT
SEKSI KESEL. DANTEKNIK SAR.
SEKSI PENYU.PROGRAM DAN
WASDAL
SEKSI DATA INF.EVALUASI DAN
LAPORAN
SEKSI BIN-PEL-MASDAN PENTARP.
U P T D
SUB BAGIANHUKUM
Source:Annex of Local Regulation of Bantul Regency No. /2000 dated 18 November 2000
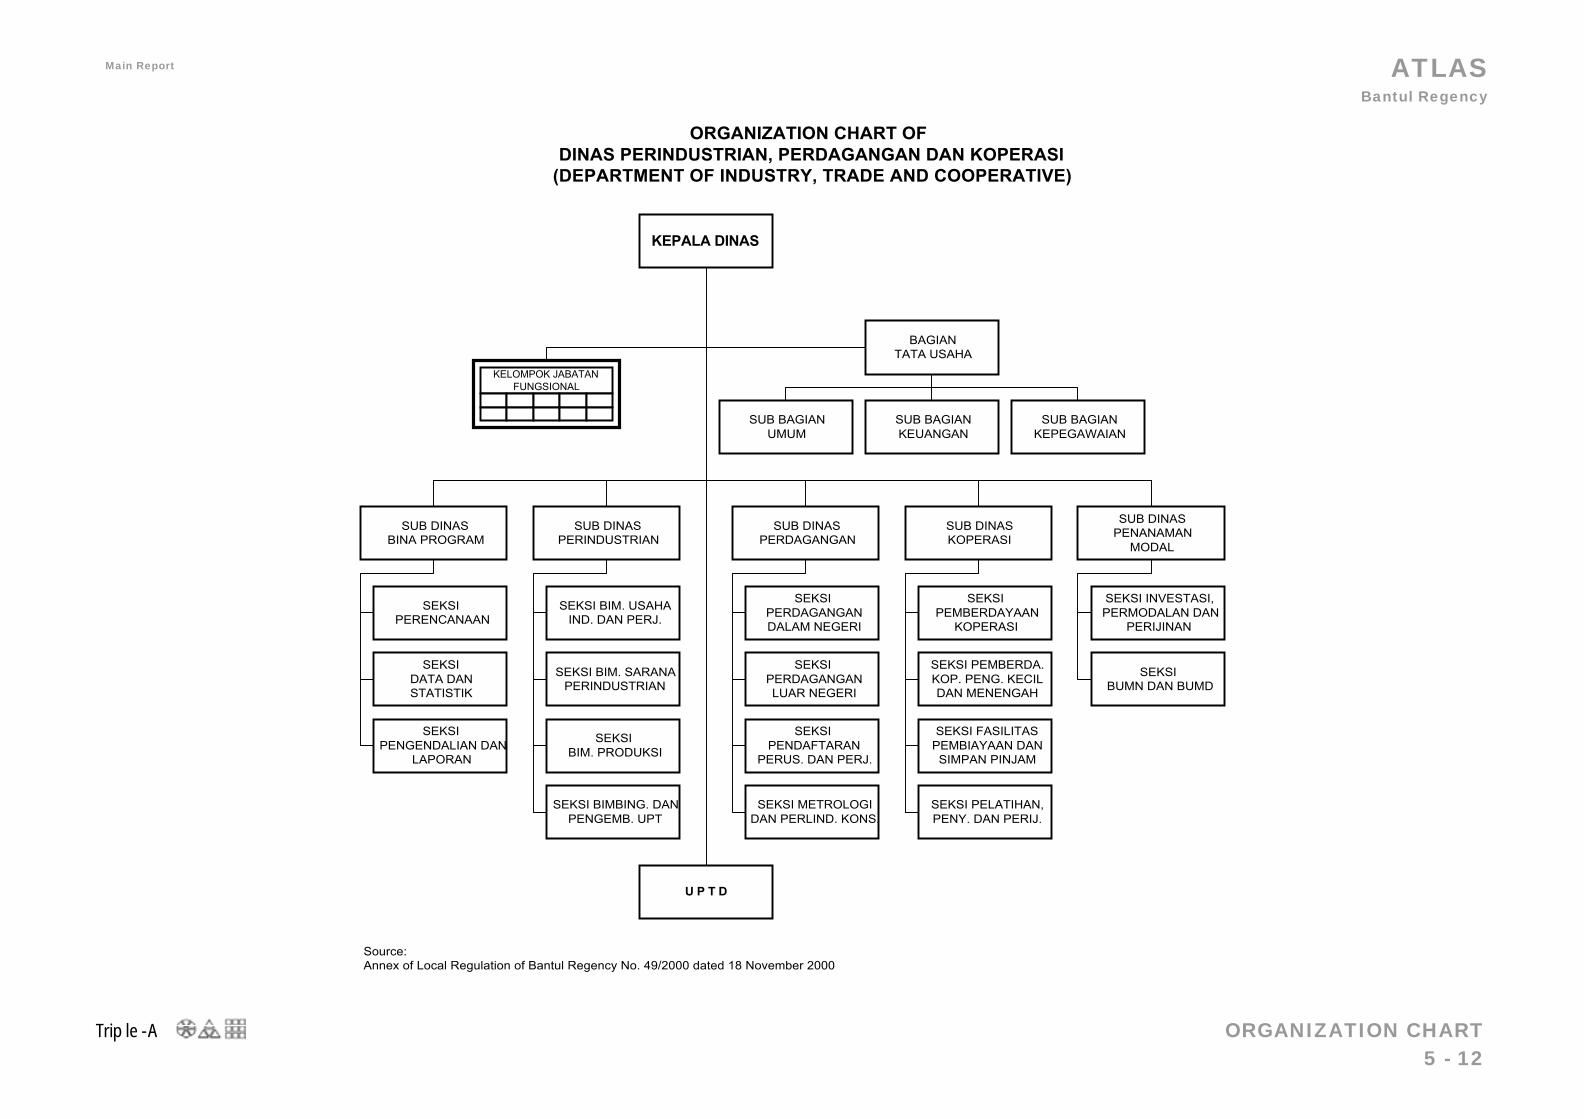
ATLAS Bantul Regency
Triple-A ORGANIZATION CHART 5 - 12
Main Report June 2003
SUB DINASPERINDUSTRIAN
KEPALA DINAS
BAGIANTATA USAHA
KELOMPOK JABATANFUNGSIONAL
ORGANIZATION CHART OFDINAS PERINDUSTRIAN, PERDAGANGAN DAN KOPERASI
(DEPARTMENT OF INDUSTRY, TRADE AND COOPERATIVE)
SUB BAGIANKEUANGAN
SUB BAGIANUMUM
SUB BAGIANKEPEGAWAIAN
SUB DINASBINA PROGRAM
SUB DINASPERDAGANGAN
SEKSIPERDAGANGANDALAM NEGERI
SEKSIPERDAGANGANLUAR NEGERI
SEKSIPENDAFTARAN
PERUS. DAN PERJ.
SEKSI BIM. USAHAIND. DAN PERJ.
SEKSI BIM. SARANAPERINDUSTRIAN
SEKSIBIM. PRODUKSI
SEKSIPERENCANAAN
SEKSIDATA DANSTATISTIK
SEKSIPENGENDALIAN DAN
LAPORAN
U P T D
SUB DINASKOPERASI
SEKSIPEMBERDAYAAN
KOPERASI
SEKSI PEMBERDA.KOP. PENG. KECILDAN MENENGAH
SEKSI FASILITASPEMBIAYAAN DANSIMPAN PINJAM
SUB DINASPENANAMAN
MODAL
SEKSI INVESTASI,PERMODALAN DAN
PERIJINAN
SEKSIBUMN DAN BUMD
SEKSI BIMBING. DANPENGEMB. UPT
SEKSI METROLOGIDAN PERLIND. KONS.
SEKSI PELATIHAN,PENY. DAN PERIJ.
Source:Annex of Local Regulation of Bantul Regency No. 49/2000 dated 18 November 2000
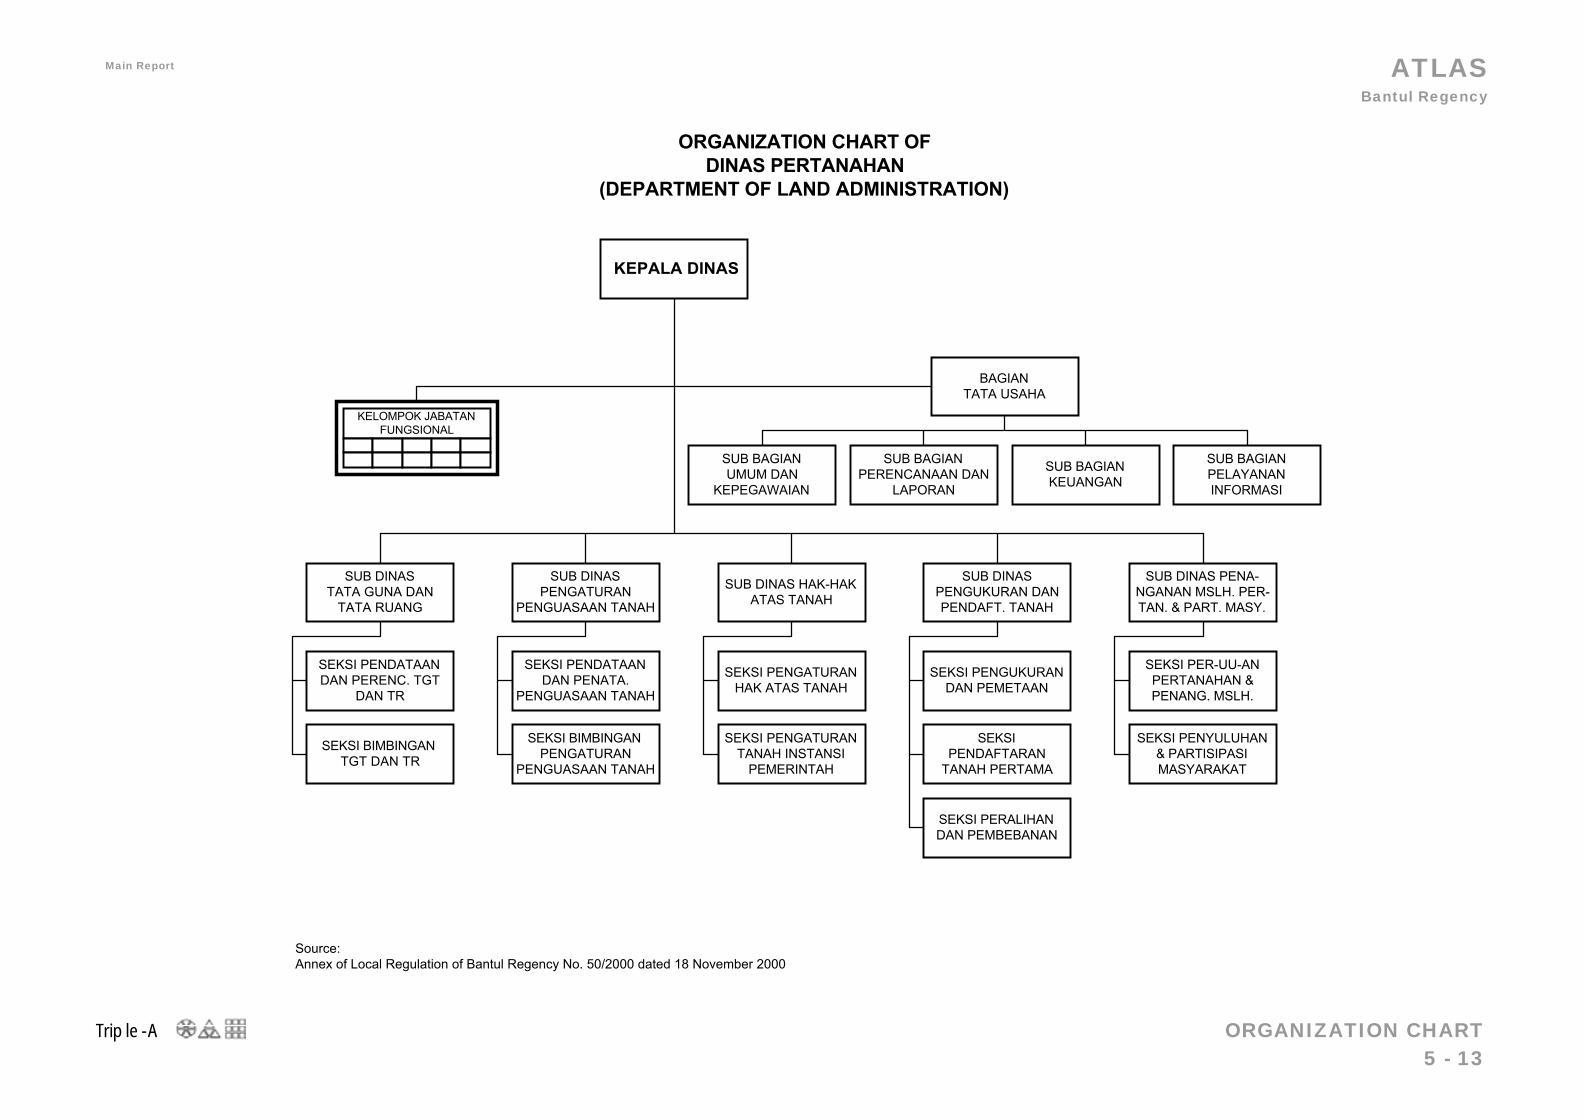
ATLAS Bantul Regency
Triple-A ORGANIZATION CHART 5 - 13
Main Report June 2003
SUB DINASPENGATURAN
PENGUASAAN TANAH
KEPALA DINAS
BAGIANTATA USAHA
KELOMPOK JABATANFUNGSIONAL
ORGANIZATION CHART OFDINAS PERTANAHAN
(DEPARTMENT OF LAND ADMINISTRATION)
SUB BAGIANPERENCANAAN DAN
LAPORAN
SUB BAGIANUMUM DAN
KEPEGAWAIAN
SUB BAGIANKEUANGAN
SUB DINASTATA GUNA DAN
TATA RUANG
SUB DINAS HAK-HAKATAS TANAH
SEKSI PENGATURANHAK ATAS TANAH
SEKSI PENGATURANTANAH INSTANSI
PEMERINTAH
SEKSI PENDATAANDAN PENATA.
PENGUASAAN TANAH
SEKSI BIMBINGANPENGATURAN
PENGUASAAN TANAH
SEKSI PENDATAANDAN PERENC. TGT
DAN TR
SEKSI BIMBINGANTGT DAN TR
SUB DINASPENGUKURAN DANPENDAFT. TANAH
SEKSI PENGUKURANDAN PEMETAAN
SEKSIPENDAFTARAN
TANAH PERTAMA
SEKSI PERALIHANDAN PEMBEBANAN
SUB DINAS PENA-NGANAN MSLH. PER-TAN. & PART. MASY.
SEKSI PER-UU-ANPERTANAHAN &PENANG. MSLH.
SEKSI PENYULUHAN& PARTISIPASIMASYARAKAT
SUB BAGIANPELAYANANINFORMASI
Source:Annex of Local Regulation of Bantul Regency No. 50/2000 dated 18 November 2000
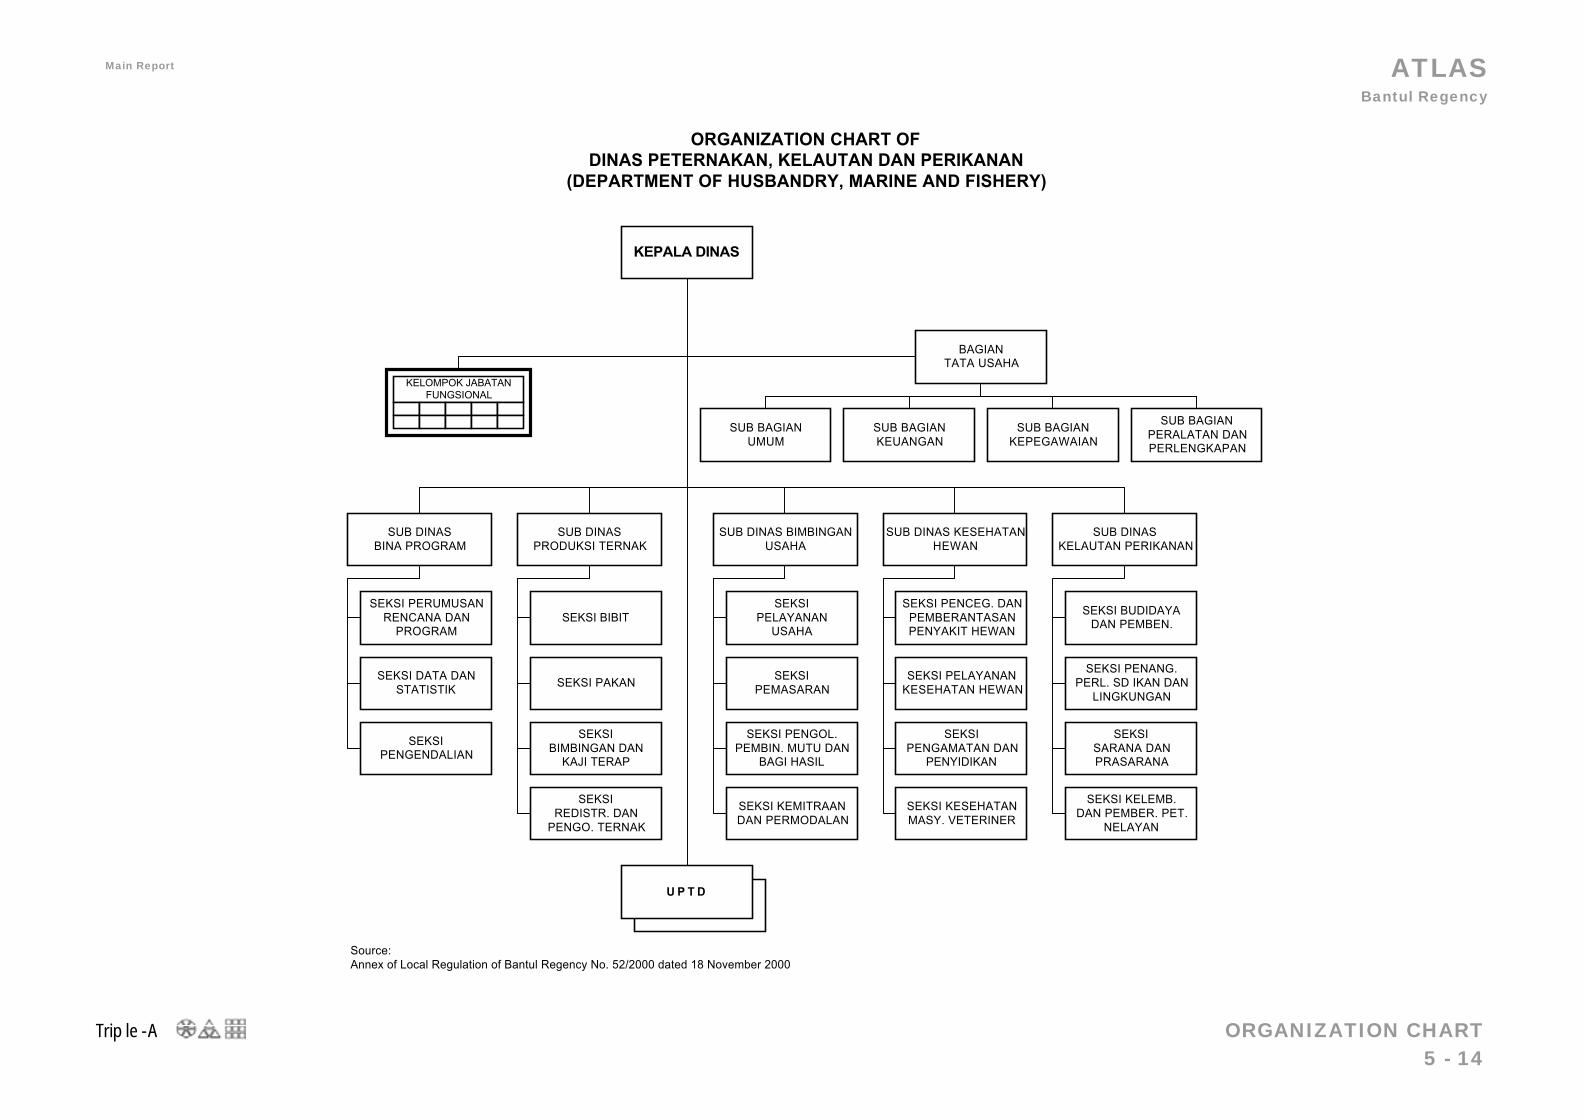
ATLAS Bantul Regency
Triple-A ORGANIZATION CHART 5 - 14
Main Report June 2003
SUB DINASPRODUKSI TERNAK
KEPALA DINAS
BAGIANTATA USAHA
KELOMPOK JABATANFUNGSIONAL
ORGANIZATION CHART OFDINAS PETERNAKAN, KELAUTAN DAN PERIKANAN
(DEPARTMENT OF HUSBANDRY, MARINE AND FISHERY)
SUB BAGIANKEUANGAN
SUB BAGIANUMUM
SUB BAGIANKEPEGAWAIAN
SUB DINASBINA PROGRAM
SUB DINAS BIMBINGANUSAHA
SEKSIPELAYANAN
USAHA
SEKSIPEMASARAN
SEKSI PENGOL.PEMBIN. MUTU DAN
BAGI HASIL
SEKSI BIBIT
SEKSI PAKAN
SEKSIBIMBINGAN DAN
KAJI TERAP
SEKSI PERUMUSANRENCANA DAN
PROGRAM
SEKSI DATA DANSTATISTIK
SEKSIPENGENDALIAN
U P T D
SUB BAGIANPERALATAN DANPERLENGKAPAN
SUB DINAS KESEHATANHEWAN
SEKSI PENCEG. DANPEMBERANTASANPENYAKIT HEWAN
SEKSI PELAYANANKESEHATAN HEWAN
SEKSIPENGAMATAN DAN
PENYIDIKAN
SUB DINASKELAUTAN PERIKANAN
SEKSI BUDIDAYADAN PEMBEN.
SEKSI PENANG.PERL. SD IKAN DAN
LINGKUNGAN
SEKSISARANA DANPRASARANA
SEKSIREDISTR. DAN
PENGO. TERNAK
SEKSI KEMITRAANDAN PERMODALAN
SEKSI KESEHATANMASY. VETERINER
SEKSI KELEMB.DAN PEMBER. PET.
NELAYAN
Source:Annex of Local Regulation of Bantul Regency No. 52/2000 dated 18 November 2000
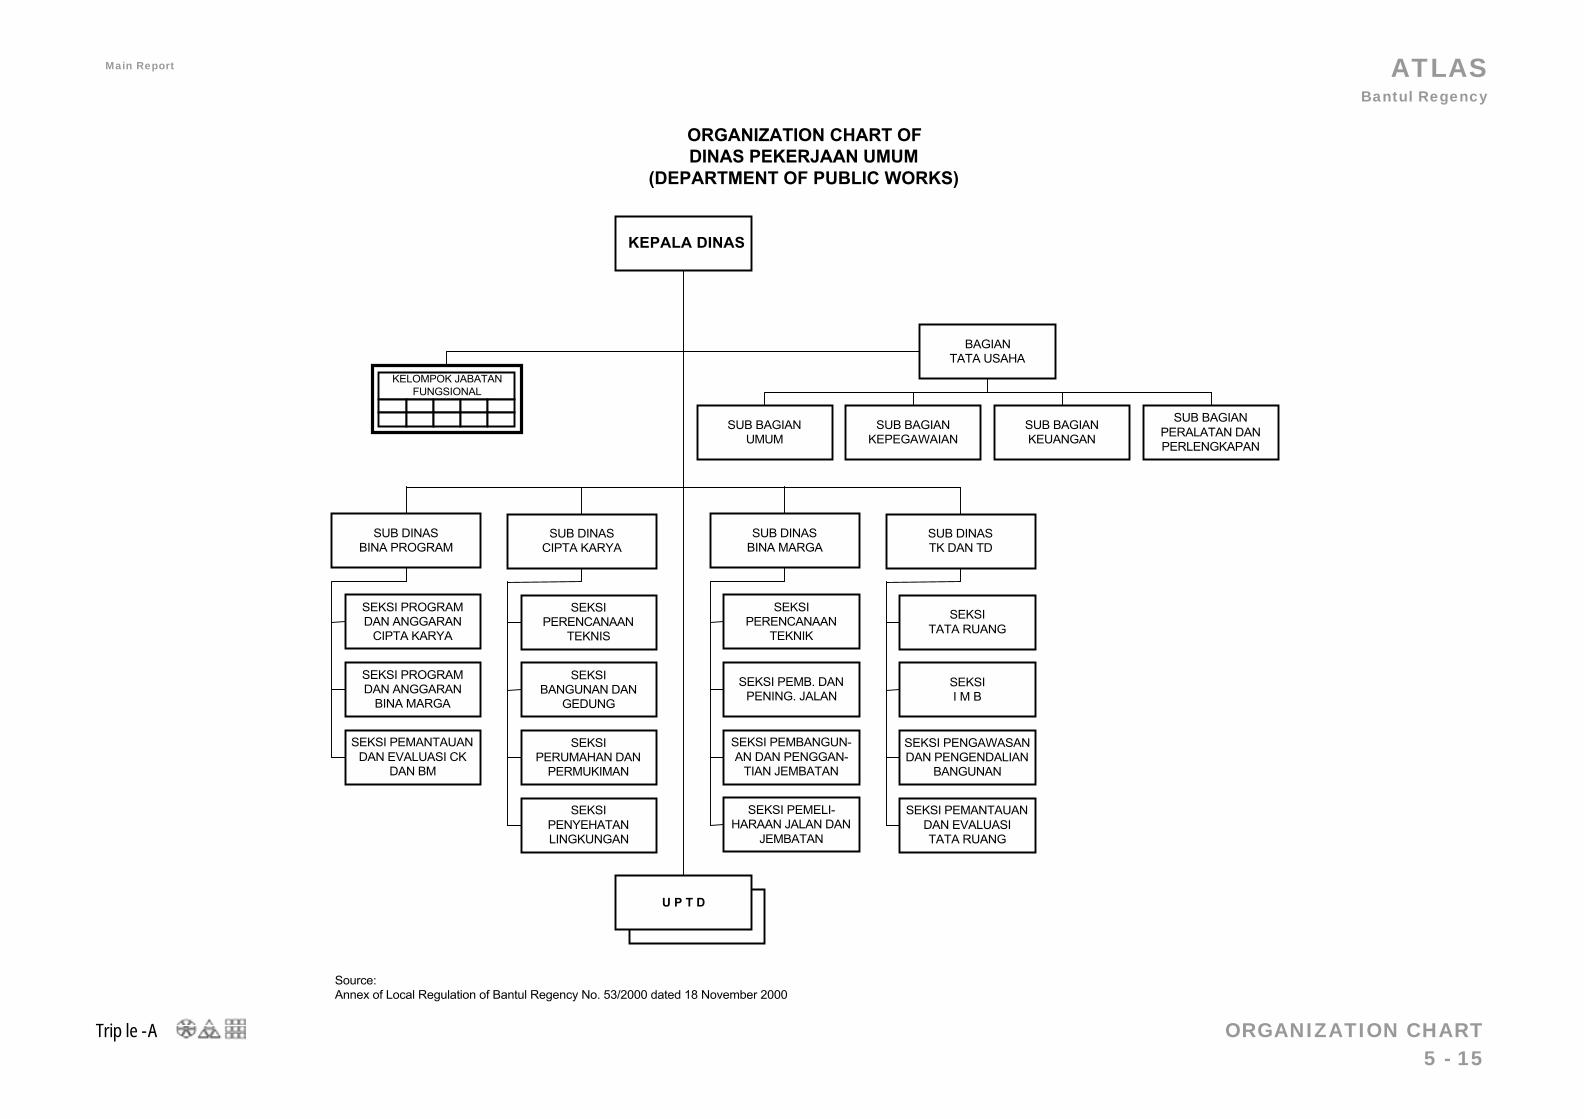
ATLAS Bantul Regency
Triple-A ORGANIZATION CHART 5 - 15
Main Report June 2003
SUB DINASCIPTA KARYA
KEPALA DINAS
BAGIANTATA USAHA
KELOMPOK JABATANFUNGSIONAL
ORGANIZATION CHART OFDINAS PEKERJAAN UMUM
(DEPARTMENT OF PUBLIC WORKS)
SUB BAGIANKEPEGAWAIAN
SUB BAGIANUMUM
SUB BAGIANKEUANGAN
SUB DINASBINA PROGRAM
SUB DINASBINA MARGA
SEKSIPERENCANAAN
TEKNIK
SEKSI PEMB. DANPENING. JALAN
SEKSIPERENCANAAN
TEKNIS
SEKSIBANGUNAN DAN
GEDUNG
SEKSI PROGRAMDAN ANGGARAN
CIPTA KARYA
SEKSI PROGRAMDAN ANGGARAN
BINA MARGA
U P T D
SUB DINASTK DAN TD
SEKSITATA RUANG
SEKSII M B
SUB BAGIANPERALATAN DANPERLENGKAPAN
SEKSI PENGAWASANDAN PENGENDALIAN
BANGUNAN
SEKSI PEMANTAUANDAN EVALUASITATA RUANG
SEKSI PEMBANGUN-AN DAN PENGGAN-
TIAN JEMBATAN
SEKSI PEMELI-HARAAN JALAN DAN
JEMBATAN
SEKSIPERUMAHAN DAN
PERMUKIMAN
SEKSIPENYEHATANLINGKUNGAN
SEKSI PEMANTAUANDAN EVALUASI CK
DAN BM
Source:Annex of Local Regulation of Bantul Regency No. 53/2000 dated 18 November 2000
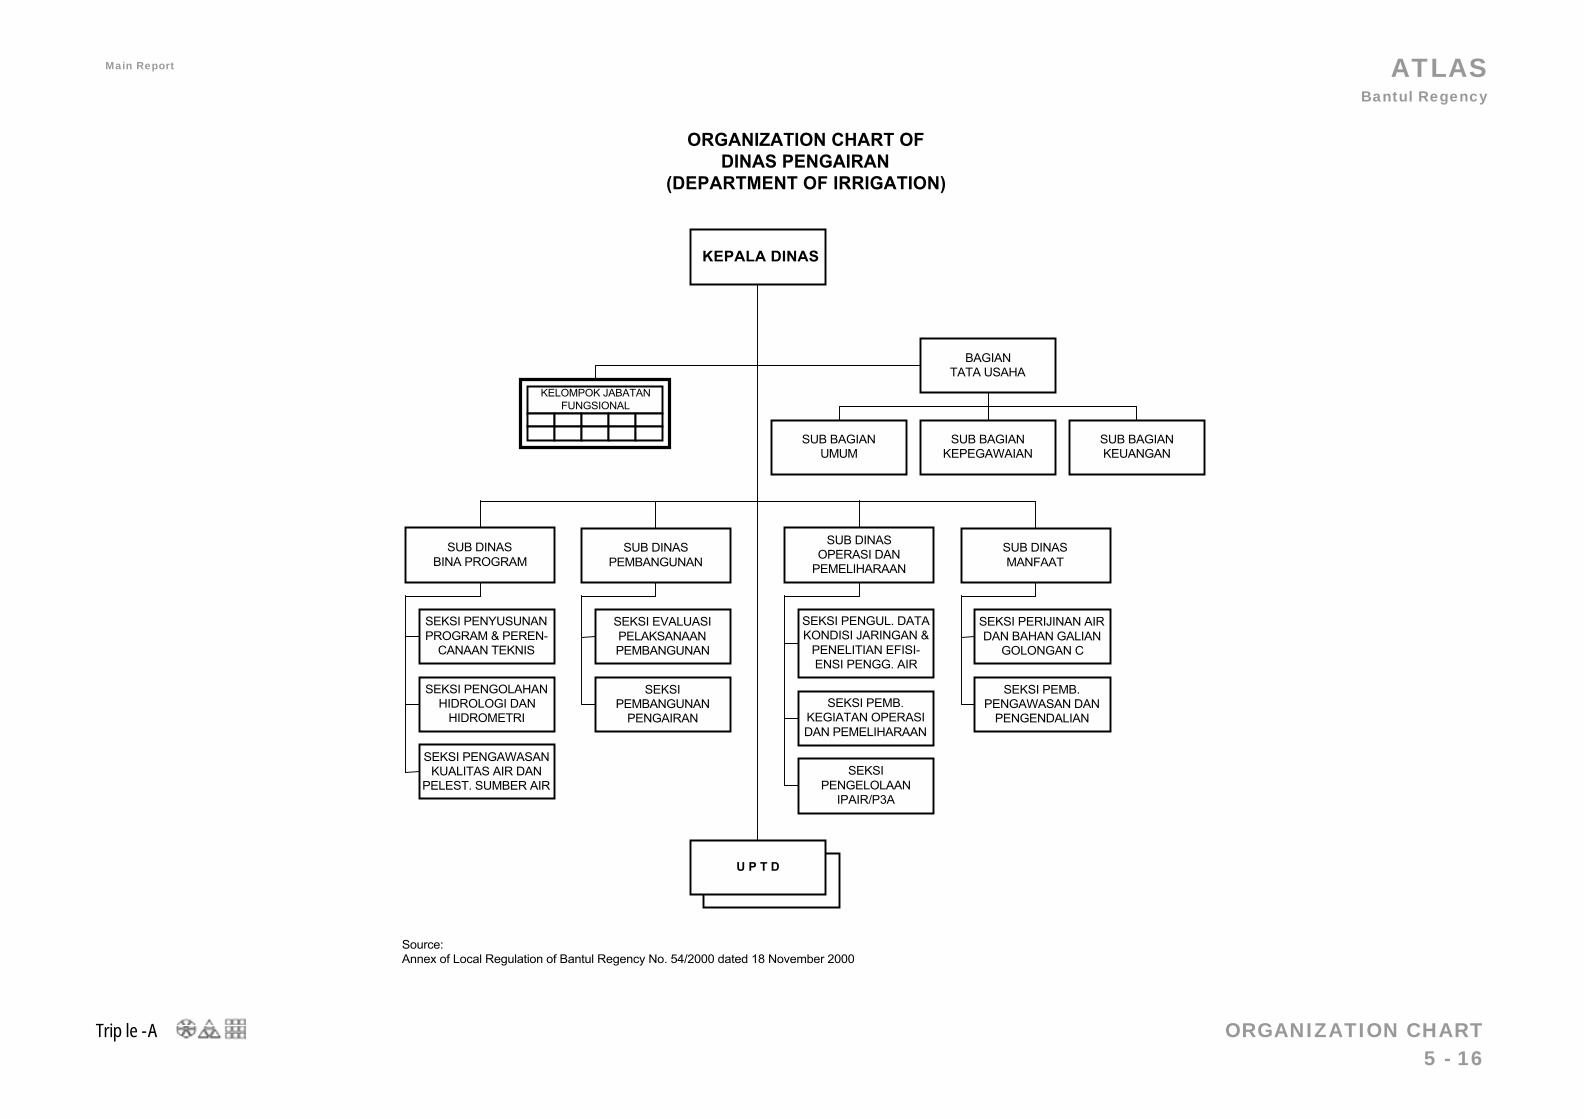
ATLAS Bantul Regency
Triple-A ORGANIZATION CHART 5 - 16
Main Report June 2003
SUB DINASPEMBANGUNAN
KEPALA DINAS
BAGIANTATA USAHA
KELOMPOK JABATANFUNGSIONAL
ORGANIZATION CHART OFDINAS PENGAIRAN
(DEPARTMENT OF IRRIGATION)
SUB BAGIANKEPEGAWAIAN
SUB BAGIANUMUM
SUB BAGIANKEUANGAN
SUB DINASBINA PROGRAM
SUB DINASOPERASI DAN
PEMELIHARAAN
SEKSI PENGUL. DATAKONDISI JARINGAN &
PENELITIAN EFISI-ENSI PENGG. AIR
SEKSI PEMB.KEGIATAN OPERASIDAN PEMELIHARAAN
SEKSI EVALUASIPELAKSANAANPEMBANGUNAN
SEKSIPEMBANGUNAN
PENGAIRAN
SEKSI PENYUSUNANPROGRAM & PEREN-
CANAAN TEKNIS
SEKSI PENGOLAHANHIDROLOGI DAN
HIDROMETRI
U P T D
SUB DINASMANFAAT
SEKSI PERIJINAN AIRDAN BAHAN GALIAN
GOLONGAN C
SEKSI PEMB.PENGAWASAN DAN
PENGENDALIAN
SEKSIPENGELOLAAN
IPAIR/P3A
SEKSI PENGAWASANKUALITAS AIR DAN
PELEST. SUMBER AIR
Source:Annex of Local Regulation of Bantul Regency No. 54/2000 dated 18 November 2000
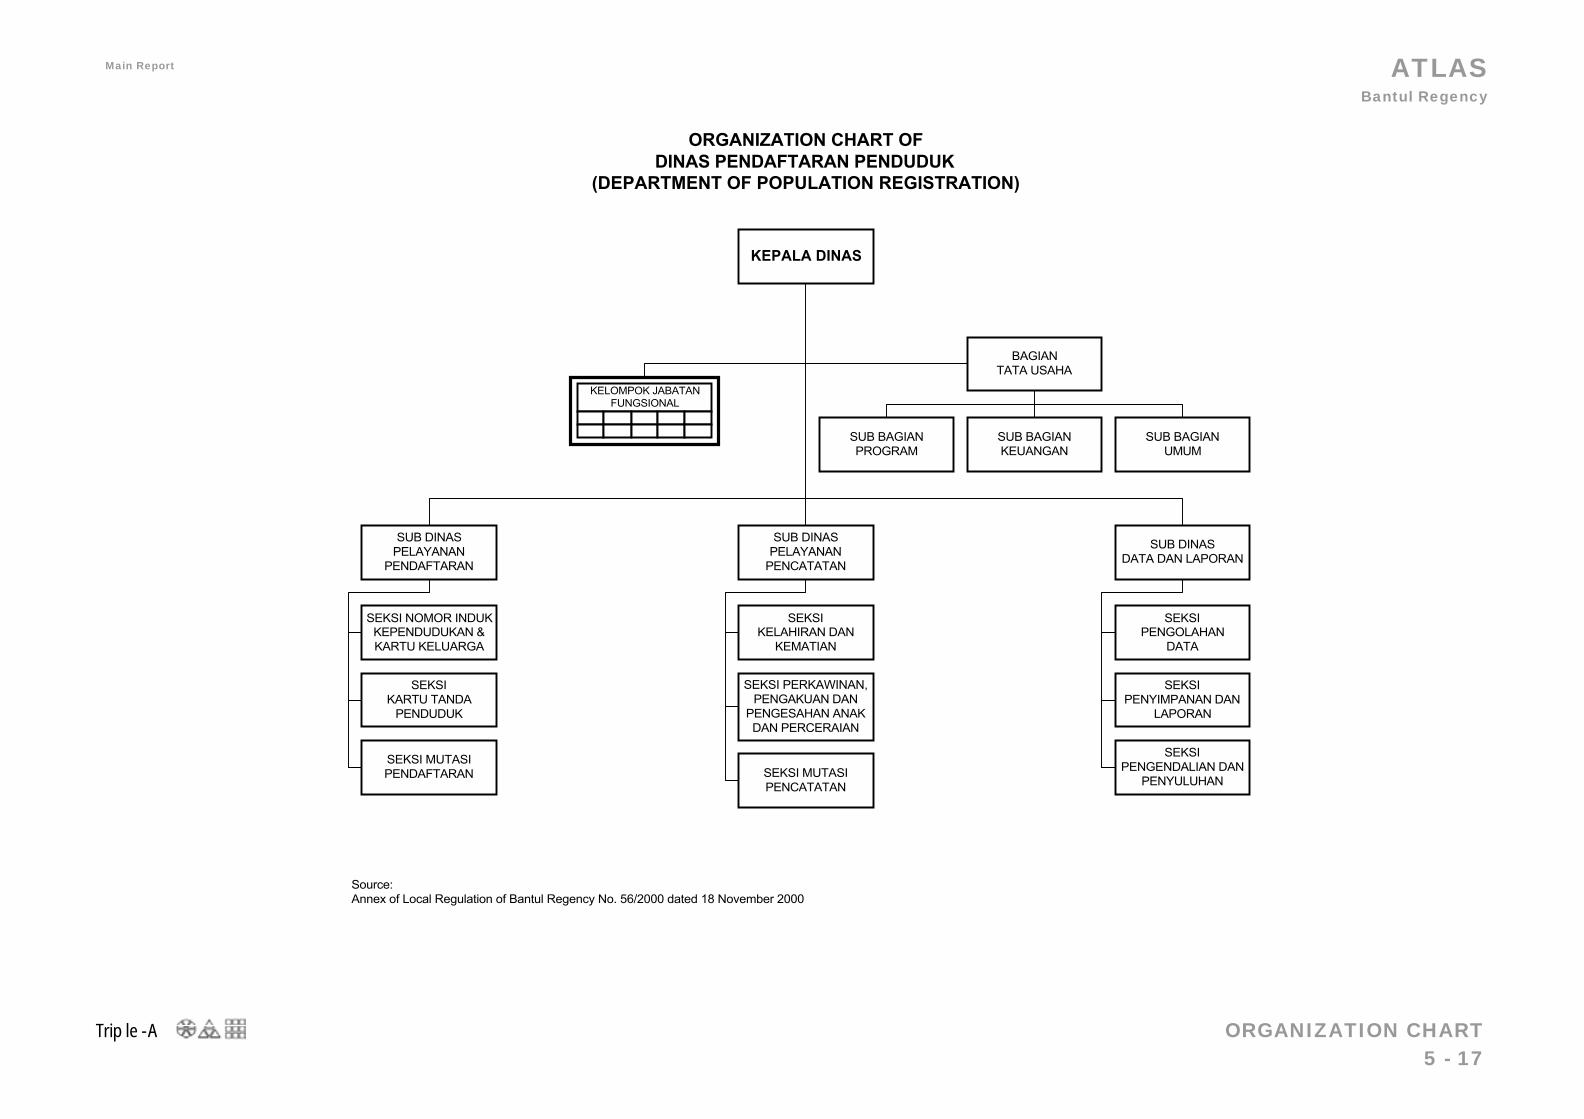
ATLAS Bantul Regency
Triple-A ORGANIZATION CHART 5 - 17
Main Report June 2003
SUB DINASPELAYANAN
PENDAFTARAN
SUB DINASPELAYANAN
PENCATATAN
SUB DINASDATA DAN LAPORAN
KEPALA DINAS
KELOMPOK JABATANFUNGSIONAL
ORGANIZATION CHART OFDINAS PENDAFTARAN PENDUDUK
(DEPARTMENT OF POPULATION REGISTRATION)
SEKSI NOMOR INDUKKEPENDUDUKAN &KARTU KELUARGA
SEKSIKARTU TANDA
PENDUDUK
SEKSIKELAHIRAN DAN
KEMATIAN
SEKSI PERKAWINAN,PENGAKUAN DAN
PENGESAHAN ANAKDAN PERCERAIAN
SEKSI MUTASIPENCATATAN
SEKSIPENGOLAHAN
DATA
SEKSIPENYIMPANAN DAN
LAPORAN
BAGIANTATA USAHA
SUB BAGIANPROGRAM
SUB BAGIANKEUANGAN
SUB BAGIANUMUM
SEKSIPENGENDALIAN DAN
PENYULUHAN
SEKSI MUTASIPENDAFTARAN
Source:Annex of Local Regulation of Bantul Regency No. 56/2000 dated 18 November 2000
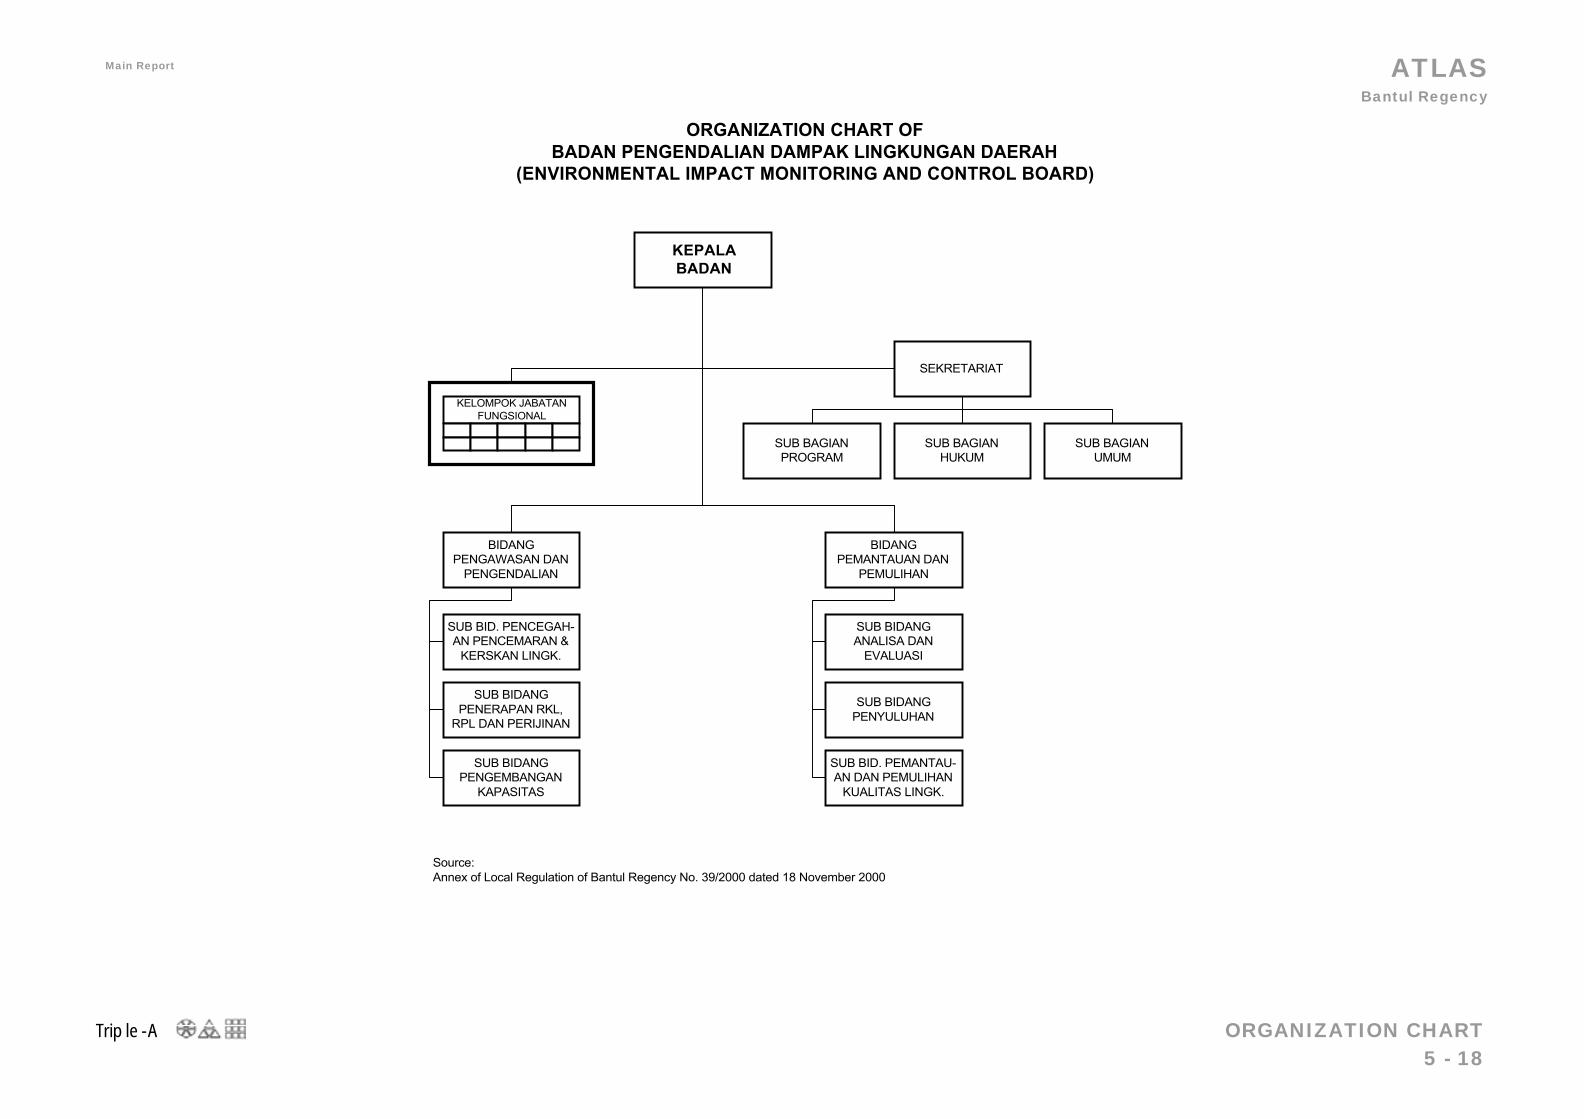
ATLAS Bantul Regency
Triple-A ORGANIZATION CHART 5 - 18
Main Report June 2003
KEPALABADAN
KELOMPOK JABATANFUNGSIONAL
ORGANIZATION CHART OFBADAN PENGENDALIAN DAMPAK LINGKUNGAN DAERAH
(ENVIRONMENTAL IMPACT MONITORING AND CONTROL BOARD)
BIDANGPENGAWASAN DAN
PENGENDALIAN
BIDANGPEMANTAUAN DAN
PEMULIHAN
SEKRETARIAT
SUB BAGIANHUKUM
SUB BAGIANPROGRAM
SUB BAGIANUMUM
SUB BID. PENCEGAH-AN PENCEMARAN &
KERSKAN LINGK.
SUB BIDANGPENERAPAN RKL,
RPL DAN PERIJINAN
SUB BIDANGPENGEMBANGAN
KAPASITAS
SUB BIDANGANALISA DAN
EVALUASI
SUB BIDANGPENYULUHAN
SUB BID. PEMANTAU-AN DAN PEMULIHAN
KUALITAS LINGK.
Source:Annex of Local Regulation of Bantul Regency No. 39/2000 dated 18 November 2000
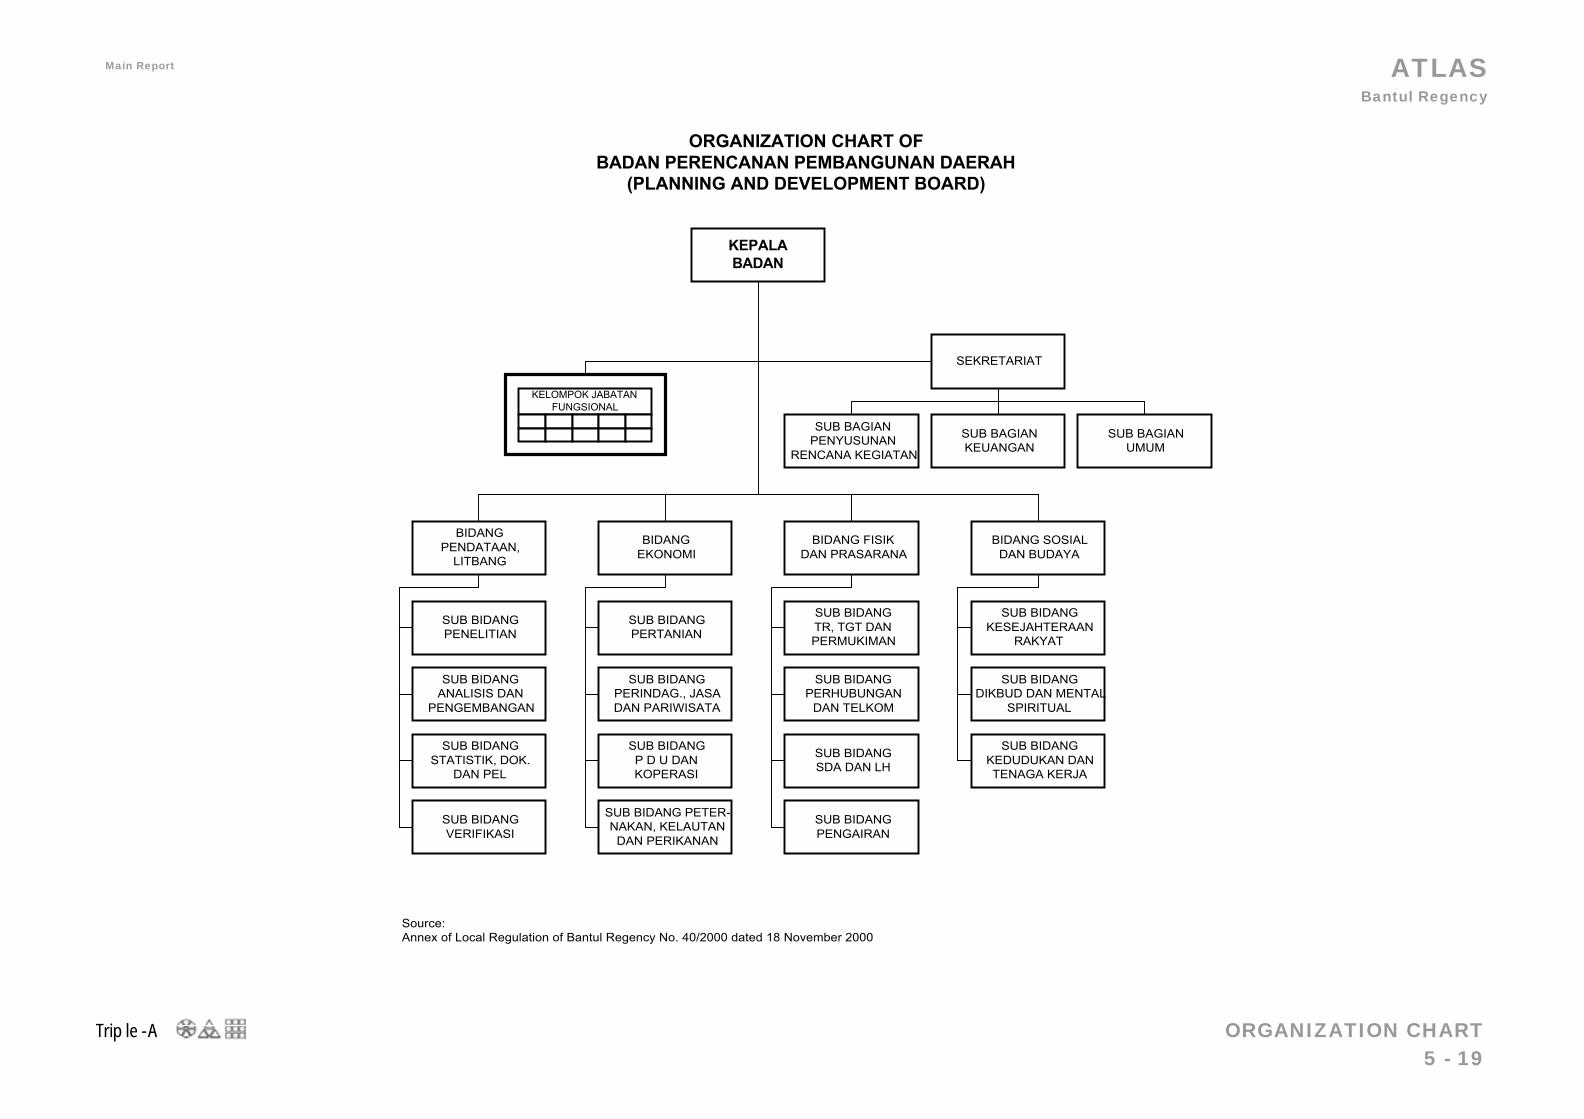
ATLAS Bantul Regency
Triple-A ORGANIZATION CHART 5 - 19
Main Report June 2003
KEPALABADAN
KELOMPOK JABATANFUNGSIONAL
ORGANIZATION CHART OFBADAN PERENCANAN PEMBANGUNAN DAERAH
(PLANNING AND DEVELOPMENT BOARD)
BIDANGEKONOMI
BIDANG SOSIALDAN BUDAYA
SEKRETARIAT
SUB BAGIANKEUANGAN
SUB BAGIANPENYUSUNAN
RENCANA KEGIATAN
SUB BAGIANUMUM
SUB BIDANGPERTANIAN
SUB BIDANGPERINDAG., JASADAN PARIWISATA
SUB BIDANGP D U DANKOPERASI
SUB BIDANGKESEJAHTERAAN
RAKYAT
SUB BIDANGDIKBUD DAN MENTAL
SPIRITUAL
SUB BIDANGKEDUDUKAN DANTENAGA KERJA
BIDANG FISIKDAN PRASARANA
SUB BIDANGTR, TGT DANPERMUKIMAN
SUB BIDANGPERHUBUNGAN
DAN TELKOM
SUB BIDANGSDA DAN LH
BIDANGPENDATAAN,
LITBANG
SUB BIDANGPENELITIAN
SUB BIDANGANALISIS DAN
PENGEMBANGAN
SUB BIDANGSTATISTIK, DOK.
DAN PEL
SUB BIDANGVERIFIKASI
SUB BIDANG PETER-NAKAN, KELAUTAN
DAN PERIKANAN
SUB BIDANGPENGAIRAN
Source:Annex of Local Regulation of Bantul Regency No. 40/2000 dated 18 November 2000
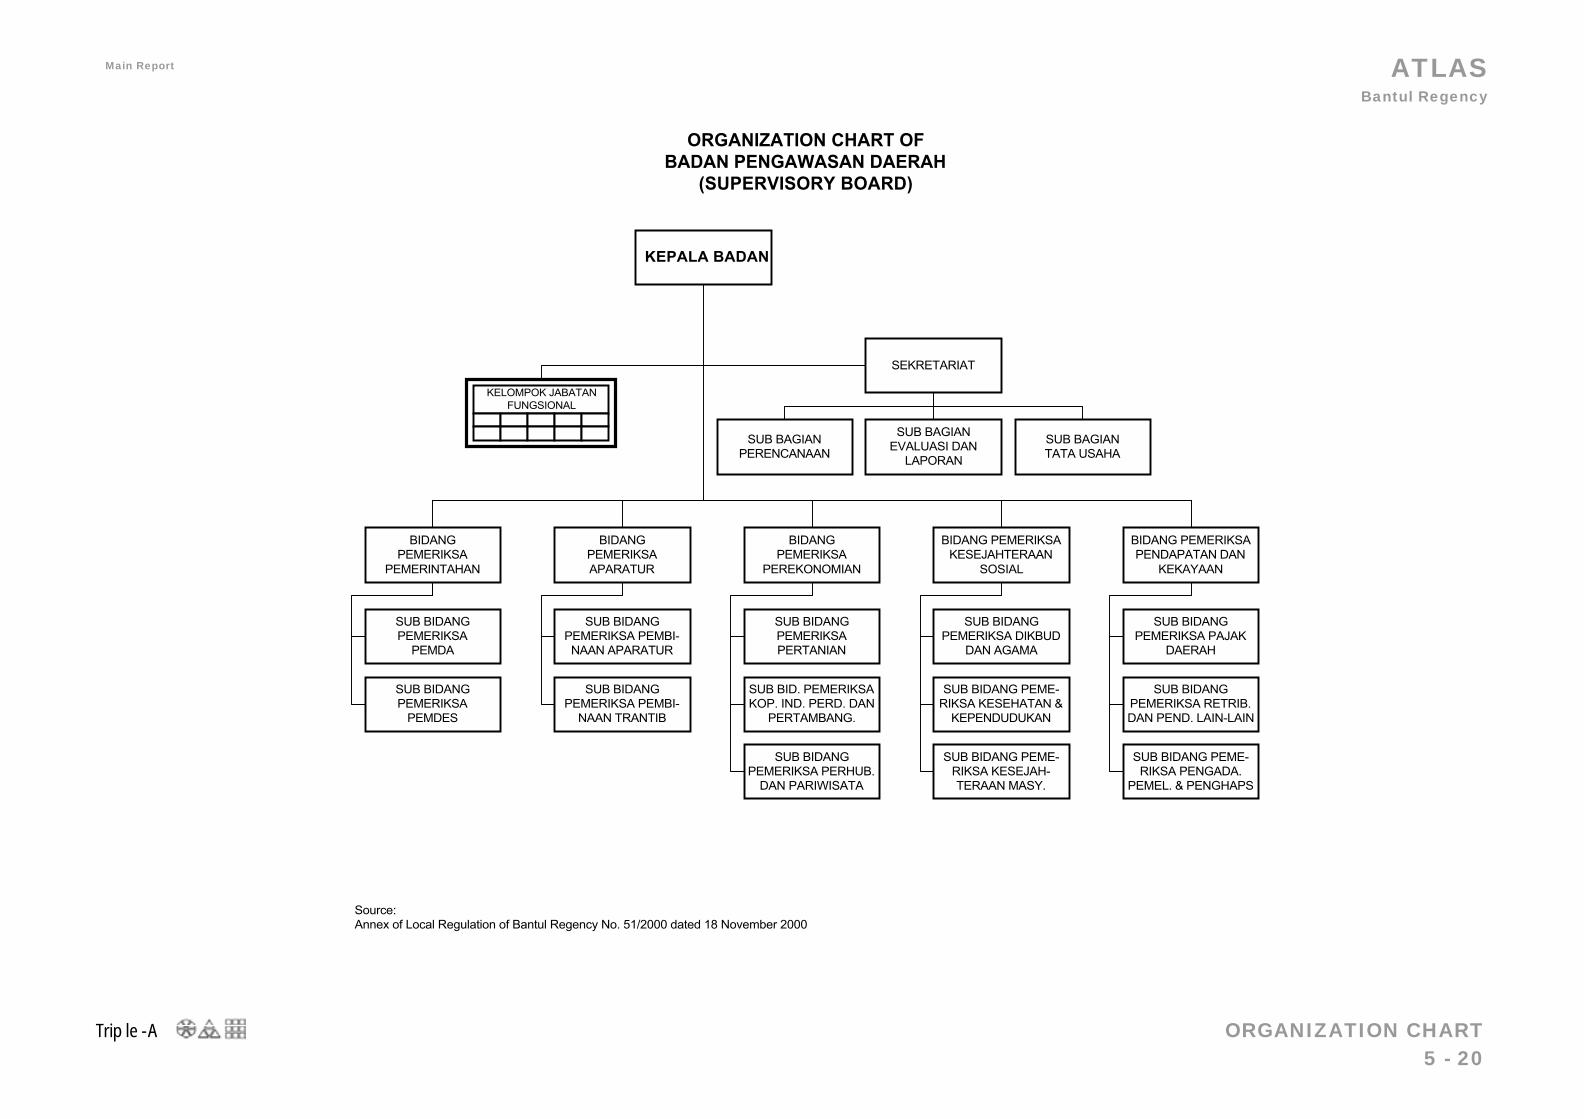
ATLAS Bantul Regency
Triple-A ORGANIZATION CHART 5 - 20
Main Report June 2003
BIDANGPEMERIKSAAPARATUR
KEPALA BADAN
SEKRETARIAT
KELOMPOK JABATANFUNGSIONAL
ORGANIZATION CHART OFBADAN PENGAWASAN DAERAH
(SUPERVISORY BOARD)
SUB BAGIANEVALUASI DAN
LAPORAN
SUB BAGIANPERENCANAAN
SUB BAGIANTATA USAHA
BIDANGPEMERIKSA
PEMERINTAHAN
BIDANGPEMERIKSA
PEREKONOMIAN
SUB BIDANGPEMERIKSAPERTANIAN
SUB BID. PEMERIKSAKOP. IND. PERD. DAN
PERTAMBANG.
SUB BIDANGPEMERIKSA PERHUB.
DAN PARIWISATA
SUB BIDANGPEMERIKSA PEMBI-NAAN APARATUR
SUB BIDANGPEMERIKSA PEMBI-
NAAN TRANTIB
SUB BIDANGPEMERIKSA
PEMDA
SUB BIDANGPEMERIKSA
PEMDES
BIDANG PEMERIKSAKESEJAHTERAAN
SOSIAL
SUB BIDANGPEMERIKSA DIKBUD
DAN AGAMA
SUB BIDANG PEME-RIKSA KESEHATAN &
KEPENDUDUKAN
SUB BIDANG PEME-RIKSA KESEJAH-TERAAN MASY.
BIDANG PEMERIKSAPENDAPATAN DAN
KEKAYAAN
SUB BIDANGPEMERIKSA PAJAK
DAERAH
SUB BIDANGPEMERIKSA RETRIB.DAN PEND. LAIN-LAIN
SUB BIDANG PEME-RIKSA PENGADA.
PEMEL. & PENGHAPS
Source:Annex of Local Regulation of Bantul Regency No. 51/2000 dated 18 November 2000
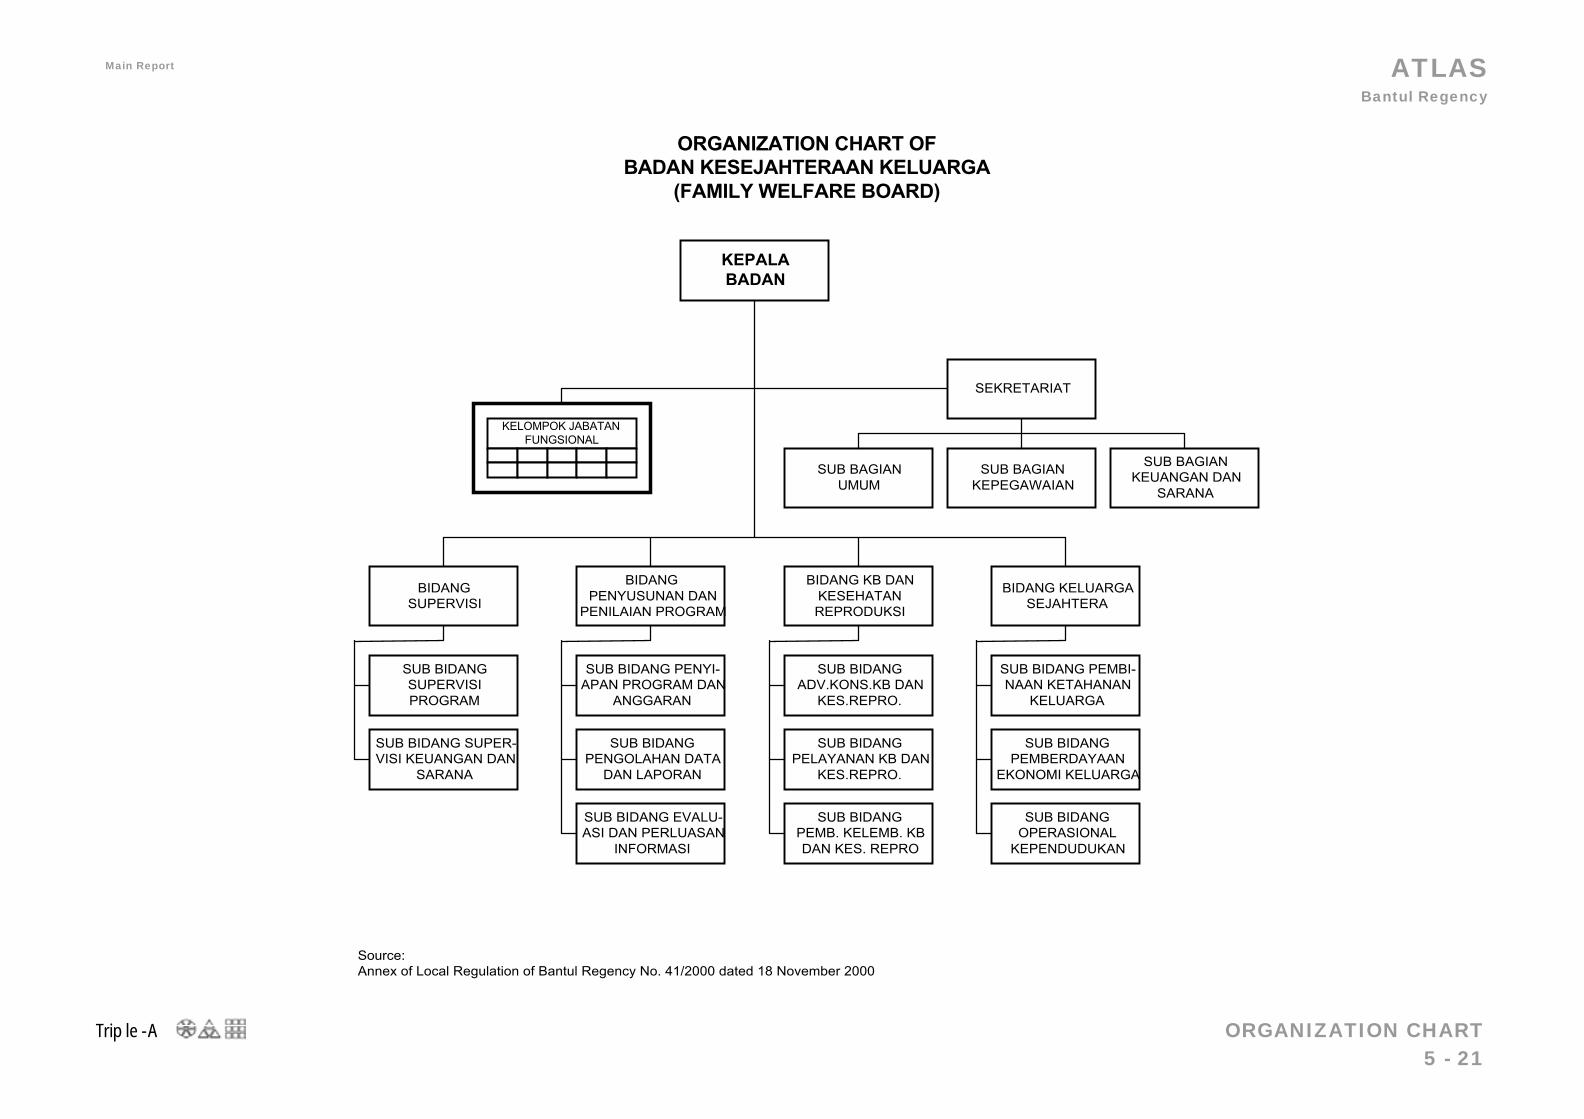
ATLAS Bantul Regency
Triple-A ORGANIZATION CHART 5 - 21
Main Report June 2003
KEPALABADAN
KELOMPOK JABATANFUNGSIONAL
ORGANIZATION CHART OFBADAN KESEJAHTERAAN KELUARGA
(FAMILY WELFARE BOARD)
BIDANGPENYUSUNAN DAN
PENILAIAN PROGRAM
BIDANG KELUARGASEJAHTERA
SEKRETARIAT
SUB BAGIANKEPEGAWAIAN
SUB BAGIANUMUM
SUB BAGIANKEUANGAN DAN
SARANA
SUB BIDANG PENYI-APAN PROGRAM DAN
ANGGARAN
SUB BIDANGPENGOLAHAN DATA
DAN LAPORAN
SUB BIDANG EVALU-ASI DAN PERLUASAN
INFORMASI
SUB BIDANG PEMBI-NAAN KETAHANAN
KELUARGA
SUB BIDANGPEMBERDAYAAN
EKONOMI KELUARGA
SUB BIDANGOPERASIONAL
KEPENDUDUKAN
BIDANG KB DANKESEHATANREPRODUKSI
SUB BIDANGADV.KONS.KB DAN
KES.REPRO.
SUB BIDANGPELAYANAN KB DAN
KES.REPRO.
SUB BIDANGPEMB. KELEMB. KBDAN KES. REPRO
BIDANGSUPERVISI
SUB BIDANGSUPERVISIPROGRAM
SUB BIDANG SUPER-VISI KEUANGAN DAN
SARANA
Source:Annex of Local Regulation of Bantul Regency No. 41/2000 dated 18 November 2000
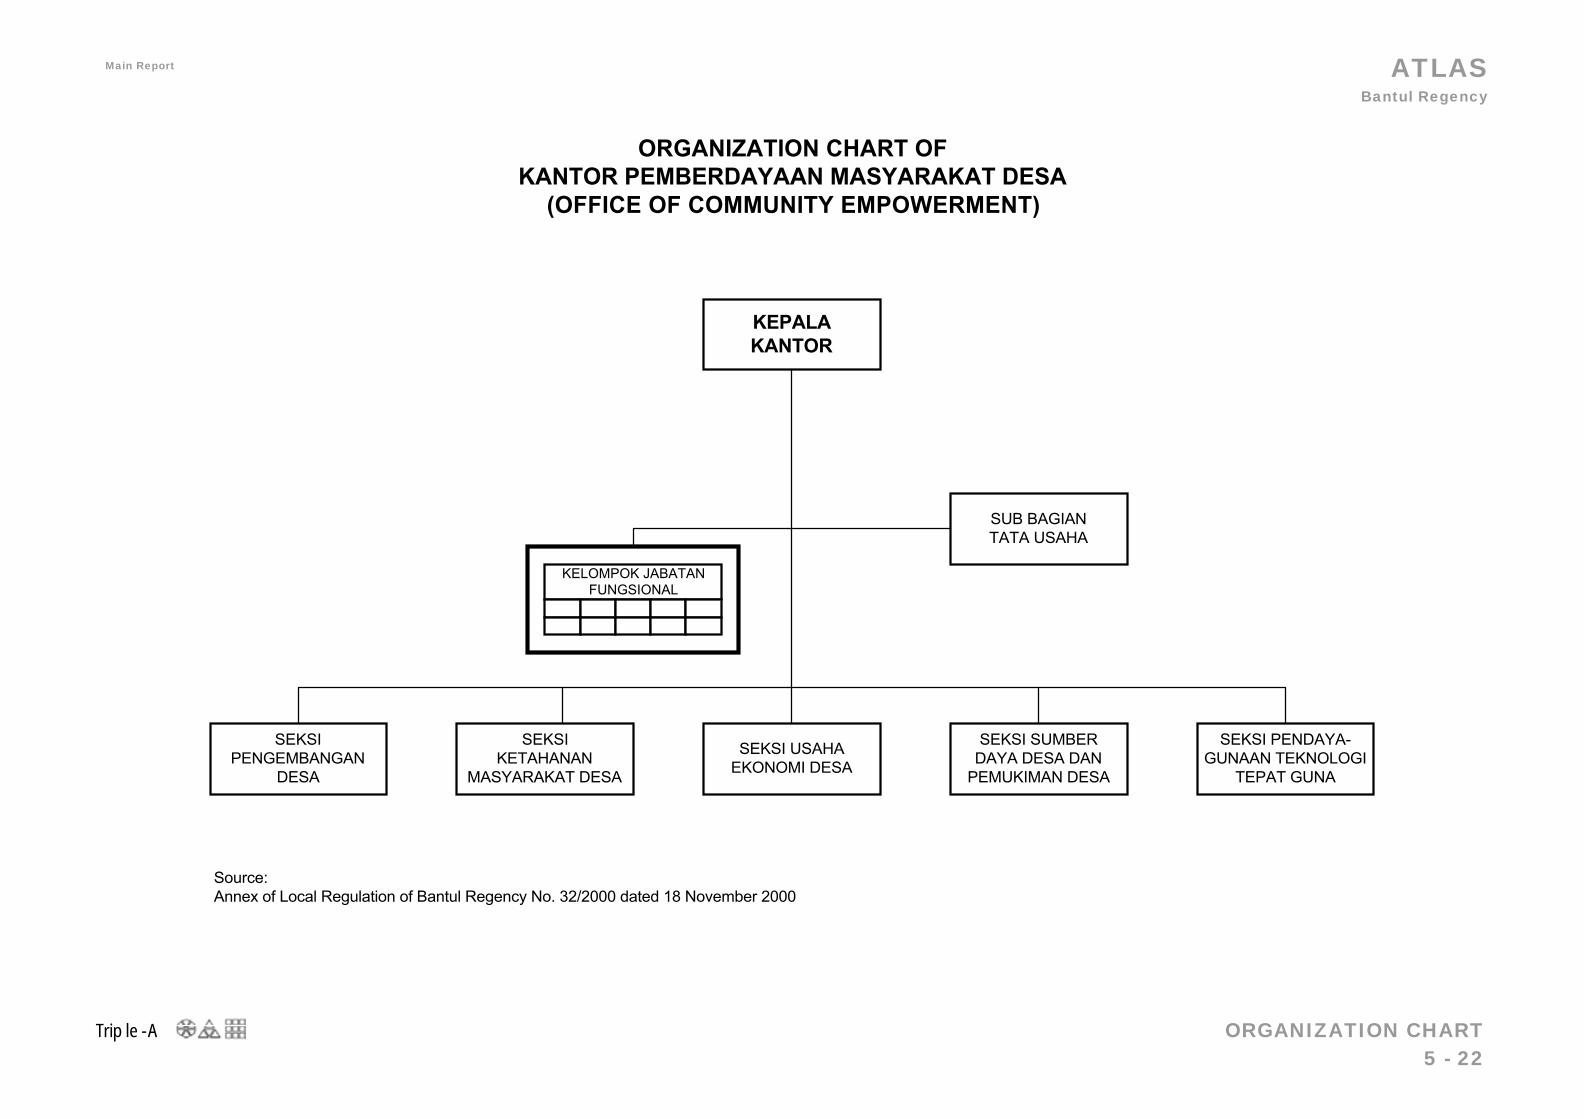
ATLAS Bantul Regency
Triple-A ORGANIZATION CHART 5 - 22
Main Report June 2003
SEKSIPENGEMBANGAN
DESA
SEKSI USAHAEKONOMI DESA
SEKSI PENDAYA-GUNAAN TEKNOLOGI
TEPAT GUNA
KEPALAKANTOR
KELOMPOK JABATANFUNGSIONAL
ORGANIZATION CHART OFKANTOR PEMBERDAYAAN MASYARAKAT DESA
(OFFICE OF COMMUNITY EMPOWERMENT)
SEKSIKETAHANAN
MASYARAKAT DESA
SEKSI SUMBERDAYA DESA DAN
PEMUKIMAN DESA
SUB BAGIANTATA USAHA
Source:Annex of Local Regulation of Bantul Regency No. 32/2000 dated 18 November 2000
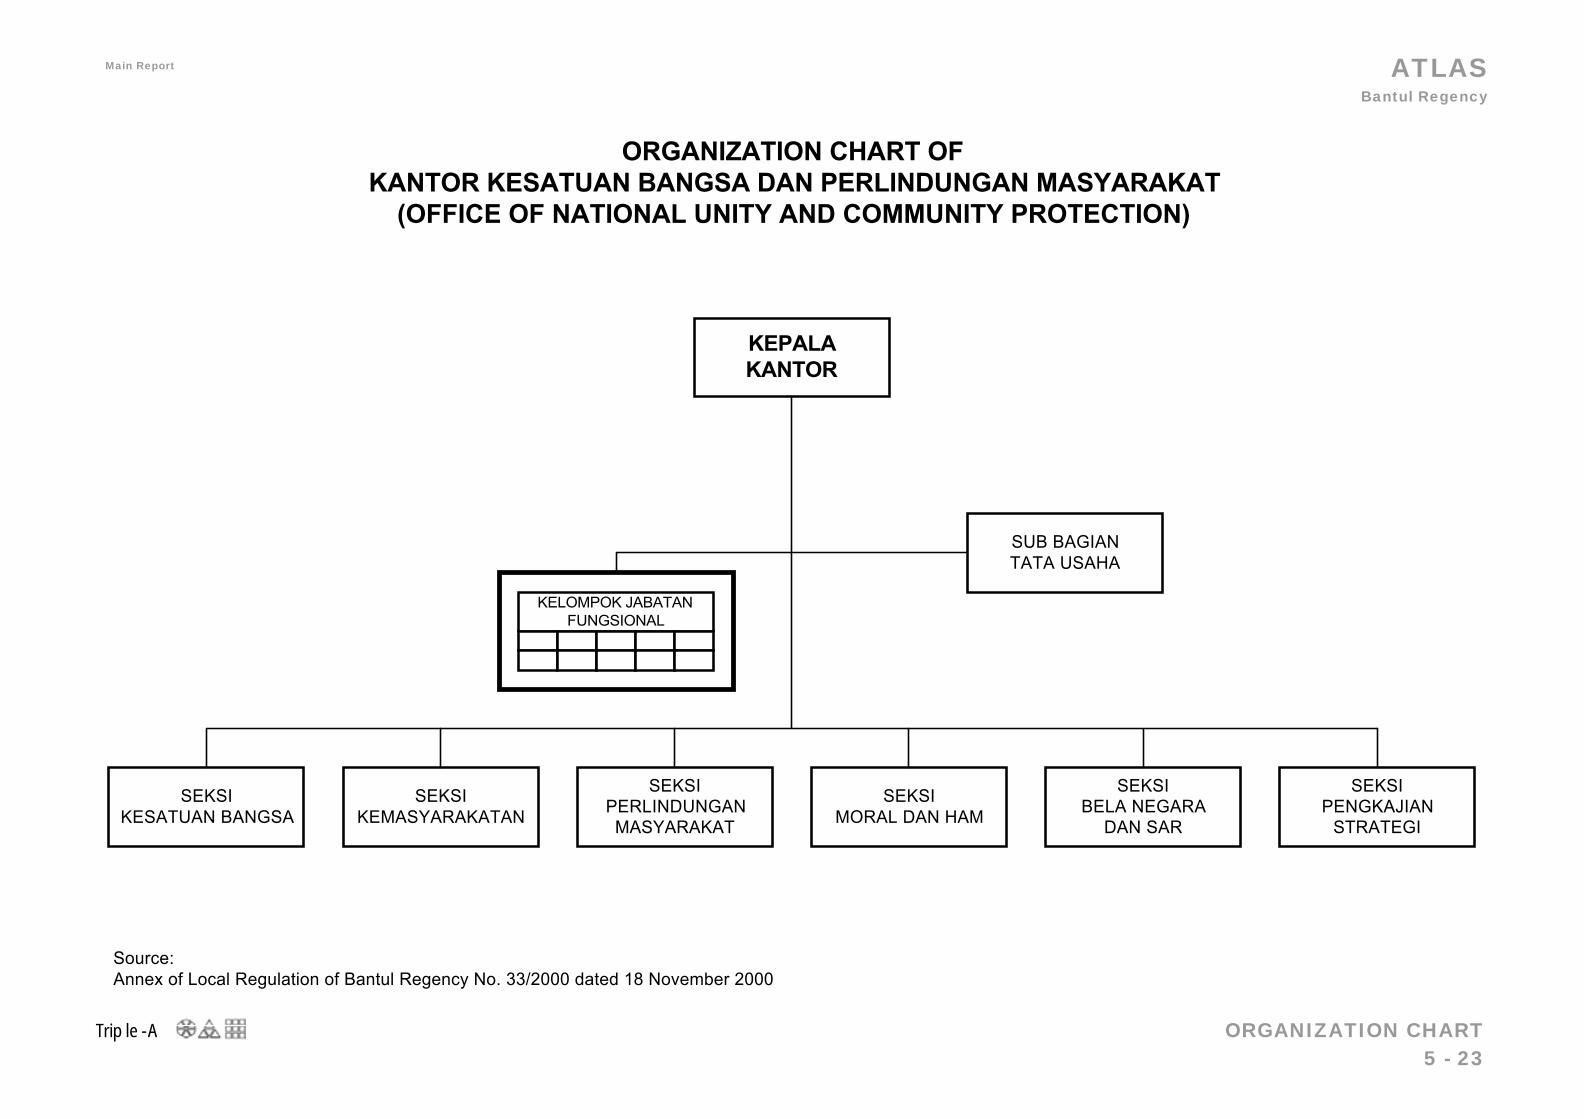
ATLAS Bantul Regency
Triple-A ORGANIZATION CHART 5 - 23
Main Report June 2003
SEKSIKESATUAN BANGSA
SEKSIPERLINDUNGANMASYARAKAT
SEKSIBELA NEGARA
DAN SAR
KEPALAKANTOR
KELOMPOK JABATANFUNGSIONAL
ORGANIZATION CHART OFKANTOR KESATUAN BANGSA DAN PERLINDUNGAN MASYARAKAT
(OFFICE OF NATIONAL UNITY AND COMMUNITY PROTECTION)
SEKSIKEMASYARAKATAN
SEKSIMORAL DAN HAM
SUB BAGIANTATA USAHA
SEKSIPENGKAJIAN
STRATEGI
Source:Annex of Local Regulation of Bantul Regency No. 33/2000 dated 18 November 2000

ATLAS Bantul Regency
Triple-A ORGANIZATION CHART 5 - 24
Main Report June 2003
SEKSIDATA MASUKAN
KEPALAKANTOR
KELOMPOK JABATANFUNGSIONAL
ORGANIZATION CHART OFKANTOR PENGOLAHAN DATA ELEKTRONIK(ELECTRONIC DATA PROCESSING OFFICE)
SEKSIPELAYANAN DATADAN KERJASAMA
SUB BAGIANTATA USAHA
Source:Annex of Local Regulation of Bantul Regency No. /2000 dated 18 November 2000
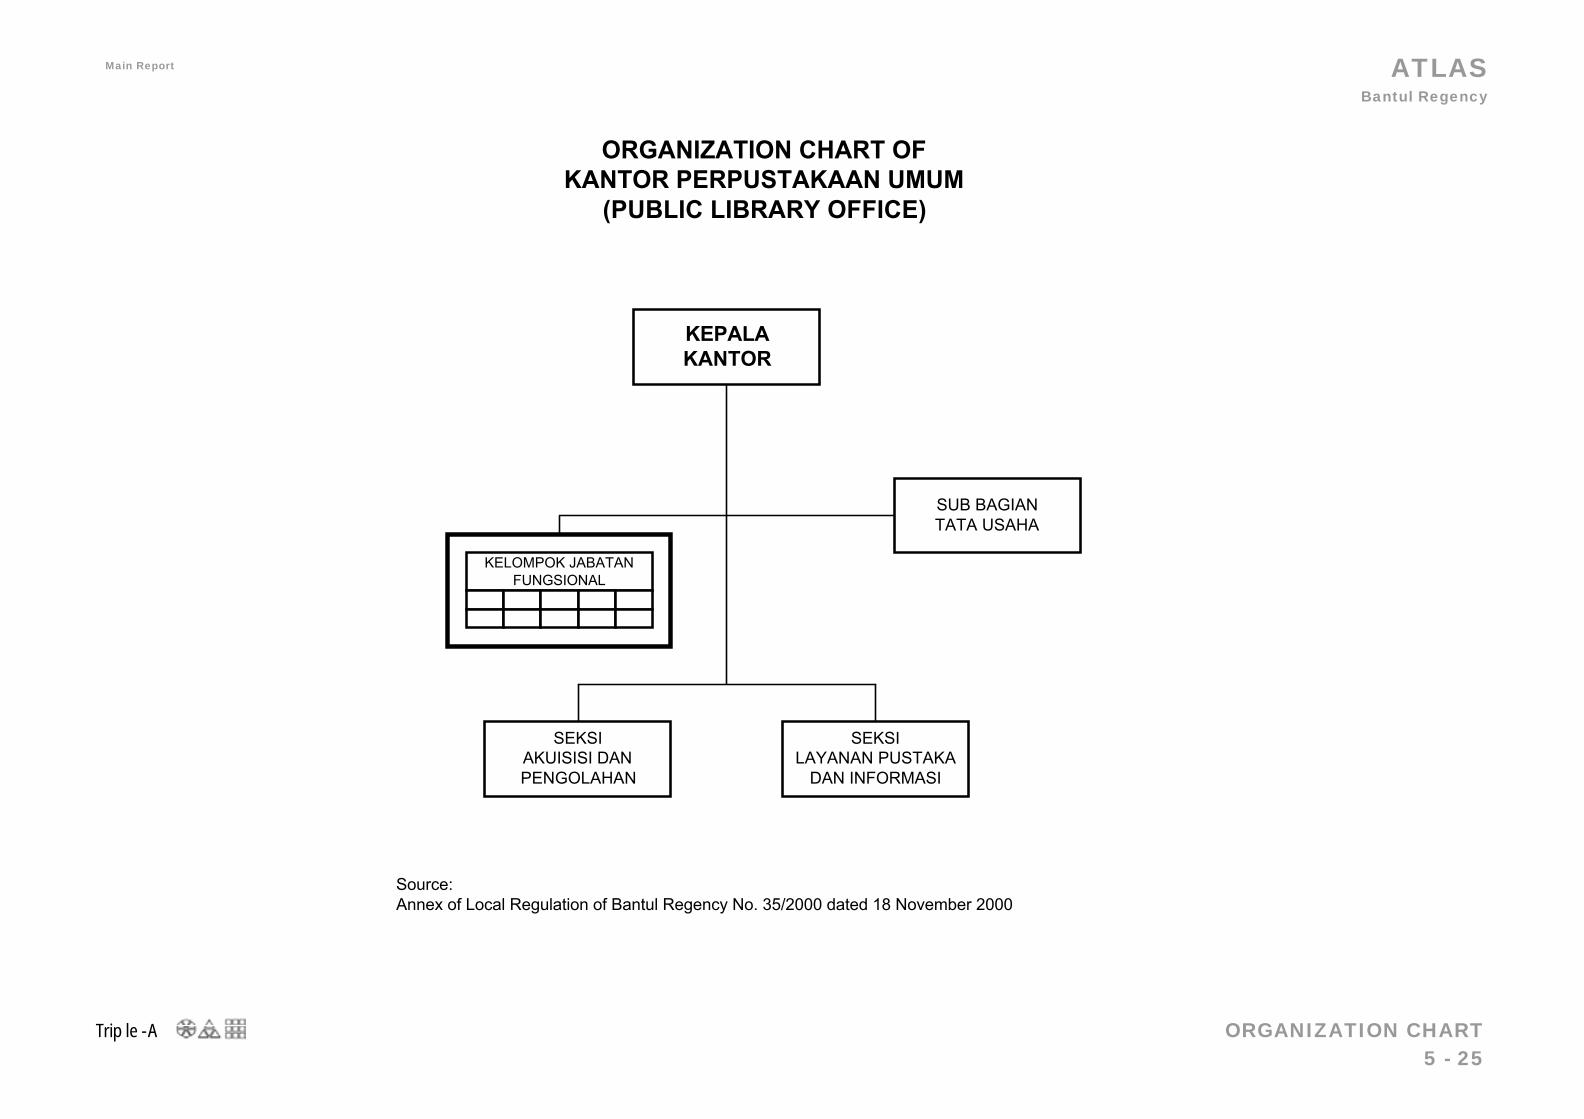
ATLAS Bantul Regency
Triple-A ORGANIZATION CHART 5 - 25
Main Report June 2003
SEKSIAKUISISI DANPENGOLAHAN
KEPALAKANTOR
KELOMPOK JABATANFUNGSIONAL
ORGANIZATION CHART OFKANTOR PERPUSTAKAAN UMUM
(PUBLIC LIBRARY OFFICE)
SEKSILAYANAN PUSTAKA
DAN INFORMASI
SUB BAGIANTATA USAHA
Source:Annex of Local Regulation of Bantul Regency No. 35/2000 dated 18 November 2000
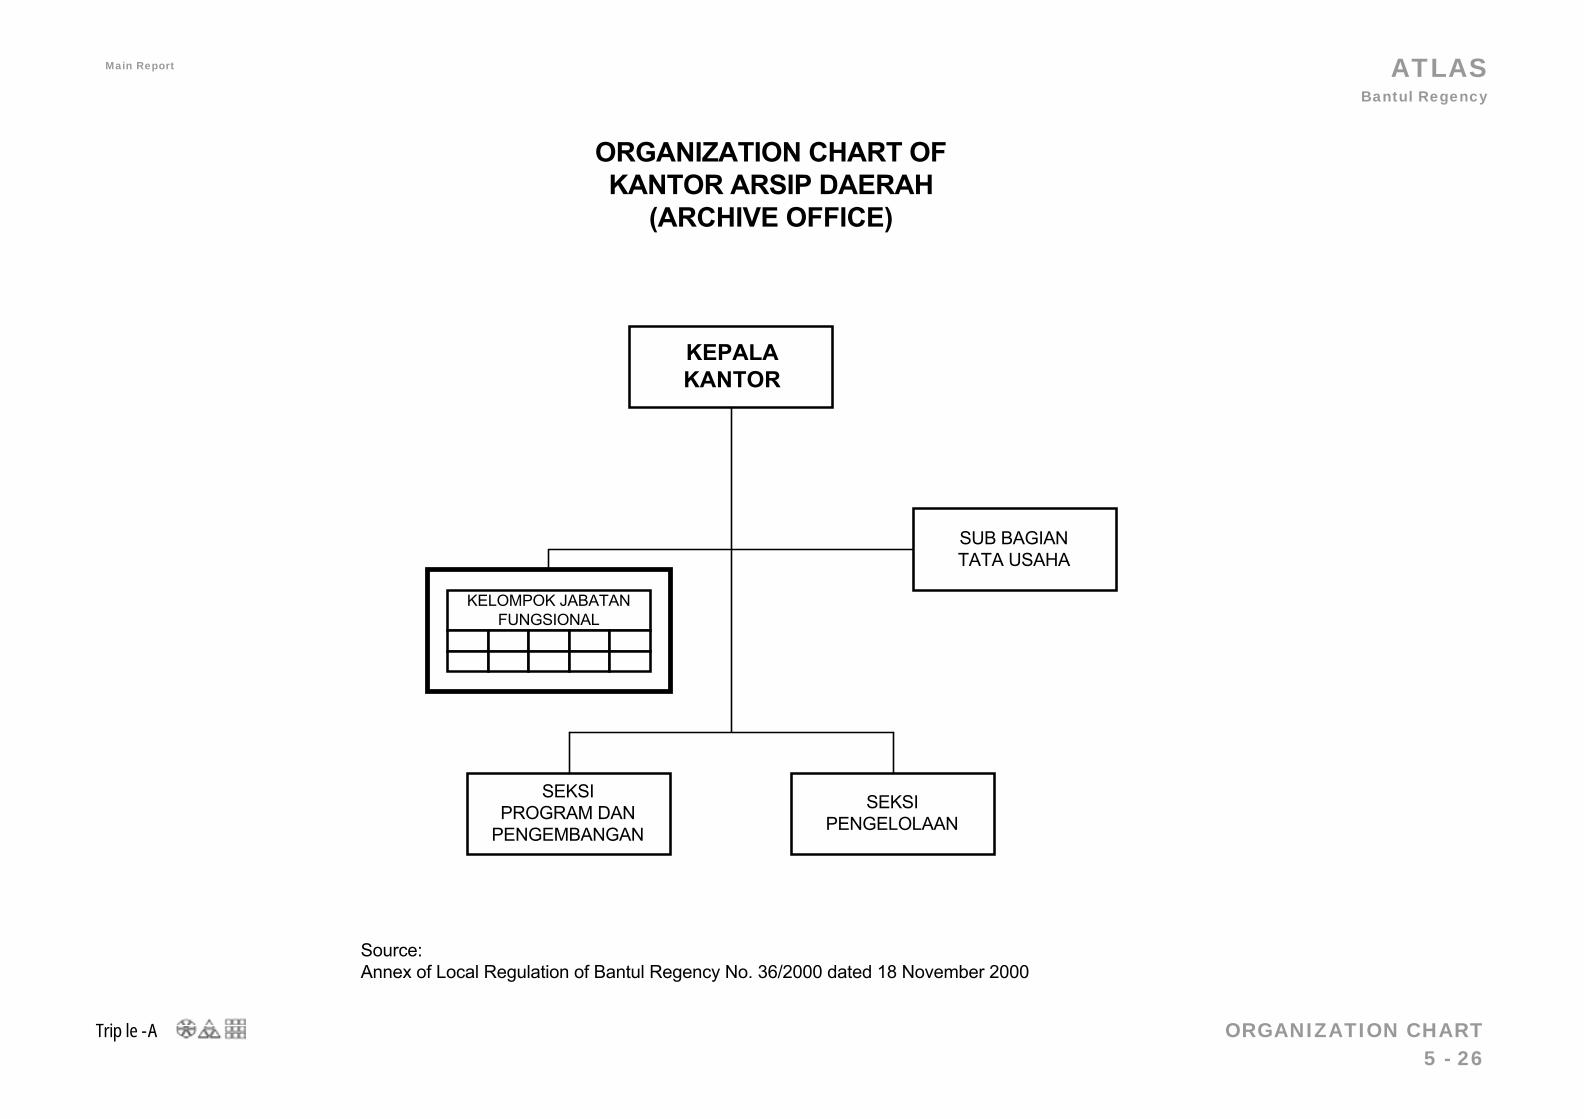
ATLAS Bantul Regency
Triple-A ORGANIZATION CHART 5 - 26
Main Report June 2003
SEKSIPROGRAM DAN
PENGEMBANGAN
KEPALAKANTOR
KELOMPOK JABATANFUNGSIONAL
ORGANIZATION CHART OFKANTOR ARSIP DAERAH
(ARCHIVE OFFICE)
SEKSIPENGELOLAAN
SUB BAGIANTATA USAHA
Source:Annex of Local Regulation of Bantul Regency No. 36/2000 dated 18 November 2000

ATLAS Bantul Regency
Triple-A ORGANIZATION CHART 5 - 27
Main Report June 2003
SEKSIBINA KETERTIBAN
KEPALAKANTOR
KELOMPOK JABATANFUNGSIONAL
ORGANIZATION CHART OFKANTOR SATUAN POLISI PAMONG PRAJA
(OFFICE OF LOCAL SECURITY)
SEKSIOPERASI
SEKSIPENEGAKAN
PERATURAN DAERAH
SUB BAGIANTATA USAHA
Source:Annex of Local Regulation of Bantul Regency No. 37/2000 dated 18 November 2000
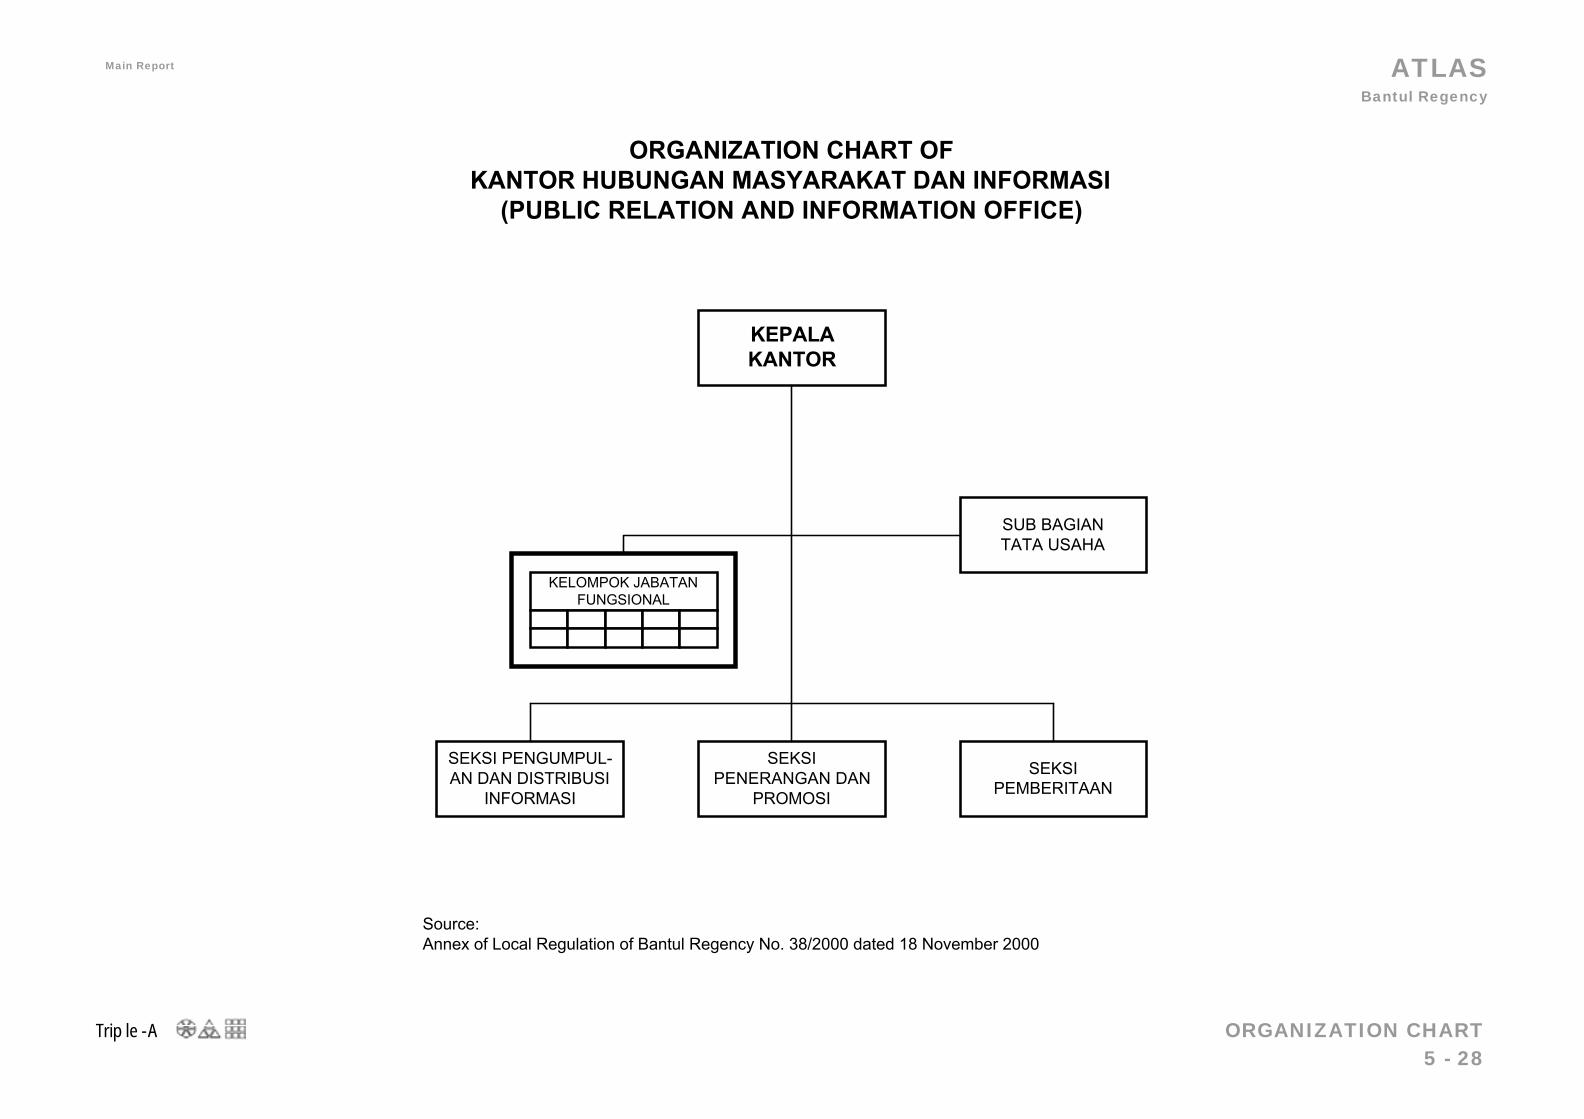
ATLAS Bantul Regency
Triple-A ORGANIZATION CHART 5 - 28
Main Report June 2003
SEKSIPENERANGAN DAN
PROMOSI
KEPALAKANTOR
KELOMPOK JABATANFUNGSIONAL
ORGANIZATION CHART OFKANTOR HUBUNGAN MASYARAKAT DAN INFORMASI
(PUBLIC RELATION AND INFORMATION OFFICE)
SEKSI PENGUMPUL-AN DAN DISTRIBUSI
INFORMASI
SEKSIPEMBERITAAN
SUB BAGIANTATA USAHA
Source:Annex of Local Regulation of Bantul Regency No. 38/2000 dated 18 November 2000
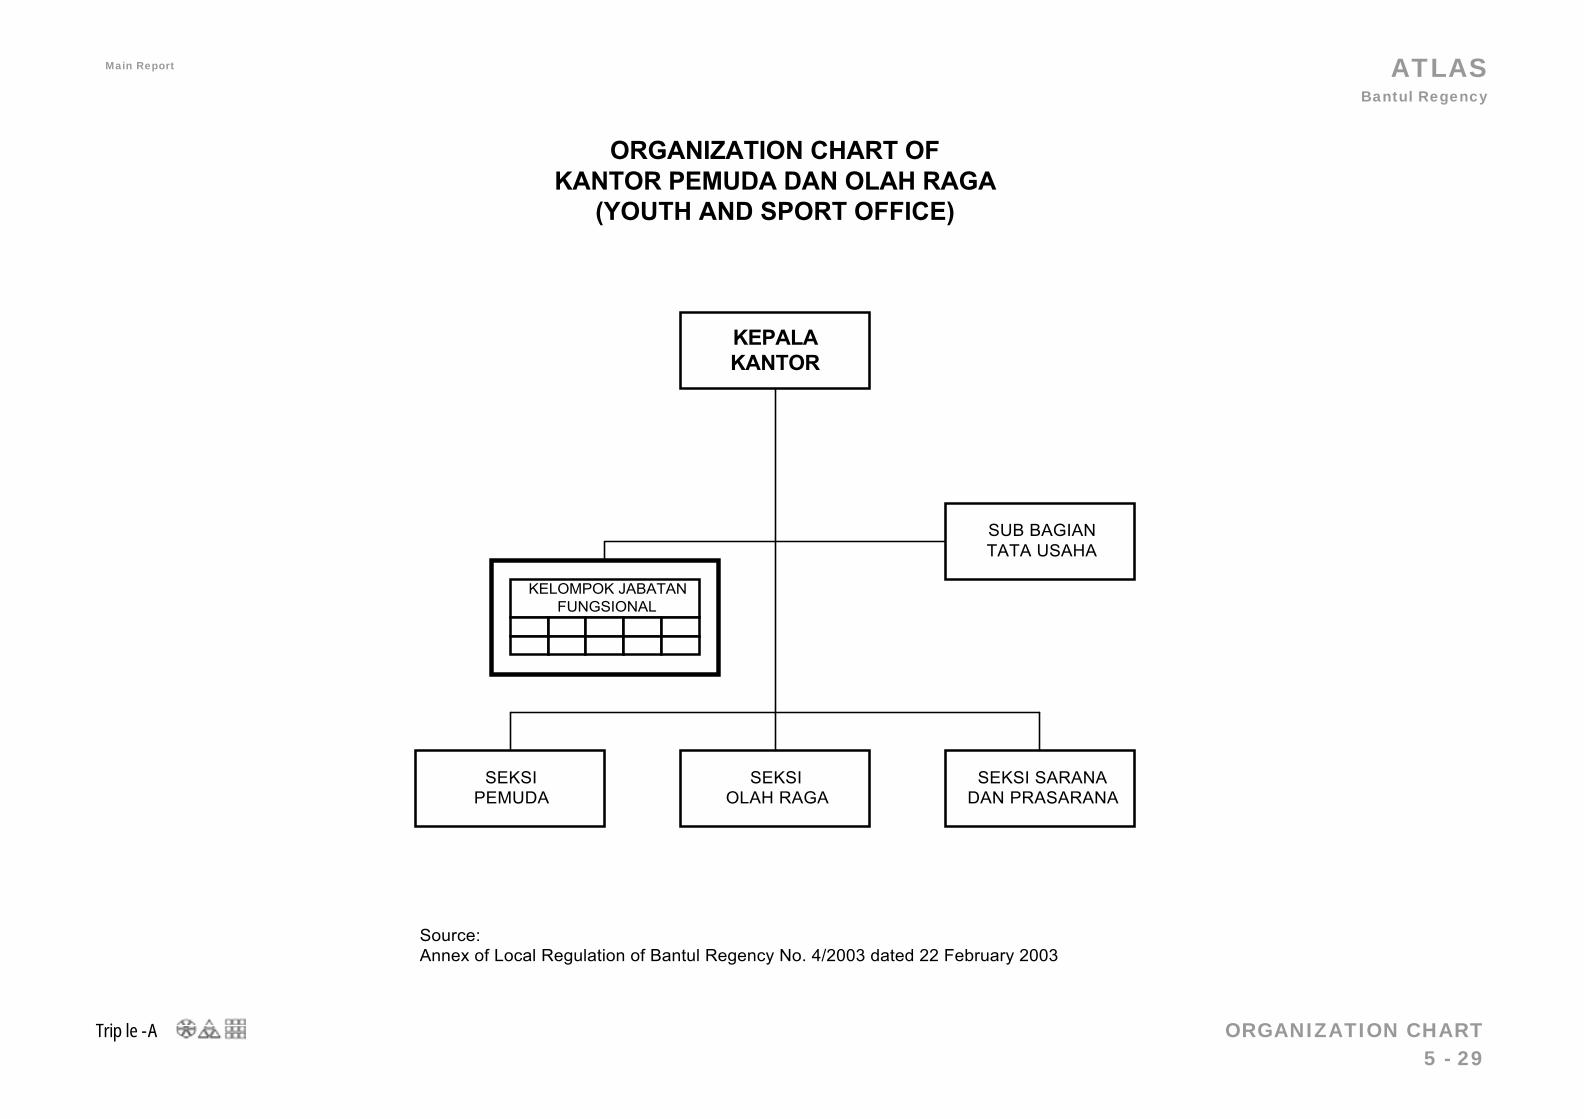
ATLAS Bantul Regency
Triple-A ORGANIZATION CHART 5 - 29
Main Report June 2003
SEKSIOLAH RAGA
KEPALAKANTOR
KELOMPOK JABATANFUNGSIONAL
ORGANIZATION CHART OFKANTOR PEMUDA DAN OLAH RAGA
(YOUTH AND SPORT OFFICE)
SEKSIPEMUDA
SEKSI SARANADAN PRASARANA
SUB BAGIANTATA USAHA
Source:Annex of Local Regulation of Bantul Regency No. 4/2003 dated 22 February 2003
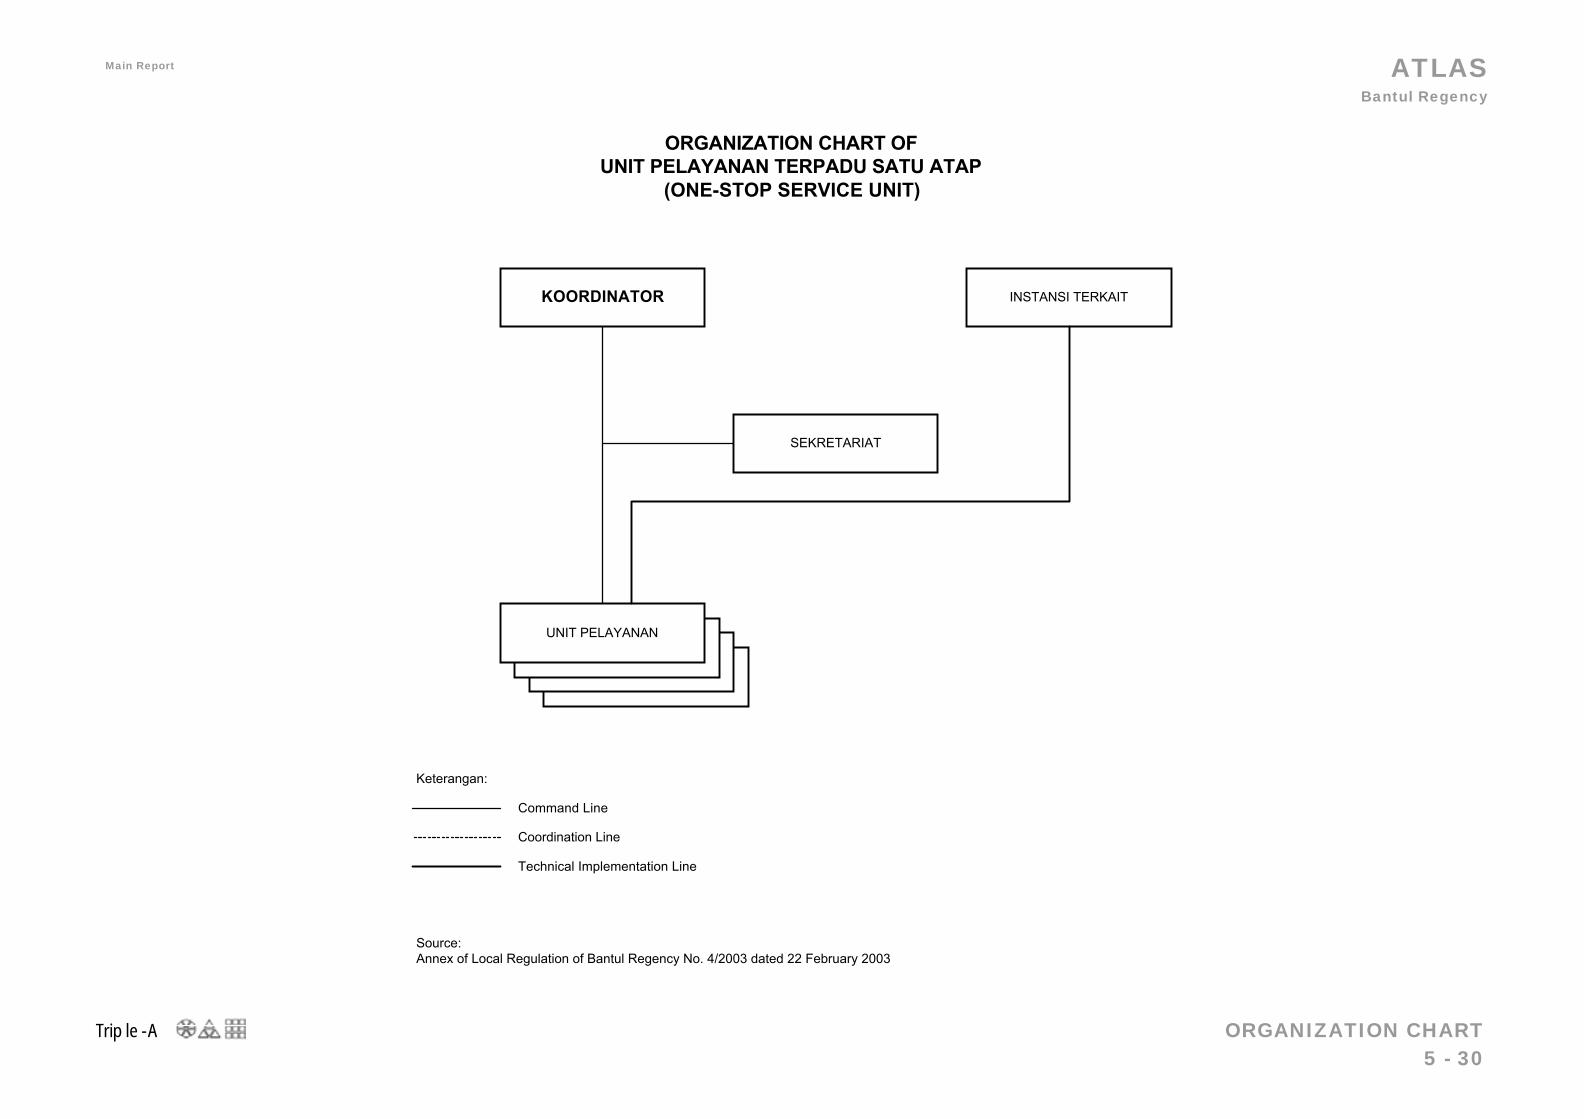
ATLAS Bantul Regency
Triple-A ORGANIZATION CHART 5 - 30
Main Report June 2003
UNIT PELAYANAN
KOORDINATOR
ORGANIZATION CHART OFUNIT PELAYANAN TERPADU SATU ATAP
(ONE-STOP SERVICE UNIT)
SEKRETARIAT
Source:Annex of Local Regulation of Bantul Regency No. 4/2003 dated 22 February 2003
INSTANSI TERKAIT
Keterangan:
Command Line
Coordination Line
Technical Implementation Line

ATLAS Bantul Regency
Triple-A ORGANIZATION CHART 5 - 31
Main Report June 2003
PETUGAS FASILITASIPEMASARAN, PERIJINAN DAN
KERJASAMA INDUSTRI
KOORDINATOR
ORGANIZATION CHART OFUNIT KERJA PENGEMBANGAN INDUSTRI PIYUNGAN
(PIYUNGAN INDUSTRIAL DEVELOPMENT UNIT)
PETUGAS FASILITASIALIH TEKNOLOGI
PETUGASPENGELOLAANLINGKUNGAN
PETUGASTATA USAHA
Source:Annex II of Draft of Decree of Bantul Regent
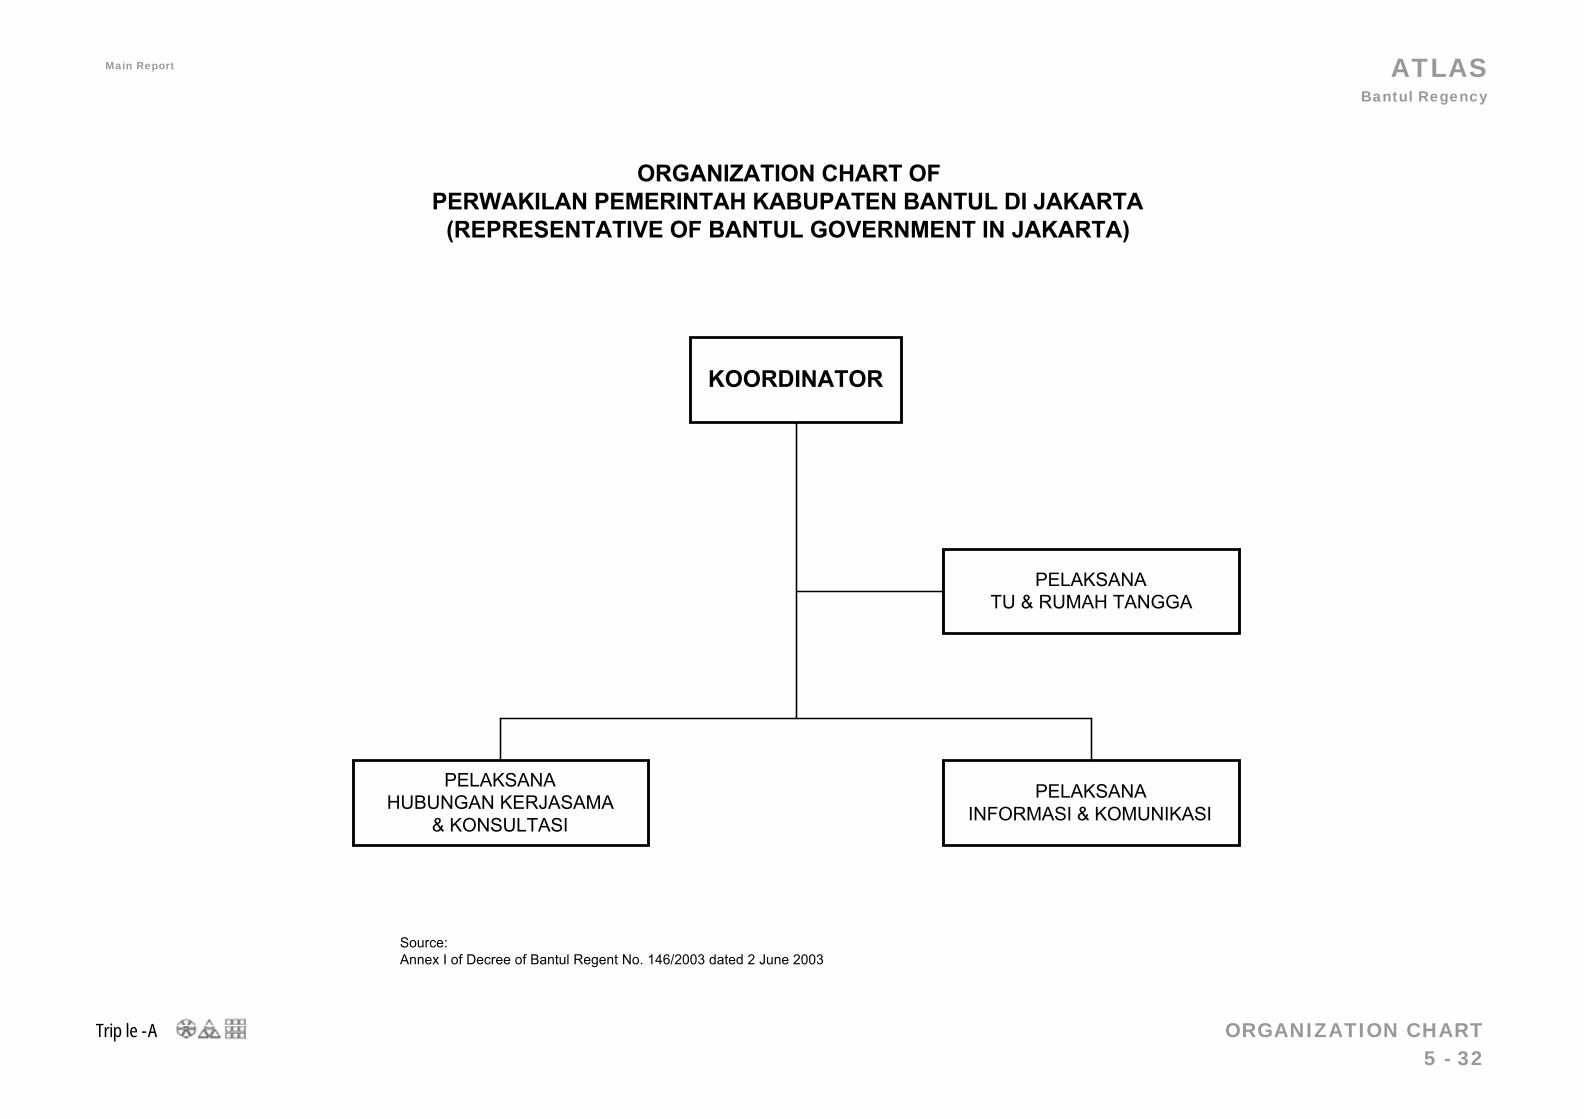
ATLAS Bantul Regency
Triple-A ORGANIZATION CHART 5 - 32
Main Report June 2003
KOORDINATOR
ORGANIZATION CHART OFPERWAKILAN PEMERINTAH KABUPATEN BANTUL DI JAKARTA
(REPRESENTATIVE OF BANTUL GOVERNMENT IN JAKARTA)
PELAKSANAHUBUNGAN KERJASAMA
& KONSULTASI
PELAKSANAINFORMASI & KOMUNIKASI
PELAKSANATU & RUMAH TANGGA
Source:Annex I of Decree of Bantul Regent No. 146/2003 dated 2 June 2003
Main Report ATLAS Bantul Regency
Triple-A Reference 6 - 1
REFERENCE
LOCAL GOVERNMENT WEB SITE 1. Web site of Special Province of Yogyakarta : www.Pemda-DIY.go.id
2. Web Site of Bantul Regency: www.Bantul.go.id
BOOKS YUDP REPORTS 3. Triple-A Edisi Pertama, YUDP Triple A, Mei 2002
4. Inventarisasi dan Evaluasi Kinerja Aset-Aset Prasarana di Aglomerasi Perkotaan Yogyakarta : Sektor
Perumahan dan Penyehatan Lingkungan Pemukiman, YUIMS, April 1999.
5. Inventarisasi dan Evaluasi Kinerja Aset-Aset Prasarana di Aglomerasi Perkotaan Yogyakarta: Sektor
Jalan dan Transportasi, YUIMS, April 1999.
6. Inventarisasi dan Evaluasi Kinerja Aset-Aset Prasarana di Aglomerasi Perkotaan Yogyakarta: Sektor
Persampahan, YUIMS, April 1999. 7. Inventarisasi dan Evaluasi Kinerja Aset-Aset Prasarana di Aglomerasi Perkotaan Yogyakarta: Sektor
Drainase, YUIMS, April 1999.
8. Inventarisasi dan Evaluasi Kinerja Aset-Aset Prasarana di Aglomerasi Perkotaan Yogyakarta: Sektor Air
Bersih, YUIMS, April 1999.
9. Inventarisasi dan Evaluasi Kinerja Aset-Aset Prasarana di Aglomerasi Perkotaan Yogyakarta: Sektor Air
limbah, YUIMS, April 1999.
10. Press-ing Issues Demographic ( 1998 – 2000), Yogyakarta Urban Development Project.
11. Press-ing Issues Social ( 1998 – 2000), Yogyakarta Urban Development Project.. 12. Press-ing Issues Cultural ( 1998 – 2000), Yogyakarta Urban Development Project.
13. Press-ing Issues Environmental ( 1998 – 2000), Yogyakarta Urban Development Project.
14. Press-ing Issues Spatial ( 1998 – 2000), Yogyakarta Urban Development Project.
15. Press-ing Issues Infrastructural ( 1998 – 2000), Yogyakarta Urban Development Project.
16. Press-ing Issues Financial ( 1998 – 2000), Yogyakarta Urban Development Project.
17. Press-ing Issues Institutional ( 1998 – 2000), Yogyakarta Urban Development Project.
18. Press-ing Issues UDMIS&GIS ( 1998 – 2000), Yogyakarta Urban Development Project.
19. Real Demand Study : Studi Kebutuhan Nyata, IUIDP-YUDP, 1991
STATISTIC 20. Kabupaten Bantul Dalam angka, (Tahun 1994, 1996, 1998, 1999, 2000, 2001), Badan Pusat Stasitistik
Kabupaten Bantul. 21. Propinsi Daerah Istimewa Yogyakarta Dalam Angka, (Tahun 1990 - 2000), Badan Pusat Stasitistik
Propinsi Daerah Istimewa Yogyakarta.
LOCAL GOVERNMENT DOCUMENTS 22. Penduduk Kabupaten Bantul : Hasil Sensus Penduduk 2000, Badan Pusat Statistik Propinsi Daerah
Istimewa Yogyakarta, 2001. 23. Profil 7 Penyandang Masalah Kesejahteraan Sosial dan Analisa Data Keluarga Miskin tahun 1999,
Dinas Sosial Propinsi Daerah Istimewa Yogyakarta, 2000. 24. Data dan Profil 5 Penyandang Masalah Kesejahteraan Sosial Propinsi Daerah Istimewa Yogyakarta
tahun 1999, Dinas Sosial Propinsi DIY, 2000.
25. Data Kesejahteraan Sosial tahun 1999/2000, Kantor Wilayah Departement Sosial Propinsi Daerah
Istimewa Yogyakarta, 1999. 26. Profil Kesehatan Kabupaten, Dinas Kesehatan Kabupaten
27. Profil Pendidikan Kabupaten, Dinas Pendidikan Kabupaten
28. Neraca Kualitas Lingkungan Hidup Daerah (NKLD), Pemerintah Daerah Kabupaten/Kota.
29. Neraca Kualitas Lingkungan Hidup Daerah (NKLD), Pemerintah Daerah Propinsi DIY.
30. Rencana Strategis ( RENSTRA) Daerah, Badan Perencanaan Pembangunan Daerah Kabupaten/Kota
(Sleman, Bantul, Kulon Progo, Gunungkidul, Yogyakarta) 31. Himpunan Peraturan Pemerintah, Departement Dalam Negeri Otonomi Daerah RI.
32. Penyusunan Pra Rancangan Peraturan Daerah Kawasan Cagar Budaya, Dinas Kebudayaan
Pemerintah Propinsi DIY & PT. Cipta Nindita Buana Yogyakarta, 2000 33. Studi Penggalian dan Inventarisasi Benda-Benda Budaya di Propinsi DIY : Laporan Inventarisasi dan
Identifikasi Benda-Benda Budaya Ta 1998/1999, Dinas Kebudayaan Pemerintah Propinsi DIY, 1998
34. A Studi on the Contemporary Utilization of the Javanese Urban Heritage and Its Effect on Hiistoricity :
An Attempt to Introduce the Contextual Adaptability Into the Preservation of Historic Environtment of
Yogyakarta, IKAPUTERA; The Course of Environtmental Engineering, Graduate School of Engineering ,
OSAKA University JAPAN, 1995. 35. Persiapan Penyusunan Materi Teknis Peraturan Daerah Desa Budaya Daerah Istimewa Yogyakarta:
Laporan Materi Teknis Pra Raperda, Dinas Kebudayaan Propinsi DIY dan Yayasan Warisan Budaya
Yogyakarta, 1999/2000 36. Rencana Induk Pengembangan Pariwisata Daerah Propinsi DIY, Pusat Dinas Pariwisata Prop. DIY dan
Pusat Penelitian dan Pengembangan Pariwisata UGM Yogyakarta, 1999
MAP ALBUM 37. Album Peta Data Pokok Pembangunan : Proyek Evaluasi dan Analisa Pembangunan Daerah TA.
1999/2000, Badan Perencana Pembangunan Daerah Propinsi Daerah Istimewa Yogyakarta.
38. Album Peta Potensi 14 Kecamatan sebagai pusat pertumbuhan. Ekonomi Propinsi Daerah Istimewa
Yogyakarta, Badan Perencana Pembangunan Daerah Propinsi Daerah Istimewa Yogyakarta.
39. Data Pokok Pembangunan Daerah propinsi Daerah Istimewa Yogyakarta 1999/2000, Badan
Perencanaan Pembangunan Daerah Propinsi Daerah Istimewa Yogyakarta, 2000
Main Report ATLAS Bantul Regency
Triple-A Reference 6 - 2
40. Data Pokok Pembangunan Daerah Kabupaten Bantul, Badan Perencanaan Pembangunan Daerah
Kabupaten Bantul, 2000, 2002. DIGITAL MAP 41. Album Peta Data Pokok Pembangunan Daerah Propinsi DIY, Bappeda Propinsi DIY, 1998. Peta Dasar
Skala 1 : 25000, Bakosurtanal, Jakarta, 1997. 42. Peta Photo Udara Skala 1 : 2500, Bappeda Propinsi DIY, 1997.
43. Peta Garis Skala 1 : 2500, Bappeda Propinsi DIY, 1997
44. Ledger Prasarana Air Bersih, Air Limbah, Jalan, Drainase, Yogyakarta Urban Development Project,
1994-2001.
ATLASATLASATLASATLASATLASATLASATLASATLASATLASATLASATLASATLASATLASATLASATLASATLASATLASATLASATLASATLASATLASATLASATLASATLASATLASATLASATLASATLASATLASATLASATLASATLASATLASATLASATLASATLASATLASATLASATLASATLASATLASATLASATLASATLASATLASATLASATLASATLASATLASATLASATLASATLASATLASATLASATLASATLASATLASATLASATLA
ATLASATLASATLASATLASATLASATLASATLASATLASATLASATLASATLASATLASATLASATLASATLASATLASATLASATLASATLASATLASATLASATLASATLASATLASATLASATLASATLASATLASATLASATLASATLASATLASATLASATLASATLASATLASATLASATLASATLASATLASATLASATLASATLASATLASATLASATLASATLASATLASATLASATLASATLASATLASATLASATLASATLASATLASATLASATLASATLA
Department of Settlements and Regional Infrastructure
Executing Agency: Funding Agencies:
Swiss Agency for Development
and Cooperation (SDC)
Cities AllianceCities Without Slums
Cities Alliance World Bank Electrowatt Infra-Switzerland (EWI) jaakko poyry group
Consultant:
REGIONAL DEVELOPMENT AND POVERTY REDUCTION PROGRAM
Related Documents