ANNUAL REPORT 2009

Atlas Iron Annual Report 2009
Mar 28, 2016
Atlas is an Australian-owned mineral exploration and mining company which prides itself on its commitment to principles of environmental and social responsibility.
Welcome message from author
This document is posted to help you gain knowledge. Please leave a comment to let me know what you think about it! Share it to your friends and learn new things together.
Transcript
ANNUAL REPORT 2009
2
The Company
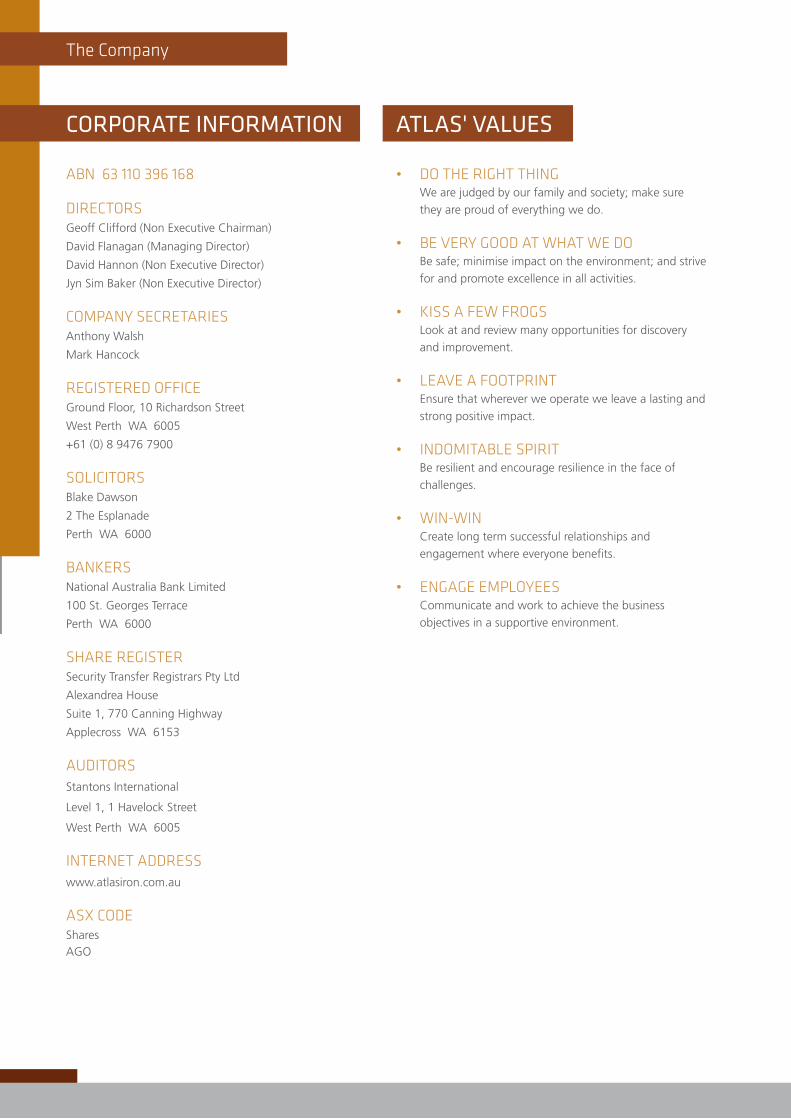
Corporate InformatIon atLaS' VaLUeS
ABN 63 110 396 168
DiRECTORsGeoff Clifford (Non Executive Chairman)
David Flanagan (Managing Director)
David Hannon (Non Executive Director)
Jyn Sim Baker (Non Executive Director)
COmPANy sECRETARiEsAnthony Walsh
Mark Hancock
REgisTERED OffiCE Ground Floor, 10 Richardson Street
West Perth WA 6005
+61 (0) 8 9476 7900
sOLiCiTORsBlake Dawson
2 The Esplanade
Perth WA 6000
BANkERsNational Australia Bank Limited
100 St. Georges Terrace
Perth WA 6000
shARE REgisTERSecurity Transfer Registrars Pty Ltd
Alexandrea House
Suite 1, 770 Canning Highway
Applecross WA 6153
AUDiTORsStantons International
Level 1, 1 Havelock Street
West Perth WA 6005
iNTERNET ADDREsswww.atlasiron.com.au
AsX CODEShares AGO
DO ThE RighT ThiNg •We are judged by our family and society; make sure
they are proud of everything we do.
BE vERy gOOD AT whAT wE DO •Be safe; minimise impact on the environment; and strive
for and promote excellence in all activities.
kiss A fEw fROgs •Look at and review many opportunities for discovery
and improvement.
LEAvE A fOOTPRiNT •Ensure that wherever we operate we leave a lasting and
strong positive impact.
iNDOmiTABLE sPiRiT •Be resilient and encourage resilience in the face of
challenges.
wiN-wiN •Create long term successful relationships and
engagement where everyone benefits.
ENgAgE EmPLOyEEs •Communicate and work to achieve the business
objectives in a supportive environment.

tabLe of ContentS
2009 Financial Year – Highlights 2
Environment and the Community 3
Operations Review 6
- Overview 6
• Pardoo DSO Project 7
• Wodgina DSO Project 10
• Abydos DSO Project 14
• Mt Webber DSO Project 16
• Turner River DSO Project 18
• Midwest DSO Projects 18
• Ridley Magnetite Project 19
Corporate Activities 21
Sales and Marketing 23
Competent Persons and JORC Compliance Statements 24
Corporate Governance Statement 26
Directors’ Report 36
Income Statement 51
Balance Sheet 52
Statement of Changes in Equity 53
Statement of Cash Flows 54
Notes to the Financial Statements 55
Directors’ Declaration 94
Independent Auditor's Report 95
Auditor’s Independence Letter 97
ASX Additional Information 98
Content
atlas Iron Limited Annual Report 2009 1
2 atlas Iron Limited Annual Report 20092
OPERATiONs First Pardoo DSO ore shipped from Port Hedland •December 2008
First third party infrastructure sharing agreement at FMG •Port.
Pardoo Operation on track to ship 1 million tonnes in its •first 12 months of operations
CORPORATE Completed $119.8 million capital raising in June and July •2009 to accelerate development of iron ore business.
Talison infrastructure access agreement signed to enable •Atlas to have access to the Wodgina mine infrastructure, 300 man camp and 10MW powerplant.
Secured an additional 3Mtpa port capacity at Utah point •until February 2012.
Exercise of Mt Webber and Mt Dove options following •drill success at both projects.
Strong cash position at end of July 2009 of $164 million •with no debt.
Merger with Warwick Resources announced on 7 •September 2009 which, subject to Warwick shareholder approval, is expected to be completed by mid December 2009.
Winner of Digger of the Year at the 2009 Diggers and •Dealers Mining Forum
Runner-up in the Insync 2009 Best Employer Awards •for medium sized businesses, highest ranked mining company.
EXPLORATiON Atlas remains one of Australia’s most aggressive mineral •explorers with 2,808 holes drilled for 141,000 metres drilling during the year.
Increase in resources and reserves across all projects:•
143% increase in total DSO resources to 94.9Mt at •56.5% Fe
72% increase in total DSO reserves to 25.5Mt at •57.9% Fe
39% increase in magnetite resources for the Ridley •Magnetite Project to 2.01Bt at 36.5% Fe
First reserve estimated for Ridley Magnetite Project of •970Mt at 36.0% Fe
New DSO discoveries generating resources at Wodgina, •Mt Webber and Turner River projects.
Early exploration success with high-grade DSO Fe •intersected at Weld Range.
Native Title Mining Agreement signed with the •Njamal people in relation to the Abydos and Mt Webber DSO projects.
Native Title Mining Agreement signed with the Karriyarra •people in relation the Wodgina DSO project.
Company-wide exploration target of 180 to 245 million •tonnes at 57% to 61% Fe.
•
Highlights
2 atlas Iron Limited Annual Report 20092
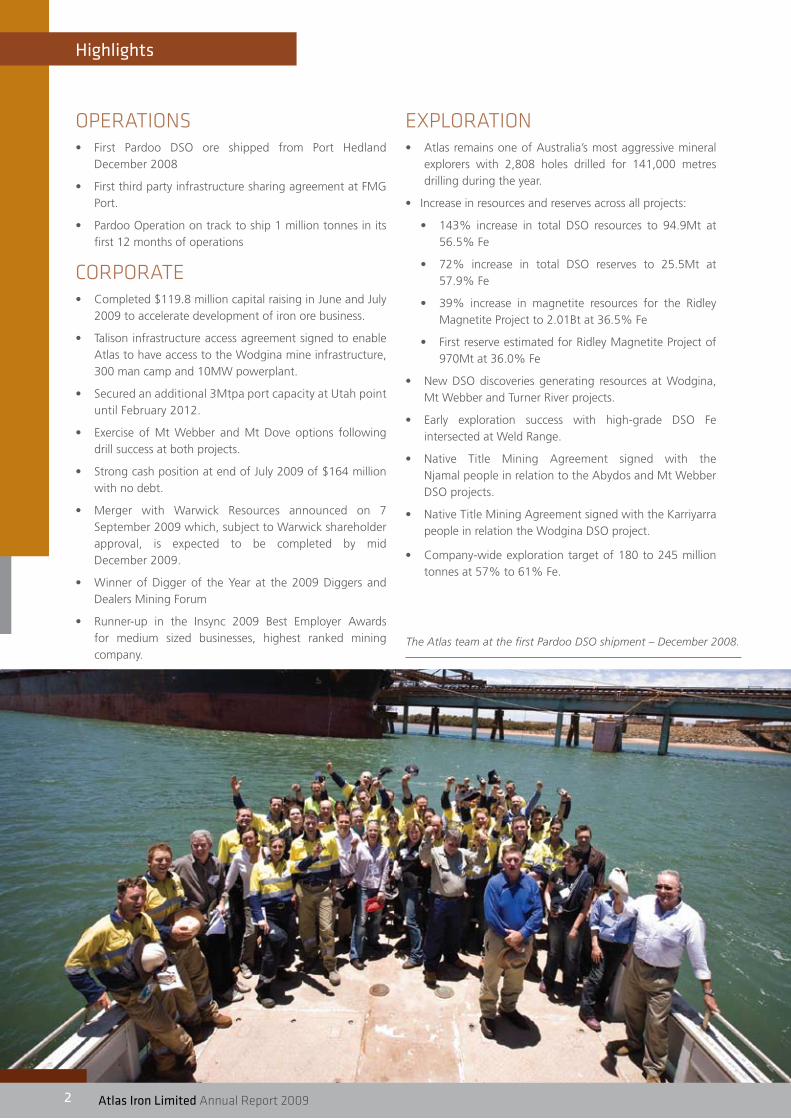
The Atlas team at the first Pardoo DSO shipment – December 2008.
atlas Iron Limited Annual Report 2009 3
Environment and the Community
enVIronment and tHe CommUnIty
Our team are doing a fantastic job of environmental best practice, demonstrating community engagement and social responsibility to providing positive win-win outcomes for the people we interact with. This achievement has been recognised throughout the Pilbara region.”
David Flanagan, Managing Director
With a strong devotion to investment in people, the community and project development, Atlas has endeavoured to set new standards of environmental best practice, community engagement and social responsibility leaving a lasting positive footprint within the areas it operates. During the past year, Atlas has entered into two unique Native Title agreements, to progress access to developing mining centres within the Pilbara region of Western Australia.
In addition to the construction and operation of the Pardoo DSO mine Atlas has also undertaken high level environmental impact assessments covering the two subsequent DSO projects at Wodgina and Abydos. It has involved multiple Aboriginal Heritage surveys, detailed flora and vegetation studies, terrestrial and subterranean fauna surveys, along with impact determination assessments to provide for ongoing and sustainable operations.
ENviRONmENTIn a year of growth in Atlas' environment and land access activities, Atlas has successfully negotiated the state approval regime for the Pardoo DSO Project, developed and implemented compliance procedures, and completed various impact assessments for new mining and exploration projects. Through the engagement and coordination of respected specialist consultants, Atlas successfully completed the Public Environmental Review (PER) assessment and provided effective and achievable Project Environmental Management Plans for the on-going operations. (Hotlink to announcement on environmental approval: www.atlasiron2009ar.com)
Over the past twelve months Atlas has built on the standards, legislations, procedures and systems to identify, assess and manage environmental risk in the areas in which it operates.
Throughout 2009, Atlas has successfully built on its reputation as a responsible proponent within the exploration/mining industry. Atlas has further enhanced its reputation with the ongoing and strategic engagement of indigenous groups, government departments, non-government organisations, land holders, and key stakeholders to ensure all aspects of its activities exceed the legal and social obligations, and are undertaken in a meaningful and sustainable manner. One of the beneficiaries of this engagement is the NorthWest Iron Ore Alliance community fund.
Atlas is an Australian-owned mineral exploration and mining company which prides itself on its commitment to principles of environmental and social responsibility. In accordance with this Environmental and Social Policy, the following operational-specific objectives have been established which represent Atlas' commitment:
Atlas will operate an Integrated Management System 1. (IMS), which accurately defines the environmental and social aspects and impacts of what we do, and build what we learn from this knowledge into clear and concise operational systems, to thus minimise the risk to the environment and the community.
Atlas will employ, to the extent practicable, the principles 2. of pollution prevention, efficient resource use and waste minimisation in all of our activities.
Atlas will set environmental improvement targets based on 3. established criteria and annually report our environmental performance publicly.
Atlas will develop a mine completion and rehabilitation plan 4. that addresses regulatory requirements, risk minimisation, potential future land use and stakeholder issues.
Atlas will identify, report, and remediate environmental 5. incidents, and employ changes that reduce the likelihood and/or consequence of occurrences.
Atlas will actively promote environmental awareness and 6. training among all employees and contractors.
Atlas will respect cultural and heritage values and facilitate 7. cross-cultural awareness.
Atlas will anticipate and respond to community 8. concerns, aspirations and values regarding our activities and foster open dialogue with employees, contractors and the community.
Atlas will strive for continual improvement in environmental 9. and social awareness, and our performance.
Atlas will comply with all legal and regulatory requirements 10. as a minimum operating condition.
Atlas will allocate sufficient resources to ensure these 11. objectives can be achieved.

4 atlas Iron Limited Annual Report 20094
Environment and the Community (cont'd)
By implementing this policy Atlas believes it will:
Ensure that environmental obligations and considerations •form an integral part of our business planning and decision-making processes.
Comply with applicable environmental laws and aspire to •higher standards within our business.
Promote a culture of responsible environmental •management within the organisation.
Protect the natural environment, indigenous and social •surroundings.
Continually improve our environmental performance.•
Comply with applicable environmental laws and aspire to •higher standards within our business.
Communicate openly, effectively and transparently with •all stakeholders on environmental matters.
Engage the community in environmental initiatives aligned •with our business values.
Atlas’ Environmental and Social Policy is based on the recognition that all our activities have impact on the environment. Since it is not possible to eliminate such impact, the Atlas policy is to engineer and conduct operations with the objective of achieving best practice so that adverse effects on the environment and any surrounding community are either avoided or kept to an acceptable level.
COmmUNiTy
“Atlas’ excellent long-term relationship with the Njamal people and the Pilbara Native Title Service helped facilitate engagement on key aspects of this agreement quickly. Atlas came to the negotiating table respecting for the Njamal people’s rights to culture and country. Atlas’ willingness to make a good offer and its commitment to following the correct process insured that a well considered agreement was finalised very quickly.”
Simon Hawkins, Chief Executive Officer, Pilbara Native Title
Service, on the Njamal Native Title agreement with Atlas
Throughout 2009 Atlas has worked with a number of stakeholders, the community and government to establish and maintain better outcomes in the areas it operates. To this end, Atlas held 18 meetings with local community groups and other stakeholders during the year. Atlas has embarked upon a number of incentive programs to promote indigenous business enterprise and partnering throughout both the mining and exploration activities. Atlas is committed to providing outcomes for communities that are sustainable
and can leave a positive footprint. Atlas is constantly looking for win-win outcomes that will promote and enhance Atlas' social licence to operate.
Atlas houses a number of its team and their families in Port Hedland which has allowed them to contribute to the local community. All of the Atlas staff and contractors are encouraged to discover the social, cultural and environmental opportunities available to them within the local community, so they can become active participants within the community.
Also during the year, Atlas has further enhanced strong relationships with the indigenous stakeholders and their representatives in Western Australia. This has been achieved by engagement, transparency of discussion and willingness to listen to the various groups. Accordingly, Atlas’ Indigenous Peoples Policy reflects this commitment to foster new and strengthen existing relationships with the communities. Njamal Traditional Owner Rodney Monaghan said that the Njamal community was happy that the Njamal Native Title agreement with Atlas managed to balance the protection of their country and culture with commercial realities and opportunities. “This agreement recognises the importance of our culture and country, but still shows that Njamal people are serious and fair with their commercial negotiations,” said Mr Monaghan.
Atlas is committed to employing indigenous peoples and during the year has employed indigenous persons from the Ngarla, Njamal and Kariyarra Peoples, being the three native title land holders where Atlas is operating.
Atlas is proud of the relationship it has established with the indigenous stakeholders and their legal representatives in the Pilbara region. Accordingly, Atlas’ Indigenous Peoples Policy reflects the commitment to foster new, and strengthen existing, relationships with the communities we co-exist with.
Atlas is committed to being recognised as a leader in the field of indigenous relations and in partnership with the indigenous people on whose land it operates, will deliver:
Economic opportunity in its exploration and mining •activities.
Culturally and Environmentally sensitive outcomes.•
Leading by example is consistent with our values.•
Promote sustainable commercial relationships with •indigenous peoples.
Continue to develop and increase its indigenous workforce.•
Maintain partnership with the indigenous community •to develop sustainable economic business opportunities wherever appropriate.
Seek to generally improve the wellbeing of indigenous •people in its operating areas.
Operate within existing environmental constraints and •respect the indigenous relationship to the land.

atlas Iron Limited Annual Report 2009 5
Environment and the Community (cont'd)
Encourage other companies, with which we interact, to •engage with native title groups.
Forge new and maintain existing relationships with the •indigenous communities with which it operates; and
Deliver cross cultural awareness training to its workforce.•
Encouraging staff to be involved in the community. Atlas •Managing Director recently joined the board of Youth Focus Inc, a charity whose objective is the prevention of youth suicide and self harm.
sUsTAiNABLE DEvELOPmENTAtlas’ core values and operational strategy has placed the Company ahead of its peers, and paved the way for unprecedented growth opportunities.
By adopting Atlas’ values, its environmental and social policies, and sustainable management systems, the Company has proven it can better manage the risks associated with the business, whilst creating opportunities, reducing costs, and attracting the best people to our company. This is a unique asset that sets Atlas apart from its industry peers, and adds to our ability to attract and retain high calibre personnel.
OCCUPATiONAL hEALTh AND sAfETy
“The Atlas vision is to set new standards of safety and health management. To do this while starting our first mine is a challenge, but our team is up to the task, improving performance and standardising safety management systems across the organisation.”
David Flanagan, Managing Director
At Atlas we care about the health and safety of all of our employees, contractors and visitors to our sites. Atlas is committed to providing an environment where everyone is protected. This is achieved through:
Implementing and communicating high occupational •health, hygiene and safety standards. Implementing effective training and appropriate high quality safety equipment.
Meeting or exceeding all relevant legislative and statutory •obligations.
Continuous review and improvement of our safety •management systems.
Ensuring all our contractors manage health and safety in •line with this policy.
Supporting and engaging injured workers to return to •work as soon as medically fit.
Providing a workplace free of drugs, supported by a •holistic and open approach; and
Managing the impact on fitness for work of fatigue, •stress, physical well being and medical issues.
Our vision is to establish a culture within Atlas where there is no harm to people or the environment.
OCCUPATiONAL hEALTh AND sAfETy PERfORmANCEAtlas continues to strive for an incident-free work place and the safety and health of our employees and contractors is paramount. During the course of the financial year Atlas continued to invest in the development of integrated occupational health and safety management systems, with the focus being on integration across the organisation inclusive of exploration, resource development and the mining disciplines.
Of particular note has been the safety leadership demonstrated by the Pilbara Operations team. They have worked closely with our lead contractors to demonstrate and establish a safe work culture that is having a marked impact on overall safety performance. Having set a tone at Pardoo the team is well placed to facilitate equivalent performance at the soon to be established Wodgina mine site.
Indigenous mining contractors working at the Pardoo mine.

6 atlas Iron Limited Annual Report 20096
Operations Review
operatIonS reVIeW
“Atlas continues to deliver on its publicly stated objectives in project development and production. Whilst the Company is proud of its achievements to date, it is only just the beginning, with substantial production growth to come over the next 12 months to two years.”
Ken Brinsden, Operations Manager
OvERviEwThe Pilbara arguably hosts the largest endowment of iron ore of any region of the world, with Atlas having positioned itself with the most extensive landholding within 150 kilometres of the world’s largest iron ore port, in Port Hedland. Given the seismic shifts that are occurring in global seaborne iron ore trade, the time is right to generate potentially unprecedented opportunities for shareholders, employees, the region’s local communities and the State of Western Australia. With huge demand coming from Asian markets for iron ore, the Pilbara’s unique position in relation to these markets and its undeveloped resources mean the Pilbara is the place to be for an emerging iron ore company.
One of the early movers of the current iron ore juniors in the Pilbara, Atlas listed on the ASX in December 2004 and within 9 months of listing, Atlas had made a Direct Shipping iron ore discovery at its Pardoo Project, 75 kilometres east of Port Hedland. This has since transformed Atlas from iron ore explorer to producer, with Atlas being the only junior iron ore company to move into production in the world’s premier iron ore province.
Atlas commenced iron ore exports through Port Hedland from its Pardoo Mine in December 2008, marking the commencement of what Atlas plans to be a meaningful, positive and long-term contribution to the Pilbara iron ore
industry and its regional communities. Atlas is targeting the export of one million tonnes (Mt) of iron ore in its first year of operations at Pardoo, increasing to 2.5 million tonnes per annum (Mtpa) by 2010. The planned development of the Wodgina DSO Project, from early 2010, will increase the company’s production to 6Mtpa during next year. Subsequent development of the Abydos and Mt Webber Projects will see the company’s production grow to 9Mtpa in 2011, and 12Mtpa by 2012.
In order to further enhance its production profile over time, Atlas continues to pursue strategic, complementary and value-adding acquisitions, predominantly in the Pilbara of Western Australia. Furthermore, Atlas maintained an aggressive exploration program across its prospective Pilbara landholdings with outstanding results, culminating with the announcement of a substantial increase in its resources and reserves position subsequent to year-end. Atlas has defined resources of over 127 million tonnes, and reserves of over 25 million tonnes.
With a growing number of high quality iron ore projects and one of the largest landholdings in the Pilbara (over 8,900 square kilometres) located close to infrastructure, Atlas is effectively defining resources and reserves capable of being mined and exported with relatively low capital expenditure.
With mining having already commenced at Pardoo, and Atlas preparing for the commencement of the mining at Wodgina, Atlas is well positioned to advance a number of projects concurrently in the Pilbara to expand its direct ship iron ore production. Atlas has now developed a team with significant specialist technical skills, with a proven capacity to deliver projects from discovery to production inclusive of managing the approvals process, sourcing funding and engaging all stakeholders. Clearly this retained capacity positions the company well to maximise the returns and minimise risk in future project developments.
Atlas is now well positioned to deliver on its publicly stated production objectives over the coming years, with its project pipeline building and logistics solutions coming to fruition.
Ore being hauled out of the Bobby pit at Pardoo.
atlas Iron Limited Annual Report 2009 7
Operations Review (cont'd)
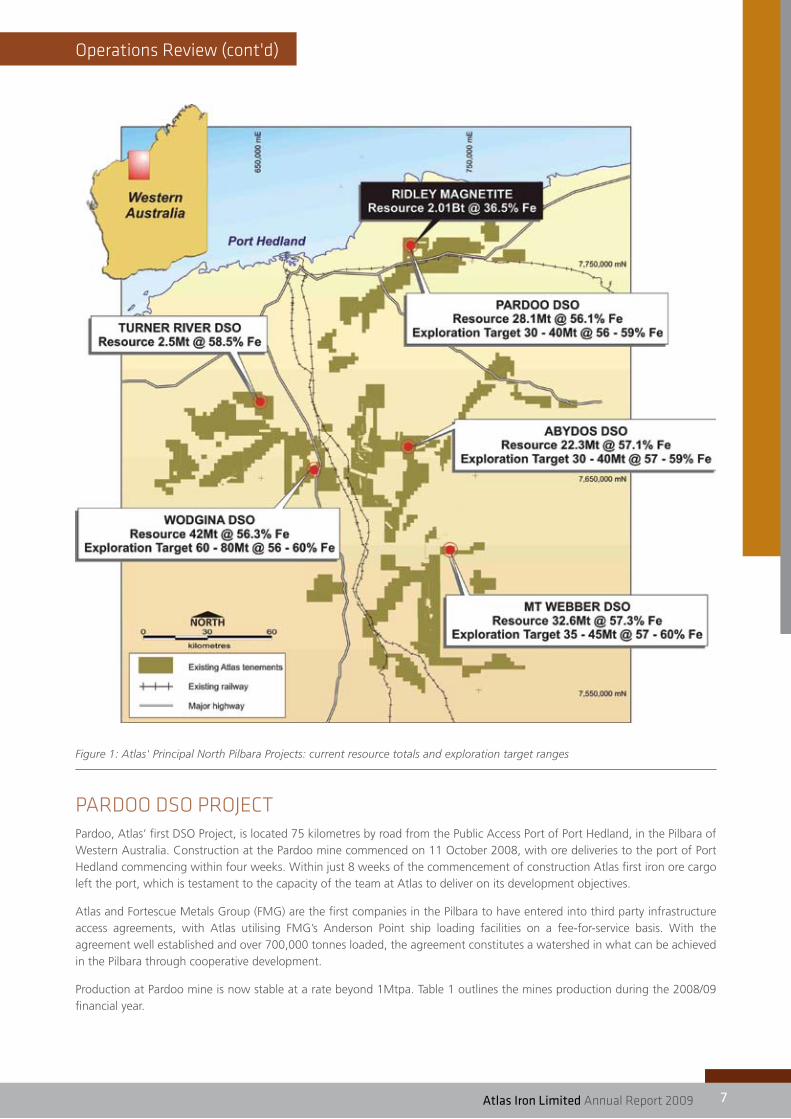
Figure 1: Atlas' Principal North Pilbara Projects: current resource totals and exploration target ranges
PARDOO DsO PROJECTPardoo, Atlas’ first DSO Project, is located 75 kilometres by road from the Public Access Port of Port Hedland, in the Pilbara of Western Australia. Construction at the Pardoo mine commenced on 11 October 2008, with ore deliveries to the port of Port Hedland commencing within four weeks. Within just 8 weeks of the commencement of construction Atlas first iron ore cargo left the port, which is testament to the capacity of the team at Atlas to deliver on its development objectives.
Atlas and Fortescue Metals Group (FMG) are the first companies in the Pilbara to have entered into third party infrastructure access agreements, with Atlas utilising FMG’s Anderson Point ship loading facilities on a fee-for-service basis. With the agreement well established and over 700,000 tonnes loaded, the agreement constitutes a watershed in what can be achieved in the Pilbara through cooperative development.
Production at Pardoo mine is now stable at a rate beyond 1Mtpa. Table 1 outlines the mines production during the 2008/09 financial year.
8 atlas Iron Limited Annual Report 20098
Operations Review (cont'd)
Table 1: Pardoo Mine Production
Production to June 2009 (t)
Ore Tonnes Mined 680,950
Ore Tonnes Processed 643,229
Ore Tonnes Shipped (Dry) 409,514
Subsequent to year end, and until the end of August 2009 Atlas had shipped a further 300,326 dry tonnes, and as a result is on target to achieve over 1 million tonnes shipped in its first 12 months of operations.
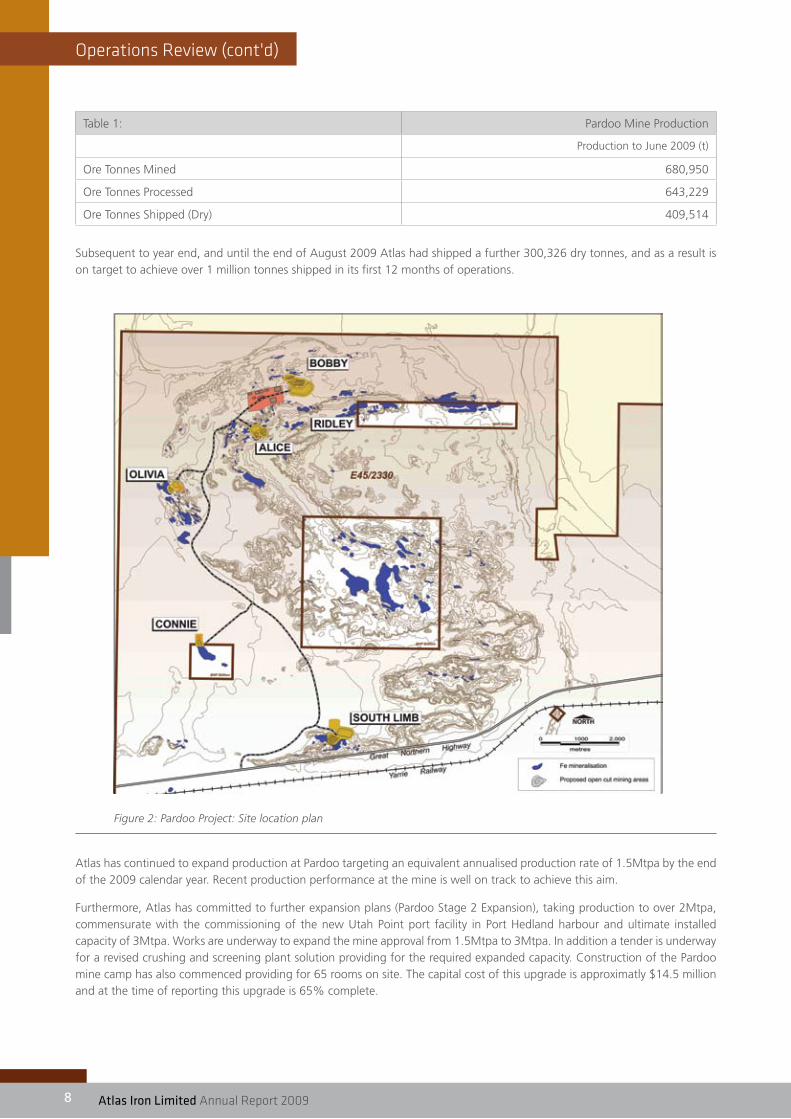
Figure 2: Pardoo Project: Site location plan
Atlas has continued to expand production at Pardoo targeting an equivalent annualised production rate of 1.5Mtpa by the end of the 2009 calendar year. Recent production performance at the mine is well on track to achieve this aim.
Furthermore, Atlas has committed to further expansion plans (Pardoo Stage 2 Expansion), taking production to over 2Mtpa, commensurate with the commissioning of the new Utah Point port facility in Port Hedland harbour and ultimate installed capacity of 3Mtpa. Works are underway to expand the mine approval from 1.5Mtpa to 3Mtpa. In addition a tender is underway for a revised crushing and screening plant solution providing for the required expanded capacity. Construction of the Pardoo mine camp has also commenced providing for 65 rooms on site. The capital cost of this upgrade is approximatly $14.5 million and at the time of reporting this upgrade is 65% complete.
atlas Iron Limited Annual Report 2009 9
Operations Review (cont'd)
PARDOO DsO - EXPLORATiON & REsOURCEsWith the commencement of mining operations at Pardoo in October 2008, the focus of work at Pardoo shifted from exploration to resource definition and infill drilling aimed at upgrading the Pardoo resource inventory from Inferred to Indicated and Measured category. Six diamond and 1,208 RC holes were completed during the year for a total of 51,925 metres of drilling. DSO resources have increased 17% to 28Mt at 56.1% Fe after mining depletion is accounted for.
Reserves for the Pardoo Project now stand at 8.4Mt at 57.4% Fe, a 14% increase compared to the previous Reserve statement, with improvements in overall Fe grade, and lower Alumina and Phosphorous evident. Please refer to Atlas’ previous Resource and Reserve Update announcement dated 29 July 2009.
Near-mine exploration will resume at Pardoo in quarter four 2009 with the aim of increasing and upgrading known resources and prospects in the Pardoo area in line with the mining schedule.
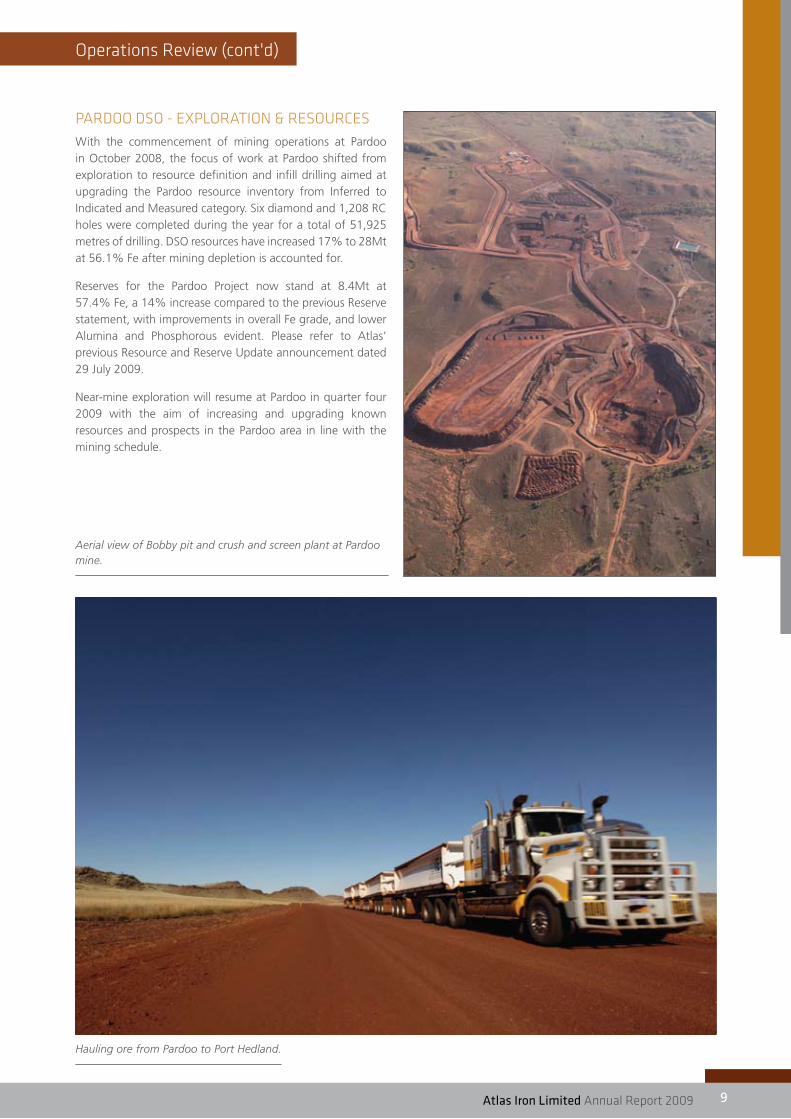
Hauling ore from Pardoo to Port Hedland.
Aerial view of Bobby pit and crush and screen plant at Pardoo mine.
10 atlas Iron Limited Annual Report 200910
Operations Review (cont'd)
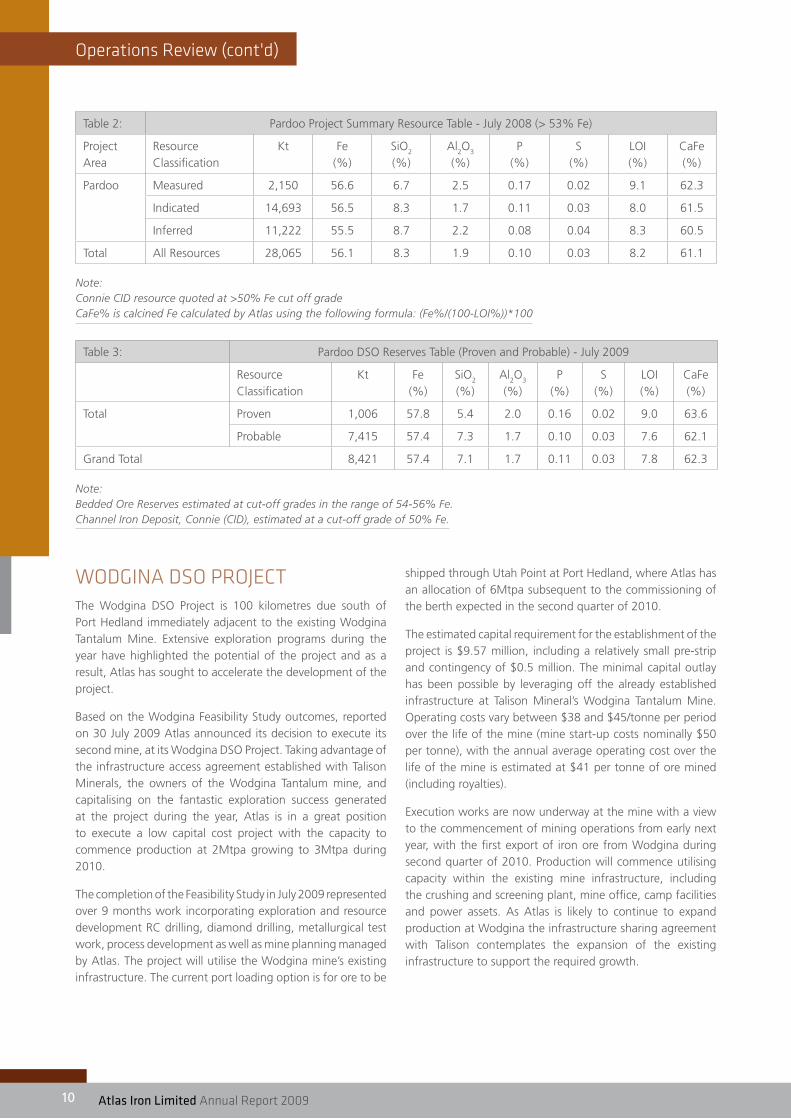
Table 2: Pardoo Project Summary Resource Table - July 2008 (> 53% Fe)
Project Area
Resource Classification
Kt Fe (%)
SiO2
(%)Al
2O
3
(%)P
(%)S
(%)LOI (%)
CaFe (%)
Pardoo Measured 2,150 56.6 6.7 2.5 0.17 0.02 9.1 62.3
Indicated 14,693 56.5 8.3 1.7 0.11 0.03 8.0 61.5
Inferred 11,222 55.5 8.7 2.2 0.08 0.04 8.3 60.5
Total All Resources 28,065 56.1 8.3 1.9 0.10 0.03 8.2 61.1
Note: Connie CID resource quoted at >50% Fe cut off grade CaFe% is calcined Fe calculated by Atlas using the following formula: (Fe%/(100-LOI%))*100
Table 3: Pardoo DSO Reserves Table (Proven and Probable) - July 2009
Resource Classification
Kt Fe (%)
SiO2
(%)Al
2O
3
(%)P
(%)S
(%)LOI (%)
CaFe (%)
Total Proven 1,006 57.8 5.4 2.0 0.16 0.02 9.0 63.6
Probable 7,415 57.4 7.3 1.7 0.10 0.03 7.6 62.1
Grand Total 8,421 57.4 7.1 1.7 0.11 0.03 7.8 62.3
Note: Bedded Ore Reserves estimated at cut-off grades in the range of 54-56% Fe. Channel Iron Deposit, Connie (CID), estimated at a cut-off grade of 50% Fe.
wODgiNA DsO PROJECTThe Wodgina DSO Project is 100 kilometres due south of Port Hedland immediately adjacent to the existing Wodgina Tantalum Mine. Extensive exploration programs during the year have highlighted the potential of the project and as a result, Atlas has sought to accelerate the development of the project.
Based on the Wodgina Feasibility Study outcomes, reported on 30 July 2009 Atlas announced its decision to execute its second mine, at its Wodgina DSO Project. Taking advantage of the infrastructure access agreement established with Talison Minerals, the owners of the Wodgina Tantalum mine, and capitalising on the fantastic exploration success generated at the project during the year, Atlas is in a great position to execute a low capital cost project with the capacity to commence production at 2Mtpa growing to 3Mtpa during 2010.
The completion of the Feasibility Study in July 2009 represented over 9 months work incorporating exploration and resource development RC drilling, diamond drilling, metallurgical test work, process development as well as mine planning managed by Atlas. The project will utilise the Wodgina mine’s existing infrastructure. The current port loading option is for ore to be
shipped through Utah Point at Port Hedland, where Atlas has an allocation of 6Mtpa subsequent to the commissioning of the berth expected in the second quarter of 2010.
The estimated capital requirement for the establishment of the project is $9.57 million, including a relatively small pre-strip and contingency of $0.5 million. The minimal capital outlay has been possible by leveraging off the already established infrastructure at Talison Mineral’s Wodgina Tantalum Mine. Operating costs vary between $38 and $45/tonne per period over the life of the mine (mine start-up costs nominally $50 per tonne), with the annual average operating cost over the life of the mine is estimated at $41 per tonne of ore mined (including royalties).
Execution works are now underway at the mine with a view to the commencement of mining operations from early next year, with the first export of iron ore from Wodgina during second quarter of 2010. Production will commence utilising capacity within the existing mine infrastructure, including the crushing and screening plant, mine office, camp facilities and power assets. As Atlas is likely to continue to expand production at Wodgina the infrastructure sharing agreement with Talison contemplates the expansion of the existing infrastructure to support the required growth.
atlas Iron Limited Annual Report 2009 11
Operations Review (cont'd)
On 3 August 2009, Atlas announced that it had signed the Wodgina Mining Native Title Agreement with the Kariyarra People. This native title mining agreement with the Kariyarra people is another example of the high standard of engagement by Atlas and its desire to provide opportunity
for indigenous enterprise, whilst continuing active business. The agreement is designed to facilitate mine development at the Wodgina DSO Project, along with port and export related infrastructure. It combines strong protection of Kariyarra country to preserve the cultural and environmental significance
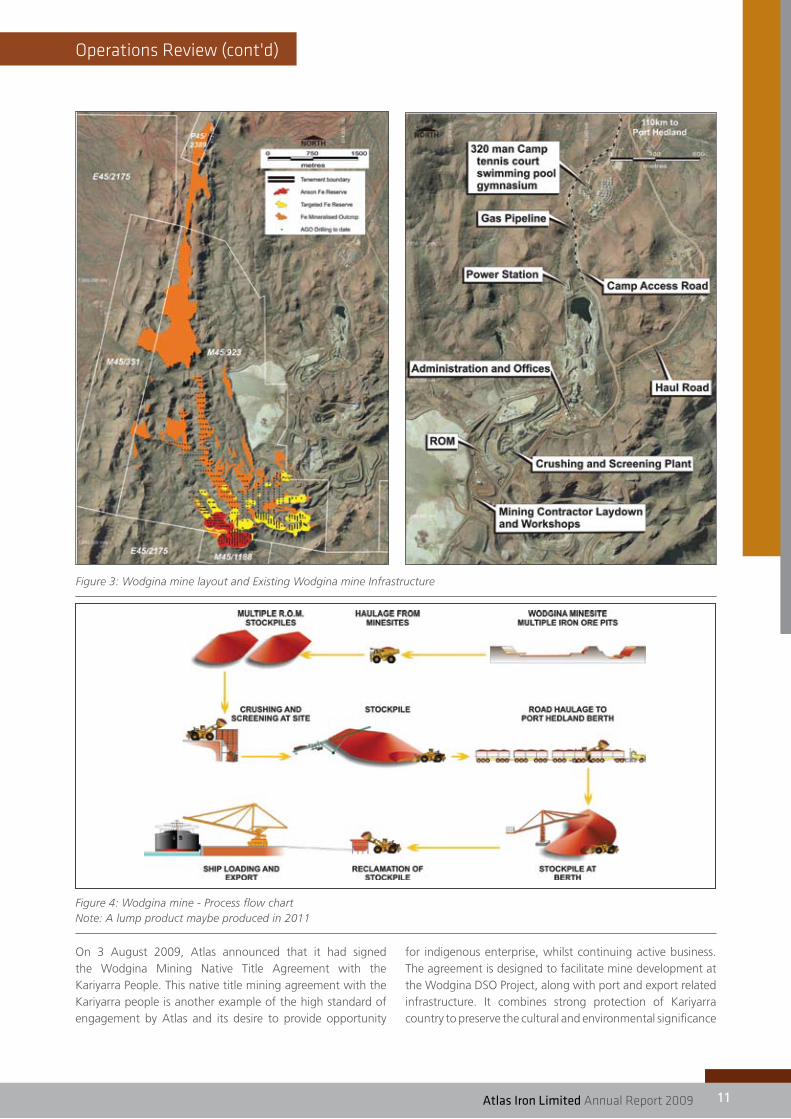
Figure 3: Wodgina mine layout and Existing Wodgina mine Infrastructure
Figure 4: Wodgina mine - Process flow chart Note: A lump product maybe produced in 2011

12 atlas Iron Limited Annual Report 200912
Operations Review (cont'd)
of the region. Compliance with heritage protocols, protection of significant sites with good community communication through a monitoring and liaison committee and on-going partnering throughout the operations through employment and contracting opportunities are paramount. (Hotlink to announcement: www.atlasiron2009ar.com)
Atlas’ intention is to continue to support the local Port Hedland community during the execution and ongoing operations at the Wodgina DSO Project. While Atlas will employ a mining work force to be housed in camp facilities based at Wodgina, Atlas’ existing senior mine management team will continue to be based in Port Hedland, and will continue to support the new Wodgina mine in conjunction with their existing responsibilities for the Pardoo site. In conjunction with its contractors, Atlas anticipates employing up to 60 people during the construction phase and up to 130 people during normal operations, inclusive of the required roster coverage across all disciplines.
Mining, crushing and screening operations are expected to be conducted on a continuous shift basis year round. It is Atlas’ intention to continue to employ its personnel and secure support services from a Port Hedland base where possible.
The Project will utilise contractors to maximise flexibility and minimise the capital costs at commencement of Atlas.
EXPLORATiON & REsOURCE DEvELOPmENTWodgina has been the main focus of exploration for Atlas since exploration commenced in November 2008. A total of 20 diamond and 900 RC holes were completed, for 53,874 metres of drilling.
Reconnaissance field work and mapping paid off immediately upon commencement of drilling at Wodgina with the discovery of the Anson deposit, which was intersected by the first hole drilled – WDRC001. An initial 8.1Mt resource was announced for Anson in January 2009, and this early success led to the decision to dedicate additional resources to the project in order to drill out all available targets as quickly as possible. By March 2009 three RC rigs and one diamond rig were drilling simultaneously under the supervision of the combined Exploration and Resource Development teams in a combined program.
As of 30 June 2009 Atlas had defined a total resource of 42.1Mt at 56.3% Fe, using a 53% Fe lower cut-off. This resource estimate is inclusive of infill drilling down to an average hole spacing of 40 metres by 20 metres over the Anson deposit, but not inclusive of additional infill drilling which has since been completed across the Dragon and Constellation deposits. Updated resource estimates for these latter two deposits will be completed later in 2009. Reserves for the Wodgina Project as at the time of reporting are at 9.5Mt at 58.2% Fe. (Hotlink to announcement: www.atlasiron2009ar.com)
Figure 5: Wodgina resource location Wodgina crush and screen plant.

atlas Iron Limited Annual Report 2009 13
Operations Review (cont'd)
lan
Figure 6: Cross-section of the Dragon deposit.
Table 4: Wodgina Project Resource Table - July 2009 >53% Fe
Resource Classification
Kt Fe (%)
SiO2
(%)Al
2O
3
(%)P
(%)S
(%)LOI (%)
CaFe (%)
Total Measured - - - - - - - -
Indicated 12,050 57.5 6.0 1.8 0.09 0.03 9.1 63.3
Inferred 30,020 55.8 7.3 2.4 0.06 0.07 9.1 61.4
Total All Resources 42,070 56.3 6.9 2.3 0.07 0.06 9.1 61.9
Note: CaFe% is calcined Fe calculated by Atlas using the following formula: (Fe%/(100-LOI%))*100
Table 5: Wodgina DSO Reserves Table (Proven and Probable) - July 2009
Deposit Ore Type Reserve Classification
Kt Fe (%)
SiO2
(%)Al
2O
3
(%)P
(%)S
(%)LOI (%)
CaFe (%)
Anson Bedded Ore Probable 9,495 58.2 5.3 1.6 0.10 0.03 9.0 64.0
Grand Total 9,495 58.2 5.3 1.6 0.10 0.03 9.0 64.0
Note:
Reserves estimated at a cut-off grade of 55% Fe.

14 atlas Iron Limited Annual Report 200914
Operations Review (cont'd)
One recent highlight of drilling at Dragon and Constellation was the delineation of a zone of high Fe grades and low contaminant levels. This material is expected to improve the potential economics of the project, and will possibly allow lower-grade material to be included in the Wodgina reserves as blending material.
Infill drilling is continuing within the Anson resource to increase ore body definition in preparation for mining under the supervision of the Resource Development team.
Despite the intense pace of exploration at Wodgina in the first half of 2009, significant exploration potential remains. A number of mineralised prospects identified in early reconnaissance drilling at Wodgina South are yet to be followed up, and the area north of Telegraph Gorge known as Wodgina North has not yet been drilled at all. Wodgina North is expected to be drilled in the latter half of 2009, following completion of necessary heritage approvals. This area is thought to have the potential to add significantly to Wodgina’s resource inventory in the year ahead.
AByDOs DsO PROJECTThe Abydos DSO Project is located 100 kilometres south - south east of Port Hedland in Western Australia’s Pilbara region. The Project is situated within an area of known iron ore deposits and contains prospective, archaean banded iron formation sequences. These units and surrounding terrain are prospective for DSO supergene bedded iron deposits (BID), detrital or channel iron deposits (CID) and magnetite deposits.
On the 5th December 2008, Atlas announced that it had signed a Native Title Mining Agreement with the Njamal people with respect to its Abydos Iron Ore Project. The agreement set a new improved standard of engagement and opportunity for indigenous enterprise. The agreement is designed to facilitate and fast-track mine development and combines strong protection of Njamal country with good community communication and on-going partnering throughout the operations. Furthermore the agreement sets up systems for Njamal People and Atlas to develop joint business initiatives. As an alternative to a signature payment, Atlas has agreed to help fund a Njamal business enterprise that will provide further commercial opportunities. The agreement also establishes an innovative heritage framework under which Atlas can accelerate the heritage survey process through appropriate consultation, thereby accessing its exploration and mining areas faster, while at the same time recognising the importance to Njamal People of their cultural sites. (Hotlink to announcement: www.atlasiron2009ar.com)
Following completion of pre feasibility studies (PFS) in July 2008, and with the progress of feasibility and resource development works since, the Abydos DSO project is a mature project ready for development, with mine production
targeted at an initial rate of 2Mtpa, growing to 3Mtpa shortly after. In conjunction with Atlas, Pardoo and Wodgina Mines, Abydos will support Atlas' targeted annualised production rate of 9Mtpa in 2011.
AByDOs miNE LAyOUTThe Abydos PFS has considered road haulage and rail haulage as options to transport Abydos Iron Ore to Port Hedland. In June 2007, Atlas signed a Memorandum of Understanding (MOU) with Fortescue Metals Group (FMG) relating to the use of FMG’s rail and Anderson Point ship loading facilities, for the export of 3Mt of iron ore from the Abydos Project.
Subject to agreement with FMG on commercial terms, Atlas would propose to utilise these facilities for its Abydos exports. In the absence of a rail haulage or port agreement via FMG, Atlas intends to use road trains to haul iron ore to the new public access port facilities at Utah Point in Port Hedland, subject to agreement with the Port Hedland Port Authority on available capacity. The proposed expansion of the public access port facilities at the Utah Point in Port Hedland is scheduled to be commissioned with capacity for up to 18Mtpa from April 2010.
In addition to the advantage of its location just 100 kilometres South-South East of Port Hedland, the Abydos Project tenement package is intersected by the Great Northern highway and FMG’s and BHPB’s railway lines. In addition, power, gas and hi-speed communications infrastructure is located in close proximity via the existing Wodgina Mine infrastructure available to Atlas via the Talison infrastructure sharing agreement.
The combined impact of all available infrastructure provides Atlas with significant advantages in low capital and operating costs. The PFS has now confirmed a relatively low capital cost for commencement of the Abydos Project of $53.3M for the rail haulage option, plus a $10.5M project contingency. Capital costs to establish the road haulage option are $47.2M, plus a $9.2M project contingency.
EXPLORATiON & REsOURCE DEvELOPmENTThe Abydos DSO project was the scene of intense drilling activity prior to the end of 2008, after which rigs and personnel were reassigned to Wodgina. A total of fourteen diamond and 407 RC holes were completed for 23,808 metres. Drilling was focussed on the Lalla Rookh trend, which now contains 17 deposits and prospects including Trigg, the most advanced of the resources and also the largest, with a resource of 11.8Mt at 57.7% Fe.
Resources at Abydos increased by 48% during the year to 22.3Mt at 57.1% Fe as a result of extensional drilling around Trigg, as well as new discoveries at Leighton, Scarborough and Sandtrax. Other prospects which have returned ore-grade intersections but which have not yet been drilled sufficiently

atlas Iron Limited Annual Report 2009 15
Operations Review (cont'd)
for a resource to be estimated include Contacios, Cables and Cove. There are a number of other prospects along the Lalla Rookh trend which are yet to be drilled.
Drilling will resume at Lalla Rookh in quarter four 2009. The primary objective of the year’s drilling campaign will be conversion of existing Inferred resources to Indicated category for inclusion in reserve calculations, but there are also drill metres allocated to exploration of new prospects. Abydos has an exploration target range of 30Mt to 40Mt at 57% to 59% Fe. Reserves for the Abydos Project stand at 7.5Mt at 58.2% Fe.
.
Figure 7: Abydos Lalla Rookh trend - principal prospect locations
Table 6: Abydos Project Resource Table - July 2009 (>50% Fe COG)
Resource Classification
Kt Fe (%)
SiO2
(%)Al
2O
3
(%)P
(%)S
(%)LOI (%)
CaFe (%)
Total Indicated 10,080 57.8 5.7 1.7 0.05 0.01 9.5 63.9
Inferred 12,240 56.6 6.8 2.2 0.06 0.02 9.4 62.5
Total All Resources 22,320 57.1 6.3 1.9 0.06 0.02 9.4 63.1
Note:
CaFe% is calcined Fe calculated by Atlas using the following formula: (Fe%/(100-LOI%))*100
Table 7: Abydos DSO Reserves Table (Proven and Probable) - July 2009
Deposit Ore Type Reserve Classification
Kt Fe (%)
SiO2
(%)Al
2O
3
(%)P
(%)S
(%)LOI (%)
CaFe (%)
Trigg Bedded Ore Probable 7,549 58.2 5.2 1.6 0.06 0.01 9.5 64.2
Grand Total 7,549 58.2 5.2 1.6 0.06 0.01 9.5 64.2
Note: Reserves estimated at a cut-off grade of 54% Fe.
Operations Review (cont'd)
16 atlas Iron Limited Annual Report 200916
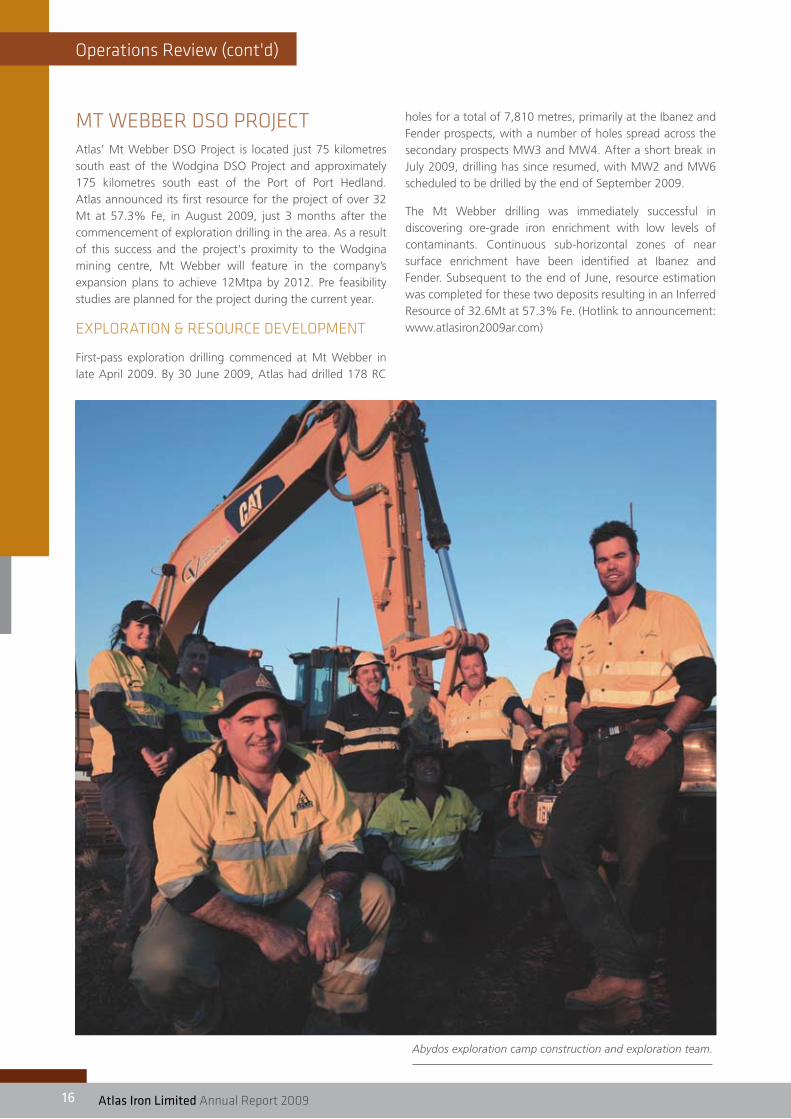
mT wEBBER DsO PROJECTAtlas’ Mt Webber DSO Project is located just 75 kilometres south east of the Wodgina DSO Project and approximately 175 kilometres south east of the Port of Port Hedland. Atlas announced its first resource for the project of over 32 Mt at 57.3% Fe, in August 2009, just 3 months after the commencement of exploration drilling in the area. As a result of this success and the project's proximity to the Wodgina mining centre, Mt Webber will feature in the company’s expansion plans to achieve 12Mtpa by 2012. Pre feasibility studies are planned for the project during the current year.
EXPLORATiON & REsOURCE DEvELOPmENT
First-pass exploration drilling commenced at Mt Webber in late April 2009. By 30 June 2009, Atlas had drilled 178 RC
holes for a total of 7,810 metres, primarily at the Ibanez and Fender prospects, with a number of holes spread across the secondary prospects MW3 and MW4. After a short break in July 2009, drilling has since resumed, with MW2 and MW6 scheduled to be drilled by the end of September 2009.
The Mt Webber drilling was immediately successful in discovering ore-grade iron enrichment with low levels of contaminants. Continuous sub-horizontal zones of near surface enrichment have been identified at Ibanez and Fender. Subsequent to the end of June, resource estimation was completed for these two deposits resulting in an Inferred Resource of 32.6Mt at 57.3% Fe. (Hotlink to announcement: www.atlasiron2009ar.com)
Abydos exploration camp construction and exploration team.
Operations Review (cont'd)
atlas Iron Limited Annual Report 2009 17
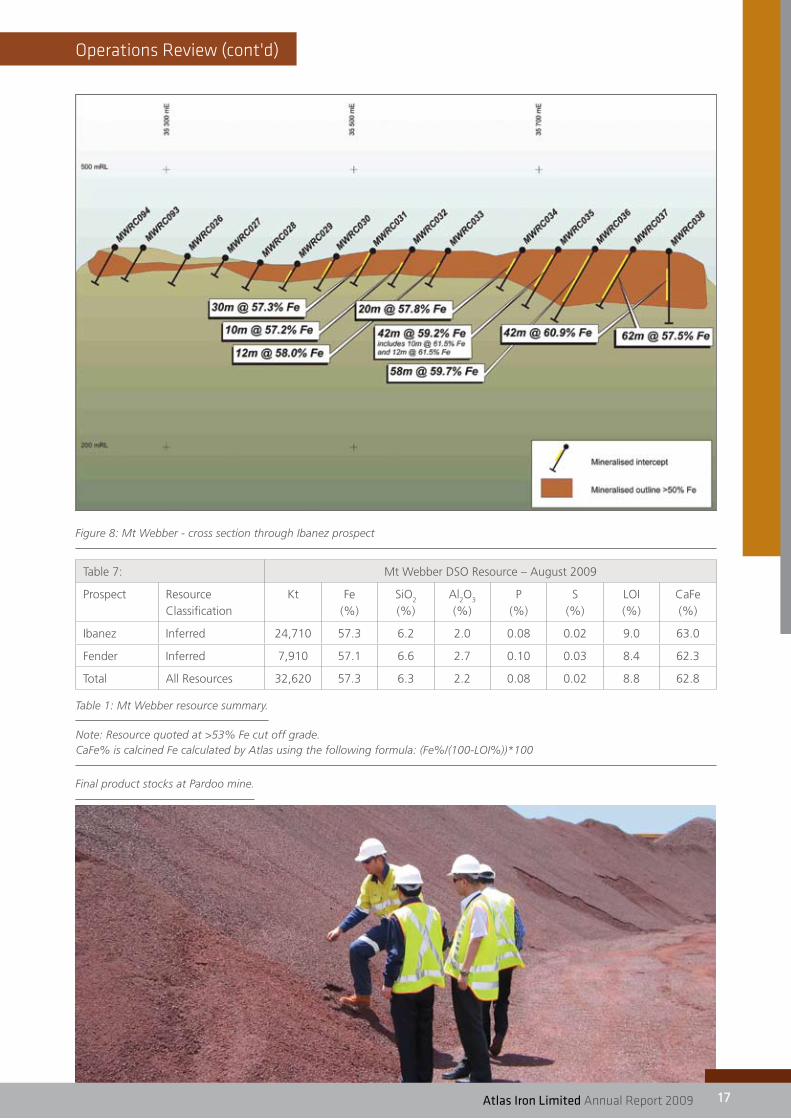
Figure 8: Mt Webber - cross section through Ibanez prospect
Table 7: Mt Webber DSO Resource – August 2009
Prospect Resource Classification
Kt Fe (%)
SiO2
(%)Al
2O
3
(%)P
(%)S
(%)LOI (%)
CaFe (%)
Ibanez Inferred 24,710 57.3 6.2 2.0 0.08 0.02 9.0 63.0
Fender Inferred 7,910 57.1 6.6 2.7 0.10 0.03 8.4 62.3
Total All Resources 32,620 57.3 6.3 2.2 0.08 0.02 8.8 62.8
Final product stocks at Pardoo mine.
Table 1: Mt Webber resource summary.
Note: Resource quoted at >53% Fe cut off grade. CaFe% is calcined Fe calculated by Atlas using the following formula: (Fe%/(100-LOI%))*100

18 atlas Iron Limited Annual Report 200918
Operations Review (cont'd)
TURNER RivER DsO PROJECTThe Turner River project area is located approximately 65 kilometres south of Port Hedland and includes a number of prospects, including potential Bedded Iron Deposits (BID) and Channel Iron Deposits (CID). The Mt Dove prospect, located 11 kilometres from the Great Northern Highway north of Wodgina and within the Turner River project area, is the subject of an iron ore rights agreement with De Grey Mining Limited. Drilling at Mt Dove during the year consisted of a single program of 20 RC holes for 798 metres. As a result of this drilling, an Inferred Resource has been estimated for Mt Dove, containing 2.5Mt at 58.5% Fe.
(Hotlink to July 2009 Resources and Reserves Update: www.atlasiron2009ar.com)
Table 8: Turner River Project Resource Table (50%Fe)
Resource Classification
Kt Fe (%)
SiO2
(%)Al
2O
3
(%)P
(%)S
(%)LOI (%)
CaFe (%)
Total Inferred 2,470 58.5 6.1 1.8 0.11 0.03 7.9 63.5
Total All Resources 2,470 58.5 6.1 1.8 0.11 0.03 7.9 63.5
Note: Café% is calcined Fe calculated by Atlas using the following formula (Fe%/(100-LOI%))*100
miDwEsT PROJECTsThe Company’s Midwest projects, consisting of Mount Gould and Weld Range in the Murchison Province of Western Australia,
are highly prospective for premium high grade hematite mineralisation. Mount Gould contains the interpreted strike extension to ore currently being mined and exported from Jack Hills. The two projects have the potential to add a combined total of 30 to 40Mt at 60-66% Fe to the Company’s resource inventory.
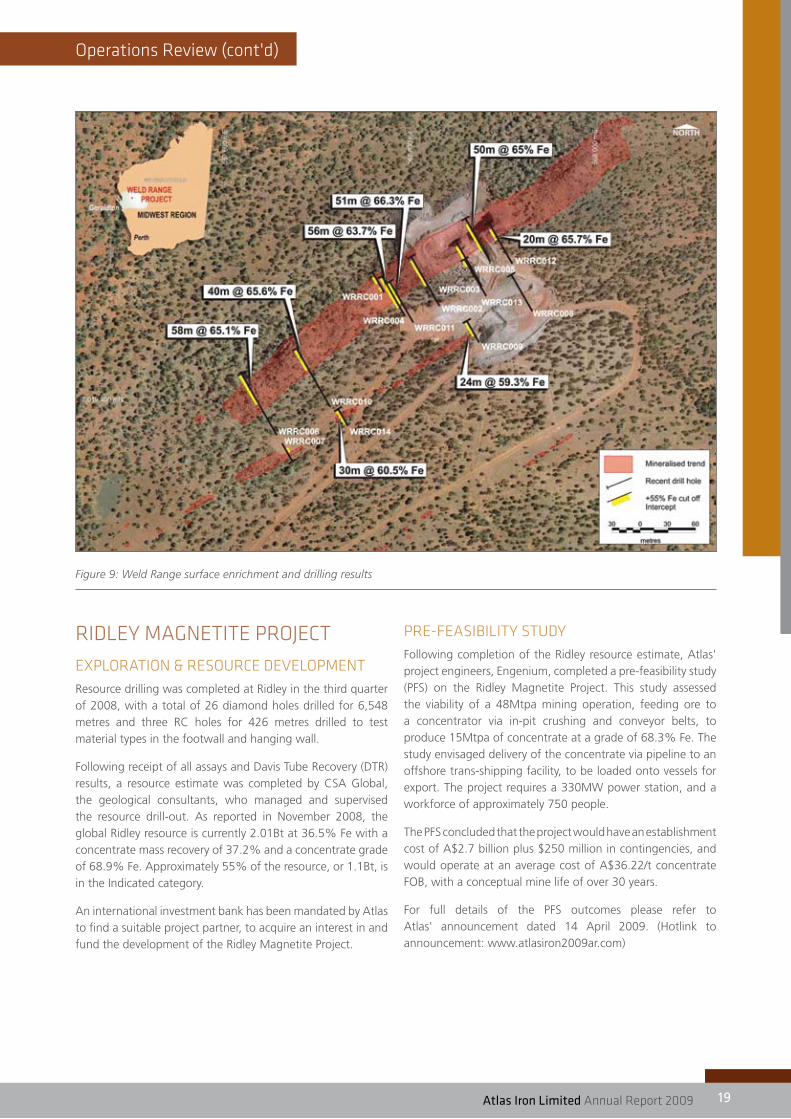
In September 2008 Atlas drilled a small RC program at its Weld Range project in the Mid West of Western Australia, consisting of 14 RC holes for 1,131 metres. The drilling was designed to test the tenor and width of enrichment along strike and at depth.
Results of the drilling correlated well with surface mapping, with 40 metre lode widths replicated at up to 70 metres vertical depth. The tenor of mineralisation was also highly encouraging, with individual 2 metre samples returning assays as high as 68.7% Fe.
The strategic value of this landholding has been confirmed during the year, with the signing of a State Development Agreement for the Oakajee Port and Rail network on 20 March 2009. The State and Federal Governments have also committed a combined $678 million in funding towards the Oakajee Port Project. The Oakajee Port and Rail developments are expected to service both the Jack Hills / Mt Gould and Weld Range areas, which will support the development of DSO mines at these two projects.
White further work is planned at both the Company’s Mid West projects, but the Pilbara projects remain higher in priority for the medium term.
(Hotlink to October 2008 announcement: www.atlasiron2009ar.com)
atlas Iron Limited Annual Report 2009 19
Operations Review (cont'd)
Figure 9: Weld Range surface enrichment and drilling results
RiDLEy mAgNETiTE PROJECT
EXPLORATiON & REsOURCE DEvELOPmENTResource drilling was completed at Ridley in the third quarter of 2008, with a total of 26 diamond holes drilled for 6,548 metres and three RC holes for 426 metres drilled to test material types in the footwall and hanging wall.
Following receipt of all assays and Davis Tube Recovery (DTR) results, a resource estimate was completed by CSA Global, the geological consultants, who managed and supervised the resource drill-out. As reported in November 2008, the global Ridley resource is currently 2.01Bt at 36.5% Fe with a concentrate mass recovery of 37.2% and a concentrate grade of 68.9% Fe. Approximately 55% of the resource, or 1.1Bt, is in the Indicated category.
An international investment bank has been mandated by Atlas to find a suitable project partner, to acquire an interest in and fund the development of the Ridley Magnetite Project.
PRE-fEAsiBiLiTy sTUDyFollowing completion of the Ridley resource estimate, Atlas' project engineers, Engenium, completed a pre-feasibility study (PFS) on the Ridley Magnetite Project. This study assessed the viability of a 48Mtpa mining operation, feeding ore to a concentrator via in-pit crushing and conveyor belts, to produce 15Mtpa of concentrate at a grade of 68.3% Fe. The study envisaged delivery of the concentrate via pipeline to an offshore trans-shipping facility, to be loaded onto vessels for export. The project requires a 330MW power station, and a workforce of approximately 750 people.
The PFS concluded that the project would have an establishment cost of A$2.7 billion plus $250 million in contingencies, and would operate at an average cost of A$36.22/t concentrate FOB, with a conceptual mine life of over 30 years.
For full details of the PFS outcomes please refer to Atlas' announcement dated 14 April 2009. (Hotlink to announcement: www.atlasiron2009ar.com)
20 atlas Iron Limited Annual Report 200920
Operations Review (cont'd)
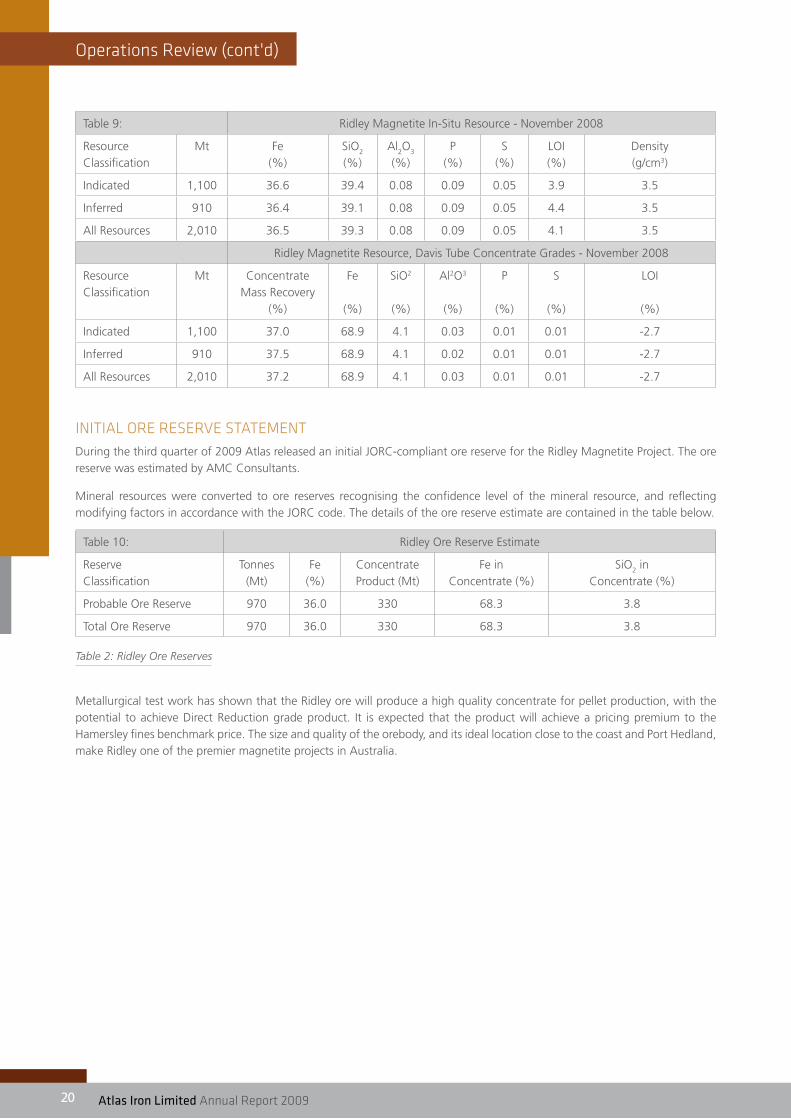
Table 9: Ridley Magnetite In-Situ Resource - November 2008
Resource Classification
Mt Fe (%)
SiO2
(%)Al
2O
3
(%)P
(%)S
(%)LOI (%)
Density (g/cm3)
Indicated 1,100 36.6 39.4 0.08 0.09 0.05 3.9 3.5
Inferred 910 36.4 39.1 0.08 0.09 0.05 4.4 3.5
All Resources 2,010 36.5 39.3 0.08 0.09 0.05 4.1 3.5
Ridley Magnetite Resource, Davis Tube Concentrate Grades - November 2008
Resource Classification
Mt Concentrate Mass Recovery
(%)
Fe
(%)
SiO2
(%)
Al2O3
(%)
P
(%)
S
(%)
LOI
(%)
Indicated 1,100 37.0 68.9 4.1 0.03 0.01 0.01 -2.7
Inferred 910 37.5 68.9 4.1 0.02 0.01 0.01 -2.7
All Resources 2,010 37.2 68.9 4.1 0.03 0.01 0.01 -2.7
iNiTiAL ORE REsERvE sTATEmENTDuring the third quarter of 2009 Atlas released an initial JORC-compliant ore reserve for the Ridley Magnetite Project. The ore reserve was estimated by AMC Consultants.
Mineral resources were converted to ore reserves recognising the confidence level of the mineral resource, and reflecting modifying factors in accordance with the JORC code. The details of the ore reserve estimate are contained in the table below.
Table 10: Ridley Ore Reserve Estimate
Reserve Classification
Tonnes (Mt)
Fe (%)
Concentrate Product (Mt)
Fe in Concentrate (%)
SiO2 in
Concentrate (%)
Probable Ore Reserve 970 36.0 330 68.3 3.8
Total Ore Reserve 970 36.0 330 68.3 3.8
Table 2: Ridley Ore Reserves
Metallurgical test work has shown that the Ridley ore will produce a high quality concentrate for pellet production, with the potential to achieve Direct Reduction grade product. It is expected that the product will achieve a pricing premium to the Hamersley fines benchmark price. The size and quality of the orebody, and its ideal location close to the coast and Port Hedland, make Ridley one of the premier magnetite projects in Australia.
atlas Iron Limited Annual Report 2009 21
Corporate Activities
Corporate aCtIVItIeSCapital raisings
In June and July 2009, Atlas completed a $119.8 million fund raising via a placement in two tranches and share purchase plan. Shareholders approved the placement at a general meeting of shareholders on 20 July 2009. Nearly 7,000 shareholders subscribed to the share purchase plan. As a result of this unprecedented demand, Atlas increased the size of the share purchase plan by 27.7% from $11.7 million to $14.8 million.. Despite this increase, Atlas had to scale back each Share Purchase Plan subscription on a pro rata basis by approximately 50%.
Acquisitions
Exercise of Mt Webber option
In May 2009, Atlas, pursuant its option agreement with Haddington Resources Limited announced on 15 January 2008, gave Haddington notice of its intention to exercise its option to acquire the iron ore rights to 6 Pilbara tenements from Haddington and as a result issued Haddington 485,437 Atlas shares, equal to $1,000,000 in Atlas shares at an issue price of $2.06, being the 5 day VWAP prior to the option agreement being signed on 15 January 2008.
Exercise of Mt Dove option
In July 2009, Atlas exercised its option to purchase the iron ore rights over the Mt Dove tenements for consideration as $650,000 cash. De Grey retains a 1% gross value royalty on future iron ore production from the area and also retains rights to all other minerals within the Mt Dove exploration licence
Talison infrastructure access
In the first half of 2009, Atlas entered into agreement with Talison Wodgina Pty Ltd (Talison) a wholly owned subsidiary of Talison Minerals, for the use of infrastructure at the Wodgina Mine to support the commencement and expansion of Atlas’ Wodgina Project development. Talison owns the Wodgina tantalum mine and associated infrastructure, which is located 100 kilometres by road south of Port Hedland, in the Pilbara of Western Australia. Atlas owns 100% of the Fe rights to the tenements immediately adjacent to the Wodgina tantalum mine. The agreement provides Atlas with access to infrastructure that can support its Wodgina iron ore project at a significantly lower cost than a new start up project. Atlas has agreed to a take or pay arrangement for the capital and fixed costs of the capacity for a monthly fee. Atlas paid Talison an initial payment of $3,000,000 payable in Atlas ordinary shares at an issue price calculated at a 5% discount to the 5 day VWAP prior to the formal agreement. (Hotlink to announcement: www.atlasiron2009ar.com)
Port Capacity
In April 2009, Atlas secured additional berth capacity at the Utah Point public access port facility in Port Hedland. Atlas is a foundation customer of the Utah Point facility and had previously secured 3Mtpa of annual capacity to underpin delivery of product from its Pardoo mine. Atlas has been allocated an additional 3Mtpa of capacity by the Port Hedland Port Authority for the period from May 2010 to February 2012, increasing its total allocation to 6Mtpa. Utah Point is currently under construction and is expected to be ready for first export of Atlas’ Pardoo product by the second quarter of 2010, with full commissioning expected later in 2010. (Hotlink to announcement: www.atlasiron2009ar.com)
Capital Structure
At 30 June 2009, Atlas had 342,830,715 shares on issue. The top 20 shareholders hold approximately 59% of the issued capital. Since year end, the Company has issued additional 57 million shares shares pursuant to the second tranche of the placement announced on 15 June 2009, the Share Purchase Plan and the exercise of approximately 9 million unlisted options.
Listed Investments
As part of Atlas' longer term strategy, Atlas has •maintained and increased its interest in ASX-listed Pilbara Iron Ore Explorer, Warwick Resources Limited (www.warwickresources.com.au)
Since year end, Warwick in association with Atlas, acquired the iron ore rights to the Jigalong tenements held with Hannans Reward Limited. This transaction was approved by Warwick shareholders on 20 August 2009. Warwick has a significant landholding in the South East Pilbara which is prospective for iron ore. Warwick has announced inferred resources and exploration targets which can be seen on its website (www.warwickresources.com.au).
On 7 September 2009, Atlas announced that it and •Warwick Resources had reached agreement for Atlas and Warwick to merge by way of Schemes of Arrangement with Warwick shareholders and optionholders. Atlas will issue one Atlas share to Warwick shareholders for every three Warwick shares on issue. Atlas will also issue Atlas shares to Warwick optionholders on a ratio determined by the exercise price and expiry date of the respective options. The Board of Warwick (other than Atlas’ nominee) has unanimously recommended that all Warwick security holders support the Schemes. The Scheme meeting is expected to be held in late November 2009. (Hotlink to announcement: www.atlasiron2009ar.com)

22 atlas Iron Limited Annual Report 200922
Corporate Activities (cont'd)
Atlas has maintained its 43% holding in ASX-listed •Pilbara Manganese Explorer, Shaw River Resources (www.shawriver.com.au). Since year end Shaw River has
announced a $5 million placement to fund its manganese exploration projects. Atlas is participating in this capital raising.
The Atlas Management Team – Jack Cullity, Daniel Taylor, Jeremy Sinclair, Tony Walsh, David Flanagan, Matt Ramsden, Ken Brinsden, Adam Liebenberg, Mark Hancock and Andrew Paterson.

atlas Iron Limited Annual Report 2009 23
sales and marketing
SaLeS and marketIng
EXisTiNg LONg TERm CONTRACTs – PERfORmANCE, PRiCiNgShipments under Pardoo long-term contracts commenced in March. To date, shipments have been made to each of Atlas’ long-term contract customers.
Pricing under our contracts is based on relativity to the Asian Benchmark however, the protracted Benchmark pricing negotiations between China and the large producers has meant that shipments to July 2009 have been priced on a spot basis. (Hotlink to 16 March 2009 announcement: www.atlasiron2009ar.com)
sPOT PRiCiNgEncouragingly, spot prices have risen throughout 2009 from the depths plumbed in November/December 2008. Atlas retains exposure to the movements in the spot price through the mutual fairness clauses in its offtake agreements.
COmPETiTOR ACTiONsSome competitors have been quietly shipping product to China at the 2009 Benchmark price on a provisional basis. During the September quarter of 2009, almost all tonnes sold into China by competitors were fixed at spot prices.
DEmANDChinese iron ore imports in the first seven months of 2009 were 354 million tonnes, up 31.1% year-on-year (84.0 million tonnes higher), equating to an annualised rate of 606 million tonnes. As demand for iron ore has been basically flat year-on-year, this implies a significant reduction in the use and production of domestically produced ore after taking into account the minimal increase in iron ore stockpiles.
fORwARD PRiCiNg OUTLOOkConsensus forecasts for the 2010 Benchmark iron ore price have improved significantly in the last quarter with most taking the view that prices will rise in 2010, with banks and research houses sitting in the range of 0-20%.
Pardoo ore being unloaded in China. Pardoo ore being loaded at Port Hedland.

24 atlas Iron Limited Annual Report 200924
Corporate governance statement (cont'd)
Competent perSonS and JorC CompLIanCe StatementS
Geological Data, Interpretation and Resource Estimation – Mt Webber
The information in this report that relates to mineral resource results is based on information compiled by Mr Shane Tomlinson is a member of the Australian Institute of Geoscientists & Mr Chris Allen is a member of the Australasian Institute of Mining and Metallurgy. Shane Tomlinson is a full time employee of Atlas Iron Limited and Chris Allen is a full time employee of CSA Global Pty Ltd. Shane Tomlinson & Chris Allen have sufficient experience which is relevant to the style of mineralisation and type of deposit under consideration and to the activity which they have undertaken to qualify as a Competent Person as defined in the 2004 Edition of the ‘Australasian Code for Reporting of Exploration Results, Mineral Resources and Ore Reserves’. Shane Tomlinson and Chris Allen consent to the inclusion in the report of the matters based on their information in the form and context in which it appears.
Geological Data, Interpretation and Resource Estimation – Alice, Clare, Hubert, Glenda, and Connie Resources
The information in this report that relates to mineral resource results is based on information compiled by Mr Tony Cormack & Mr Richard Gaze who are members of the Australasian Institute of Mining and Metallurgy. Tony Cormack is a full time employee of Atlas Iron Limited and Richard Gaze is a full time employee of Golder Associates Pty Ltd. Tony Cormack & Richard Gaze have sufficient experience which is relevant to the style of mineralisation and type of deposit under consideration and to the activity which they have undertaken to qualify as a Competent Person as defined in the 2004 Edition of the ‘Australasian Code for Reporting of Exploration Results, Mineral Resources and Ore Reserves’. Tony Cormack and Richard Gaze consent to the inclusion in the report of the matters based on their information in the form and context in which it appears.
Geological Data, Interpretation and Resource Estimation – Bobby, Floyd, Emma, Olivia, Avalon Point, Mettams, Mullaloo, and Trigg Resources
The information in this report that relates to mineral resource results is based on information compiled by Mr Tony Cormack & Mr David Williams who are members of the Australasian Institute of Mining and Metallurgy. Tony Cormack is a full time employee of Atlas Iron Limited and David Williams is a full time employee of CSA Global Pty Ltd. Tony Cormack & David Williams have sufficient experience which is relevant to the style of mineralisation and type of deposit under consideration and to the activity which they have undertaken to qualify as a Competent
Person as defined in the 2004 Edition of the ‘Australasian Code for Reporting of Exploration Results, Mineral Resources and Ore Reserves’. Tony Cormack and David Williams consent to the inclusion in the report of the matters based on their information in the form and context in which it appears.
Geological Data, Interpretation and Resource Estimation – South Limb and Dean Resources
The information in this report that relates to mineral resource results is based on information compiled by Mr Tony Cormack & Mr Malcolm Titley who are members of the Australasian Institute of Mining and Metallurgy. Tony Cormack is a full time employee of Atlas Iron Limited and Malcolm Titley is a full time employee of CSA Global Pty Ltd. Tony Cormack & Malcolm Titley have sufficient experience which is relevant to the style of mineralisation and type of deposit under consideration and to the activity which they have undertaken to qualify as a Competent Person as defined in the 2004 Edition of the ‘Australasian Code for Reporting of Exploration Results, Mineral Resources and Ore Reserves’. Tony Cormack and Malcolm Titley consent to the inclusion in the report of the matters based on their information in the form and context in which it appears.
Geological Data, Interpretation and Resource Estimation – Mt Dove and Wodgina
The information in this report that relates to mineral resource results is based on information compiled by Mr Tony Cormack who is a member of the Australasian Institute of Mining and Metallurgy. Tony Cormack is a full time employee of Atlas Iron Limited. Tony Cormack has sufficient experience which is relevant to the style of mineralisation and type of deposit under consideration and to the activity which he has undertaken to qualify as a Competent Person as defined in the 2004 Edition of the ‘Australasian Code for Reporting of Exploration Results, Mineral Resources and Ore Reserves’. Tony Cormack consents to the inclusion in the report of the matters based on his information in the form and context in which it appears.
Geological Data, Interpretation and Resource Estimation – Alice Extension
The information in this report that relates to mineral resource results is based on information compiled by Mr Simon Gobbett who is a member of the Australasian Institute of Mining and Metallurgy. Simon Gobbett is a full time employee of Atlas Iron Limited. Simon Gobbett has sufficient experience which is relevant to the style of mineralisation and type of deposit under consideration and to the activity which he has undertaken to qualify as a Competent Person as defined in the 2004 Edition of the ‘Australasian Code for Reporting of Exploration Results, Mineral Resources and Ore Reserves’. Simon Gobbett consents to the inclusion in the report of the matters based on their information in the form and context in which it appears.
Competent Persons and JORC Compliance statements

atlas Iron Limited Annual Report 2009 25
Competent Persons and JORC Compliance statements (cont'd)
Reserve Estimation
The information in this report that relates to reserve estimations is based on information compiled by Mr Ken Brinsden, who is a member of the Australasian Institute of Mining and Metallurgy. Ken Brinsden is a full time employee of Atlas Iron Limited. Ken Brinsden has sufficient experience which is relevant to the style of mineralisation and type of deposit under consideration and to the activity which he has undertaken to qualify as a Competent Person as defined in the 2004 Edition of the ‘Australasian Code for Reporting of Exploration Results, Mineral Resources and Ore Reserves’. Ken Brinsden consents to the inclusion in the report of the matters based on his information in the form and context in which it appears.
Atlas Iron Limited – Statement on Global Exploration Target
Atlas has reported a total resource inventory of 94.9 million tonnes at 56.5% Fe consisting of resources at Pardoo, Abydos, Mt Dove and Wodgina. While the Company intends to do further exploration on its tenements and remains optimistic it will report additional resources and reserves in the future, any discussion in relation to targets, resources, reserves or ‘ore’ over and above the resource of 94.9 million tonnes at 56.5% Fe is only conceptual in nature. There has been insufficient exploration to define a Mineral Resource over and above the resource of 94.9 million tonnes at 56.5% Fe, and it is uncertain if further exploration will result in the determination of a Mineral Resource over and above the resource of 94.9 million tonnes at 56.5% Fe.
Resource Estimation Ridley Deposit
The information in this report that relates to mineral resource results is based on information compiled by Mr Malcolm Titley who is a member of the Australasian Institute of Mining and Metallurgy. Malcolm Titley is a full time employee of CSA Global Pty Ltd. Malcolm Titley has sufficient experience which is relevant to the style of mineralisation and type of deposit under consideration and to the activity which he has undertaken to qualify as a Competent Person as defined in the 2004 Edition of the ‘Australasian Code for Reporting of Exploration Results, Mineral Resources and Ore Reserves’. Malcolm Titley consents to the inclusion in the report of the matters based on their information in the form and context in which it appears.
Ore Reserve Estimation Ridley Deposit
The sections in this report that relate to the Ridley Ore Reserves are based on information compiled under the direction of Mr Bruce Gregory. Mr Gregory is a Member of the Australasian Institute of Mining and Metallurgy and is a full time employee of AMC Consultants Pty Ltd. Mr Gregory has sufficient experience relevant to the style of mineralization and type of deposit under consideration to qualify as a Competent Person as defined in the 2004 Edition of the ‘Australasian Code for Reporting of Exploration results, Mineral Resources and Ore Reserves’. Mr Gregory consents to the inclusion in the report of the matters based on their information in the form and context in which it appears.
Dollars means Australian dollars.
Adam Liebenberg, Operations Mining Manager.

26 atlas Iron Limited Annual Report 200926
Corporate governance statement (cont'd)Corporate governance statement
Corporate goVernanCe Statement
The Company is committed to implementing and maintaining the highest standards of corporate governance. In determining what those standards should involve, the Company has turned to the ASX Corporate Governance Council’s Principles of Good Corporate Governance and Best Practice Recommendations. The Company is pleased to advise its practices are largely consistent with those of the ASX guidelines.
In 2008, the Company decided to review all its corporate governance practices and policies in light of the publication of the 2nd Edition of ASX Corporate Governance Council’s Principles of Good Corporate Governance and Best Practice Recommendations with a view to ensuring the Company’s corporate governance practices and policies are up to date and reflect the Company’s current stage of development as well as accommodating the Company’s future growth.
The Board considers that the Company is now of a size and its affairs of such complexity to justify the formation of a Remuneration Committee and a Nominations Committee. The charters for these two committees were approved in September 2008 and the committees were formed in compliance with the guidelines set out in the 2nd Edition of ASX Corporate Governance Council’s Principles of Good Corporate Governance and Best Practice Recommendations. The Audit & Risk Committee, the Remuneration Committee and the Nomination Committee each make recommendations to the Board. The Board as a whole addresses the governance aspects of the full scope of the Company's activities to ensure that it adheres to appropriate ethical standards.
ThE BOARD Of DiRECTORsComposition of the Board
On 20 July 2009, shareholders approved a new Constitution that reflected changes to the Corporations Act 2001 and ASX Listing Rules. This ensured that the Company’s Constitution is up to date with best corporate practice. The Company's new Constitution provides that the number of directors shall not be less than three. There is no requirement for any share holding qualification.
As the Company's activities increase in size, nature and scope, the size of the Board will be reviewed periodically, and as circumstances demand. The optimum number of directors required to supervise adequately the Company's organisational nature and structure will be determined by the Board within the limitations imposed by the Constitution, as approved by shareholders on 20 July 2009.
The membership of the Board, its activities and composition, is subject to periodic review. The criteria for determining the identification and appointment of a suitable candidate for the
Board shall include quality of the individual, background of experience and achievement, compatibility with other Board members, credibility within the Company's scope of activities, intellectual ability to contribute to Board duties and physical ability to undertake Board duties and responsibilities.
Directors are initially appointed by the full Board subject to election by shareholders at the next general meeting. Under the Company's Constitution the tenure of a director (other than managing director, and only one managing director where the position is jointly held) is subject to reappointment by shareholders not later than the third anniversary following his or her last appointment. Subject to the requirements of the Corporations Act 2001, the Board does not subscribe to the principle of retirement age and there is no maximum period of service as a director. A managing director may be appointed for any period and on any terms the directors think fit and, subject to the terms of any agreement entered into, may revoke any appointment.
Role of the Board
On 14 June 2007 the Company established a formal Board Charter as per Recommendation 1.1. In broad terms, the Board is accountable to the shareholders and must ensure that the Company is properly managed to protect and enhance shareholders’ wealth and other interests. The Board Charter sets out the role and responsibilities of the Board within the governance structure of the Company and its related bodies corporate (as defined in the Corporations Act).
The Board is responsible for promoting the success of the Company in a way which ensures that the interests of shareholders and stakeholders are promoted and protected. The Board may delegate some powers and functions to the Managing Director for the day-to-day management of the Company. Powers and functions not delegated remain with the Board. The following are regarded as the key responsibilities and functions of the Board:
to develop, review and monitor the Company’s long-•term business strategies and provide strategic direction to management;
to approve the acquisition, establishment, disposal or •cessation of any significant business of the Company;
to ensure policies and procedures are in place to safeguard •the Company’s assets and business and to enable the Company to act ethically and prudently;
to develop and promote a system of corporate governance •which ensures the Company is properly managed and controlled;
to identify the Company’s principal risks and ensure that •it has in place appropriate systems of risk management, internal control, reporting and compliance and that management is taking appropriate action to minimise those risks;
Corporate governance statement (cont'd)
atlas Iron Limited Annual Report 2009 27
Corporate governance statement (cont'd)
to review and approve the Company’s financial •statements;
to monitor management’s performance and the Company’s •financial results on a regular basis;
to appoint, ratify, appraise and determine the remuneration •and benefits of the Managing Director;
to delegate powers to the Managing Director as necessary •to enable the day-to-day business of the Company to be carried on, and to regularly review those delegations;
to ensure that the Company has in place appropriate •systems to comply with relevant legal and regulatory requirements that impact on its operations;
to determine the appropriate capital management for •the Group including share and loan capital and dividend payments;
to determine and regularly review an appropriate •remuneration policy for employees of the Company;
to approve senior management succession plans and •significant changes to organisational structure;
to authorise the issue of shares, options, equity instruments •or other securities; and
establishing procedures which ensure that the Board is •in a position to exercise its powers and to discharge its responsibilities as set out in the Board Charter.
Other than as specifically reserved to the Board in the Board Charter, responsibility for the management of the Company’s business activities is delegated to the Managing Director who is accountable to the Board.
Appointments to Other Boards
Directors are required to take into consideration any potential conflicts of interest when accepting appointments to other Boards. In light of the time commitment required by appointment to the Board, non-executive directors are asked to limit the number of other directorships for the duration of their appointment with the Company. Non-executive directors are asked to provide the Board with details of other commitments and an indication of time involved. The Board will regularly review the time required of a non-executive director and make an assessment as to whether the directors are able to meet their commitment to the Company. The Nominations Committee is charged to regularly review the time required by a Director to effectively undertake his or her Board responsibilities (and Board committee responsibilities, where relevant) and determine whether each Director is meeting that requirement after identifying and considering details of that Director's other commitments.
Chairman
The Chairman of the Board, Mr Geoff Clifford, is an independent, non-executive director and a resident Australian citizen. The Chairman is responsible for leadership and effective performance of the Board and for the maintenance of relations between directors and management that are open, cordial and conducive to productive cooperation. The Chairman’s responsibilities are set out in more detail in the Board Charter and the Company’s Constitution, which is available in the corporate governance section of the Company’s website.
Director Independence
The independence of a Director is assessed in accordance with the guidelines set out in the 2nd Edition of ASX Corporate Governance Council’s Principles of Good Corporate Governance and Best Practice Recommendations. In accordance with these guidelines, the Board assesses independence with reference to whether a Director is non-executive, not a member of management and who is free of any business or other relationship that could materially interfere with, or could reasonably be perceived to materially interfere with, the independent exercise of their judgement. In making this assessment, the Board considers all relevant facts and circumstances. Relationships that the Board will take into consideration when assessing independence are whether a director:
is a substantial shareholder of the company or an officer •of, or otherwise associated directly with, a substantial shareholder of the Company;
is employed, or has previously been employed in an •executive capacity by the Company or another group member, and there has not been a period of at least three years between ceasing such employment and serving on the Board;
has within the last three years been a principal of a •material professional advisor or a material consultant to the Company or another group member, or an employee materially associated with the service provided;
is a material supplier or customer of the Company or other •group member, or an officer of or otherwise associated directly or indirectly with a material supplier or customer; or
has a material contractual relationship with the Company •or another group member other than as a director.
The test of whether a relationship or business is material is •based on the nature of the relationship or business and on the circumstances and activities of the director. Materiality is considered from the perspective of the Company and its group members, the persons or organisations with which the director has an affiliation and from the perspective of the director. The Board reviews the independence of directors before they are appointed and on an annual

28 atlas Iron Limited Annual Report 200928
Corporate governance statement (cont'd)
basis. The Board has reviewed the independence of each of the directors in office at the date of this report and has determined that two of the four directors are independent. The two directors that are not considered independent are:
Mr David Flanagan as he is an executive director and a •member of management;
Mrs Jyn Sim Baker as she is Group CEO of IMC Resources •(Australia) Pty Ltd, which is a substantial shareholder of the Company.
For the vast majority of decisions made by the Board Mrs Baker brings substantial mining, legal and logistics industry expertise to the Board. The Board considers that the value of this expertise outweighs any issues associated with Mrs Baker not having ‘independent director’ status.
Nominations Committee
The Board has determined that the Company is now of a size and its affairs of such complexity to justify the formation of a Nominations Committee. The charter for the Nominations Committees was approved in September 2008. The role of the Committee is to
assist the Board in relation to the selection and appointment •of members of the Board;
assess and determine the independent status of each •Director, Consider and make recommendations to the Board about the size and composition of the Board;
Implement a plan for identifying, assessing and enhancing •Director competencies to ensure that the Board comprises Directors who possess an appropriate range of skills and expertise;
Regularly review the time required by a Director to •effectively undertake his or her Board responsibilities;
Develop and implement induction procedures to allow •new Directors to participate fully and actively in Board decision-making at the earliest opportunity;
Develop, implement and review the Company 's succession •plans in place for membership of the Board; and
Develop and implement processes for evaluating the •performance of the Board, the Board committees and individual Directors against appropriate measures.
Nominations Committee members are appointed by the Board for a term considered appropriate by the Board. The Board may appoint additional independent non-executive Directors to the Nominations Committee and may remove or replace members of the Nominations Committee by ordinary resolution. The Nominations Committee must comprise a minimum of 3 non-executive Directors, with the majority being independent Directors. The Chairman of the Nominations Committee must be an independent director, and may be the Chairman of the Board. Mr Geoff Clifford, the independent
non executive Chairman of the Board is the current Chairman of the Nominations Committee. The Nominations Committee will meet as often as the Committee members deem necessary in order to carry out the responsibilities of the Nominations Committee. Any Nominations Committee member may convene a meeting of the Nominations Committee.
Remuneration Committee
The Board has determined that the Company is now of a size and its affairs of such complexity to justify the formation of a Remuneration Committee. The charter for the Remuneration Committees was approved in September 2008.
Within the scope of its duties and responsibilities, the Remuneration Committee is generally authorised to:
• consult with and seek any information from anyDirector or officer or employee of the Company who has the opportunity to materially influence the integrity, strategy and operation of the Company and its financial performance, being a Senior Executive or any external party;
obtain (at the Company's expense) financial, legal or •other professional advice from external consultants or specialists it considers necessary to assist the Remuneration Committee in meeting its responsibilities; and
require the attendance of any Company employee at •Remuneration Committee meetings.
Remuneration Committee members are appointed by the •Board for a term considered appropriate by the Board. The Board may appoint additional independent non-executive Directors to the Remuneration Committee and may remove or replace members of the Remuneration Committee by ordinary resolution. The Committee currently comprises of 3 non-executive Directors, with the majority being independent Directors. The Remuneration Committee Charter requires that the Chairman of the Remuneration Committee should, where possible, be an independent director, and should, where possible, not be the Chairman of the Board. The current Chairman of the Remuneration Committee is Mr David Hannon who is an independent director and is not the Chairman of the Board.
The role of the Remuneration Committee is to assist •the Board in developing the Company’s remuneration, recruitment, retention and termination policies. The specific duties and responsibilities of the Remuneration Committee are as follows:
Consider and recommend to the Board a remuneration •policy for executive Directors and Senior Executives
Consider and recommend to the Board a remuneration •framework for the non-executive Directors that is clearly distinguished from that of executive Directors and Senior Executives
Corporate governance statement (cont'd)
atlas Iron Limited Annual Report 2009 29
When making recommendations to the Board, consider •the ASX Corporate Governance Council's guidelines in respect of executive remuneration packages and non-executive director remuneration set out under Principle 8 of the ASX Corporate Governance Principles and Recommendations, and ensure that both cash and equity-based remuneration is structured in accordance with the thresholds and restrictions under the Company's constitution, the ASX Listing Rules and the Corporations Act 2001 (Cth).
Develop, review and make recommendations to the •Board in relation to the Company's policies and practices relating to recruitment, training, retention and promotion, review and appraisal of performance and termination of employment.
Regularly review the succession plans in place for •executive Directors and Senior Executives to ensure that an appropriate balance of skills, experience and expertise is maintained
Ensure the Company carries out its obligations in respect •of superannuation, retirement benefits and other related benefits and entitlements
The Remuneration Committee will, where possible, meet at least twice each year or as often as the Committee members deem necessary in order to carry out the responsibilities of the Committee. Any Committee member may convene a meeting of the Committee.
Independent Professional Advice
Subject to a director not having a conflict of interest on a particular matter, directors have direct access to members of company management and to company information in the possession of management. The Board has determined that individual directors have the right in connection with their duties and responsibilities as directors, to seek independent professional advice at the Company's expense. With the exception of expenses for legal advice in relation to director's rights and duties, the engagement of an outside adviser is subject to prior approval of the Chairman of the Company and this will not be withheld unreasonably.
Conflicts of Interest
The Board regularly reviews any conflicts of interest that may occur and which apply if there is, or may be, a conflict between the personal interests of a director, or the duties a director owes to another company, and the duties the director owes to the Company. A director with an actual or potential conflict of interest in relation to a matter before the Board does not receive the Board papers relating to that matter and when the matter comes before the Board for discussion, the director withdraws from the meeting for the period the matter is considered and takes no part in the discussions or decision-making process. Minutes reporting on matters in which a director is considered to have a conflict of interest are
not provided to that director. However, the director is given notice of the broad nature of the matter for discussion and is updated in general terms on the progress of the matter.
The Company’s Code of Conduct requires that all business transactions must be conducted solely in the best interests of the Company. Employees must avoid situations where their personal interests could conflict with the interests of the Company. A conflict of interest exists where loyalties are divided. A person can have a potential conflict of interest if, in the course of their employment or engagement with the Company, any decision they make could provide for an improper gain or benefit to themselves or an associate. A conflict of interest may be defined as an issue that may occur when personal interests, the interests of an associate or relative or a duty or obligation to some other person or entity, conflict with a person’s duty or responsibility to the Company. Employees must notify their manager, the chief executive officer or company secretary if the individual suspects that there is a conflict of interest or a potential conflict of interest.
Directors Retirement and Re-election
Non-executive directors must retire at the third Annual General Meeting (AGM) following their election or most recent re-election. At least one non-executive director must stand for election at each AGM. Any director appointed to fill a casual vacancy since the date of the previous AGM must submit themselves to shareholders for election at the next AGM. Board support for a director’s re-election is not automatic and is subject to satisfactory director performance
CONTiNUOUs REviEw Of CORPORATE gOvERNANCEDirectors consider, on an ongoing basis, how management information is presented to them and whether such information is sufficient to enable them to discharge their duties as directors of the Company. Such information must be sufficient to enable the directors to determine appropriate operating and financial strategies from time to time in light of changing circumstances and economic conditions. The directors recognise that mineral exploration, mine development and mining production are inherently risky business activities and that operational strategies adopted should, notwithstanding, be directed towards improving or maintaining the net worth of the Company.
EThiCAL sTANDARDs – CODE Of CONDUCTThe Company has introduced a formal Code of Conduct as per Recommendation 3.1. This code outlines how the Company expects its directors and employees and those of its related bodies corporate to behave and conduct business in the workplace on a range of issues. The Company is committed to the highest level of integrity and ethical standards in all business practices. Directors and employees must conduct themselves in a manner consistent with current

30 atlas Iron Limited Annual Report 200930
Corporate governance statement (cont'd)
community and corporate standards and in compliance with all legislation. The objective of the Code of Conduct is to provide a benchmark for professional behaviour throughout the Company, support the Company’s business reputation and corporate image within the community; and make directors and employees aware of the consequences if they breach the Code of Conduct.
The Company aims to maintain the highest standard of ethical behaviour in business dealings and to behave with integrity in all its dealings with customers, clients, shareholders, government, employees, suppliers and the community. Directors and employees are expected to perform their duties in a professional manner and act with the utmost integrity and objectivity, striving at all times to enhance the reputation and performance of the Company. This should involve as a minimum acting within applicable laws, particularly those that deal with matters covered by this code, including equal opportunity and anti¬discrimination laws, acting with courtesy, acting with fairness and respect in supervision, encouraging cooperation, fostering an environment where rational debate is encouraged, with a view to achieving shared goals, avoiding behaviour that might reasonably be perceived as bullying or intimidation and understanding and responding to the needs of the Company’s broader stakeholders including the community at large.
The Company is committed to maintaining a healthy and safe working environment for its Employees. All appropriate laws and internal regulations (including occupational health and safety laws) must be fully complied with. The Company will take into account the impact of health and safety issues when making business decisions and must ensure that business decisions do not compromise the commitment to avoiding injury to people. In addition, the Board subscribes to the Statement of Ethical Standards as published by the Australian Institute of Company Directors.
PRivACy POLiCyThe Company has a formal Privacy Policy. The Company is committed to respecting the privacy of stakeholders’ personal information. This Privacy Policy sets out its personal information management practices and covers the application of privacy laws, personal information collection, the use and disclosure of personal information, accessing and updating stakeholders’ information and the security of stakeholders’ information.
Other than the introduction of a formal Privacy Policy and a formal Code of Conduct, the Board has not adopted any additional formal codes of conduct to guide compliance with the Company’s legal and other obligations to legitimate stakeholders as per Principle 3.
DiRECTORs’ AND EmPLOyEEs’ DEALiNgs iN COmPANy shAREsThe Company has formal Guidelines for Dealing Securities
policy as per Recommendation 3.2. This policy applies to directors, employees and contractors of the Company. In addition, directors must notify the Australian Securities Exchange Limited of any acquisition or disposal of shares by lodgement of a Notice of Director’s Interests. Appropriate approvals and notification systems and procedures are set out in the Guidelines for Dealing Securities policy. Board policy is to prohibit Directors and employees from dealing in shares of the Company whilst in possession of price sensitive information. Any non-compliance with the Company’s Guidelines in Dealing Securities policy will be regarded as serious misconduct which may entitle the Company to terminate the employment of any employee found to be in breach of this policy.
CONTiNUOUs DisCLOsURE AND shAREhOLDER COmmUNiCATiONThe Company has a formal Continuous Disclosure and Information Policy as per Recommendation 5.1. This policy is reviewed periodically and was last updated and approved by the Board on 11 March 2009. The policy ensures that material price sensitive information is identified and reported to Management for release, the Company achieves best practice in complying with its continuous disclosure obligations under the Corporations Act and ASX Listing Rules and ensuring the Company and individual officers do not contravene the Corporations Act or ASX Listing Rules. The Board aims to ensure that the shareholders, on behalf of whom they act, are informed of all information necessary to assess the performance of the Directors. Information is communicated to shareholders through:-
the Annual Report which is distributed to all •shareholders,
Half-Yearly Reports, Quarterly Reports, and all Australian •Securities Exchange announcements which are posted on the Company’s website, the Annual General Meeting and other general meetings so called to obtain approval for Board action as appropriate,
compliance with the continuous disclosure requirements •of the Australian Securities Exchange Listing Rules.
In addition, the Company’s auditor is required to be present, and be available to shareholders, at the AGM.
AUDiT & Risk COmmiTTEE AND AUDiT & Risk COmmiTTEE ChARTERThe role of the Audit & Risk Committee is to assist the Board to meet its oversight responsibilities in relation to the Company’s financial reporting, compliance with legal and regulatory requirements, internal control structure, risk management procedures and the internal and external audit functions. Key activities undertaken by the Audit & Risk Committee during the year included:
approval of the scope, plan and fees for the 2009 external •audit;

Corporate governance statement (cont'd)
atlas Iron Limited Annual Report 2009 31
review of the independence and performance of the •external auditor;
review of significant accounting policies and practices; •
review of the Company’s key risks and risk management •framework as developed by management;
review of reports from management on the effectiveness •of the Company’s management of its material business risks; and
review and recommendation to the Board for the •adoption of the Company’s half year and annual financial statements.
The external auditors, the Chairman, the Managing Director and the Chief Financial Officer attend Audit & Risk Committee meetings by invitation. At each Audit & Risk Committee meeting, time is scheduled for the Audit & Risk Committee to meet with the external auditors.
One of the key objectives of the Board is to ensure timely, transparent and accurate communication with all Shareholders and compliance with all regulatory requirements. To this effect on 26 September 2006 the Board established an Audit & Risk Committee as required by Recommendation 4.1, whose primary function will be to give additional assurance regarding the quality and reliability of financial information used by the Board and financial information provided by the Company pursuant to its statutory reporting requirements. The Audit & Risk Committee is comprised of three directors, Jyn Sim Baker, Geoff Clifford and David Hannon. Geoff Clifford and David Hannon are considered independent directors. All three members of the Audit & Risk Committee are non-executive Directors. On 1 December 2008, Mr Geoff Clifford, an independent non executive director, became Chairman of the Board. As a result, Mr Clifford resigned as Chairman of the Audit & Risk Committee. Mr Hannon was appointed Chairman of the Audit & Risk Committee. Mr Hannon is considered an independent director.
On 26 September 2006, the Company approved a formal Audit & Risk Committee Charter as required by Recommendation 4.3. This Charter was introduced to ensure the Company achieves best practice in safeguarding the integrity of the Company’s financial reporting. The Charter is reviewed on a regular basis by the Board and the Audit & Risk Committee.
As required by Recommendation 7.1 the Company has established policies for the oversight and management of material business risks. During the year, the Company has reviewed, amended and updated its formalised policies on risk management. The Board recognises its responsibility for identifying areas of significant material business risks and for ensuring that arrangements are in place for adequately managing these risks. Material business risks are regularly reviewed at Board meetings and a risk management culture is practiced by employees and contractors. Determined areas of risk which are regularly considered include performance
and funding of exploration, development and operations activities, budget control and asset protection, status of mineral tenements, land access and native title considerations, compliance with government laws and regulations, safety, the environment, continuous disclosure obligations and privacy.
In September 2008, the Board approved a Financial Risk Management Policy. The purpose of this Financial Risk Management Policy is to establish an integrated financial risk management framework and procedures for the efficient management of the Company’ financial price risks that arise through its iron ore mining activities. This policy outlines the objectives of the risk management activity undertaken by Atlas and details the procedures and parameters that govern these activities. A sound Financial Risk Management Policy is essential to ensure all financial and commodity price risks are fully recognised, managed and recorded in a manner consistent with the Board’ management philosophy, commonly accepted industry practise and corporate governance and shareholders expectations of an iron ore producer. These issues will be addressed through the continuing evolution of this Financial Risk Management Policy, which is to be reviewed annually.
During the year the Risk Management Plan was updated, further developed, reviewed by the Audit and Risk Committee and approved by the Board. The Risk Management process followed was in accordance with the Australian and New Zealand Risk Management Standards. The Company has reviewed, amended and updated its formalised policies on risk management. The Risk Register and Treatment Plan was updated and further developed with analysis conducted on all risks with a rating of high-medium and above.
AsX PRiNCiPLEs Of gOOD CORPORATE gOvERNANCEAs previously stated, in August 2008, the Company decided to review all its corporate governance practices and policies in light of the publication of the 2nd Edition of ASX Corporate Governance Council’s Principles of Good Corporate Governance and Best Practice Recommendations with a view to ensuring the Company’s corporate governance practices and policies are up to date and reflect the Company’s current stage of development as well as accommodating the Company’s future growth. As mentioned above, this review has resulted in the formation of the Remuneration Committee and the Nomination Committee as well as charters for these two Board committees. In addition the Company’s Continuous Disclosure and Information Policy has been updated to comply with best practice. As the Company's activities continue to develop in size, nature and scope, the size of the Board and the implementation of any additional formal corporate governance committees and policies will be given further due consideration.
The following table sets out the Company's present position with regard to adoption of these principles.

32 atlas Iron Limited Annual Report 200932
Corporate governance statement (cont'd)
ASX Principle Status Reference/comment
Principle 1: Lay solid foundations for management and oversight
1.1 Formalise and disclose the functions reserved to the Board and those delegated to senior executives and disclose those roles
A
1.2 Disclose the process for evaluating the performance of senior executives
A
1.3 Provide the information indicated in Guide to reporting on Principle 1
A
Principle 2: Structure the Board to add value
2.1 A majority of Board members should be independent directors
A (in part)
Up to 20 November 2008, the Company complied with recommendation 2.1. The Board now comprises four directors, three of whom are non-executive (including the chairman) and two are independent (including the chairman). The Company is currently considering a number of candidates to act as an independent non executive director. Following such an appointment, the Company will comply with Recommendation 2.1.
2.2 The chairperson should be an independent director
A
2.3 The roles of chairperson and chief executive officer should not be exercised by the same individual
A The positions of chairman and managing director are held by separate persons.
2.4 The Board should establish a nomination committee
A The Board has formed a Nominations Committee which is in compliance with Recommendation 2.4. In September 2008, the Board approved a Nominations Committee Charter.
2.5 Disclose the process for evaluating the performance of the Board, its committees and individual directors
A
2.6 Provide the information indicated in Guide to reporting on Principle 2
A (in part)
The skills and experience of directors are set out in the Company’s annual report and on its website.
The Company, cognisant of its growth from explorer to developer and producer, is developing policies and procedures to reflect its position as an evolving iron ore producer. As a result, during the year, the Board approved the formation of a nominations committee and a nominations committee Charter.
Principle 3: Promote ethical and responsible decision making
3.1 Establish a code of conduct and disclose the code or a summary of the code as to:
A The Company has formulated a code of conduct which can be viewed on the Company’s website. This code of conduct was updated on 14 June 2007.
- the practices necessary to maintain confidence in the Company’s integrity
The Company has a formal Privacy Policy which can be viewed on the Company’s website.
-the practices necessary to take into account their legal obligations and the reasonable expectation of stakeholders
-the responsibility and accountability of individuals for reporting and investigating reports of unethical practices
3.2 Establish a policy concerning trading in company securities by directors, senior executives and employees and disclose the policy or a summary of the policy
A The Company has formulated a Dealing in Securities trading policy which can be viewed on its website.
A = Adopted N/A = Not adopted

Corporate governance statement (cont'd)
atlas Iron Limited Annual Report 2009 33
ASX Principle Status Reference/comment
Principle 3: (continued)
Promote ethical and responsible decision making
3.3 Provide the information indicated in Guide to Reporting on Principle 3
A
Principle 4: Safeguard integrity in financial reporting
4.1 The Board should establish an audit committee
A The Company has established an Audit & Risk Committee which comprises three non-executive directors, two of who are independent directors. The chairman is an independent director who is not Chairman of the Board.
4.2 The audit committee should be structured so that it:
A
- consists only non-executive directors
- consists of a majority of independent directors
- is chaired by an independent chairperson, who is not the chairperson of the Board has at least three members
4.3 The audit committee should have a formal charter
A The charter for this Audit & Risk Committee is disclosed on the Company’s website.
4.4 Provide the information indicated in Guide to reporting on Principle 4
A
Principle 5: Make timely and balanced disclosure
5.1 Establish written policies designed to ensure compliance with ASX Listing Rule disclosure requirements and to ensure accountability at a senior management level for that compliance and disclose those policies or a summary of those policies
A The Company has a formal continuous disclosure and information policy which can be viewed on its website.
5.2 Provide the information indicated in Guide to reporting on Principle 5
A
A = Adopted N/A = Not adopted
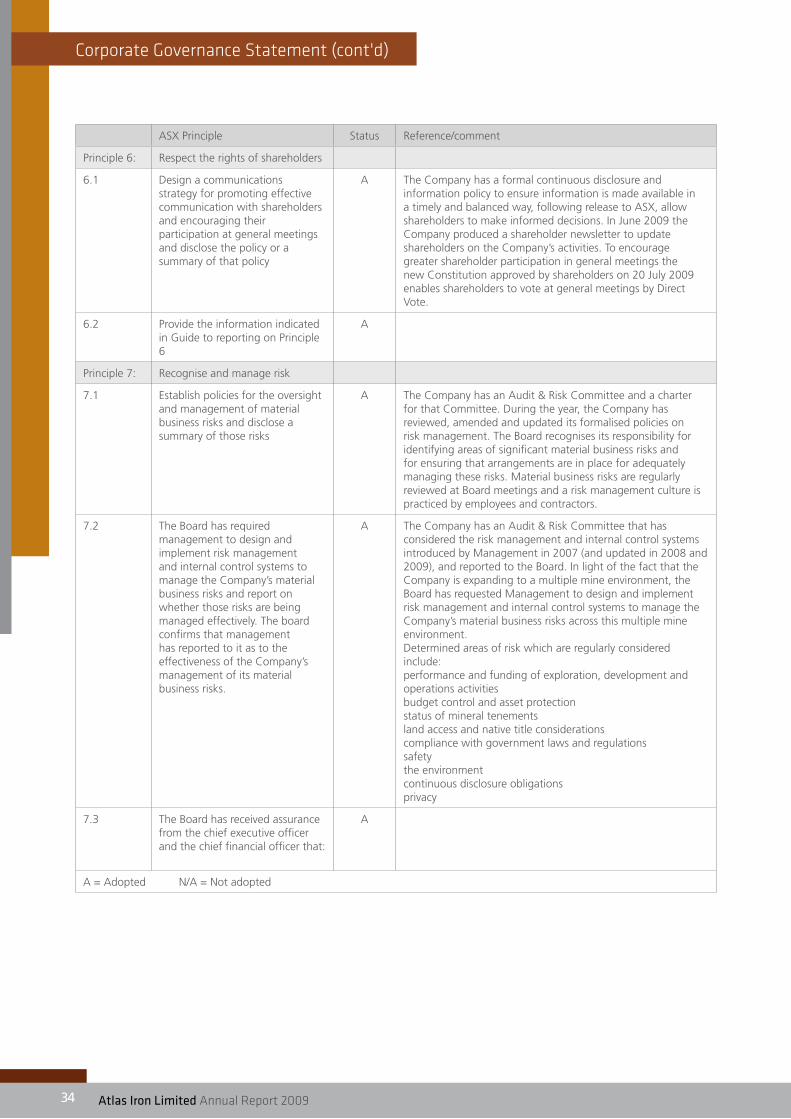
34 atlas Iron Limited Annual Report 200934
Corporate governance statement (cont'd)
ASX Principle Status Reference/comment
Principle 6: Respect the rights of shareholders
6.1 Design a communications strategy for promoting effective communication with shareholders and encouraging their participation at general meetings and disclose the policy or a summary of that policy
A The Company has a formal continuous disclosure and information policy to ensure information is made available in a timely and balanced way, following release to ASX, allow shareholders to make informed decisions. In June 2009 the Company produced a shareholder newsletter to update shareholders on the Company’s activities. To encourage greater shareholder participation in general meetings the new Constitution approved by shareholders on 20 July 2009 enables shareholders to vote at general meetings by Direct Vote.
6.2 Provide the information indicated in Guide to reporting on Principle 6
A
Principle 7: Recognise and manage risk
7.1 Establish policies for the oversight and management of material business risks and disclose a summary of those risks
A The Company has an Audit & Risk Committee and a charter for that Committee. During the year, the Company has reviewed, amended and updated its formalised policies on risk management. The Board recognises its responsibility for identifying areas of significant material business risks and for ensuring that arrangements are in place for adequately managing these risks. Material business risks are regularly reviewed at Board meetings and a risk management culture is practiced by employees and contractors.
7.2 The Board has required management to design and implement risk management and internal control systems to manage the Company’s material business risks and report on whether those risks are being managed effectively. The board confirms that management has reported to it as to the effectiveness of the Company’s management of its material business risks.
A The Company has an Audit & Risk Committee that has considered the risk management and internal control systems introduced by Management in 2007 (and updated in 2008 and 2009), and reported to the Board. In light of the fact that the Company is expanding to a multiple mine environment, the Board has requested Management to design and implement risk management and internal control systems to manage the Company’s material business risks across this multiple mine environment.Determined areas of risk which are regularly considered include:performance and funding of exploration, development and operations activitiesbudget control and asset protectionstatus of mineral tenementsland access and native title considerationscompliance with government laws and regulationssafetythe environmentcontinuous disclosure obligationsprivacy
7.3 The Board has received assurance from the chief executive officer and the chief financial officer that:
A
A = Adopted N/A = Not adopted
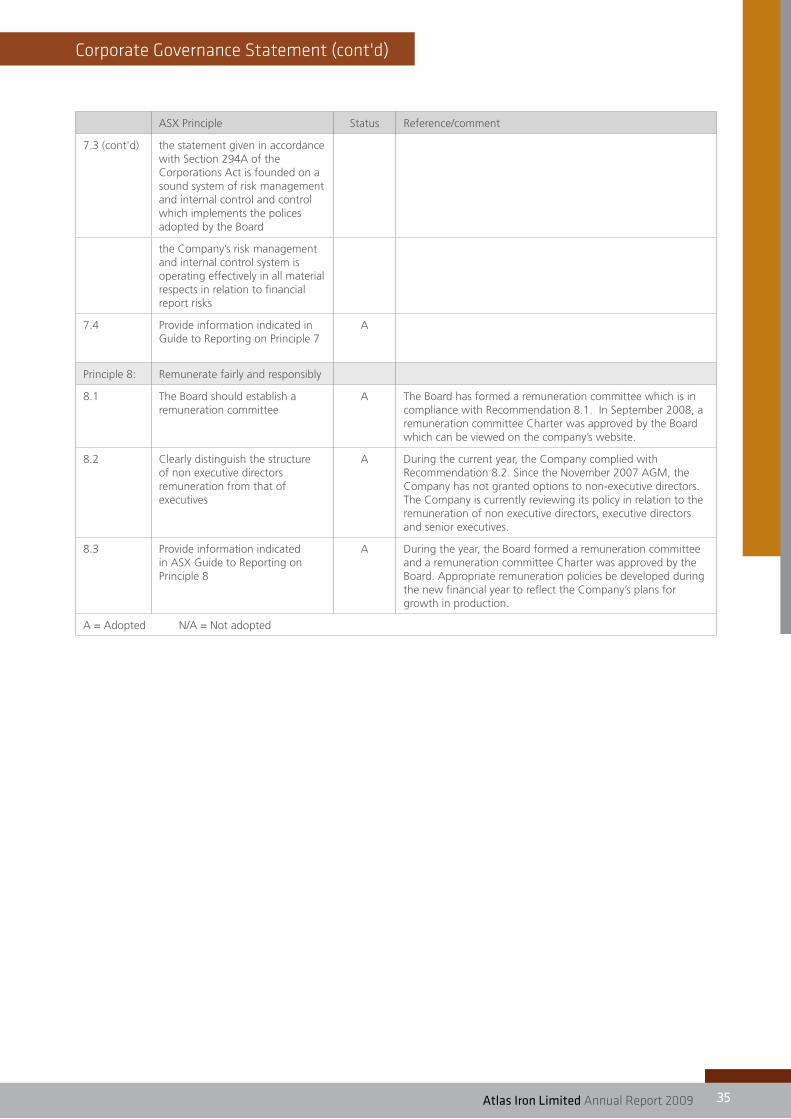
Corporate governance statement (cont'd)
atlas Iron Limited Annual Report 2009 35
ASX Principle Status Reference/comment
7.3 (cont'd) the statement given in accordance with Section 294A of the Corporations Act is founded on a sound system of risk management and internal control and control which implements the polices adopted by the Board
the Company’s risk management and internal control system is operating effectively in all material respects in relation to financial report risks
7.4 Provide information indicated in Guide to Reporting on Principle 7
A
Principle 8: Remunerate fairly and responsibly
8.1 The Board should establish a remuneration committee
A The Board has formed a remuneration committee which is in compliance with Recommendation 8.1. In September 2008, a remuneration committee Charter was approved by the Board which can be viewed on the company’s website.
8.2 Clearly distinguish the structure of non executive directors remuneration from that of executives
A During the current year, the Company complied with Recommendation 8.2. Since the November 2007 AGM, the Company has not granted options to non-executive directors. The Company is currently reviewing its policy in relation to the remuneration of non executive directors, executive directors and senior executives.
8.3 Provide information indicated in ASX Guide to Reporting on Principle 8
A During the year, the Board formed a remuneration committee and a remuneration committee Charter was approved by the Board. Appropriate remuneration policies be developed during the new financial year to reflect the Company’s plans for growth in production.
A = Adopted N/A = Not adopted

36 atlas Iron Limited Annual Report 200936
Directors' Report
dIreCtorS’ report
Your directors submit their report for the year ended 30 June 2009.
DiRECTORs The names and details of the Company's directors in office during the financial period and until the date of this report are set out below. Directors were in office for this entire period unless otherwise stated. Where applicable, all directorships held in listed public companies over the last three years have been detailed below.
NAmEs, qUALifiCATiONs, EXPERiENCE AND sPECiAL REsPONsiBiLiTiEsGeoff Clifford (Non Executive Chairman, Chairman of Nomination Committee, Member of the Audit and Risk Committee and Remuneration Committee), B.Bus, FCPA, FCIS
Mr Clifford, a Non Executive Director since 20 August 2007, was elected Non Executive Chairman on 1 December 2008.
From August 2005 until February 2007, Mr Clifford was non executive director of and consultant to Aztec Resources Limited. Prior to his time at Aztec, Geoff was General Manager Administration and Company Secretary of Portman Limited for 8 years. Portman owns and operates the Koolyanobbing iron ore project (7-8 mtpa) and has a 50% interest in the Cockatoo Island iron ore project.
Mr Clifford holds a Bachelor of Business degree from Curtin University and undertook post graduate studies in Administrative and Secretarial Practice. He has more than 30 years experience in senior accounting, finance, administration and company secretarial roles in the mining, retail and wholesale industries.
Mr Clifford is currently a member of the West Australian State Council of Chartered Secretaries Australia, and a non executive director of ASX listed companies Fox Resources Limited, Glengarry Resources Limited and RMA Energy Limited. During the last 3 years Mr Clifford was a non-executive director of Jupiter Energy Limited, resigning on 8 November 2006.
David Flanagan, B.Sc WASM, AICD, MAusIMM (Managing Director)
Mr Flanagan is a geologist with extensive experience in mining operations, exploration and project development in Western Australia, Indonesia and West Africa. Graduating in 1993 David joined Resource Service Group (RSG) in 1995 after working for Normandy at the Fimiston Open Pit Operations.
Whilst with RSG he was seconded to Gencor's Bogosu
operation as Chief Exploration Geologist. Under his leadership at Bogosu the exploration team discovered and developed the Chujah deposits (0.5 moz Au).
Whilst at RSG David also worked in an auditing capacity providing independent geological verification for financial institutions. In 1999 David joined Gindalbie, holding the position of Exploration manager from 2001. At Minjar, Mr Flanagan managed several scoping and feasibility studies advancing the company’s understanding of its iron ore potential. Mr Flanagan left Gindalbie in 2004 to list and advance Atlas in the role of Managing Director. During the last 3 years Mr Flanagan was a non-executive director of Shaw River Resources Limited, resigning on 19 February 2009.
David Hannon, B.Ec, (Non Executive Director, Chairman of Audit and Risk Committee and Remuneration Committee and Member of Nomination Committee)
Mr Hannon commenced his commercial career as a stockbroker in 1985 working with several firms including Jackson Securities and BT Securities. He later became a joint partner of a private investment bank specialising in venture capital with a focus on the mining sector.
In 2001 Mr Hannon became a director of PSG Afro Pacific Limited, a subsidiary of a listed South African Bank which further concentrated on the mining sector. Since leaving PSGAPL David has operated a private investment bank Chifley Investor Group Pty Limited. Mr Hannon has not held any other directorships in the last 3 years.
Jyn Sim Baker LLB, CLP, ICSA, MACID (Non Executive Director, Member of the Audit and Risk Committee, Remuneration Committee and Nomination Committee)
Ms Baker was appointed 13 November 2006. She is Group Chief Executive Officer of IMC Group’s wholly owned IMC Resources Group, which is the major shareholder of Atlas Iron Limited.
Ms Baker has more than 20 years experience in the resources and energy sector including law, project finance banking, mergers and acquisitions and more recently as Managing Director of Midwest Corporation.
Ms Baker is currently a director of Kairiki Energy Limited and LinQ Capital Limited, an alternate director of Horizon Oil Limited and a former director of Midwest Corporation Limited and View Resources Limited.
David Nixon B.Sc Eng, MAICD
Mr Nixon was Non Executive Chairman and member of audit committee until 21 November 2008.

atlas Iron Limited Annual Report 2009 37
Directors' Report (cont'd)
COmPANy sECRETARiEs Anthony Walsh, B.Comm, MBA, CA, FCIS
Mr Walsh was appointed on 1 July 2006. He has 20 years experience in dealing with listed companies, 14 years with the ASX where he recently held the role of Assistant Manager and acted as ASX liaison with the JORC committee. Prior to the role at ASX he worked with Ernst & Young for 5 years in an audit and compliance capacity.
Mark Hancock, BBus, CA, FFin
Mr Hancock was appointed Joint Company Secretary on 4 July 2008. He has more than 20 years experience in senior financial roles across a number of leading Australian and international companies including Lend Lease Corporation Ltd, Woodside Petroleum Ltd and Premier Oil plc.
Interests in the shares and options of the Company and related bodies corporate
As at the date of this report, the interests of the directors in the shares and options of Atlas Iron Limited were:
Ordinary Shares Options over Ordinary Shares
Geoff Clifford 50,000 500,000
David Flanagan 210,000 8,500,000
David Hannon 2,054,668 1,500,000
Jyn Sim Baker 17,985 500,000
DiviDENDsNo dividends were paid or declared during the financial year. No recommendation for payment of dividends has been made.
CORPORATE iNfORmATiON Nature of operations and principal activities
The Group received final regulatory approval for its 100% owned Pardoo Direct Shipping Ore (“DSO”) project in October 2008 and immediately commenced production, with the first cargo delivered to China just over two months later in December 2008. By 30 June 2009 the company had shipped 432,518 wet metric tonnes to its Chinese customers.
The company also continued to aggressively explore and evaluate its other DSO projects, with a particular focus on the Wodgina, Mt Webber and Abydos areas. During July 2009 the Board endorsed Wodgina as the Group’s next mine, with production scheduled to commence early in 2010 subject to receipt of timely regulatory approvals.
In addition to its DSO projects, considerable progress was made on the Ridley magnetite project, with a two billion tonne resource announced and the pre feasibility study completed. Attention is now focused on identification of a joint venture partner to assist in completing the definitive feasibility study and funding of project development.
EmPLOyEEsThe Group employed 61 employees as at 30 June 2009 (2008: 42 employees).
OPERATiNg AND fiNANCiAL REviEw
fiNANCE REviEw The Group began the financial year with cash reserves of $143,350,098. Major cash inflows for the year were $72,385,308 from the issue of shares, $25,353,839 from iron ore sales and $6,996,716 in interest received. Major outflows for the period were operating, administration and port prepayment costs of $41,596,699, exploration and evaluation costs for the Ridley magnetite and DSO operations of $51,849,289 and Pardoo development costs for stage 1 and commencement of stage 2 totalling $19,894,656.
At 30 June 2009 cash available totalled $124,350,378.
The group made a net loss for the year of $63,144,143 (2008: $38,342,002), with the major expense item being exploration and evaluation expenditure totalling $52,296,291. In line with the Group’s accounting policies, all exploration and evaluation expenditure other than acquisition costs was written off at year end.

38 atlas Iron Limited Annual Report 200938
Directors' Report (cont'd)
OPERATiNg REsULTs fOR ThE yEARSummarised operating results are as follows:
2009
Revenues $
Results $
Geographic segment
Australia 26,427,892 (63,144,143)
Revenues and loss before income tax expense 26,427,892 (63,144,143)
Shareholder Returns
2009 2008
Basic loss per share (cents) (21.3) (17.9)
Risk mANAgEmENTThe Board is responsible for ensuring that risks, and also opportunities, are identified on a timely basis and that activities are aligned with the risks and opportunities identified by the Board.
An Audit & Risk Committee exists to assist the Board in identifying and managing risk. The Audit & Risk Committee has a number of mechanisms in place to ensure that management's objectives and activities are aligned with the risks identified. These include the following:
• Boardapprovalof a strategicplan,whichencompasses strategy statementsdesigned tomeet stakeholdersneedsandmanage business risk.
• Implementation of Board approved operating plans and budgets and Board monitoring of progress against thesebudgets.
• Preparationofariskregisterandongoingmonitoringofthestatusofkeyrisks.
sigNifiCANT ChANgEs iN ThE sTATE Of AffAiRsNo significant changes in the state of affairs of the Group occurred during the financial year other than as discussed in the financial report and elsewhere in this directors’ report.
sigNifiCANT EvENTs AfTER ThE BALANCE DATENo matters or circumstances, besides those disclosed at note 24, have arisen since the end of the financial year which significantly affected or may significantly affect the operations of the Group, the results of those operations, or the state of affairs of the
Group in future financial years.
LikELy DEvELOPmENTs AND EXPECTED REsULTsThe Group plans to continue operations at its Pardoo Direct Shipping Ore project and commence operations at the Wodgina Direct Shipping Ore project during the coming year. The company will also progress exploration and evaluation activities and feasibility studies on its Mt Webber, Abydos and Midwest projects. The company is also undertaking a divestment process of a share in the Group’s Ridley magnetite project.
ENviRONmENTAL REgULATiON AND PERfORmANCEThe Group is subject to significant environmental regulation in respect to its exploration activities.
The Group aims to ensure the appropriate standard of environmental care is achieved, and in doing so, that it is aware of and is in compliance with all environmental legislation. The directors of the Group are not aware of any breach of environmental legislation for the period under review.

atlas Iron Limited Annual Report 2009 39
Directors' Report (cont'd)
SHARE OPTIONS
Unissued sharesAt the date of this report there are 39,230,000 unissued ordinary shares in respect of which options are outstanding.
Number of options
Balance at the beginning of the period 48,844,771
Share options issued during the period
Exercisable at $4.08 Options exp 30 Jun 2013 125,000
Exercisable at $4.62 Options exp 30 Jun 2013 125,000
Exercisable at $3.06 Options exp 30 Jun 2013 25,000
Exercisable at $3.46 Options exp 30 Jun 2013 25,000
Exercisable at $2.55 on or before 30 September 2012 30,000
Exercisable at $2.85 on or before 30 September 2012 30,000
Exercisable at $2.35 on or before 30 June 2013 50,000
Exercisable at $2.65 on or before 30 June 2013 50,000
Exercisable at $2.30 on or before 30 June 2013 25,000
Exercisable at $2.60 on or before 30 June 2013 25,000
Exercisable at $1.65 on or before 30 September 2013 350,000
Exercisable at $1.85 on or before 30 September 2013 350,000
Exercisable at $1.00 on or before 30 September 2013 25,000
Exercisable at $1.15 on or before 30 September 2013 25,000
Exercisable at $1.10 on or before 30 September 2013 25,000
Exercisable at $1.25 on or before 30 September 2013 25,000
Exercisable at $2.00 on or before 30 September 2013 15,000
Exercisable at $2.25 on or before 30 September 2013 15,000
Exercisable at $1.05 on or before 30 December 2013 25,000
Exercisable at $1.20 on or before 30 December 2013 25,000
Exercisable at $1.35 on or before 30 December 2013 50,000
Exercisable at $1.50 on or before 30 December 2013 50,000
Exercisable at $1.50 on or before 30 December 2013 15,000
Exercisable at $1.70 on or before 30 December 2013 15,000
Exercisable at $0.80 on or before 30 December 2013 40,000
Exercisable at $0.90 on or before 30 December 2013 40,000
Exercisable at $0.55 on or before 30 December 2013 10,000
Exercisable at $0.60 on or before 30 December 2013 10,000
Exercisable at $1.30 on or before 30 December 2013 100,000
Exercisable at $1.65 on or before 31 March 2014 50,000
Exercisable at $1.85 on or before 31 March 2014 50,000
Exercisable at $1.40 on or before 31 March 2014 15,000
Exercisable at $1.60 on or before 31 March 2014 15,000

40 atlas Iron Limited Annual Report 200940
Directors' Report (cont'd)
Number of options
Exercisable at $1.35 on or before 31 March 2014 25,000
Exercisable at $1.50 on or before 31 March 2014 25,000
Exercisable at $1.35 on or before 31 March 2014 25,000
Exercisable at $1.50 on or before 31 March 2014 25,000
Exercisable at $1.65 on or before 31 March 2014 50,000
Exercisable at $1.85 on or before 31 March 2014 50,000
Options exercised (9,995,135)
Options cancelled (964,636)
Total number of options outstanding as at 30 June 2009 39,935,000
Issued subsequent to balance date 400,000
Options exercised (1,105,000)
Options cancelled -
Total number of options outstanding at the date of this report 39,230,000
The balance is comprised of the following:
Expiry Date Exercise Price Number of Options
16 November 2010 $0.20 1,100,000
16 November 2010 $0.25 35,000
24 March 2011 $0.30 3,000,000
24 March 2011 $0.40 3,000,000
22 May 2011 $0.50 450,000
21 July 2011 $0.75 100,000
15 August 2011 $0.60 500,000
15 August 2011 $0.70 650,000
30 November 2009 $0.80 13,560,000
24 March 2011 $0.50 500,000
24 March 2011 $0.60 500,000
31 January 2012 $0.50 300,000
31 January 2012 $0.60 150,000
31 January 2012 $0.70 200,000
5 March 2012 $0.60 50,000
5 March 2012 $0.70 75,000
21 March 2012 $0.70 75,000
31 March 2012 $0.72 2,500,000
28 February 2012 * $0.70 1,800,000
31 May 2012 * $0.60 1,900,000
16 July 2012 $0.96 50,000
16 July 2012 $1.06 50,000
30 September 2012 $2.20 75,000
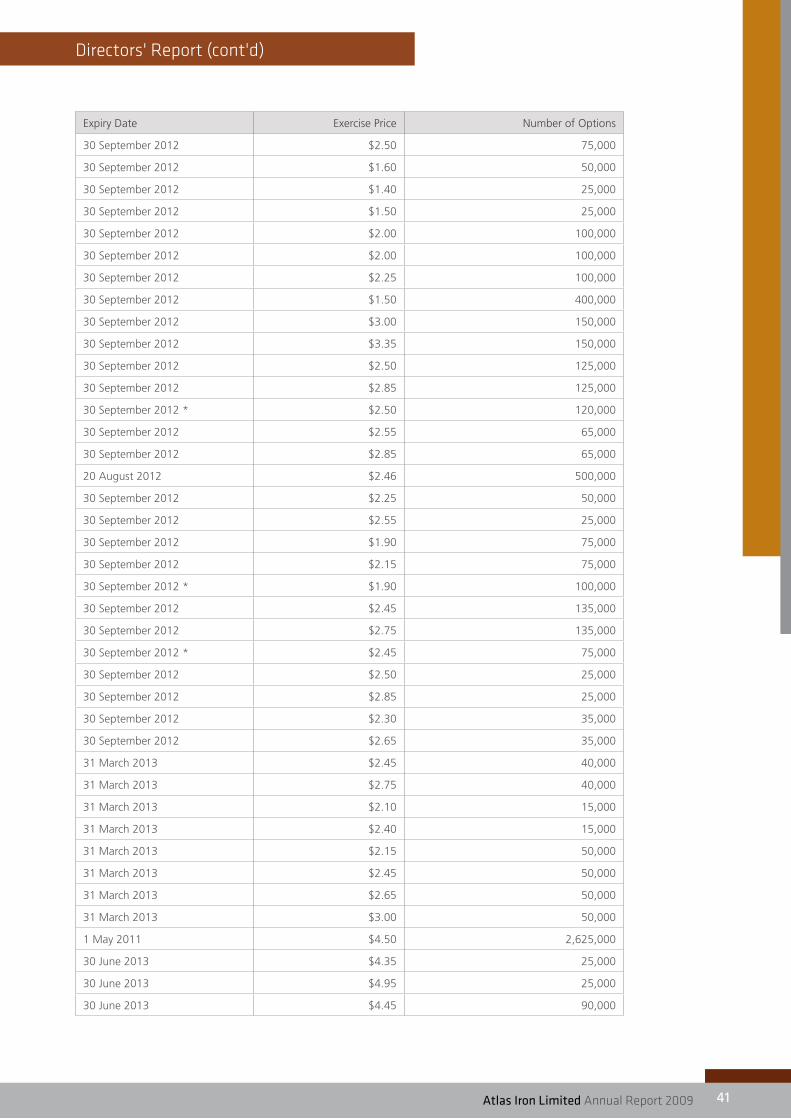
atlas Iron Limited Annual Report 2009 41
Directors' Report (cont'd)
Expiry Date Exercise Price Number of Options
30 September 2012 $2.50 75,000
30 September 2012 $1.60 50,000
30 September 2012 $1.40 25,000
30 September 2012 $1.50 25,000
30 September 2012 $2.00 100,000
30 September 2012 $2.00 100,000
30 September 2012 $2.25 100,000
30 September 2012 $1.50 400,000
30 September 2012 $3.00 150,000
30 September 2012 $3.35 150,000
30 September 2012 $2.50 125,000
30 September 2012 $2.85 125,000
30 September 2012 * $2.50 120,000
30 September 2012 $2.55 65,000
30 September 2012 $2.85 65,000
20 August 2012 $2.46 500,000
30 September 2012 $2.25 50,000
30 September 2012 $2.55 25,000
30 September 2012 $1.90 75,000
30 September 2012 $2.15 75,000
30 September 2012 * $1.90 100,000
30 September 2012 $2.45 135,000
30 September 2012 $2.75 135,000
30 September 2012 * $2.45 75,000
30 September 2012 $2.50 25,000
30 September 2012 $2.85 25,000
30 September 2012 $2.30 35,000
30 September 2012 $2.65 35,000
31 March 2013 $2.45 40,000
31 March 2013 $2.75 40,000
31 March 2013 $2.10 15,000
31 March 2013 $2.40 15,000
31 March 2013 $2.15 50,000
31 March 2013 $2.45 50,000
31 March 2013 $2.65 50,000
31 March 2013 $3.00 50,000
1 May 2011 $4.50 2,625,000
30 June 2013 $4.35 25,000
30 June 2013 $4.95 25,000
30 June 2013 $4.45 90,000
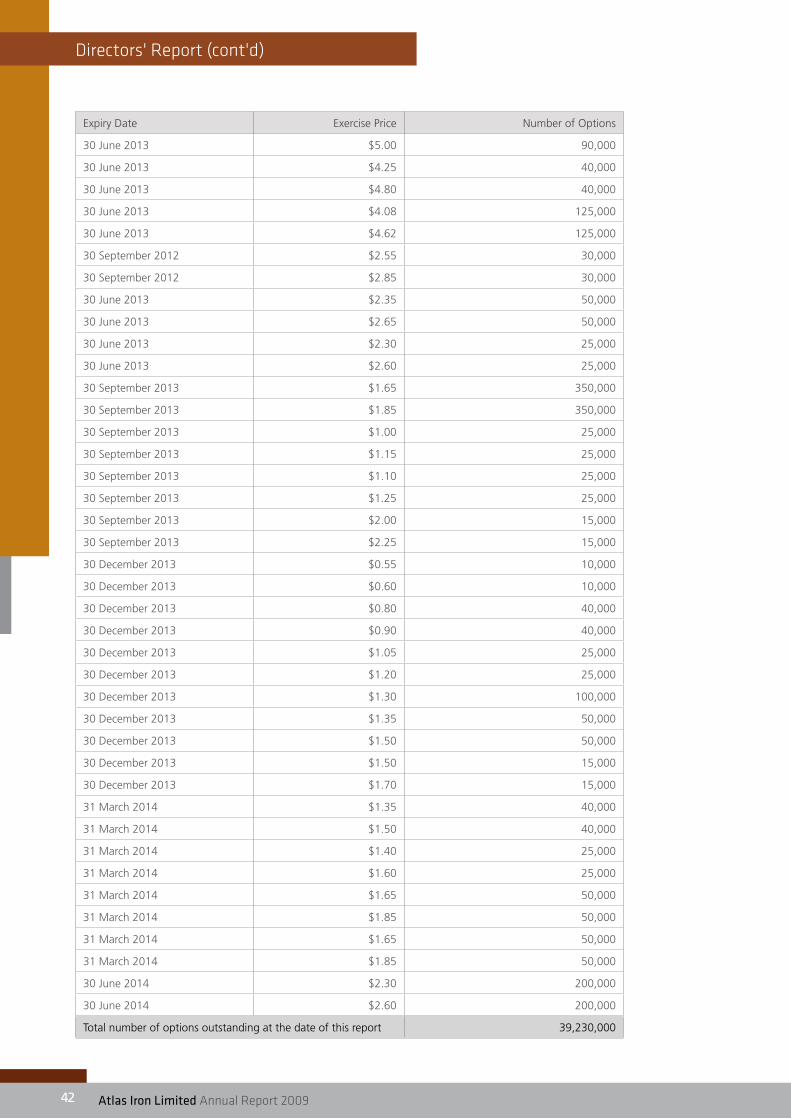
42 atlas Iron Limited Annual Report 200942
Directors' Report (cont'd)
Expiry Date Exercise Price Number of Options
30 June 2013 $5.00 90,000
30 June 2013 $4.25 40,000
30 June 2013 $4.80 40,000
30 June 2013 $4.08 125,000
30 June 2013 $4.62 125,000
30 September 2012 $2.55 30,000
30 September 2012 $2.85 30,000
30 June 2013 $2.35 50,000
30 June 2013 $2.65 50,000
30 June 2013 $2.30 25,000
30 June 2013 $2.60 25,000
30 September 2013 $1.65 350,000
30 September 2013 $1.85 350,000
30 September 2013 $1.00 25,000
30 September 2013 $1.15 25,000
30 September 2013 $1.10 25,000
30 September 2013 $1.25 25,000
30 September 2013 $2.00 15,000
30 September 2013 $2.25 15,000
30 December 2013 $0.55 10,000
30 December 2013 $0.60 10,000
30 December 2013 $0.80 40,000
30 December 2013 $0.90 40,000
30 December 2013 $1.05 25,000
30 December 2013 $1.20 25,000
30 December 2013 $1.30 100,000
30 December 2013 $1.35 50,000
30 December 2013 $1.50 50,000
30 December 2013 $1.50 15,000
30 December 2013 $1.70 15,000
31 March 2014 $1.35 40,000
31 March 2014 $1.50 40,000
31 March 2014 $1.40 25,000
31 March 2014 $1.60 25,000
31 March 2014 $1.65 50,000
31 March 2014 $1.85 50,000
31 March 2014 $1.65 50,000
31 March 2014 $1.85 50,000
30 June 2014 $2.30 200,000
30 June 2014 $2.60 200,000
Total number of options outstanding at the date of this report 39,230,000

atlas Iron Limited Annual Report 2009 43
Directors' Report (cont'd)
No person entitled to exercise any option referred to above have or had, by virtue of the option, a right to participate in any share issue of any other body corporate.
* 100% of these options have been vested subsequent to meeting a performance condition, being commencement of mining and sale of direct shipping ore from the Company’s Pardoo project by 31 December 2008.
iNDEmNifiCATiON AND iNsURANCE Of DiRECTORs AND OffiCERs During the financial year, the Company paid a premium in respect of a contract insuring the directors of the company (as named above), the company secretaries and all executive officers of the company and of any related body corporate against a liability incurred as such a director, secretary or executive officer to the extent permitted by the Corporations Act 2001. The amount of the premium paid was $35,780. The company has not otherwise, during or since the financial year, except to the extent permitted by law, indemnified or agreed to indemnify an officer or auditor of the company or of any related body corporate against a liability incurred as such an officer or auditor.
REmUNERATiON REPORT (AUDiTED)This report outlines the remuneration arrangements in place for directors and other key management personnel of Atlas Iron Limited (the Company).
REmUNERATiON POLiCy Review of Remuneration Strategy
In light of the shareholder vote at the 2008 Annual General Meeting, to ensure that the remuneration structures remain aligned with the business needs and are appropriately positioned relative to the market following significant changes to the Company following the Company’s move from explorer to iron ore producer, the remuneration arrangements for senior executives are being reviewed by the newly formed Remuneration Committee and the Board. In undertaking the review, the Board sought advice from an independent remuneration and incentive advisor on the structure and levels of remuneration to ensure they are market competitive and appropriately performance-oriented. The review included assessing the effectiveness of the current remuneration structure (with particular focus on short and long term incentives), determining how the remuneration structure can best align with the objective of meeting corporate objectives, growing shareholder value over time, and ensuring the reward strategy will continue to be an effective element in attracting and retaining talent.
Non Executive Directors
Atlas’ non-executive directors during the year were:
• GTClifford(Chairman)
• JSBaker
• DHannon
• JDNixon(until21November2008)
Remuneration Policy
Atlas’ Remuneration Policy aims to attract, retain and motivate talented and highly skilled non-executive directors and to remunerate fairly and responsibly having regard to:
• theleveloffeespaidtonon-executivedirectorsrelativetoother similarly sized Australian mining companies;
• thesizeandcomplexityofAtlas’operations;and
• the responsibilities and work requirements of Boardmembers.
Fees paid to non-executive directors are recommended to the Board based on advice from external remuneration consultants and determined by the Board, subject to an aggregate limit of $500,000 per financial year, approved by shareholders at the 2007 Annual General Meeting (AGM).
While all directors are encouraged to hold shares in the Company the Board has not introduced a minimum shareholding guideline for non-executive directors. At the date of this report, all non executive directors hold shares in the Company.
Remuneration structure
Non-executive director remuneration consists of base fees and statutory superannuation contributions (currently 9%). Currently non-executive directors do not receive additional committee fees or other payments for additional services outside the scope of Board and committee duties. Non-executive directors are not entitled to any form of performance-linked or equity based remuneration.
In addition to these fees, non-executive directors are entitled to reimbursement of reasonable travel, accommodation and other expenses incurred attending meetings of the Board, committees or shareholders, or while engaged on Atlas business. Non-executive directors are not entitled to compensation on termination of their directorships.
Board fees are not paid to the Managing Director, as the time spent on Board work and the responsibilities of Board membership are considered in determining the remuneration package provided as part of his normal employment conditions. The total remuneration paid to, or in respect of, each non-executive director during the year is set out in this report.

44 atlas Iron Limited Annual Report 200944
Directors' Report (cont'd)
Executives
The executive remuneration policy and structure discussed in this report applies to all Atlas senior executives. The specific remuneration disclosures in this report are provided for the following executives:
• DN Flanagan, Managing Director and Chief ExecutiveOfficer
• MDHancock,ChiefFinancialOfficer
• KEBrinsden,OperationsManager
• AMWalsh,CompanySecretary
• GPlowright,ApprovalsManager
• APaterson,GeologyManager
Remuneration Policy
Atlas’ Remuneration Policy aims to reward executives fairly and responsibly in accordance with the Australian market and ensure that Atlas:
• provides competitive rewards that attract, retain andmotivate executives of the highest calibre;
• setsdemanding levelsofperformancewhichareclearlylinked to an executive’s remuneration;
• structures remuneration at a level that reflects theexecutive’s duties and accountabilities and is competitive within Australia and, for certain roles, internationally;
• benchmarksremunerationagainstappropriatecomparatorgroups, generally targeting at the 50th percentile;
• aligns executive incentive rewards with the creation ofvalue for shareholders; and
• complies with applicable legal requirements andappropriate standards of governance.
Executive remuneration is reviewed annually having regard to advice from external remuneration consultants, individual and business performance relevant comparative information and expert advice from both internal and independent external sources.
Executive remuneration and company performance
A Remuneration Committee was formed during the year and this committee recommends to the Board. The Atlas Board is continually seeking to strengthen the link between executive remuneration and Atlas’ performance. In light of the Company’s development from a mining exploration company to an iron ore producer during the year, the Board is considering the introduction of a Short Term Incentive Program (STIP) and a Long Term Incentive Program (LTIP) as an integral part of Atlas’ overall approach to performance-based
remuneration. It is proposed that under the STIP, the variable or ‘at risk’ element of executive remuneration will be linked to financial and non-financial performance measures aimed at aligning remuneration with shareholder wealth.
The Board is considering the introduction of a STIP where the STI component would be determined by the outcome of the performance scorecard (Scorecard) which is set and approved annually by the Board, and individual performance.
It is proposed that this Scorecard be based on five measures:
• Health,safetyandenvironment–basedontotalrecordablecase frequency;
• productiontargets;
• resourcegrowthtargets;
• operatingexpendituretargets;and
• Atlas’oneyeartotalreturntoshareholders,rankedwithina peer group based on the growth in the value of shares over the performance year, less new equity subscribed.
There are a number of internal and external factors relevant to Atlas’ performance since it listed on ASX in December 2004. In addition, the Board believes Atlas ’ performance is also attributable to the ability to motivate and retain its executives and the effectiveness of the remuneration policies Atlas has in place over that time.
Remuneration structure
Atlas’ remuneration structure for executives has two components:
• FixedAnnualRemuneration-the‘notatrisk’component(unrelated to performance) which includes base salary, superannuation contribution and other allowances. This fixed remuneration is determined on the basis of the scope of the executive’s role, advice from external remuneration consultants and the individual level of knowledge, skill and experience.
• Variable Annual Remuneration – as mentioned aboveIn light of the Company’s development from a mining exploration company to an iron ore producer during the year, the Board is considering the introduction of a STIP and a LTIP as an integral part of Atlas’ overall approach to performance-based remuneration. This would be the ‘at risk’ component (related to performance) which includes a short term incentive (STI) and a long term incentive (LTI). The Board is considering allowing Executives to be eligible to receive a Variable Annual Remuneration allocation based on a percentage of their Fixed Annual Remuneration, as determined by the Board with reference to market comparator groups, advice from external remuneration consultants and the scope of the executive’s role.
atlas Iron Limited Annual Report 2009 45
Directors' Report (cont'd)
In addition, executive remuneration may, subject to Board approval, include participation in equity based retention plans or general employee share plans.
The remuneration policy of Atlas Iron Limited has been designed to align director and executive objectives with shareholder and business objectives by providing a fixed remuneration component and offering specific long-term incentives based on key performance areas affecting the Group’s financial results. The Board of Atlas Iron Limited believes the remuneration policy to be appropriate and effective in its ability to attract and retain the best executives and directors to run and manage the Group.
The Board’s policy for determining the nature and amount of remuneration for Board members and senior executives of the Group is as follows:
The remuneration policy, setting the terms and conditions for the executive directors and other senior executives, was developed by the Board. All executives receive a base salary (which is based on factors such as length of service and experience) and superannuation. The Board reviews executive packages annually by reference to the Group’s performance, executive performance and comparable information from industry sectors and other listed companies in similar industries.
The Board may exercise discretion in relation to approving incentives, bonuses and options. The policy is designed to attract the highest calibre of executives and reward them for performance that results in long-term growth in shareholder wealth.
Executives are also entitled to participate in the employee option arrangements.
The executive directors and executives receive a superannuation guarantee contribution required by the government (currently 9%) and do not receive any other retirement benefits.
All remuneration paid to directors and executives is valued at the cost to the Group and expensed. Shares are not given to directors and executives as part of their remuneration. Options are valued using either the Black Scholes or Binomial methodologies.
The Board policy is to remunerate non executive directors at market rates for comparable companies for time, commitment and responsibilities. The Board determines payments to the non executive directors and reviews their remuneration annually, based on market practice, duties and accountability. Independent external advice is sought when required. The maximum aggregate amount of fees that can be paid to non executive directors is subject to approval by shareholders at the Annual General Meeting (currently $500,000). Fees for non executive directors are not linked to the performance of the Group. However, to align directors’ interests with shareholder interests, the directors are encouraged to hold shares in the Company.
PERfORmANCE BAsED REmUNERATiON The Group currently has no performance based remuneration component built into director and executive remuneration packages, with the exception of the performance based options referred to on page 9. The performance options were issued in prior periods.
COmPANy PERfORmANCE, shAREhOLDER wEALTh AND DiRECTORs' AND EXECUTivEs' REmUNERATiONThe remuneration policy has been tailored to increase goal alignment between shareholders and directors and executives. Currently, this is facilitated through the issue of options to the majority of directors and executives to encourage the alignment of personal and shareholder interests. The Company believes this policy will be effective in increasing shareholder wealth. For details of directors and executives interests in options at balance date, refer note 27 of the financial statements.
EmPLOymENT CONTRACTs Of kEy mANAgEmENT PERsONNELThe agreements relating to remuneration are set out below:
David Flanagan, Managing Director:
Term of agreement – commencing 25 September •2008 with indefinite duration. Three months notice of resignation to be provided by Mr Flanagan.
Base salary, exclusive of superannuation, of $700,000 to •be reviewed annually.
Payment of termination benefit on early termination by •the employer, other than for gross misconduct, includes an amount equal to the final 12 months total annual remuneration paid to Mr Flanagan.
Ken Brinsden, Operations Manager, agreement amended 15 January 2009:
• Termofagreement–indefinitewith4weeksnoticeoftermination required by either party other than in the event of redundancy where termination obligation is the greater of 6 months salary or 4 weeks per year of service
• Basesalaryof$330,000inclusiveofsuperannuation
Mark Hancock, Chief Financial Officer, agreement amended 15 January 2009:
• Termof agreement – indefinitewith4weeksnoticeoftermination required by either party other than in the event of redundancy where termination obligation is the greater of 6 months salary or 4 weeks per year of service
• Basesalaryof$300,000inclusiveofsuperannuation

46 atlas Iron Limited Annual Report 200946
Directors' Report (cont'd)
Garry Plowright, Land and Access Approvals Manager, agreement amended 15 January 2009:
• Termofagreement–indefinitewith4weeksnoticeoftermination required by either party other than in the event of redundancy where termination obligation is the greater of 6 months salary or 4 weeks per year of service
• Basesalaryof$215,000inclusiveofsuperannuation
Andrew Patterson, Geology Manager, agreement commenced 6 October 2008:
• Termofagreement–indefinitewith4weeksnoticeoftermination required by either party other than in the event of redundancy where termination obligation is the greater of 6 months salary or 4 weeks per year of service
• Basesalaryof$294,000inclusiveofsuperannuation
Anthony Walsh, Company Secretary:
Between 1 July 2006 and 1 February 2009
• Termofagreement–indefinitewith2monthsnoticeof termination required by either party.
• Fixed fee, $12,000 per month, to be reviewedannually.
Commenced 2 February 2009
• Termofagreement–indefinitewith4weeksnoticeoftermination required by either party other than in the event of redundancy where termination obligation is the greater of 6 months salary or 4 weeks per year of service
• Basesalaryof$275,000inclusiveofsuperannuation
Retirement Benefits
Other retirement benefits may be provided directly by the Company if approved by shareholders.

atlas Iron Limited Annual Report 2009 47
Directors' Report (cont'd)
Short-term employee benefitsPost-employment
benefitsLong-term benefits
Share-based
paymentsTotal
% of Remuneration Share Based
% of Remuneration
Performance BasedSalary & fees
Cash bonus
Non-monetary benefits
OtherSuperan-nuation
Termi-nation
benefits
Long service leave
Options
Directors
David Flanagan
2009 700,000 - 37,173 3,578 63,000 - 10,614 435,466 1,249,831 35 35
2008 400,000 - 68,423 1,481 36,000 - 2,704 1,505,335 2,013,943 75 -
David Hannon
2009 66,055 - - 3,578 5,945 - - - 75,578 - -
2008 58,257 - - 1,481 5,243 - - 383,690 448,671 86 -
Jyn Sim Baker*
2009 72,000 - - 3,578 - - - - 75,578 - -
2008 63,500 - - 1,481 - - - 343,902 408,883 84 -
Geoff Clifford
2009 99,771 - - 3,578 8,979 - - 108,918 221,246 49 -
2008 51,200 - - 1,481 4,608 - - 509,024 566,313 90 -
David Nixon (Director until 21 November 2008)
2009 35,356 - - 3,578 3,182 - - - 42,116 - -
2008 83,563 - - 1,481 7,521 - - 687,805 780,370 88 -
Executives
Jeremy Sinclair (Operations General Manager)
2009 258,381 - 22,500 - 23,254 - - 265,147 569,282 47 8
2008 142,603 - 10,883 - 12,834 - - 207,900 374,220 56 23
Mark Hancock (Chief Financial Officer)
2009 276,729 - 12,423 3,578 24,906 - 1,627 209,470 528,733 40 4
2008 221,183 - 20,310 1,481 19,816 - - 98,150 360,940 27 16
Ken Brinsden (Operations Manager)
2009 304,252 - 9,859 3,578 27,383 - 674 211,630 557,376 38 3
2008 267,055 - 18,179 1,481 23,945 - 969 101,190 412,819 25 14
Andrew Paterson (Geology Manager)-commenced on 6 October 2008
2009 202,064 - 12,512 3,578 18,186 - - 282,388 518,728 54 -
2008 - - - - - - - - - - -
Anthony Walsh (Company Secretary)
2009 182,440 - 127 3,578 8,617 - - 123,866 318,628 39 -
2008 131,000 - - 1,481 - - - 125,140 257,621 49 -
Jack Cullity** (Legal Manager)
2009 235,445 - 7,475 - 21,190 - - 254,836 518,946 49 -
2008 136,333 - 3,237 - 12,270 - - 197,204 349,044 56 -
Garry Plowright (Land & Access Approvals Manager)
2009 197,989 - 10,614 3,578 17,819 - 1,003 216,975 447,978 48 4
2008 175,312 - 2,382 1,481 15,688 - - 105,218 300,081 35 19
Daniel Taylor** (Marketing Manager)-commenced on 1 July 2008
2009 207,922 - 14,169 - 18,713 - - 342,360 583,164 59 -
2008 - - - - - - - - - - -
Total
2009 2,838,404 - 126,852 35,780 241,174 - 13,918 2,451,056 5,707,184 43 9
2008 1,730,006 - 123,414 13,329 137,925 - 3,673 4,264,558 6,272,905 68 9
COmPENsATiON Of kEy mANAgEmENT PERsONNEL fOR ThE yEAR ENDED 30 JUNE 2009
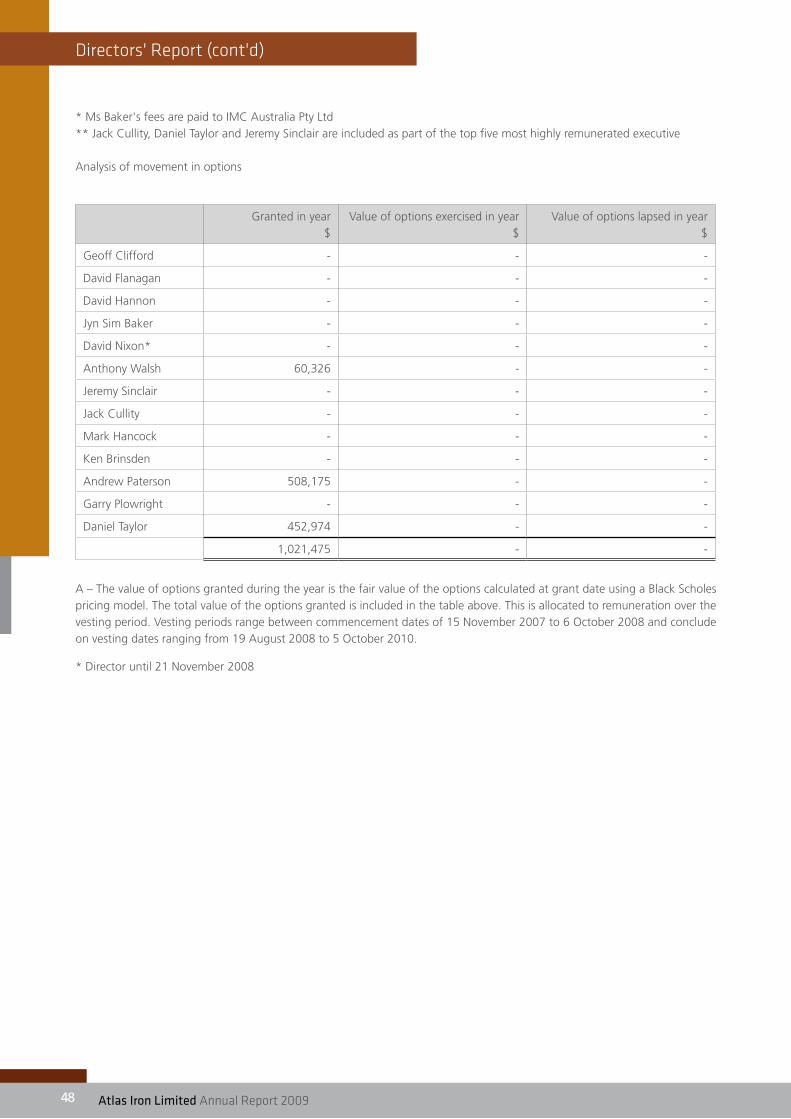
48 atlas Iron Limited Annual Report 200948
Directors' Report (cont'd)
* Ms Baker's fees are paid to IMC Australia Pty Ltd** Jack Cullity, Daniel Taylor and Jeremy Sinclair are included as part of the top five most highly remunerated executive
Analysis of movement in options
Granted in year $
Value of options exercised in year $
Value of options lapsed in year $
Geoff Clifford - - -
David Flanagan - - -
David Hannon - - -
Jyn Sim Baker - - -
David Nixon* - - -
Anthony Walsh 60,326 - -
Jeremy Sinclair - - -
Jack Cullity - - -
Mark Hancock - - -
Ken Brinsden - - -
Andrew Paterson 508,175 - -
Garry Plowright - - -
Daniel Taylor 452,974 - -
1,021,475 - -
A – The value of options granted during the year is the fair value of the options calculated at grant date using a Black Scholes pricing model. The total value of the options granted is included in the table above. This is allocated to remuneration over the vesting period. Vesting periods range between commencement dates of 15 November 2007 to 6 October 2008 and conclude on vesting dates ranging from 19 August 2008 to 5 October 2010.
* Director until 21 November 2008

atlas Iron Limited Annual Report 2009 49
Directors' Report (cont'd)
Compensation options granted during the year ended 30 June 2009
Options are issued to directors and executives as part of their remuneration. The majority of options are not issued based on performance criteria, but are issued to the directors and executives of Atlas Iron Limited to increase goal congruence between executives, directors and shareholders. The following options were granted during the year to key management personnel:
Grant date Grant number
Vest Value per option at
grant date
Exercise price Expiry date
Directors - - - - - -
Executives
Daniel Taylor 01/07/2008 125,000 01/07/2009 $1.85 $4.08 30/06/2013
01/07/2008 125,000 01/07/2010 $1.77 $4.62 30/06/2013
Andrew Paterson 26/09/2008 350,000 05/10/2009 $0.74 $1.65 30/09/2013
26/09/2008 350,000 05/10/2010 $0.71 $1.85 30/09/2013
Anthony Walsh 09/02/2009 100,000 02/02/2010 $0.60 $1.30 30/12/2013
Black Scholes assumptions:
Life of the option (years)
Underlying share price ($)
Stock volatility Risk free rate Adjustment for unlisted nature
Daniel Taylor 5.00 $3.55 70% 7.25% 15%
Andrew Paterson 5.01 $1.43 70% 7.00% 15%
Anthony Walsh 4.89 $1.22 70% 3.25% 15%
30 June 2008
Grant date Grant number
Vest Value per option at
grant date
Exercise price Expiry date
Directors
Geoff Clifford 15/11/2007 500,000 20/08/2008 $1.24 $2.46 20/08/2012
Executives
Anthony Walsh 27/05/2008 100,000 31/12/2009 $1.51 $4.50 01/05/2011
Mark Hancock 27/05/2008 200,000 31/12/2009 $1.51 $4.50 01/05/2011
Ken Brinsden 27/05/2008 200,000 31/12/2009 $1.51 $4.50 01/05/2011
Mark Gunther 27/05/2008 200,000 31/12/2009 $1.51 $4.50 01/05/2011
Garry Plowright 27/05/2008 200,000 31/12/2009 $1.51 $4.50 01/05/2011
Shares issued on exercise of compensation options
There have been no ordinary shares issued as a result of the exercise of compensation options of directors and executives in the current year.

50 atlas Iron Limited Annual Report 200950
Directors' Report (cont'd)
Performance income as a proportion of total compensation
No performance based bonuses have been paid to key management personnel during the financial year, however some share options granted in previous periods were based on performance criteria and have vested during the year. The company is developing a performance based short term incentive program in conjunction with independent remuneration consultants for roll out during the 2009/10 year.
DiRECTORs' mEETiNgsAttendance of directors’ meetings held during the year are set our below:
Directors Meetings Audit and Risk Committee
Remuneration Committee
Nomination Committee
A B A B A B A B
David Flanagan 16 16 - - - - - -
David Hannon 16 16 3 3 1 1 1 1
Jyn Sim Baker 14 16 3 3 1 1 1 1
Geoff Clifford 16 16 3 3 1 1 1 1
David Nixon* 6 6 1 1 - - - -
Notes: A: Number of meetings attended. B:Number of meetings held during the time the director held office during the year.
*Director until 21 November 2008
ROUNDiNg
The amounts contained in this report and in the financial report have been rounded to the nearest $1 (where rounding is applicable) under the option available to the Company under ASIC Class Order 98/0100. The Company is an entity to which the Class Order applies.
AUDiTOR iNDEPENDENCEThe auditor's independence declaration for the year ended 30 June 2009 has been received and can be found on page 55.
NON AUDiT sERviCEsThe Company's auditor, Stantons International and associated entities did not provide any non-audit services to the Group during the year ended 30 June 2009.
Signed in accordance with a resolution of the directors.
David Flanagan
Managing Director
Perth, 28 August 2009

atlas Iron Limited Annual Report 2009 51
income statement
iNCOmE sTATEmENT
YEAR ENDED 30 JUNE 2009 Notes Consolidated Company
2009 2008 2009 2008
$ $ $ $
CONTINUING OPERATIONS
Revenue 2 26,427,892 - 26,427,892 -
Cost of sales 3 (32,662,316) - (32,662,316) -
GROSS PROFIT / (LOSS) (6,234,424) - (6,234,424) -
Other income - 88,636 - 88,636
Gain on sale of assets - 954,857 - 4,276,104
Depreciation and amortisation expenses 4 (782,847) (343,539) (782,847) (343,539)
Exploration and evaluation expenses 4 (52,296,291) (33,883,699) (23,317,821) (16,819,680)
Share based payment expense 5 (5,639,603) (5,962,270) (5,639,603) (5,962,270)
Intercompany loan write down - - (29,000,022) (16,288,692)
Share of loss of associate 12 (1,362,350) (2,074,446) - -
Other expenses from ordinary activities 8 (3,492,923) (3,157,311) (3,463,100) (3,157,164)
LOSS FROM OPERATING ACTIVITIES (69,808,438) (44,377,772) (68,437,817) (38,206,605)
Interest received 6,837,000 6,035,770 6,837,000 6,035,770
Interest paid (1,091) - (1,091) -
Foreign exchange loss, net (171,614) - (171,614) -
NET FINANCIAL INCOME 6,664,295 6,035,770 6,664,295 6,035,770
LOSS BEFORE INCOME TAX (63,144,143) (38,342,002) (61,773,522) (32,170,835)
Income tax (expense)/benefit 6 - - - -
LOSS ATTRIBUTABLE TO EQUITY HOLDERS OF THE COMPANY (63,144,143) (38,342,002) (61,773,522) (32,170,835)
Basic loss per share (cents per share) 25 (21.3) (17.9) (20.8) (15.0)
Diluted loss per share (cents per share) 25 (21.3) (17.9) (20.8) (15.0)
The above Income Statement is to be read in conjunction with the Notes to the Financial Statements.

52 atlas Iron Limited Annual Report 200952
Balance sheet
BALANCE shEET
YEAR ENDED 30 JUNE 2009 Notes Consolidated Company
2009 2008 2009 2008
$ $ $ $
CURRENT ASSETS
Cash and cash equivalents 21(b) 124,350,378 143,350,098 124,350,378 143,350,098
Trade and other receivables 9 5,032,072 3,129,621 5,032,072 3,129,621
Inventories 10 8,335,870 - 8,335,870 -
TOTAL CURRENT ASSETS 137,718,320 146,479,719 137,718,320 146,479,719
NON-CURRENT ASSETS
Other financial assets 11 5,516,142 10,020,993 31,393,160 32,949,593
Other receivables 9 21,003,957 6,679,479 21,003,957 6,679,479
Investment accounted for using the equity method 12 1,540,900 726,109 - -
Property, plant and equipment 13 10,278,474 4,625,524 10,278,474 4,625,524
Intangibles 14 217,072 286,576 217,072 286,576
Mine development costs 15 25,405,365 4,884,235 25,405,365 4,294,424
Mining tenements capitalised 16 25,113,096 23,028,538 8,996,988 8,265,247
TOTAL NON-CURRENT ASSETS 89,075,006 50,251,454 97,295,016 57,100,843
TOTAL ASSETS 226,793,326 196,731,173 235,013,336 203,580,562
CURRENT LIABILITIES
Trade and other payables 17 22,722,896 11,807,765 22,722,896 11,807,765
Deferred income - 69,478 - 69,478
Provisions 18 2,169,081 1,354,158 2,169,081 1,354,158
TOTAL CURRENT LIABILITIES 24,891,977 13,231,401 24,891,977 13,231,401
NON-CURRENT LIABILITIESProvisions 18 1,984,466 55,552 1,984,466 55,552
TOTAL NON-CURRENT LIABILITIES 1,984,466 55,552 1,984,466 55,552
TOTAL LIABILITIES 26,876,443 13,286,953 26,876,443 13,286,953
NET ASSETS 199,916,883 183,444,220 208,136,893 190,293,609
EQUITY
Issued capital 19(a) 296,984,324 231,369,466 296,984,324 231,369,466
Shares to be issued 19(e) 12,912,196 45,000 12,912,196 45,000
Reserves 20(a) 15,887,529 14,752,777 15,887,529 14,752,777
Accumulated losses 20(b) (125,867,166) (62,723,023) (117,647,156) (55,873,634)
TOTAL EQUITY 199,916,883 183,444,220 208,136,893 190,293,609
The above Balance Sheet is to be read in conjunction with the Notes to the Financial Statements.
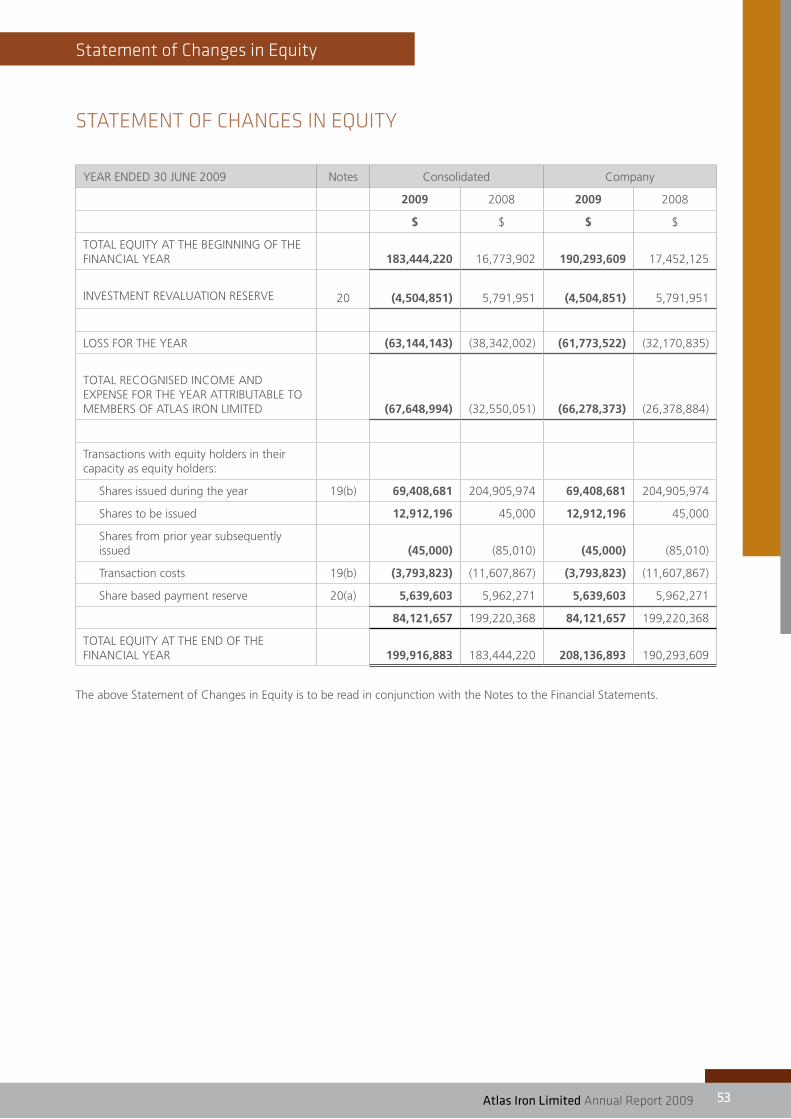
atlas Iron Limited Annual Report 2009 53
statement of Changes in Equity
sTATEmENT Of ChANgEs iN EqUiTy
YEAR ENDED 30 JUNE 2009 Notes Consolidated Company
2009 2008 2009 2008
$ $ $ $
TOTAL EQUITY AT THE BEGINNING OF THE FINANCIAL YEAR 183,444,220 16,773,902 190,293,609 17,452,125
INVESTMENT REVALUATION RESERVE 20 (4,504,851) 5,791,951 (4,504,851) 5,791,951
LOSS FOR THE YEAR (63,144,143) (38,342,002) (61,773,522) (32,170,835)
TOTAL RECOGNISED INCOME AND EXPENSE FOR THE YEAR ATTRIBUTABLE TO MEMBERS OF ATLAS IRON LIMITED (67,648,994) (32,550,051) (66,278,373) (26,378,884)
Transactions with equity holders in their capacity as equity holders:
Shares issued during the year 19(b) 69,408,681 204,905,974 69,408,681 204,905,974
Shares to be issued 12,912,196 45,000 12,912,196 45,000
Shares from prior year subsequently issued (45,000) (85,010) (45,000) (85,010)
Transaction costs 19(b) (3,793,823) (11,607,867) (3,793,823) (11,607,867)
Share based payment reserve 20(a) 5,639,603 5,962,271 5,639,603 5,962,271
84,121,657 199,220,368 84,121,657 199,220,368
TOTAL EQUITY AT THE END OF THE FINANCIAL YEAR 199,916,883 183,444,220 208,136,893 190,293,609
The above Statement of Changes in Equity is to be read in conjunction with the Notes to the Financial Statements.

54 atlas Iron Limited Annual Report 200954
statement of Cash flows
sTATEmENT Of CAsh fLOws
YEAR ENDED 30 JUNE 2009 Notes Consolidated Company
2009 2008 2009 2008
$ $ $ $
CASH FLOWS USED IN OPERATING ACTIVITIES
Cash receipts from customers 25,353,839 - 25,353,839 -
Payments to suppliers and employees (41,596,699) (4,226,867) (41,538,642) (4,029,195)
Interest and grants received 6,996,716 4,993,694 6,996,716 4,993,694
Expenditure on mining interests (51,849,289) (30,321,477) (23,098,225) (13,507,459)
Interest paid (1,091) - (1,091) -
Income tax paid (5,182) - - -
NET CASH FLOWS (USED IN) OPERATING ACTIVITIES 21(a) (61,101,706) (29,554,650) (32,287,403) (12,542,960)
CASH FLOWS USED IN INVESTING ACTIVITIES
Payment for security deposits - (5,025,527) - (5,025,527)
Acquisition of plant and equipment and intangibles (6,940,390) (4,341,655) (6,940,390) (4,341,655)
Acquisition of tenements (1,910,057) (5,650,040) (1,559,000) (318,660)
Development of mining tenements (19,894,656) (4,319,809) (19,826,331) (4,319,808)
Payment for investments (2,177,141) (5,379,043) (2,177,141) (10,629,043)
Amounts advanced to related parties - - (29,233,685) (17,093,069)
NET CASH FLOWS (USED IN) INVESTING ACTIVITIES (30,922,244) (24,716,074) (59,736,547) (41,727,762)
CASH FLOWS FROM FINANCING ACTIVITIES
Proceeds from issues of ordinary shares 72,385,308 195,324,805 72,385,308 195,324,804
Net refund of share issue costs 417,781 (12,136,882) 417,781 (12,136,883)
NET CASH FLOWS FROM FINANCING ACTIVITIES 72,803,089 183,187,923 72,803,089 183,187,921
NET INCREASE/(DECREASE) IN CASH AND CASH EQUIVALENTS (19,220,861) 128,917,199 (19,220,861) 128,917,199
Add opening cash and cash equivalents brought forward 143,350,098 14,432,899 143,350,098 14,432,899
Effect of exchange rate changes on cash and cash equivalents 221,141 - 221,141 -
CLOSING CASH AND CASH EQUIVALENTS CARRIED FORWARD 21(b) 124,350,378 143,350,098 124,350,378 143,350,098
The above Statement of Cash Flows is to be read in conjunction with the Notes to the Financial Statements.
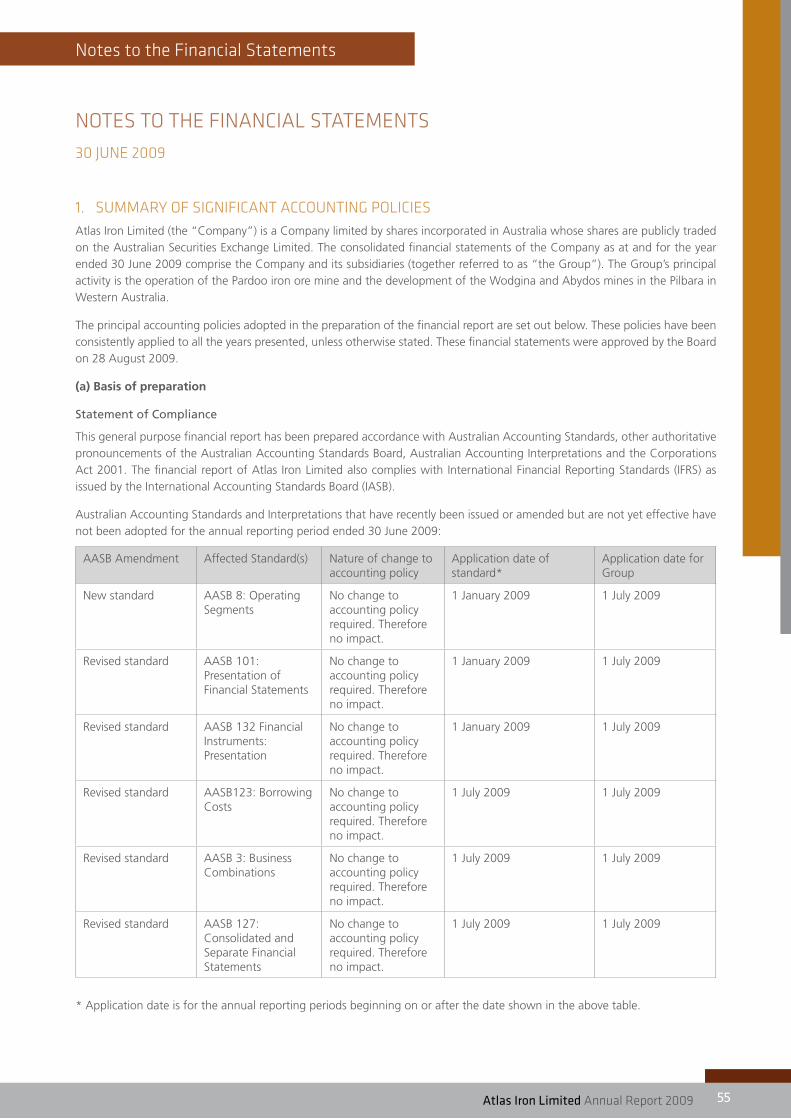
atlas Iron Limited Annual Report 2009 55
Notes to the financial statements
NOTEs TO ThE fiNANCiAL sTATEmENTs
30 JUNE 2009
1. sUmmARy Of sigNifiCANT ACCOUNTiNg POLiCiEsAtlas Iron Limited (the “Company”) is a Company limited by shares incorporated in Australia whose shares are publicly traded on the Australian Securities Exchange Limited. The consolidated financial statements of the Company as at and for the year ended 30 June 2009 comprise the Company and its subsidiaries (together referred to as “the Group”). The Group’s principal activity is the operation of the Pardoo iron ore mine and the development of the Wodgina and Abydos mines in the Pilbara in Western Australia.
The principal accounting policies adopted in the preparation of the financial report are set out below. These policies have been consistently applied to all the years presented, unless otherwise stated. These financial statements were approved by the Board on 28 August 2009.
(a) Basis of preparation
Statement of Compliance
This general purpose financial report has been prepared accordance with Australian Accounting Standards, other authoritative pronouncements of the Australian Accounting Standards Board, Australian Accounting Interpretations and the Corporations Act 2001. The financial report of Atlas Iron Limited also complies with International Financial Reporting Standards (IFRS) as issued by the International Accounting Standards Board (IASB).
Australian Accounting Standards and Interpretations that have recently been issued or amended but are not yet effective have not been adopted for the annual reporting period ended 30 June 2009:
AASB Amendment Affected Standard(s) Nature of change to accounting policy
Application date of standard*
Application date for Group
New standard AASB 8: Operating Segments
No change to accounting policy required. Therefore no impact.
1 January 2009 1 July 2009
Revised standard AASB 101: Presentation of Financial Statements
No change to accounting policy required. Therefore no impact.
1 January 2009 1 July 2009
Revised standard AASB 132 Financial Instruments: Presentation
No change to accounting policy required. Therefore no impact.
1 January 2009 1 July 2009
Revised standard AASB123: Borrowing Costs
No change to accounting policy required. Therefore no impact.
1 July 2009 1 July 2009
Revised standard AASB 3: Business Combinations
No change to accounting policy required. Therefore no impact.
1 July 2009 1 July 2009
Revised standard AASB 127: Consolidated and Separate Financial Statements
No change to accounting policy required. Therefore no impact.
1 July 2009 1 July 2009
* Application date is for the annual reporting periods beginning on or after the date shown in the above table.

56 atlas Iron Limited Annual Report 200956
Notes to the financial statements (cont'd)
Historical cost convention
These financial statements have been prepared under the historical cost convention, as modified where applicable by the revaluation of available-for-sale financial assets and financial assets and liabilities at fair value through profit or loss.
(b) Basis of consolidation
The consolidated financial statements comprise the financial statements of Atlas Iron Limited and its subsidiaries as at 30 June 2009.
Subsidiaries are all those entities over which the Group has control. Control exists when the Company has the power, directly or indirectly, to govern the financial and operating policies of an entity so as to obtain benefits from its activities. In assessing control, potential voting rights that presently are exercisable or convertible are taken into account. The financial statements of subsidiaries are included in the consolidated financial statements from the date that control commences until the date that control ceases.
Investments in subsidiaries are carried at their cost of acquisition in the Company’s financial statements.
In preparing the consolidated financial statements all intercompany balances and transactions, income, expenses and profit and loss resulting from intergroup transactions have been eliminated in full.
Minority interests not held by the Group are allocated their share of net profit after tax in the income statement and are presented within equity in the consolidated balance sheet, separately from parent shareholders’ equity.
Investment in Associates
Associates are those entities in which the Company has significant influence, but not control, over the financial and operating policies. The consolidated financial statements include the Company’s share of the total recognised gains and losses of associates on an equity accounted basis from the date that significant influence commences until the date that significant influences ceases.
When the Company’s share of losses exceeds its interest in an associate, the Company’s carrying amount is reduced to nil and recognition of further losses is discontinued except to the extent that the Company has incurred legal or constructive obligations or made payments on behalf of an associate.
Under the equity method, investments in associates are carried in the consolidated balance sheet at cost plus post acquisition changes in the Group’s share of net assets of the associates. After application of the equity method the Group determines whether it is necessary to recognise any impairment loss with respect to the Group’s net investment in associates.
The reporting dates of the associate and the Group are identical and the associate’s accounting policies conform to those used by the Group for like transactions and events in similar circumstances.
(c) Critical accounting judgements, estimates and assumptions
The carrying amounts of certain assets and liabilities are often determined based on estimates and assumptions of future events. The key estimates and assumptions that have a significant risk of causing a material adjustment to the carrying amounts of certain assets and liabilities within the next annual reporting period are:
Share based payment transactions
The Group measures the cost of equity-settled transactions with employees, contractors and other third parties by reference to the fair value of the equity instruments at the date at which they are granted. The fair value is determined by an internal valuation using a Black-Scholes option pricing model, using the assumptions detailed in note 5.
Provision for rehabilitation costs
The Group assesses its mine rehabilitation provision at each reporting date. Significant estimates and assumptions are made in determining the provision for mine rehabilitation as there are numerous factors that will affect the ultimate liability payable. These factors include estimates of the extent and costs of rehabilitation activities, technological changes, regulatory changes, cost increases, and changes in discount rates. Those uncertainties may result in future actual expenditure differing from the amounts currently provided. The provision at balance date represents management’s best estimate of the present value of the future rehabilitation costs required. Changes to estimated future costs are recognized in the balance sheet by adjusting the rehabilitation asset and liability.
Ore reserve and resource estimates
Ore reserves are estimates of the amount of ore that can be economically and legally extracted from the Group’s mining properties. The Group estimates its ore reserves based on information compiled by appropriately qualified persons relating to the geological judgements to interpret the data. The estimation of recoverable reserves is based upon factors such as estimates of foreign exchange rates, commodity prices, future capital requirements, and production costs along with geological assumptions and judgements made in estimating the size and grade of the ore body. Changes in the reserve or resource estimates may impact upon the carrying value of exploration and evaluation assets, mine properties, property, plant & equipment, provision for rehabilitation, and depreciation and amortisation charges.

Notes to the financial statements (cont'd)
atlas Iron Limited Annual Report 2009 57
Units of production depreciation
Estimated recoverable reserves are used in determining the depreciation and/or amortisation of mine specific assets. This results in a depreciation/amortisation charge proportional to the depletion of the anticipated remaining life of mine production. Each item’s life, which is assessed annually, has regard to both its physical life limitations and to present assessments of economically recoverable reserves of the mine property at which the asset is located. These calculations require the use of estimates and assumptions, including the amount of recoverable reserves and estimates of future capital expenditure. The Group adopts a Run of the Mine (ROM) tonnes of ore produced methodology. Changes are accounted for prospectively.
Loans to controlled entities
The ultimate recoverability of intercompany receivables is dependent upon future exploration success of controlled entities (refer note 11).
Deferred taxation
Deferred income tax assets are only recognised to the extent that it is probable that future profits will be available against which deductible temporary differences can be utilised.
Production start date
The Group assess the stage of each mine development project to determine when a mine moves into the production stage. The criteria used to assess the start date of a mine are determined based on the unique nature of each mine development project. The Group considers various relevant criteria to assess when the mine is substantially complete, ready for its intended use and moves into the production phase. Some of the criteria include:
• the level of capital expenditure compared to construction cost estimates;
• completion of a reasonable period of testing of the mine plant and equipment;
• ability to process iron ore in saleable form; and
• ability to sustain ongoing mining and processing of iron ore.
When a mine development project moves into the production stage, the capitalisation of certain mine construction costs ceases and costs are either regarded as inventory or expensed, except for costs related to mining asset additions or improvements, and mineable reserve development, which are capitalised. It is also at this point that depreciation/amortisation commences.
Amortisation of mine development costs
The Group assesses future capital costs required to bring existing reserves into production and includes an estimate of these costs in the base when calculating amortisation expense.
Loans to controlled entities
The Group assesses the recoverability of loans and makes provision in the event that full recovery is not expected. The ultimate recoverability of loans is dependent upon future exploration success of the controlled entities.
Deferred taxation
The Group assesses the extent to which it is probable that future taxable profits will be available to offset against existing tax losses when considering whether to bring any tax benefit to account.
(d) Property, plant and equipment
Each class of property, plant and equipment is carried at cost less, where applicable, any accumulated depreciation and impairment losses.
Land and Buildings
Land and Buildings are measured on the cost basis.
Depreciation
Depreciation of buildings is calculated on a prime cost basis so as to write off the net costs over the expected useful life. The depreciation rate for buildings is 5% per annum. Land is not depreciated but is subject to impairment.
Plant and equipment
Plant and equipment are measured on the cost basis.
The carrying amount of plant and equipment is reviewed annually by directors to ensure it is not in excess of the recoverable amount from these assets. The recoverable amount is assessed on the basis of the expected net cash flows which will be received from the assets employment and subsequent disposal. The expected net cash flows have been discounted to their present values in determining recoverable amounts. The cost of fixed assets constructed within the Group includes the cost of materials, direct labour, borrowing costs and an appropriate proportion of fixed and variable overheads.
Subsequent costs are included in the asset's carrying amount or recognised as a separate asset, as appropriate, only when it is probable that future economic benefits associated with the item will flow to the Group and the cost of the item can be measured reliably. All other repairs and maintenance are charged to the income statement during the financial period in which they are incurred.

58 atlas Iron Limited Annual Report 200958
Notes to the financial statements (cont'd)
Depreciation
Depreciation of plant and equipment is calculated on a diminishing value or prime cost basis so as to write off the net costs of each asset over the expected useful life. The rates vary between 5% and 40% per annum.
Depreciation of buildings is calculated on a prime cost basis over the expected useful life of the asset at a rate of 5% per annum.
The assets' residual values and useful lives are reviewed, and adjusted if appropriate, at each balance sheet date.
An asset's carrying amount is written down immediately to its recoverable amount if the asset's carrying amount is greater than its estimated recoverable amount.
Gains and losses on disposals are determined by comparing proceeds with carrying amount. These are included in the income statement. When revalued assets are sold, it is Company policy to transfer the amounts included in other reserves in respect of those assets to retained earnings.
(e) Impairment of assets
At each reporting date, the Group reviews the carrying values of its tangible and intangible assets to determine whether there is any indication that those assets have been impaired. If such an indication exists, the recoverable amount of the asset, being the higher of the asset's fair value less costs to sell and value in use, is compared to the asset's carrying value. Any excess of the asset's carrying value over its recoverable amount is expensed to the income statement.
Impairment testing is performed annually for goodwill and intangible assets with indefinite lives.
Where it is not possible to estimate the recoverable amount of an individual asset, the Group estimates the recoverable amount of the cash-generating unit to which the asset belongs.
(f) Exploration and evaluation costs
Exploration and evaluation costs are written off in the year they are incurred apart from acquisition costs which are carried forward where right of tenure of the area of interest is current and they are expected to be recouped through sale or successful development and exploitation of the area of interest or, where exploration and evaluation activities in the area of interest have not reached a stage that permits reasonable assessment of the existence of economically recoverable reserves.
Where an area of interest is abandoned or the directors decide that it is not commercial, any accumulated acquisition costs in respect of that area are written off in the financial period
the decision is made. Each area of interest is also reviewed at the end of each accounting period and accumulated costs written off to the extent that they will not be recoverable in the future.
Amortisation is not charged on costs carried forward in respect of areas of interest in the development phase until production commences. When production commences, accumulated costs for the relevant mineral project are amortised on a units of production basis over the life of the economically recoverable reserves.
(g) Development Costs
Development costs include mine infrastructure, pre-production development costs, development excavation, project execution costs and other subsurface expenditure pertaining to that area of interest. Costs related to surface plant and equipment and any associated land and buildings are accounted for as property, plant and equipment. The definition of an area of interest is the area serviced by a given Mining Operations centre. Development Costs are carried forward in respect of areas of interest in the development phase until production commences. When production commences, carried forward development costs are to be amortised on a units of production basis over the life of economically recoverable reserves.
Development assets are assessed for impairment if facts and circumstances suggest that the carrying amount exceeds the recoverable amount. For the purposes of impairment testing, development assets are allocated to cash-generating units to which the development activity relates. The cash generating unit shall not be larger than the area of interest.
Deferred stripping
Overburden and other mine waste materials are often removed during the initial development of a mine in order to access the mineral deposit. This activity is referred to as development stripping. The directly attributable costs (inclusive of an allocation of relevant overhead expenditure) are capitalised as development costs. Capitalisation of development stripping costs ceases and amortisation of those capitalised costs commences upon extraction of ore. Amortisation of capitalised development stripping costs is determined on a unit of production basis for each separate area of interest.
Capitalised development stripping costs are classified as ‘Development Expenditure’. Development stripping costs are considered in combination with other assets of an operation for the purpose of undertaking impairment assessments.

Notes to the financial statements (cont'd)
atlas Iron Limited Annual Report 2009 59
Removal of waste material normally continues throughout the life of a mine. This activity is referred to as production stripping and commences upon extraction of ore.
The costs of production stripping are charged to the income statement as operating costs.
(h) Leases
Leases of fixed assets where substantially all the risks and benefits incidental to the ownership of the asset, but not the legal ownership transfer to the company are classified as finance leases.
Finance leases are capitalised by recording an asset and a liability at the lower of the amounts equal to the fair value of the leased property or the present value of the minimum lease payments, including any guaranteed residual values. Lease payments are allocated between the reduction of the lease liability and the lease interest expense for the period.
Leased assets are depreciated on a straight-line basis over their estimated useful lives.
Lease payments for operating leases, where substantially all the risks and benefits remain with the lessor, are charged as expenses in the periods in which they are incurred.
Lease incentives under operating leases are recognised as a liability and amortised on a straight-line basis over the life of the lease term.
(i) Income tax
The charge for current income tax expense is based on the profit for the year adjusted for any non-assessable or disallowed items. It is calculated using the tax rates that have been enacted or are substantially enacted by the balance sheet date.
Deferred tax is accounted for using the balance sheet liability method in respect of temporary differences arising between the tax bases of assets and liabilities and their carrying amounts in the financial statements. No deferred income tax will be recognised from the initial recognition of an asset or liability, excluding a business combination, where there is no effect on accounting or taxable profit or loss.
Deferred tax is calculated at the tax rates that are expected to apply to the period when the asset is realised or liability is settled. Deferred tax is credited in the income statement except where it relates to items that may be credited directly to equity, in which case the deferred tax is adjusted directly against equity.
Deferred income tax assets are recognised to the extent that it is probable that future tax profits will be available against which deductible temporary differences can be utilised.
The amount of benefits brought to account or which may
be realised in the future is based on the assumption that no adverse change will occur in income taxation legislation and the anticipation that the Group will derive sufficient future assessable income to enable the benefit to be realised and comply with the conditions of deductibility imposed by the law.
(j) Goods and Services Tax (GST)
Revenues, expenses and assets are recognised net of the amount of GST, except where the amount of GST incurred is not recoverable from the Australian Tax Office. In these circumstances the GST is recognised as part of the cost of acquisition of the asset or as part of an item of the expense. Receivables and payables in the balance sheet are shown inclusive of GST.
Cash flows are presented in the cash flow statement on a gross basis, except for the GST component of investing and financing activities, which are disclosed as operating cash flows.
(k) Trade and other payables
Liabilities for trade creditors and other amounts are carried at cost which is the fair value of the consideration to be paid in the future for goods and services received, whether or not billed to the Group.
Payables to related parties are carried at the principal amount. Interest, when charged by the lender, is recognised as an expense on an accrual basis.
(l) Employee benefits
Provision is made for employee benefits accumulated as a result of employees rendering services up to the reporting date. These benefits include wages and salaries, annual leave, and long service leave.
Liabilities arising in respect of wages and salaries, annual leave and any other employee benefits expected to be settled within twelve months of the reporting date are measured at their nominal amounts based on remuneration rates which are expected to be paid when the liability is settled. All other employee benefit liabilities are measured at the present value of the estimated future cash outflow to be made in respect of services provided by employees up to the reporting date. In determining the present value of future cash outflows, the market yield as at the reporting date on national government bonds, which have terms to maturity approximating the terms of the related liability, are used.
Share-based payments
The Company provides benefits to employees (including directors) of the Company in the form of share-based payment transactions, whereby employees render services in exchange for shares or rights over shares (‘equity-settled transactions’).

60 atlas Iron Limited Annual Report 200960
Notes to the financial statements (cont'd)
The cost of these equity-settled transactions with employees is measured by reference to the fair value at the date on which they are granted. The fair value is determined by an internal valuation using a Black-Scholes option pricing model.
The cost of equity-settled transactions is recognised, together with a corresponding increase in equity, over the period in which the performance conditions are fulfilled, ending on the date on which the relevant employees become fully entitled to the award (‘vesting date’).
The cumulative expense recognised for equity-settled transactions at each reporting date until vesting date reflects (i) the extent to which the vesting period has expired and (ii) the number of options that, in the opinion of the directors of the Company, will ultimately vest. This opinion is formed based on the best available information at balance date. No adjustment is made for the likelihood of market performance conditions being met as the effect of these conditions is included in the determination of fair value at grant date.
No expense is recognised for awards that do not ultimately vest, except for awards where vesting is conditional upon a market condition.
Where an equity-settled award is cancelled no further expense is recognised. However, if a new award is substituted for the cancelled award, and designated as a replacement award on the date that it is granted, the cancelled and new award are treated as if they were a modification of the original award.
(m) Revenue recognition
Revenue is measured at the fair value of the gross consideration received or receivable. The Group recognises revenue when the amount of revenue can be reliably measured, it is probable that future economic benefits will flow to the entity and specific criteria have been met for each of Group’s activities. The amount of revenue is not considered to be reliably measurable until all contingencies relating to the sale have been resolved. The Group bases its estimates on historical results, taking into consideration the type of customer, the type of transaction and the specifics of each arrangement.
Sale of goods
Revenue from the sale of goods and disposal of other assets is recognised when persuasive evidence, usually in the form of an executed sales agreement, or an arrangement exists, indicating there has been a transfer of risks and rewards to the customer, no further work or processing is required by the Group, the quantity and quality of the goods has been determined with reasonable accuracy, the price is fixed or determinable, and collectability is reasonably assured. This is generally when title passes. The majority of the Group’s sales agreements specify that title passes when the product is delivered to the destination specified by the customer, which is typically the vessel on which the product will be shipped. In
practical terms, revenue is generally recognised on the bill of lading date, which is the date the commodity is delivered to the shipping agent. These sales agreements also allow for an adjustment to the sales price based on a survey of the goods by the customer (an assay for mineral content); therefore recognition of the sales revenue is based on the most recently determined estimate of product specifications.
Interest
Interest revenue is recognised on a time proportionate basis that takes into account the effective yield on the financial assets.
(n) Issued capital
Ordinary shares are classified as equity.
Any transaction costs arising on the issue of ordinary shares are recognised directly in equity as a reduction of the share proceeds received.
(o) Earnings per share (EPS)
Basic earnings per share
Basic EPS is calculated as the profit / (loss) attributable to equity holders of the Company, excluding any costs of servicing equity other than ordinary shares, divided by the weighted average number of ordinary shares outstanding during the financial year, adjusted for any bonus elements in ordinary shares issued during the year.
Diluted earnings per share
Diluted EPS adjusts the figures used in the determination of basic EPS to take into account the after income tax effect of interest and other financing costs associated with dilutive potential ordinary shares and the weighted average number of shares assumed to have been issued for no consideration in relation to dilutive potential ordinary shares.
(p) Cash and cash equivalents
Cash and cash equivalents include cash on hand, deposits held at call with banks, other short-term highly liquid investments with original maturities of three months or less, and bank overdrafts. Bank overdrafts are shown within short-term borrowings in current liabilities on the balance sheet.
(q) Financial risk management
The Group’s activities expose it to a variety of financial risks: credit risk, liquidity risk and market risk. The Group’s overall risk management program focuses on the unpredictability of financial markets and seeks to minimise potential adverse effects on the financial performance of the Group.
Risk management is carried out by the Chief Financial Officer under policies developed and approved by the audit and risk

Notes to the financial statements (cont'd)
atlas Iron Limited Annual Report 2009 61
committee. Due to the nature of transactions undertaken by the Group, the main risk exposure is in relation to credit and currency risk, therefore the purpose of the current policy is to:
• Maximise the return on surplus cash with the aim of outperforming the benchmark, within acceptable levels of risk return exposure.
• Mitigate the credit and liquidity risks that the Group is exposed to through investment activities.
• Set dealing policy, controls and management reporting processes.
• Provide a framework for foreign currency hedging
Credit risk
Credit risk arises from cash and cash equivalents, derivative financial instruments and deposits with banks and financial institutions. For banks and financial institutions, only independently rated parties with a minimum rating of ‘A-1+’ are accepted and exposure to an individual counterparty is restricted to 25% of the total portfolio.
Liquidity risk
Prudent liquidity risk management implies maintaining sufficient cash and marketable securities, the availability of funding through an adequate amount of committed credit facilities and the ability to close out market positions. The Group manages liquidity risk by continuously monitoring forecast and actual cash flows and matching the maturity profiles of financial assets and liabilities. For maximum flexibility all securities purchased have, subject to market conditions, the ability to be liquidated within three working days.
Market risk
Market risk arises from the Company’s use of foreign currency financial instruments. It is the risk that the fair value of future cash flows of a financial instrument will fluctuate because of changes in foreign exchange rates or other factors such as price risk.
Foreign exchange risk
The Company operates internationally and is exposed to foreign exchange risk arising mainly from US dollar sales receipts. Prior to each shipment, the Company will closely monitor the US dollar fluctuations and lock in the best possible US dollars rate via engagement of foreign exchange contracts. As at 30 June 2009 it is exposed to currency risk on trade receivables.
The Group’s Financial Risk Management Policy permits foreign currency hedges for between 0% and 80% of current year’s anticipated US dollar receipts to assist in managing this risk as the Board considers appropriate.
Commodity price risk
The Group is exposed to price risk as sales are referenced to global iron ore prices which are set by the major producers and customers. The Group does not currently hedge iron ore price as the market to do so is presently immature. It believes a natural hedge exists in the form of the Australian dollar’s relationship with commodity prices.
(r) Comparative figures
When required by Accounting Standards, comparative figures have been adjusted to conform to changes in presentation for the current financial year.
(s) Rehabilitation provision
The Group records the present value of estimated costs of legal and constructive obligations required to restore operating locations in the period in which the obligation is incurred. The nature of these restoration activities includes dismantling and removing structures, rehabilitating mines, dismantling operating facilities, closure of plant and waste sites, and restoration, reclamation and re-vegetation of affected areas. The obligation generally arises when the asset is installed or the ground/environment is disturbed at the production location. When the liability is initially recognised, the present value of the estimated cost is capitalised by increasing the carrying amount of the related mining assets. Over time, the discounted liability is increased for the change in present value based on the discount rates that reflect current market assessments and the risks specific to the liability. The periodic unwinding of the discount is recognised in the income statement as a finance cost. Additional disturbances or changes in rehabilitation costs will be recognised as additions or charges to the corresponding assets and rehabilitation liability when they occur.
(t) Inventories
Iron ore stockpiles are physically measured or estimated and valued at the lower of cost or net realisable value. Net realisable value is the estimated selling price in the ordinary course of business, less estimated costs of completion and costs of selling final product.
Cost is determined by the weighted average method and comprises direct purchase costs and an appropriate portion of fixed and variable overhead costs, including depreciation and amortisation, incurred in converting materials into finished goods.
Materials and supplies are valued at the lower of cost or net realisable value. Any provision of obsolescence is determined by reference to specific items of stock. A regular review is undertaken to determine the extent of any provision for obsolescence.

62 atlas Iron Limited Annual Report 200962
Notes to the financial statements (cont'd)
(u) Amortisation of capitalised exploration, evaluation and development expenditure
Amortisation of capitalised acquisition and development costs is charged on a units of production basis over the life of economically recoverable reserves.
(v) Other intangible assets
Other intangible assets include computer software.
Intangible assets acquired separately are measured on initial recognition at cost, which comprises its purchase price plus any directly attributable cost of preparing the asset for its intended use. Following initial recognition, intangible assets are carried at cost less any accumulated amortization on a straight line basis over their useful lives.
(w) Contingencies
By their nature, contingencies will only be resolved when one or more future events occur or fail to occur. The assessment of contingencies inherently involves the exercise of significant judgement and estimates of the outcome of future events.
Notes Consolidated Company
2009 2008 2009 2008
$ $ $ $
2. REvENUE
Sale of iron ore 26,427,892 - 26,427,892 -
26,427,892 - 26,427,892 -
3. COsT Of sALEs
Mining costs 16,276,878 - 16,276,878 -
Haulage 6,565,237 - 6,565,237 -
Port costs 2,517,224 - 2,517,224 -
Shipping costs 3,056,927 - 3,056,927 -
Government Royalty 1,351,823 - 1,351,823 -
Depreciation and amortisation 2,894,227 - 2,894,227 -
32,662,316 - 32,662,316 -
4. DEPRECiATiON, AmORTisATiON AND wRiTE-Offs
Amortisation of intangibles 184,307 87,149 184,307 87,149
Depreciation and amortisation of non-current assets
598,540 256,390 598,540 256,390
Exploration and evaluation costs written off
52,296,291 33,883,699 23,317,821 16,819,680
The above excludes depreciation and amortisation amount of $2,894,227 included in cost of sales.

Notes to the financial statements (cont'd)
atlas Iron Limited Annual Report 2009 63
5. shARE-BAsED PAymENTs Employee and Contractors Option Plan
The Group provides benefits to employees (including directors) and contractors of the Group in the form of share-based payment transactions, whereby options to acquire ordinary shares are issued as an incentive to improve employee and shareholder goal congruence. The exercise price of the options granted range from $0.20 to $5.00 per option. The options granted to employees have expiry dates ranging from 16 November 2010 to 31 March 2014.
Options granted carry no dividend or voting rights. When exercisable, each option is convertible into one ordinary share of the Company with full dividend and voting rights.
Set out below are summaries of the options granted:
The Company
2009 2008
Number of options Weighted average exercise price
Number of options Weighted average exercise price
Outstanding at the beginning of the year 27,690,000 1.22 21,175,000 0.49
Granted 2,050,000 2.04 7,065,000 3.37
Exercised (1,109,000) 0.61 (550,000) 0.60
Cancelled/lapsed (730,000) 3.77 - -
Outstanding at year-end 27,901,000 1.24 27,690,000 1.22
Exercisable at year-end 13,065,229 0.69 11,575,000 0.43
The weighted average remaining contractual life of share options outstanding at the end of the period was 2.2 years (2008: 3.1 years), and the exercise prices range from $0.20 to $5.00.
Expenses arising from share-based payment transactions
The weighted average fair value of the options granted during the year was $0.87. The price was calculated by using the Black-Scholes European Option Pricing Model applying the following inputs, except for listed options in which case the closing price on the date of issue was used:
Weighted average exercise price ($) 2.04
Weighted average life of the option (years) 4.93
Weighted average underlying share price ($) 1.70
Expected share price volatility 70%
Weighted average risk free interest rate 5.62%
Adjustment for unlisted nature 15%

64 atlas Iron Limited Annual Report 200964
Notes to the financial statements (cont'd)
Historical volatility has been the basis for determining expected share price volatility as it assumed that this is indicative of future trends, which may not eventuate.
The life of the options is based on historical exercise patterns, which may not eventuate in the future.
Total expenses arising from share-based payment transactions recognised during the period were as follows:
The Company
2009 2008
$ $
Options issued to directors, employees and consultants 5,639,603 5,962,270
6. iNCOmE TAX
The major components of income tax expense are:
Notes Consolidated Company
2009 2008 2009 2008
$ $ $ $
Current income tax
Current income tax charge (21,118,757) (12,141,140) (12,166,886) (6,863,057)
Adjustment in respect of current income tax of previous year (5,406,150) - (5,584,594) -
Tax losses not recognised 18,073,970 8,957,092 13,715,940 4,091,124
Deferred Income Tax
Relating to origination and reversal of temporary differences 4,284,923 3,184,048 4,035,540 2,771,933
Adjustment in respect of current income tax of previous year 4,166,014 - - -
Income tax expense reported in the income statement - - - -

Notes to the financial statements (cont'd)
atlas Iron Limited Annual Report 2009 65
Notes Consolidated Company
2009 2008 2009 2008
$ $ $ $
6. iNCOmE TAX (CONT'D)
Statement of Recognised Income and Expense
Deferred income tax related to items charged or credited directly to equity
Fair value of investment (1,351,455) 1,737,585 (1,351,455) 1,737,585
Capital raising costs (1,138,147) (3,482,360) (1,138,147) (3,482,359)
Income tax expense reported in equity (2,489,602) (1,744,775) (2,489,602) (1,744,774)
A reconciliation between tax expense and the product of accounting profit before income tax multiplied by the Group’s applicable income tax rate as follows:
Accounting profit/(loss) before tax from continuing operations (63,144,143) (38,342,002) (61,773,522) (32,170,835)
Loss before tax from discontinued operations - - - -
Accounting profit/(loss) before income tax (63,144,143) (38,342,002) (61,773,522) (32,170,835)
At the Group’s statutory income tax rate of 30% (2008: 30%) (18,943,243) (11,502,601) (18,532,056) (9,651,251)
Adjustment in respect of current income tax of previous years (1,240,136) - (5,584,594) -
Entertainment – non deductible 8,256 4,753 8,256 4,753
Penalties 566 162 566 162
R&D income - (10,077) - (10,077)
Non cash benefit 1,691,881 1,788,681 1,691,881 1,788,681
Provision for writedown – sub - - 8,700,007 4,886,608
Equity accounting for share of loss of associate 408,706 761,990 - -
Gain on disposal of tenements – St George - - - (1,110,000)
Other – amounts not recognised 18,073,970 8,957,092 13,715,940 4,091,124
Income tax expense reported in the consolidated income statement - - - -
Income tax attributable to discontinued operations - - - -
- - - -

66 atlas Iron Limited Annual Report 200966
Notes to the financial statements (cont'd)
Balance Sheet
2008$
Current Tax Equity 2009 $
6. iNCOmE TAX (CONT'D)
Deferred Income Tax
Deferred income tax at 30 June relates to the following:
CONSOLIDATED
Deferred tax liabilities
Prepayments (7,500) 7,500 - -
Accrued income (350,720) 53,402 - (297,318)
Capitalised exploration (3,204,289) (5,997,309) - (9,201,598)
Capitalised operating costs - (2,323,383) - (2,323,383)
Investments (1,737,586) - 1,351,455 (386,131)
(5,300,095) (8,259,790) 1,351,455 (12,208,430)
DTL – not recognised 5,300,095 12,208,430
- (8,259,790) 1,351,455 -
Deferred tax assets
Plant and equipment 1,278 2,758 - 4,036
Payroll liabilities 113 50,753 - 50,866
Accrued expenses 9,000 6,000 - 15,000
Provisions – office refurbish 15,000 15,000 - 30,000
Provisions – rehabilitation 329,760 668,442 - 998,202
Provisions – demobilisation - 50,199 - 50,199
Provisions – long service leave 1,665 5,685 - 7,350
Provisions – annual leave 76,487 83,826 - 160,313
Provisions – deferred revenue 20,844 (20,844) - -
Other 3,135,171 (3,135,171) - -
Gross deferred income tax assets 3,589,318 (2,273,352) - 1,315,966
Tax losses 19,617,758 - - 46,135,606
DTA recognised to offset DTL (5,300,094) - - (12,208,427)
DTA – Not recognised (17,906,982) - - (35,243,145)
- (2,273,352) - -
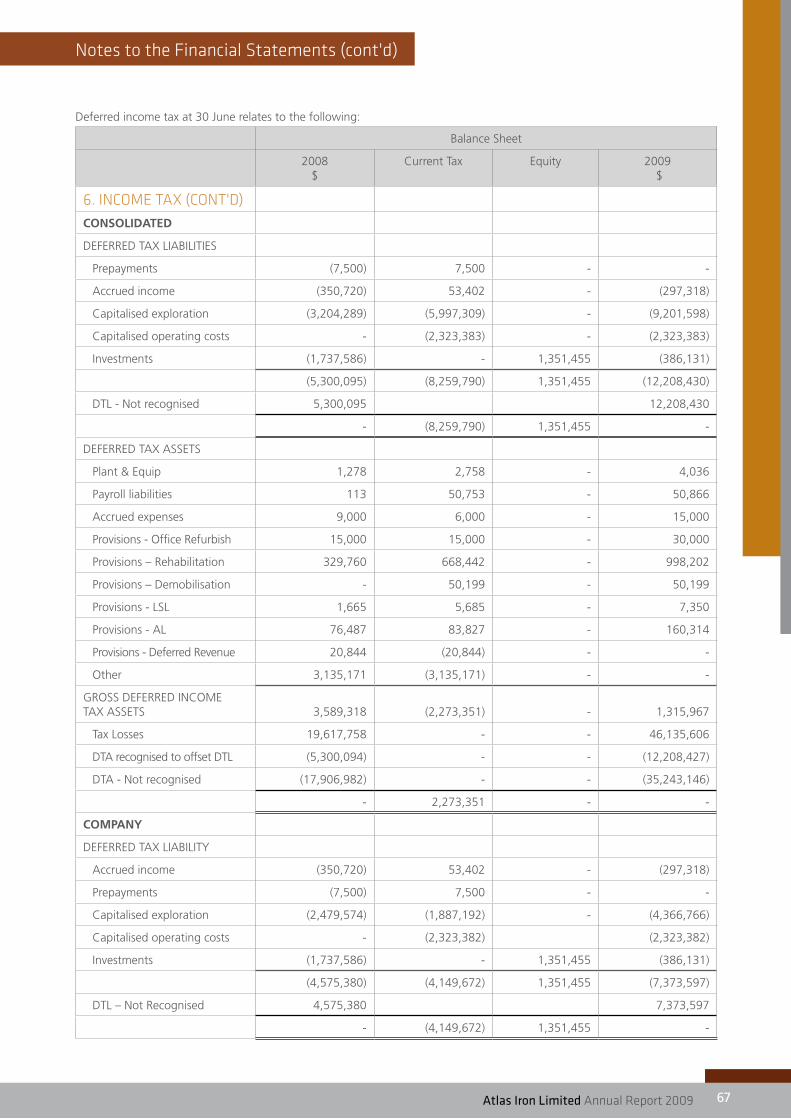
Notes to the financial statements (cont'd)
atlas Iron Limited Annual Report 2009 67
Deferred income tax at 30 June relates to the following:
Balance Sheet
2008$
Current Tax Equity 2009 $
6. iNCOmE TAX (CONT'D)
CONSOLIDATED
DEFERRED TAX LIABILITIES
Prepayments (7,500) 7,500 - -
Accrued income (350,720) 53,402 - (297,318)
Capitalised exploration (3,204,289) (5,997,309) - (9,201,598)
Capitalised operating costs - (2,323,383) - (2,323,383)
Investments (1,737,586) - 1,351,455 (386,131)
(5,300,095) (8,259,790) 1,351,455 (12,208,430)
DTL - Not recognised 5,300,095 12,208,430
- (8,259,790) 1,351,455 -
DEFERRED TAX ASSETS
Plant & Equip 1,278 2,758 - 4,036
Payroll liabilities 113 50,753 - 50,866
Accrued expenses 9,000 6,000 - 15,000
Provisions - Office Refurbish 15,000 15,000 - 30,000
Provisions – Rehabilitation 329,760 668,442 - 998,202
Provisions – Demobilisation - 50,199 - 50,199
Provisions - LSL 1,665 5,685 - 7,350
Provisions - AL 76,487 83,827 - 160,314
Provisions - Deferred Revenue 20,844 (20,844) - -
Other 3,135,171 (3,135,171) - -
GROSS DEFERRED INCOME TAX ASSETS 3,589,318 (2,273,351) - 1,315,967
Tax Losses 19,617,758 - - 46,135,606
DTA recognised to offset DTL (5,300,094) - - (12,208,427)
DTA - Not recognised (17,906,982) - - (35,243,146)
- 2,273,351 - -
COMPANY
DEFERRED TAX LIABILITY
Accrued income (350,720) 53,402 - (297,318)
Prepayments (7,500) 7,500 - -
Capitalised exploration (2,479,574) (1,887,192) - (4,366,766)
Capitalised operating costs - (2,323,382) (2,323,382)
Investments (1,737,586) - 1,351,455 (386,131)
(4,575,380) (4,149,672) 1,351,455 (7,373,597)
DTL – Not Recognised 4,575,380 7,373,597
- (4,149,672) 1,351,455 -
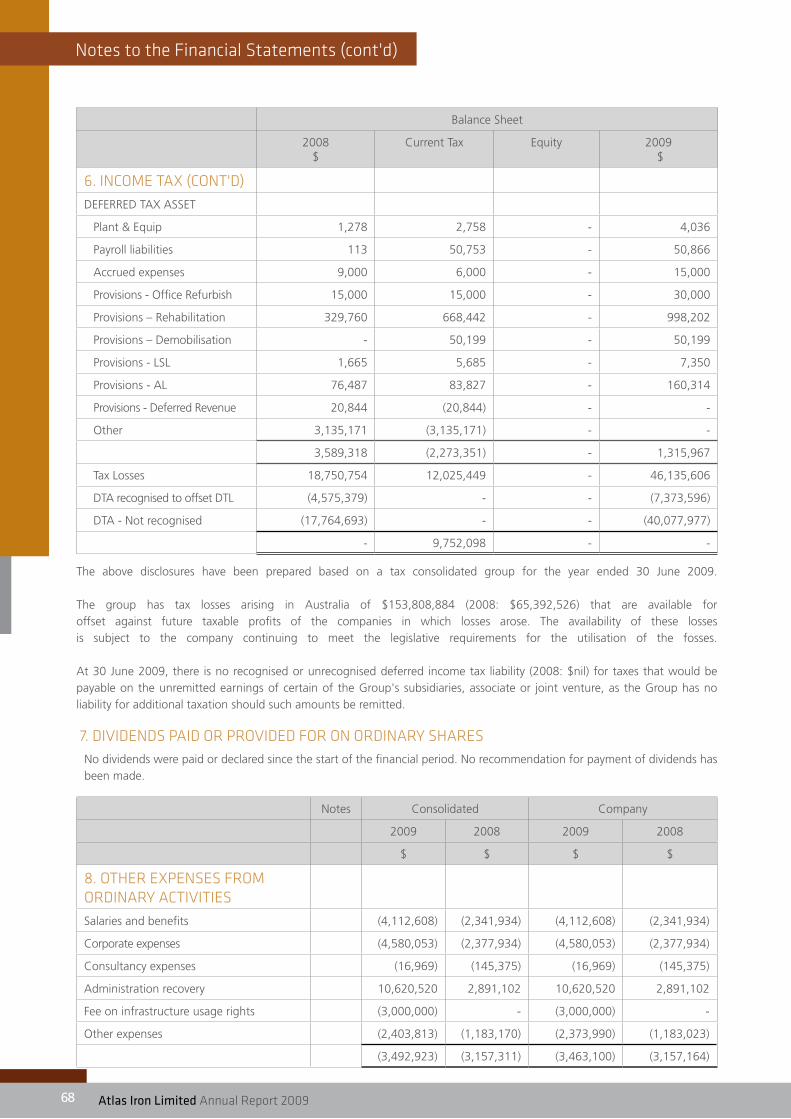
68 atlas Iron Limited Annual Report 200968
Notes to the financial statements (cont'd)
Balance Sheet
2008$
Current Tax Equity 2009 $
6. iNCOmE TAX (CONT'D)
DEFERRED TAX ASSET
Plant & Equip 1,278 2,758 - 4,036
Payroll liabilities 113 50,753 - 50,866
Accrued expenses 9,000 6,000 - 15,000
Provisions - Office Refurbish 15,000 15,000 - 30,000
Provisions – Rehabilitation 329,760 668,442 - 998,202
Provisions – Demobilisation - 50,199 - 50,199
Provisions - LSL 1,665 5,685 - 7,350
Provisions - AL 76,487 83,827 - 160,314
Provisions - Deferred Revenue 20,844 (20,844) - -
Other 3,135,171 (3,135,171) - -
3,589,318 (2,273,351) - 1,315,967
Tax Losses 18,750,754 12,025,449 - 46,135,606
DTA recognised to offset DTL (4,575,379) - - (7,373,596)
DTA - Not recognised (17,764,693) - - (40,077,977)
- 9,752,098 - -
The above disclosures have been prepared based on a tax consolidated group for the year ended 30 June 2009. The group has tax losses arising in Australia of $153,808,884 (2008: $65,392,526) that are available for offset against future taxable profits of the companies in which losses arose. The availability of these losses is subject to the company continuing to meet the legislative requirements for the utilisation of the fosses. At 30 June 2009, there is no recognised or unrecognised deferred income tax liability (2008: $nil) for taxes that would be payable on the unremitted earnings of certain of the Group's subsidiaries, associate or joint venture, as the Group has no liability for additional taxation should such amounts be remitted.
7. DiviDENDs PAiD OR PROviDED fOR ON ORDiNARy shAREs No dividends were paid or declared since the start of the financial period. No recommendation for payment of dividends has
been made.
Notes Consolidated Company
2009 2008 2009 2008
$ $ $ $
8. OThER EXPENsEs fROm ORDiNARy ACTiviTiEs
Salaries and benefits (4,112,608) (2,341,934) (4,112,608) (2,341,934)
Corporate expenses (4,580,053) (2,377,934) (4,580,053) (2,377,934)
Consultancy expenses (16,969) (145,375) (16,969) (145,375)
Administration recovery 10,620,520 2,891,102 10,620,520 2,891,102
Fee on infrastructure usage rights (3,000,000) - (3,000,000) -
Other expenses (2,403,813) (1,183,170) (2,373,990) (1,183,023)
(3,492,923) (3,157,311) (3,463,100) (3,157,164)

Notes to the financial statements (cont'd)
atlas Iron Limited Annual Report 2009 69
Notes Consolidated Company
2009 2008 2009 2008
$ $ $ $
9. TRADE AND OThER RECEivABLEs
Current
Trade receivables 470,165 - 470,165 -
Goods and Services Tax receivable and other receivables 3,676,151 3,061,499 3,676,151 3,061,499
Interest receivable 151,806 - 151,806 -
Prepayments 197,022 68,122 197,022 68,122
Other receivables 536,928 - 536,928 -
5,032,072 3,129,621 5,032,072 3,129,621
No receivables are past due
Non – Current
Security deposits 5,146,413 5,110,000 5,146,413 5,110,000
Prepayments 15,857,544 1,569,479 15,857,544 1,569,479
21,003,957 6,679,479 21,003,957 6,679,479
The Security deposits represent cash backing for exploration and mining bonds, office bonds and a credit card guarantee facility.
The prepayment represents Port charges paid in advance under the terms of a contract with Port Hedland Port Authority to underpin the development of the new Utah Point facility.
10. iNvENTORiEs
Run of mine materials 1,173,405 - 1,173,405 -
Iron ore stockpiles 7,162,465 - 7,162,465 -
8,335,870 - 8,335,870 -
11. OThER fiNANCiAL AssETs
NON-CURRENT
Investment in other listed entity at cost – associate - - 6,120,761 3,943,620
Investment in listed entity, at market value 5,516,142 10,020,993 5,516,142 10,020,993
Investment in controlled entities, at cost - - 16,569,266 16,569,266
Loans to controlled entities net of impairment - - 3,186,991 2,415,714
5,516,142 10,020,993 31,393,160 32,949,593
Loans to controlled entities
The ultimate recoverability of intercompany receivables is dependent upon future exploration success of controlled entities. Intercompany receivables are interest free and repayable on demand. Loans to controlled entities are shown net of impairment writedowns of $45,699,890. (2008: $16,699,867). The total loans advanced are shown in note 28.
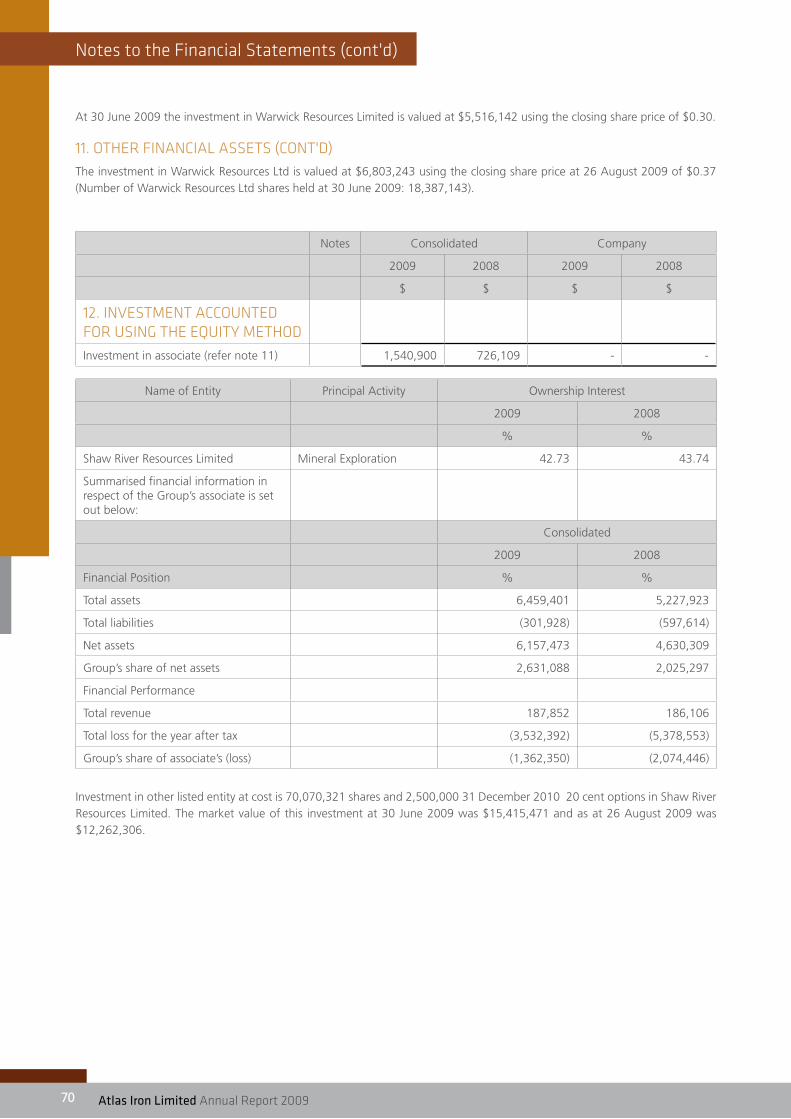
70 atlas Iron Limited Annual Report 200970
Notes to the financial statements (cont'd)
At 30 June 2009 the investment in Warwick Resources Limited is valued at $5,516,142 using the closing share price of $0.30.
11. OThER fiNANCiAL AssETs (CONT'D)The investment in Warwick Resources Ltd is valued at $6,803,243 using the closing share price at 26 August 2009 of $0.37 (Number of Warwick Resources Ltd shares held at 30 June 2009: 18,387,143).
Notes Consolidated Company
2009 2008 2009 2008
$ $ $ $
12. iNvEsTmENT ACCOUNTED fOR UsiNg ThE EqUiTy mEThOD
Investment in associate (refer note 11) 1,540,900 726,109 - -
Name of Entity Principal Activity Ownership Interest
2009 2008
% %
Shaw River Resources Limited Mineral Exploration 42.73 43.74
Summarised financial information in respect of the Group’s associate is set out below:
Consolidated
2009 2008
Financial Position % %
Total assets 6,459,401 5,227,923
Total liabilities (301,928) (597,614)
Net assets 6,157,473 4,630,309
Group’s share of net assets 2,631,088 2,025,297
Financial Performance
Total revenue 187,852 186,106
Total loss for the year after tax (3,532,392) (5,378,553)
Group’s share of associate’s (loss) (1,362,350) (2,074,446)
Investment in other listed entity at cost is 70,070,321 shares and 2,500,000 31 December 2010 20 cent options in Shaw River Resources Limited. The market value of this investment at 30 June 2009 was $15,415,471 and as at 26 August 2009 was $12,262,306.
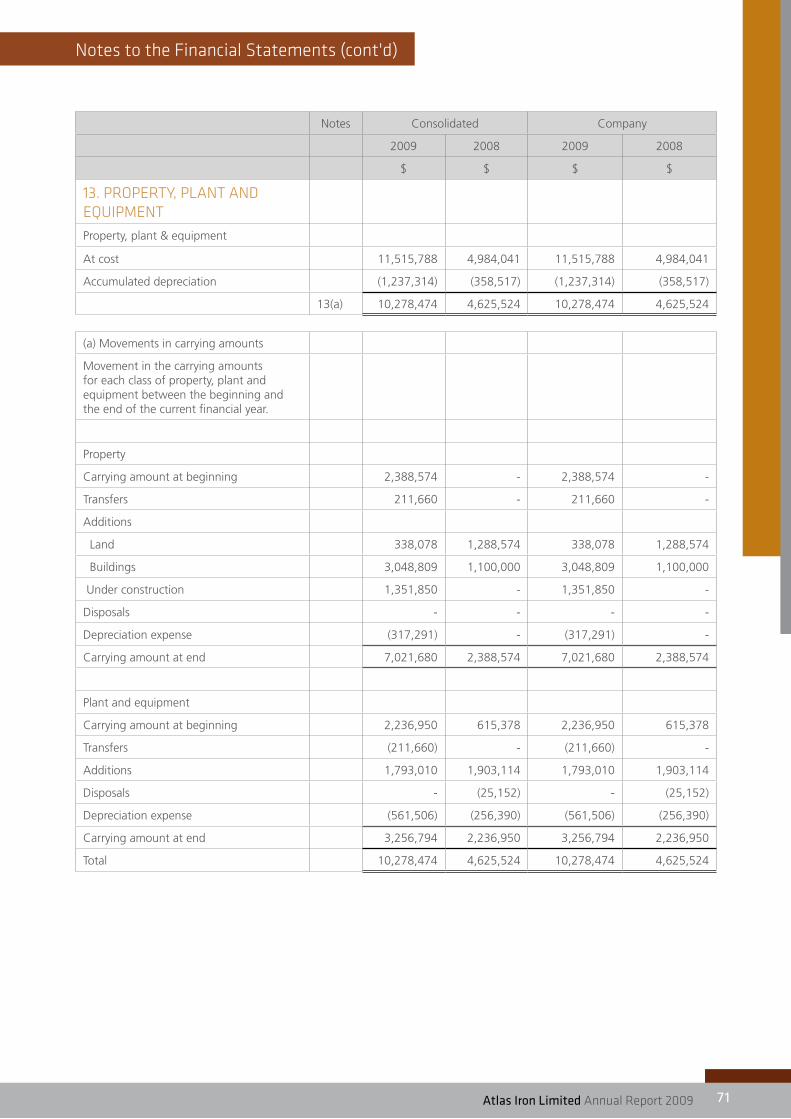
Notes to the financial statements (cont'd)
atlas Iron Limited Annual Report 2009 71
Notes Consolidated Company
2009 2008 2009 2008
$ $ $ $
13. PROPERTy, PLANT AND EqUiPmENT
Property, plant & equipment
At cost 11,515,788 4,984,041 11,515,788 4,984,041
Accumulated depreciation (1,237,314) (358,517) (1,237,314) (358,517)
13(a) 10,278,474 4,625,524 10,278,474 4,625,524
(a) Movements in carrying amounts
Movement in the carrying amounts for each class of property, plant and equipment between the beginning and the end of the current financial year.
Property
Carrying amount at beginning 2,388,574 - 2,388,574 -
Transfers 211,660 - 211,660 -
Additions
Land 338,078 1,288,574 338,078 1,288,574
Buildings 3,048,809 1,100,000 3,048,809 1,100,000
Under construction 1,351,850 - 1,351,850 -
Disposals - - - -
Depreciation expense (317,291) - (317,291) -
Carrying amount at end 7,021,680 2,388,574 7,021,680 2,388,574
Plant and equipment
Carrying amount at beginning 2,236,950 615,378 2,236,950 615,378
Transfers (211,660) - (211,660) -
Additions 1,793,010 1,903,114 1,793,010 1,903,114
Disposals - (25,152) - (25,152)
Depreciation expense (561,506) (256,390) (561,506) (256,390)
Carrying amount at end 3,256,794 2,236,950 3,256,794 2,236,950
Total 10,278,474 4,625,524 10,278,474 4,625,524

72 atlas Iron Limited Annual Report 200972
Notes to the financial statements (cont'd)
Notes Consolidated Company
2009 2008 2009 2008
$ $ $ $
14. iNTANgiBLEs
Computer software 496,355 381,555 496,355 381,555
Accumulated amortisation (279,283) (94,979) (279,283) (94,979)
Carrying amount at end 14(a) 217,072 286,576 217,072 286,576
a) Computer software
Carrying amount at beginning 286,576 114,633 286,576 114,633
Additions 114,803 259,092 114,803 259,092
Disposals - - - -
Amortisation expense (184,307) (87,149) (184,307) (87,149)
Carrying amount at end 217,072 286,576 217,072 286,576
15. miNiNg DEvELOPmENT COsTs
At cost 28,254,797 4,884,235 28,254,797 4,294,424
Accumulated amortisation (2,849,432) - (2,849,432) -
25,405,365 4,884,235 25,405,365 4,294,424
Mining development cost breakdown:
Carrying amount at beginning 4,884,235 - 4,294,424 -
Additions 20,992,563 4,884,235 20,992,563 4,294,424
Change in rehabilitation provision 2,696,541 - 2,696,541 -
Reclassification of costs (to)/from mining tenements
(585,242) - 4,569 -
Transfers from mining tenements 266,700 - 266,700 -
Amortisation (2,849,432) - (2,849,432) -
Carrying amount at end 25,405,365 4,884,235 25,405,365 4,294,424
16. miNiNg TENEmENTs CAPiTALisED
Tenement acquisition costs 25,113,096 23,028,538 8,996,988 8,265,247
25,113,096 23,028,538 8,996,988 8,265,247
Tenement acquisition cost breakdown:
Carrying amount at beginning 23,028,538 2,813,842 8,265,247 1,766,844
Acquisitions 2,616,872 20,616,906 1,595,886 6,900,613
Divestments - (268,140) (220) (268,140)
Reclassification of costs (to)/from mining development
585,242 - (4,569) -
Transfers to development costs (266,700) - (266,700) -
Write downs (850,856) (134,070) (592,656) (134,070)
Carrying amount at end 25,113,096 23,028,538 8,996,988 8,265,247
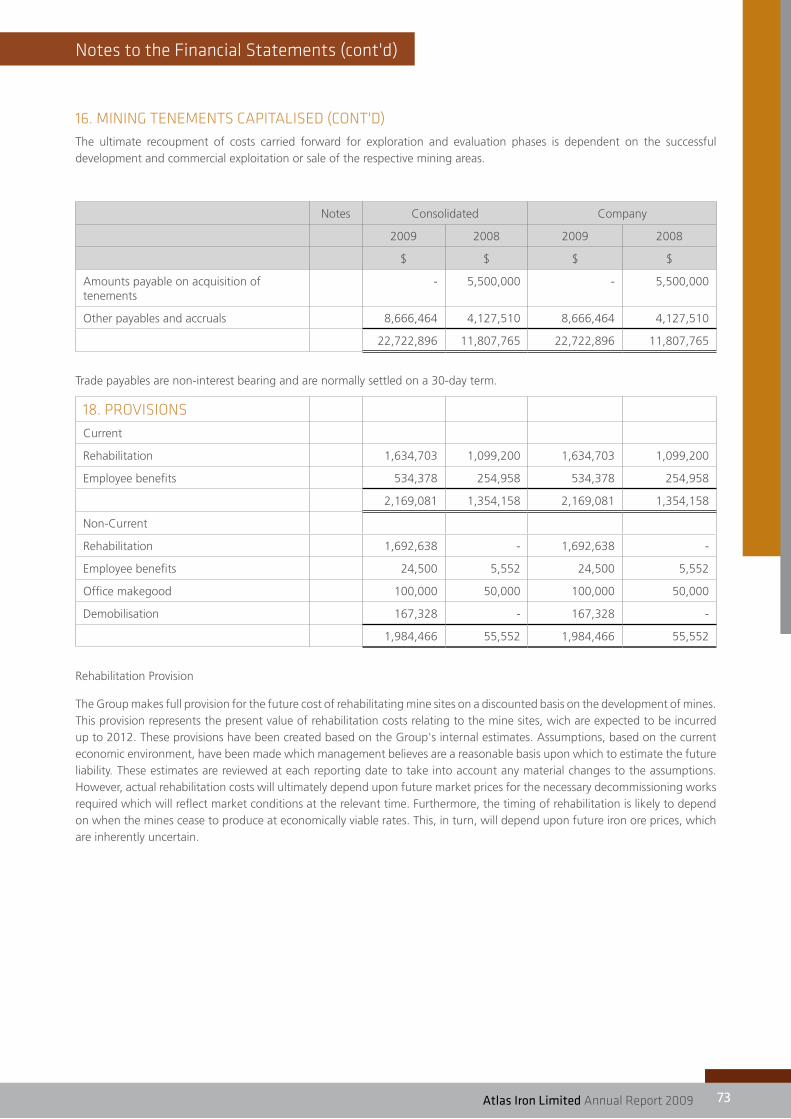
Notes to the financial statements (cont'd)
atlas Iron Limited Annual Report 2009 73
16. miNiNg TENEmENTs CAPiTALisED (CONT'D)The ultimate recoupment of costs carried forward for exploration and evaluation phases is dependent on the successful development and commercial exploitation or sale of the respective mining areas.
Notes Consolidated Company
2009 2008 2009 2008
$ $ $ $
Amounts payable on acquisition of tenements
- 5,500,000 - 5,500,000
Other payables and accruals 8,666,464 4,127,510 8,666,464 4,127,510
22,722,896 11,807,765 22,722,896 11,807,765
Trade payables are non-interest bearing and are normally settled on a 30-day term.
18. PROvisiONs
Current
Rehabilitation 1,634,703 1,099,200 1,634,703 1,099,200
Employee benefits 534,378 254,958 534,378 254,958
2,169,081 1,354,158 2,169,081 1,354,158
Non-Current
Rehabilitation 1,692,638 - 1,692,638 -
Employee benefits 24,500 5,552 24,500 5,552
Office makegood 100,000 50,000 100,000 50,000
Demobilisation 167,328 - 167,328 -
1,984,466 55,552 1,984,466 55,552
Rehabilitation Provision
The Group makes full provision for the future cost of rehabilitating mine sites on a discounted basis on the development of mines. This provision represents the present value of rehabilitation costs relating to the mine sites, wich are expected to be incurred up to 2012. These provisions have been created based on the Group's internal estimates. Assumptions, based on the current economic environment, have been made which management believes are a reasonable basis upon which to estimate the future liability. These estimates are reviewed at each reporting date to take into account any material changes to the assumptions. However, actual rehabilitation costs will ultimately depend upon future market prices for the necessary decommissioning works required which will reflect market conditions at the relevant time. Furthermore, the timing of rehabilitation is likely to depend on when the mines cease to produce at economically viable rates. This, in turn, will depend upon future iron ore prices, which are inherently uncertain.
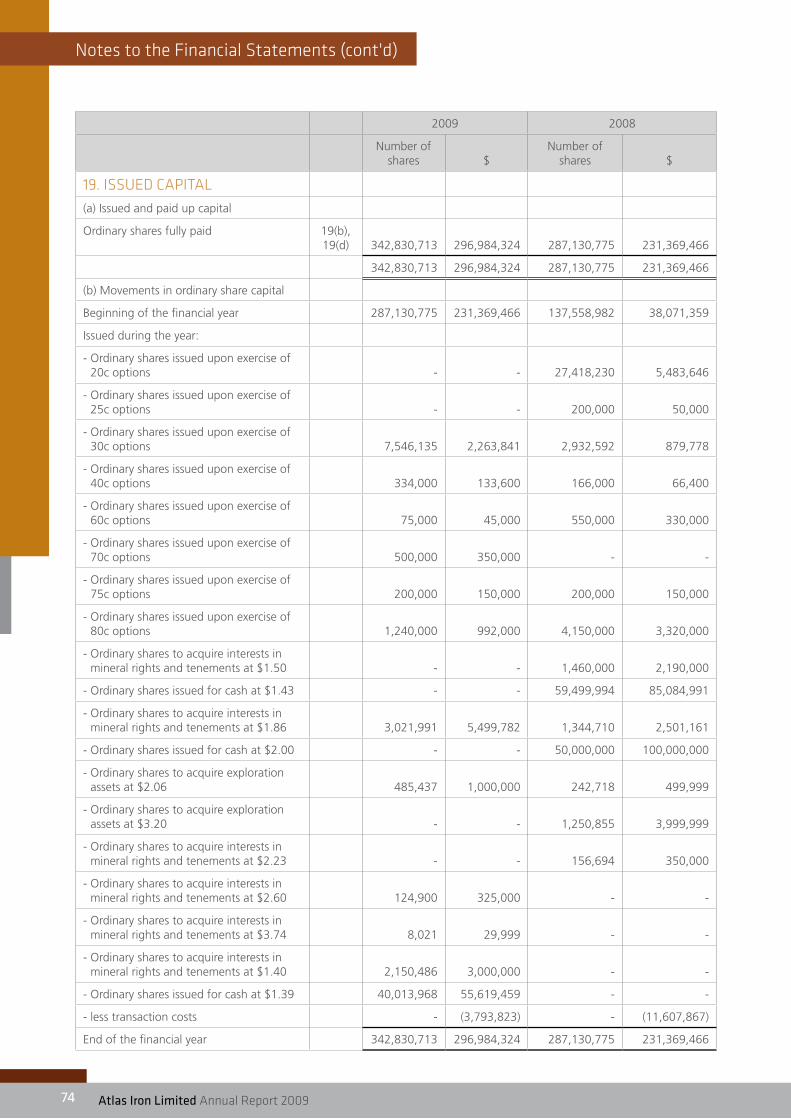
74 atlas Iron Limited Annual Report 200974
Notes to the financial statements (cont'd)
2009 2008
Number of shares $
Number of shares $
19. issUED CAPiTAL
(a) Issued and paid up capital
Ordinary shares fully paid 19(b), 19(d) 342,830,713 296,984,324 287,130,775 231,369,466
342,830,713 296,984,324 287,130,775 231,369,466
(b) Movements in ordinary share capital
Beginning of the financial year 287,130,775 231,369,466 137,558,982 38,071,359
Issued during the year:
- Ordinary shares issued upon exercise of 20c options - - 27,418,230 5,483,646
- Ordinary shares issued upon exercise of 25c options - - 200,000 50,000
- Ordinary shares issued upon exercise of 30c options 7,546,135 2,263,841 2,932,592 879,778
- Ordinary shares issued upon exercise of 40c options 334,000 133,600 166,000 66,400
- Ordinary shares issued upon exercise of 60c options 75,000 45,000 550,000 330,000
- Ordinary shares issued upon exercise of 70c options 500,000 350,000 - -
- Ordinary shares issued upon exercise of 75c options 200,000 150,000 200,000 150,000
- Ordinary shares issued upon exercise of 80c options 1,240,000 992,000 4,150,000 3,320,000
- Ordinary shares to acquire interests in mineral rights and tenements at $1.50 - - 1,460,000 2,190,000
- Ordinary shares issued for cash at $1.43 - - 59,499,994 85,084,991
- Ordinary shares to acquire interests in mineral rights and tenements at $1.86 3,021,991 5,499,782 1,344,710 2,501,161
- Ordinary shares issued for cash at $2.00 - - 50,000,000 100,000,000
- Ordinary shares to acquire exploration assets at $2.06 485,437 1,000,000 242,718 499,999
- Ordinary shares to acquire exploration assets at $3.20 - - 1,250,855 3,999,999
- Ordinary shares to acquire interests in mineral rights and tenements at $2.23 - - 156,694 350,000
- Ordinary shares to acquire interests in mineral rights and tenements at $2.60 124,900 325,000 - -
- Ordinary shares to acquire interests in mineral rights and tenements at $3.74 8,021 29,999 - -
- Ordinary shares to acquire interests in mineral rights and tenements at $1.40 2,150,486 3,000,000 - -
- Ordinary shares issued for cash at $1.39 40,013,968 55,619,459 - -
- less transaction costs - (3,793,823) - (11,607,867)
End of the financial year 342,830,713 296,984,324 287,130,775 231,369,466

Notes to the financial statements (cont'd)
atlas Iron Limited Annual Report 2009 75
Number of options Number of options
2009 2008
Beginning of the financial year 48,844,771 77,386,413
Issued during the year:
Exercisable at 75c, on or before 30 June 2012 50,000
Exercisable at 96c, on or before 16 July 2012 50,000
Exercisable at $1.06, on or before 16 July 2012 50,000
Exercisable at $2.46, on or before 20 August 2012 500,000
Exercisable at $1.40, on or before 30 September 2012 25,000
Exercisable at $1.50, on or before 30 September 2012 425,000
Exercisable at $1.60, on or before 30 September 2012 50,000
Exercisable at $1.70, on or before 30 September 2012 50,000
Exercisable at $1.90, on or before 30 September 2012 75,000
Exercisable at $1.90, on or before 30 September 2012* 100,000
Exercisable at $2.00, on or before 30 September 2012 200,000
Exercisable at $2.05, on or before 30 September 2012 25,000
Exercisable at $2.15, on or before 30 September 2012 75,000
Exercisable at $2.20, on or before 30 September 2012 75,000
Exercisable at $2.25, on or before 30 September 2012 150,000
Exercisable at $2.30, on or before 30 September 2012 35,000
Exercisable at $2.35, on or before 30 September 2012 25,000
Exercisable at $2.45, on or before 30 September 2012 135,000
Exercisable at $2.45, on or before 30 September 2012* 75,000
Exercisable at $2.50, on or before 30 September 2012 225,000
Exercisable at $2.50, on or before 30 September 2012 120,000
Exercisable at $2.55, on or before 30 September 2012 130,000
Exercisable at $2.65, on or before 30 September 2012 35,000
Exercisable at $2.75, on or before 30 September 2012 135,000
Exercisable at $2.85, on or before 30 September 2012 230,000
Exercisable at $3.00, on or before 30 September 2012 150,000
Exercisable at $3.35, on or before 30 September 2012 150,000
Exercisable at $2.10, on or before 31 March 2013 25,000
Exercisable at $2.15, on or before 31 March 2013 50,000
Exercisable at $2.30, on or before 31 March 2013 40,000
Exercisable at $2.40, on or before 31 March 2013 25,000
Exercisable at $2.45, on or before 31 March 2013 90,000
Exercisable at $2.65, on or before 31 March 2013 90,000
Exercisable at $2.75, on or before 31 March 2013 40,000
Exercisable at $3.00, on or before 31 March 2013 50,000
Exercisable at $4.50, on or before 1 May 2011 3,000,000
Exercisable at $4.20, on or before 30 June 2013 15,000

76 atlas Iron Limited Annual Report 200976
Notes to the financial statements (cont'd)
Number of options Number of options
2009 2008
Exercisable at $4.25, on or before 30 June 2013 40,000
Exercisable at $4.35, on or before 30 June 2013 25,000
Exercisable at $4.45, on or before 30 June 2013 115,000
Exercisable at $4.75, on or before 30 June 2013 15,000
Exercisable at $4.80, on or before 30 June 2013 40,000
Exercisable at $4.95, on or before 30 June 2013 25,000
Exercisable at $5.00, on or before 30 June 2013 115,000
Exercisable at $4.08 Options exp 30 Jun 2013 125,000
Exercisable at $4.62 Options exp 30 Jun 2013 125,000
Exercisable at $3.06 Options exp 30 Jun 2013 25,000
Exercisable at $3.46 Options exp 30 Jun 2013 25,000
Exercisable at $2.55 on or before 30 September 2012 30,000
Exercisable at $2.85 on or before 30 September 2012 30,000
Exercisable at $2.35 on or before 30 June 2013 50,000
Exercisable at $2.65 on or before 30 June 2013 50,000
Exercisable at $2.30 on or before 30 June 2013 25,000
Exercisable at $2.60 on or before 30 June 2013 25,000
Exercisable at $1.65 on or before 30 September 2013 350,000
Exercisable at $1.85 on or before 30 September 2013 350,000
Exercisable at $1.00 on or before 30 September 2013 25,000
Exercisable at $1.15 on or before 30 September 2013 25,000
Exercisable at $1.10 on or before 30 September 2013 25,000
Exercisable at $1.25 on or before 30 September 2013 25,000
Exercisable at $2.00 on or before 30 September 2013 15,000
Exercisable at $2.25 on or before 30 September 2013 15,000
Exercisable at $1.05 on or before 30 December 2013 25,000
Exercisable at $1.20 on or before 30 December 2013 25,000
Exercisable at $1.35 on or before 30 December 2013 50,000
Exercisable at $1.50 on or before 30 December 2013 50,000
Exercisable at $1.50 on or before 30 December 2013 15,000
Exercisable at $1.70 on or before 30 December 2013 15,000
Exercisable at $0.80 on or before 30 December 2013 40,000
Exercisable at $0.90 on or before 30 December 2013 40,000
Exercisable at $0.55 on or before 30 December 2013 10,000
Exercisable at $0.60 on or before 30 December 2013 10,000
Exercisable at $1.30 on or before 30 December 2013 100,000
Exercisable at $1.65 on or before 31 March 2014 50,000
Exercisable at $1.85 on or before 31 March 2014 50,000
Exercisable at $1.40 on or before 31 March 2014 15,000
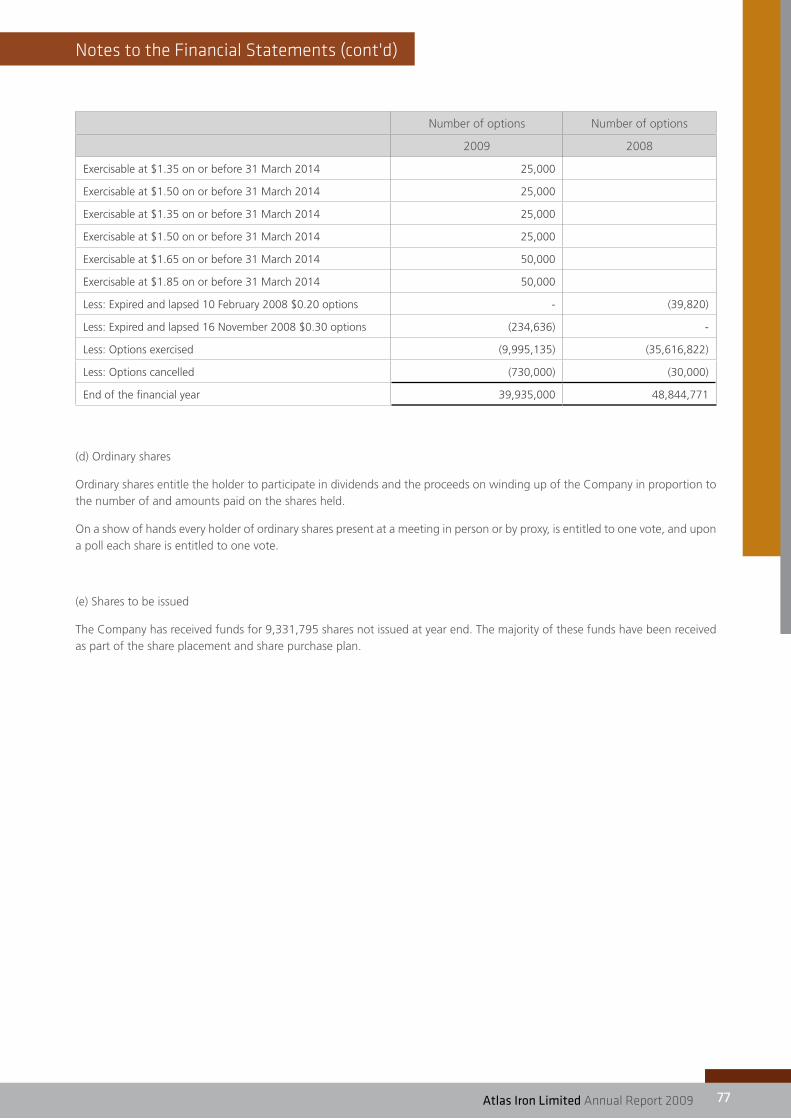
Notes to the financial statements (cont'd)
atlas Iron Limited Annual Report 2009 77
Number of options Number of options
2009 2008
Exercisable at $1.35 on or before 31 March 2014 25,000
Exercisable at $1.50 on or before 31 March 2014 25,000
Exercisable at $1.35 on or before 31 March 2014 25,000
Exercisable at $1.50 on or before 31 March 2014 25,000
Exercisable at $1.65 on or before 31 March 2014 50,000
Exercisable at $1.85 on or before 31 March 2014 50,000
Less: Expired and lapsed 10 February 2008 $0.20 options - (39,820)
Less: Expired and lapsed 16 November 2008 $0.30 options (234,636) -
Less: Options exercised (9,995,135) (35,616,822)
Less: Options cancelled (730,000) (30,000)
End of the financial year 39,935,000 48,844,771
(d) Ordinary shares
Ordinary shares entitle the holder to participate in dividends and the proceeds on winding up of the Company in proportion to the number of and amounts paid on the shares held.
On a show of hands every holder of ordinary shares present at a meeting in person or by proxy, is entitled to one vote, and upon a poll each share is entitled to one vote.
(e) Shares to be issued
The Company has received funds for 9,331,795 shares not issued at year end. The majority of these funds have been received as part of the share placement and share purchase plan.
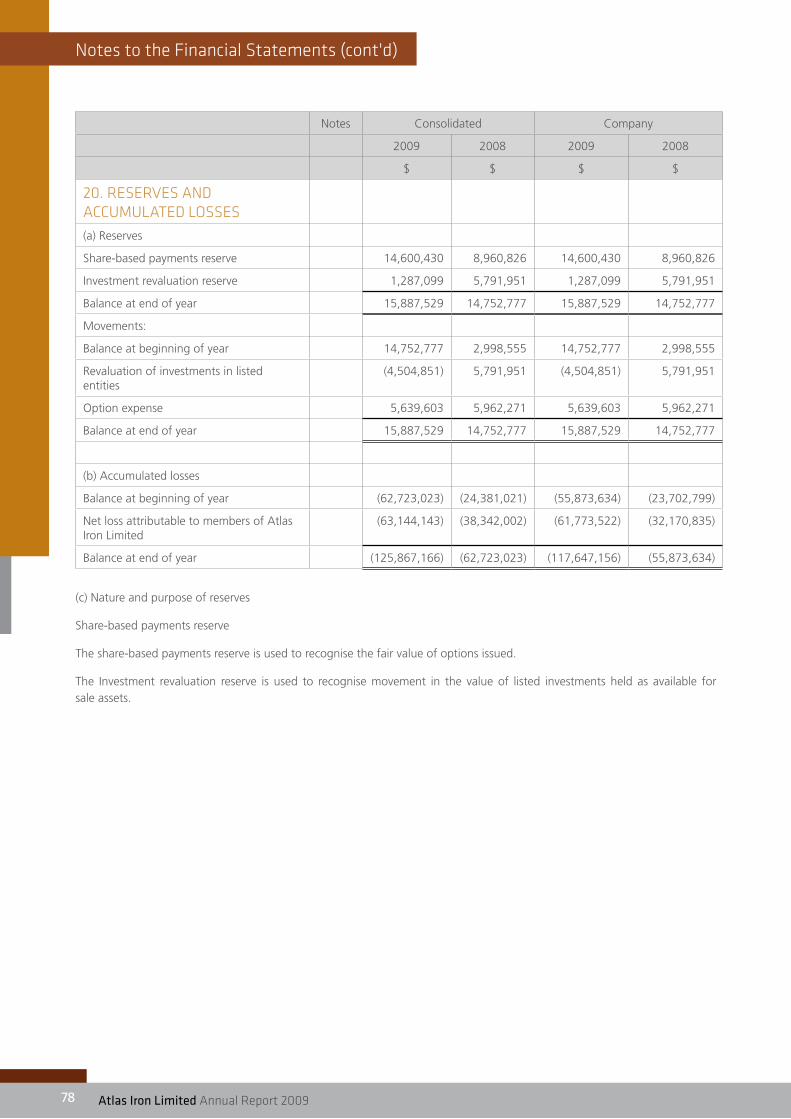
78 atlas Iron Limited Annual Report 200978
Notes to the financial statements (cont'd)
Notes Consolidated Company
2009 2008 2009 2008
$ $ $ $
20. REsERvEs AND ACCUmULATED LOssEs
(a) Reserves
Share-based payments reserve 14,600,430 8,960,826 14,600,430 8,960,826
Investment revaluation reserve 1,287,099 5,791,951 1,287,099 5,791,951
Balance at end of year 15,887,529 14,752,777 15,887,529 14,752,777
Movements:
Balance at beginning of year 14,752,777 2,998,555 14,752,777 2,998,555
Revaluation of investments in listed entities
(4,504,851) 5,791,951 (4,504,851) 5,791,951
Option expense 5,639,603 5,962,271 5,639,603 5,962,271
Balance at end of year 15,887,529 14,752,777 15,887,529 14,752,777
(b) Accumulated losses
Balance at beginning of year (62,723,023) (24,381,021) (55,873,634) (23,702,799)
Net loss attributable to members of Atlas Iron Limited
(63,144,143) (38,342,002) (61,773,522) (32,170,835)
Balance at end of year (125,867,166) (62,723,023) (117,647,156) (55,873,634)
(c) Nature and purpose of reserves
Share-based payments reserve
The share-based payments reserve is used to recognise the fair value of options issued.
The Investment revaluation reserve is used to recognise movement in the value of listed investments held as available for sale assets.

Notes to the financial statements (cont'd)
atlas Iron Limited Annual Report 2009 79
Consolidated Company
2009 2008 2009 2008
$ $ $ $
21. sTATEmENT Of CAsh fLOws
(a) Reconciliation of the net loss after income tax to the net cash flows from operations
Net loss (63,144,143) (38,342,002) (61,773,522) (32,170,835)
Non cash items
(Gain)/loss on disposal or write-down of tenements - (820,788) - (4,142,034)
Depreciation and amortisation of non current assets 3,677,073 343,539 3,677,073 343,539
Write-down of loan to controlled entities - - 29,000,023 16,288,692
Option expense 5,639,603 5,962,271 5,639,603 5,962,271
Impairment of mining tenements 850,856 - 592,656 -
Shares issued related to exploration and evaluation activities 3,000,000 - 3,000,000 -
-Unrealised gain on foreign exchange (221,145) - (221,145) -
Share of loss of associate 1,362,350 2,074,446 - -
Changes in operating assets and liabilities
(Increase) in trade and other receivables (1,443,782) (3,298,900) (1,443,782) (3,298,900)
(Increase) in prepayments (14,357,544) - (14,357,544) -
(Increase) in inventories (8,335,870) - (8,335,870) -
Increase in trade and other payables 12,040,931 3,334,094 12,105,140 3,281,617
Increase in employee entitlements 298,365 158,490 298,365 158,490
(Decrease)/Increase in provision (468,400) 1,034,200 (468,400) 1,034,200
Net cash outflow from operating activities (61,101,706) (29,554,650) (32,287,403) (12,542,960)
Cash at bank and in hand earns interest at floating rates based on daily bank deposit rates.
Short-term deposits are made for varying periods of between one day and three months depending on the immediate cash requirements of the Group, and earn interest at the respective short-term deposit rates.
(b) Reconciliation of cash and cash equivalents
Cash and cash equivalents comprises:
cash at bank and in hand 76,824,146 2,540,686 76,824,146 2,540,686
short-term deposits 47,526,232 140,809,412 47,526,232 140,809,412
Closing cash and cash equivalents balance 124,350,378 143,350,098 124,350,378 143,350,098
(c) Non-cash financing and investing activities
During the year a total of 5,790,835 ordinary shares valued at $9,854,781 were issued to acquire mineral rights and tenements and an option over Wodgina mine infrastructure usage.
Options issued to employees and consultants for no consideration or as settlement for expenses are shown in note 5.

80 atlas Iron Limited Annual Report 200980
Notes to the financial statements (cont'd)
Consolidated Company
2009 2008 2009 2008
$ $ $ $
22. EXPENDiTURE COmmiTmENTs
(a) Exploration commitments
The Company has certain commitments to meet minimum expenditure requirements on the mineral exploration assets it has an interest in. Outstanding exploration commitments are as follows:
- not later than one year 2,194,631 1,469,806 1,523,402 1,076,128
2,194,631 1,469,806 1,523,402 1,076,128
(b) Contractual commitments
Purchase of property in Port Hedland (not later than one year) - 1,251,150 - 1,251,150
Port handling fees (not later than one year) 10,621,250 13,500,000 10,621,250 13,500,000
Camp construction costs 7,918,734 - 7,918,734 -
18,539,984 14,751,150 18,539,984 14,751,150
(c) Lease expenditure commitments
Operating leases (non cancellable):
Minimum lease payments
- not later than one year 1,235,855 540,646 892,655 540,646
- later than one year and not later than five years 2,847,172 703,124 2,512,959 703,124
Aggregate expenditure contracted for at reporting date 4,083,027 1,243,770 3,405,614 1,243,770
The Group has entered into leases for office and accommodation buildings, motor vehicles and office equipment. These leases have an average remaining life of 2.4 years.
(d) Remuneration commitments
Amounts disclosed as remuneration commitments include commitments arising from the service contracts of key management personnel referred to in note 27 that are not recognised as liabilities and are not included in the key management personnel compensation.
- not later than one year 763,000 436,000 763,000 436,000
- later than one year and not later than five years - 436,000 - 436,000
763,000 872,000 763,000 872,000
(e) Capital commitments
Contribution towards port development 1,000,000 - 1,000,000 -
1,000,000 - 1,000,000 -
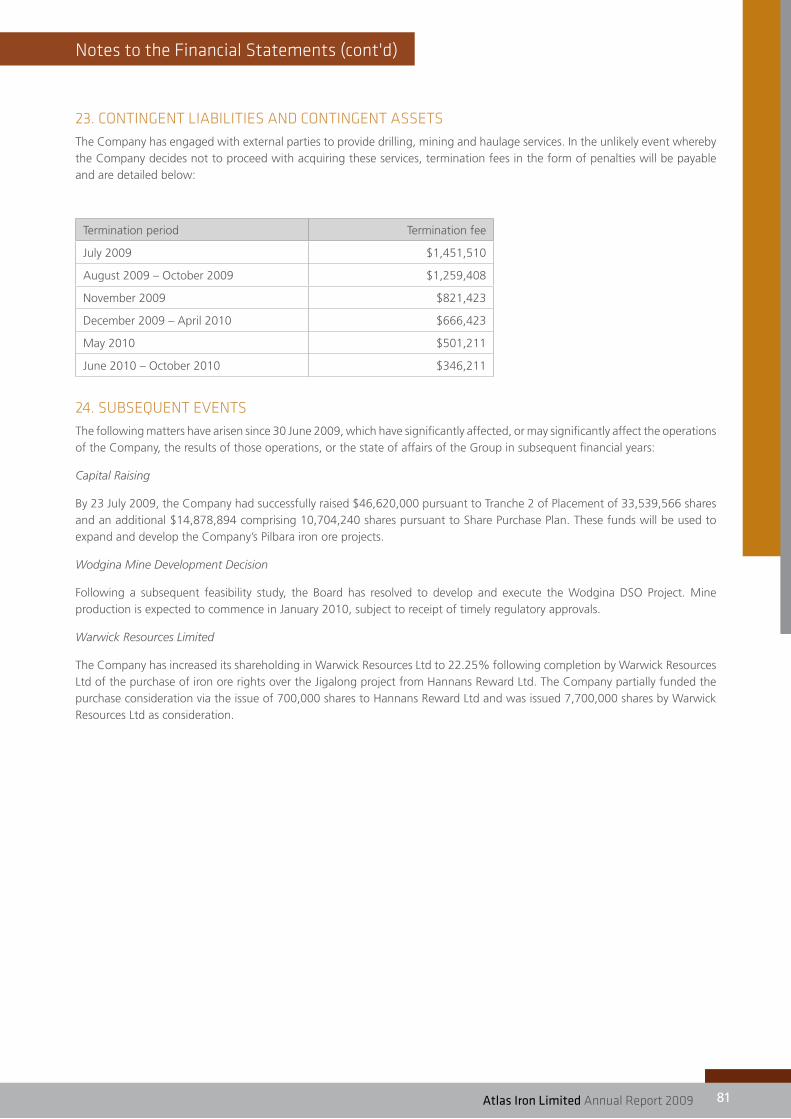
Notes to the financial statements (cont'd)
atlas Iron Limited Annual Report 2009 81
23. CONTiNgENT LiABiLiTiEs AND CONTiNgENT AssETs The Company has engaged with external parties to provide drilling, mining and haulage services. In the unlikely event whereby the Company decides not to proceed with acquiring these services, termination fees in the form of penalties will be payable and are detailed below:
Termination period Termination fee
July 2009 $1,451,510
August 2009 – October 2009 $1,259,408
November 2009 $821,423
December 2009 – April 2010 $666,423
May 2010 $501,211
June 2010 – October 2010 $346,211
24. sUBsEqUENT EvENTsThe following matters have arisen since 30 June 2009, which have significantly affected, or may significantly affect the operations of the Company, the results of those operations, or the state of affairs of the Group in subsequent financial years:
Capital Raising
By 23 July 2009, the Company had successfully raised $46,620,000 pursuant to Tranche 2 of Placement of 33,539,566 shares and an additional $14,878,894 comprising 10,704,240 shares pursuant to Share Purchase Plan. These funds will be used to expand and develop the Company’s Pilbara iron ore projects.
Wodgina Mine Development Decision
Following a subsequent feasibility study, the Board has resolved to develop and execute the Wodgina DSO Project. Mine production is expected to commence in January 2010, subject to receipt of timely regulatory approvals.
Warwick Resources Limited
The Company has increased its shareholding in Warwick Resources Ltd to 22.25% following completion by Warwick Resources Ltd of the purchase of iron ore rights over the Jigalong project from Hannans Reward Ltd. The Company partially funded the purchase consideration via the issue of 700,000 shares to Hannans Reward Ltd and was issued 7,700,000 shares by Warwick Resources Ltd as consideration.

82 atlas Iron Limited Annual Report 200982
Notes to the financial statements (cont'd)
Consolidated Company
2009 2008 2009 2008
$ $ $ $
25. LOss PER shARE
(a) Reconciliation of earnings to profit or loss
Net loss (63,144,143) (38,342,002) (61,773,522) (32,170,835)
Loss used in calculating basic and diluted loss per share (63,144,143) (38,342,002) (61,773,522) (32,170,835)
Number of shares
Number of shares
Number of shares
Number of shares
(b) Weighted average number of ordinary shares outstanding during the year used in calculating basic loss per share
Weighted average number of ordinary shares used in calculating basic loss per share 296,643,994 214,190,962 296,643,994 214,190,962
Effect of dilutive securities:
There were dilutive potential ordinary shares on issue at balance date. However, given the Company has made a loss, there is no dilution of earnings, hence diluted loss per share has not been disclosed.
26. AUDiTOR's REmUNERATiON
Amounts received or due and receivable by Stantons International for:
Audit or review of the financial report of the Company 103,116 57,552 103,116 57,552
103,116 57,552 103,116 57,552
27. kEy mANAgEmENT PERsONNEL (a) Shares issued on exercise of compensation options
Details of ordinary shares in the Company provided as a result of the exercise of compensation options to certain directors and executives are set out below. No amounts are unpaid on any shares issued on the exercise of options.
Date of exercise of options Amount paid per share (cents) Number of ordinary shares issued on exercise of options
30 June 2009
Nil
30 June 2008
20 December 2007 $0.60 250,000
11 February 2008 $0.20 1,415,000
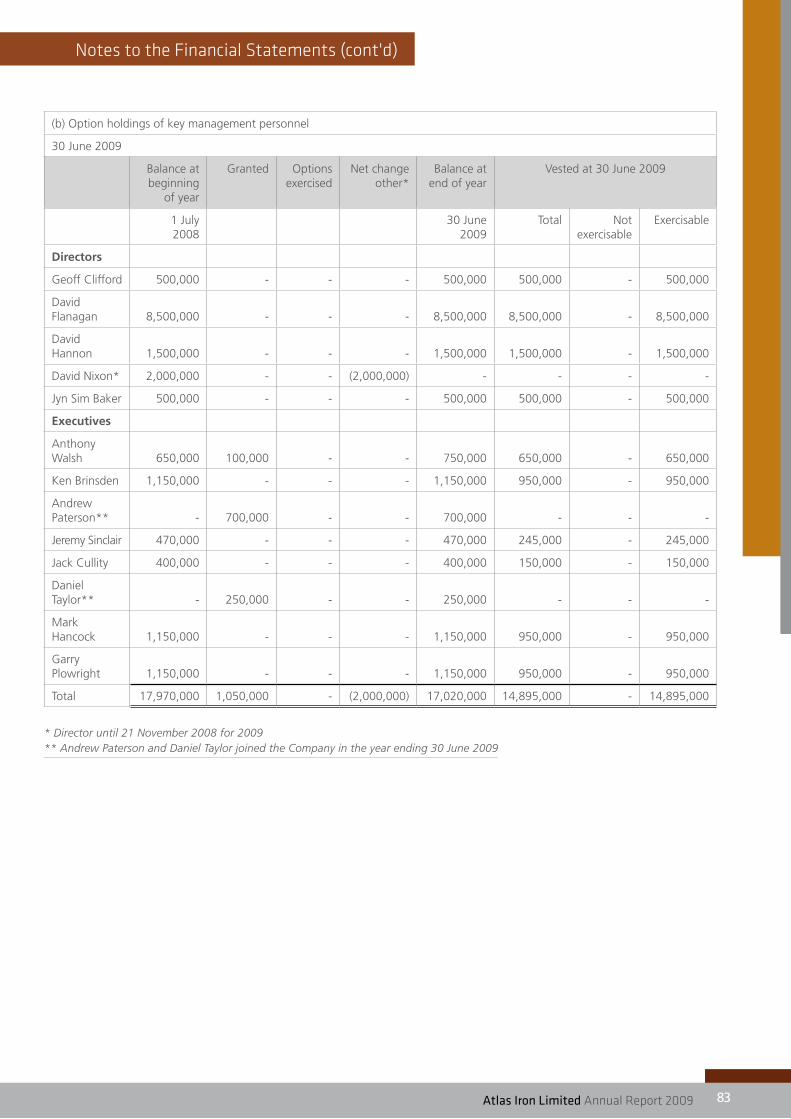
Notes to the financial statements (cont'd)
atlas Iron Limited Annual Report 2009 83
(b) Option holdings of key management personnel
30 June 2009
Balance at beginning
of year
Granted Options exercised
Net change other*
Balance at end of year
Vested at 30 June 2009
1 July 2008
30 June 2009
Total Not exercisable
Exercisable
Directors
Geoff Clifford 500,000 - - - 500,000 500,000 - 500,000
David Flanagan 8,500,000 - - - 8,500,000 8,500,000 - 8,500,000
David Hannon 1,500,000 - - - 1,500,000 1,500,000 - 1,500,000
David Nixon* 2,000,000 - - (2,000,000) - - - -
Jyn Sim Baker 500,000 - - - 500,000 500,000 - 500,000
Executives
Anthony Walsh 650,000 100,000 - - 750,000 650,000 - 650,000
Ken Brinsden 1,150,000 - - - 1,150,000 950,000 - 950,000
Andrew Paterson** - 700,000 - - 700,000 - - -
Jeremy Sinclair 470,000 - - - 470,000 245,000 - 245,000
Jack Cullity 400,000 - - - 400,000 150,000 - 150,000
Daniel Taylor** - 250,000 - - 250,000 - - -
Mark Hancock 1,150,000 - - - 1,150,000 950,000 - 950,000
Garry Plowright 1,150,000 - - - 1,150,000 950,000 - 950,000
Total 17,970,000 1,050,000 - (2,000,000) 17,020,000 14,895,000 - 14,895,000
* Director until 21 November 2008 for 2009 ** Andrew Paterson and Daniel Taylor joined the Company in the year ending 30 June 2009
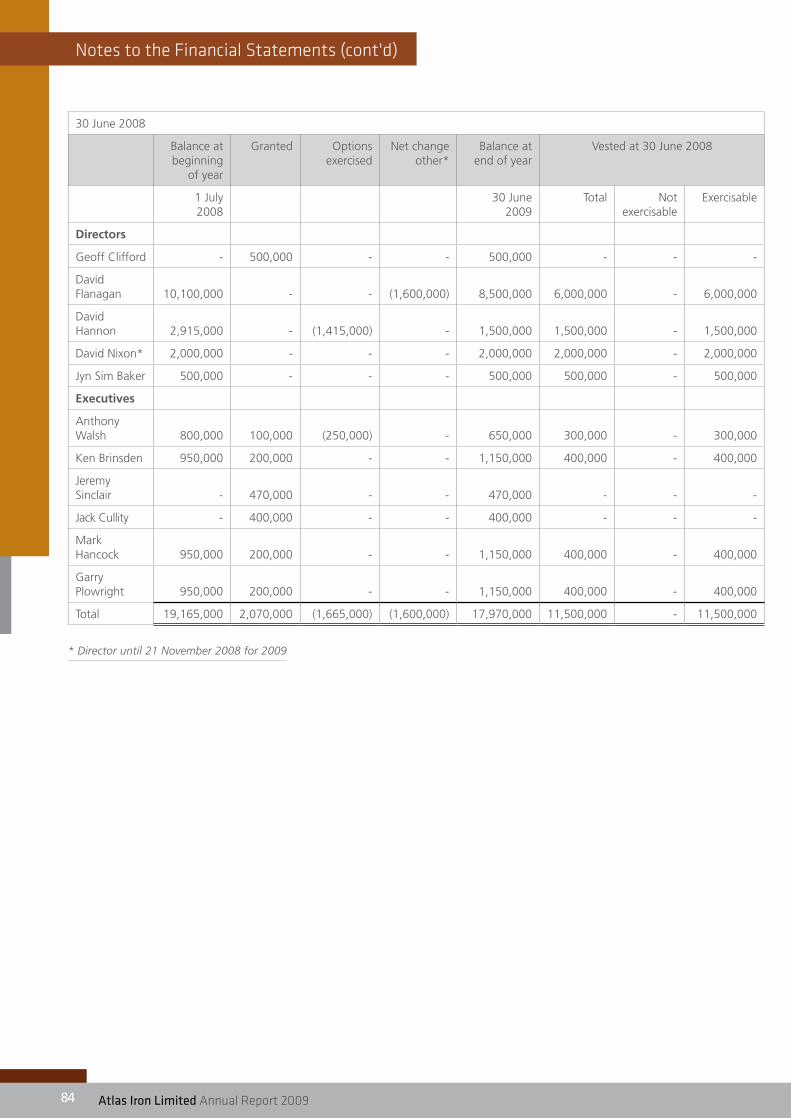
84 atlas Iron Limited Annual Report 200984
Notes to the financial statements (cont'd)
30 June 2008
Balance at beginning
of year
Granted Options exercised
Net change other*
Balance at end of year
Vested at 30 June 2008
1 July 2008
30 June 2009
Total Not exercisable
Exercisable
Directors
Geoff Clifford - 500,000 - - 500,000 - - -
David Flanagan 10,100,000 - - (1,600,000) 8,500,000 6,000,000 - 6,000,000
David Hannon 2,915,000 - (1,415,000) - 1,500,000 1,500,000 - 1,500,000
David Nixon* 2,000,000 - - - 2,000,000 2,000,000 - 2,000,000
Jyn Sim Baker 500,000 - - - 500,000 500,000 - 500,000
Executives
Anthony Walsh 800,000 100,000 (250,000) - 650,000 300,000 - 300,000
Ken Brinsden 950,000 200,000 - - 1,150,000 400,000 - 400,000
Jeremy Sinclair - 470,000 - - 470,000 - - -
Jack Cullity - 400,000 - - 400,000 - - -
Mark Hancock 950,000 200,000 - - 1,150,000 400,000 - 400,000
Garry Plowright 950,000 200,000 - - 1,150,000 400,000 - 400,000
Total 19,165,000 2,070,000 (1,665,000) (1,600,000) 17,970,000 11,500,000 - 11,500,000
* Director until 21 November 2008 for 2009

Notes to the financial statements (cont'd)
atlas Iron Limited Annual Report 2009 85
(c) Shareholdings of key management personnel
30 June 2009
Balance 1 July 2008
Issued On exercise of options
Net change other
Balance 30 June 2009
Directors
Geoff Clifford 25,000 - - - 25,000
David Flanagan 200,000 - - 10,000 210,000
David Hannon 4,140,868 - - (2,298,800) 1,842,068
David Nixon* 100,000 - - (100,000) -
Jyn Sim Baker - - -
Executives
Anthony Walsh 10,000 - - - 10,000
Ken Brinsden - - - 2,500 2,500
Andrew Paterson** - - - 15,000 15,000
Jeremy Sinclair - - - 36,000 36,000
Jack Cullity - - - - -
Daniel Taylor** - - - 6,250 6,250
Mark Hancock 1,000 - - - 1,000
Garry Plowright - - - - -
Total 4,476,868 - - (2,329,050) 2,147,818
30 June 2008
Balance 1 July 2007
Issued On exercise of options
Net change other
Balance 30 June 2008
Directors
Geoff Clifford - 25,000 - - 25,000
David Flanagan 200,000 - - - 200,000
David Hannon 1,725,868 1,000,000 1,415,000 - 4,140,868
David Nixon* 100,000 - - - 100,000
Jyn Sim Baker - - - - -
Executives
Anthony Walsh 10,000 - 250,000 (250,000) 10,000
Ken Brinsden - - - - -
Jeremy Sinclair - - - - -
Jack Cullity - - - - -
Mark Hancock 20,000 - - (19,000) 1,000
Garry Plowright - - - - -
Total 2,055,868 1,025,000 1,665,000 (269,000) 4,476,868
* Director until 21 November 2008 for 2009
** Andrew Paterson and Daniel Taylor joined the Company in the year ending 30 June 2009
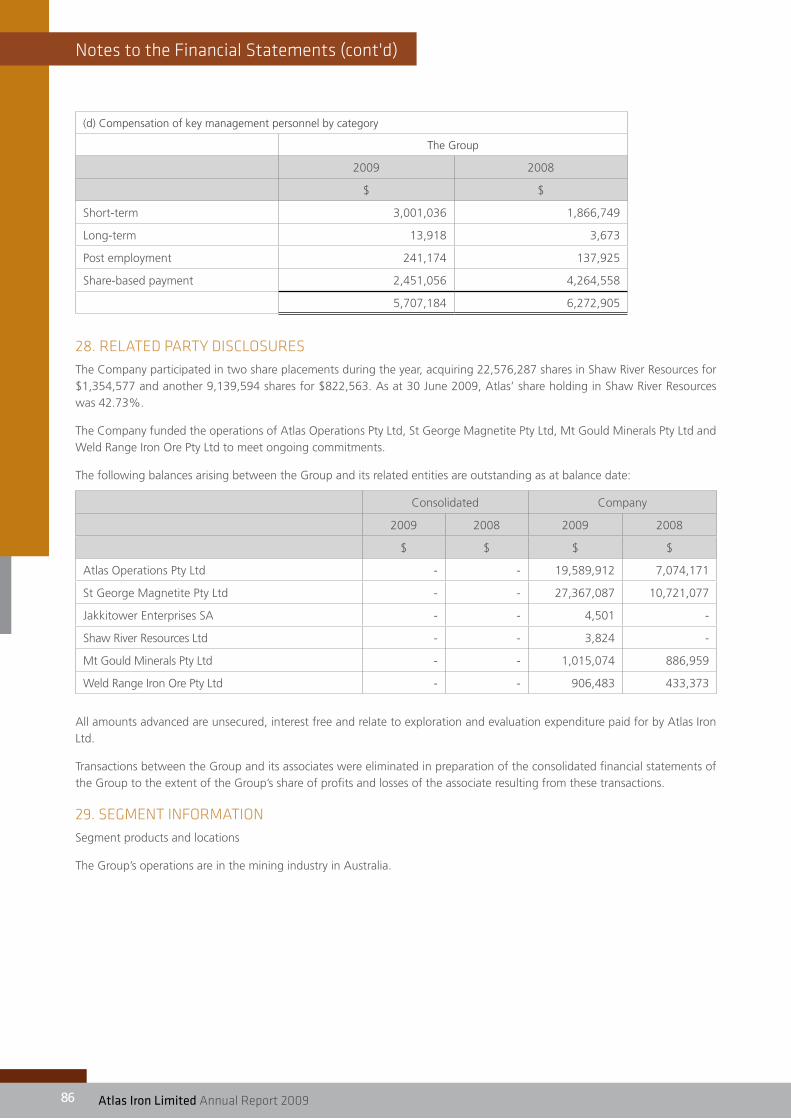
86 atlas Iron Limited Annual Report 200986
Notes to the financial statements (cont'd)
(d) Compensation of key management personnel by category
The Group
2009 2008
$ $
Short-term 3,001,036 1,866,749
Long-term 13,918 3,673
Post employment 241,174 137,925
Share-based payment 2,451,056 4,264,558
5,707,184 6,272,905
28. RELATED PARTy DisCLOsUREs The Company participated in two share placements during the year, acquiring 22,576,287 shares in Shaw River Resources for $1,354,577 and another 9,139,594 shares for $822,563. As at 30 June 2009, Atlas’ share holding in Shaw River Resources was 42.73%.
The Company funded the operations of Atlas Operations Pty Ltd, St George Magnetite Pty Ltd, Mt Gould Minerals Pty Ltd and Weld Range Iron Ore Pty Ltd to meet ongoing commitments.
The following balances arising between the Group and its related entities are outstanding as at balance date:
Consolidated Company
2009 2008 2009 2008
$ $ $ $
Atlas Operations Pty Ltd - - 19,589,912 7,074,171
St George Magnetite Pty Ltd - - 27,367,087 10,721,077
Jakkitower Enterprises SA - - 4,501 -
Shaw River Resources Ltd - - 3,824 -
Mt Gould Minerals Pty Ltd - - 1,015,074 886,959
Weld Range Iron Ore Pty Ltd - - 906,483 433,373
All amounts advanced are unsecured, interest free and relate to exploration and evaluation expenditure paid for by Atlas Iron Ltd.
Transactions between the Group and its associates were eliminated in preparation of the consolidated financial statements of the Group to the extent of the Group’s share of profits and losses of the associate resulting from these transactions.
29. sEgmENT iNfORmATiONSegment products and locations
The Group’s operations are in the mining industry in Australia.

Notes to the financial statements (cont'd)
atlas Iron Limited Annual Report 2009 87
30. fiNANCiAL iNsTRUmENTs, Risk mANAgEmENT OBJECTivEs AND POLiCiEs30(a) Interest rate risk
The Group is exposed to movements in market interest rates on short-term deposits. Group policy is to monitor the interest rate yield curve out to 90 days to ensure a balance is maintained between the liquidity of cash assets and the interest rate return.
The Group’s exposure to interest rate risks and the effective interest rates of financial assets and financial liabilities, both recognised and unrecognised at the balance date, are as follows:
Consolidated Company
2009 2008 2009 2008
Fixed rate $ $ $ $
Cash at bank and short-term bank deposits and Commercial Paper
A-1+ 39,874,974 139,057,533 39,874,974 139,057,533
A-2 - -
Other -
Floating rate
Expiring within one year (bank overdraft and bill facility) 84,474,904 4,292,065 84,474,904 4,292,065
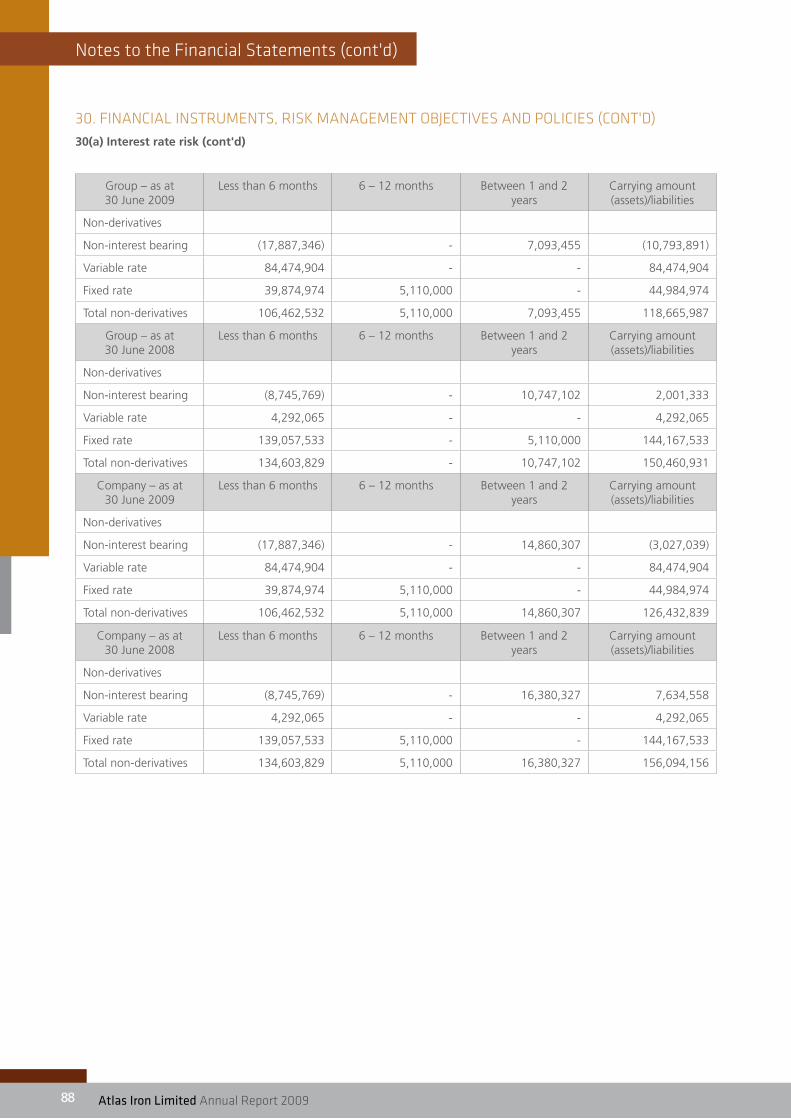
88 atlas Iron Limited Annual Report 200988
Notes to the financial statements (cont'd)
30. fiNANCiAL iNsTRUmENTs, Risk mANAgEmENT OBJECTivEs AND POLiCiEs (CONT'D)30(a) Interest rate risk (cont'd)
Group – as at 30 June 2009
Less than 6 months 6 – 12 months Between 1 and 2 years
Carrying amount (assets)/liabilities
Non-derivatives
Non-interest bearing (17,887,346) - 7,093,455 (10,793,891)
Variable rate 84,474,904 - - 84,474,904
Fixed rate 39,874,974 5,110,000 - 44,984,974
Total non-derivatives 106,462,532 5,110,000 7,093,455 118,665,987
Group – as at 30 June 2008
Less than 6 months 6 – 12 months Between 1 and 2 years
Carrying amount (assets)/liabilities
Non-derivatives
Non-interest bearing (8,745,769) - 10,747,102 2,001,333
Variable rate 4,292,065 - - 4,292,065
Fixed rate 139,057,533 - 5,110,000 144,167,533
Total non-derivatives 134,603,829 - 10,747,102 150,460,931
Company – as at 30 June 2009
Less than 6 months 6 – 12 months Between 1 and 2 years
Carrying amount (assets)/liabilities
Non-derivatives
Non-interest bearing (17,887,346) - 14,860,307 (3,027,039)
Variable rate 84,474,904 - - 84,474,904
Fixed rate 39,874,974 5,110,000 - 44,984,974
Total non-derivatives 106,462,532 5,110,000 14,860,307 126,432,839
Company – as at 30 June 2008
Less than 6 months 6 – 12 months Between 1 and 2 years
Carrying amount (assets)/liabilities
Non-derivatives
Non-interest bearing (8,745,769) - 16,380,327 7,634,558
Variable rate 4,292,065 - - 4,292,065
Fixed rate 139,057,533 5,110,000 - 144,167,533
Total non-derivatives 134,603,829 5,110,000 16,380,327 156,094,156
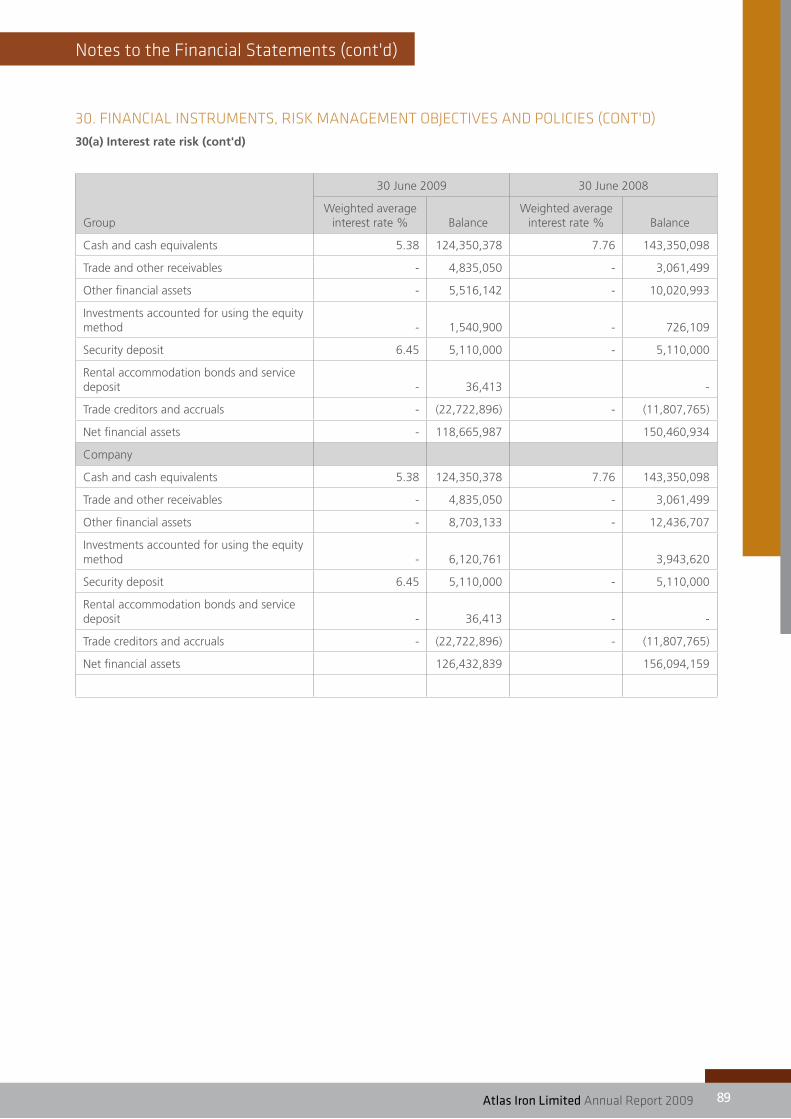
Notes to the financial statements (cont'd)
atlas Iron Limited Annual Report 2009 89
30. fiNANCiAL iNsTRUmENTs, Risk mANAgEmENT OBJECTivEs AND POLiCiEs (CONT'D)30(a) Interest rate risk (cont'd)
Group
30 June 2009 30 June 2008
Weighted average interest rate % Balance
Weighted average interest rate % Balance
Cash and cash equivalents 5.38 124,350,378 7.76 143,350,098
Trade and other receivables - 4,835,050 - 3,061,499
Other financial assets - 5,516,142 - 10,020,993
Investments accounted for using the equity method - 1,540,900 - 726,109
Security deposit 6.45 5,110,000 - 5,110,000
Rental accommodation bonds and service deposit - 36,413 -
Trade creditors and accruals - (22,722,896) - (11,807,765)
Net financial assets - 118,665,987 150,460,934
Company
Cash and cash equivalents 5.38 124,350,378 7.76 143,350,098
Trade and other receivables - 4,835,050 - 3,061,499
Other financial assets - 8,703,133 - 12,436,707
Investments accounted for using the equity method - 6,120,761 3,943,620
Security deposit 6.45 5,110,000 - 5,110,000
Rental accommodation bonds and service deposit - 36,413 - -
Trade creditors and accruals - (22,722,896) - (11,807,765)
Net financial assets 126,432,839 156,094,159

90 atlas Iron Limited Annual Report 200990
Notes to the financial statements (cont'd)
30. fiNANCiAL iNsTRUmENTs, Risk mANAgEmENT OBJECTivEs AND POLiCiEs (CONT'D)30(a) Interest rate risk (cont'd)
The Group is exposed to movements in market interest rates on short-term deposits. Company policy is to monitor the interest rate yield curve out to 90 days to ensure a balance is maintained between the liquidity of cash assets and the interest rate return.
The Group’s exposure to interest rate risks and the effective interest rates of financial assets and financial liabilities, both recognised and unrecognised at the balance date, are as follows:
GROUP:
Floating interest rate
2009 $ 84,474,904 - - - - - 84,474,904 - - -
2008 $ 4,292,065 - - - - - 4,292,065 - - -
1 year or less
2009 $ 39,874,974 - - - 5,110,000 - 44,984,974 - - -
2008 $ 139,057,533 - - - 5,110,000 - 144,167,53 - - -
Over 1 to 5 years
2009 $ - - - - - - - - - -
2008 $ - - - - - - - - - -
More than 5 years
2009 $ - - - - - - - - - -
2008 $ - - - - - - - - - -
Non interest bearing
2009 $ 500 4,835,050 5,516,14 1,540,900 - - 11,929,005 (14,056,432) (8,666,464) (22,722,896)
2008 $ 500 3,061,499 10,020,993 726,109 - - 13,809,101 (2,180,255) (9,627,510) (11,807,765)
Total carrying amount
2009 $ 124,350,378 4,835,050 5,516,142 1,540,900 5,110,000 36,413 141,388,883 (14,056,432) (8,666,464) (22,722,896)
2008 $ 143,350,098 3,061,499 10,020,993 726,109 5,110,000 - 162,268,699 (2,180,255) (9,627,510) (11,807,765)
Weighted average effective interest rate
2009 % 5.4 - - - 6.5 - - - - -
2008 % 7.8 - - - - - - - - -
(i) F
inan
cial
ass
ets
(ii) F
inan
cial
liab
ilitie
s
Fina
ncia
l Ins
trum
ents
Cas
h
Trad
e an
d ot
her
rece
ivab
les
Oth
er fi
nanc
ial a
sset
s
Inve
stm
ent
acco
unte
d fo
r us
ing
the
equi
ty m
etho
d
Secu
rity
Dep
osit
Rent
al a
ccom
mod
atio
n bo
nds
and
serv
ice
depo
sit
Tota
l fina
ncia
l ass
ets
Trad
e cr
edito
rs
Oth
er c
redi
tors
and
acc
rual
s
Tota
l fina
ncia
l lia
bilit
ies

Notes to the financial statements (cont'd)
atlas Iron Limited Annual Report 2009 91
30. fiNANCiAL iNsTRUmENTs, Risk mANAgEmENT OBJECTivEs AND POLiCiEs (CONT'D)30(a) Interest rate risk (cont'd)
If interest rates +/- by 1% from the weighted average effective interest rate at 30 June 2009, interest will +/- by $1,243,504. This applies to the Company and the Group.
COMPANY:
Floating interest rate
2009 $ 84,474,904 - - - - - 84,474,904 - - -
2008 $ 4,292,065 - - - - - 4,292,065 - - -
1 year or less
2009 $ 39,874,974 - - - 5,110,000 - 44,984,974 - - -
2008 $ 139,057,533 - - - 5,110,000 - 144,167,53 - - -
Over 1 to 5 years
2009 $ - - - - - - - - - -
2008 $ - - - - - - - - - -
More than 5 years
2009 $ - - - - - - - - - -
2008 $ - - - - - - - - - -
Non interest bearing
2009 $ 500 4,835,050 8,703,133 6,120,761 - 36,413 19,695,857 (14,056,432) (8,666,464) (22,722,896)
2008 $ 500 3,061,499 12,436,707 3,943,620 - - 19,442,326 (2,180,255) (9,627,510) (11,807,765)
Total carrying amount
2009 $ 124,350,378 4,835,050 8,703,133 6,120,761 5,110,000 36,413 149,155,735 (14,056,432) (8,666,464) (22,722,896)
2008 $ 143,350,098 3,061,499 12,436,707 3,943,620 5,110,000 - 167,901,924 (2,180,255) (9,627,510) (11,807,765)
Weighted average effective interest rate
2009 % 5.4 - - - 6.5 - - - - -
2008 % 7.8 - - - - - - - - -
(i) F
inan
cial
ass
ets
(ii) F
inan
cial
liab
ilitie
s
Fina
ncia
l Ins
trum
ents
Cas
h
Trad
e an
d ot
her
rece
ivab
les
Oth
er fi
nanc
ial a
sset
s
Inve
stm
ent
acco
unte
d fo
r us
ing
the
equi
ty m
etho
d
Secu
rity
Dep
osit
Rent
al a
ccom
mod
atio
n bo
nds
and
serv
ice
depo
sit
Tota
l fina
ncia
l ass
ets
Trad
e cr
edito
rs
Oth
er c
redi
tors
and
acc
rual
s
Tota
l fina
ncia
l lia
bilit
ies

92 atlas Iron Limited Annual Report 200992
Notes to the financial statements (cont'd)
30. fiNANCiAL iNsTRUmENTs, Risk mANAgEmENT OBJECTivEs AND POLiCiEs (CONT'D)30(b) Liquidity risk
Maturities of financial liabilities
The tables above analyse the Group’s and the parent entity’s financial liabilities, net and gross settled derivative financial instruments into relevant maturity groupings based on the remaining period at the reporting date to the contractual maturity date. The amounts disclosed in the table are the contractual undiscounted cash flows.
30(c) Net fair values
All financial assets and liabilities have been recognised at the balance date at amounts approximating their carrying value.
30(d) Credit risk exposures
Credit risk refers to the risk that a counterparty will default on its contractual obligations resulting in financial loss to the Group will default on its contractual obligations resulting in financial loss to the Group. Credit risk arises from cash and cash equivalents, derivative financial instruments, deposits with banks and financial institutions and credit exposures to customers, including outstanding receivables and committed transactions.
The Company is exposed to a concentration of risk with all iron ore customers being Chinese companies. The Company has adopted a policy of only dealing with counterparties who access to top tier bank credit. All shipments occur under Letters of Credit from these top tier banks and are typically confirmed by the company’s bankers.
30(e) Foreign currency risk
The Group has transactional currency exposures. Such exposures arise from sales or purchase in currencies other than the respective functional currency. The Group manages this risk by matching receipts and payments in the same currency and monitoring. All the Group’s sales are denominated in currencies US dollars, whereas 9% of its cost of sales are denominated in US dollars.
The following table demonstrates the sensitivity to a reasonably possible change in the foreign exchange rate, with all other variables held constant, of the Group’s loss before tax due to changes in the carrying value of monetary assets and liabilities denominated in foreign currency as at 30 June 2009.
Effect on loss before tax for the year ended 30 June 2009
Effect on loss before tax for the year ended 30 June 2008
Increase/decrease in foreign exchange rate Increase/(Decrease) Increase/(Decrease)
$ $
+5% (58,217) -
-5% 61,128 -
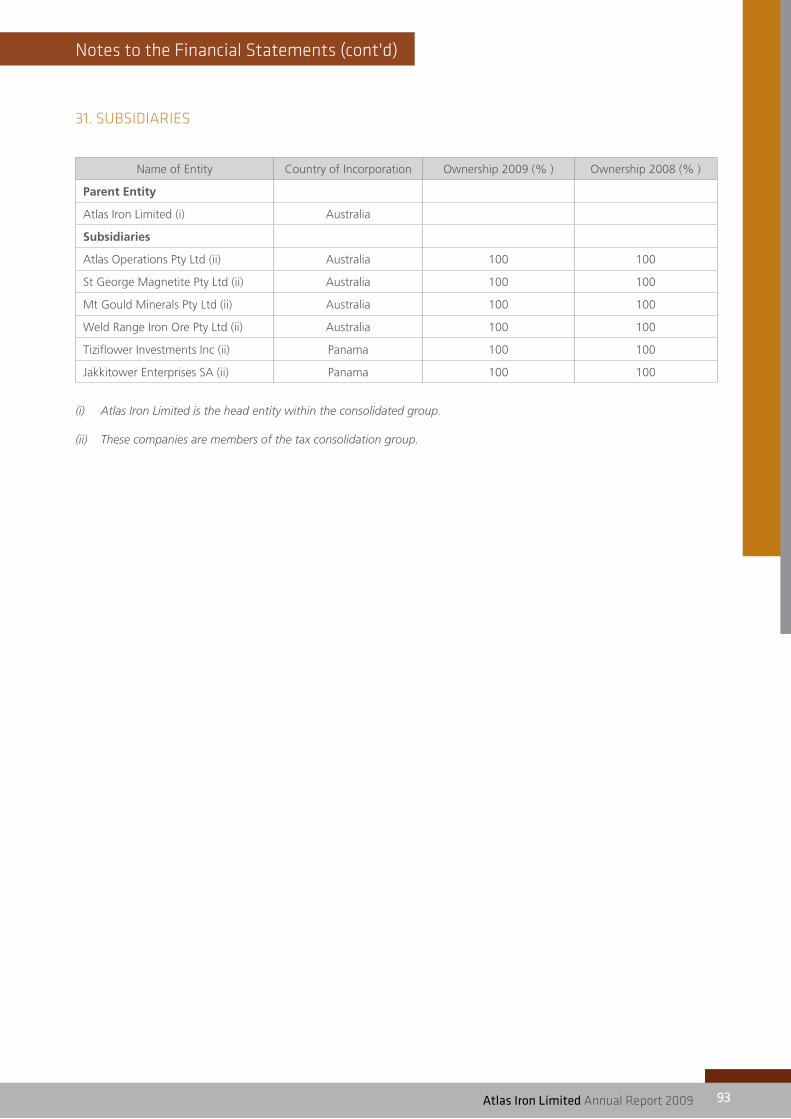
Notes to the financial statements (cont'd)
atlas Iron Limited Annual Report 2009 93
31. sUBsiDiARiEs
Name of Entity Country of Incorporation Ownership 2009 (% ) Ownership 2008 (% )
Parent Entity
Atlas Iron Limited (i) Australia
Subsidiaries
Atlas Operations Pty Ltd (ii) Australia 100 100
St George Magnetite Pty Ltd (ii) Australia 100 100
Mt Gould Minerals Pty Ltd (ii) Australia 100 100
Weld Range Iron Ore Pty Ltd (ii) Australia 100 100
Tiziflower Investments Inc (ii) Panama 100 100
Jakkitower Enterprises SA (ii) Panama 100 100
(i) Atlas Iron Limited is the head entity within the consolidated group.
(ii) These companies are members of the tax consolidation group.

94 atlas Iron Limited Annual Report 200994
Directors' Declaration
In accordance with a resolution of the directors of Atlas Iron Limited, I state that:
(1) In the opinion of the directors:
(a) the financial statements and notes of the Company and of the Group and the remuneration disclosures that are contained in the Remuneration report in the Directors report are in accordance with the Corporations Act 2001, including:
(i) giving a true and fair view of the Company’s and of the Group’s financial position as at 30 June 2009 and their performance for the year ended on that date; and
(ii) complying with Accounting Standards and Corporations Regulations 2001; and
(b) there are reasonable grounds to believe that the Company will be able to pay its debts as and when they become due and payable.
(2) This declaration has been made after receiving the declarations required to be made to the directors in accordance with section 295A of the Corporations Act 2001 for the financial year ended 30 June 2009.
On behalf of the Board
David Flanagan
Managing Director
28 August 2009
dIreCtorS’ deCLaratIon

atlas Iron Limited Annual Report 2009 95
independent Audit Report
INDEPENDENT AUDITOR’S REPORTTO THE MEMBERS OFATLAS IRON LIMITED
Report on the Financial Report
We have audited the accompanying financial report of Atlas Iron Ltd, which comprises the balance sheet as at 30 June 2009, and the income statement, statement of changes in equity and cash flow statement for the year ended on that date, a summary of significant accounting policies and other explanatory notes and the directors’ declaration of the Group comprising the company and the entities it controlled at the year’s end or from time to time during the financial year.
Directors’ Responsibility for the Financial Report
The directors of the Atlas Iron Limited are responsible for the preparation and fair presentation of the financial report in accordance with Australian Accounting Standards (including the Australian Accounting Interpretations) and the Corporations Act 2001. This responsibility includes designing, implementing and maintaining internal control relevant to the preparation and fair presentation of the financial report that is free from material misstatement, whether due to fraud or error; selecting and applying appropriate accounting policies; and making accounting estimates that are reasonable in the circumstances. In note 1, the directors also state, in accordance with Australian Accounting Standard AASB 101 Presentation of Financial Statements, that the financial report of the Group, comprising the financial statements and notes, complies with International Financial Reporting Standards, but that the financial report of the Company does not comply.
Auditor’s Responsibility
Our responsibility is to express an opinion on the financial report based on our audit. We conducted our audit in accordance with Australian Auditing Standards. These Auditing Standards require that we comply with relevant ethical requirements relating to audit engagements and plan and perform the audit to obtain reasonable assurance whether the financial report is free from material misstatement.
An audit involves performing procedures to obtain audit evidence about the amounts and disclosures in the financial report. The procedures selected depend on the auditor’s judgement, including the assessment of the risks of material misstatement of the financial report, whether due to fraud or error. In making those risk assessments, the auditor considers internal control relevant to the entity’s preparation and fair presentation of the financial report in order to design audit procedures that are appropriate in the circumstances, but not for the purpose of expressing an opinion on the effectiveness of the entity’s internal control. An audit also includes evaluating the appropriateness of accounting policies used and the reasonableness of accounting estimates made by the directors, as well as evaluating the overall presentation of the financial report.
We believe that the audit evidence we have obtained is sufficient and appropriate to provide a basis for our audit opinion.

96 atlas Iron Limited Annual Report 200996
independent Audit Report (cont'd)
Independence
In conducting our audit, we have complied with the independence requirements of the Corporations Act 2001.
Auditor’s Opinion
1. In our opinion:
(a) the financial report of Atlas Iron Ltd is in accordance with the Corporations Act 2001, including:
(i) giving a true and fair view of the company’s and Group’s financial position as at 30 June 2009 and of their performance for the year ended on that date; and
(ii) complying with Australian Accounting Standards (including the Australian Accounting Interpretations) and the Corporations Regulations 2001.
(b) the financial report of the Group also complies with International Financial Reporting Standards as disclosed in note 1.
STANTONS INTERNATIONAL
(An Authorised Audit Company)
J P Van Dieren
Director
West Perth, Western Australia 28 August 2009
atlas Iron Limited Annual Report 2009 97
Auditor's independence Letter
28 August 2009
Board of DirectorsAtlas Iron Limited25 Richardson StreetWEST PERTH WA 6005
Dear Directors
RE: ATLAS IRON LIMITED
In accordance with section 307C of the Corporations Act 2001, I am pleased to provide the following declaration of independence to the directors of Atlas Iron Limited.
As Audit Director for the audit of the financial statements of Atlas Iron Limited for the year ended 30 June 2009, I declare that to the best of my knowledge and belief, there have been no contraventions of:
(i) the auditor independence requirements of the Corporations Act 2001 in relation to the audit; and
(ii) any applicable code of professional conduct in relation to the audit.
Yours sincerelySTANTONS INTERNATIONAL (Authorised Audit Company)
John Van DierenDirector
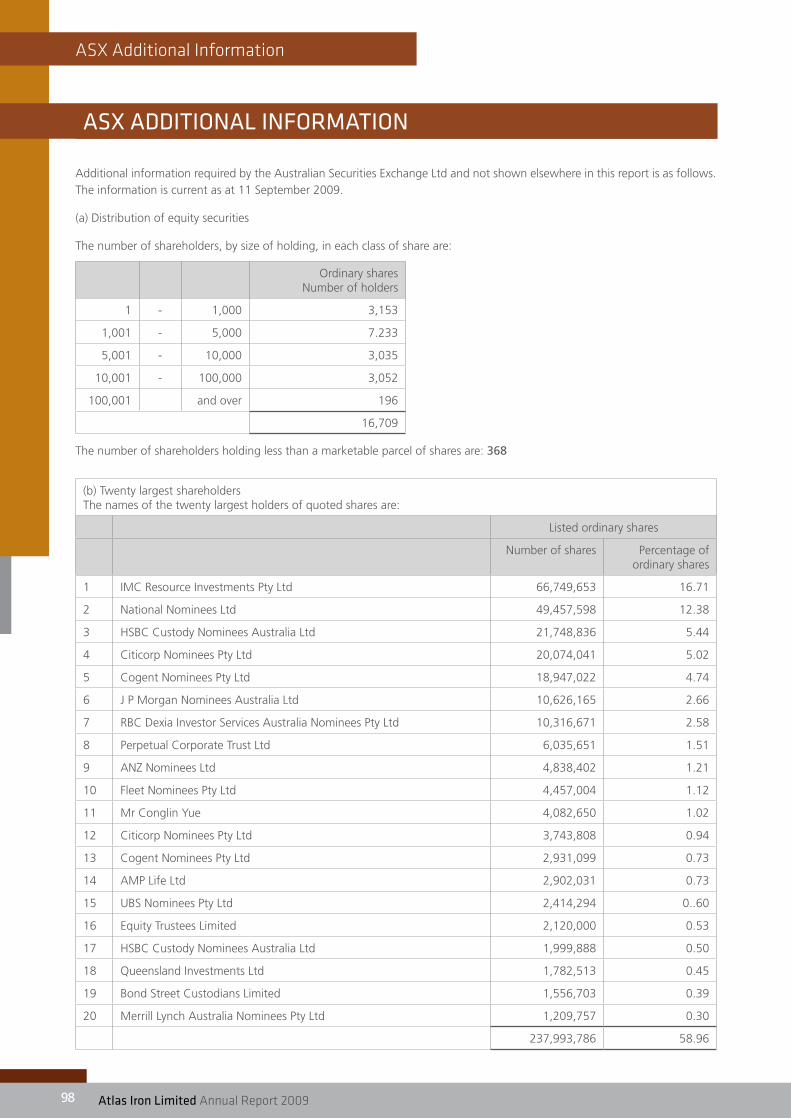
98 atlas Iron Limited Annual Report 200998
AsX Additional information
aSX addItIonaL InformatIon
Additional information required by the Australian Securities Exchange Ltd and not shown elsewhere in this report is as follows. The information is current as at 11 September 2009.
(a) Distribution of equity securities
The number of shareholders, by size of holding, in each class of share are:
Ordinary shares Number of holders
1 - 1,000 3,153
1,001 - 5,000 7.233
5,001 - 10,000 3,035
10,001 - 100,000 3,052
100,001 and over 196
16,709
The number of shareholders holding less than a marketable parcel of shares are: 368
(b) Twenty largest shareholdersThe names of the twenty largest holders of quoted shares are:
Listed ordinary shares
Number of shares Percentage of ordinary shares
1 IMC Resource Investments Pty Ltd 66,749,653 16.71
2 National Nominees Ltd 49,457,598 12.38
3 HSBC Custody Nominees Australia Ltd 21,748,836 5.44
4 Citicorp Nominees Pty Ltd 20,074,041 5.02
5 Cogent Nominees Pty Ltd 18,947,022 4.74
6 J P Morgan Nominees Australia Ltd 10,626,165 2.66
7 RBC Dexia Investor Services Australia Nominees Pty Ltd 10,316,671 2.58
8 Perpetual Corporate Trust Ltd 6,035,651 1.51
9 ANZ Nominees Ltd 4,838,402 1.21
10 Fleet Nominees Pty Ltd 4,457,004 1.12
11 Mr Conglin Yue 4,082,650 1.02
12 Citicorp Nominees Pty Ltd 3,743,808 0.94
13 Cogent Nominees Pty Ltd 2,931,099 0.73
14 AMP Life Ltd 2,902,031 0.73
15 UBS Nominees Pty Ltd 2,414,294 0..60
16 Equity Trustees Limited 2,120,000 0.53
17 HSBC Custody Nominees Australia Ltd 1,999,888 0.50
18 Queensland Investments Ltd 1,782,513 0.45
19 Bond Street Custodians Limited 1,556,703 0.39
20 Merrill Lynch Australia Nominees Pty Ltd 1,209,757 0.30
237,993,786 58.96
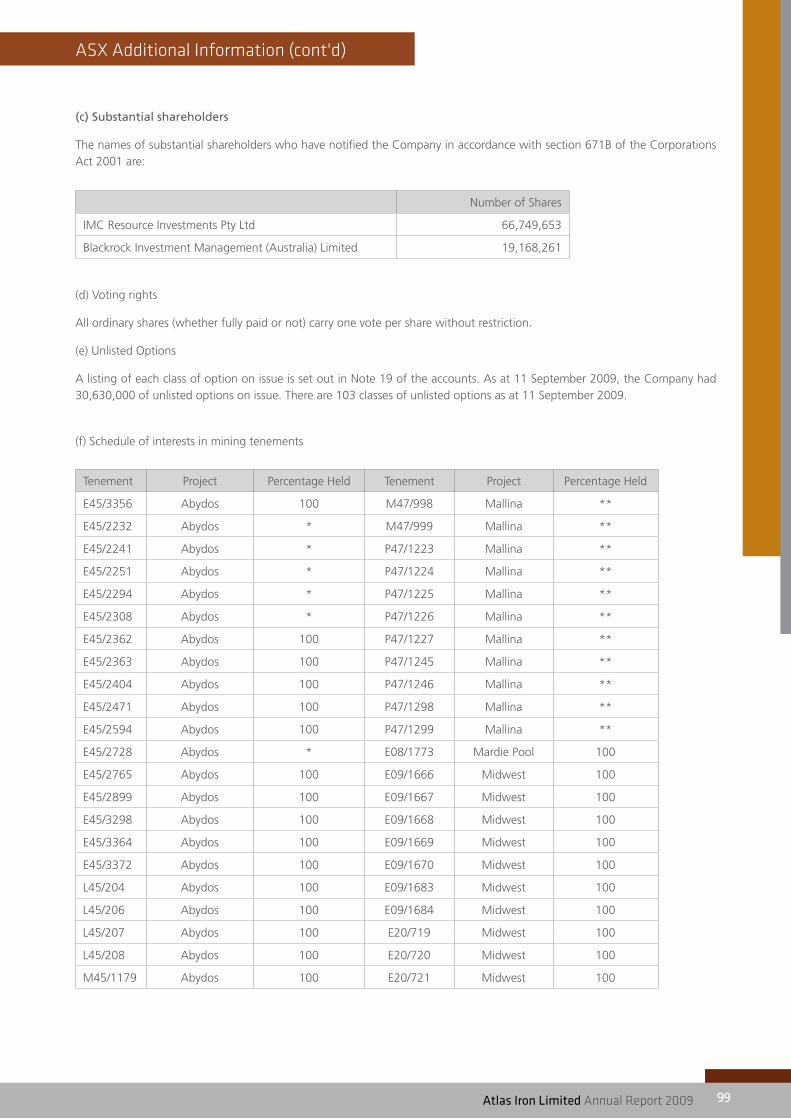
atlas Iron Limited Annual Report 2009 99
AsX Additional information (cont'd)
(c) Substantial shareholders
The names of substantial shareholders who have notified the Company in accordance with section 671B of the Corporations Act 2001 are:
Number of Shares
IMC Resource Investments Pty Ltd 66,749,653
Blackrock Investment Management (Australia) Limited 19,168,261
(d) Voting rights
All ordinary shares (whether fully paid or not) carry one vote per share without restriction.
(e) Unlisted Options
A listing of each class of option on issue is set out in Note 19 of the accounts. As at 11 September 2009, the Company had 30,630,000 of unlisted options on issue. There are 103 classes of unlisted options as at 11 September 2009.
(f) Schedule of interests in mining tenements
Tenement Project Percentage Held Tenement Project Percentage Held
E45/3356 Abydos 100 M47/998 Mallina **
E45/2232 Abydos * M47/999 Mallina **
E45/2241 Abydos * P47/1223 Mallina **
E45/2251 Abydos * P47/1224 Mallina **
E45/2294 Abydos * P47/1225 Mallina **
E45/2308 Abydos * P47/1226 Mallina **
E45/2362 Abydos 100 P47/1227 Mallina **
E45/2363 Abydos 100 P47/1245 Mallina **
E45/2404 Abydos 100 P47/1246 Mallina **
E45/2471 Abydos 100 P47/1298 Mallina **
E45/2594 Abydos 100 P47/1299 Mallina **
E45/2728 Abydos * E08/1773 Mardie Pool 100
E45/2765 Abydos 100 E09/1666 Midwest 100
E45/2899 Abydos 100 E09/1667 Midwest 100
E45/3298 Abydos 100 E09/1668 Midwest 100
E45/3364 Abydos 100 E09/1669 Midwest 100
E45/3372 Abydos 100 E09/1670 Midwest 100
L45/204 Abydos 100 E09/1683 Midwest 100
L45/206 Abydos 100 E09/1684 Midwest 100
L45/207 Abydos 100 E20/719 Midwest 100
L45/208 Abydos 100 E20/720 Midwest 100
M45/1179 Abydos 100 E20/721 Midwest 100
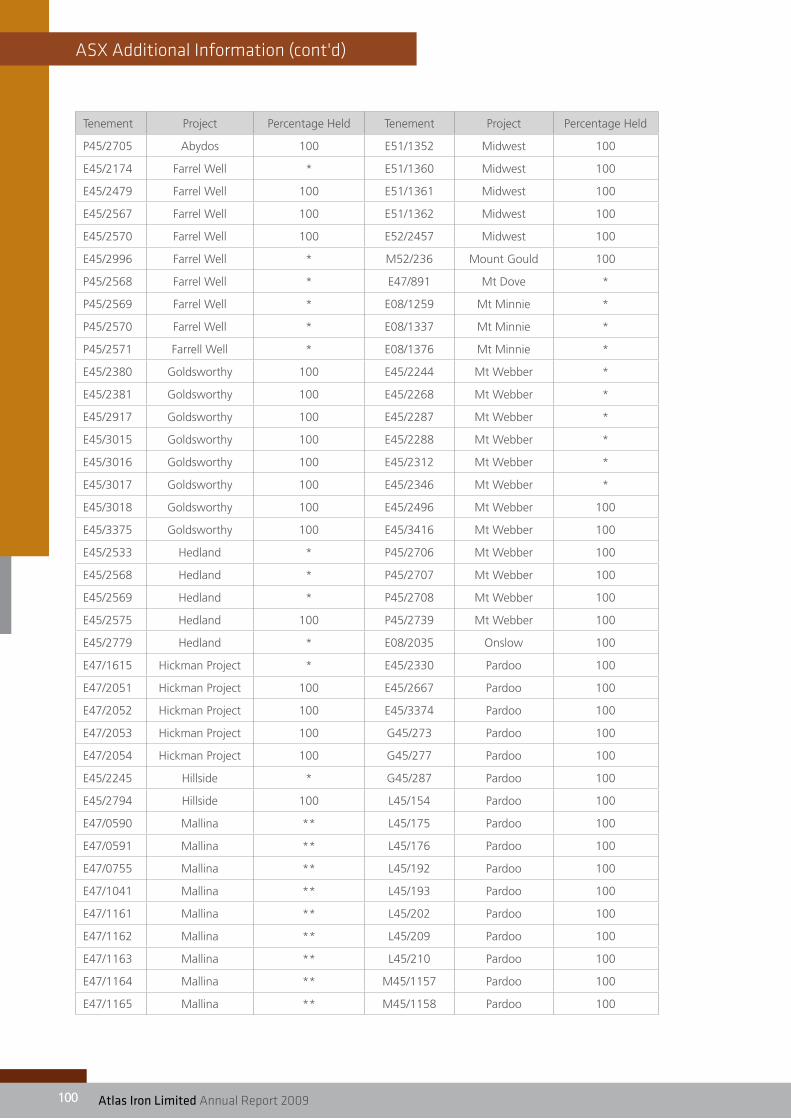
100 atlas Iron Limited Annual Report 2009100
AsX Additional information (cont'd)
Tenement Project Percentage Held Tenement Project Percentage Held
P45/2705 Abydos 100 E51/1352 Midwest 100
E45/2174 Farrel Well * E51/1360 Midwest 100
E45/2479 Farrel Well 100 E51/1361 Midwest 100
E45/2567 Farrel Well 100 E51/1362 Midwest 100
E45/2570 Farrel Well 100 E52/2457 Midwest 100
E45/2996 Farrel Well * M52/236 Mount Gould 100
P45/2568 Farrel Well * E47/891 Mt Dove *
P45/2569 Farrel Well * E08/1259 Mt Minnie *
P45/2570 Farrel Well * E08/1337 Mt Minnie *
P45/2571 Farrell Well * E08/1376 Mt Minnie *
E45/2380 Goldsworthy 100 E45/2244 Mt Webber *
E45/2381 Goldsworthy 100 E45/2268 Mt Webber *
E45/2917 Goldsworthy 100 E45/2287 Mt Webber *
E45/3015 Goldsworthy 100 E45/2288 Mt Webber *
E45/3016 Goldsworthy 100 E45/2312 Mt Webber *
E45/3017 Goldsworthy 100 E45/2346 Mt Webber *
E45/3018 Goldsworthy 100 E45/2496 Mt Webber 100
E45/3375 Goldsworthy 100 E45/3416 Mt Webber 100
E45/2533 Hedland * P45/2706 Mt Webber 100
E45/2568 Hedland * P45/2707 Mt Webber 100
E45/2569 Hedland * P45/2708 Mt Webber 100
E45/2575 Hedland 100 P45/2739 Mt Webber 100
E45/2779 Hedland * E08/2035 Onslow 100
E47/1615 Hickman Project * E45/2330 Pardoo 100
E47/2051 Hickman Project 100 E45/2667 Pardoo 100
E47/2052 Hickman Project 100 E45/3374 Pardoo 100
E47/2053 Hickman Project 100 G45/273 Pardoo 100
E47/2054 Hickman Project 100 G45/277 Pardoo 100
E45/2245 Hillside * G45/287 Pardoo 100
E45/2794 Hillside 100 L45/154 Pardoo 100
E47/0590 Mallina ** L45/175 Pardoo 100
E47/0591 Mallina ** L45/176 Pardoo 100
E47/0755 Mallina ** L45/192 Pardoo 100
E47/1041 Mallina ** L45/193 Pardoo 100
E47/1161 Mallina ** L45/202 Pardoo 100
E47/1162 Mallina ** L45/209 Pardoo 100
E47/1163 Mallina ** L45/210 Pardoo 100
E47/1164 Mallina ** M45/1157 Pardoo 100
E47/1165 Mallina ** M45/1158 Pardoo 100
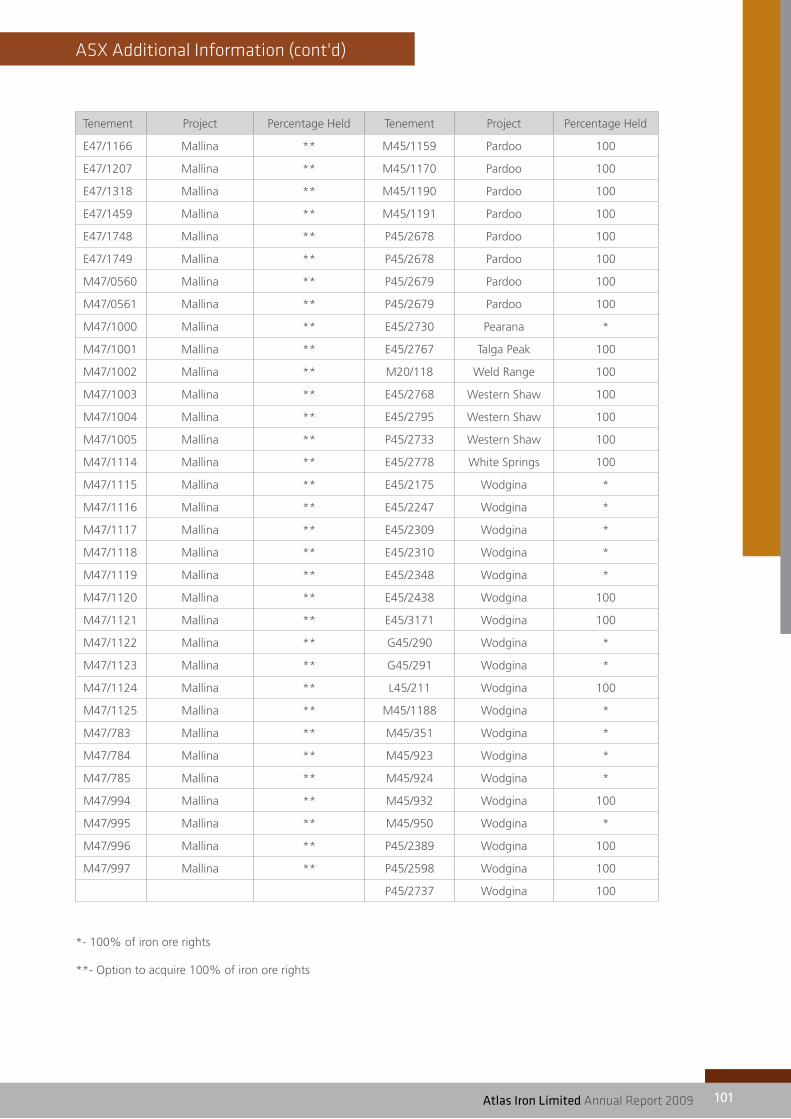
atlas Iron Limited Annual Report 2009 101
AsX Additional information (cont'd)
Tenement Project Percentage Held Tenement Project Percentage Held
E47/1166 Mallina ** M45/1159 Pardoo 100
E47/1207 Mallina ** M45/1170 Pardoo 100
E47/1318 Mallina ** M45/1190 Pardoo 100
E47/1459 Mallina ** M45/1191 Pardoo 100
E47/1748 Mallina ** P45/2678 Pardoo 100
E47/1749 Mallina ** P45/2678 Pardoo 100
M47/0560 Mallina ** P45/2679 Pardoo 100
M47/0561 Mallina ** P45/2679 Pardoo 100
M47/1000 Mallina ** E45/2730 Pearana *
M47/1001 Mallina ** E45/2767 Talga Peak 100
M47/1002 Mallina ** M20/118 Weld Range 100
M47/1003 Mallina ** E45/2768 Western Shaw 100
M47/1004 Mallina ** E45/2795 Western Shaw 100
M47/1005 Mallina ** P45/2733 Western Shaw 100
M47/1114 Mallina ** E45/2778 White Springs 100
M47/1115 Mallina ** E45/2175 Wodgina *
M47/1116 Mallina ** E45/2247 Wodgina *
M47/1117 Mallina ** E45/2309 Wodgina *
M47/1118 Mallina ** E45/2310 Wodgina *
M47/1119 Mallina ** E45/2348 Wodgina *
M47/1120 Mallina ** E45/2438 Wodgina 100
M47/1121 Mallina ** E45/3171 Wodgina 100
M47/1122 Mallina ** G45/290 Wodgina *
M47/1123 Mallina ** G45/291 Wodgina *
M47/1124 Mallina ** L45/211 Wodgina 100
M47/1125 Mallina ** M45/1188 Wodgina *
M47/783 Mallina ** M45/351 Wodgina *
M47/784 Mallina ** M45/923 Wodgina *
M47/785 Mallina ** M45/924 Wodgina *
M47/994 Mallina ** M45/932 Wodgina 100
M47/995 Mallina ** M45/950 Wodgina *
M47/996 Mallina ** P45/2389 Wodgina 100
M47/997 Mallina ** P45/2598 Wodgina 100
P45/2737 Wodgina 100
*- 100% of iron ore rights
**- Option to acquire 100% of iron ore rights

102 atlas Iron Limited Annual Report 2009102
Notes

atlas Iron Limited Annual Report 2009 103
Notes
104 atlas Iron Limited Annual Report 2009104
Notes


Registered & Principal Office: ground floor, 10 Richardson street, wEsT PERTh wA 6005
postal address: po box 223, WeSt pertH Wa 6872
t: +61 (0) 8 9476 7900 f: +61 (0) 8 9476 7988 e: [email protected]
www.atlasiron.com.au
Related Documents