Scientific Research ATLANTIC Scientific Consultation SCIENCE CORPORATION i Computer Services (NASA-CR-1 43692) INVESTIGATION OF THE N75-17873 IONOSPHERIC FARADAY ROTATION FOR USE IN ORBIT CORRECTIONS (Atlantic Science Corp., Indialantic, Fla.) 113 p HC $5.25 CSCL 03B Unclas - __- ____ _ G3/46 11060 C\j GENERAL OFFICE: 1701 North AlA * Indialantic, Florida 32903 * Telephone: 305/723-8779 BRANCH OFFICE: P.O. Box 636 * Seabrook, Maryland 20801 * Telephone: 301/459-1692 https://ntrs.nasa.gov/search.jsp?R=19750009801 2018-06-14T09:02:52+00:00Z

Welcome message from author
This document is posted to help you gain knowledge. Please leave a comment to let me know what you think about it! Share it to your friends and learn new things together.
Transcript

Scientific Research
ATLANTIC Scientific ConsultationSCIENCE CORPORATION i Computer Services
(NASA-CR-1 43692) INVESTIGATION OF THE N75-17873IONOSPHERIC FARADAY ROTATION FOR USE INORBIT CORRECTIONS (Atlantic Science Corp.,Indialantic, Fla.) 113 p HC $5.25 CSCL 03B Unclas
- __- ____ _ G3/46 11060
C\j
GENERAL OFFICE: 1701 North AlA * Indialantic, Florida 32903 * Telephone: 305/723-8779BRANCH OFFICE: P.O. Box 636 * Seabrook, Maryland 20801 * Telephone: 301/459-1692
https://ntrs.nasa.gov/search.jsp?R=19750009801 2018-06-14T09:02:52+00:00Z

INVESTIGATION OF THE IONOSPHERIC
FARADAY ROTATION FOR USE IN
ORBIT CORRECTIONS
ASC 74-F-016
INVESTIGATION OF THE IONOSPHERIC
FARADAY ROTATION FOR USE IN
ORBIT CORRECTIONS
by
Sigrid K. LlewellynRodney B. Bent
George Nesterczuk
NASA Contract :NAS5-21972
December 1974.
Atlantic Science: Corporation
P. O. Box 3201Indialantic, Florida 32903

TABLE OF CONTENTS
Page
1. 0 Computation of the Faraday Factor . ...... 1
2. 0 Influence of Various Parameters on theFaraday Factor. ........... ... 3
2. 1 Diurnal and Seasonal Influences . . . . ...... 3
2. 2 Effect of Sudden Changes in Critical Frequencyand Ionospheric Height . .... . . . . . . . . 3
2. 3 Effects of Magnetic Latitude, Elevation, andAzimuth. ..... ............. 5
2. 4 Variation of the Angle Theta and DirectionalChanges in Polarization Twist . . . . . . . . . 6
2. 5 Effects of Additional Topside Model Layers . . 8
2. 6 Variation of the Integration Limit . . . . . . . 9
3. 0, Conclusions . . . . . . . . . . . .. . . . 11.
Appendix A Observations at Cape Kennedy .. . . ...... 36
Appendix B Brief Plan Regarding the Collection, Inter-comparison, and Analysis of the INTASATWorldwide Data . . . ...... ... . . . . . 104
References . . . . . . . . . . . . . . .... . 106

LIST OF FIGURES
Page
1 Seasonal and Diurnal Variation of the Faraday
Factor for Honolulu. . . . . . . . . ...... . . 14
2 Effect of Increase and Decrease in foF2 on theFaraday Factor for a Vertical Path ... ... . 15
3a, b Effect of Increase and Decrease in the Ionospheric
Height on the Faraday Factor for a Vertical and
Angular Path .......... ........ 16, 17
4 Variation of the Faraday Factor with MagneticLatitude for a Vertical Path and with the DiurnalChanges .... . ............... . 21
5a-c Variation of the Faraday Factor with Changes inElevation and Azimuth Angles at 800, 390, and 10'
Magnetic Latitude . ....... .. .. ... 22, 23, 24
6 a-e Variation of the Angle 0 Between the Direction of
Propagation and the Magnetic Field . . . . ... 28, 29, 30, 31, 3Z
7 Comparison of the Amount of Electron Contentand Faraday Rotation Accumulated from Groundup to a Varying Height. ........ ...... 34
8 Difference between Percent Contributions ofElectron Content and Faraday Rotation in each100 km Height Interval . . ........... 35
9 Diurnal Mean Curves of Predicted and MeasuredHeights and Differences . . . . . . . . . . . . 39
10a-1 Daily Curves of Measured, Predicted, and Up-dated Electron Content . .... . . ...... 40 to 51
lla-l Daily Curves of Measured and Predicted foF2 . . . 52 to 6 3
12a-1 Daily Curves of Measured and Predicted HeightatfoF2 ................. .. 64 to 7 5
ii
LIST OF FIGURES (con't)
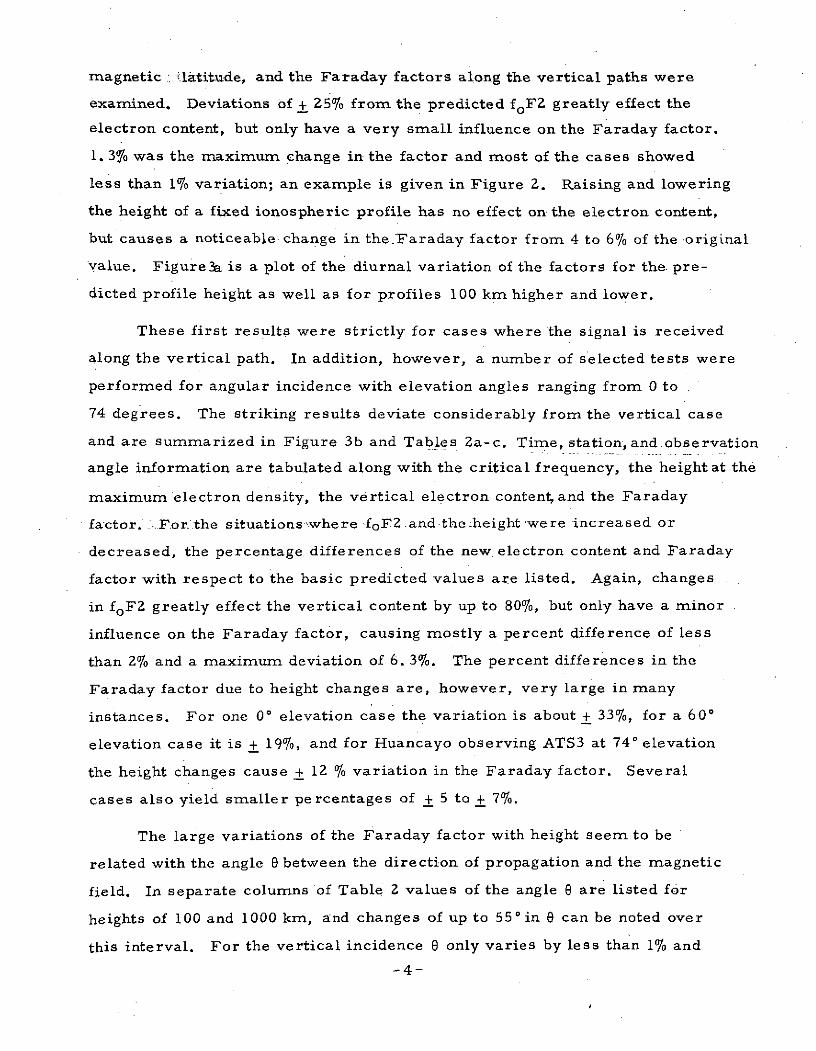
Page13a-f Monthly Mean and Error Curves for Electron 76 to 81
Content . . . . . . . . . . . ... . . . .. . .
14a-g Monthly Mean and Error Curves for foFZ ..... 82 to 88
15a-g Monthly Mean and Error Curves for Height atfF2 ....... ...... .......... 89 to 95

LIST OF TABLES
Page
1 Diurnal Variation of the Faraday Factor for 3 Stations
with Integration Carried out to 1000, 2000 and 3000 km
Height . .. . . .. .. . .... . . . . .. . 13
2a, b, c, Effect of Increase and Decrease in foF2 and h, on the
Faraday Factor for an Angular Path . ....... 1. 8, 19, 20
3a, b, c, Variation of the Faraday Factor with Changes in Elevation
and Azimuth for 3 Stations with Integration Carried out to
1000, 2000 and 3000 kmHeight . .......... 25, 26,27
4 Comparison of Changes in Vertical Electron Content and
Faraday Factor due to Integration Carried out to 1000,
2000 and 3000 km Height .. ....... . .. . 33
5a-g Monthly Mean Statistics for Cape Kennedy Data . . . 96 to 102
6 Daytime RMS Percent Errors . . . . . . . . . . . 103
iv

1. 0 Computation of the Faraday Factor
For use in orbit corrections, the Faraday rotation which is effected
by both the earth's magnetic field and the ionosphere, has to be reduced to
the ionospheric influence alone. The equations relating the Faraday rotation
angle along the angular path to the vertical electron content are as follows:
K hK h K- If3 B cos sec XN dh M N dh = MNT FN
where
0 = rotation angle in radians
K = 2. 36 = constant
f = frequency in hertz
B = magnetic field strength in gauss
e = angle between direction of propagation and magnetic field
X = zenith angle
N = electron density in e/m 3
h = height above surface of earth in m
M = mean value of (B cos 8 sec X)
NT = vertical total electron content in e/m' column
F = Faraday rotation factor in 1/(m2 radians)
h u = upper integration limit
In practice the measured amount of polarization twist, 0, is converted
to an equivalent vertical total electron content by removing B cos 8 sec X
from under the integral sign and replacing it with a mean value. Then:
S-= M u Ndh
where B cos 0 sec X = M is computed in the following manner. A typical
N(h) profile is assumed and calculations of the mean value M are found by
computing: h
- o B cos e sec X N dh
j- N dh
-1-

The integrals are evaluated in computer mode by generating the electron
density N and the function (B cos 8 sec XN) at various height intervals
and numerically integrating. Both Simpson's parabolic rule and Gaussian
quadrature have been used., The electron density at each height h is
calculated by the worldwide Bent Ionospheric profile model (Reference 1).
Each parabolic and exponential segment of the profile was integrated
separately with a varying number of points to achieve maximum accuracy.
A total of 23 points was used to evaluate the integrals by Gaussian quadrature.
The components of the magnetic field strength are obtained by a spherical
harmonic analysis routine as described by Chapman and Bartels (Reference 2)
which uses the coefficients of Epoch 1960 given by Jensen and Cain
(Reference 3). The assumption of straight line propagation through a
spherically stratified ionosphere was made. No bending corrections
were calculated as this would have required a prohibitive amount of
computer time,and at a frequency of 140 MHz, bending is a second order
effect. Given the straight line propagation assumption the zenith angle
.at each height h then becomes a function of the ground elevation angle,
and the angle 6 is calculated using the station and satellite positions and
the direction of the magnetic field.
In the following investigations the Faraday rotation factor F is the
computed quantity, giving the direct conversion from angular measure-
ment to vertical content, NT=FQ. A frequency of f=137 MHz is used to
compute F=f2 / K M, and the conversion factor is expressed in units of
1/m 2 degrees.
-2-

2. 0 Influence of Various Parameters on the Faraday Factor
The effects of many different conditions on the Faraday factor have
been investigated to gain a better understanding of the variations and to
test out the possibilities for mapping the factors. Variations -with local
time and season have been looked into as well as with magnetic latitude,
elevation and azimuth angles. Typical day to day fluctuations of sudden
increase and decrease in the ionospheric density >and height have been imposed
on the Faraday factor. The conditions and effects of the angle between the
direction of propagation and the magnetic field have been examined. The
influence of the high altitude topside extension of the ionospheric model and
the importance of the upper integration limit in computing the factors have
been studied.
2. 1 Diurnal and Seasonal Influence
Test data was generated at 4 hour intervals for three different stations
spaced at 10, 39, and 80 degrees magnetic latitude. Table 1 summarizes
the computed values of foF2, vertical electron content, and Faraday rotation
factors resulting from integrations carried out to 1000, 2000, and 3000 km
in height. Normal- diurnal influences are causing changes of 2 to 6% in the
Faraday factors.
Figure 1 shows the predicted monthly mean diurnal curves of the Faraday
factors for the station Honolulu observing the ATSl.satellite during March,
June, September, and December of 1968. The very definite changes of the
factors with season amount to 3. 1%0 considering the diurnal mean values for
June and December, and are as high as 8. 5% at 20 hours.
2.2 Effect of Sudden Changes in Critical Frequency and Ionospheric Height
The day to day changes that occur in the ionosphere cause increases
and decreases in critical frequency that typically amount to + 25% of the monthly
mean and also shifts in the ionospheric height of the order of + 100 km. Such
conditions were simulated for the three stations at 10, 39, and 80 degrees
-3-
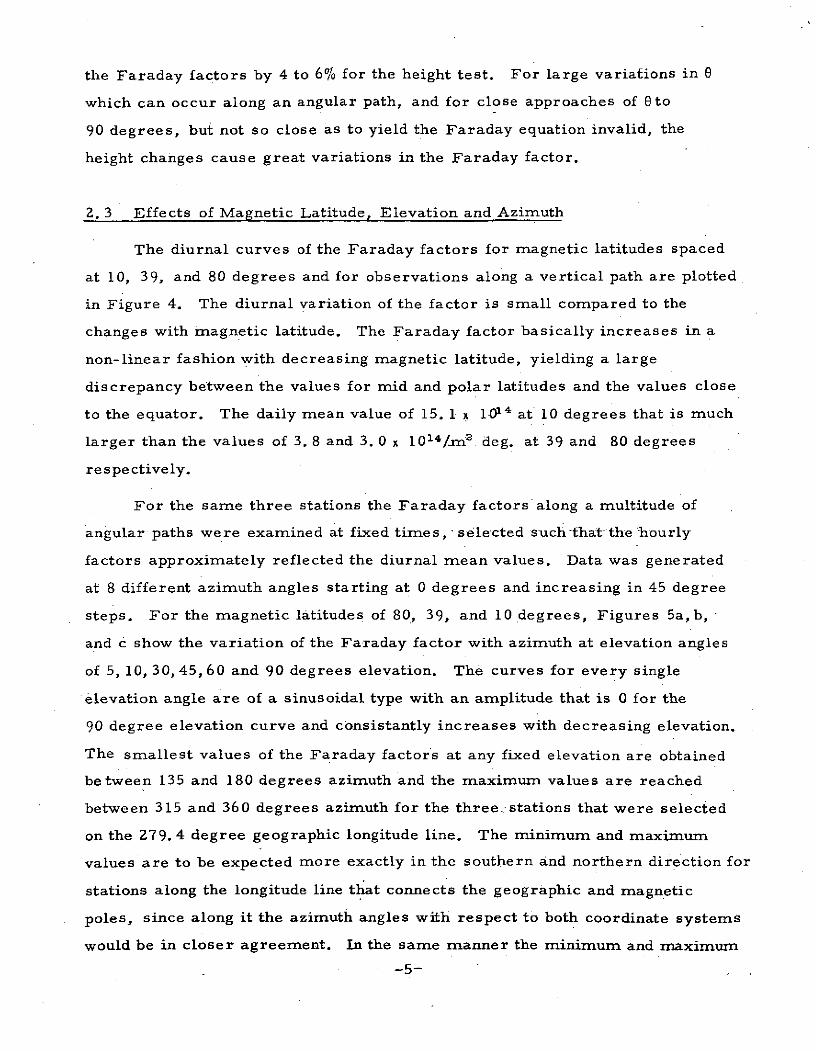
magnetic latitude, and the Faraday factors along the vertical paths were
examined. Deviations of + 25% from the predicted foFZ greatly effect the
electron content, but only have a very small influence on the Faraday factor.
1. 3% was the maximum change in the factor and most of the cases showed
less than 1% variation; an example is given in Figure 2. Raising and lowering
the height of a fixed ionospheric profile has no effect on the electron content,
but causes a noticeable change in theFaraday factor from 4 to 6% of the original
value. Figure3a is a plot of the diurnal variation of the factors for the pre-
dicted profile height as well as for profiles 100 km higher and lower.
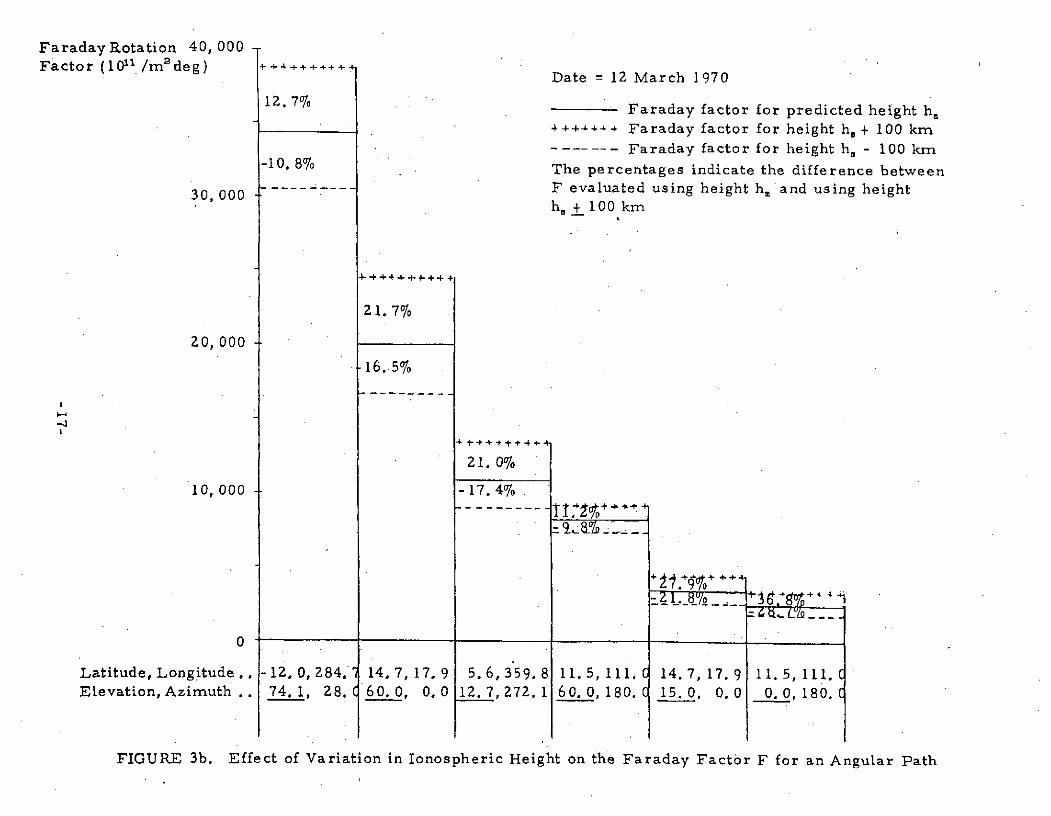
These first results were strictly for cases where the signal is received
along the vertical path. In addition, however, a number of selected tests were
performed for angular incidence with elevation angles ranging from 0 to
74 degrees. The striking results deviate considerably from the vertical case
and are summarized in Figure 3b and Tables Za-c. Time, station, and observation
angle information are tabulated along with the critical frequency, the height at the
maximum electron density, the vertical electron content, and the Faraday
factor. .F.or.the situations-where foF2 .and the height -were increased or
decreased, the percentage differences of the new electron content and Faraday
factor with respect to the basic predicted values are listed. Again, changes
in foFZ greatly effect the vertical content by up to 80%, but only have a minor
influence on the Faraday factor, causing mostly a percent difference of less
than 2% and a maximum deviation of 6. 3%. The percent differences in the
Faraday factor due to height changes are, however, very large in many
instances. For one 0* elevation case the variation is about + 33%0, for a 60*
elevation case it is + 19%, and for Huancayo observing ATS3 at 740 elevation
the height changes cause + 12 /o variation in the Faraday factor. Several
cases also yield smaller percentages of + 5 to + 7%.
The large variations of the Faraday factor with height seem to be
related with the angle 0 between the direction of propagation and the magnetic
field. In separate columns of Table 2 values of the angle B are listed for
heights of 100 and 1000 km, and changes of up to 550 in B can be noted over
this interval. For the vertical incidence B only varies by less than 1% and
-4-
the Faraday factors by 4 to 6% for the height test. For large variations in 0
which can occur along an angular path, and for close approaches of to
90 degrees, but not so close as to yield the Faraday equation invalid, the
height changes cause great variations in the Faraday factor.
2. 3 Effects of Magnetic Latitude, Elevation and Azimuth
The diurnal curves of the Faraday factors for magnetic latitudes spaced
at 10, 39, and 80 degrees and for observations along a vertical path are plotted
in Figure 4. The diurnal variation of the factor is small compared to the
changes with magnetic latitude. The Faraday factor basically increases in a
non-linear fashion with decreasing magnetic latitude, yielding a large
discrepancy between the values for mid and polar latitudes and the values close
to the equator. The daily mean value of 15. 1 x 10¹⁴ at 10 degrees that is much
larger than the values of 3. 8 and 3. 0 x 1014/ni2 deg. at 39 and 80 degrees
respectively.
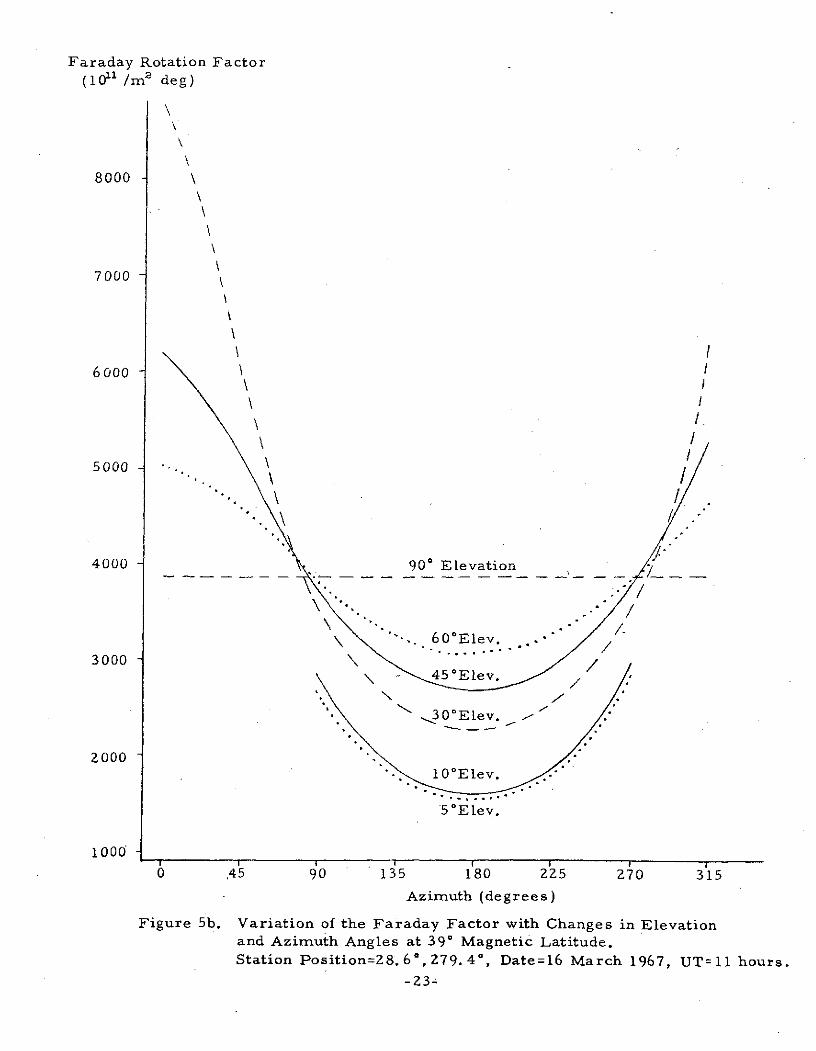
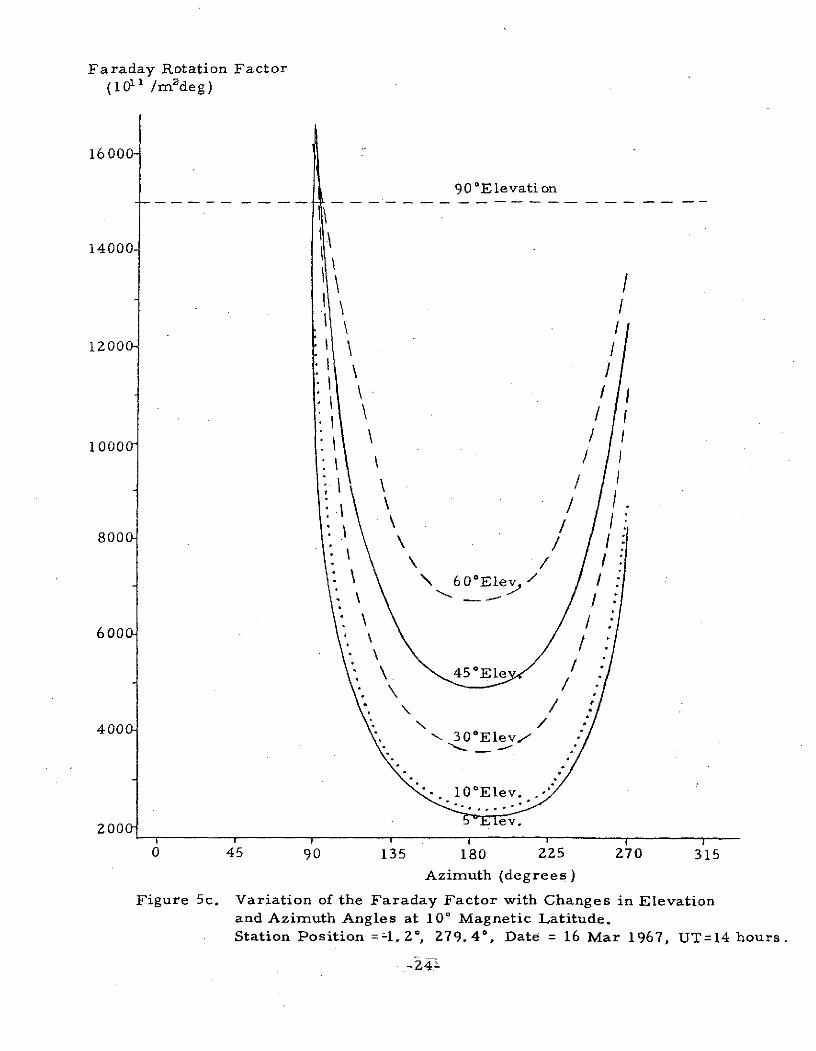
For the same three stations the Faraday factors along a multitude of
angular paths were examined at fixed times, selected such that the hourly
factors approximately reflected the diurnal mean values. Data was generated
at 8 different azimuth angles starting at 0 degrees and increasing in 45 degree
steps. For the magnetic latitudes of 80, 39, and 10 degrees, Figures 5a,b, -
and c show the variation of the Faraday factor with azimuth at elevation angles
of 5, 10, 30, 45, 60 and 90 degrees elevation. The curves for every single
elevation angle are of a sinusoidal type with an amplitude that is 0 for the
90 degree elevation curve and consistantly increases with decreasing elevation.
The smallest values of the Faraday factors at any fixed elevation are obtained
between 135 and 180 degrees azimuth and the maximum values are reached
between 315 and 360 degrees azimuth for the three, stations that were selected
on the 279. 4 degree geographic longitude line. The minimum and maximum
values are to be expected more exactly in the southern and northern direction for
stations along the longitude line that connects the geographic and magnetic
poles, since along it the azimuth angles with respect to both coordinate systems
would be in closer agreement. In the same manner the minimum and maximum
-5-

values of the Faraday factors could occur at azimuth angles deviating more
from the southern and northern direction for stations along geographic longitude
lines further displaced from the magnetic pole. The maximum difference in
the Faraday factors between the 5 and 90 degree elevation angles increases
from 1. 0 x 1014 to 2.4 x 10"14to 12. 8 x 10¹⁴/m 2 deg. for 80, 39 and 10 degrees
magnetic latitude respectively. The .variation with azimuth is the dominant
influence on the Faraday factor except at very high elevations, encompassing
the whole scale of possible values. This variation is due almost totally to the
changing magnetic field angles for different azimuths.
Tables 3 a-c present the variation of the Faraday factors with azimuth
for the same three stations at elevation angles of 90, 45, and 10 degrees.
Critical frequency and vertical electron content are listed as well and the
integration in the computations is carried out to three different heights,
1000, 2000, and 3000 km.
2. 4 Variation of the Angle Theta and Directional Changes in Polarization Twist
Several cases in Tables 3a-c aremarkedby an asterisk, denoting-that
the Faraday factors are not useable. In the same instances there are missing
points in Figures 5b and c. The angle e between the direction of propagation
and the magnetic field passed through 90 degrees along the path, at the height
indicated behind the asterisk, yielding the Faraday equation invalid. Equivalent
to such a mathematically undefined case is a physical wave that experiences
polarization in one direction from the satellite down to a certain height along
the path and polarization in the opposite direction below that height. The
polarization twist measured is smaller than the total absolute amount of
polarization since contributions in reversed directions cancel out. Thus the
measurement is not representative of the ionosphere between the satellite and
the station, and the Faraday rotation equipment is of no use in these particular
instances.
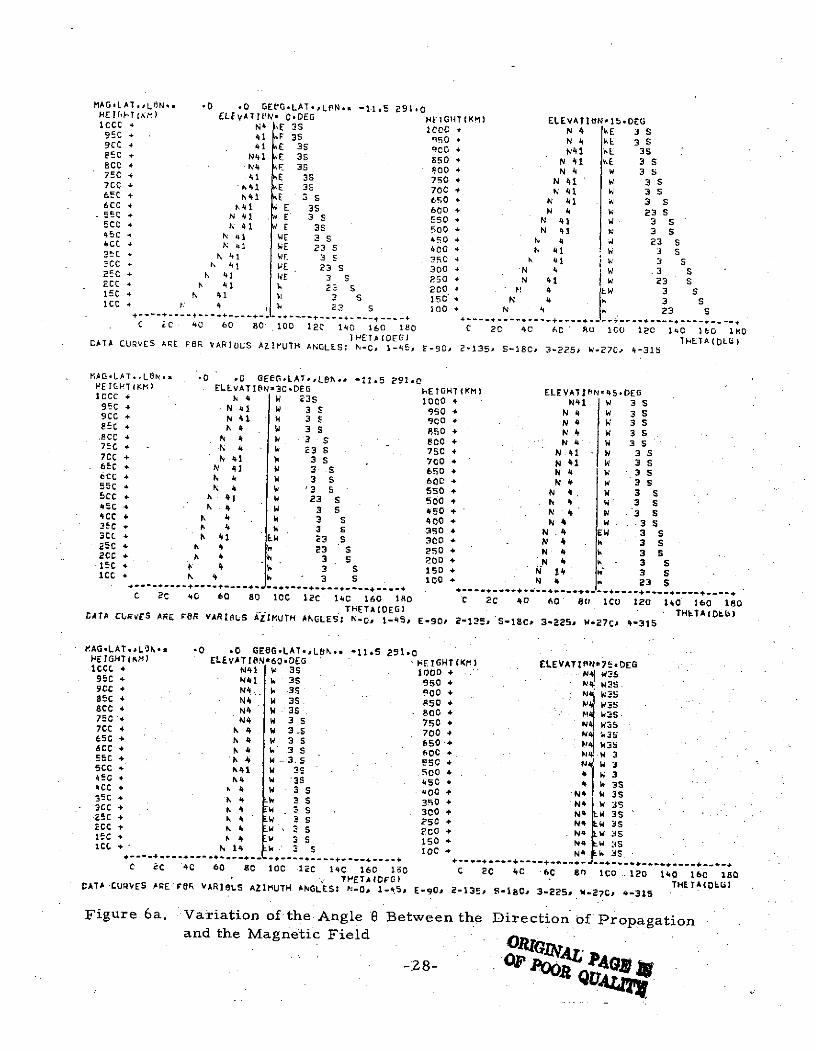
To further investigate at which locations and in which directions these
undefined cases occur, graphs of the angle 8 at heights between 100 and 1000 km
along the wave path were plotted for 8 directions.in azimuth starting with
-6-

0 degrees and increasing in 45" intervals, and for 6 elevation.angles of 0, 15,
30, 45, 60, and 75 degrees. The data was produced for a multitude of stations
at magnetic latitudes from 0 to 90 degrees at 150 steps along the magnetic
longitude lines of 0, 90, 180, and 270 degrees. Figures 6a-d show the graphs
selected at 0, 30, 60, and 90 degrees magnetic latitude and 00 magnetic
longitude, and Figure 6e at 0* magnetic latitude and 90 * magnetic longitude.
In Figure 6 a for example at 0* elevation and below 1000 km height, the
angle e passes through 90* in a direction slightly north of west and of east.
At 15" elevation in Figure 6b, 0 crosses 900 in all directions between northeast
and north at heights from 250 to 550 km, in all directions between northwest
and north at heights from 400 to 550 -km,. and in directions. slightly east-of north-
east and slightly west of northwest at heights somewhere below 250 and 400 km
respectively. For the station at 600 magnetic latitude in Figure 3c, the angle eremains larger than 90* in all directions and for all heights,permitting: good
Faraday rotation data to be reduced from all over the sky.
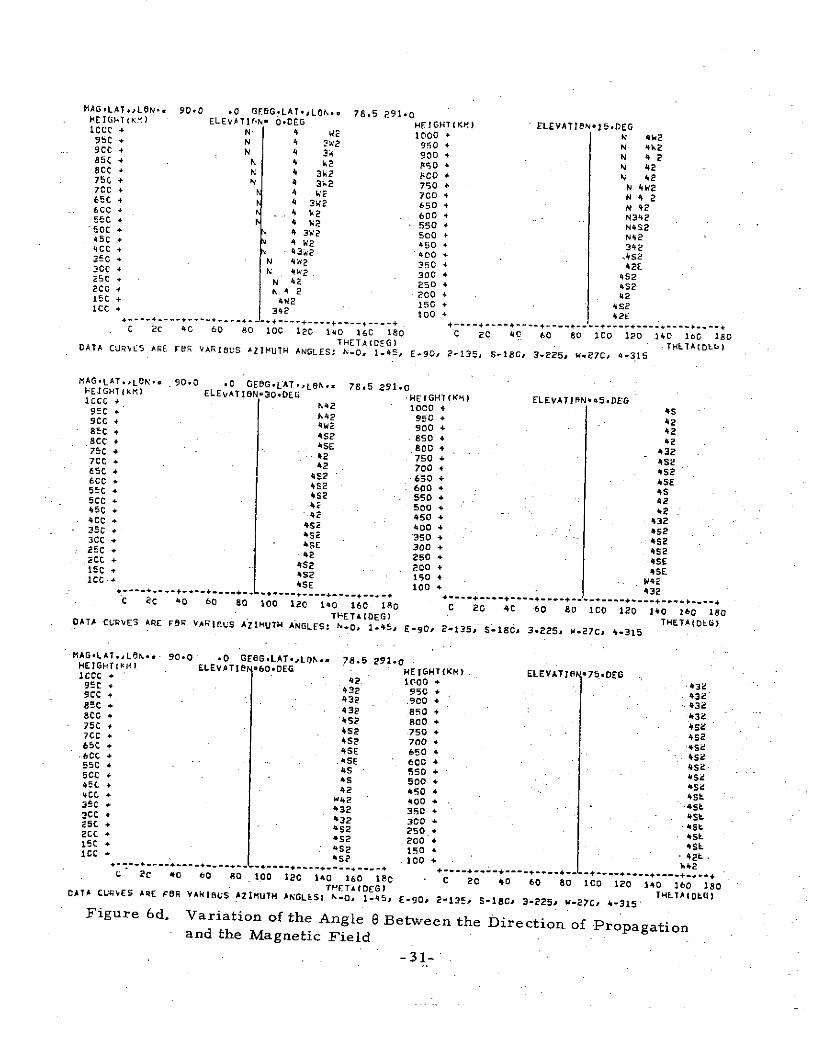
The following trend becomes apparent: Along the magnetic equator the
angle 9 passes through 90' below 1000 km height basically in eastern and
western directions at all elevations. The further north the station is located,
however, the more the directions at which 9 crosses 900shift from east and
west toward north, and only in the lower elevation angles can the change of 9
through 900 be observed. For stations south of the magnetic equator 9 crosses
900 in southern, southeastern and southwestern directions. In Figure 6 e for
a station on the magnetic equator observing at 0O elevation it can be seen, how-
ever, that 9 passes through 90' not in the eastern and western direction, but
in the southern direction and slightly east and west of south. This occurs
because the station coordinates are chosen for the dipole magnetic field and
actually fall south of the true earth's magnetic equator.
The relationship between the geographic and-the true magnetic coordinates
is rather complex and the azimuth angle measured clockwise from geographic
north does not easily fit into the irregular true field pattern; thus there exists
no short and simple tabulation relating the geographic latitude and longitude
-7-
of the station and the elevation and azimuth angle of the observationi to the
occurrence of the angle 6 passing through 90 degrees below 1000 km height.
However, the general trend of occurrence can be considered as a first estimate,
and will in many cases,, eliminate the necessity for accurate determination of
the angular conditions. For example, all stations that are located outside the
equatorial region extending from about 120 north to 18" south, which is
the range of the earth's magnetic equator, and are observing a geostationary
satellite, remaining within a few degrees of the geographic equator, will not
encounter the situation where 0 passes through 900 below 1000 km height. The
Faraday observations will be useful for ionospheric content reduction all over
the visible sky. For stations within the equatorial band the relative locations
of the station and satellite with respect to the magnetic equator might yield
enough information for the decision whether careful examination and detailed
computations for the particular case are necessary or not.
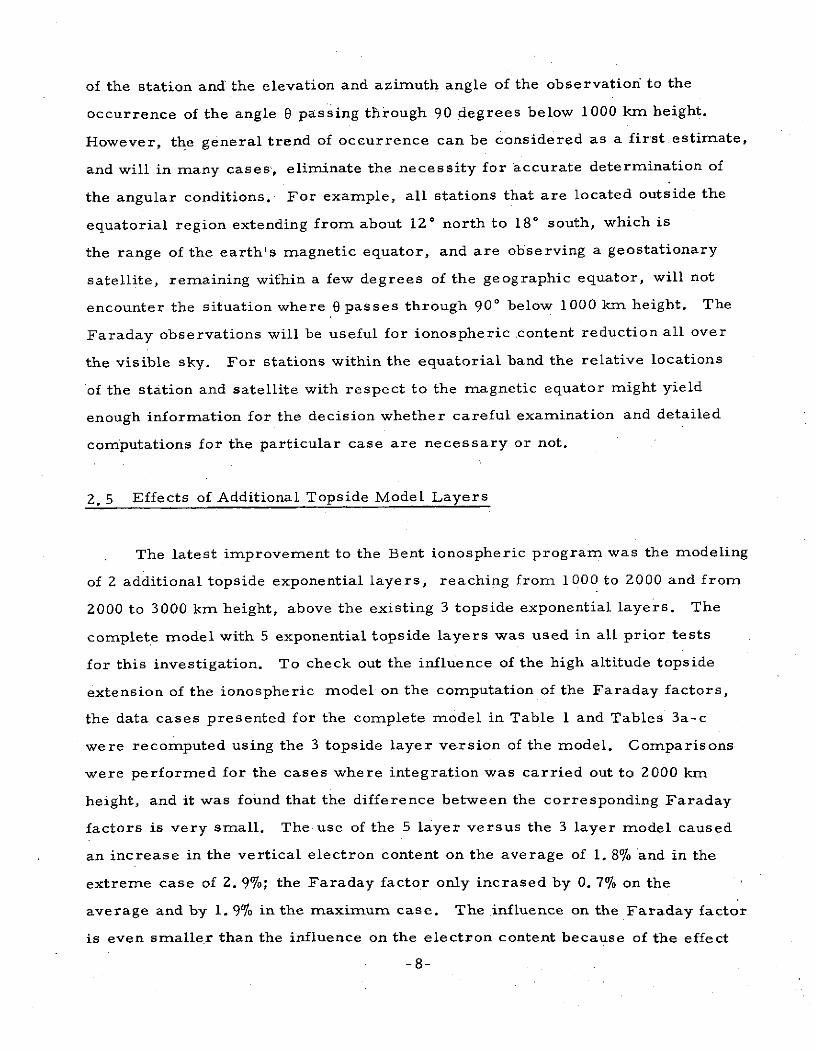
2. 5 Effects of Additional Topside Model Layers
The latest improvement to the Bent ionospheric program was the modeling
of 2 additional topside exponential layers, reaching from 1000 to 2000 and from
2000 to 3000 km height, above the existing 3 topside exponential layers. The
complete model with 5 exponential topside layers was used in all prior tests
for this investigation. To check out the influence of the high altitude topside
extension of the ionospheric model on the computation of the Faraday factors,
the data cases presented for the complete model in Table 1 and Tables 3a-c
were recomputed using the 3 topside layer version of the model. Comparisons
were performed for the cases where integration was carried out to 2000 km
height, and it was found that the difference between the corresponding Faraday
factors is very small. The use of the 5 layer versus the 3 layer model caused
an increase in the vertical electron content on the average of 1. 8% and in the
extreme case of 2. 9%; the Faraday factor only incrased by 0. 7% on the
average and by 1. 9% in the maximum case. The influence on the Faraday factor
is even smaller than the influence on the electron content because of the effect
-8-

of the magnetic field that decreases in strength with increasing altitude.
The added model layers can, in some instances, enlarge the vertical electron
content considerably more, as is apparent from the results of the following
tests inTable 4. The effect on the Faraday factors though is quite a bit
smaller.
2. 6 Variation of the Integration Limit
Important for the correct determination of the Faraday factor converting
the polarization data to vertical electron content is the proper height selection
for the integration limit in the Faraday equation in Section 1. 0. Detailed studies
have already been performed on this subject in the past by Klobuchar and
Mendillo, (Reference 4.). The argument brought forward was that the Faraday
factor is in error if the integration is carried out to the satellite altitude.
Instead the integration should only be carried out to heights above which
the remaining amount of polarization is less than the absolute experimental
error. At most observation sites,. the equipment induces errors of + 100 and
this portion of rotation can occur at heights above 1000 to 3000 km. The
recommended approach was to compute Faraday factors for porfiles up to
1000 km for converting the measured rotation angles to vertical electron
content and to add to that amount a high altitude contribution of electron
content in order to come up with the total electron content.
This concept seems to be substantiated by several tests computing the
vertical electron content and the Faraday factors and integrating to heights
of 1000 km as well as to 2000 and 3000 km. Table 4 lists the results for a
station at 15' latitude and 0* longitude observing along the vertical path at
2 hour intervals, presenting the various integrated values and in addition
the percentages by which the vertical content values and Faraday factors
increase when stepping from the 1000 km to the 2000 km integration limit
and from the 1000 to the 3000 km limit. Tables 1 and 3a-c include similar
test results. Keeping in mind that the Faraday factor is proportional to the
-9-

vertical content NT =FQ, we find that raising the integration limit from
1000 to 3000 km yields on average electron content values that are
10. 8%0 larger and Faraday factors that are 2..9%. larger than their
respective values for the 1000 km integration limit. It is apparent
that a sizable portion of the total electron content can be accumulated
above 1000 km, while the corresponding increase in the rotation angle
is clearly below the size of the experimental error.
Upon closer examination, however, this argument of fixing the
upper integration limit of the integrals computing the Faraday factors
does not hold up. A number of tests were performed computing total
electron content and Faraday rotation from ground up to 33000 km, for
various combinations of high, medium, and low magnetic latitude and
solar activity conditions and different seasons. Electron content and
Faraday conversion factors were computed for each 100 km height
interval. The rotation angles for the same intervals we re formed from
these values, and the total values were obtained by summing over the
contributions of all the segments.
Figure 7 shows the integrated electron content and Faraday rotation
from ground up to height h as a percentage of the total values integrated
to a satellite height of 33000 km for two selected cases. Faraday rotation
is accumulated more rapid at lower heights than electron content; in the
given cases 88 and 95% of the rotation are accumulated at 1000 km compared
with 78 and 91%0 of the total content. The same condition is illustrated in
Figure 8, only this time considering the percent of the total integrated
values in each 100 km interval, and plotting the difference between these
electron content and Faraday rotation contributions as a function of the
interval height. For all intervals below 500-600 km the contributions to
the total rotation exceed the corresponding percentages of electron content,
but at the higher altitudes the contributions to the total content are con-
siderably larger. This seems to indicate that the low altitude as well as
the high altitude portion have to be included in the integration process for
-10-

the Faraday conversion factor, even though the amounts we are talking
about are only of the same order or less than the instrumental errors.
Excluding contributions above 1000 km from the computation by integrating
only to a height of 1000 km and not all the way to the satellite would intro-
duce a one-sided bias, and the resultant total content values would be
consistently too small. The typical measurement errors of say + 10%
may become +2 to -18%7 if this one-sided bias is not taken into account.
3. 0 Conclusions
The results from the Faraday factor investigation point out the
importance for modeling the factors correctly with respect to the station
position where the magnetic latitude is of most significance and with
respect.to the direction of observation, since the elevation and azimuth
angles determine the direction at which the magnetic field lines are inter-
sected as well as the location at which the wave passes through the densest
part of the ionosphere. For low accuracy requirements it might be acceptable
to neglect the specific seasonal and diurnal influences since they only
produce variations of about 2 to 6% in the Faraday factors. High precision
in the high altitude end of the ionospheric model is not necessary, just as
the day to day prediction errors in foFZ do not effect the Faraday factors to
a great extent. However, prediction errors in ionospheric height, which
could easily be caused by sudden day to day changes can have a significant
influence on the Faraday factors. The predicted values of the height of
maximum electron density obtained from the Bent Model are on average
within the accuracy of the measured values, which considering instrumental
and reduction techniques, are about 15 km. However, the day to day
variations are quite a bit larger, and on occasion, deviations in the pre-
dictions of 100 km from the height measurements have been noted particu-
larly in the equatorial region. The resulting errors in the Faraday factor
are typically 5% for paths at vertical incidence. But for angular paths
errors of around 30%0 in the Faraday factor might occur resulting in pro-
portionally large errors in N T, whenever the condition occurs that the
-11-

propagation angle 0 falls between about 80 and 100* along a low elevation
path.
To avoid errors in the computation of the Faraday factor, the angle 0
between and the direction of propagation and the earth's magnetic field
lines has to be carefully monitored along the ray path. When the condition
89. 5°:5O90. 5 occurs, the equation relating the Faraday rotation angle
and vertical electron content no long holds true. When 6 passes through
90°at a certain height, the wave experiences rotation of the polarization
vector in one direction from the satellite down to that height, and rotation
in the opposite direction below that height. Contributions to the rotation
of the polarization vector in reversed directions cancel out, thus the
measurement is not representative of the ionosphere between the satellite
and the station.
There has been some question as to what the upper integration limit
of the integrals computing the Faraday factors should be. In order to
avoid any one-sided biases that might result in total electron content values
-being -consistently-tood--sma-ll and--creating--in effect unbalanced-me-asurement
errors of maybe +2 to -18%, the integration process should not be terminated
at some fixed height, but carried out from ground all the way to the height
of the satellite. In this case typical errors would be about + 10%.
The possibility of mapping the Faraday factors on a worldwide basis
was examined as a simple method of representing the conversion factors
for any possible user. After the preceding investigations, however, it
does not seem feasible. The complex relationship between the true magnetic
coordinates and the geographic latitude, longitude, and azimuth angles
eliminates the possibility of setting up some simple tables that would yield
worldwide result of sufficient accuracy. If tabular results for specific
stations are desired, however, such tables could be easily produced or
could be represented in graphic form.
-12-
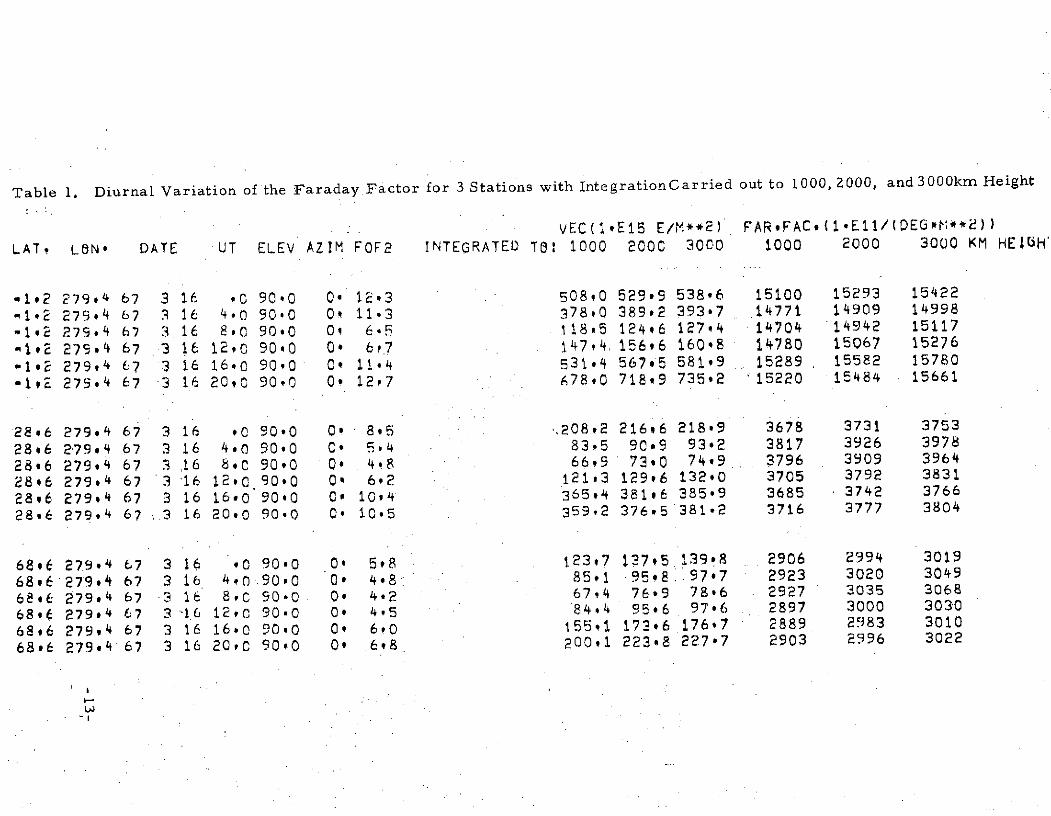
Table 1. Diurnal Variation of the Faraday Factor for 3 Stations with IntegrationCarried out to 1000, 2000, and 3000km Height
vEC(IE1I5 E/M**2) FARFAC.(1*E11/(DEG* **2))
LAT. L6N* DATE UT ELEV AZIM FOF2 INTEGRATED TO: 1000 200C 3000 1000 2000 3000 KM HEIiH'
-1,2 279o4 67 3 16 ,C 90*0 0. 12 3 50890 529.9 538,6 15100 15293 15422
-1.2 279.4 67 3 16 4.0 90.0 0O 11.3 378,0 389.2 393.7 14771 14909 14998
-1.2 279*4 67 3 16 8,0 90.0 0, 6.5 118.5 124.6 12744 14704 14942 15117
-,E 279.4 67 3 16 12,0 90.0 0. 6,7 147,4 156o6 160*8 14780 15067 15276
-1.2 279,4 67 3 16 16.0 90.0 0, 11.4 531,4 567,5 58199 115289 15582 15780
-I12 279.4 67 3 16 20,0 90,0 0, 12.7 :78,0 718.9 735.2 '15220 15484 15661
28.6 279.4 67 3 16 ,0 90.0 0. 85 -208,2 21616 218.9 3678 3731 3753
28*6 279*4 67 3 16 4.0 90*0 C. 5.4 83.5 90.9 93.2 3817 3926 3978
28.6 279#4 67 3 16 8*C 90.0 0* 4*8 6699 73.0 74*9 3796 3909 3964
28.6 279.4 67 3 16 120C 90*0 0. 6.2 121,3 129.6 132,0 3705 3792 3831
2896 279*4 67 3 16 160 90*0 0* 10.4 365.4 381.6 385.9 3685 3742 3766
28*6 279.4 67 .3 16 20.0 90.0 0, 10.5 359.2 376*5 381.2 3716 3777 3804
68*6 279.4 67 3 16 *0 90.0 0, 5.8 t2397 13715 139-8 2906 2994 3019
68*6 279.4 67 3 16 4,0.90,0 0o 4.8 85.1 95,.8 97.7 2923 3020 3049
68 6 279.4 67 3 16 8.C 90.0 0, 4.2 67,4 76*9 78*6 2927 3035 3068
68*6 279.4 67 3 -16 12,C 90*0 0. 4,5 84*4 95.6 97*6 2897 3000 3030
68.6 279,4 67 3 16 16*0 90.0 09 6,0 155*1 173,6 176*7 2889 2983 3010
6896 279.4 67 3 16 20,C 90.0 0, 6,8 200.1 223.8 227*7 2903 2996 3022

Faraday Rotation Factor
(10' /m 2 degree)
. 530--
.520
June 196 8
.510 *.Sept. 1968/ ,'Mar. 1968
0, Dec. 1968
500
.490.-
.480
0 4 . 8 12 16 20 24 UT (hours)
Figure i. Seasonal and Diurnal Variation of the Faraday Factor F (equation (6))for -Honolulu Looking at an Elevation and Azimuth of
63.60 and 159.30.

Faraday-_Rotation-Eacto r
3050
1. 1% diff.
3030
3010
2990
f o FZ -2-5%o/
2970- predicted foF2
0. 3.% diff.
fF2 +25%
2950-0 4 8 12 16 20
UT (hours)
Figure 2. Effect of Increase and Decrease in foF2 on theFaraday Factor for a Vertical Path.Station Position = 68. 6, 279. 40, Date = 16 March 1967.
--15 -

Faraday Rotation Factor(1 1P/m 2 deg)
4100
4000
3900 /hf +100 km
5. 4% it-ff.
38005. 50/% diff.
3700 predicted h,
3600
h, -100 km
3500I I0 4 8 12 16 20
UT (hours)
Figure 3a. Effect of Increase and Decrease in the Ionospheric Heighton the Faraday Factor for a Vertical Path.Station Position = 28. 6, 279. 4 , Date=16 March 1967.
Faraday Rotation 40, 000Factor (101 /madeg) + 4- 4++ +4
Date = 12 March 1970
12. 7% Faraday factor for predicted height h,-++-4+- Faraday factor for height h.+ 100 km
- ----- Faraday factor for height h, - 100 km-10. 8% The percentages indicate the difference between
30, 000 F evaluated using height hm and using heighth, + 100 km
21. 7%o
20, 000
16. 5%
-44
----------
21. 0%
10, 000 -17.4o--------- "+_
0
Latitude, Longitude..-12.0,2 Z84.1 14.7,17.9 5.6,359.8 11.5,111.C 14.7,17.9 11.5,111.CElevation, Azimuth.. 74. 1, 28. 60.0, 0.0 12.7,272.1 60.0,180.C 15.0, 0.0 0.0,180.(
FIGURE 3b. Effect of Variation in Ionospheric Height on the Faraday Factor F for an Angular Path

.TABLE..j-EFFECT-F'-INCREXS.E-AND -DCREASTN-F0F2ANDHMTh.~THE FARADAY FACTOR FOR AN-ANGULAR--PAT ..
VERTICAL ELECTRON C6NTENT (iEfl5 E/M**2), FARADAY FACTOR (1.E11/(CEG*M *2))
UNIV GEOGRAPHIC THETA AT HEIGHTDATE TIME LAT, LeN, ELEV AZIM 100 KM 1000 KM F8F2 HM VEC %DIFF.FAR,FACo %DIFF
70 3 12 6.6 11.5 111*0 '0 18010 153.6 98.2 14*4 366, 895.4 2425'+25% 1611.5 80.0 2578, 6.3S25% 439.5 -50,9 2312' -"4i7
+100 KM 9C5*9 1*2 331.6 36,8-100 KM 890o7 -.5 1729, -28.7
70 3 12 12,8 14*7 17,9 15#0 0C 33*9 79.1 1-48 347. 805.9 3393.+25% 1437,9 78,4 35310 4*125%. 400;3 -50.3 3297, -2.8
+100 KM 816,4 1,3 4340 27.9
S-00 KM 800*7 -.6 2654,4 21.8.... ... ............... . ....~~~ ~ ~~~~~ ------- .... ... .. ... .... .... ...... .. .. .... ..... ,
170 3 12 18*6 33-5 291,0 '0 270.0 101*6 130,1 11,9 332, 4810 24679+25% 840o6 74.8 2484. *7-25% 282;3 41 3 2470 #I
+100 KM 488.5 1,6 2607, 5.7-100 KM 476*9 "-9 2368. 4#00
70 3 12 23.8 43.9 212*3 '0 900 94.6 1227 10.9 314 379.9 3475,+25% 643*2 69.3 3468. "02-25%. 2341 384 3484-. 3
+100 KM 385*7 1.5 3414, -1.7"100 KM 376.5 -9 3738. 7.6
70 3 12 6.6 11.5 111.0 60,0 180.0 125*0 111i7 10.6 455* 456.7 8260.+25% 792.7 73*6 8380, 1.525% 285 6 -375 ...8282 ..... 3 ...
+100 KM 463.8 1.6 9182. 11.2100CC KM 453.8 w.6 7453. -998.
70 3 12 12.8 14.7 17,9 60.0 -0 70.4 85,5 13.1 3930 6C8,7 200640+25% 1075.9 76,8 20637' 2.9
+100 KM 617.7 1.5 24419v 21.7-100 KM 604*4 -7 16762s -16.5
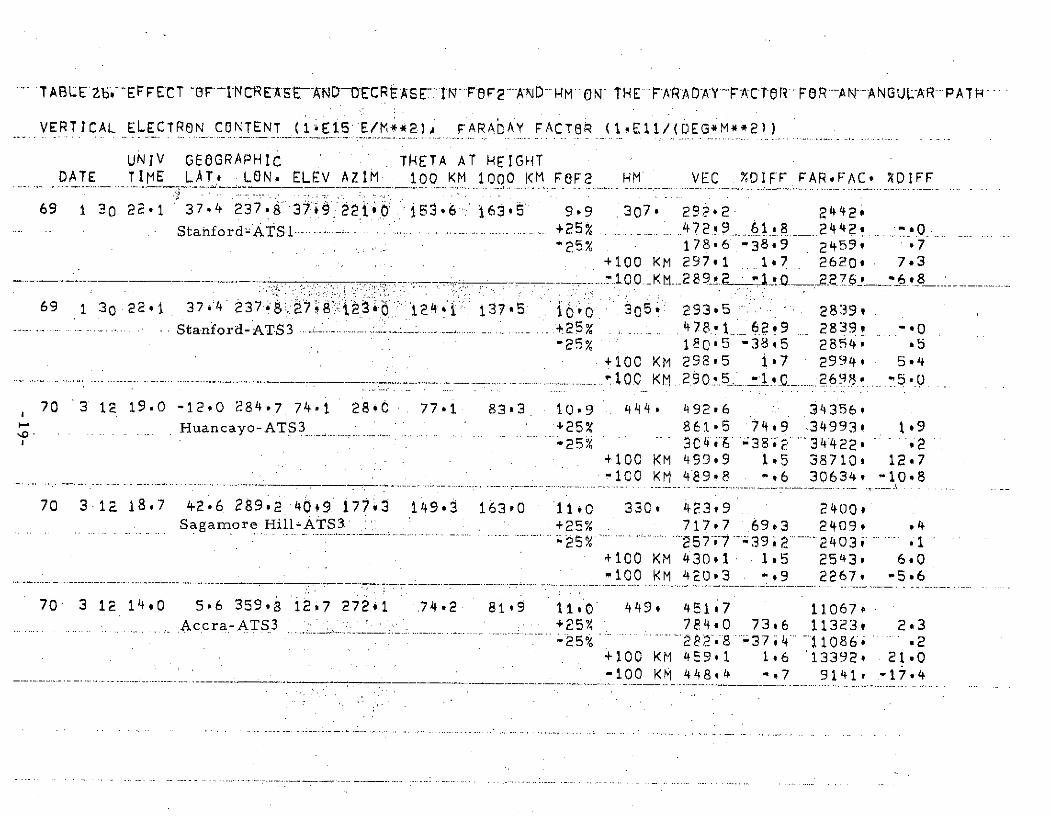
STABL E Zb--EFFECT T-OF-I-NCR EASE-A-N -DECRTAS ET-'I-FTW F 2 -•AND-- HM OW THE- FARAD-AY~'-ACTO R FO R -A NANGUL-AR- PAT H
VERTICAL ELECTRON CONTENT (l.E15 E/M**2)A FARACAY FACT8R (1,Eli/(DEG*M**2))
UNIV GEOGRAPHIC . THETA AT HEIGHTDATE TIME LAT* LON. ELEV AZIM 100 KM 1000 KM FOF2 HM VEC %DIFF FAR*FAC# XDIFF
69 1 30 22.1 37.4 237.8 37~ 221;0: 53,6 1635. 9.9 3070 292*2 2442,Staiford-ATS. :... . +25% . 729. 61.8 2442 0.
~25 % 1786 -38.9 2459' *7+100 KM 297*1 17 l 2620. 7.3
___ __- -__-- -0 .KM 8289! * .Q 76 *8
69 1 30 22-1 37'4 237.& Bb278 1, i214 137*5 io0 305 293.5 28:39.Stanford-ATS3 ..L .. l l . +25% 478 62 ...... 2839, -*0
-25% 1~0 5 138 5 28540 '+100 KM 298*5 1i7 29949 5*4
00 KM..29.01..5. . ..KM .... 2698' -5@0
70 3 12 19.0 -12.0 284.7 74.1 280C 77.1 83,3 10.9 44 4 492.6 34356Huancayo-ATS3 +25% 861.5 74.9 34993, 1.9
25% 304.6 ; 38 2 34422 .2+100 KM 499.9 1*5 387102 12.7-100 KM 489,8 -*6 306349 -10,8
70 3 12 18.7 4-2*6 289,2 40#9 177.3 149.3 163.0 11.0 330. 423,9 2400vSagamore Hill-ATS3 +25% 717.0 69.3 2409. 94
S2 5 % .... .... ..257'97 39 9 2 403 "
+100 KM 430.1 1.5 2543, 6*0-100 KM 420,3 -,9 2267, -5.6
70 3 12 14.0 5.6 359.8 12.7 272.1 74.2 81,9 11.0 449, 451*7 11067sAccra-ATS 3 +2. 5% 7840 736 11323. 2.3
-25% 828 "-37,4 i086; .2
+100 KM 459.1 1.6 '13392. 21.0-100 KM 448,4 -,7 9141, -17.4
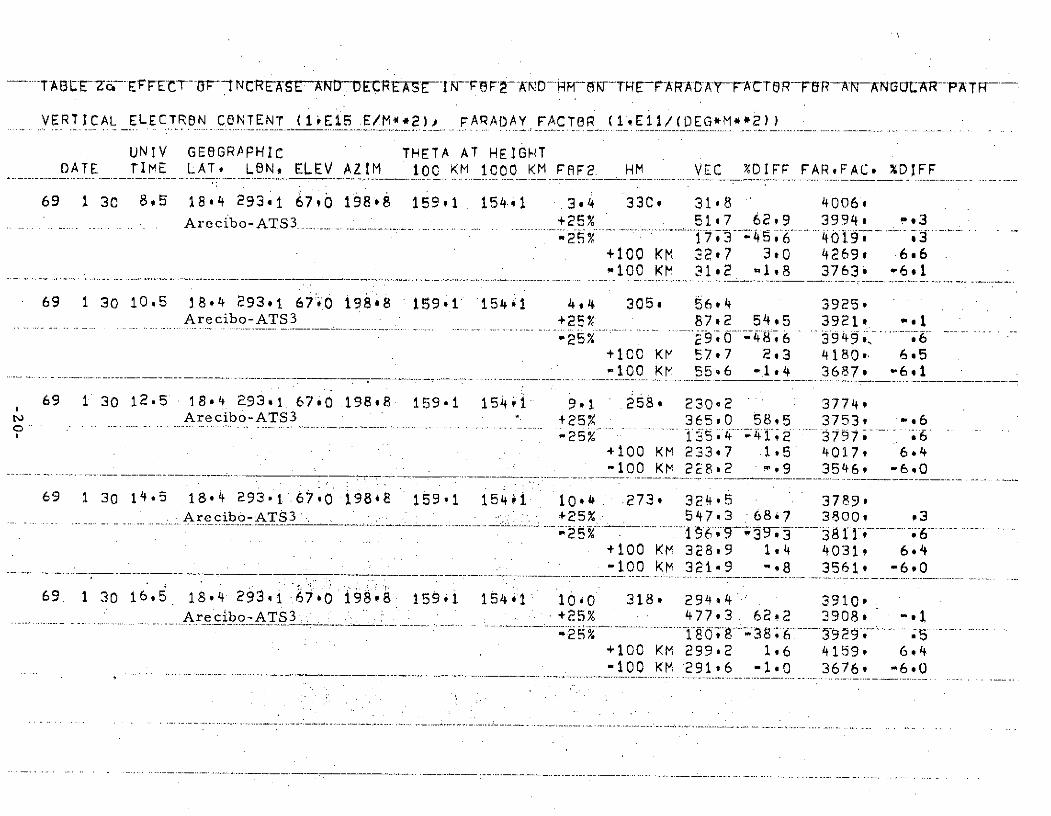
.TABLE -- EFFEC-L7NEASE ANEC. ECEASE-IN- FF~F2 A- MD -- F-TE TAAUDAYFACTO R-FOR--AN-AN(GULAR-PAT-
VERTICAL ELECTRON CONTENT (IE15 E/M**2)A FARADAY FACTOR (1IE11/(EG*M**2))
UNIV GEOGRAPHIC THETA AT HEIGHTDATE TIME LAT, LON. ELEV AZIM 100 KM 1000 KM FHF2 HM VEC %DIFF FARFAC* %DIFF
69 1 30 8,5 18*4 293.1 6790 198.8 159,1 154.1 3.4 33C# 31o8 4006s
Arecibo-ATS3 +25% . 51,7 62v9 3994o W,325% - 17.3 45.6 4019. 3
+100 KM 32;7 3.0 4269o 6.6"100 KM 31.2 -1.8 3763i -6,1
69 1 30 10.5 18.4 293.1 67'0 198'8 159.1 154.1 4.4 305. 56,4 3925,Arecibo-ATS3 : +25% 87.2 54.5 3921. M1
-25% 29.0 -48.6 3949p,+100 Kr 57.7 2.3 41800. 6.5-100 Kt 55,6 -1.4 3687* -6*1
69 1 30 12.5 18.4 293.1 67.0 198.8 159.1 154i1 9.1 2589 230,2 3774*N Arecibo-ATS3 +25% 365.0 58*5 3753v -. 6
S-25% 135.4 41 2 3797, .6+100 KM 233*7 1.5 4017. 6.4-100 KN 228,2 ,9 3546, -6.0
69 1 30 14*5 18.4 293.1 67.0 198,8 159.1 154i 10.4 273. 324.5 3789.Arecibo-ATS3 +25%1- 547.3 :68.7 3800. .3
-25% - S6939- 31E* 6+100 KM 328.9 1.4 40319 6.4-100 KM 321.9 ",8 3561. -6*0
69. 1 30 16.5 18.4 293.1 67.0 198.8 1591 1541 10.0 318. 294*4 3910,Arecibo-ATS3 +25% 477,3 62,2 3908. ",1
S- 25% -180 38 ---- 929.-
+100 KM 299.2 1.6 4159. 6,4.-100 KM 291,6 -1.0 3676. -6.0

Faraday Rotation Factor(10:/deg m )
16000
100 magn. latitude
14000
12000
10000
8000
6000
4000
39' magn. latitude
800 magn. latitude
2000
6 A 1 1!6 20
UT (hours)Figure 4. Variation of the Faraday Factor with Magnetic Latitude
for a Vertical Path and with the Diurnal Changes on16 March 1967.
-21-

Faraday Rotation Factor
(10 / m 2" deg)
3200
3000 . 90' Elevation
6 0' Elev.
28002800 - 45* Ele,
2600 -30* Elev.
2400
2200 10" Ele
5*Elev.2000
0 45 90 135 180 225 270 315
Azimuth (degrees)
Figure 5a. Variation of the Faraday Factor with Changes in Elevationand Azimuth Angles at 80" Magnetic Latitude.Station Position= 68.6*, 279.4*, Date = 16 March 1967, UT=12 hours.
-ZZ-
Faraday Rotation Factor(101 /m 2 deg)
8000 \
7000
6000 \
\ I
\ I
5000 - . \
4000 . 908 Elevation
• . 60 0Elev. •
3000 .... /45*Elev.
_30"Eev.
200010 Elev.
5"Elev.
1000
0 45 90 135 180 225 270 315
Azimuth (degrees)
Figure 5b. Variation of the Faraday Factor with Changes in Elevationand Azimuth Angles at 39" Magnetic Latitude.Station Position=28. 60,279. 40, Date=16 March 1967, UT= 11 hours.
-23-
Faraday Rotation Factor(1011 /m 2 deg)
16000-
90°Elevation
14000-
I I12000- I
\ I
OO I
1000 I\ I I
\ / 60*Ele
8000-
45\ /
\ 60°Elev /
600 /
400
. 10°Elev. .
2000 ev.
0 45 90 135 180 225 270 315
Azimuth (degrees)
Figure 5c. Variation of the Faraday Factor with Changes in Elevationand Azimuth Angles at 10* Magnetic Latitude.Station Position =-1.2 , 279.4, Date = 16 Mar 1967, UT=14 hours.
-241
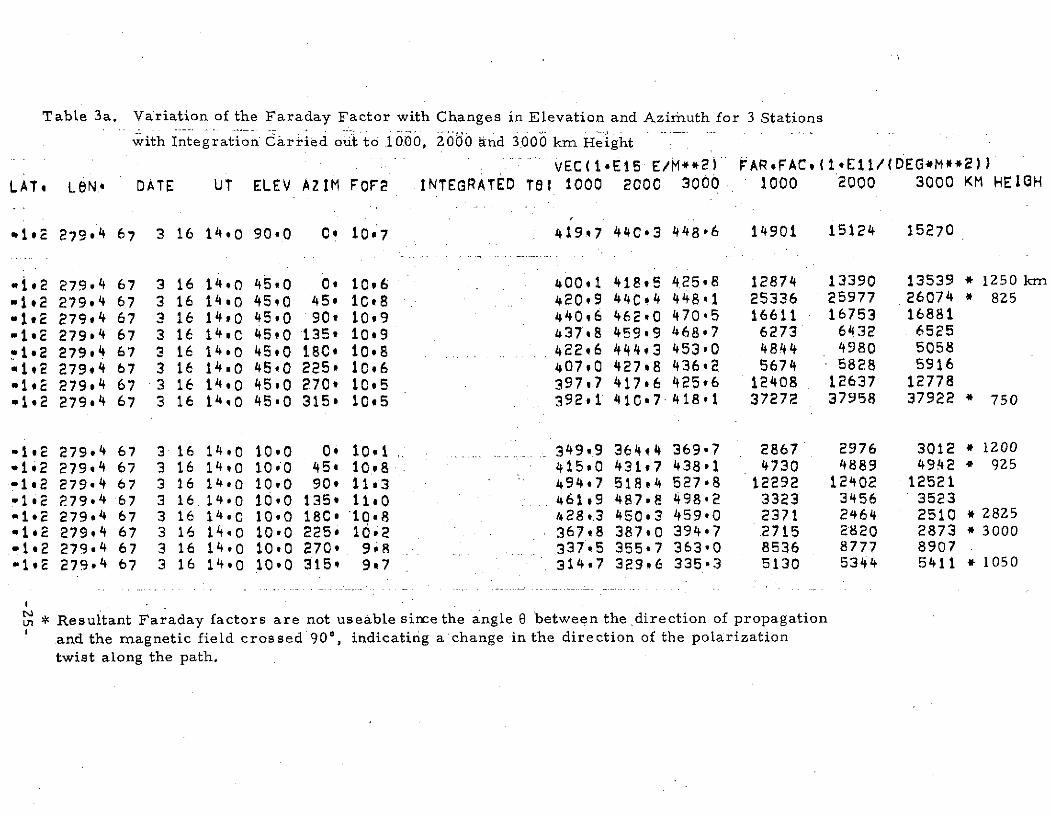
Table 3 a. Variation of the Faraday Factor with Changes in Elevation and Azimuth for 3 Stations
with Integration Carried out to 1000, 2000 and 3000 km Height
VEC(1.EI5 E/M**2) PAR.FAC,(1.E11/(DEG*M**2))
LATe L6N* DATE UT ELEV AZIM FOF2 INTEGRATED T81 1000 2000 3000 1000 2000 3000 KM HEIGH
.1i2 279*4 67 3 16 14,0 90.0 C0 10.7 419,7 440,3 44806 14901 15124 15270
1i,2 279.4 67 3 16 14*0 45,0 0' 10.6 40091 418.5 425.8 12874 13390 13539 * 1250 km
-1*2 27994 67 3 16 14.0 45,0 45. 10.8 420,9 44C04 448,1 25336 25977 26074 * 825
-192 279*4 67 3 16 14,0 4590 90' 10.9 440.6 46290 470*5 16611 16753 16881
-192 279*4 67 3 16 14,0 45.0 135t 10.9 437.8 459.9 468o7 6273 6432 6525
,1*2 279.4 67 3 16 14.0 45,0 18C0 10*8 422.6 444,3 453*0 4844 4980 5058
-1*2 279.4 67 3 16 14.0 45,0 225. 10.6 407.0 427*8 436,2 5674 5828 5916
-1.2 279.4 67 3 16 14,0 45,0 270' 105 397.7 417.6 425,6 12408 12637 12778
e1.2 279*4 67 3 16 14,0 45.0 315s 10.5 392.1 41C07 41891 37272 37958 37922 * 750
-I,2 279.4 67 3 16 14.0 100 0 10. ........ 3499 364.4 369*7 2867 2976 3012 * 1200
*1i2 279.4 67 3 16 14*0 10.0 45' 10,8 415.0 431,7 438*1 4730 4889 4942 * 925-1e2 279.4 67 3 16 14.0 10*0 90, 11.3 494.7 518.4 527*8 12292 12402 12521-1I2 279o4 67 3 16. 14,0 10.0 135 11,0 - 461,9 487,8 498,2 3323 3456 3523-1*2 279.4 67 3 16 149C 10.0 18c0 10.8 428.3 450,3 459,0 2371 2464 2510 * 2825-1*2 279.4 67 3 16 14*0 10*0 225, 10.2 367.8 387.0 394*7 2715 2820 2873 * 30001*2 279.4 67 3 16 14*0 10*0 270. 9P8 337.5 355.7 363.0 8536 8777 89071*2, 279,4 67 3 16 14,0 10*0 315* 9,7 314,7 329.6 335.3 5130 5344 5411 * 1050
S* Resultant Faraday factors are not useable since the angle 8 between the direction of propagation.and the magnetic field crossed 90, indicating a change in the direction of the polarizationtwist along the path.

Table 3b. Variation of the Faraday Factor with Changes in Elevation and Azimuth for 3 Stationswith Integration Carried out to 1000, 2000 and 3000 km Height
VEC(1E16 E/M*2) .. F'AR,FAC,(1,EIi/(DEG*M**2)),AT, LON" DATE UT ELEV AZIM FOF2 INTEGRATED TB: 1000 2000 3000 1000 2000 3000 KM HEIGH
28*6 279,4 67 3 16 11*0 90.0 0. 4*6 68.7 74.9 76*9 3761 3874 3929
28.6 279,4 67 3 16 11i0 45*0 0' 4,5 67.5 737 75*5 6153 6209 625228.6 279*4 67 3 16 11.0 4590 45v 47 73*1 79.6 81*5 5069 5155 520528o6 279.4 67 3 16 11.0 45,0 90' 4;8 76t3 829: 85*0 3630 3731 378128*6 27994 67 3 16 11T0 45.0 135' 4.8 7319 80.4 82.5 2839 2938 298628.6 279.4 67 3 16 11.0 45*0 180, 4,6 68.4 74.6 76,6 2600 2698 274528,6 279.4 67 3 16 11,0 4590 225v 4.5 64.3 70.2 72*2 2832 2935 298628.6 279.4 67 3 16 11,0 45,0 270' 4,4 62.9 68.9 70.7 3655 3764 381928,6 279*4 67 3 16 11#0 45.0 315s 4*4 63.8 69.8 71.6 5163 5253 5304
28*6 279*4 67 3 16 11.0 10.0 O. 4.2 59,4 65*5 67.0 14619 12854 12612 * 300 km28,6 279,4 67 3 16 110 100 ...45 5.1 87,9 95,.6 97*6 6791 6665 6679 * 15028.6 279,4 67 3 16 11.0 1090 90, 5.8 105.1 113,0 115*3 2829 2911 295028,6 279*4 67 3 16 11.0 10,0 135. 5,3 89.6 96,6 99.0 1828 1909 194628,6 279.4 67 3 16 11,0 10.0 180, 4,3 58.3 63.5 65'5 1588 1675 171928,6 279.4 67 3 16 11,0 10,0 225t 490 49.6 54,5 56.3 1814 1915 196528,6 279*4 67 3 16 11.0 10,0 270. 4.2 56,1 61.7 63.5 2929 3039 309328,6 279,4 67 3 16 11.0 10,0 315 4*0 52.4 57S 59.3 7597 7332 7327 * 175
N * Resultant Faraday factors are not useable since the ang14 0 between the direction of propagation andthe magnetic field crossed 90 ° , indicating a change in the direction of the polarization twist alongthe path.

Table 3c. Variation of the Faraday Factor with Changes in Elevation and Azimuth for 3 Stations
with Integration Carried out to 1000, 2000,and 3000 km Height.
VEC(1iEiS E/M'**2)e ARFACii(L11/(DEG*M*w2 ))
LAT, L8N* DATE UT ELEV AZIM FOF2 INTEGRATED T8! 1000 200C 3000 1000 2000 3000 KM HEIGH
68.6 279*4 67 3 16 12.0 90,0 0* 495 84o4 95.6 9706 2897 3000 3030
68o6 279.4 67 3 16 12.0 45.0 0. 47 8996 1013 1033 . 2993 3094 3124
68,6 279.4 67'- 3 16 12.0 45,0 45* 4*8 94*9 1069. 109*0 2876 2976. 3005
68P6 279*4 67 3 16 12*0 45,0 90* 4.8 94*7 106,6 108*7 2741 2837 2865
68*6 279,4 67 3 16 12,0 45.0 135, 4*6 88.9 100.3 102,3 2682 2776 2804
68.8.6 2.79.4 67 .. 3 16 12 0 45,0 180 .. 4. 4 ................ 80 5 912 93 1 2706 2799 2828
68.6 279.4 67 3 16 12*0 45,0 225, 4.2 * 74,5 84*7 86*5 2782 2875 2905
68.6 27994 67 3 16 12.0 4590 270. 492 74v8 85.2 87*0 2889 2984 3013
68,6 279*4 67 3 16 12.0 450. 315* 4.4 81s3 92.3 94,2 2989 3086 3116
.68.6 279. 67 3 16 120 100 .... 5 .......... ... 1075 120 8 123 1 2902 3037 3082
68,6 279.4 67 3 16 12.0 10.0 '45 5,5 12591 139.8 142.3 .2572 2660 268768.6 279.4 67 3 16 12,0 1090 90, 5.6 1 30*3 145.1 147*7 2208 2292 2315
6896 279,4 67 3 16 12,0 10,0.135, 5,2 . 109*1 121.3 123*5 2089 2168 2191
68.6 279*4 67 3 16 12,0 10*0 180m 4.3 73.5 82*8 84*5 2131 2212 2239
68*6 279.4 67 3 16 12*0 10.0 225. 3.5 479 55.0 56.4 2201 2290 232268.6 279*4 67 3 16.12 0 10?0. 270 34.. .................. 47 6 .552. 566 2360 2455 2488
68*6 279.4 67 3 16 12.0 10,0 315. 4.3 72.8 83.2 85*1 2688 2772 2805
MAGLAT,L3N. .0 .0 GEVG*LAT.,LPN.. -1.1.5 291.0HE I0-T (Km) ELEvATIN ODEG HFIGHT(KM) ELEVATIN 15DEGICCC N4 .E 35 ICCC + N 4 kE 3 S95C + 41 F 3S n50 + N 4 kE 3 S9CC 41 E 3S qC0 + N41 3E 3S-50 + N4 E 35 850 + N 41 kE 3 S8CC + .4 F 35 300 + N 4 3 575C0 .41 E 35 750 + N 41 W 3 S7CC 4 h41 E 35 700 N 41 W 3 S
6C + h 1 E 3 S 650 + N 41 W 3 S6CC + ,h41 E 3S 600 N 4 N 23 S155C N I4 E 3 S -50 N 41 W 3 S5CC t 41 E 3S 500 + N 41 W 3 S45C 4 K 41 WE 3 S 450 + N 4 W 234CC + N 41 WE 23 S 400 N 4 W 3 S?tC + K 41 WE 3 S 3C + N 41 W3 S3CC + '1 WE 23 S 300 + N 4 W 3 .25C + 1 E 3 S 250 + N 41 w 23 S2CC 4 N 41 2 S 200 + N4 3 S1CC + 4 S 250 +LW 3 S
C; N 41 W 3 S 15C + N 4 3 S1CC t. 4 2 E3 S 100 + N 4 23 S----------------------- ----------------------+ ----------------- ------------.......--
C iC 40 60 80 100 12C 140 160 180 C 20 4C 6C Ro 1C0 120 140 160 180TPTACOCCI THETA (DLU}CATA CURVES ARE FOR VARIOUS AZIMUTH ANGLES: N-C, 1-45, E-90A 2-135, S-18C- 3-225, W-27C, 4-315
MAGLAT.,L3N. . 0 .0 GEeG*LAT.,LB ,. -11.5 291.0E I HT KM) ELEVATIBN30DEG hE IGHT(KM) ELEVATI N745.DEG1CCC + N 4 W 23S 100 + N41 W 3 S9-C + N 41 W 3 S 950 + N 4 39CC. ~41 3 S 900 + N 4 W 385C0 N4 W 3 S 850 + N 4 W 3 S.8CC + 4 3 800 + N W 3 S75C + N 4 23 S 750 + N:41 W 3 S7CC + h 41 W 3 S 700 + N 41 W 3 S65C + N 41 W 3. S 650 . N 4 W 3 S6CC + h 4 W 3 S 600 + N 4 W 3 S55C + N 4 '3 5 550 + N 4 W 3 S5CC + h 41 W 23 S 500 + N 4 W 3 S45C + K 4 W 3 S450+ N 4 W .3 S4CC + h 4 W 450 + N 4 W 3 S35C * N 4 W 3 S 400 + N 4 W :33CC + 4 W 3 S 350 4 N 4 W 3 S3( * K 41 4 -W 3 S 300 + N 4 3 S25C + K, 4 23 S 250 + N 4 3 S2CC + 4 3 S P20o0 + N 4 3 S15C N 4 3 S 150 N 14 " " 3 S1CC K 4 3 5 100 + N 4 23 S
- ------------ -- --------------+.... JA4C 6+--------------4-----.C 2o C 60 80 1CC 12C 14C 160 180 C 2C 40 60' 80 lC 120 140 160 180
THETA (EG) THLTAt(DUiCATA CURVES ARE F*R VARIeLS AZIMUTH ANGLES: K-0, 1-45, E-90, 2-135, S-18C, 3-225a W-27C* 4-315
MAGLAt.,LON . 0 .0 GE8GLAT,LSN. -11.5 291.0HEIGHTiA1) ELEVATOIN.60.DEG .HEIGHT(KM) ELEVATIONv75.DEG1CgL 4 N41 W 3S 1000 + DN1 W3S
950C N41 W 3S 950 + . K'4 w3S00C . N4 3- 3S 0 + j3585C 4 N4 W. 3S . 50 + . A W3S'
8cC N4 W 35 800 + NP4 W3s5750' N4 W 3 S 750 + N4 W357CC + K 4 W 3-S 700. #165C + 33
6CC h 4 W 35 S 650+ " w356CC 5 h 4 W 3 S -C + N W 3SSC+ k4 W -35 -5C + 4 W 35CC * 41 W 35 .500 + 3450 + h4 W 35 45C0 4 W 35S4CC + 4 W 3 S 4o00 + N4 W 3535C + K 4 N 3 S 350 + N4 W 353CC + 4 'W 3 S 300 + N
4 W 3s.25C + K 4 W 3 S 250 + N4 W 3S2CC + , N4 W 3 S 2C0 + N Lw 351SC . , 4 W 3 S 150 + N w 3S1C. * N 14 W 3 S 100 # N'.- 3S,---------- - ---- - - ---------- 4 -----.--- ----------------C kC 4C 60 80 10C 12C 14C 160 160 C 20 40 -6C 8n 1C0 .120 140 160 180
- T ETAIDFG) THErAf -L )DATA -CURVES ARE FOR VARIOUS AZIMUTH ANGLES: '-0, 1-4.5 E-90, 2-135, S-180C, 3-225, W-27C, 4-315
Figure 6a. Variation of-the Angle O Between the Direction of'Propagationand the Magnetic Field
-28- Oi Pa

MAG.LAT,LUN- 30.0 .0 GEOG.LAT,LP*. 18.5 291.0HEIGHT(Kr) ELEVATION- ODEG HEIGHT(KM) ELEVATION-15*DEGICCG + -+ 41 WE 32S 1oO + N41 w E 3? S
95C P41 WE 32 S 950 + N41 W E 32 S9CC . K4 W E 32 S 900 + N41 W E 3e 5850 + K4 W E 3 2 850 + N41 WE 32 S8CC + 41 W E 32 S F00 + N41 WE 32 S75C + N41 WE 32 S 75C 4 N41 WE 3e S7CC + W WE 32 S 700 + N41 W E 3i 56EC.4 41 WE 32 S 650 + 41 W L 3 ? 560C + N41 E 32 5 600 + K41 W E 3 5S55C + N41 W E 32 S 550 * '41 WE 3 ? 5ECC . N41 W E 32 S 500 + N 41 WE 32 S45. + r,41 WE 32 S 450 + r41 WE 32 S4CC + 41 k E 3 2 S 400 + t41 W E 3 2 S35C + I1 k E 32 5 350 + N 41 WE 32 S3CC + N 41 WE 32 S 30C + N41 WE 32 S25C + N41 W E 3 2 S 250 + N 41 W E 3 2 S2CC + N41 WE 32 S 200 + N
41 WE 32 S
1EC + N 41 W E 32 S 150 + N 41 k E 3 2 S1CC *+ 1 w E 32 S 10C + N 41 E 32 5
---- +----.---------+--- +---+-- --+-- --------+ +----+-------+----+---+---------------+C zC 40 60 80 100 12C 140 160 180 C 20 40 60 80 100 120 140 160 180
THETA(DEG) THETA(DLU)DATA CURVES APE FOR VARIOUS AZIMUTH ANGLES: N-0 1-45, E-90i 2-135, S-18CP 3-225s w-27C. 4-315
PAG*LAT.ALON.= 30.0 .0 GEBG.LAT.sLO&. 18.5 291.0HEIGHT(KM) ELEVATIeN=30,DEG HEIGHT(KM) ELEVATION-45DEG1CCC + 41 WE 3 2 S 1000 + N41 WE 32 S95C + N41 WE 3 2 S 950 + N4 WE 32 S9CC + N41 WE 3 2 S 900 + N4 -WE 32 585C + K4 WE 3 2 S 850 + -K41 WE 32 S8CC 4. N41 WE 32 S 800 + N41 WE 32 575C + - N41 W E 32 S 750 4 N41 -WE 32 S7CC h41 E 32 S 700 + N41 WE 32 565C + N41 W E 32 S 650 + N41 WE 32 S6CC + N 41 WE 32 S 600 +- N41 WE 32 'S55C + 41 WE 32 S 550 + N 4 WE 32 55CC + - K41 WE 32 S C00 +
41 W E 3 2 S
45C + N41 WE 3 2 S 450 + N41 WE 3 2 S4CC + . 41 W E 3 2 S 40C + N41 W E 3 2 s35C + . 41 WE 3 2 S 350+ N 41 WE 3 2 S3CC + .41 WE 32 S 300 + 4 1 wE 32 525C N 41 WE 32 S 250 + K 41 WE 3 2 S2CC + 41 _ WE 3 2 S 200 + N41 WE 3 2 S15C + N1 WE 3 2 S 150 + N41 WE 3 2 :S1CC + N 1 . k E 3 2 s 100 + N41 WE 3 2 S
+---*---- *-*-----+ -- ------ ------- +--- --+---*4I---+ - ------------C 2C 40 60 80 100 12C 140 16C. 180 C 2C 40 .6C 80 100 120 140 160 180
THETA(DEG) THETA(DOQ)DATA CURVES ARE FOA VARIOUS AZIMUTH ANGLES: N-O 1-45 iE-90-. 2-135s S-18o 3-225. W-270a 4-315
MAG.LAT..LSK*. 30.0 .0 GEOG*LAToLON.. 18.5 291.0EIGHTIKM) ELEVATIBN-60*DEG . NEIGHT(KM) , ELEVATIRNs75.CEGICCC + N4 WE 3 S 1000+ 4 w 3595C + N4 WE 3 S 950 + 4W k359CC + N4 w 32 S 900 + 4 35850 + N' W 32 5 850 + 4 W 3580C + N4 W 32 -S 800 4 w 35750 + N4 WE 32 5 75C + N4 k 3S7CC + 41 WE 32 S 700 + N4 % 3S65C + N41 WE 32 5 .650 4 N4 w 356CC + . .41 iE 32 5 6C0 + N4 k 35550C + 41 WE .32 S 550 # N4 W 355CC + N41 WE 32 S 500 + N4 W 325450 + 41 WE 32 S 450 + N4 W 32SSCC + N41 tE 32 S 400 4 N4 W 32S :35C h4 WE 32 S 3 90 + N4 w 323CC * 4 N 1E 32 S 300 + N4 w 32S25C + K4 WE 32 S 250 + N4 W 32S2CC + N4 6E 32 S 200 + N4 W 32S15 N41 . WE 32 S 150 + N4 k 3S21CC h41 WE 32 5 100 + N4 32S
-*-- ------- - -------- ; -**------ --- +---- - +--------- *+ + ------C 2C 40 60 80 100 12C -140 160 140 C .20 4C 60 80 .100 120 140 160 180
THETACOEG) THETA(DLU)'DATA CURVES APE rfR VARIPLS AZIMUTH ANLES: N-Cp 1-45, E-90, 2-235, S-18CP 3-225* W-270, 4-315
Figure 6b. Variation of the Angle 0 Between the Direction of Propagationand the Magnetic 'Field
-29- RIGIN PA..rooR QUAMp*

MAG.LAT.PLOf.-a 60.0 t0 GEOG*LAT.,LON . 48.5 291*0HEI GH M) LLLVATIONP ODEG E0IGHT(KM) ELEVATItN-15*DEG1CCC + N4 WE 32S 1000 + 41w E 32595C + N4 6 E 3 25 950 * 41W E3 S900CC + 4 kE 3 S 900 + N41W E3 S85C &4 WE 325 850 + N4 WE 3 S8CC K 4 kE 3 S PO8 + 41W E 32S.75C * 4 W E 3 S 750 + 41h E3 S7CC + s41 WE 3 25 700 4 N41w E3 S65C .+ 41 WE 3 S 650 + N41W E32S66C + K4 W E 325 600 4 41W E3 S55C + 41 kE 3 S 550 + 41w E3 SSCC + N41i E 325 500 + N41W E32545C + N4 W E3 S 450 + 4 w E3 S4CC + 41W E 32S 400 + 41W E3 S35C + N41W E3 S 350 + t41W 3 S3CC + 416 E3 S 300 + 4 W E3 S29C + N41h E3 S 250 + 41W 3 S2CC + 41W E3 S 200 + 4 w 3 S15C + 4 k 3 S 150 + 4 W 3 SICC + 4 W 3 S 100 + 4 % 3 5
-------- -------- --- ---- +--- +-- ------- --------------------------- -C 2C 40 60 80 100 120 140 160 180 C 20 40 60 80 100 120 140 160 180
THETA(DEG) THETA(DBU)CATA CURVES AnE FOF VARICUS AZIMUTH ANGL.ES: N-0, 1-45, E-90, 2-135o S-180s 3-225# W-27C, 4-315
MAG*LAT.,LUK.. 60.0 .D GE5G.LAT.,Lf.,* 48.5 291.0HEIGHIKM) ELEVATIeN-30*DEG . EIGHT(KM) ELEVATION=45.DE G1CCC 4 41k E3 S 1000 + 41W E3 595C + 41N E3 S 950 + 41k E3 S90C + 41W E3 S 900 + 41w E3 S85 + 41W E32S 850 + 41w E325-8CC + N41k 3 2S 800 + 41w 3 2575C + N4W E3 S 750 + 41W 3 25CC 41W E3 S 700 + 4W 3 S65C * 41W E3 S 650 + N4w E3 S6CC 4 41w E32S 600C + W E3 S55C + h41W 3 S 550 + 4 W E3 S500C 4 k 3 S 500 -. 41W E3 S45C + 4 W E3 S 450 41W 3 2S4CC + 41W E32S 400 + 41W 3 535C + 41k 3 S 350 + 4W 3 S3CC + K4w 3 S 300 + 4W 3 5EEC * 4 k E5 250 + 4 W E3 52CC + 4 W 3 -S 200 + 4 W E3 S150 - 41 3 S 150 4 4 W 3 251CC N4W 3 S 100 + 4 W 3 S- ---- 4-------------* --- * ------------- *- ------ +-----.- -+--- ------------
.C EC 40 60 80 100 12C 140 160 180 C 2C 4C 60 80. 100 120 140 160 180THETAtOEG) THLTAI0tC)
CATA CURVES ARE. FOR VARI5LS AZIMUTH ANGLES: k-C, 1-45, E-9qC.2-135 S-18C, 3-225,w.W-7C, 4-315
MAG.LAT*LON..- 60.0 .0 GEBG.LAT,#LO.. 48.5.291.0hEIGHTEKM) ELEVATIBN-60,DEG HEIGHT(KM) . ELEVATIMNN75,DEG10CC + 41WE3 2S 1000 + 4WE32595C + 4W E3 2S 950 + 4WE3S9CC + 4w E3 2S 900 + 4.E3585C + 4W E3 S o50-+ 4WE3eS8CD- 4W E3 5 800 + N4WE3575C N4W E3 S 750 + N4WE3257CC * h4 E3 S 700 + N4WE3eS65c + k4W E3 S 650 N4WE3S6CC- . . W 3 S 600 + N4wE3 5550 + 41W 3 S 550 + 41WE3 55CC 41W 3 2S 500 4 *1WE3 545C 41W 3 25 450 + 41w3 ,4CC- 41W 3 25 400 + 4W 3 S35C + 41W 3 5 350 4W 3 53CC + 4 3 S 300 + 4 3 S525C 4W- 3 S 250 + 4W 3 52CC + 4w E3 S 200 4 3 515C * 4W E3 S 150 + 4 3 5ICC-- 4W 3 S 100 + 3------------ - --- ---+- ---------- 4---- ---- - - - -
C C 40 60 80 100 12C 140 160 180 C 20 40 60 80 100 120 140 160 180THETAM( i) THtTA(DEU).ATA CURVES ARE FO VAkUebS AZIMUTH ANGLES: &-C, 1-45, E-9C* 2-135, S-18C 3-225. W-7C 4*315
Figure 6c. Variation of the.Angle 8 Between the Direction of Propagationand the Magnetic Field
-30- OIGI PAG f" .O.
MAG.LAT.,LON*. 90.0 .0 GEOG.LAT.,LO.. 78.5 291.0HEIGhTeaY) ELEVATIFN= O0DEG HEIGHT(KM) ELEVATI1N-15tDEGICCE * N- 4 W2 1000 + N 4W295C + N 4 322 950 + N- 4k29CC + N 4 3W 930 + N 4 285C 4 K 4 k2 850 + N 428CC 4 4 3k2 co0 N 4275C + N 4 3k.2 750 N 4W27CC + 4 WE 700 N 4 265C + 4 3W2 650 + N 426CC + 4 k2 600 + N34255C + 4 W2 550 4 N4S250 + 4 3W2 500 + N4245C + 4 W2 450 + 3424CC + 4 3
w2 400 + 4S350 + N 4w2 350 * 42E3CC + N 4A E 300 * 45225C + N 42 250 + 4522CC + 4 2 200 + 4215C + 4W2 150 + 4S2ICC + 342 100 + 42E----- --- +.... ----------------------- -------C 2C 4C 60 80 100 120 140 16C 180 C 20 40C 60 80 1CO 120 140 16b 180THETA(DEC) THTAI(DLb)DATA CURVES ARE FOR VARIOUS AZIMUTH ANGLES: N.0, 1.45, E-90. 2-135, S-18C, 3-225P W.27C, 4-315
MAG*LAT.,LON.- 900 00 GEOG.LAT,La. 78.5 291.0fEIGHT(KM) ELEATION630.DEG HEIGHT(KM) ELEVATIRN45.DEGICCC + K42 lOOO 4SSEC + h42 950C * 42CC 4W2 900 + 4285C + 4S2 850 4 428CC + 4SE 8004 43275C - 42 750 + 4527CC + 42 7004 4S265C + 452 650+ 45E6CC +
• +sE600 + 452 .600 + 45CC 42 500 + 4245C + .42 450 + 432400+ 4S2 400 4S2350C 4S2 350+ 4S23CC + 4SE 300 4 45225C + 42 250 + 4aSE2CC + 4S2 20 + +SE15C + 4S2 150 +ICC4., 4SE 100 + 4321504-~--+----+ 45 , 104--------------------------------------------- ------------------- ------------c EC 40 60 80 100 120 140 160 180 C 2G 4C 60 80 1CO 120 140 160 180TI-ETA(DEG)
THETADLU)DOATA CURVES ARE FSF VARIFuS AZIMUTH ANGLES: N.0 , 1-45, E-90i 2-135, S-18C, 3.225, W-27C, 4-315
MAG-LAT.,LF,-- 90.0 .0 GEOGLAT.,LOh.. 78.5 291.0HEIGHT(IMI) ELEVATIe O60.DEG NEIGHT(KM) ELEVATe "75.DEG1CC * .42. C100 4329CC + .- 432 950 43290 *43 4328 50 "432 390085C + 432 .850 + 4328C + 452 800 4SL
75C + 4S2 750 + 4S27CC + 4S2 700 4 4e65C + 4SE 657004 s.6CC +. 4SE 600 4 S550 + 4S 550 + 4Si5CC +. 45 500 + 4"SASO +42 4504
4SE43C - W42 400 4. "4S332 350
.3CC * 432 3C0 6 4SL5C S2 2504 St2C00 * *S2 200 +
ASL15C + 4S2 150 4 2*L+52 tO0 +
%42
S2C 40 60 80 100 12 1410 160 180 C 20 40 60 80 CO 120 140 260 180
DATA CURVES ARE FOR VARIOUS AZIMUTH ANGLES: K. 0 , 1-45A E-90* 2-135o S-18C 3-2251 w-27C, 4-315'Figure 6d. Variation of the Angle 8 Between the Direction of Propagationand the Magnetic Field
-31_- +

MAG.LAT.sLON.. .0 90.0 GEUOGLAT.,L6BN* -.0 21.0hEIGITIKM) ELCVATIeN" OD.EG HEIGHT(KM) ELEVATItN,15.DEUICCc * 4.13ES 1000 + N4 1 W Fi S950 + 4W 3S 950 + N41 W F. S900CC + 4 3 900C + N4 I W E S85C + 4t. 3 2 RS0 + N4 1 W Et3 S8CC + 41w 3 2 800 + N 41 W E 3 S750 + N41W 3 2 750 + 14 1 W E 3 57-CC * 41 % E3 S 700 + N 4 1 w E 3 S265C + N41 W E3 52 650 + N 4 1 W E 3 S6CC + 4 i W .E3 2 6C00 + N 4 1 w E 3 555C + N41 t E3 S 550 + N 4 1 W E 3 25SCC + N4 1 w E 3 S 500 + N 4 1 W E 3 25450C N 41 N E 3 S 450 + N 4 1 W E 3 2S4CC + N 4 1 E 3 S 400 + N 4 1 W E .3 2535C + N 41 W E 3 S 350 + I 4 1 W E 3 2 53CC + N, 4 1 w E 3 S 300 + N 4 1 W E "3 2525C + N 41 h E 3 2S 250 + K 4 1 W E 3 2 52CC + K 4 1 E 3 .25 200+ N 4 1 W E 3 2 S15C + N -4 1 W E 3 ES 150 + N 4 1 W 3 2 S1CC + N 4 1 E 3 2S lCO + h 4 1 W 3 2 S
-----..... ------ ......... ........+.... .+----+----+------- -+.--+--+---- -------.--C 2C 40 60 80 100 12C 140 160 180 C . 20 4C 60 80 100 120 140 160 180
THETA (DEG THLTA Dti)DATA CURVES ARE FBR VAFILS AZIMUTH ANGLES: N-c, 1-45, E-90. 2-135, S-180s 3-225, W.-270, 4-315
MAGLAT.,LON= .0 90.0 GEIG*LAT.,LK.. -. 0 21.0NEIG-T(iKM) ELEVATIfN30.OEG HEIGHT(KM) ELEVATIMN=
45*DEG10CC + K4 1 W E S 1000 + N4 I W E 3 595C * N 41 FE S 950 + K4j W E 3 59CC + K 41 H E 2S 900 + N 41 W E 385C N 4 1 w E 2S 850 + N 41 w E 3 2S8CC + . 4 .1 hE 2S 800 + K4 1 WE 32S
.75C + N 4 1 W E 3 S 750 + N 41 WE w 257CC + N 41 NE 25 700 N41 WE 3257C + N 41 W E 3 2S .700 + N 4 1 W E 32S65C + - 4 1 k E 3 PS 650 + N 41 W E 3ES6CC * N 4 1 w E 325 600 N 41 W E 32S550 + N 4 1 WE 3 2 550 + N WE 2S5CC + k 4 1 W E 3 25 500 + N 4 1 W E 2545C + N 4 1 W E 3 2 S 450 + N 41 W E 2S4CC + K 4 1 E 3 2S .400 +. N 4 1 w E 2S35C + , 4 1 W E 3 2 S 350 + N l1 W E 32S3CC . . 4 1 E 32 S 300 + N 4 1 w E 2 S.250C + 4 1 E 3 2 S- P50 + N 4 1 WE 2 5ECC + 4 1 WE 3 2 S 120 + N 4 1 W E 2 '-15C h .. 1 E 3 2 S I0 + N 4 1 W E EsICC + N .4 1 w E 3 2 S 100+ h 4 1 w E 2 SS--------------- - -- ---- +---------- -------- ------------------ + + --
.0 2C 40 60 80 10C 120 14 160 180 C 20 40 60 80 100 120 140 160 180THETA (DEG) THLTA(DLU)CATA CURVES ARE FOR VARIbLS AZIMUTH ANGLES: Nh-O 1-45, E-90 2-135A 5-180, 3-225, W-27C0 4-315
MHAGLAT.LON. .0 .90.0 "GE&G.LAT.,LR1.* -.0 21.0hEIGHT(KM) ELEVATI8N=60.DEG HEIGHT(KM) ELEVATIB N75DEG
95C + .41 WE 32S 950 + i4WE3S9CC + N41 WE 32S 900 + 41WE3S75C + .41 WE 325 750 + 41WE3S8CC * h41 lE 32S 800 + 4IWE3S
7CC + N41 WE 32 700 4 N41W 3S6CC + N41 wE 321 650 -N W 356CC + 1 WE 32S60 -:N4 W 3S
55C + ! 41 WE 32S550 + N4 355CC + K 41 wE 32.500 +4 W3S45C + N4 1 wE 3 50 + 1WE 3S4CC + . 141 WE 32 ..400 4 41WE 3S350 + N 41 W E 32 350 + N41WE 353CC + N 41 W E 32 300 4 N41WE 3525C0 + 41 .E 32 250 + N4 WE 352CC + *41 W E 32 200 + N E32S15C.4 N4 1 W E 3 150 + N, WE32S1CC + N 41 W E 32 ICO 41 WE325---- -------- --------- -- ------------- -------------. .4
C 2C 40 20 80 0OC 120 140 160 180 C 20 40 60 80 100 120 140 160 180THETA (DGU) . THT A(DLtCDATA CURVESARE F&P VARILLS AZIMUTH ANGLES: N-C, 1-45, E-90, 2-135, S-18E, 3-225, W-27C, 4-315
Figure 6 e. Variation of the.Angle e Between the.Direction of Propagationand the Magnetic Field

Table 4. Comparison of Changes in Vertical Electron Content and Faraday Factor due to
Integration Carried to 1000, 2000 and 3000 km Height
SVEC(liE1 SE/M*) . FARPFAC,(1iE11/(DEG*M**2))
LAT, LOBN DATE UT ELEV AZIM FOF2 INTEGRATED TO: 100 2000 -3000 1000 2000 3000 KM HEIfH1
15,0 .0 65 10 10 ,0 90*0 0* 6.6 1.05,7 111,5 114*5 19537 19787 20002% DIFF,1-2K &-13K; 5,5 8.3 1*3 2W4
15,0 .0 65 10 10 2*0 90.0 0. 5.0 64.0 6894 -- 09 - 19526 .1. i9840 20125% DIFF1I-2K -I.3KI 6,9 10,7 1,6 3,1
15.0 .0 65 10 10 4*0 90.0 0O 2.8 21,5 253 27,6. 19773 20506 21181% DIFFl*-2K &1-3K: 17,728,2 3.7 71-
15.0 .0 65 10 10 6,0 90.0 0, 4*4 5715 62,9 66*0 19577 19997 20383% DIFF.1-2K &1!3K! 9.4 14o8 2.,1 4*1.
15,0 .0 65 10 10 8.0 90.0 O0 7,8 - 79,0 191ii 197.0 :19639 19939 20184
% DIFF..1-2K &,13K: 6.7 10.0 1,5 2,8
1590 .0 b5 10 10 10.-0 90-0 0 892. 224,0 240t2 247.9 19817 20128 20382% DIFF K 13K 72 ......106 1.......... 6 2,9
15.0 *0 65 10 10 12,0 90,0 00 9,3 285o9 306,0 315.1 19876 20176 20410% DIFF.1-21( &1.3K: 7.0 10,2 1*5- 2.7
15.0 ,0 65 10 10 14.0 90.0 0. 10,1 314,6 334,3 343.2 19779 .20052 20264
X DIFFI-2K &13K 6,3 .. 9, 1,4 2.5
15*0 *0 65 10 10 1690 90.0 0o 10,9 339,4 355.5 3627 1..9690 19902 20065
% DIFF.1-2K &1'3K: 47' 6.9 191 1,9
15,0 *0 65 10 10 18.0 900 0' io,10 279,2 291t5 297,0 19657 19854 20006
% DIFF,1.2K &I-3K; 4.4 6.4 .1.0 1,8
15.0 ,0 65 10 10 20.0 90'0 O0 9.1 209.4 218.7 223*0 1.9645 .19845 19999
% DIFF.1-2K U~-3K: 4,5 6.5 1.0 .18
15.0 ,0 65 10 10 22.0 90.0 0* 8.2 162.7 1707 174.5 19610 19832 20012
% DIFF,12K 1 -3K; 4.9 703 11 2.0
I

Height (km)4000 - II
II
3500 - II
II
3000 - II
I1IIII
2500 -I
I'
II
2000 - I
1500 -
fI
Date=10 Dec 65
Magnetic1000 Latitude 3- I Date=16 Mar 67
I MagneticLatitude =10
500
0 040 60 80 100
Percent of Total (at 33000 km) Electron Content------ Faraday Rotation
Figure 7. Comparison of the Amount of EC and Far.. RotationAccumnulated from Ground up to a-Varying Height
-34-

Height (kin)
3000 I
1000
0
-4 -3 -2 -1 01 ()
Mag. Lat.=100 Mag. Lat. =390 Mag. Lat. =80'
10Dec65 -----.--- .- o a ....e. rK oKXX 9x X
16 Mar 67 ...----20 Jun 71 .....-..--------- --------
Figure 8. Difference between Percent Contributions of Electron Contentand Faraday Rotation in each 100 km Height Interval.Percentages are taken of the total values integrated from0 to a satellite height of 33000 km.
-35-

APPENDIX A
Observations at Cape Kennedy
At the Cape Kennedy location, latitude = 28. 40, longitude = 279. 4,
2 types of experiments were set up, a digisonde measuring critical
frequency foF2 and height of the F layer h'F, and a polarimeter measur-
ing Faraday rotation angles Qthat were converted to total electron content
NT. Approximately a 6 month span of data was reduced, foF2 and height
data for two time periods 19 October 73 to 24 Nov 73 and from 20 Dec 73
to 7 Mar 74, and total content data from 20 Dec 73 to 7 March 74.
The height of the F layer was converted to an approximate height at
f o F2 by a rough conversion process relating the mean h'F observation to
the mean h, prediction on an hourly basis for the total reduction period.
Figure 9 shows the mean height curves along with the resultant scale
constants. The Faraday rotation angles were converted to total electron
content by the relation NT=FO using a fixed conversion factor of
F=0. 293x 101 5 el/m2 degrees. Considering the results from the preceding
report, the error introduced by the use of a fixed rather than a variable
factor was thought acceptable for the following reasons. For this particular
case, both station position and direction of observation were fixed. The
specific seasonal and diurnal variations will introduce at most, errors of
about 6%0, and the day to day variations in foFZ and height may contribute
up to a 5%0 error in the Faraday factor. The large possible errors due
to height changes do not apply to this case, since the angular observation
path has a relatively high elevation of 54* and azimuth of 156* for which
the propagation angle e does not come close to 90 . Thus the use of a fixed
factor will at most introduce an error of 7. 8%, and combining this in RSS
fashion with the inherent instrumental errors of about 10%7, the overall
error in the total electron content values should not exceed 12. 7%.
On a daily and monthly mean basis comparisons were performed between
the measured values of foF2, height and total electron content and the
-36-
corresponding predictions and updated values obtained from the Bent
Ionospheric Model. The diurnal plots are given day by day showing the
height variations in Figures 12a-I and the changes in foFZ in Figures lla-l.
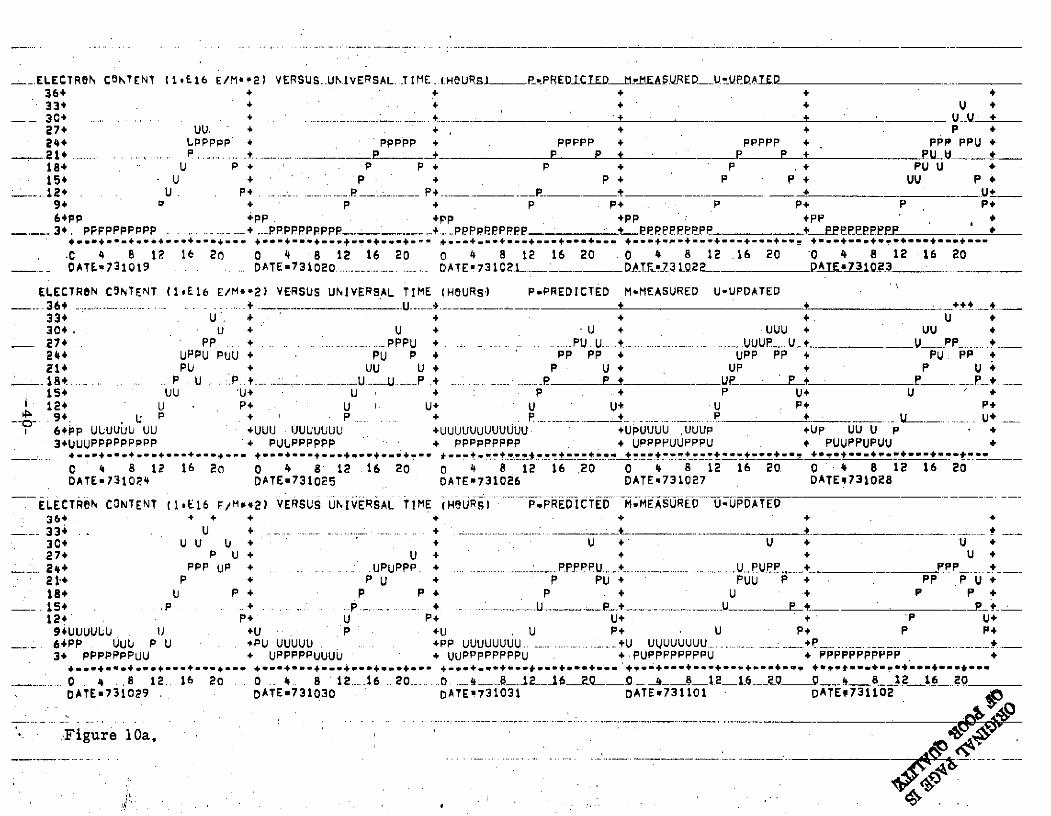
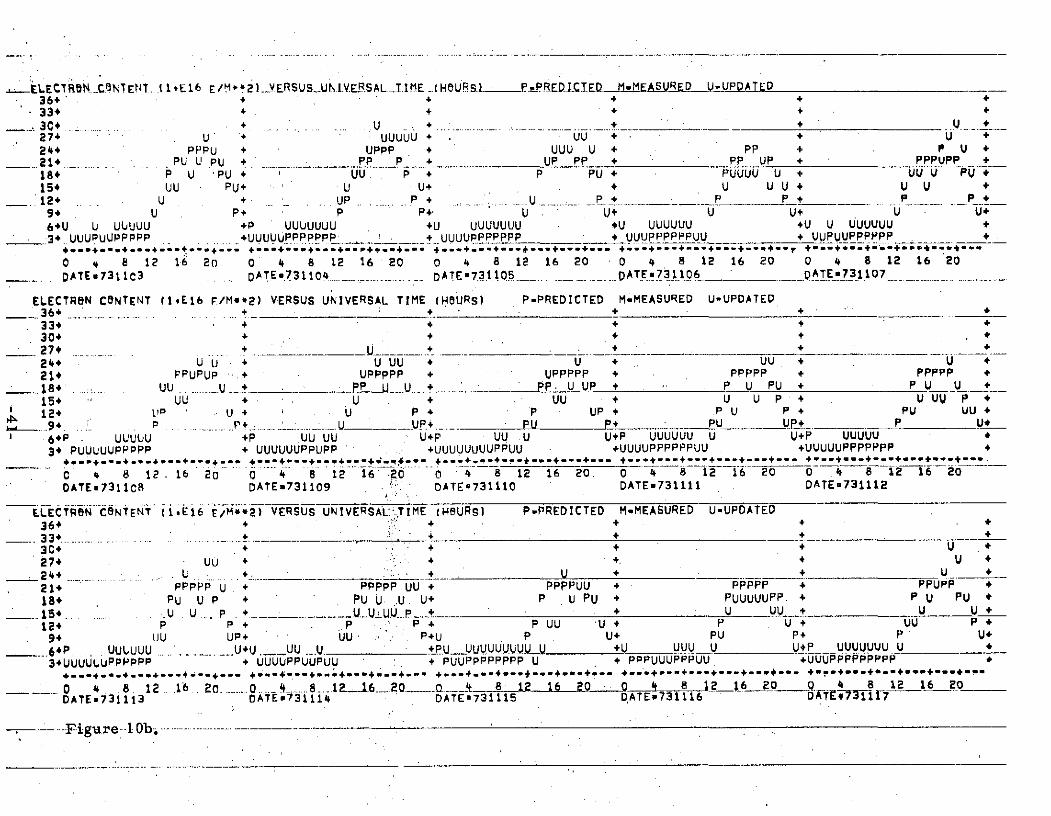
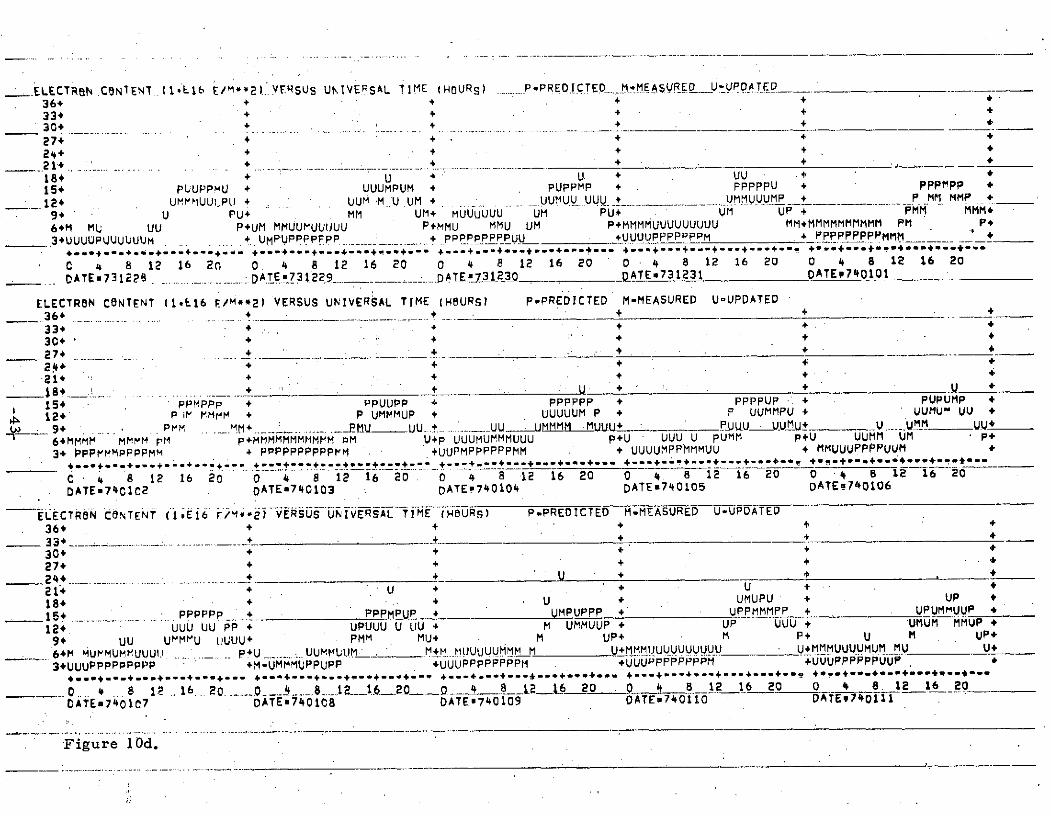
Figures 10a-1 show the curves for the total electron content predictions
and the measurements as reduced from the Faraday rotation observations
as well as the total content values updated with the foFZ measurements.
The diurnal curves giving the monthly means of the measurements as well
as the RMS residuals, measured minus predicted or updated values, are
plotted in Figures 13 a-f and 14, 15a-g for electron content, f0 F2 and
height.respectively. The monthly mean statistics are listed in more detail
in Tables 5a-g, where the daytime percent errors and the number of data
points are included.
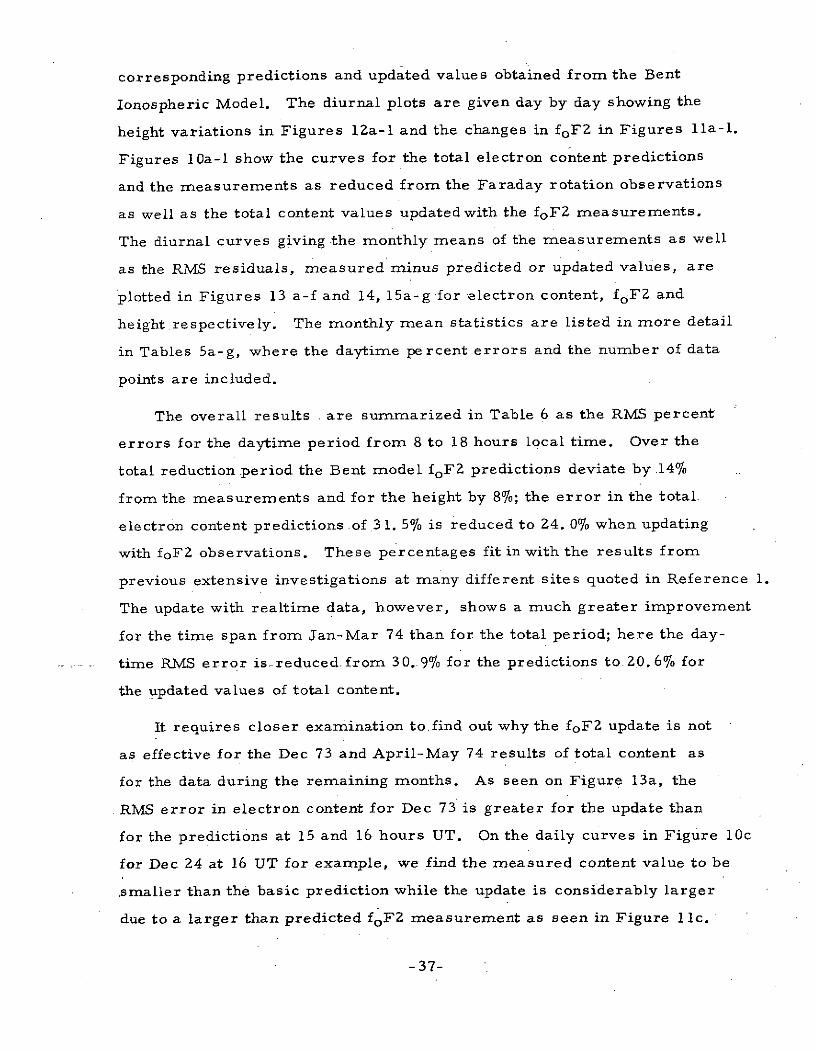
The overall results .are summarized in Table 6 as the RMS percent
errors for the daytime period from 8 to 18 hours local time. Over the
total reduction period the Bent model foF2 predictions deviate by .14%
from the measurements and for the height by 8%; the error in the total.
electron content predictions of 31. 5% is reduced to Z4. 0% when updating
with foF2 observations. These percentages fit in with the results from
previous extensive investigations at many different sites quoted in Reference 1.
The update with realtime data, however, shows a much greater improvement
for the time span from Jan-Mar 74 than for the total period; here the day-
time RMS error is-reduced-from 30.9% for the predictions to 20.6% for
the updated values of total content.
It requires closer examination to.find out why the foFZ update is not
as effective for the Dec 73 and April-May 74 results of total content as
for the data during the remaining months. As seen on Figure 13a, the
RMS error in electron content for Dec 73 is greater for the update than
for the predictions at 15 and 16 hours UT. On the daily curves in Figure 10c
for Dec 24 at 16 UT for example, we find the measured content value to be
.smaller than the basic prediction while the update is considerably larger
due to a larger than predicted foF2 measurement as seen in Figure 1lc.
-37-
Here we have an ionospheric irregularity where a sudden sharp increase
in foF2 is not accompanied by a corresponding increase in total content;
the increased electron density must be limited to a very narrow interval"
close to h, FZ. A few such points effect the monthly averages significantly,
and replacing for example the update by the predictions at 13, 15, and 16
hours UT when the update does not give an overall improvement, would
result in an RMS error for the Dec 73 update statistics of 17. 2%. This
is an improvement over the 21. 8% error for the predictions alone that
fits in with the Jan-Mar 74 results.
The update in April and May 74 shows a less than average improvement
for the same reason as in Dec 73. The Bent Model fits extremely good
to an average relationship for the variation between the quantities of foF2
and total content. On Jan 25 for example, the much higher than normal
foF2 observations between about 16 and 20 hours UT as seen in Figure l1e,
are used to update the total content predictions resulting in a near perfect
match for the much higher than average electron content measurements
in Figure 10e. On several occasions in April and May 74, however, the
higher than predicted foF2 observations are not accompanied by a typical
increase in the total electron content, and large discrepancies 'between the
predicted and measured values can be noted, as on April 12 and 13 in
Figure 10k.
-38-

Height h,.and h'F (km)
ha
300-
h'F N
Z80 /
260- I Scale constant
Ah (km)
240 - 20
?20 1 ." •
0 4 8 12' 16 20 Z.* 24
Ah-- 20
* I
Figure 9. Diurnal Mean Curves for Oct 73-May 74 of Predicted hm,Observed h'F, and the Difference Ah.
,....ELECTRON CONTENT (1,E16 E/M*2) VERSUS..UN.IVERSAL TIME. H6OURS)__ PPREDECIED._AtIJMEAS.REP-UPPDAIEP ._..36+ + + + + +33+ + + + + VU3C+ .............. + -+ + _ U U.' +274 UU. + + + + P +244 LPPPPP + PPPP + PPPPP + PPPPP + PPU +21 ... ............ P P P + P + U U +184 U P + P P + P + P . PU U +154 U + p + P P P + UU P +12+ U. P+ ..... ...... ....... . .. P+ .... ... __ . + U+9 + P + P P+ P P+ P P+
64PP +PP. +pp +PP +PP .
34. PPPPPPPPP .... - --+.PPPPPPPPP. . +PPPPPPPPPPP I 2PPPEPEPPP + PPYP-EEPP +* ** *****4..... . .. **.*... .. *.. 4-. . .... *.... + ... +..... ... ... +. *44f'h'+.* .**+..4.+* f*4 *.**+
.C 4 8 12 16 20 0 4 -8 12 16 20 0 4 8 12 16 20 0 4 8 12 .16 20 0O 4 8 12 16 20DATE,731019 . DATE 731020 ....... .... .. ....... ..... DATE 731C2.1 .. DAT=.31022. .PATE73 0231
ELECTRON CONTENT (1,El6 E/M**2) VERSUS UNIVERSAL TIME (HOURS,) P-PREDICTED M-MEASURED U-UPDATED36€ -. . . .... + .U ........ . + + + +33+ U. + . + +. U +304. U + U + : UUU + UU +274 PP + ...... ................ PPPU + PU. U . ..... ..... ..... UUUP U t U PP. +24' UPPU PUU + PU P + PP 'PP UPP PP + PU PP +a14 PU + UU U + P U + UP + P U +18 ...... .. P .U .P . . P..U ... P .+ . ... .... _P UP P +p15+ UU U+ U + P + P U+ U +'12 U - P+ U U+ U U+ U P+ P+9+. U P PP P.P + U p U+
6*PP ULUUUU UU +UUU UJUUUUUU +UUUUUUUUUUUU +UpUUUU ,UUUp +Up UU U P +34UUUPPPPPPPPP + PULPPPPPP PPPPPPP + UPPPPUUPPPU + PUUPPUPUU
=.•€of' L'-.w+'Z ... ... ....... = w .....
C . 4 8 12 16 20 0 4 8 12 16 20 o 4 8 12 16 ,20 0 4 8 12 16 20 0 .4 8 12 16 20DATE.73104 DATEo731025 DATEs731026 DATE=731027 DATEq731028
ELECTRON CONTENT (1.E16 F/M**2) VERSUS UNIVERSAL TIME (HBURS) PoPREDICTED M-MEASURED U-UPDATED36 . + + + + +334 . U + .... ....... .............. ...... + . .. . _ __ __30+ U U U + + U +' U + U +27+ P U + U + + + U +24+ PPP UP + ... UPUPPP. + ...................... PPPPU ........ _ ........ U.PUPP + PPP
21+ + P PU + P PU + PUU P + . PP PU18+ U P + P P P + U + P P +15+ . .P + P ...........- .... u + . .. +124 P+ U P+ U+ + 'P U+94UUUULU U +U 'P +U . U P+ U P+ P P+64PP UUL P U .. +P ..++PU UUUUU . +PP UUUUUUUU............ U UQUUUUUU-..34 PPPPPPPUU + UPPPPPUUUU UUPPPPPPPPU + PUPPPPPPPPU 4 PPPPPPPPPPP . +
.. .....04. ....... O............ ... . .. +.. ......... 4._......._.._...... 4 +* Xe !LeO
S . .8 12.. 16 20 0... 4 8 12.-16 .. 20 ....... ._ 4 ...- O.. 12 16 0 2 .o 4 812-6 Q _ .4 8 12 16 20DATE.731029 . DATE=731030 DATE!731031 DATEx731101 DATEP731102
Figure 10a.
.ELECTR NCONTENT...( ,L16 E/M * 2 _VERUS U .IVER.SAL ._TIME _(HBURSSL- UPILFC.TED__-_Bi-ME _RPAi PU-UPDAlTED36+ + + + + *
* 33+ + + + + +
.3C+ . + ........ ....... U + + + U27+ U UUUUU + UU + + U +
24+ PPPU + UPPP + UUU U + PP + P U +
21+ .. PU U + PP P + UP PP + PP UP + PPPUPP +
18+ P U 'PU + UU P + P PU + PUUUUU + UU U PU +154 UU PU+ U U+ + U U U + U U +12 U + UP . ..... ... + .. .. .... .. .. P P P + P ..9+ U P+ P P+ U U+ U U+ U U+6+U U UGUUU +P UUUUUUU +U UUUUUUU *U UUUUUU +U U UUUUUU +3* ..UUUPUUPPPPP .... UUUUUPPPPP +UUUUPPP P ++ UUUPPPPPPUU + UUPUUPPPPP + +
*.f+.***. -*.*+--. +.-.....--+ ... . .+- ... .... ..........+........ "+. ..... .4.n .n .
0 q 8 12 16 20 0 4 8 12 16 20 0 4 8 12 16 20 0 4 8 12 16 20 0 4 8 12 16 20
DATE.7311C3 DATE.731104. ....... ....... ATEx731.105 ... ............ AT.E3 5 106 . ATE731107 .
ELECTRON CONTENT (1*E16 F/M**2) VERSUS UNIVERSAL TIME (HBURS) P-PREDICTED M-MEASURED U-UPDATED36+ + _ _ _334 + + 4304 + 4 4 +S274. U + + .
24+ U U 4 U UU + U + UU + U +21 PPUPUP + UPPPPP + UPPPPP + PPPPP + PPPPP *
S .184 U + PP U._VU_ .+ PP. U UP + P U PU + PU U +15+ UU U + UU + U U P + U UU P +12+ 0 U + U P + P UP + .PU P + PU UU +9*. P P+ ..... U UP+ PU P+ PU UP+ P U*
6+P UUUUU +P UU UU U+P UU U U+P UUUUUU U U+P UUUUUU34 PUUUUPPPPP + UUUUUUPPUPP +UUUUUUUUPPUU +UUUUPPPPPPUU +UUUUUPPPPPPP +
. .+ .4... . ... .... ....+ *.. . ... .... . **+ + + + +4 * + 4*+ * * * * + *
0 4 6 12. 16 20 0 4 8 12 16 0 0 4 8 12 16 20. 0 4 8 12 16 20 0 4 8 12 16 20DATE,7311C8 DATE=731109 DATE=731110 DATE731111 DATE=731112
-iELECTRCEiNTEN " isE16 r/M**2) VERSUS UNIVERSAL. TIME (HBURS) P.PREDICTED M-MEASURED U-UPDATED36 +33+.. +.i" ++3C+ + + U +
27+ UU .(): + + U +2* . .+ + + U + + U +
21+ PPPPP U + PPPPP UU + PPPPUU + PPPPP + PPUPP +
18+ PU U P + PU U U U+ P .U PU + PUUUUUPP. + P U PU +15.... . ..U U.. P . .U_.U .U.._ + U UU + U U +12+ P P * P P + P UU U + P U + UU P +94 UU UP+ UU :. P+U P U+ PU P+ P U+
64P . UULUUU ..... ...U+U UU ....U. +PUUUUUUU UU +U UUU U U+P UUUIUUUU U +3+UUUULUPPPPPP + UUUUPPUUPUU + PUUPPPPPPPP U + PPPUUUPPPUU +UUUPPPPPPPPP +
- . +.-.-. 4...------.... +.------------ -*.sn. ~f. 4 +.+.-- +*..+ --.-4-- +...+*+-+... ..... +---+-I-. *.r.-+...++...*** *
0. 4 8 12 16 20....0 ..........4 8 P 1.... 204 8 12 16 0 4 8 2 6 20 0 4 8 12 16 20DATEE731113 DATE=731115 DATE0731115 0 ATE731116 oAfEM 7
-.Figure-1 Obi. .......... -

S..ELECTReN CONTENT (1 1 6 E/M**2) VERSUS.U' IVERSAL..TIME (HOURL P P-R-EICTIF MMEMAS slR-D -VPDATE--364 + + + *
S 33+ + 4 + 4
.304+ ... _. . + + U +.274 + + U + . U +244 U + U + + + UU +
....... .............. PPUUP ........ ..+ PPPPP ..PPPP UUPF U + UPP184 P LU + P U UP + PUU UUP + UP PP U+ U UU +154 UUUU' U + UU ' U UU + . UU U + U UU P + U P +.. 12+ . P U. .... . ...... U +__ U ......... ___U_--P t____ EP .U P UP_ +
9+ U P+ U P+ U UP+ + U P UU+6+P UU U U+U U+P UUUUU U+U UUU U U P+P UUUUU U U +
; .3+UUUULUPPUUP ............... UUUUUUUUUUU.-- ......+UUUUUPE.ERUU , + UUUEPEUUU 4 VUE!-_._e +PPP +*+........--.-- +.-+---+* **-*... ...... ---- .....-.--+ +--+ +. ---+-+.. +4.4+*...
C 4 8 12 16 20 0 4 8 12 16 20 0 4 8 12 16 20 0 4 8m 12 16 20 0 .4 8 12 16 20.DATE731118 .. D . ATE 731119. ... ..... DATE73112 . ... __ D.. .A 3 DATE 311 L2__
ELECTRON CNTENT (1sE16 E/M**2) VERSUS UNIVERSAL TIME (HOURS) P*PREDICTED M.MEASURED U-UPDATED- 36+* ..... . ..-... . ................. t . . +
33*4 + +3C+ + + + +27+ . U. ......... .... . ....... ........... . +
24+ LU U + + + UUM U +21+ UPPP + PPPP + + MUUMM + U +S 18... ................ P PU . . . P PP ........... PE-._.M __ UMPPU_ UUUUUM .....15+ U P . P + M MMUUUU + PP PPP + UM MPPU +
12+ U U + P P + P MM M + U U + UM H +_N 9 '.. U U+ . U P P+ .M .... ... .. . . P M+MMMMUU .....UP UM+
6+P UU +P UUUUUU U +MMMMMMMMMMMMM U+UM UMUUUUUUUP U+UUUUUU MUUM U*+3+UUUUUUUUPPUU + UUPPPPPPPPP pp PPPPPP + UUPUPPPPPPP + PPPPPPPUUPP +
t +.- +. .+-.--4-- .. ..-- --- .-.- + +. . . . ..- +......** .
C 4 8 12 16 20 0 4 8 i2 16 20 0 4 8 12 16 20 0 4 8 12 16 20 0 4 8 12 16 20DATE=731173 DATE=731124 DATEm731220 DATE=731221 DATE*731222
ELECTRON CONTENT (1*E16 F/M**2) VERSUS UNIVERSAL TIME (HOURS) P.PREDICTED M.MEASURED U-UPDATED36+ + 4 ' +33* .... .. +4 .. "- .' ..... ......... . ....... _ ..... .. -.. ..... . . __ _303+ * - + +304 4
27+ + U + *
24+ . ++ U21+ UU + " + U + +184 PPP. 4 PPPU 4 UPPP + UPP + UPp
15 . UUFRUUMUP + . . UUM UMUP. + .. ...PUUU . -... UMUUUP ._ PP UPP *124 PM MMU UU +. UMM UM MUP + UMMUMMM P Um MMUP 4 UUUMMMUUU
94 P M + UM UU+ UM UU + PM U + MM U
... 64MMUULUUUUUU U .U+M UUUUMUUUUM..... M+P . UU UUM U.......... U..... ...... UUU.. U U+ ____ M3+UUPPPPPPPPMU +UUPPPPUPPMPP +MMUUPMUMMPPU +UUUUUUMMMUUUM +UUUUUUUUUUUU U+
....... ... +.t. .......... ** ...+ + .. +.. .+.+........ +.? --*.+...
0.. 4 . 8 12 16 20 .. 0 44. 8 12... 16....20 ..... 0 .. 84.._12 _ 0 0 8 2 6 20 0 4 8 12 16 20DATEu731223 DATE-731224 DATEP731225 'DATE.731226 DATE731227
S....F-igure10c; ....
E..ELECTRN CNIENT _(IL6b E/m**2). VERSUS UNIVEPSAL TIME (HOURS) .........P-PERED.ICT ED.... M E E. V.E P TE_ _ _ P
36+ + + + +
33+ + "+ + + +30+ + + + +
27+ + + +
244+ + + + +...... 21 .---. .- .-----..-------.. _+_ __ + +__ '___ +
18 + U + U + UU .+
154 PLUPPMU + UUUMPUM + PUPPMP + PPPPPU + PPPMPP +
124 UM~iUUIjPU t+ . UM MU UM + UUMUU UUU +' UMMUUUMP + P MM MMP +
9+ U PU+ MM UM+ MUUUUUU U PU ....... UM UP + PMM MMM+
6+M MU UU P+UM MMUUMUUUUU P+MMU MMU UM P+MMMMUUUUUUUUU MM*MMMMMMMMMM PM P+
_.. 3+UUUUPUUUUUUUM ......... + UMPUPPPPFPP + PPPPPPPPpUU +UUUUPPPPPPPM * PPPPPPPPPMMM *.. .+.. .....+ ... . .... . ... +... + .. +. +.-+. 4+.- +4.=4.. . .+-.. ..+---+--.+..--..+-. . +.** . ... * * 4*....
C 4 8 12 16 20 0. 4 8 12 16 20 0 4 8 12 16 20 0 4 8 12 16 20 0 4 8 12 16 20
DATE731228 . .7... ATE07313 731229_ DA.... TE. 3120 DATE.731231 DATEP740101!
ELECTRON CONTENT (1.L16 F/M**2) VERSUS UNIVERSAL TIME (HOURS) P-PREDICTED M-MEASURED U-UPDATED
364 + + + + +
33* + + + +.
30+ '+ ; 4 4 + +
S27+ ____2+ + + +
214 + +
_18 ' + . U + + _. +154 PPMPPP + PPUUPP + PPPPPP + PPPPUP - + PUPUMP +
12+ P if MMMM + P UMMMUP + UUUUUM P + P UUMMPU + UUMUM UU +
L 9 94 . PM ....... - U UU._. ......-____UU- - -MM MUilU+ PUl U.iU+_ __U_ ..uiMM U.U-T 6+MMM MM tMH P+MMMMMMMMMMMM PM U+p UUUMUMMMUUU p+U UUU U pUMM p+U UUMM UM • P+
3+ PPPVMMPPPPMM + PPPPPPPPPPPPM +UUPMPPPPPPMM + UUUUMPPHMMUU + MMUUUPPPPUUM +
....................-... .... 4.........+ *+ -
C 1 16 0 0 8 1212 16 20 0 4 8 122 16 20 0 4. 8 12 16 20 0 - 8 12 16 20
DATE=74CIC2 DATE*740103 DATE?740104 DATE*740105 DATEO740106
ELECTRON CONTENT (IE1i6 F/M** 2 VERSUS UNIVERSAL TIME (HOURS) P.PREDICTED M.MEASURED U-UPDATED
36+ + + + + +
36* - + +.- .- ++
30+ + +274 + + + +
__ 24 + f. + U + + +
214 + U + + U + 4
18+4 + U + UMUPU + UP +
.15 . PPPPPp + PPPMPEP + UMPUPPP + UPPMMMPP + . UPUMMUUP +
12. UUU UU PP + UPUUU U UU + M UMMUUP + UP UUU + UMUM MMUP +
9+ UU UmMMU uUUU + PMM MU+ M UP + . - M P+ U M UP+
64M MUWMUMMUUUU ..... P+U ........_UUMUL M. MUUUUMMMM U+ MHM!UUUUUUUUu U+MMMUUUUMUM MU U+
3+UUUPpppppppp +M-UMMMUPPUPP +UUUPPPPPPPPM +UUUPPPPPPPM +UUUPPPPPPUUP ... ............... ... ............... ...+....-......w.....* +-.-+..*..*** ++ -+....... .++ e ++ ...... **.'.*....
0 4 8 12 16. 20 8 2_.1620 4 8 . 16 20 p0 4 8 12 16 20 0 4 8 12 16 20 _____
DATEu74017 DATEm740108 DATE,740109 DATEP740110 DATE9740111
Figure 10d.

_ ELECTR06N CONTENT.. (1.Ei6 /M**2) VERSUS U I.VERSAL.. TLME IHAURL_ P.REDtTtcpItMFUeM A t UPDATED
36* + +33* + + *
S3C+ + *
24+S41+ +........ + U + + U U___ +
.184 FP + UPP + UMU + UUU + M MMM
15+ UPUU PP + PPMUUPP + . UUPM MMU + PPP UUU + UPP UPUU +
12+ UUMMH u P ..... ...... ........UUUU._MMUUP .+ ._MU UUP.__.. iM PU_ . U - MU+___9+ U MM UUP+ U MMM UP+ UM U+ U U P+ U U M+
6+M ULUUUMU '- U+U MMUUUMU U U+M U UUUUU M . MMMMMUUUUU M +UUMUUMUUMUUUU +_3+UUUPPPPPPMUUU ........ _U.... LUUUPPPPMUU.. - +-- UUUMUMPPEPPUUUll fUUUUlEP PPE UUU .. _FPPPPReU!P~PPP
*..4.*.+...+-.+ .4.. 4..+ 4+..-+..+-.. -*+ e.-.+- +"+*.'.*+.*++..+ +-----------4 -- +---+4e +**+n4*+*+* n*+*
0 4 8 12 16 20 0 4 8 12 16 20 0 4 8 12 16 20 0 4 8 12 16 20 0 4 8 12 16 20DATE74C1I2 ... ATEU7a09113 .A. DATE-740114 DATEo740115 DATEg740116
ELECTR8N CBNTENT (1.E16 F/M**2) VERSUS UNIVERSAL TIME (HOURS) P-PREDICTED M-MEASURED U-UPDATED.. 36 ........ .. ... ....... .......... ... _ . ... + - +
334 + + +30+ +2 7 .. + ._ .. _. .... -. , . .. + .......... - -. ..- -....... -..... . ....... . . _24+ + MM . + + 4
21+ - M UMUU + .18. . UPU . UUPU--M + .... U--- U-_UP - UUP +
15+ PLpMUMMU + UUP PP. + PPMUMPU + UMUMUUUM + PPM UMP +12+ UUMVU UPU+ UU PM+ UU MU UMUU+ UM UUM+ UUUU UUUU+
. 9 MM M+ . P .... U+ UMMUU_-- MIUt .e .U* - . .... M
S6+MUUM MUUUUUUUII +P UUU U +UMMMUMUUUUUUM +UMM MUUUUU MU +U UUUUUUUUU +
3+UPPULUpPPPP +UUUUUUPPPUMM + UUUPPPPPPPP + UUUUPPPPMUU + UUUPPPPPPP P
4..4.. . .+... -..... +..,4...*-..-------+-.---y4----*- -+ + -+ +........... -- ,---,.-._
C 4 8 12 16 20 0 4 8 12 16 20 0 4 8 12 16 20 0 4 8 12 16 20 0 4 8 12 16 20
DATE.740117 DATE,740118 DATE,740119 DATEm740120 DATE9740121
ELECTReN CBNTENT (1.16 E/M**2) VERSUS UNIVERSAL TIME (HBURS) P.PREDICTED M.MEASURED U-UPDATED
36+ + +-33+ ... . .. -...... ..... .... ...
3C0 + MU '27+ + U U +24+ + M M MM + _
21+ +. U + U M M + +
18 PP + pp + PP + U U. + U U +
15+ UPUPU PPU + . PPU UPP. + _................PPU .P ...... U.PPPPUP.U+±....___ _PUUPPMUVU
12+ UMUPU UUUM + P UMUMU U + .UUUUM U UP.+ M P + M UPUM U MM +
9+ UU M U+ U PUUM U U+ MM M UMUP+ U P+UUUMUUUU UMUM U+
.... 6MMMUYUUUtMUUU +P MUUUUvU UMM M+p UMUUU p..............U+P ... MUUUUU... ................P..U ....... MUM U...
3+UUUFLPPPPOPP . +UUUUUPPPPPMUMU +MUUUMUMUPPPUU +UUUUUUPPPPPUU + PPPPPPPUUP +
.... . . 8 12 16 2o O 4 8 12. 16 20 0 ..... 8 12.. 16..... 4 ..8 12. 16 _........ 4....8__. 16 20DATE-74CI22 DATE74C123 DATE8740124 QATEa740125 DATE9740126
Figure l0e.

_ELECTReN.CONTENT...I1 (16 L/M*2) .VERSUS UNIVERSAL .T.IME .(HURSL P.PREDICT M36+ + + + +334 + + + + +
_3C+ + +4' +.. . . .... .... .... . . . .... . . .. . . .. . . - --- --. ..... .27+ + +. *24 + + + + *21 ..... U + .. + + U +184 U + UU + U + + M15+ PPPPPUU 4 UUUPUUMM + PPPUUMU + PPPPPPP + PPPUPUU +124 .. MLMUU 'U + PMMMM .. U + . UUU ... P + UUUUUMU
P + PUMU MP +
9 . UM Mr+ UM P+ UUMM UP+' UMMM M UUU + UUM UP*6*U U UUU pM U+p UU PM U+p UUU PM M+P UUUUU PM +U MUUUUM U*3+ UUUUMUMMMUUU. . +MmUUMMMUUUU _ __ . +UUUUUUUMMMmUU ... ' UUUUPmPPMUUUU + UUUUUUUPPM +
C 4 8 12 16 20 0 4 8 12 16 20 0 4 8 12 16 20 0 4 8 "12 16 20 0 4 8 12 16 20DATLE740127 DATE740128 . DATE*740129 DATE,740130 DATEw740131
ELECTR8N CONTENT (1.E16 F/M**2) VERSUS UNIVERSAL TIME (HOURS) P.PREDICTED M-MEASURED U-UPDATED364 + .+ + +33* + + + + *304 + + +274 + + + +24+ + +21+ + + +. +
8 .................... PPP + UP .. + U P P + PPP + PPPP +154 PPUUUtjUU + UPPPM P + PPPU P + PUU P + UU U P124 PLUM M + PU M UUUU + UUUMMUUUP + PUM UU P + UMMUMUUUU +
in 94 UUMM ..... U+__ " .. ---........-------. UiU ... U+ ......... PA__ IU MUi+±- UU MMMUUUt_ UM M M U+64P ULUUUUUU UM +P UUU PM +U UUUU PM +M MMM PM M+M U U U3+MMMMPPPPPPMUM +UUUUUUMMPUUU + UUUUUUMMPMUU + MMMMMMPPPMMM +UUUUUUMUUMUUM +
C 4 16 20 0 8 12 16 20 0 4 8 12 16 20 0 4 8 12 16 .20 0 4 8 12 16 20DATE=7402CI DATE=740202 DATEm740203 DATE*740204 DATEe740205
ELECTR6N C6NTNT (1.E16 E/M**2) VERSUS UNIVERSAL TIME (HRURS) P.PREDICTED M.MEASURED U-UPDATED364 + + + + +33+ + + + +30+ + + + + +27* + + + +244 ' + + + + +214 + + U U + U + +18 . UPPP + PPPP + UUPPPP + UPPPPP + PPPvP +15+.. ........ PU UUUU.. + UUUU UP PP UUP + UPU P + UPU UPU+12+ PUv U + UP UU UP + U U U + U U + P U U. U +9* UU U+U P UU+ U U+ U U UUU+ UU P*6U U UU UM .......... +PP .. UUUU .U . UP UUUUU!U +UP UUUUU U +UP UU P +34 UMULUUUUMMU + UUUUPPPPPUU + UUUUUPPPPPP + UUUUUPPPPPU + UUUUUUPPUUU +
4 +..... .... +. . +4....- ..-- e.. ... .. . .+..*..*+...+ **.. +---.....+.. +... .... *. . ....... ". ..............
0 .. 4 8 12 16 20 0 8 812 16 20 0 4 8 1216 20 0 4 8 12 16 20OATE.7402C6 DATEa74C207 DATEP740208 bATEa740209 DATEe,740210
Figure 10f.

9220_ _ 84,031VO t12204L13VQ E220,7L43±VG Z220'7*31VC t8O'Lu3VO02 91 2! 9 T 1 2t- 0 ---- 1 'I .' 0 02 91 -. 9 q 0 02 9 8 9 0
......+.*4.*........ '.... .--+----+---+ -*.+--... ... . .*-. .~.' l++ .**+ .............*.+.*
+ WAWWAAnnnnWA + nnnwwwnwn + nnnnnnwnd : dddddddd + nnfdddddd +Ed . d+ n d . + n nnn ... wn nnnnnnnn + n nnrfl(Iifnnl+9
wn d+ Wn nn+. nA + 0 ' AA w+n +6+ nw4 . +A nnnd +nnn d +fl Wd +wA n +21
47-M) nd T + dn Wd + dO 0 0t+ dWwnWd + dWWWWdd + d dWn + dkW wn. + dW d.4 +s9
Snnfnn + W Addd + . dddd + ddddfl fiWnd +42S ... .. ..... ---- + AW -
+ n + w + n nn + n +4L2
* + + +*OE
+ . * + n + +9E031VOdadn- 03l SV3Hw* 031103dd (S~ 0H) 3W1l IVS83AINA SnSM3A (Z**W/ 91301) IN31NA3 Ngu13313
0220Ld31VO 6120#L.31VO 9G U3iVOL3V L412 L*31VO 9120'Lt3V 002 91 2t 9 4. 0 0 91 1 2 0 0o 911 92 0 o 0 91 at 9 ' 0 02 91 ~t 9 * 3
..... ... +...... .E.+°- +I + -- ¥~-- -.. .-.- ,- ...- ........... ... +..
O AAdddWnAW + dddA ddAdA + dddddddddnnA AHdddnn4nA + -wnAA Annnn +En . W lnnn nn+ WnnwnNwn wnA+ dAnnnnnWnnnW + n nnn An kW+ wl a . dl+9
... n w d d 6-~. 0 - ln d + d*6+dW WA +d n nn +d 1W n +nwA wn +dnw Wi Ann .. +21+ WA + d WWW Wnd + d nW AWn + nnw 00 + diAnnn d +ST+ w--ww + dd -d --- ww ~-H d WWW--- + dW w WR . + dd d d- .."+ nwww. + Odd n + ddnn + nndn + ndd +* .t
Snn + + + n +
+ ++ + +3E* . .4 4 4 Ee
+ - -- + --- -- :-------------7--- -. - -- ----.---- 49- -
031VOdn-A 03nSV3W&W 031I3103d-d (,sdnH) 3WIl IV'S83AINn SnS83A (t2**H/ 9131) IN31'4ND NGUL3313
..... .. i...+. a.+ ... ...... .... 4 +...+ ...... .+. .. +.+ i .. ................ ..
4dnWi f WWWWWWnn +. -- WdWWIA lnnn-- + - , daddddaifdnn i:- nnddddddnnfl *Ed WWWnn di+ n nnnnnn dn+ n n nn n d+ nn n d + n innnni dn*9
+WW "WW d + d dt+ n n+dn n n+d d d+6
+ d wwnnnnO d + nnwnn Ad + d W Wnndd +nd ww dd + d nnA d +* dd ddd + d n nd + dnW dd + ddAdWdN +n dddndd -T1
+ d + ++ + +E
S+ ++ +2
...-. il- h-H Va- T T)S-V W--03I;F03-d-d--. . S ngH 3W 1 7 H) VS83 I Sn '0S M3A (* ,W/3 913 1) IN31N TNO" 40 331

LELC TkON C8ENT (1.lb F/M**2) VERSUS UNIVERSAL TIME (HOURs) P.PREDICTED MMEASURED U-UPDATED36+ 4 + + +
.33+ + + +*3C+. + + + + +21. +-+ U + U
24 + + U + U + PU + PP +... 21+ .. .. PPPPU ..... _ _ PUMP _ + P. + P PUP + P UPP +
18+ PPUU UM + PUUM MP + PP M P + UPUUM + .PP UMUU +15+ . P M.M UU+ . PUM UP + UUU M U + U UMM MUU + UUUU M P +'12+ PL M+ t ' PM MUP+ . U+ ... PMM .MM+ . UMMM . MUP+9+P UUU +U UU, U+P UM MM+P U M+P UM U+
6+UPP U U +MPPU U UU UUM +UUUMUUU UM +UUUUUUU U +UPP UUU M 4
3+4 UUULUUUL'UUU + UUMUMUUPPUMM + UPPPUUUUU + PPMMUUUUU + UUUMMMUUUUU +
C 4 8 12 .16 20 0 4 B 12 16 20 0 4 8 12 16 .20 0 4 8 12 16 20 0 4 8 12 16 20ATE74C226 . DATE 74C27.. __ _ ATEr74288 DATE74030 __ DATEr740302_
ELECTRON CONTENT (IE16 E/M**2) VERSUS UNIVERSAL. TIME (HOURS) P-PREDICTED M-MEASURED U-UPDATED364 + + + +33+ + + + +304 + + + +27+ ......... + + U,U + +_24+ PP + PP + PU + UU PP U + UUU21+ . PUUPP + UP PPU + PUMMUPUU+ PP UPU + UPMMUP +18+ .. PPU U P UP. ___+ PU MMMM+ MMUUUMMM + UMM MUP +154+ . VU MUJUMU+ PUMMMMUMMU+ UU +U UM MMM U+ UM MU +
' 124 P M' M M+ . PU M+ UMM P+M M P+U UM MP*9+ UM ... .......... M +U +P +M
6+MUUU UU UU UU +MPP UU U + UUUM UUU H + UUMMUUUU U + MUUUUUUU U +3+ PLMMUMMUM + UUUUUUMMUUM + PPMUMMMUU + PPPPPPUUU + PPPPMMUUU +
C 4 .8 12 16 2n 0 8 12 6 0 4 8 12 16 20 0 4 8 12 16 20 0 4 8 12 16 20DATEa74C3C3 DATE=74C304 DATE=740305 DATEw740306 DATEw740307
ELECTRON CONTENT (1E16 EE/O*2) VERSUS UNIVERSAL TIME (HBURS) P-PREDICTED M-MEASURED U-UPDATED36+ + U+ + + U U + .
3+ .......... .............. ............. t UMMU + + UM +30+ . + M + U .+ U MM + +274 U . + UU MU + MMUUU + U + UU 4
.2 + . .MPPU;. MMPPP + PPPM + PPPPM + UMPUP +21+ MPMMPU + P PP + P P + UP PU + ' M MMUP 418+ P MU + UP MP + UUU MU + UP M + M MUP +
S15+ .P .. + P + UMM M + MP+ PU MUU+12+4 PM MU+ P UP+ M. U+P P U+P PU M49+P UM M+UU U U+P U + P UU + P UU +6+UUUULUU .................. +MMUUUUU.. . +UUUUUUUU M +UUUUUUUUUUM +U UPUUUUUU M3+ MMllMUUUUU + MMmMMUUfUU. + PPMMMUUUU + PMMPPUUM + UMMPPPPPPPU +
+------+*+-*------ +-*--*+---+-+--+- +--+4.*+*+r+r + +.....-.+--+..+.+- **+** +..*...* *v+.+..4...4.
...0... 4.... 8 12.. 16.. 20 .._..0 0 ... 8..._ ._12 16_20 0 ._. __8_.6 Q 48 2 16 20 0 4 8 12 16 20DATE.7403C8 DATEs740309 DATEN740310 DATEm740311 DATE9740312
Figure 10h. . . . . .... ... .. :....... . ... . ... .V..~ W ill-
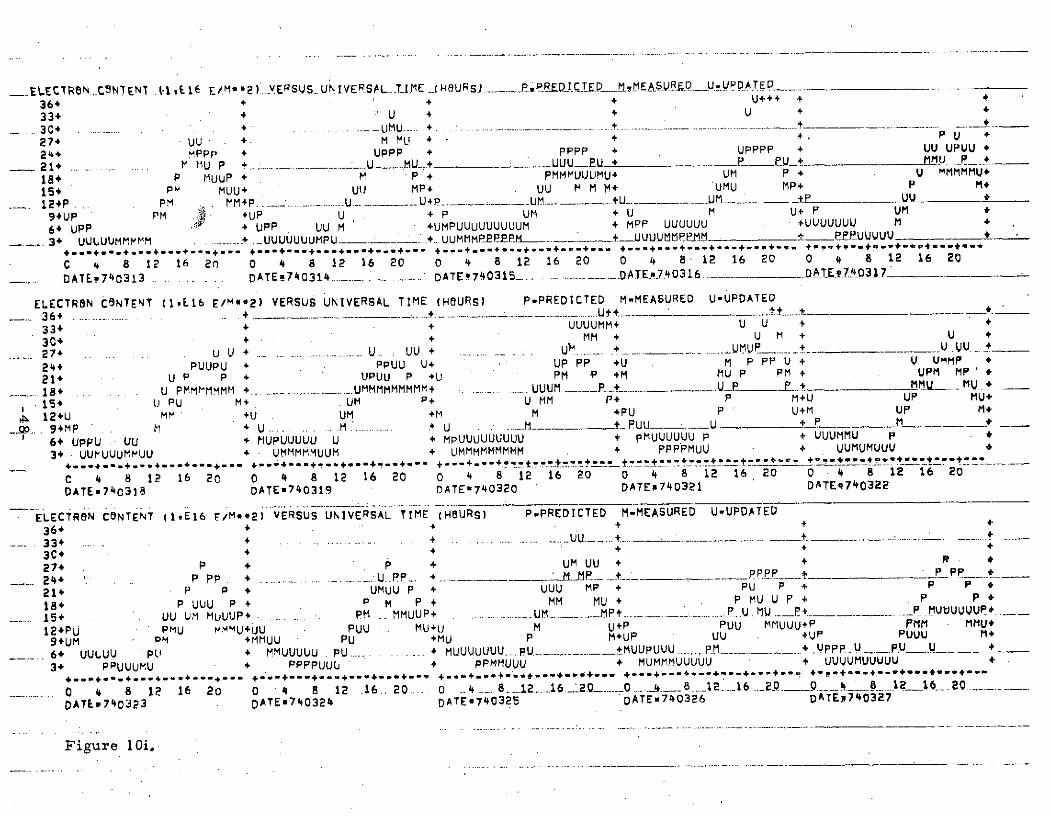
A. ELECNTR EMT U 6 £/M2).. YERSUS.. UNIVE.SA.L.. T-IME ..--C(HURSJ ______pRP.EDIRE~p__M??NEFA.YR5 UUPD-A-TEP
36 + + + U+++ +
33+ + U + U +
3++ ----U--
27+ UU + M MU4 + + PU +
24 MPPP + UPPP + pPPP + UPPPP + UU UPUU +
21 . fU P +_ .. U UU.U_eU_+ P ___EU + MMU. P +
18+ P MUUP + M P + PMMMUUUMU+ UM P + U MMMMMU+
15+ Pm MUU+ UU MP+ UU H MM+ UMU MP+ P M+
12+P .. PM M+P .-............- ... ---- U+. UM- U
9+UP PM +UP U + P UM 4 U M U+ P UM *
64 U UP UPP UU M +UMPUUUUUUUUUM + MPP UUUUUU +UUUUUUU M
3+ UULUUMMMM -UUUUUUUMPU- . ',.+-UUMMMPEePPM ---- UtUUPMMP.PeM-M , + PPP-UU U.....3 UUUUM M.... ............ _uuuuu +.--+.,+. U ...... . *.UUU.U.* .*
C 4 8 12 16 20 0 4 8 12 16 20 0 4 8 12 16 20 0 4 8. 12 16 20 0 .4 8 12 16 20
DATEP740313 ... .... . DATE740314 ......... DATE 740315-.. --......... DAIE.0316 .... ........ DTEA0_ .7_
ELECTRON CONTENT (1t*16 E/M*'2) VERSUS UNIVERSAL TIME (HOURS) P.PREDICTED M-MEASURED U-UPDATED
36+ .... ... +....... ........ .- - ...........-... -- ,a "
33+ + + UUUUMM+ U U + +
3C0 +. ++ MM+ U M + U +
27+ U U + ....... U UU + . . U ........... ..........UP + U UU +
24* PUUPU + PPUU U+ UP PP +U M P PP U + V UMP +
21+ U P + UPUU P +U PM P +M MU P PM + UPM MP' +18 .. . U PMMlMMMMM +.. ........... .UMMMMMMMMM+ ................. UUUM .. U + MM _ MU+
15 U PU M+ UM P+ U MM P+ P M+U UP MU*
12+U MM +U UM +M M +PU P U+M UP M+
. ... MP . + U ....... . U . - - -- _ PUU... + P M +
6+ UpPU UU + MUPUUUUU U + MpUUUUUUUUU + pMUUUUUU P UUUMMU P
3+. UU 'UUUMPUU + UMMMMUUM + UMMMMMMMMM + PPPPMUU + UUMUMUUU
--.................. .......-+- -.. --------- --+---*.~......
C 4 8 12 16 20 0 4 8 12 16 20 0 4 8 12 16 20 0 4 8 12 16 20 0 4 8 12 16 20
DATE,740318 DATEw740319 DATE,740320 DATE*740321 DATEq740322
ELECTRON CONTENT (1,Ej6 F/M**2) VERSUS UNIVERSAL TIME (HOURS) P.PREDICTED M-MEASURED UwUPDATED
364 + + + +
33+ ............ + ._..... UU ....... .--....... .... ... --- .. - ..
3C+ + + +
27+ p + p + UM UU + 4 R" +
24' 'P PP ............ ............... U PP_. a P
21+ P P + UMUU P + UUU MP + PU P + P P
18+ P UUU P + P M P + MM MU + P MU U P + P P
15+ UU UM MUUUP . PM .MMUUP+ .... ... UM ...... .-.-- ..-- .... P.U . + M...UUUU .
12+PU PMU MMUMU+JU PUU . MU+U M U+ P PUU MMUUU+P PMM MMU+
9+UM . PM +HMMUU PU +MU P M+UP UU +UP PUUU M+
6+ UULUU PU + MMUUUUU PU..... + MUUUUUUU. ..PU ....- MUUPUUU.... . + UPP. ... ..PU U
3+ PPUUUMU + PPPPUUU + PPMMUUU + MUMMMUUUUU + UUUUMUUUUU +
.4...-...--... --......-........ .....- -......+ .+---.+-----.. -4i*-
0 4 8 12 16 20 0 '4 8 12 .16.. 20.. . 0 .4....8... 2. ...16._2 .........._... 12..._6 ...2_ 8 12 _ 20
DATE740323 DATE,740324 DATE,7403 25 DATE,740326 DATE9740327
Figure 10i.

_ELECTRON _CONTENT (I1llb r/M**2) VERSUS UNIVERSAL TIME (H8URS) .. P.PREDICTED M.MEASURED U-UPDATED364 + + + + +334 + + + + 4
3C+ UUU + + + .+ . +274. + P + PP + PP + +244 PFpP + P PP + P P + P P .. PPPP +21 . PMMMUP + P P + P P + P U P + UUUP +184 PU P + P MMUU P + P U P + P UMU P UMU'+ PUMMMUP +154 P MUUP+ P MUU U P+ P UUMUU P+ P U MUUP+ PM P+124P P m mMU+P P U .. U +P P MU MUU+P P MU MMU+P UUUMU MUU+94 P UUUUL +UP P MU MM+ P U P M M+UP PUMU M+UP P MU M6*U PPU UUUU UMM. *MUUUUUUUU PUUU U+UUUPP(JUU PUU +MUUUUU UUMU +MUPPUP PH ,M+........ 3 UUUUPp UM * MMMMMMMUUU .............+ UMMUUUU +. MMMUUUUUM + UUMUUUUUUUU+*..*+..*....+.* -. ++*+... +...... .+ - +.-*..-+..*+ ...*.. + +- ---.. +---+ +*..... .................. *- *++..........C 4 8 1 16 20 0 4 8 12 16 20 0 4 8 12 16 20 0 4 8 12 16 20 0 8 12 16 20DATE74C328 ,'_ D0AT.EI74C329 . .. m DATEmTA033Q.0 -...___.. DATE740331 DATEP740401
ELECTRON CONTENT (1i.16 F/MN*2) VERSUS UNIVERSAL TIME (HOURS)' P-PREDICTED M-MEASURED U-UPDATED364 +. U . ....... +. + + +++ +334 . + +U +304 + U + U + + U U +27 U + MMU .. + _U + PP MMMP U +244 PPPU 4 PPPP + UMPP + P P + UM P MP +.21+ M P + U U MP + M P + P + M P MPP +
18.................PU MUP. . .U U P + M U PP+ P PP+ U UU+15+ P M P+ UMM U P+ UU + PMUUU UU + MPP M +12+P PPUU mU +UUU MP MU +P UU MUU +U MMMU MMUMM +P P MM+9+ P p UUM . . MU+ .MMVU .. . U __MU+UU ___U_ MM_U MUU U+Up U +6+UUUUpP U pIJUM + PPPUU UU P + MUUUp pM + MUUPP UU +MUUUUUUUU PM +3+ MMMLUUMUUtJU + MUMMUU + MMUUUUU + MUUUUUUUM + PPPUUU
*. . . . .. ... +. . . ..++ +- --........... - -- +--- +.... ..... . .. . .4
C . 8 20 0 4 8 12 16 20 0 4 8 12 6 0 16 20 0 4 8 12 16 20 0 4 8 12 16 20DATEv7404C2 DATEI740403 DATER740404 DATE*740405 DATE740406
ELECTR8N CTNT (1,i16 FM**2) VERSUS-jNIVERSAL TIME. (HURS) P-PREDICTED M-MEASURED- U-UOPDATED
36+ UL + ++U + ++U + ++U+ + 4
33+ ................. ...... U + MM U + U +30C U + UMM U U MM + U U + +274 UM * PP + MPPM + PMM + UPUUU +
_ 24 .... .P. + .... P MM P + MP PMUU + M.P M. P PP +21* PU PU + UP U + UP P + UP PU+ PM M U *184 M p P+ M M P+ UM MP+U P MP+ U MM P+15+U ... PUU _ .+ M UM M+P M M+MM+p UUU U+12+P P M MU+ UM U+ UM +M UUU +UP M MM+9+MP UUU M+UP UM +UU M + P U M tM P M 4
... 6+ UULUUUU PM .. ......... MUPUUU . UM __. + iUUUUUUUU.U + UUUUUUU P + uUUUPU P +3+ MfMMMvUUU + MMMMMUUUUUM + . PPPPP + MMMMMMMUUU + MMUMMMMMM -
**...r.. ...+*.+-.--+..- +--.---* -..- +---+---*** +*-.+ -.r+.*-++*- -.. +..*+-+- +*..*4.-. * .=Y.. +..s+....+....
...... 4...8 12 16.0 . 0 . ... .6 20__0 4 8 12 16 20 0 4 8 12 16 20 0 4 8 12 16 20.DATEs74C407 DATEo74C408 DATE740409 DATEw740410 DATEP740411
Figure 10j.
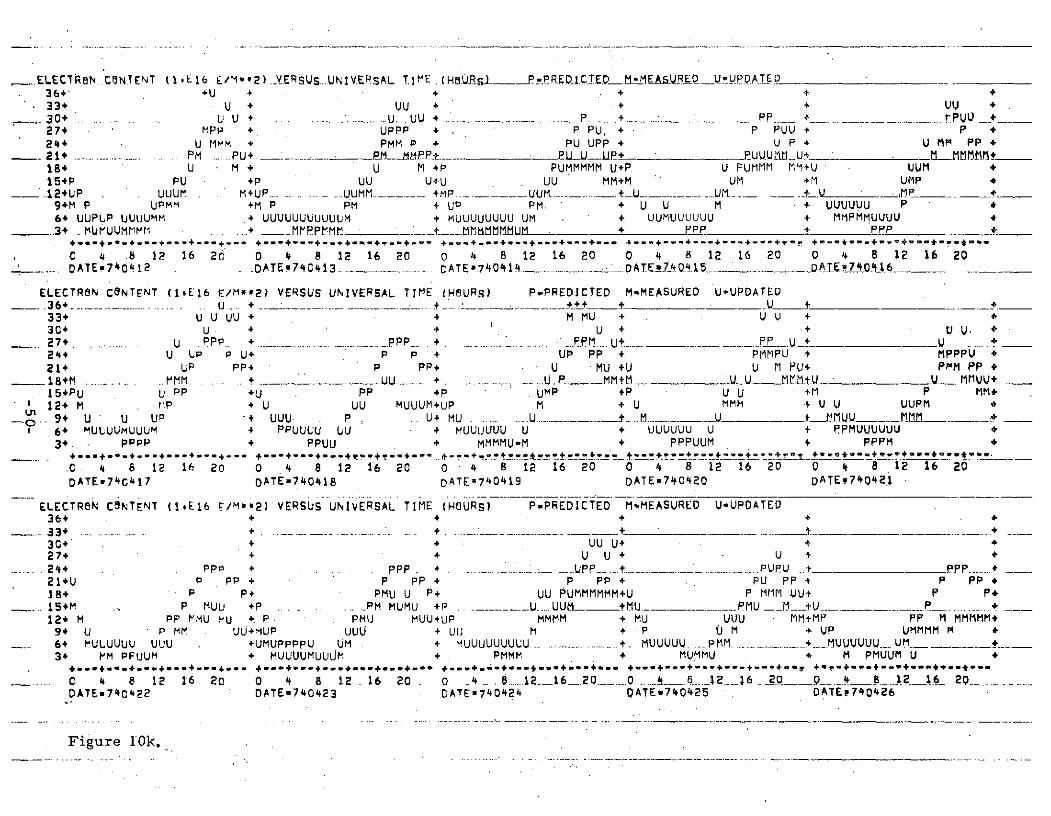
.ELECTReN CONTENT (It.L16 E/'**2) VERSUS.. UNIVESAL TIME (HfQlU __ _ _PRI.CTED MMstv _U__P _AT
36+' +U + + + + +
33+ U + UU + + + UU +30+. U U + ... .. U...UU . P. ....... .. PP_ ..tPUU +_27+ MPP + UPPP + P PU, + P PUU + P +244 U Mm~ + PMM P + PU UPP + U P + U MM PP
_.Pi+ PM P . Pm MM PP-+. PII lP+ P UUUU ..Ut. _ Mmmm _184 U M + U M +P PUMMMMM U+P. U PUMMM MM+U UUM15+P PU +P UU U+U UU MM+M UM +M UMP
. 12+LP UUUr, M+UP.... .UUMM ............ MP ....... --- UUM ..... _ ....UM .... .. V__ _ +9+M P UPMM +M P PM + UP PM. + U U M .+ UUUUUU P64 UUPLP UUUUMM + UUUUUUUUUUUM + MUUUUUUUU UM + UUMUUUUUU + MMPMMUUUU
... 3+ .. MUrUUMMM. . . .. M.. ._MPPM .. .... ...... MMMU tU + + PPP+**-l+-*-,r+r**++---+--- +*******+--- ****+---+ ** +**+- **+* +**+ +* +------ -- *---+-*+ve +- ***+. "+ **** j-**
C 4 .8 12 16 20 0 4 8 12 16 20 0 4 8 12 16 20 0 4 8 12 16 20 0 4 8 1? 16 20C. DATEP70412 DATE*w74C413.. ...... ATE740414.... . DATE2 740A15 .. A151
404!j6- _
ELECTRBN CSNTENT (t1E16 E/M**2) VERSUS UNIVERSAL TIME (HeURS) P.PREDICTED M-MEASURED U-UPDATEO. ... 36+ .... .... .... ...... U .... ..._ .... . .. . ... $ + .... .. L..... .U +__
33+ U U UU + + M MU + U U +3C+ U + + . U +J UtV.7 . . . U PPP. ....... ..... . PPP + ... U+ .... ... . U + U
24+ U UP P U+ P P + UP PP + PMMPU + MPPPU
21+ UP PP+ P PP+ U MU +U U M PU+ PPM PP +18+M .... .. MM . .. . . UU ........ + .. U P.. M~_. M _ ,..U . .M tU _ U_ .... _ MMUU .154PU U PP +U PP +P UMP +P UU + M P MM*
12+ M f!P. + U UU MUUUM+UP M + U MMM + U U UUPM
9+ U U UP "+ UUU P . U+ MU U .. U + _MUU MM6' MULUUMUUUM + PPUUUU UU + MUUUUU U + UUUUUU U + RPMUUUUUU3+ , . PPPP + PPUU + MMMMU"M + PPPUUM + PPPMH
------- *------------------------------+.-*+.**+--*+.-'+r-*+--* .+---me+.* 4her!+*±±*+ 4.i* t* + *4**-+ *4+ 4, 4**** *4****4.*t
.C 4 8 12 16 20 0 4 8 12 16 20 0 4 8 12 16 20 0 4 8 12 16 20 0 4 8 12 16 20
DATEv74C417 DATE=740418 DATEP740419 DATEn740420 DATE9740421
ELECTRON CONTENT (1IE16 F/M**2) VERSUS UNIVERSAL TIME (HOURS) P-PREICTEI D M-MEASURED U-UPDATEO36+ + + + +
+ .... _ ._.. .. . ................. .__ __ ... +_ ....... :___.. .......... . . • _ +334 + .+-.- .--- - ----- .. . i...30+ + + UU U+ +27+ + + U U + U + +
24+ PPP PPP. .. PP ... ........... ...........PUPU .t . PPP..... + ___21+U P PP + P PP + P PP + PU PP + P PP +18+ P P+ PMU U P+ UU PUMMMMMM+U P MMM UU+ P P+15+M . P MUU +P .....PM MUMU. +P ......... UUM__ U MU... PMU ___U.U P ...124 M PP rMU U + P PMU MUU+UP MMMM + MU UUU MM+MP PP M MMMMM+9+ U P MM UU+1UP UUU + UU H + P 0 M + UP UMMMM M +6+ MULUUUU UUU +UMUPPPPU UM . + MUUUUUUUUU . ....... +. MUUUUU.. PMM ... . MUUUUUU... UM +3+ PM PFUUM + MUUUUMUUM + PMMM + MUMMU 4 M PMUUM U +
4.............. ... 4.. ..- + +..+ ..++w. +-* *+--+.--+*---.-+.+- +*-- +-+'*+-*+'-+ *+s ' +* +..+....'+..5....-
. C 4 8 12 16 20 0 4 8 12.. 16 20 . 0 4.. .8.....12.16 .. ... 0 . 8..2. 6 _20 _ 8 12 16 20DATE=740422 DATE=740423 DATE0740424 QATEs740425 DATEP710426
Figure 10k..

ELECTReN CENTFNT (1,1l6 E/M**2).~YERSUS_.UNI.VEPSAL T IME...(HOURS.)... .PPREDICTED M-MEASURED U-UPDATED364 + + + + +
334 + + U + +
30+ . + + + + _._ UU +2 +. + . U + U +. U +.244 PPp + PPP + MPPP + P UPP + PPPPP +21 .. ..... P PPP+ P PPP+ P. ._+ PU UUP+ PUUMMMP+
18+ P + PM .MM'+P UU M+UU PUMMM U+MU UUMM M+15+P P MM MM +P P M MM M+ UU MMM + M UUM MM + P PUMM +12+MP . Pm 'M M M+MP ........ PPMM .. .+MP ....... UM . .. + PU . .. UUUMM.. + M . . .UUM.. .9+ -P PM + P PM + P PM + PU UMM + UP UUM +64 M PPPPP P'4 + M PPPPP PMM + MMPPPPP PM + MUUUUUUUM .+ UUUUUUUUMM +__ 3, MMVMMMMYMM j. MMMMMMEM . + MMMMMMMM . MM PPM + MMMMM
C' 4 &8 12 16 20 0 4 8 12 16 20 0 4 8 12 16 20 0 4 8- 12 16 20 0 .4 8 12 16 20
DATEa74C.427 . ATE 74C428 . .. ...... DATE 40429 DATE.740430 DATE7 40501
ELECTRON CONTENT (1.E16 P/M*~2) VERSUS UNIVERSAL TIME (HOURS) P-PREDICTED MvMEASURED U-UPDATED
33 + U + + + + , U+30+ U U .4 UUU + + + U MMMM U +
__ 27+ . .... UU + p + "-PP + PP + M PPMP +24 MMMMPP+ U MP PPPP+ P ppp+ P PPP+ M P PP+
21+ U U M +U PMMUU +U P +P P +P MMM*18U...... U M+P MM P M U+ P U U + P MU + M P _
s15+ P UMM +MU UUPP MMM+Mp PPMMMM MU +UU ppp MM UUU+ P UPPP +S12+ MP UM + MMUUMU PP + UP PMMM M + MP P MMM MM+ P UM
S9+ + M U + MUUU UU M + MUU UUU MM +U P +
64 MULUUUU PU + PPPUMUPU + MMMMMMU PPUUU + UMMUMMMUPU + UUUUUUUUUM .3+ M vUU . + MU + MMM + PU MM
..... 4+-'o . 4.. 4- -o+*.- - .. n+. 4 n+"'+.-+ .- .- - -
+n'
w'
. *..+---+-....-+-.... +........+....-.........
0 4 8 12 16 20 0 4 8 2 16 200 4 i4 20 0 4 8 -I 1I 20-
DATE,7405C2 DATE=740503 DATE0740504 DATE*740505 DATEP740506
ELECTRN CONTENT (iEi6 F'/M*;2) VERSUS UNIVERSAL TIME (HURS) P.PREDICTED M-MEASURED-U--UPDATED36+ +++ +
33+.......... .. U .... U -+.
3C+ v II +274 PPP +
S_2 . .4+ ....... _.. ... ....... ... M .. P PP+21+U M P +18+ U p
__15+MUU .UPP._. ._. _UPP .
124 MPULU UM9+ MMv U
3+ wM +6 =..+..UUUU..........
0 4 ...8 .. 12 16 2DATE=7405C7
- -Figure - .10-'1;-

FOF2 (MHi~ ..VERSUS.. UNIVERSAL.. TI E .- HOURJRSI ..- P-aPRED ICTED--.M.EASURED-12 4 + +
+ + + * +
C + M + . . _ . . . .M M
84 MPP + + PPPPPPP +
64 M + M*
5* +
4 4. . + + .
2++
S . ... ...... ................ .-- +
C 4 8 12 16 20 0 4 8 12 16 20 0 4 8 12 16 20 0 4 8 12 16 20 0 4 8 12 16 20
DATE731019 ... . . DATE!73i020 -.....-...--.-- .DATEE.73121 D.AEL22 _DATE3
F8F2 (MHZ) VERSUS UNIVERSAL TIME (HOURS) PPREDICTED M.NEASURED
-:.12+ .:................... ... . . .. -... . 4 - + .-M M II±m_.
114 + + + +. +
10+' MM + M + M + MMM + M M
.P M . -. ... .. .. MPM .. .... M ....... - ........ M -M PP__
.84 MMPMP M + MPMP PM +PMM + MMPPPM P + PPMP PM +
74. PM M PM+ MM MM PM* p PP PM+ MP P
6. ..... MM ..... P_+_ _ . p -- ................. . _ M - - P M
5 +P. * P +p P +P P +P P +P M
U' 4+ PMM"MMM M MM MMMM MMMm 4MMMMMMMMMM MMMMMM MMMMP *M MMMMM +
_. 3*MMPPFPP PPPM 4 PMPPP .PFP + PPPPP PPP. ......... .... P . PPM P PP ~iPPI.PM M.__ -
4 .......--...--.----- +--- + +---+--+~ -+ *r* - -+.- -t+
C: 4 8 12 16 20 0 4 8 12 16 20 0 4 8 12 16 20 0 4 8 12 16 20 0 4 8 12 16 20
DATE=731024 DATEo731025 DATE=731026 DATEm731027 OATEP731028
F-F2 (MHZ) VERSUS UNIVERSAL TIME (H8URS) P.PREDI.CTED M.MEASURED
12+ M + + +
S+ ... ...... ---- ._- __.--------- .1* M MM M + M + M M
94 pM H M .M +
8+ PFPPP.MP + ..... MMM.. P... .. ... __PM. MPMMP + P-
* PM P + + M 'P + MMM PM
6+ + M + M+ P + +
..5. *MMMMHM H +M. ... MMM. P.. ........_ ....... +M .... ...... M + M . + P
4+ P MMM M + MMMM PM + PMMMMMMMM MMMMMHM + +
3* ppppP PMM + PPPPP PMMM + MPPPPP PPPM + PPPPP PPPMH
..................................... +...............4.*4*44++W_ +** .+-** ** **.." 4" "
C . 4 8 12 16 20 0 . 4 8 12... 16 20 0. 4 8 .. 12.... 16...2 .. . 0 ... _.. 12__16_._ -_ _1 2~ _h_2 Q
OATE,731029 DATEE731030 DATEm731C31 DATE-731101 DATEP731102
'Figure la.

PBF2 (NZ) VtqSUS.UNIVLRSAL TIME (HOU.RS) --- P-PRE-I.QCTED -M.MEA$URE-D- ___
S +' + * + +
* ih+ 4 + + + 4
1 nM + MM + + + m +SMM • MMMM + . MMM + + MM +
84 pvpMpp!M , PMPPPPP + MMMMPPpM + PPPPMpM + PPPMPPPM +7+ mM M PM+ . . __ MMM PM+ P + MMMMM MM + MMMMM P +
6+ M ' + .MP + M M+ + MP
5+M +. P+ P P+ M M+ P M4+PM v M'MMM +MP MMMMMP +MP MMMMMM . +MP MMMMMM +MP M MMMMMM3+ MMPMMPPPPP + MMMMPPPPPPP + MMMMPPPPPPP + MMMPPPPPPMM + MMPMMPPPPPP 4
2+ + + + +
+ _ + . _ _ + _ __ _4........ . ............. ............. +.... ..+..-..-. . . *0 4 8 12 16 20 0 4 8 12 16 20 0 4 8 12 16 20 0 4 8 12 16 20 0 4 8 12 16 20DATE37311C3 ............. DATEa 3114 .. DATEIZ37315 DATE*731106 DATEr731107
FF2 (MHZ) VERSUS UNIVERSAL TIME (HOURS) P-PREDICTED M.MEASURED
11+ , + + +
9* + MM + + 4MM + _M
8+ MMPPMMMoP p MpppMp + MPPPMPP + p PPPPM + PPPPPP +
7 PMM 'P + M M MP + MMM M + P MM P + P MMm MP +
.64', M.... P ... M + M + _ _ M + PMM P + MM MM +
54 P + M M+ M M+ PM MP* M+
I 4+ MMPMM + P MMPMM +PP MM +PP MMMMMM M . M+PP MMMMM
.. MMtMPPPP .+ MM _MPPP. M.mMMMMMMM.MMMP-.PPM +MMMMPPPPPPMM +MMMMMPPPPP .+2+.+ + + +. **
I + + + * +4.......4. ... ... . . n ..n ..... ........ .- 4 *. ... .. *S...... ." " .• .4" +' ' '' + '+h. ......4e . 9+.4n.
C 4 • 8 12 16 20 0 8 12 16 20 0 4 8 12 16 20 0 4 8 12 16 20 0 4 8 12 16 20DATEn73tlC8 DATEm731109 DATEV731110 DATEP731111 DATE9731112
FOF2 (MHZ) VERSUS UNIVERSAL iIME (HOURS) PoPREDICTED M.MEASURED12+ + + + +
10C+ + + . M 4
94 MM + + + M +
.8+ ....... .PPPPpM + Pp.PP MMM+ PPMMMM PMPF P + PPMMPPM
74 PM MM P + PMMMMM P + P P + MM MMMMM + PMM PM
6+ MM M + PM P + P MM M + M M + MM P #
_5 + . .. ... ... l ...... P ... . ._.MM P+M P M M+ M P -tM+. - P M+
44PP MMFHM? HMYP MMMMM *PM MMMMMMvMM +M MM M +PP MMMMMM M34MMM MPPPPPP -. + MMMvPPPPPM' . MMPPPPPPPP M + MMPP PMM +MMM PPPP PP
14 + 4 + 4
*.. .4..+...n..=.... +...+.-+....-........... +..-+..+.....-.. + -. -*+ . +...--+---,-,---* * +......-+...*..+...
.. 4 ... 8. 12 16..20 .. 0..... 8.. _.6 .... 20__ 0 8 1-62 0- 204 8 _2 16 20 0. 4 8 12 16 20DATE731113 DATE*731114 DATEP731115 QATE=731116 DATE*731117
Figure 1 lb.
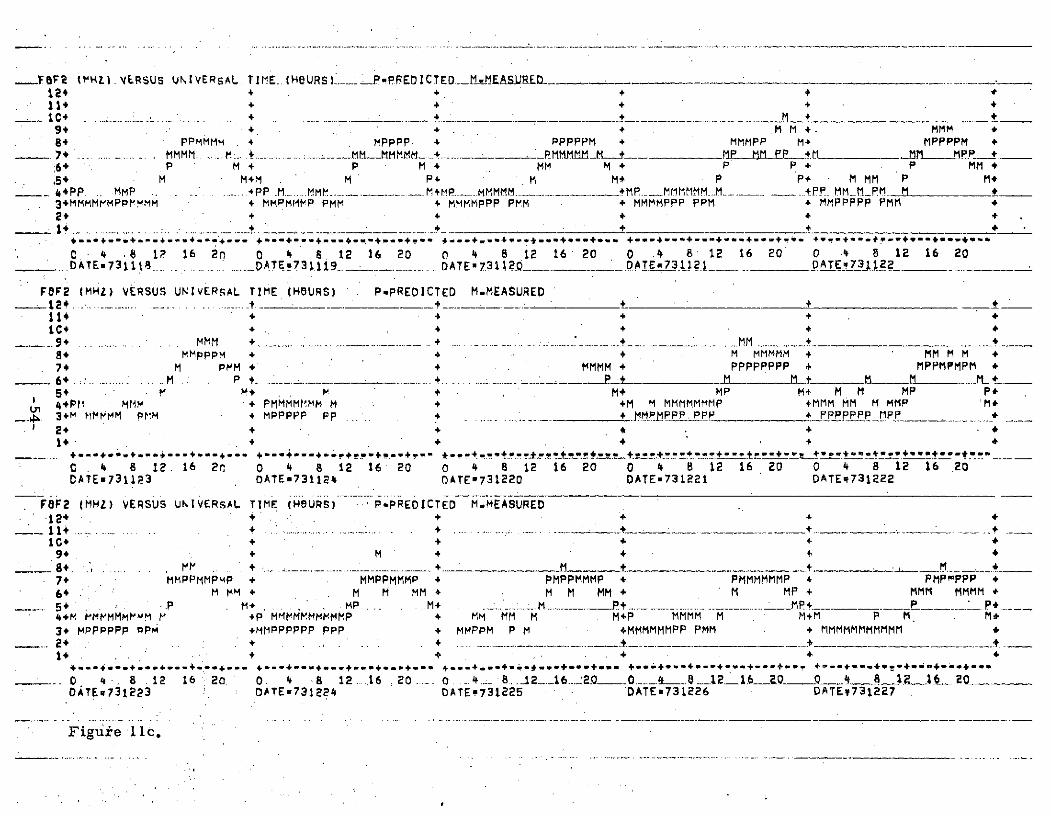
..F.O2 HL).. VERSUS UNIVERSAL TIME., (HOURS ... .P-PFPEDICTED__WEMS.URED ___ .. .12 +114+ + + + +
9, * M M +. MMM +84 PPMMMM .+ MPPPP + PPPPPM + MMMPP M+ MPPPPM +
7 ... MMMM .. M . . MMMML. PMMM M IP MMPP+M M_ MPP +:6+ P M+ P M+ MM M + P P + P MM 4,54 M M+M M P+ M M+ P P+ M MM P M+.*PP. MMP .... ... *PP . MMEM... ... ... MMR...MMMMM... +MP._MMMMM .. .+.....+_.4P. MMi_.M. M +34MMMMrMPPhMMM 4 MMPMMfP PMM + MMMMPPP PMM + MMMMPPP PPM + MMPPPPP PMM +2+ + + + + +
*,.**....*....... +..+...+..*...+..+.* ..... +.....+*+*........ +...+-...-..-.....+..+ +..*.a4***a4********.*
0 4 .8 1? 16 20 0 4 8. 12 16 20 0 4 8 12 16 20 0 4. 8 12 16 20 0 .4 8 12 16 20... ATE731118.. ...DATE?31119 ........ ........ DATE73112.0. DATE73112.1 DATEi731(22_
FeF2 (MHZ) VERSUS UNIVERSAL TIME (HOURS) P-PREDICTED M-MEASURED
11+ + +
1C* + .. + + + _
.9+ MMM + ......... + ... + MM ... + __
8+ MMpppM + . . M MMMMM + MM MM +7+ M PpM + + MMM + PPPPPPPP + MPPMPMPM *S64 ... .. .. H P . + P + M.. M ___ _ __.... t5+ M+ + M+ MP M+ MM MP P+
S4Pl t MMP + PMMMMMM M + +M M MMMMMMMMP +MMM MM M MMP3+m MMPMM PMM + MPPPPP pp + ............. + 1MMPmPPP.PPP + MPPPPPP MPP .
2+ + + ..* . . .4 4 . 4
.. +-----------------------------------------+ *+,* so+v+R- .*** **.-**+--e**n+r****?****
0 4 8 12. 16 20 0 4 8 12 16 20 0 4 8 12 16 20 0 4 8 12 16 20 0 4 8 12 16 20DATE=7311P3 DATE=731124 - DATE-731220 DATE-731221 DATEq731222
F8F2 (MHZ) VERSUS UNIVERSAL TIME (HBURS) P PREDICTED M.MEASURED
12 + +----- a1 .. ......... ..... . . ... . 4 .+.. + . . _ _ ___ _10+ + +
9+ + M + 4
84 . I I' . 4. + ..... ._ . .. 4.. _ + M. _ . M +7+ MMPPMMPMP + MMPPMMMP + PMPPMMMP + PMMMMMP * PMPKPPP +
6+4 M + M M MM + M MM + M MP + MMM MMMM +5.P M+ . MP ... ..M+ _.. ...... M. ......... ..... .......... ......... P P4+M rMvMMMuM r +P MMMMMMMMP + MM MM MM M M+P MMMM M M+M P M. M*
3# MPPPPPP DPM +MMPPPPPP PPP + MMPPM P M +MMMMMPP PMM + MMMMMMMMMMMM
o , .. + +
0 4 8 .12 16 20. O. 4 B 12 ..16 20 ... 0 .4... 8..12__16. _..__... l... 280L 20.DATE731223 DATEx731224 DATEP731225 'DATEm731226 DATE9731227
Figuie lic.
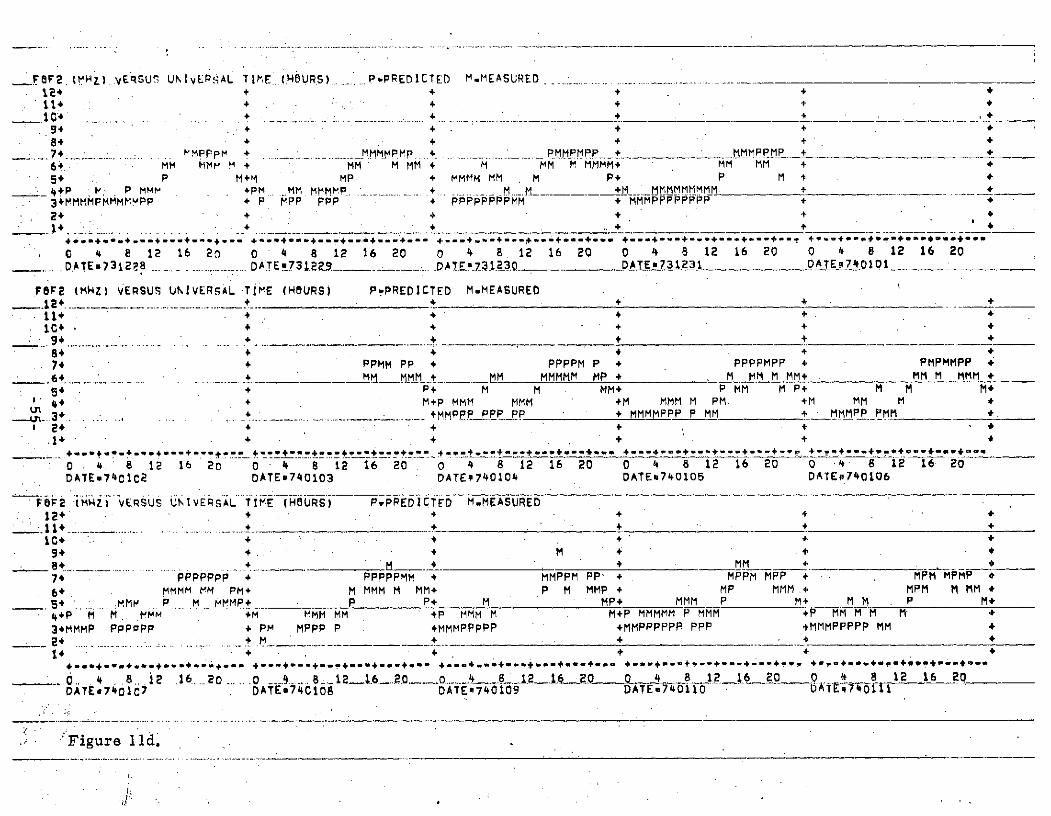
FBF2O H)L vERSUs UNIVELPAL TIE.I HOURS) PPREDICTED M.MEASURED• e + + + + +11 + + +
.. .' + + + 4 . +89 + + +8 + .+7+ MPPPM + 4 + PMMPMPP +.____ mMMM-PPMP +4 _
6+ MM MM M + MM M MM M MMHM MM MM .+
5+ P M+M MP + MMM MM . M P+ P M + +
4+P P MM +PM MM MMMP + M .. . +___ MMMMMM +3+MMMMPMMMMVPP + P MPP PPP + PPPPPPPPMM + MMMPPPPPPPP +
2+ + . +
.............. +*....*.. +*.+. 4. '. ... +--...+......+.4+...** +.- ..+ .......+... +..... e
c 4 8 12 16 2) 0 4 8 12 16 20 0 4 8. 12 16 20 0 4 8 12 16 20 0 4 8 12 16 20
SDATE=731228 ........ DATE.731229__ . . DATE73 1230 _ DAE=731 3 DATE740101_ _
FOrE (MWZ) VERSUS UNIVERSAL TIME (HOURS) PyPREDICTED M.MEASURED11 + +
_ + + + +lc+ . + + + +
C + 4 4 +
74 PPMM PP + PPPPM P + PPPPMPP + PMPMMPP 4
6+. . M J . + -- MM MMMMM MP + M MM M MM+ MM M MMM _
5+ P* M M MM* P MM M P+ M M M4
4+ ' M+ MMM MMM +M MMM M PM +M MM M
3 .... ... . ..... ......... +MMPPP PPP PP + MMMMPPP P MM + MMMPP PMM2+ + + .S+ +
4S..4...4...4.n 4..* *.e.+.-+. .*+.fl.4.- *4+. n 4+..+.4*+.._+- +.........+...-.-+ -......*.r .......... +..........*
0 .. 8 12 16 20 0 • 4 8 12 16 20 o 4 8 12 16 20 0 4 8 12 16 20 0 .4 8 12 16 20DATEv7401C2 DATEm740103 DATEV740104 DATEm740105 DATEP740106
FOF2 (MHZ) VERSUS UNIVERSAL TIME (HOURS) P-PREDICTED M.MEASURED
1+ ++ + +10++ + +9 +.. + M .8+ .. . . . . .. .. . .. _ M + + MM +
7+ PPPPPPP + PPPPPMM + MMPPM PP' + MPPM MPP + . MPM MPMP
6+, mMMMMMM PM+ M MMM M MM+ P M MMP + MP MMM + MPM M MM +
M5 : ..P M MMP . P P+ M MP+ MMM P M+ M P M
HP M M MMM +M MMM MM +P MMM M M+P MMMMM P MMM +P MM MM M
3+MMMP PPPoPP + PM MPPP P +MMMPPPPP +MMPPPPPP PPP +MMMPPPPP MM +
14 1 + . + + + •....... .... ....... +.... .. ... +. . 4 .4. +..+ * +...+. .+..+...+...... +*.0+* ...... O
40. . 8.. .12 .16... 20 .... .O ... i .0....8 _2_1. 0 4 8 A. _Q _..__11 6 20 0 4 8 12 16 20DATEs7401C7 DATE74C108 DATES740109 DATE740110 . ATE7401 1T
Figure 11d.

.FBF2'(MHZ) VERSUS U IVERSAL.TIME .(HIURS) -....PPREDICTED M.1AM.E.ASURED_12* + + +11 + +
94 + 4. +. + +8 + + MM + M + M M +7+ . P MMPPP ... PPMPMPP. +. + ... _MPPMPPPPM ..+ .. ..... PMPhMM+ MP_ MPMM +6+ MM MMMM + MMM M MMM + MPMM MMPM+ P + .M PM+5* MM P P+ M P M+ p P+ M MM P+ MMM M P+4+P Mt-MM PM ..P M .M .... P MMM JP +MM...MPM P MM MM M P MMM3+MMMPPPPP PMM + MMMPPPP PMM + MPPMPPP PMM + MMM PPP PMMM +' PPPtPP PPP +
2* + + + +2. .+ . . . . ..4.. . +. +++**+*****.. .**+***+* + __+-** + * * +* +. .4. _* +__ __+_ ** *
C 4 8 12 16 20 0 4 8 12 16 20 0 4 8 12 16 20 0 4. 8 12 16 20 0 4 8 12 16 20DATE74011C2..............DATE70113 .... . DATE,.7401.1.4_.._.. DATE,740V115 DATE=740116
FeF2 (MHZ) VERSUS UNIVERSAL TIME (HOURS) P-PREDICTED M.MEASURED._ 12* -. .... ........ _... ... . . ..... + . ..... _. _.._.... . .. ...... _._._.. _..._._
11+ + + 4 . +10+ + + 4 +9+ . . . + .. ........ .... ....... .. ........ .t...... .............. ........ .... . ..__ _ _ _ _ ,___ _ _8* M + M MM + + + +7+ PPMMPPMM4 MMMMPMP + PPPMMPM M+ MMMMMMMPM + PPMMMPM M+
.6+ MM M . MP + ......... PM+ ' MM....M t ___ . MP Mf+ __MnMM _..._.MF5 P P+ M P P+ M MP MM P+ P P+ MMP 444PMM MMMM+P MMP M +MM M M MMMMP +MM MMMMM M +MP MMMMMMMM P +
_ 3+tMPPMIPMtPP PPP . +MMHPMMPP M + PMMP.. PP PPP ......... __ PMP.PMM _ MM8P1 PPPPpPP . +24 . . + +
S +* +.. .4- , ... * + + * **
.C 4 8 12 16 20 0 4 8 12 16 20 o 4 8 12 16 20 0 4 8 12 16 20 0 4 8 12 16 20DATEm740117 DATE*740118 DATE8740119 DATEn740120 DATE740121
FeF2 (MHZ) VERSUS UNIVERSAL TIME (HOURS) P.PREDICTED M.MEASURED12+ + + +11+ . + ... . .. + ..... .......... .......... + .....104 + * + +*9+ + + + MM + +.8+ .+ + . ... ... ............. ..... +..... ....... ... .. ...... M ..... M . +_ __ +
7+ PPPMPpPM + PPPPMPPM + PPMPPPP + MMPPPPMPM + PMMMPMMM 4
6* MPM M MMMPM+ M P MMM M PM+ MMMM MMMP + P P +MMM M MPM M PM+.5+ M P + . PMM. M ..+ . -. .... MP... . . M+ ... MMM _ _MP __4*PPMM MMMP MMm +PPM MMM M M + P MMHMM P M+PPH MMMMM P +PP MP .3+'MPPPPP PPP +MPMmPPP PPm + MMM MPPPPMMH MMPMMMPPPPPMM + PPPPPPPMMP +2+ . . + . M. .. + .. .. .... ..... ... . _. .. ............. ............... ... .+1 . 4 + + + . +
+• uu,+ -*u+ **.,-u *-.u. +-*-**....*f+-,..4+.u..* ,-.*.......*.l,+... +uu*4*+-.u+ .+. +.+-4.nn +..q ,* *Iu+...+* .,..0. 4 .8 12 16 20 0 4 8 12. 16 .20 ... 0 .. 812.16 ..... 0 ..... ....8 ....1.__6__Q.8 ~i .. _L2QOATE*74C122 DATEm740123 DATE-740124 DATEe740125 DATE#740126
Figure 116. .

_FF2 MHZ) VERSUS UNIEQSAL TIME ..HBURS)Y P....P_.PRE0ICTED M.MEASURED12+ + + + + +
11+ + + + + +1+ + ++ + +9+ + + + +.
8* M + M + + M +7 ..... ...... ... PPPPmoy + .M... __MM__ _P + ....... M.M PPPP PP + P PMPMM *6 M M MM M + P M + MMMM M + MMMMM MMMM+ PM M M +
5+ M M+ .M M+ M P+ M P+ MM M*4*+M MP M + MM P m +PP MMM P +PP MMMMM P +MM MMMM +
3+ MMMPMPPPiMPV + MMMPP MMMM +M MMMMMPPP MM M+MMMMPPPMPPM + MMMMMMMPPP +2+ . M + + M MM +
. *. ..... . . . .w. .... . ... . . ... .. + 4 _.pW wp. .
0 4 8 12 16 2e 0 4 8 12 16 20 0 4 8 12 16 20 0 4 8 12 16 20 0 4 8 12 16 20.DATE74C127 .D E...... ..... DATE740_128 ________ ___ DA TE7129 ____ DTE740130 _ pATE7401 31
FBF2 (MHZ) VERSUS UNIVERSAL TIME (HOURS) P-PREDICTED M.MEASURED_124 ___..._ + 4 .
114 + 4 + 4 4C4 ++ + + + +.9+ .. __. 4 + 4 4
7+ PPMMMMMM + PPMMPPPP + PPMPPPpP + PMPPPPPP + PPPPPPPP +6+ . . . p .r M+ .M... MML MMMM4. + MMM MMMM + MMMM M P+ MMMMMMMMMM+54+ MM +P M +M M + M MMMM+P M +4+ M-MMMM' + P ' MMM P + P MMMM P + + P- M M M +3.. PPPPPPPPM +mMMMMMPPPMMM 4._MM MMMP PPPMM .+ + MMMMMMPMMPMM2+ . + + .14 4+ + + + +
..............------- -------.+4*** -4-n*+.--.4 - +..4.*-+---+.*--. +-4---W+--4---+---+-t, + +------- 4+* -...
C 4 8 12 16 20 0 8 12 16 20 0 4 8 12 16 20 0 4 8 12 16 20 0 4 8 2 16 20DATEu7402CI DATE*740202 DATE0740203 DATE-740204 DATE740205
FeF2 gMHZ) VERSUS UNIVERSAL TIME (HOURS) P-PREDICTFD M.MEASURED12+. . + + +i. + + +
IC4 . . + + 4+ +.94 + + + + 48 ......... .......... .... + M M + M 4+7* PtMMPMMP + MPMPPPPPP + MMPPPMPP + MMMPPPPP + MPMP MMPM+6+ PM M MM+ MPM MMMM M+ M MM MM+ MM M P+ MMM MP+5+ .......... P M +P M +P P M MMM+P M '4+MPMM .MM " + P MmmMM M +MP MMMMMM +MP MMMM M +M MM P3+ MPPMMMPMPM + MMMNPPP PMM + MMMMMPPPP P + MMMMMPP PPM + PMMMMM PMMM
+ ++ + . + M +
i+ . + + + +.. .. ............... .......... 4 .... _._.. ........... ........... 4.e .....
_._C....... 8 12... 16 .20 ... 0 4 8__ .8.12Q . .6__20 .0 6 0 2 6 20 0 4 8 12 16 20DATE@7402C6 DATEu740207 DATE0740208 OATEo740209 DATEO740210
-..... g-ure -llf . ...............

.FBF2..(HHZl VERSUS UNIVERSAL TIE I HURS) ...... PPREDICT ED ...M.MEASURED. .12+ + + +11+ + + + +
SC+ ........... -. --. ---... + -... . .. . .. . .. . +- .--.-- + 49+ + M + .
834 M M M+ M M + M + 4 M 4
.7+ M............ PPMMMP. .. MPPMM+_ PPPM ..... +_ PMMPPP + _MMMMMjM PMMPMP P
,6* HP P P+4 M MMP+ MMM MMP+ MP M+ M M MM#+5*M *P M *M P M+P P *P
4 PP mMMM. . .. _. PP .... M .. -- ............. P.... MM ..MM..... MMMMMMMMMMM.,..... . MPPM.ML_h _____3+ MMMPPPP PMM. + MM MM P + MMMPMP PM + MPPPP P P + MMPMPPM +
2+ + + + M + I.
......... ...... . .... .+......-... ....... ... .+ ____... ..... ...+..
C 4 8 12 16 20 0 4 . 8 12 16 20 0 4 8 12 16 20 0 4 8 12 16 20 0 4 8 12 16 20DATE,74C211... ....... DATE740212......- ..... DATE!740213 ........_DATIE.qC.4214 _ IE.l. i..15_
FOF2 (MHZ) VERSUS UNIVERSAL TIME (HOURS) P-PREDICTED M.MEASURED12+ _.... . . .. .. .- ..-.. +. +.+............ .
11+ . + +10* + + + +
9+ + ..M. . +8g + M P + MMP + + MM MMM +7+ . PP~MPMMP + PMPP MMMM + MMMP MPP + PMMMM MPP + PMPPPPPPM +
6_MMM_ M MM+..; M11.- _ __- M+ ML..... ..... m MM P+ MM M M+ MM P+
5+M. +M . MM +MM M M+P M M +P M+~ 4 PP PM. M + MPMM MMMM M + PMMM HP TMP +M MM MM PMMMP +MMP MMMP M +
.o. 3+ MMMPMMMPVMM + MPPMPP .PM + M PPPPP PPP. + P MPPMMPPP + MM PPPMMM +
24 p + + + 4 .+ + + +
S... .. ..- +-- +.- -.+ -.+,. o-+o-+.o + **-I *+ - +---+°.' o -ar *A*****e"-*_-. -. ._l-___+o* - **-- + + - + ****_** **t_ -. .....
C . 4 8 12 16 20 0 4 8 12 16 20 0 4 8 12 16 20 0 4 8 12 16 20 0 -4 8 12 16 20DATE740216 OATE*740217 DATED740218 DATEm740219 DATE*740220
FBF2 IMHZ) VERSUS UNIVERSAL TIME (HOURS) P-PREDICTED M.MEASURED
12+ + + + + +11 .. . + . .. .. .• ...... . + ... _+10+ + M M + +
94 MM + M M + + M +
8+ . . M PMP V. . .. MPMMP.. .:. .- .. . . MPPM ... ... .. .. Mpp-_M... MMp +_
7+ MPP MP + PMP MP + MPP PP + PPPPM PP + PPMPM MMMM+
6+ M MM+ P M+M PM MMM+ M PMMM M M+ MM P+
.... MP . + P .... . MH. ... .M +PMM ........ ..M M ........ M ... +P _4* MMMvMMMP m + MMMMMHMM M + pM MM P H + PM MM M +MP MM P, +3+ PPPPP pMM + PPPPP PPM + PMPPMMMvMH + M R P MMM M MMMMP MM
+ .I + .... ... ... . I+ _14 + + + 4
. ........ ...... ... ...... ........ e.....+...*...+ ...... . +........ .........-... + ...... *
..0 4 8 ,12 16 20 0 . 8 12.....16 20 0 ..... 8 2.16 0.. 1._16___ ..... _ .__12. 20
DATE740221 OATE=740222 DATE8740223 DATEP740224 OATEn740225
' Figure 11g.
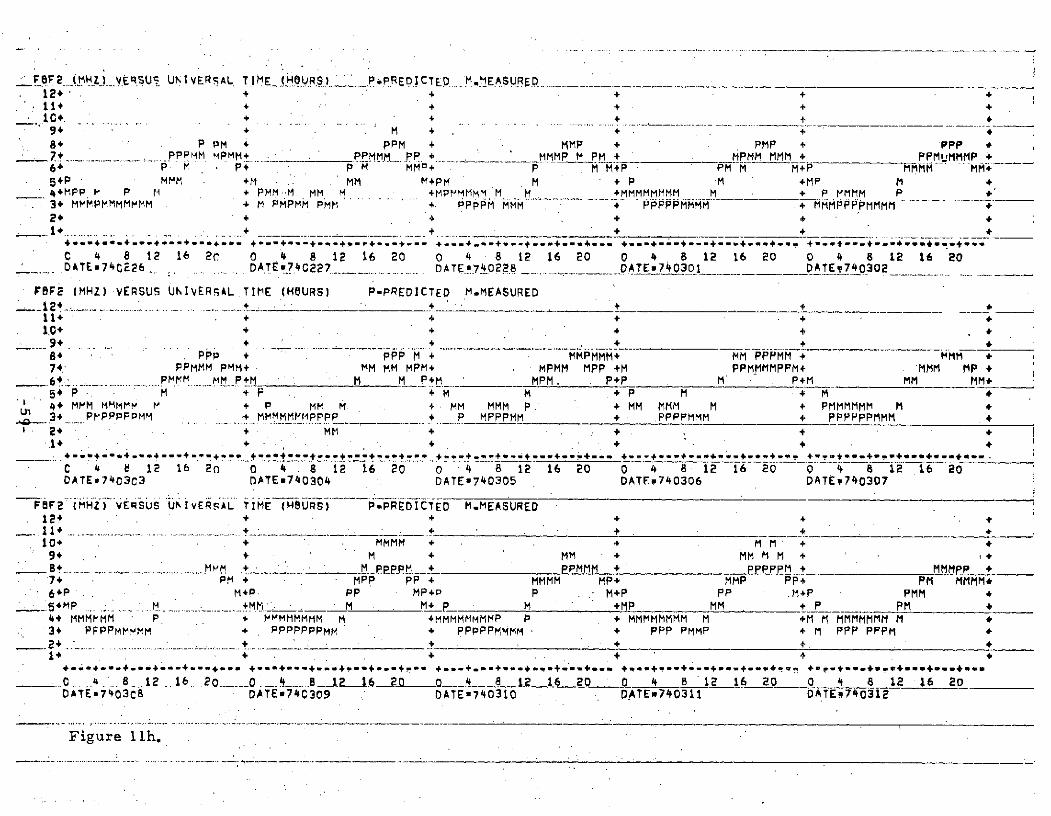
FOF2 (MiH VtSUS UtNIVERS;AL TIME (HOURS) P.PRE.ICTED M.MEASUREDS12+ + + + + +
+1 + +++11+ + + + +
9* + M 4+ + +8* P PM + PPM + MMP + PMP + PPP+ ...... ..... P M PMM+ . PPMMM PP + MMMP M PM + MPMM MMM + PPMUMMMP +
6* P M . P P M MMP+ P MM+P PM M M+P MMMM MM+5+P MMM +MMMM M+PM M + P M +MP M +
S4*MPP P + PMM M MM M +MPtMMMM M M +MMMMMMMM M + P MMMM P +3+ MMMPMMMMMMM + M PMPMM PMM . . PPPPM MMM + PPPPMMMM .+ MMMPPPPMMMM 42+ + + +
. . ........ .... .. .... + . . . .
C 4 8 12 16 2r 0 4 8 12 16 20 0 4 8 12 16 20 0 4 8 12 16 20 0 4 8 12 16 20DATEm74C226. ......... DATE74C227 ... ........ DATE740228 . DOATE.740301 DATEv740302
FFR (MHZ) VERSUS UNIVER9AL TIME (HOURS) P-PREDICTED M.MEASURED
_4...... .......... + +11+ +. + +1.0+ ++.... 9+ + . . .8+ PPP + PPP M + MMPMMM+ MM PPPMM + MMM +74 PPMMM PMM+ MM MM MPM+ . MPMM MPP +M PPMMMMPPM+ MMM MP +S.. ... ..................... MM +M M M P+M MPM. P+P M. P+M MM MM+
5P . M +P * M M + P M + M +4+ MMM MMMMm P + P M M MM MMM P.. + MM MMM M + PMMMMMM M +3+ PPPPPPMM .+ MMMMMI'PPPP + P MPPPMM + .PPPPMMM + PPPPPPPMMM 4
2+ + MM + . . + +++ + + + + +
.. ........ ..... .. .. ........... ................
C 4 8 12 16 20 0 4 8 12 16 20 0 4 8 12 16 20 0 4 8 12 16 20 0 4 8 12 16 20DATE.7403C3 DATEs740304 DATEN740305 0ATFm740306 DATE*740307
F7F2 (MHZ) VERSUS UNIVERSAL TIME (HOURS) PoPREDICTED M.MEASURED12 + + +. +11+ .... . .... + + + ... ++ +104 + MMMM + + . M + +
9+ . M MM + MM MM +8+ ........ M M + M_ PPMMM eePPpPM + MMMPP +7+ PM + MPP PP + MMMM MP+ MMP PP+ PM MMMM*6*P M+P PP MP+P P M+P PP .M+P PMM5MP .... ......... MM M M+ P M +MP MM + P PM +4+ MMMMHM P + HMMMMMMM M *MMMMMMMMP P + MMMMMMMM M M M MMMMMMM M +3+ PFPPMMMM + PPPPPPPMM PPPPPMMM + PPP PMMP + M PPP PPPM +.. + ... . ...... ........ .. .. + . .1+ . + . +
. *.*........*-....+.*...... .*...+......-* + .-- .4.+ .* .+-+ 4..+..4.su.4 .4.+.*.+... 4+O+--+*flt *+..4 ++er +u***..4.e.w..4..+.* 4S0 >..8.. .12..16 20 0.. ... 8_._2_.0 8 12 16 20 0 4 8 12 16 20 0 4 8 12 16 20
DATE-7403C8 DATEv74C309 DATE*740310 - DATE=740311 DATE7040312
Figure llh.
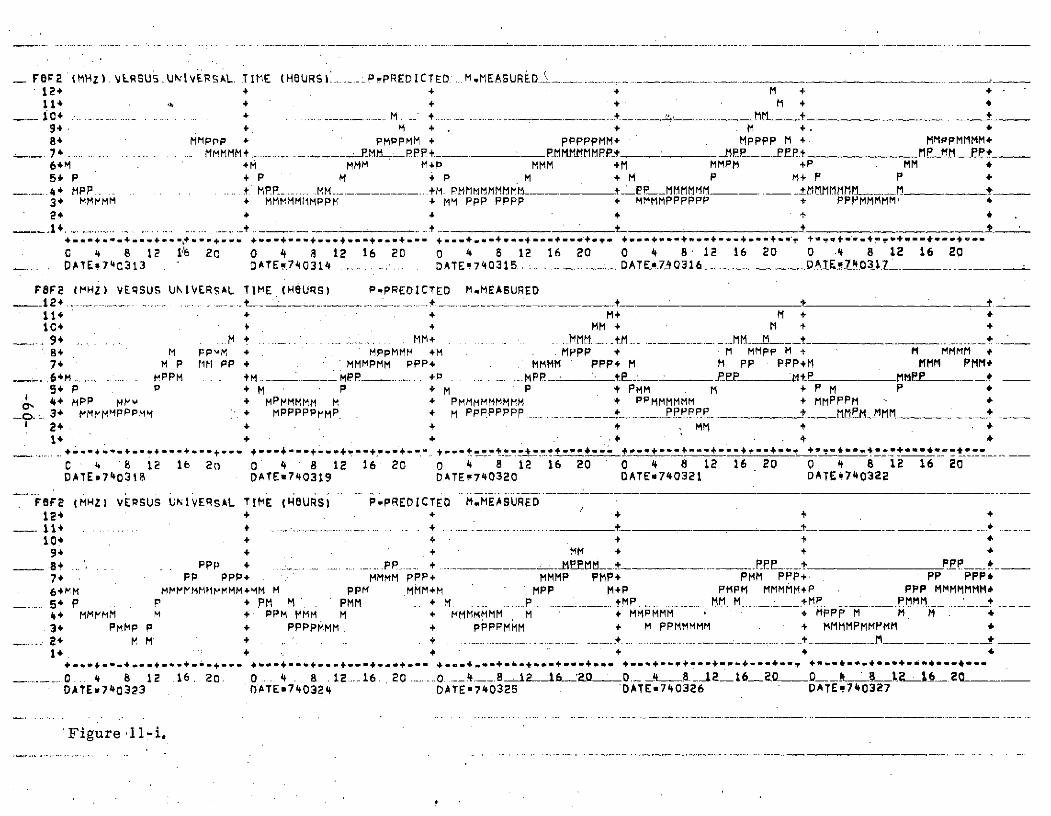
_FOF2 IMHZ) VLRSUS. UkIVERSAL. TIME (H8URSI...--.. PPREDICTED..M.MEASURED_12+ + + + M ++114 . + + + M + 4
10 + .. . ............ ..... + ... .. .. .... +. . -........+ __ ... . MM + +94. + M + + M . +.8+ MMPpp + PMPPMM + PPPPPMM+ . MPPpP M + MMPMMMM+7 ....... .......... MMMMM+ ...... . .... __MM_ PP.. P.MMmMRPPt . P . E__P6+M +M MMM M+P MMM +M MMPM +P MM +
5 P +P M +P M +M P M+P P +.... MPP.. ..... ... . MPP. +M PMMHMMMMM .... P __MMMMMM ........ _MMMMM... .. M +
3+ MMvMM + MMmHMIIMPPM + MM PPP PPPP + MMMMPPPPPP + PPPMMMMM +
2+ + 4 +
.. ... ...... .. ...... .. +........ _ +
0 4 8 12 1'6 20 0 4 8 12 16 20 0 4 8 12 16 20 0 4 8 12 16 20 0 .4 8 12 16 20DATE74C313 . DATE.70314 ............ .DATE74035......... .. DATE.ZQ316 ....... _ P 4031. _ _
F8F2 (MHZ) VEqSUS UNIVERSAL TIME (HBURS) P-PREDICTED M.MEASURED
114 + +. M+ M + +
iC+ + MM + M + +
.9..M + . ... .. . .. . . MM+ . .. .. MM . M .. ... .. M +.. +
8+ M FPMM + . MPpMMM +M MPPP + M MMPP M + M MMMM +74 M P MM PP + MMMPMM PPP+ MMMM PPP+ M M PP PPP+M MMM PMM+
...6+M ............. tMPPM ... +M ... MP............ +P....... .. MPP._ P~- _ P Mt_ _ _.M MMP- -
5+ P . + M P + M P + PMM M + P M P +
4+ MPP MMv + MPMMMMM H + PMMMMMMM + PPMMMMM + MMPPPM +..-o.- MMPPPMM + MPPPPPMMP + M PPPPPPPP ppp...M__pppMM +p
24. + + + MM+ .14 + . + . 4
..... +.- + -.*+ +-+--.- +**-+--'.I.,+--,+..-+.--. f , .. ,-..--+..* .. +*.* * + +p.- -+--+*+-' +.- ? +4.44**~*.** . 4.*..+.*C 4 8 12 16 2o 0 4 8 12 16 20 0 4 8 12 16 20 0 4 8 12 16 20 0 4 8 12 16 20DATEP740318 DATEm740319 DATEP740320 DATEm740321 DATE740322
F.F2 (MHZ) VERSUS UNIVERSAL TIME (HOURS) P.PREDICTED M.MEASURED12+ + + + + +
.+ .+. . ...... .......... ... ....... .. . + ................ ....... __ + _ _ _ _ ... 4 .. ..10+ + + +
9+ + . + MM + + +
8+ . PPP + .... ......... PP .... ..... MPMM-. + .. +. PPP *
7+ PP PPP+ MMMM PPP+ MMMP PMP+ PMM PPP+. PP PPP+
64MM MMPMMMpMMM+MM M PPM MMM+M MPP M+P PMPM MMMMM+P PPP MMMMMM+5+ P + PM M PMM . + M ........... P ...... +MP M... .. M. +MP PMMM +44 MMvMM H + PPM VMM M + MMMMMM M + MMPMMM ' 4 MPPP M M M +34 PMMP P + PPPPMMM + PPPPMMM + M PPMMMMM + MMMMPMMPMM 4
.2+ M +..... ................. ... ... ............- .... .. .... __ .." "+ . + +. ... . . . . . .
. .. 4 8 12 .16..20 0. 4 8 .12..... 1620 .....0 ... ... 812 16__20 0 48_. 16. 0.._ . .81.66 ' .-__DATEu740323 DATEm740324 DATE*740325 "DATEm740326 DATEi740327
Figure 11-i.

EF2 tMHWZ) .VERSUS UNIVERSAL TIME_(HeURS) P-PPEDIVTED _M.M__ASURED12+ + + +
10+ + + + + I
94 + + + +
8+ MMM + PP + PPP + PPP + +
7+ .P PPP+ P PPPP+ .PP PPM P MPPI- PPMMMPP+6+P PPPM MMM+P PPP MMMMM +P P MMMMMMM+P PPP MM MMMM+P MMPP M M +5+ P M + P P MM M + P M .P M +MP P MM +Mp PPMMM ,+
4+M PPV MMM M M + MMMMMvrM MM M+MMMPPMMM MM + MMMMM MMMM + MPPM P +
3+ MMM MPPPv'NM + PPPPMMM M + M PPPMMPM + PMMMMMP + MM MMMMMMM .
2+ + M + .14 +1+ * + 4 4
+...*...*...++- ...--.----+--------------+---+-44+..4*+**... +...... ......... T ....... .. .
0. 4 8 12 16 2c 0 4 8 12 16 20 0 4 8 i 16 20 0 4 8 12 16 20 0 4 8 12 16 20DATE,740328 ... DATEx. Q329 -- _9_•__. DATE!P7 .3.0 _ _DATEn7403g3 DATEP740401
FOF2 (HHZ) VERSUS UNIVERSAL TIME (HOURS) P-PREDICTFD M.MEASURED
11+ 4 . 4 4 4.
IC+ MM + +
9+ 4 M + M +
8+ M + MM + M + M MMM +. + PP PmPPP+ MMMPMPPPPPP+ PMMPPPPP+ PPPPPPPP+ M PPPPPPMM+
6+P_...... PP M .m, MM PPM MMM.M.P. PMM MM LM . P MMM MM +P _ FP 4
5+ P PMMtm M+ P M MP M+MM MMM M M+ M PPM M M MM+MP PP4. +M MMP M PH + PPPMM P + PMM P + "MPP MMM + MPMMMMMM PM
3+. M MMP.M-MM . .PP1MMMA + .M tM1PM t+ MMMMM M1 +PPPMMM2+ . + Mt +1+ + + +
.........* -.. ..+---..**+ **- +- --- +**o ***+--*+.*- +.--+ . +=..+.**+*-.+*** +***+--*+<*-****+---+ _ .=.-+*=* * -** =
C . 4 8 12 16 20 0 4: 8 12 16 20 0 4 8 .12 16 20 0 4 8 12 16 20 0 4 8 12 16 20DATE*7404c2 DATEn740403 DATE6740404 DATEo740405 . TEm7404Q6
F8F2 (MHZ) VERSUS UNIVERSAL TIME (HBURS) P.PREDICTED M.MEASURED12+ + + + . +
- .... 11+............ .... - ....-.... ... _.. +__ " +_ +_ _________________ + I1+ + MM + MM + MM M -
.94 . MM + MMM + M . + + M MM +
8+ + M M MPP MM+ M PPP .M _ .MMMM +
74 PMMPPPMP+ MPPPPPPMP+ MMPP PPP+M MPP PPP+P PMP PFMM+6+M. PPR M+P. P P M+P MPP + P MMP ,MF MNMM
5+ p MMM MP MM .MM ' M + M M . P44 MMMMMMM' P + M PMP P + MMMMMMMMM + MMMMMM P . MMMPPM3+ PPPvMM + M MMMMMMM 4 PPPPP + P PMMM MM .
1+ 4 + . + +*.G~ *4 l*.+. **4r+f*. +- ..*.+* *............. + +....*+*l*+**+4*+*** +, 4**+n **+***+.*y*-9 +..*rwt*+ eare** cet***
S 4 .... 12 16. 20 .. .... ... . __20 0...0_.16 20 0 4 8 12 16 20 0 9 8 12 16 20DATE74C04C7 DATEs74C408 DATEt740409 DATEm740410 DATEi740411
Figure 11j.

,.F2 ...(HZ) ..VERSUS UNiVERSAL.J.TIME(HBURSt ... _.-PREDICTED._tM.EASURED.2 + + +11+ + + +
1 . ... . . . . +.9+ MM MM + * 4
8+ PM + MMMMM + PPPM + PPPMM + MMMM +
7+P... .. . ..... P.._ PPMP.- - ..M P+M PMMM _ PMMMM MtM _ P
6+ P PPMM + P PMMM M+ P PMMM + M MMM M + M M!PP P
5+M P MfM M P - MM + MP MM + M M P + MMMMM P +44 MMPPPPMM M .+ MfM MVMMMM. . ... .MMMMMMMM.Mm . . t-_ J t.....MMn_ M -- --- fIPfMi I3+ MYMM P"M1 + PPP .. PPM ' . PP . PP +
2+ + +
-- .. I .... .... ... . - -_ - + ,. .
0 4 8 1;2 16 2c 0. 4 8 12 16 20 0 4 8 12 16 20 0 4 8 12 16 20 0 4 8 12 16 20
DATE04 0412 . . . DATE!74C413. ...... . DATEIF74044 ..-...------ DAIL-Q 15Ew -AE
FBF2 (MHZ) VERSUS UNIVERSAL TIME (HOURS) P.PREDICTED. M.MEASURED.12+ ...... ....- ..... ..... .- ... ._..._._..... ..... L. + __ii+ + .
11 + +
10++104 + + M + + 4
9+ M M.. . ......... + . MM .1..... __ _M_ _ ~ + .. MM ___
8+ MM MMMM M+ . M M+ M M + MM
74 rMPP PPP+ P PPPP+P MM PPPPPPMP+M MPPPMPM+M MP PMPM*
6+ M . ... .. ..MPPP........MM .----.. P..- P M .. .. +M MMP._ MMM M ... ...... MMPP _ _MMMM M ...
5+ M M MP 4 MMM PMM MMMM+ M MP + M MP + MM MM4 MrMMPM MP 4 PPMMM PM + MMMMMM P + MMM M M + PPPMMMMMM
SPPP + ..PMM ..... ... PPM + PPPMM + PPPPP
24 + . .
. 4.. .... ............. .... + .......... . .. . .. -+--4---+---+''--''* ' +'+*'' '+'* *
o 4 8 12 16 20 0 4 8 12 16 20 0 4 8 12 16 '20 0 4 8 12 16 20 0 4 8 12 16 20
DATE974C417 - DATEo740418 DATE*740419 DATEP740420 DATEv740421
(MF2 (MHZi VERSUS UNIVERSAL TIME (HOURS) P-PREDICTrD M.MEASURED12+ +
.... 11. . . .............. -- . ... .... ........... -.... __ - -
104+ + + +54 + M+ + 4
74M PPPPPP+P PPPPP+P M PMMPPPP+MM PMMMMPM+M +
6+ M + P P MMMM +P M MMMM + PM P .M + P
5+ M PP .M MMM+ MP..... MPMM ....... MM+ MM ....... PPP..... ... MMM. + M PP
44 MRPMMM PNM +M MPPP M + MMMMMM m + MM PM + MMMMM PM
3+ MPPPMM . 4 MMMMMMMM + PPPMM + PPM M + PPPMMM M
2+
1... .. . ... 4 8. . ... ..8 ..1O....... ............... ...... *__- - . . ............. -. . ... +
0 4 8 12 16 20 0 4 .. 8 12... 16 20 .. o 812 _ . _-. 0 -12_ 4. 24 8 12 6 20
OATE.74C422 DATE=740423 DATEm740424 . OATEn740425. DATEP740426
Figure 11k;

FBF2 (M PVERSUS UNIVERSAL TMIHE uHURS P-PRE ICTED M.MEASURED
12+ + + +
+ . + + #94 1 . + + • 48' . , M. + . + MM4.. ~. ... .__- . .... "P~. ._P . MMMMMMMMM+ M PPMMPP *6 MMMM + PM PPMM + M PMMMM +54 - • MP PM MMMM + MP tPMiM4 4 + + P MPMMMMM + MMMMMM PM +34 + + MPPPPP PPMM +24 4 + + +
S14.. ..... .. . ... ... ....... . .. _____... . .
C 4 12 ,1 20 0 4 8 12 16 20 0 4 8 12 16 20 0 4 8 12 16 20 0 4 8 12 16 20S ATEv740427 oATE774 O4$8 - DATEaj74429 _____ DATE-740430 _DATE740501
FBF2 (MHZ) VERSUS UNIVERSAL TIME -(HBURS) P-PREDICTED M.MEASURED__ 12+ ...... ...... : + .
11+ ++
_ 9+ mM ++ + MMMMMH M+,8+ M+ MM + p+ Pt M MMP+
7+M M MMMPPPP+MM MMPPMMM M+M P PPM+P PPP +P . PPPPPP +S 6 ... MM P M PM- M P __ PP + M M MM +MMP MMMM+ PP M PPP +54 + P P M + P P + PM MM +M P MP 44* M~vMMMH M P + P PM MM + P PMM MM MMPMPPMM P + MMMMMPMM P
S.. PPM PPPM + P M PPMM M PMM+
-- -..-....--. -........ w ... ...... .... -- +--. *+ +*** + +.--+ ......0 :4 8 12 1 2 0 4 8 12 16 20 0 4 8 12 16 20 0 4 8 12 16 .20 0 4 8 12 16 20DATE=74C5C2 DATEu74C503 DATER740504 DATEP740505 DATE740506
F,2 (HHZ) VERSUS UNIvERSAL TIME (HBURS) PoPREDICTED M.MEASURED12+ +
S.__._._. _ ....... ................ _ .__ ........ _ +10 M +
9+ M .894 M +
74M PPPP
S5+ P 'MM. MP. . +4* PPPMmMP3+ PPP
1+
C 12 16 20 ...
DATE7 40C7
F........ igure..l1-l...... ..
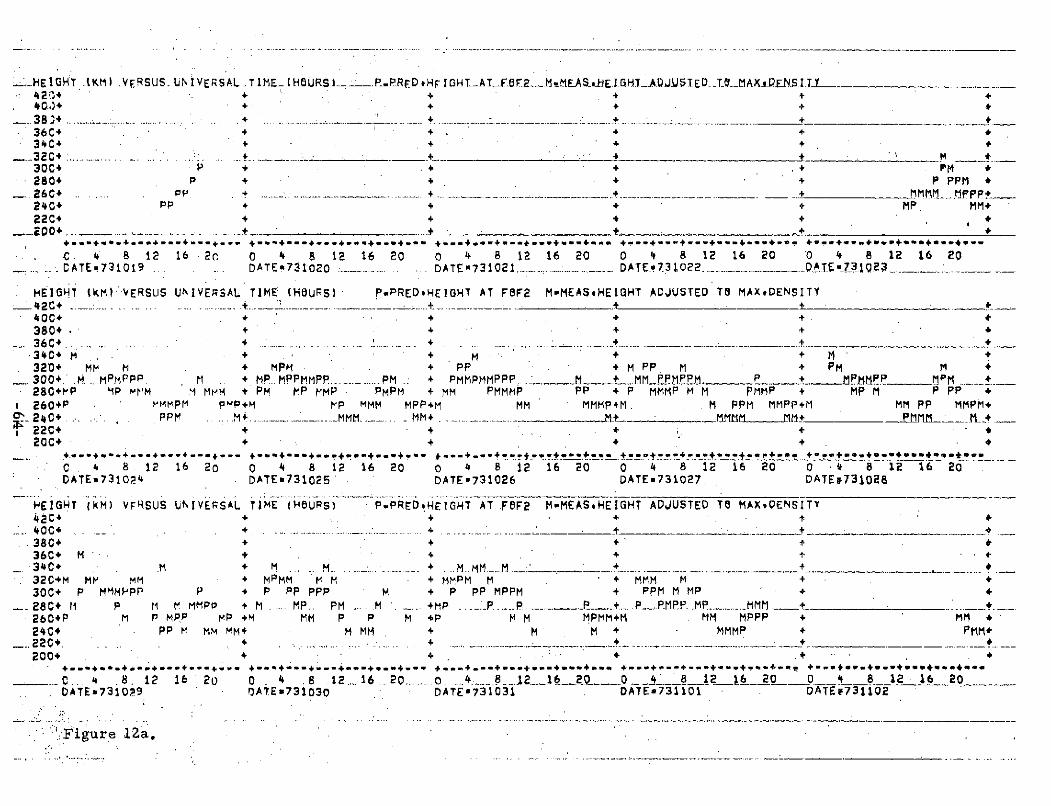
-_HE GHT (KM) .VERSUS. UNIVER SAL .T IME HURS ,._..- P._PRED, HF I GHLAEf2-MSHEIGHTL.ADUSTED_.T_MAX,_EN-S.I..T424 + + + + +
S+ + + + +
36C#34C+ + + +
....32C+ :............... .. ..... ... . .....+ . _. + ' M30C+ P + * + .+ PM *
280 P + + + P PPM26C+ PP + .. ... -__+ MMhiM. MFFP240+ PP + + + MP. MM+22C+ + + + +
24......00+ .. .. . C f .. 4 . ++.
C. 4 8 12 16 20 0 4 8 12 16 20 0 4 8 12 16 20 0 4 8 12 16 20 0 4 8 12 16 20... CATE 731019 .. . DATE 731020 DATE 731020 ...... .1 ........ -.. DATE 3 022 ........ 3.123
HEIGHT IKM) VERSUS UNIVERSAL TIME (HOURS) P.PREDHEIGHT AT FOF2 M-MEASHEIGHT ADJUSTED TU MAXvDENSITY420+ .. . .... . __ __ 40C* + + +. *
380+. + . + . .
36C+.340 C+ M + + M + + M +320+ M H + MPM + PP + M PP, M PM M300+. .M. MPMPPP. M .. + MP.. MPPHMPP... ..... PM + PMMPMMPPP ..L__ _____....M_ P + MMFP P M280+PP MP rM '1 MmM + PM MP MMP PMPM + MM PMMMP PP + P MMMP M M PMMP + MP M P PP260+P ryMMPM PMP+M P MMM MPP*H MM MMMP+M. . M PPM MMPP+M MM PP MMPM+24C+.. .. . PPM .M+ .... .MMM .... MM+. ..... .MI"£LH ... ! P'___.___.... _MM__
22C0+ + + + +20C+ + + + + *
C . 4 8. 12 6 20 0 4 8 16 26 20 0 4 8 12 16 20 0 4 8 12 16 20 0 4 8 12 16 20DATEa731024 DATEm731025 DATE-731026 DATE.731027 DATEP7310E8
PEIGHT (kM) VFRSUS UNIVERSAL TIME (H.URS) P.PREDHEIGHT AT .FF2 M-MEAS.HEIGHT ADJUSTED TB MAXOENSITY42C* + . + + +
...40C+. ... + - *..... L... . ' 4 _3804 + + *36C+ M+ + 4
34C + . .M + M M .. .. ... + ..... MM.....: . ............... i.t. .32C+M MV MM + MPMM V M + MMPM H + MMM M m 4
30C0+ P MMMPPP P + P PP PPP M + P PP MPPM + PPM M MP + +28C+ M P M t MMPP + M ..... MP.. PM .. .... +P ....P P ..P .... .P. . P... .....MMM +...260+P MP MPP P +M MM P P M +P M MMPMH+M . MM MPPP + MM24C PP M MM MM+ M MM . + M M MMMP + PMM
200+ 4 + + .+ .
0... 4 .8 12 16 20 0 4 .8 1.2 .... 16 20 .. .... 8 _1 6 . 0 8 12 16 20 0 4 8 12 16 20DATE*731029 DATEa731030 DATE*731031 DATEw731101 DATEP731102
'Figure 12a.

__ EIGHR (M~ .VERSUS L.UNlERSAL.TI E (HeURS) P___ PREDHEIGH. ATFF __MEAStHEIGHT ADJUSTED Te MAXDENSITY42C+ + + +
.40C+ +_.38C+ + + + " .
360+, + + . + M -340* MM + M M + M M.3204+ .MMM _... + MMM M • + + m. +300+ M PM MP PP M MP + MPP MMP + MMPMM. MMP + MMMP PP -M280+MP PPPP MP M + PP 'PPMM MP MMMM + PPM PPMP MP MM + PP PMMP MM + PP MMPPM P M +26C.PPPp + .....M . MM M PpPPMM +PM MP MPPPPM M+M P PMMPM +M ..... M.... P - +m MM .. MPPPM +24C+ MHmMMM MM ' MPPM PPP+M MM MPM MPMP+ MPPMM MPMM+ . MMMM MPMM+220+ + M M+ + MM
+-*.+**.* ...*..+...... .*.....- . . ... + . .+.-...~+--- .-- +..+- + + -- + ..- +...+.. +..+..+..--+**. ..C 4 8 12 16 .20 0 4 8 12 16 20 0 4 8 12 16 20 0 4 8 12 16 20 0 4 8 12 16 20.DATE-7311c3 DATEm7311C4 .. DATE.8731 105 .. DATEa731106 _pATE!7311707
HEIGHT (KM) VERSUS UNIVERSAL TIME.(HOURS) P-PREDWEIGHT AT F6F2 M-MEASHEIGHT ADJUSTED Te MAXDENSITY420+400+ + + + + 4380+4 4 + +360+ + +
340+ m4 +320+ M . M M + M + M- + *300+ PFM PPM ... MPP MM MM PM MMMP . + M PM M MPP + M MM MP M +28C P PPMM MP MM + MP MMPPP P +MMMM PPP P + PP. PPMPMP M +MM MMMPM26C+ M MPPp + M M PPMPM M+p M. MMM M MMp +M M M Mp pMP +p PPMPM +
S240 + 4.... .... MP._ MMP + _ LftPtMK.._MPP+ M MM MMMl+ M MMPP MMMM ___-+ MMM MPMM+220+ M 4 MM + +200+ + + +
.4 +-+. .+. --+ * .--- +* -+--- +- +-+* -+-+ +--+-+-- +--+-+ ++.+. . -+=. ..C 4 8 12 16 20 0 4 8 12 16 20 0 4 8 12 16 20 0 4 8 12 16 20 0 4 8 12 16 20DATE.7311C8 OATE=731109 DATE-731110 DATE=731111 DATEP731112
HEIGHT (M) VERSUS UIVErRAL TME (HeURS) P.PR~E-.*IGHT AT FBF2 M-MEASHEIGHT ADJUSTE-TB-- MAX7 NS-----E-- TY420+' + + + +
._ . 4 + 4. M + +38C+ . 4 M + .+ +360+ 4+ + M + +.340+ . 4 + +320+ + + M + MM + M MMM +•30C+ M PP PP MHMM MPP + PMM MP . + P M PP - + M PM MP28C+ PM MMMHMM P MM M+MM PMMPMMP . M 4 PP PPMM MMM M +M PPPPM P MM .+ PM PPPP MM _
26C4M M MM M PPPH +P MM MMMPMM+MM P MMPMP M+P MMM MMPPPM +M m MM PPMM +240+ MPMMM MPP+ MMMM PPP+ M PPPP MMHP+ MMMP MPMM+ FMMM MMM+
-,220+, . , . M +.L + + - +
29C+ + - + +. ,4+-*4*+. -.+ **+---+-- +.*-+.'+-4-+---+---+--- +.--.*+--. + -l.-.* +n+- - +--- +--+---+ .+*+.- +.-..+.-.+-..**.... .+- .
.. . .- .. .8 . 1 . 20 ....0... 4.. 8 ...12_ 60 4 8 1 0 Q .4 8 12' 16 20 0 8 12 16 20DATE731113 DATEo731114 DATEN731115 DATE=731116 DATE*731117
. ... F ig ure-2b ;- _ .........::_ _ ____---- ..... _ _ __ _ _

'.h I GHT ..KM) ,.VERSUS U I VEPSAL. TIME .( hURS) -PRED, HE.IGRLATkTEE__ithALT -S.-HEI.THAJ S.E. ~L L-_.---T412C . + + +
400 + + + +3804 + -+ -_-__- +
36C+ M +. + + MS34C+ MM M + .M + + + M +
32C+ M + ....... _ . + +.__ M f MI~ .M M +
30C+ MPP M PP M + MP M PM + PPMMM MPM + MMPMMM PP M + M PP P
280+ PP PPPP P +*HMM MPPP m + PPM PPPM P + PP PPMMM. P M + PP PMMM MP +
... 260+M ..........M P PMMP M+P ... M ..... .... PMPPM. M+MMM...M. ..M.M. .. PMMM.M+M. .ML.PM...... MM .PM_ _ ,tP M!.l . MMIMPl__+__
2404 M PMPPM t.4MMP+ MM PM MMPMP+ MMMMM PMP+ PMMP PMM+M MMMP MMMP*
220+ M M. + M + + M + 4
4 4....-...... .... ....... .......... .........-4. .. + 4 4 -*-4-.-+--.+4 +.. ,*
0 4 8 12 16 20 0 4 8 12 16 20 0 4 8 12 16 20 0 4 8 12 16 20 0 4 8 12 16 20CDATE731118 D... . TE 731 119..__ DATE_ 731120 ........ DATE731121 DATE731122
.HEIGHT (KM) VERSUS UNIVERSAL TIME (HOURS) P.PREDHEIGHT AT FOF2 MPMEASHEIGHT ADUSTED TO MAXUENSITY
. 20.. :............ .... + _ . ...... .. .......--40C+
36C+ . - -340 M + + " . .+ 4320+ t M + M M M M
300 . MFM mPP .. .. M..P .e...M --- - ........-- M .. M M MMMM tM ML MM_28C+ MP PPPPv P M + PM MMM M + +M PM MPPPPPP M M M+ P MPPPMPPPM
260+M MMPM PPPMt + pMM +pM MM MM M +pM MMM P MMp MMM'. 240+ ...... MP:M Mtl PM.P+ .. ._-.PP .. MM P + MM .. __ MMMMP MPPP+
220C M M+ '+ + P + P +
200+ 4 - -- +- -------- + .
C 4 8 12 16 20 0 4 8 12 16 20 0 4 8 12 16 20 0 i 8 12 16 20 0 4 8 12 16 20
DATE.731123 DATEa731124 DATE731220 DATE731221 DATEp731222
.HEIGHT (KH) VERSUS UhIVERSAL TIME (HBURS) P-PREDHEIGHT AT FOF2 M-MEASHEIGHT ADJUSTED TB MAXDENSITY
420+. + +
400+380+ * + + +
360+ + + ' . ' .
. .34 + ... + H .+.. ......... ._.M ..+ ... _ _ + _____M.,_M_320+ +M + M + M MMM M +M M M +
300+ MP M lMI + M MM M MM + PM MM +MM MP M + PP M +
280+MMM MPPPrPP . M . H MPMPPPPM MM M. + P M..PP.. MM...... M .. .... + ....P_MPP~MM . M MP PPPPPMPM
260+PP MM PM PP MMM+PP M P PPM + M P PMM +PP .P MM M +PF P MM M+
240* PMMPM MmPPP+ MMMPP PPMM+ MM MM PMMM+ MMMP PMP+ MM MP PMMP+
220+ . . P + . . .. PMM . + - ---- -- M M +
S200 . .. 4 ... .. ..... PMM ............................ ++-a + +
4. 8 12 16 20 0 4 8 12 ..16 20 .0 4 8 12. 16 20 .. 4 8 12 16 20 0 4 8 12 16 20
DATE731223 DATE9731224 DATE-731225 DATE=731226 DATE173127
Figure 12c.

HEIGT (KM) VERSUS lIVERSAL TIME (HOURS) ... P-PREDH-IGHT AT.. 2 M-MEASHEIGHT AUJSTED._OMAXDENSITY42C0 + + + +400+ * + + +380+ + + + +36C+ M + M + + + +340+* + + M + M+32 + M .M .M ... .........M....... ...... . + MI M+M +300+MM PPMM + P + PMMm V +MHMM MM M + MPPM.M M . +28C+ P .PPPPPPPM M+M PP PPPPm M + P PPPMMPPM MM +M P PMPMPPPM M M M +260+PP P MMPMP +PP P MMPMMM + MP MMM MM+PP . P M MPMM24C + MM PP MPPMP + M PMmMP PPP + MMMMP PPPP+ MP MP PP + +
220+ . M + MIP + P + . P + +200+ .. ..... . .-. -- . . ... .. + + ..+ - .
C 4 8 12 16 2o 0 4 8 12 16 20 0 4 8 12 16 20 0 4 8 12 16 20 0 4 8 12 16 200 ATE.73128 ... .... ... ..DA229 ..... ATE73 3 ... DATE 731231 DATE 70101
HEIGHT (KM) VERSUS UNIVERSAL TIME (HOURS) P-PREDHEFIGHT AT FBF2 M-MEASHEIGHT ADJUSTED TB MAXDENSITY4 20 + ....... .... .+ + +
40C+ " * + + +.38C0+ + + + *
360+ ........ . . . ...... + + +340+ + + M M + M *
32'C+ + M M + M M + M +__30C+ ... + .+M PMM .M.. M M + PMPMMMMM. . PPM M M
280+ + M + M PMP PPM M + MP PP p P M + PP PPPM 4
260+ ' + M MM MMM +pp M PMM MPPM MM+pp P MMPP M +P MM MP MrMM M_240..+ ...... PP _PM+ .... .PPMP MPP+M M MMPP PP M MPMP M.JP_22C + + + HM M *M+ M M M *
20C+ + . + + M + +
C . 4 8 12' 16 2c 0 4 8 12 16 20 0 4 8 12 16 20 0 4 8 12 16 20 0 9 8 12 16 20DATE.7401C2 DATEa740103 DATEP740104 • DATE740105 DATEq74006
HEIGHT.(KM) VERSUS UNIVERSAL.TIME (N6URS) P.PRED.HEIGHT AT F6F2 M-MEAS.HEIGHT ADJUSTED TB MAX,DENSITY42C+ + + + + +400 + + + +
38C+ . + + + + +.34C+
32C40+ M + M + M + M .
30C+ P + M M + MMPPP + PMH M + MPPP MM +
_28C+.PM .MPPOMMF . M . MP PM~ __ M... +.P IP M + PM MMMPMM + MPM MPPPPPM M +.260+Mp MM p pHppeM +pp M MMP PPMPM +Mp M MM M M+MpM M pM M Mp +M M M PMi +24C+ MMPP MPPM+M MMMMM M PMM+ MPP PMP+ PMMM MMMP+ MM MMMP MPP+
__.220+ M .... .... t M + .. HM±200+ + + + .+M +
C. .. 8 12 1620 8 6 20 0 4 8 12 16 20 0 4 8 12 16 20DATEo740107 DAAE740108 DATEm740109 DATEm740110 DAIE9*701i
. Figure. 12d.............

HE.IGHT...(KM) VERSUS.UNIVEpSAL TIME ..(HUURS) ... ...... PREDHEIGH .ALE2.M MEAs HEI.GH. ~ SED__ALDEN SIT420+ + + + +
S00+ + +
360+ + + +34C + +
.320 ............ .. + . ............. .. ........- M -t ._ M- __MMM.___300+ MMMFM ' + MMPPMM + PPM M + P P M M PPPMM M .
280+ P V MMPPPPM M + PMM PMPPPM M + MM MMMPPMM MM + MM MPMPPPM M + PPMPPMM MM2604PP . r.. P . . PPP +MP .....-- MMM .M .....MPPMP.M _..+MP .M MM.E. P.PM.tl.-+MM " M__P. MMMM MtPf M M 2PM __PM____PPM +240+M PPM MMPP+ MPPPM MPPM+' PMPM MPPP+ M M PP PMPMM . MPPPMM PMM+2204 MM M MM+ M M + M M M+ + M
.* ...2C N ......... .. ... . ....... ............ ..... * .__ _ .... ... _ .
C 4 8 12 16 2c 0 4 8 12 16 20 0 4 8 12 16 20 0 4 . 8 12 16 20 0 4 8 12 16 20DATE.74C112 DATE-74C113........ DATE&7.4011 .4....... .D.A TE _QL 15_DATEO 74 6 .... __
HEIGHT (KMI VERSUS UNIVERSAL TIME (HBURS) P.PREDHEIGHT AT FBF2 M-MEASHEIGHT ADJUSTED TO MAXIOENSITY42C+ .. + + .+.. +_400+ + +
380+ + + 4 + *360+ + M... . . . .. ...... . . ... _+340+ M + ++32C+ P + M MM + MM M + M M +
.. 300 .PPPMM .. . + M P.P ...... . +. PP........M .......... ... .... ... L M .___ eMPt -___M .280+ PM PPMMMPM MM +M P PMMMM M M + M MMPPPPPM M + MPM PMMMPPM M + P M PMPPMP M m +
\ 26C+MMM MP PPMM +PFM P MMMPMM +MM MM P MPMPMMM+MPM P MPPPM +PM MM PPPPM M+
o. 240+ M HPMM MMM .. PMMP PMM+ ........ .......... MPPP -- . MMMM-- M-.M±M __.PPTMM MPMP.220+ M + M + M + + MMM +
200+ + M +. +
C 4 8 12 16 20 0 4 8 12 16 20 0 4 8 12 16 20 0 4 8 12 16 20 1 4 8 1 16 20DATE*741I7 DATE.74C118 DATEn740119 DATEw740120 DATE7940121
-EIGT (KM) VERSUS UhVERSAL TIPE (IHOURS) P.PRED#HEIGHT AT FeF2 M*MEASHEIGHT ADJUSTED TO MAX*DENSITY
42C+ +.0C O + . + .... ............... _....... 4 4... ..... . . ..... . ... .
38C+ + *360+ + + M + *
340 + .----. -- + - - - ? 'M .. ..8.. ... ___
32C+ + +M + M + M M +
300+ PPP + M PPPMMM + M P M +M PMP MM •+ PMP M +280+ MMVMMMPPPP + PMMMPPPMPM .. MM .... M MMPMMPPM ........ M.. M. .M... MPPPM........M......M..+ .. .._..MPMP......M MM *.
260+PM MMMMV' PiPDM *4PP M PpPP M 4 P M p MMMM +PPMM .MPM PPMPM +MM M MM M PMPP M +240+M MPM M vPMM+M M M PPPPM MPPM+ M MMPM PMM+ MPMMP PPM+ PPPM MPM+
..220+ M + m. MMM + ...... ..... A. .MM.200+ + 4 M , . + +
+*..+. * +*+, ~ 4...-.+-r.4. --. r 4........+...+...** ... +...+.. .*......* ..... + .....-- .+'+ +*"
.. ~4 . 8 12 16 20o 0 . 4 8 12 . 16 20 .... 0 . 4 . 8 ..12...16.20....0 . . . 8 ..... 2...... 8 _ _6 2ODATE,7401P2 DATE.74C123 DATE740124 DATEw740125 DATE740126
Figure 1Ze.

_ IEIG T. (KM) VERSUS YNIVERSAL TItE (HOURS)' P.PREDHEGHT. _ATF2 .... SHT ADJUSTED T_ MAXESITY
42 g + +M400+ + +380+ + +
36C+ + + +
34c+
M m M M320+ M
+ M + M P +
..300 M P m + PPM MM + PPM MPM M +
28+ P MPPPPMP M M + PP PPPM MMM + M MPMP M + MP MMMPPMPPM M + MM PPPPMP MM +
26C*PPM MW P MPPlMm + M MM PPPM +PP M M P MMMMM +MP MM M P MP P M +MP M P PPMPM +
24C+M MMPP M PMM+M MMPM PMM+ PMPM PMP+ PMMM M MPPM+ M MMMPP MPMP+
220+ + M + MM , M+ M MM M
200+......... +........ +.......... --..+...-. ..+.-.,.--+--.+... +.-+ . ---.+---+.. ..
c 4 8- 12 16 20 0 4 8 12 16 20 0 4 8 12 16 20 0 4 8 12 16 20 0 + 8 12 16 20
DATE974CI 7 DOATEo40128 DATE.740129 DATE-740130 DATE=740131
HEIGHT (KM) VFRSUS UNIVERSAL TIME (HOURS) P.PREDHEIGHT AT FCF2 MMEASHEIGHT ADJUSTED TO MAXDENSITY
420+ . +
400++ +
38C* + + +
36C+ + + + +
34C . . . . . + + +
32C + + M + +
300+ MP ...... MMMMM M + _PPIMM , + MPPM M +
280+ MMMPPPP MPPM + P PMPMPMM MMPM + PM PPMPPP PP + PP + MPMM MMMMPP M MPM +
o26C+ MtnM P P MP +MM P PPMM + MM M M PP MPP 4 M PPMMPM M+ P M M PM MPM
,. 240*+ -~PM PP MM+P .. M . M M MM PPMM MM + MPPMM MPtM PPPM MM+
220C MM + MM + MMM M M + MM
200+. .4___ .._._+,......+........ ......+..+. ... o +..+ * 4efl*,*.,. .+.... .... _.._ ._
0 4 8 12 16 2r 0 4 8 12 16 20 0 4 8 12 16 20 0 4 8 12 16 20 0 48 2 16 20
CATE,7402C DATE,74C2C2 DATE,740203 DATE.740204 DATE9740205
HEIGHT (KM) VFPRSUS UNIVEPSAL TIME (HOURS) P.PRED.HEIGHT AT FOF2 MoMEASHEIGHT ADJUSTED TO MAXDENSITY. 2C4 .......... .. .+.. ........... + + + +
40C+ + + + M
38C + + + +
_ _3 6 C + . -... .......... ........ ... ... .... .. .. ++ t
340+ + + M +
320+ M + M + MM MM + MMM +
30C0+ PP E M + MPMM MM PPMM + MPPP + PPPMMM MM. M
280+ IM MPPHP FPM -P MMPMMP MPM + PM PMMPPP MMM + P MPPMMM PP + P PPPPPP P
26C+ P M MM PM pM + P M pp MpM M+Mp M P PM PP +MP MM M MP MPM + M M MM -PPM *
S240+MPPP H M MM+MM MPPMM MP+PM MMMPMMM MMM+PM MM M M MM+P PPM PM+
220+ MMM + M + MM
20 + .. .... . .... .... . ... -- --- ------- + M + +__ C .. .......... ..... ---.........-- ...--------------------- + +..
C 4 8 12 16 :20 0 ' 4 8 12 16 20 0 4 8 12 16 20 0 4 8 12 16 20 0 4 8 12 16 20
. _.DATEP740206..... .. DATE.w740207 - DATEI74AO a AATL740i9 )ATE. r7 020 .
Figure 12f.

_ E_ UT *( KM VRSLIS U' I VEr.SAL TIME (HURS) - P.PRED.HFIGHT _AT FOF2 M-MEASvHEIGHT ADJUSTED TO MAX DENS IrY _ _ _
420+ . + +
.400* + + +
38C+ + + + + +
36 + + + + +
34C* M + + + M M *
32C0 M M M * M + +
3C PFP P .... ..... M..... MPPPM + PPM M + MMMMP
280C P MPPPMP MP + P P P MP PP + PM MPMP mPM MMP + M MPPP PM PP M + P MPP M
_.26C0 P m M MPMMM P p MPMM PMMM+M . M P PP .MM +MM MM PM PPM MP +MP MM__ PM MPMM +
24C+MM MMM P+MM M MPMPM M PP+PM MMP MM+P M PMMMM MM+P MMM M PM+
220 . M M + M
+ 0 4 ---- --.... +.__. . __... . .;-. ... - -- -- ' ' '&"------...... 4..4..4n4.+~+l +~ ~r~r~- , 44 r+.44CP~ 44*ee.........
'0 4 8 12 16 20 0 4 8 12 16 20 0 4 8 12 16 20 0 4 8 12 16 20 '0 4 8 12 16 .20
DATEm740C21 DATE74C212 .... DATE=740213 DATEu740214 DATE*740215
HEIGHT (KM) VERSUS UNIVEPSAL TIME (HOURS) P-PRED.HEIGHT AT FOF2 M-MEASHEIGHT ADJUSTED TB MAXtDENSITY
_ 42C . ... . .+. + ---
400+ + +
384C+ + + 4
_ 36 0 4 M +... . - .... __+ _-_ 4
34C+. + + +
32C* M M + MM + + M
___30C* M..PPP M ._ .. P M ..... P P P M. + MP P M
280' p MPPMPPP MP + P M PMPP P MP + MMMMPPPPPP MP +M MM MPPMMPMM M MP + P MPPPMMM MM +
- 260CMP M PP -P +MP M M MMM MPMM +MP M MMMMM PM MPMM + M MM P MPP MPMM + M MM M M MP MM
o 2C0+P. . M PPMMM . MM+PM M P M PM+P M..M MMMM M M+P MPPM M PM+M M MPM MM+
220 M + + M
+ +
20C . + ++
+ ... ...... . .. . ...
0 4 8 12 16 20 0 4 8 12 16 20 0 4 8 12 16 20 0 8 1 16 20
DATE,740216 DATE=740217 DATE5740218 DATEP740219 DATEq740220
HEiGHT KM) VERSUS UNIVERSAL TIME 6URS) i- P.PREDHEIGHT AT FBF2 M-MEAS.HEIGHT ADJUSTED TO MAXPENSITY
420* + +
4..400+380+ + + ' MM +
360+ + + +
34C . + . + + M +
320' MM . + M ,M M + MM + M +
300+ MMVP M + PMP MMM + PPM M + P MM M MM M + PPPMM M M M
280* MP MMMPPP MMM . + MM MMPPPMP M P + MM PMPPMP M P M+M P MMMPP pP PP +M.M MMM MP +
260+ P M v MPP MM +MP MP PMM MMMM+ p M MP ppMMPMM + PM M MPM PP +MP M P PP MPM +
2404M MP : MM+ M MPMM PP+MM MPP M PP+PM MMP MP+P MMPP PM+
S2 + ......... ....... ... -. ...... -.-. M 9 ..- 4..-- .---. 4
4 8 12 16 20 ... 0...A 162 0 4 8. 1 16 20 0 4 8 12 16 20 0 8 12 16 20
DATE*74C21P 0ATEo740222 DATEN740223 DATE*740224 DATE*7402E5
Figure 12g. __
.

-j E 1 rtKM...l ERSUS.. 'A I vEPSAL.T ImE US ------- ___
420+ ' . + + +.400+ + + + + +
36C+ + +
S.34 + + + MM M + M M - M . MM
.32 .MM ..... M ..... ... . ....... _ ... M. M. . ..__.___.._t . .M._ __ _eEtIIMPI.__ I_ _ ___300+ PPMM M + MPPPM M + MMMP M M + MP MMPPPMP PMP + P PPMPP PMP +
2804 P PMtPMM MMP , + PM;MPPPpMP MMMM +MP MPPPPPP M PM M + P M P PM MPM P M PM PM MMP-C4.26C+MM rM" PPM PPMM+ M .MP. -. PP.. MM M .MMM P M.pPP .MPtf..P --.. -.I PPL. -J PRtMr ti--__p__
240+P PMP PP+M MMMM PM+P MMPP' PM+ M M M+ M M M +220+ + + +
..200+ ............. .... + - - - -... + . .- _- . --- -
S 4 8 12 . 16 20 0 4 8 12 16 20 0 4 8 12 16 20 0 4 8 12 16 20 0 4 8 12 16 20. .DATE.74c226 . .. .DATE740227--.... . .. DATE740228 _.ATEaO30 DATE740302
HEIGHT (KM) VERSUS UNIVEPSAL TIME (HOURS) P.PREDHEIGHT AT FOF2 M-MEASHEIQHT ADJUSTED TO MAX,DENSITY
42C+. + + ..- --- _ 4-.-.
400C + + + +
380+ + + + + +
36C ........... ...... ......... .......- .... + - +
34C+ + M M +
320+ MPPM- + MPMMMM M M + P MM: + MMP + PPM MMM +
30C+. P..t PPMMMM P PPP . P PPMPPM .... P . + P, MMPPP .... PP ........ -M _P..?Mt.P.PP?-P- _ . MP ..
280+ MM MM P PHMMmm .+ P p P MMPM + P kp PMM PM + P MM MMP P MM + MM MM PM P MMP +
26C+H MPPM MP+M P PPM PP+M MPPPM M MP+P M MPMP M MP+M M PMPMM MPM+24C+ . MM MM .. ....... , M MM. MM+ M _. MM __ MM. ... M ..... M M M +
220+ * + + M + M
20C* + + + *
.....+....+....-*.-*- --- +---+-....-----+r-------------- *+4 4 *+.-+4* .i-+* . **3*+-! ... . 4+*r -44r.,.*..t.*
C 4 8 12 16 20 0 4 8 12 16 20 0 4 8 12 16 20 0 . 4 8 12 16 20 0 4 8 12 16 20
DATE*7403C3 DATE-740304 DATE=740305 DATEn740306 DATEN740307
HEIG 'T (KM) VERSUS UNIVERSAL TIME (HOURS) P-PRED*HEIGHT AT FBF2 MMEASHEIGHT ADJUSTED TB MAXDENSITY
420+ + + +
.40C+ ___+ - -__ -- - +
380+ + 4 + + .
360 + + MM + + +
340+ .. M + . MM ..... _____
.320+ MMPP M + MMP MM M + PMP M + MMM + MP HMM
300+ P PPPPP M + M MMPPMP PPP + MP MPMPP PPP .+ M PPMPPM PPM .+ MP MMPPMP MM PMP +
280C P.. MM P PM + P ... MP. M.MM .PP + P ..... -- .. ... PM1. . _ _M ....MM_ + P... MM. MMM..
.26CMM P M PPMM pppM MMMPM+M MPPPM M PM+P MPMM MMMP+M MMMMPP MM+
240+ MM+ MM M + MMM M + M M+ +
220 + M +
200 4. + +
..... ............ ...I- . ... + -- .......... ......... . _+. *l+.... +. L+_* .. * *+r.'* .+.***.......O *---- .
C. 4 8 12.. 16 . 0 4 8 12....16 20 ... . .. 8 120 .. 8 6.... - .7_ 16 28--
DATEa7403C8 D ATEn740309 DATEF740310 DATEu740311 QATEL740312.
Figure ,12h.

.HEIGHT.. (IK).. ERSUS UN IVEP SAL TIME_.(HBURS) P.PREO.*HEIGHT ... ALF E2 i.MASPEISTtH LADJSIED Te MAX.ENSLTY42C0* + + +
400+ + + *38C ++ M + M
360+ M +. M + MM + MM + 4
340C+ M M M + + M M M MM M +
32C+ PtM .+ PPMM MM MM + MPPP + PPP MM + M PPM MM M *
300* P P PPM + P PPPPP MPPP + P MPPMMP MPP M + P PMPPP PPP + P PPPMP PPP28C+ PM MM MM + FP MMM Mp MMM + P MM P MM MMMPM + P P MMP P + P P MMMMMMM *
26C+MM MtMp pMMP pM+M . MPPMP .. PM+M MMMp MPP+M M MPP_ _ MM+
240+ +MM M M MM 4 MM+ M MM
22C+ + M +
200+. + +...... ......... ww. . ....... 4.*... +.* +. +.* ++. . . .. ........ .. *
0 4 8 12 16 2o 0 4 8 12 16 20 0 4 8 12 16 20 0 4 8' 12 16 20 0 4. 8 12 16 20
DATE=740313 DATE74C314 DATEn740315 DATE.740316 DATEP740317
HEIGHT (KM) VERSUS UNIVERSAL TIME (HBURS) P.PREDHETGHT AT FOF2 M-MEASHEIGHT ADJUSTED Te MAX,DENSITT
... .20+.._ ...... . . . . 4 __00 + + +
380+ - + M +
36C0 ..... ... . . M M +
340+ M MM M MM + M M
320+ MMMH M PMH + MMP + PMP + PMP M M
S3004 P. PPPP P M t.... -_ 1PMM__ +PpPP-..... 4 .. M M ___ MM P PPPPP PP + PM M PM MPMMM +
28C0+ P . HH . M + P MMM M PMMMMM 4 P M P M PPM + P MMM PMMMMP M M P t- PP
-I 260+P PPPP M +P MPPP MM+M MMPPP PM+M MM PPPPM MP+M MPMM MM#
24C-M- mmm 4MMM I_ __ MM. -........MM + M+22C+ M + M M + +
20C+ + + *. ........ -....................... ..- +-+-...-..+--4+-- +.***.4W*4.. . ........
C 4 8 12 20 0 41"8 12-16 20 4 8 12 16 20 0 4 8 12 1620 -- 4 812 16 20
DATE=740318 DATEu740319 DATER740320 DATEP740321 DATEP740322
HEIGHT (KM) VFRSUS UNIVERSAL TIME (H6UPS) P.PRED.HETGHT AT FBF2 M.MEAS.HEIGHT ADJUSTED TO MAXDENSITY.'420+ + + + +
400+ ... ........... M .. ...... ....- +
.380+ + +.360+ , + M + +
+ M M . M+ M + MMM + MM M M':320 Pm M M Mu + PPMM + PMP M M + PPP MM M + PMP M M +
300+ P PPPm 1YMPP M + P PMPPPM MM PMP M + P MPPPMP PMPM. + M PPPPPM M MPM MM + P PMPPM PPPMM +
.280+MPM ,.M P P KMPPMM+MMM M P __MM MPM + P MM P P PM + P M P MM M PP + + M M P PPM
26C+PM M PPMP PP+P MPPP -PP+M M MMMM MM+MM M MMPP PP+MM PPP PP
240+ + + M + + M M*
220*+ +,. + .+
2004
0 ...+.*....,-+ .. .... +--.-+---+---+ -+--"+ +......*.*---..+4+- +-.---. +..+-. o+--..... .+.-H+,*..*,,.=
0 4 8 12... 16 20..... .... 8. 126__0_ 4 8 2 16 "20 0 4 8 12 8 19 16 20
0ATE4740323 . DATE,740324 DATE*740325 DATEm740326 DATE%740327
- -... Figure -l ._ 2 .i

.. E I GHT .KM). V ERSUS UNIVERSAL TIME _(HURS) --..-.- P-PREDHEIGHTAT A...F2._M-MEAS,HEI GHAI T J EDL .TB..M J irNSIL~42C+ + +"M + + +40OC+ + + + M
__ 380+ ..... .. .. ... .. - M + - _. -360+ + MM + M + M MM + . M MM
34C P M + M + M M MM MM. + M M + .M M +-32C* -.MPPM.. M +_ .-. MP _+ M.-MP-MM__ M__ TE M .______' .. _ P!_ PPPPP PPpM
300+ MP PPMmP MMP + M MMMMPm PPPMMM + P PPPPP PPPMM + P MMPMPM PPMMM .+ P M MMM P "'PPP2804 P MM fM P MpoMM + M MP P PP M+ P M P P PPM + PM P M. P PPMM+PPM M M P MP MMPM+
2604M ... PPP PM+M ... ..... PPP...... PPM .... MM .MPPP_.. _P+M ... P_ _ MP .M 1 _240*+ m + + M M
2204+ +2 0C . 4.-. .... .... ... ..
20. 4................................ ... +... 4..-- .-... +** .. .--+ .- *+. + ,* +* *+.*C 4 8 12 16 2o 0 4 8 12 16 20 0 4 8 12 16 20 . 0 4 8 12 16 20 0 4 8 12 16 20CATE.74C328 DATE a740329 . TE70330 ....... . D_.D AT7 Q L 3L .QA _ L __ _ _ _. 1
PEIGHT (KM) VERSUS UKIVEQS'AL TIME (H8URS) P.PREDHEIGHT AT FDF2 M-MEAS*HEIGHT ADJUSTED TB MAXDENSITY
400 F + M + +
380C + + M ' M + 4
36C+ ... M + . ......... ...... .. ..340+ M + MM . M M + M MM MM + MM
32C0 MPPMPPM PPM + PPPPPMM PPM + MPM PMP M PPP + MPPMMPP PPP + MpPMMPPPM M PPP 4
. 300C+ M ..... MM P MP . PPP . + .MM.' PM ... MPM . P .M P .. P.. .PP..MR.P..JIM PL.. Pf_.__ ___P. . E PPP + _
2804PP ,M P MmI PP+MP MMMM P MMM M MM+MP M PMMP M MMM+PPM PM P MM+PP MM M F MMMM MP*
260+MM. PM MMM+ PP M + M pp M + pp +MM MP M MM M*
w 24C4 . + t __+_ M_ 1 __ _
220C + + +
200+ ** +-* * + *- ,*I+* +++ .- '+ . .w .+ .. .+...... .. ...
0 ~ 8 12 16 2o 0 4 8 12 16 20 0 4 8 12 16 20 0 4 8 12 16 20 0 4 8 12 16 20
DATE=7404C DATE740403 DATE-740404 DATEn740405 DATE740406
h1EIGHT (KM) VERSUS UNIVEPSAL TIME (HeURS) P.PRED.HEIGHT AT FBF2 M-MEASeHEIGHT ADJUSTED TO MAX.DENSITY420 + + + M +
400 .... ... .............. ....... ............ ... ...... ...
380+ + + '360+ Mr + . MM M + MMM
340+ MM .. ..... .... - +4 - -- ...... + --- +
32C0 PPMPPPP PMP + PPPPPPPM MMPP + MPMPPPP PMP + MPPPMPPP M PPP + PPPM MPP +
3004 P M PM MM MPP 4 MM MP P PPPM + M MMMMP P MPMP + P PM MPM PPM + P M P MMMP +
280+PP M ,Pf. P MMPP+PP. .. M P.M..... MMMM.PP+MP ........... MM_.M PP .P .MMM P+P __ . M MPP
2 60+KMM M PM M+ M MMP M M+ M MMP . M M PP MM+ M P MM*
240 M *M M M M +M +
2004 .4+.... .....- --. -... 4n+.n ...... * ,u +.......... +. ... +-+.......4. 4.***+ . .*....+..l**. ... ,qqt..4,.4..
0. 4 8 12 16 .'20 0 4 8 12.. 16 .20... 0 ...4...8...126 - 20_ .0... .8 12._1._1 0 _P__1 28 1_20DATE*74C047 . DATE=740408 DATE0740409 DATE.740410 DATE740411
'Figure ,1Zj.

HEiGHT (KM) VERSUS UNIVERSAL TIME (HOURs) P-PRED.-EIGHT AT FeF2 M-MEASHEIGHT ADJUSTED TO MAX-DENSITT
420+ + + +
3 O0+ + + + +
360+ + +
340* MM M MM + M + M M + MMMM + M
320+. PPMMPMM PP . MPPMMMP MMMM .. + ...PMPP. MPMMM + PMPPPPP . PPP MM + MPPPPPM PM
300C M M P MMPP P MM MP P PMM + MM MM P P PMP M+ MMM M PPP MP M MM MP PM-- *
280+PP P M r 0oP+PPM MP P PP+MP MMfP MM MMP+MP M M MM P MM+PMM MM PM PM MM
2604MM MPP M + M MMM MM+ ... MM PM + MPM
240+ MM MHM M220+S200+ + ..
- - ..-.....- --................... .... . ....... .. ................ .... .. . ........... ... *
C 4 8 12 16 20 0 4 8 12 16 20 0 4 8 12 16 20 0 4 8 12 16 20 0 4 8 12 16 20
OATE740412 . : DATE=74C43 _ ...... DATE740 4 14 DATE*740415 OATEi740416
hEIGHT (KM) VERSUS UNIVERSAL TIME (HOURS) P.PREDHEIGHT AT FBF2 M-MEASHEIGHT ADJUSTED TO MAXDENSITY
S.. - - ' =____ ____ ____ ___ ____ .... ______ ___. ..._
.- --
400' . - 4380+ M M 4+ M *
36C+MM+ M MM MM M 4 M
340+ + MMM MM M M +M M + M MM +
32C0 PPPPPPp PMPM + PPPMPPP -PP + MPPPMP M PPP + PMMMPPP PPM + PPPPMMM PMM e
300C, Pm MM .MM Pm PMM .... ._PM P.... ---..P iP TMhM.. P P MPP M+ M m M P MM _MPMM_
.280+ PM M PM PM M MM+MPM M P PP+P M M M P M PP,+MM M MM P MM MMMPMP M M MM MPP+
'. 260+MM M pMM + + MPM + Mp MP PP
_ 2404.......... .M _.................. -- ____ M _+ .2
204 + + +, + M
200+ 4 + +...-.. +.... + .. +..... +.. ..,..... +...... ... .4 - 4. - -.+-.4 +-- -r --)~- -- *-----
0 4 8 12 16 2o 0 4 8 .12 16 20 0 4 8 12 16 20 0 4 8 12 16 20 0 4 8 12 16 20
DATE74C417 DATEm740418 DATEP740419 DATE*740420 DATE9740421
HEI GiT KM) VERSUS UIVESAL TIME (H6URS)+ PPRED-oHEGHT AT FBF2 M-MEAS.HEIGHT ADJUSTED TO MAX#DENSITY
420+ + + ++ +
+40 + ..... ..... ... ..380+ M M + M MM + M +
36C+ M + M + + + M M
340 M M MM + M M M MM
320* PPPMPPM P + MPPPPPM P M MM* PMPMPPM PPM MM + PPPMMMM PP + PPPMPPP
300+ PM M M PPP +M P MMMH P P PPM 4M PMM M M M MPPMM+ P M MP MMPMM+ MM MM P +
280+M .-. . PM .Pm .. PPPPM PPPPP .RP L M M PP+PP M M M MP MPP+PP P 4
260+ M MPM + M MPP + MM MPM *MM PP +M M MPP 4
240+ M . +
.220+ 4
4. -. .
4
2004 + 4 l....................... ......... . ,. .. .............
0., 4 .8. 12.. 16: 20..... 8 0 _ __ 2 16 20 0 4 8 12 16 20 0 4 8 12 16 20
S DATE8740422 DATE*740423 DATE 740424 DATE*740425 P- P7-1~E 426
Figure 12k.
dL

HE I GHTKM L.YERSUS UN IVERSAL T I ME._(HUBS) i__ ERPRE.HEIGHL A E~tOL_ MEASt EiQHLA vET A ±nI I _
4204 + + +400+ + +380 + - . ... . - - + +36C+ + M *+ + M .3404 + 4
+ MMM M MMM + M P M MM M320+ + MMPM + P......MP...MPPP_ __ _ MMP MMPPPPM
300 + + + P P M +M P M P MMP MMMM + PPPM P MP PMM+
280+ + + MM M +PP MMM P PP+P PPMP- - 26 + .. . . . ......- -........... . ...... . . ......... .+ MM PP + MP
24C+ . + ++ MM 4
220+ + + *
. .. 200+ ... ... ............ ........ ... . + . .. ._ .+.. -+.*+l**l* !-- +--!+!11+ l+ * * +---+.******+**+I-- +***+ **+r**+---+**!+*t +a- ***~** ** *~*t*****
0 4 8 12 16 2o 0 4 8 12 16 20 0 4 8 12 16 20 0 4 8 12 16 20 0 4- 8 12 16 20
DATE74C427 ................ DATE740428 ..-................... DATE-740429. DATEZ 30 _ E 01
HEIGHT (KM) VERSUS UNIVERSAL TIME (HOURS) P-PREDIHEIGHT AT F8F2 M-MEASHEIGHT ,ADJUSTED TO MAXDENSITY
S4C+ ...... .............. .. .-.............-.. +..... -............--.---... _______--__". -----400+ +
380+ M + M M+ M +- 36C+ ..... .. M . M. +.. ... M. - + .... ... _. M_ _340+ . M MMM MMM + M M + MMM + MM + MM M
320 + M PPPP U HMP PPPP + MPPP MPPMMP + ppp P + MMPPPM P M + PMMP MPPMMMPM *
300+ ..PP MP MP MP + MMP_.. .MP ... MM..P MM PPP. M ....... M+... P MM E . _ Pt_ ..M P__J MPM_
280+M PM P M MM+MP MM PP M P+PP MM P P+MM PP P+MF PMM M+
260+ P + MP 4 M + M + M P 4
220+ + + M + + -
200+ + 4
0 4 8 12 16 20 0 4 8 12 16 20 0 4 8 12 16 20 0 4 8 12 16 20 0 4 8 12 16 20DATE74C05C2 DATEs740503 DATEm740504 DATE740505 ATE?740506
HEIGHT (tKMi VFRSUS UNIVESAL "TIME (HBURS) P.PREDHEIGHT AT F'O2 M*MEASHEIGHT ADJUSTED TO MAXDENSITY
420+ +400+ .. ..38C+360+ H M M +340+ , H + .
320+ M MPMP MPPPp +3004 PPP PM H M +
..280+MMM. M PP M M +
260+ p+240+ M
.2 2 0 + - -+ ......... ....... - -.... ... .... . .... .
20+ +
.0 4 8 12 16 20DATEo740507 . +
.Figure 12-1.
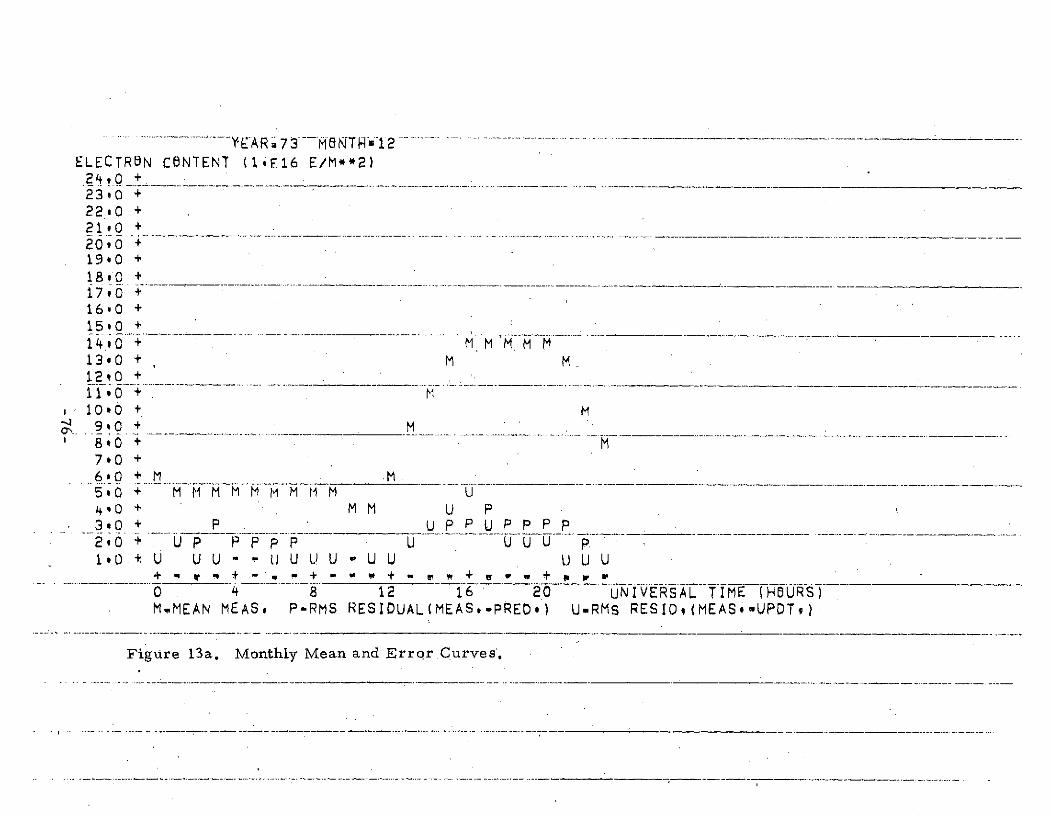
ELECTRON CONTENT (1El16 E/M**2)24,0 +23.0 +22,0 +21,0 +20.0 +19*0 +18,0 +17,0 +16.0 +15.0 +140 +. . M MM M M.13,0 + M M.1210 +
10,0 + M., 9.0 + _ _ _ M
8.0 + M7,0 +6,0 + M M5.0 + M i M M M M M M M U4.0 + M M U P3.0 + P . U PPU P P 2,0 + .U P PP P P U U U U p.10 . U UU- U U UU U U U U U U U U
+ q ~ + - ",, - + - " + -" w + u ~ + , p
0 4 8 12 16 20 UNIVERSAL TIME (HOURS)M.MEAN MEAS. P-RMS RESIDUAL(MEAS,-PRED.) U-RMS RESIDO(MEAS,.UPDT,)
Figure 13a. Monthly Mean and Error Curves'.

YEAR&74 MONTHm IELECTRBN CONTENT (1iF16 E/M**2).. t 0.. +.23,0 +22.0 +21 Q!0.. .+ .... . ...... . ..20,0 +19,0 +18!0..+'17,0 +1690 +15 !..+ .. _ .... ... ... . . __ _ _ _ _ _ _ _ _ _ _ _ _ .......14,0 + M MM13,0 + M M12..0 + .... .. ,11,0 + M M10,0 + M
8,0 + M M7,0 +
.. 0 ..... . _ ............ .........M _U _ ' .... ............ .. .... .. ......... _____....
50 + M M M M M M4,0 + M MM M M p P p p p310 . U . P. p P21.0 + U PPPPPPPPP U U U UU U'U U U190 + U U U U U U U U U U U U
S+ + + -r + g - + V -0 +_ ___
0 4 8 12 16 20 UNIVERSAL .TIME (HOURS)M-MEAN MEAS. P-RMS ,RESIDUAL(MEAS.,PRED,) URMS RESID*(MEAS,,UPDT,)
Figure 13b. Monthly Mean and Error Curves.

.. YEA . 4RNTR -2.
ELECTRN C6NTENT (1*E16 E/M**2)24,0 +
2390 +22.0 +21.0 +20,0 +1990 +18*0 +17,0 +,16,0 + M150 + . . . M M14,0 +13,0 + M M12.0 + M110 +100 + M
7 .,0 +7,0 + M- - 6.0+ - H--- -- _____---- ____ -- -- ------.- -^-.--._.. _1________ ___ ~___ ___
5,0 + M P P P P4.0 + M M M M M M M M MM P PP U U P3.0 + M U U U2*0 + P P U U U U U U1.0 + U U U U U U i U U U U U U
0 4 8 12 16 20 UNIVERSAL TIME (HBURS)M.MEAN MEAS* P-RMS RESIDUAL(MEAS,-PRED*) UVRMS RESID.(MEAS,-UPDT,)
Figure 13c. Monthly Mean and Error Curves .
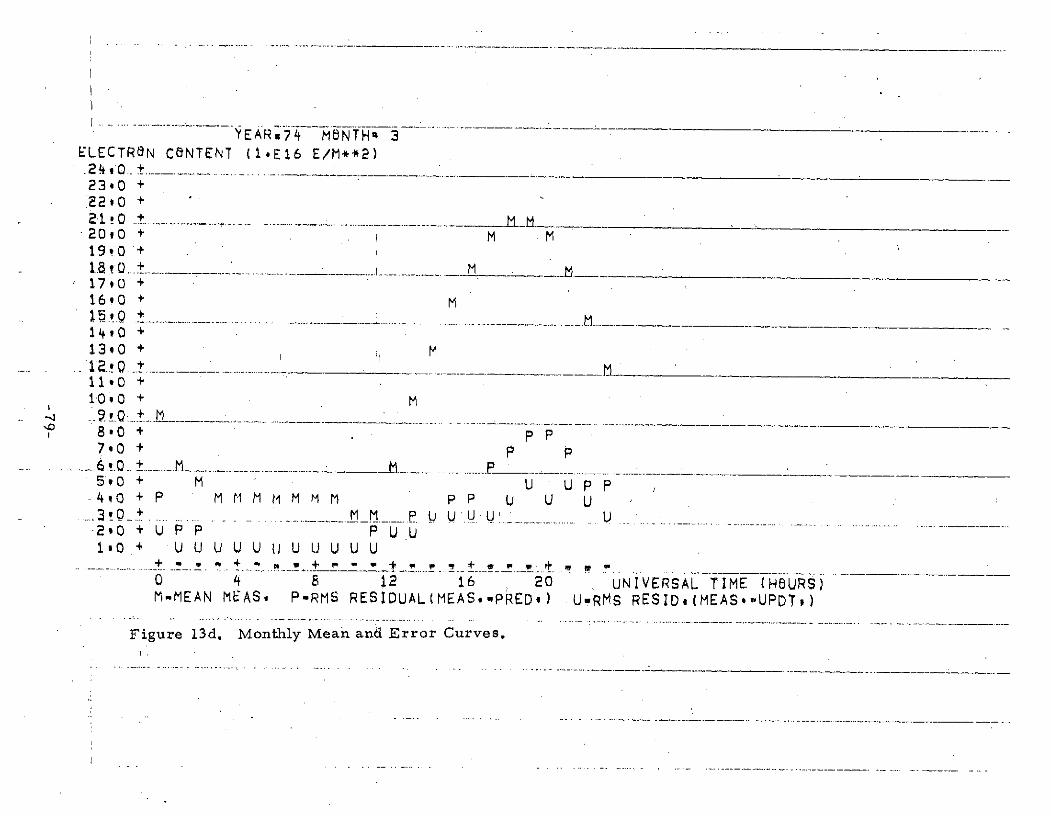
YEAR,74 MONTH" 3ELECTRON CONTENT (1iE16 E/M**2)
24.10.. t23*0 +22.0 +21 0 .+ . _ ...... ...... .. .................. . __ IZ i __20,0 + M M19.0 +18t0 1 ...+ -..... -_-__. A ......... M _ M17.0 +16.0 + M15,0 +14,0 +13,0 +
11.0 +10,0 + M..
_Q__.._+_.._
...
__.._._ _......S 8,7*0 +7.0 t p p........ .6 ..... M .. _ ..... I . .............. _ __ _ __
5.*0 + M U U P P.40 + P M M M M M M P P U U U230 + U P P P U UUU U
1s0 + U U U U U 11 U U U U U+ - . . q .'. + p - ~ - p * + w w v + i -0 4 6 12 16 20 UNIVERSAL TIME (HOURS)M-MEAN MEAS* P-RMS RESIDUAL(MEAS.-PRED.) U-RMS RESID#(MEAS.,UPDTP)
Figure 13d. Monthly Mean and Error Curves.

ELECTR6N cbNTENT (1#E16 E/M**2)24.0 +23,0 +22.0 + M21.0 +20.0 + M M
2~ ~~~ ...... ; ....... i' .........................- - --- -- -- - -- -19,0 + M1890 +.... ....... .. . ....... 8i0 i .- ___ __ _________ _ _
1790 + M1690 + M15.,0 +..................................................14.0 + .M M13.0 + M12.0 + M - _
11,0 + M10,0 + M9,0 +8,0 + - M U U70 + U P P P6,0 + M P UP5 0 p- M NP4,0 + M M MM M U U3,0 + U PP M M U U U P U
1,0 + U U U U U U U U U U+ - + - - -+ - we+*,+u +, wq yO 4 8 1- 1 20 UNIVERSAL T IE Ru-lRS)M.MEAN MEAS, P.RMS RESIDUAL(MEAS,.PRED,) U.RMS RESID,(MEAS.-UPDT,)
Figure 13e. Monthly Mean and Error Curves.
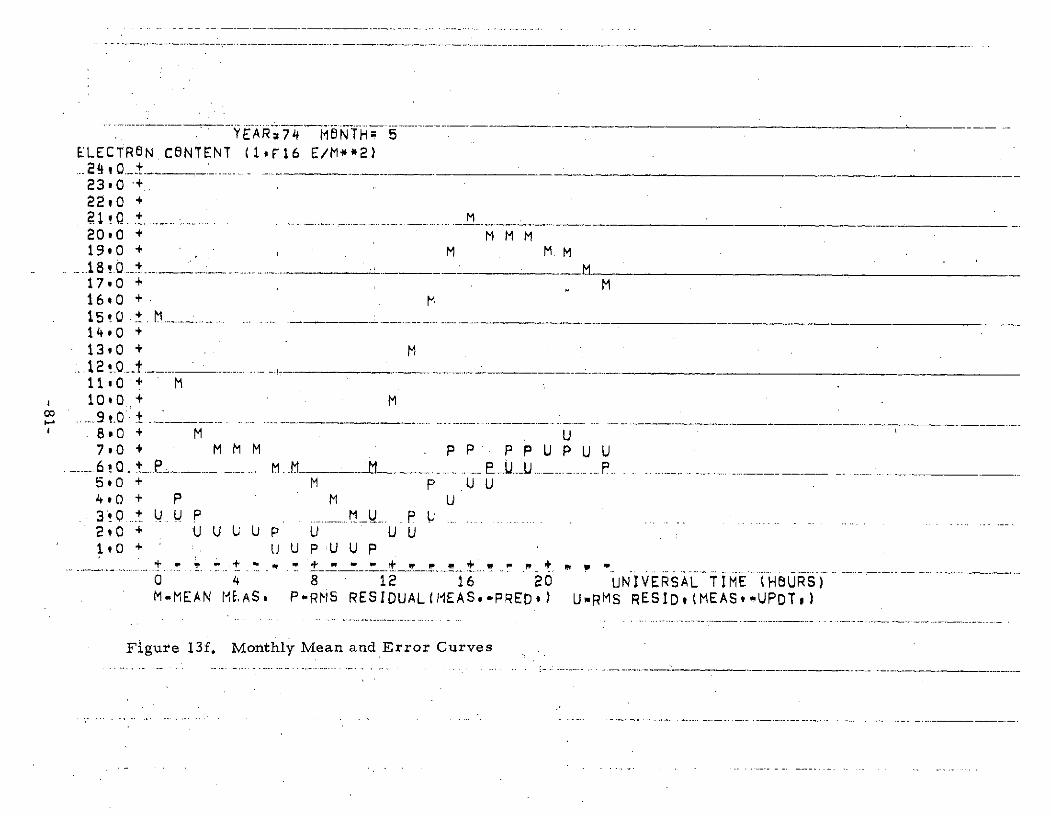
YEAR=74 M8NTH= 5ELECTRON CONTENT (1,l16 E/M**2).. 24 c O_ .+..23.0 +2290 +21~Q .... .... : ... ... ....... _ __ _ _ __ _ M20.0 + MMM19,0 + M MM
.. ..18.0 __ '____ _ __ M17,0 + M16,0 + . M15!0 M ... .....14,0 +1390 + M12! 0 -- -- -------11.0 + M1010 + M.. 0.. +.80 + M . U790 + M M PP PP U P U U. ....... ... MP U . ...... ........5,0 + M P U U4,0 + P M U3 0 U U P .......... M U ..p. .2,0+ UUUUP U UU10 + U UPUUP P
+ + + -. . * + + m0 4 8 12 16 20 UNIVERSAL TIME (HOURS)M-MEAN MEAS, P-RMS RESIDUAL(MEAS.-PRED*) U-RMS RESID,(MEAS,-UPDT,)
Figure 13f. Monthly Mean and Error Curves
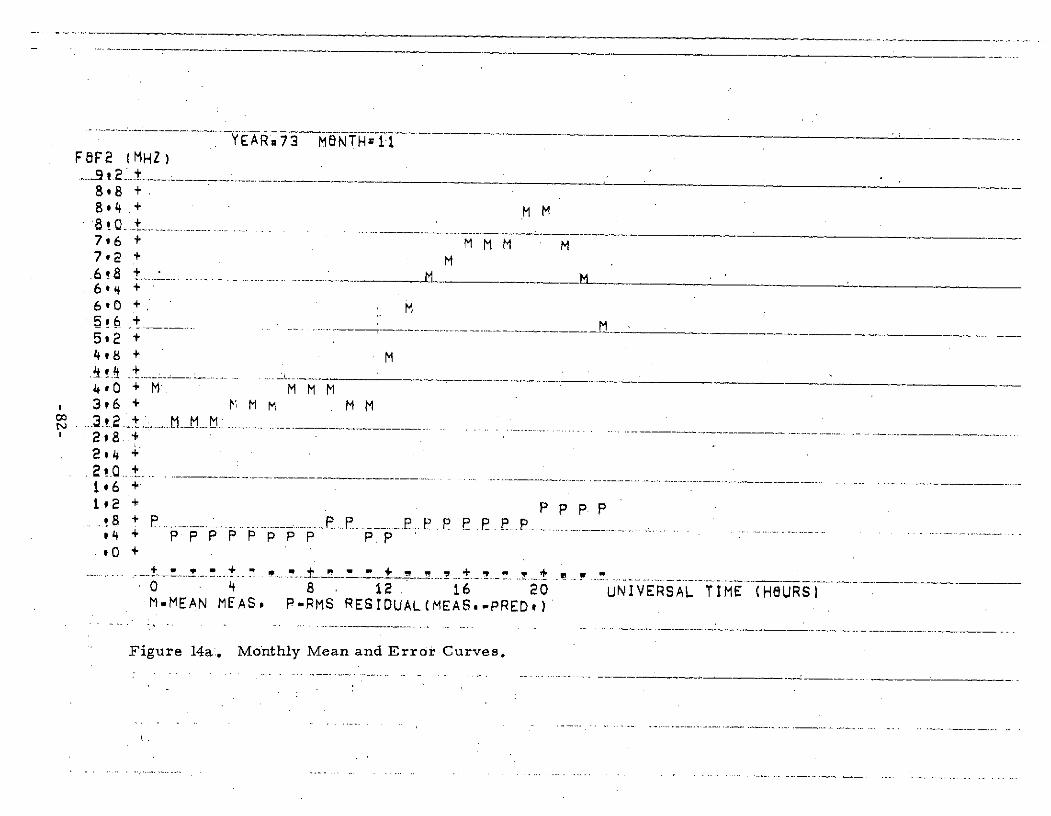
YEARm73 M6NTH=11FBF2 (MHZ)-3 t 2 -+..
8.8 +8o4 + M M:8 !0 ....+... ...... ...... ...7,6 + M M M7*2 + M.6 8 M ..... _ .. M _6*' +6,0 + M6 0 .M
5'2 +498 + M
4#0 + M M MM3,6+ NMM M M3-2 . + I.+ M-_M.. .___
2,4 42 .. . .. ..1.6 +.
,+ P P P p P P PP P -..
P4+ ppppppp PP.0 +
........... .... ++....._+... .. _. +. . . . , . -.-_.-._. .- .-.._. _ . . - -
O 4 8 12. 16 20 UNIVERSAL TIME (H6URS)M-MEAN MEAS, P-RMS RESIDUAL(MEAS.-PRED,)
Figure 14a:. Monthly Mean and Error Curves.
,. - - . - - - - - -
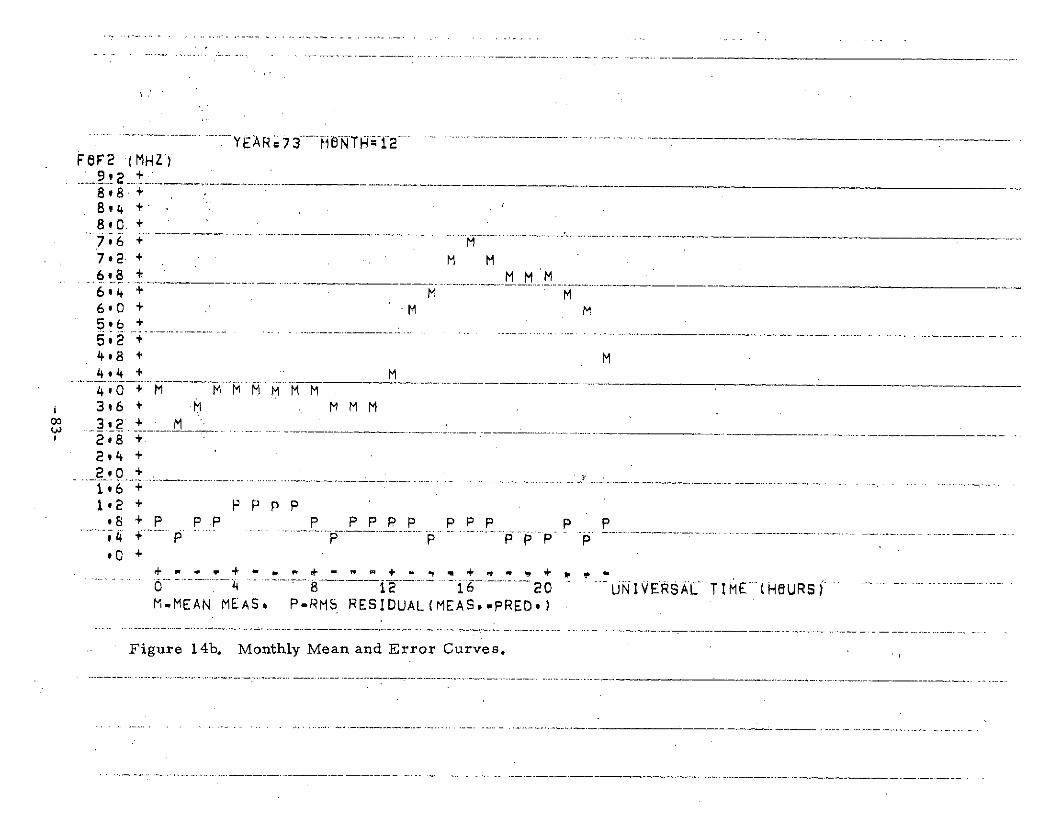
FOF2 -(MHZ)
8,8 +"8OF ( Y ; ------- -------
8.4 +m
61, + 4 M6*0 + M M5,6 +
4,8 . M464 +4 M.0 + M MM MM
3*2 +28 +
294 +2,0 +1,6 +
1,2 + p p p p,8 + P PP P P PPP p p P P.4 + P .... Pp . . P - -P . .... i ....... .*0 +
+ U - . + - + - ! + m , + , " w 4 , -
0 8 12 16. 20 UNIVERSAL TIME (H V -i..I- -URM.MEAN MEAS. P-RMS RESIDUAL(MEAS.-PRED,)
Figure 14b. Monthly Mean and Error Curves.

YEAR.74 MONTH: 1F6F2 (MHZ)....9 2 +_8,8 +8.4 +
7,6 +7.2 + M
6,4 + MM MMM6.0 +5 r 6 .N ..... .. ............ ................ ...... ..........................
_5,2 +"4,8 +04 ____ ___ M
M MM-4,0 + M M3,6 + M MM, M M MM
c ... 3'2 + M__ __ _ _ _ _ _ _ _S28 +
2,4 +
240 +
0 ++ -. - + - + - U .* * + I + • - U + , -.
O 4 i 8 12 16 NIVERSAL TIME (HOURS)M-MEAN MEAS. P-RMS RESIDUALIMEAS,-PRED,)
Figure 14c. Monthly Mean and Error Curves.
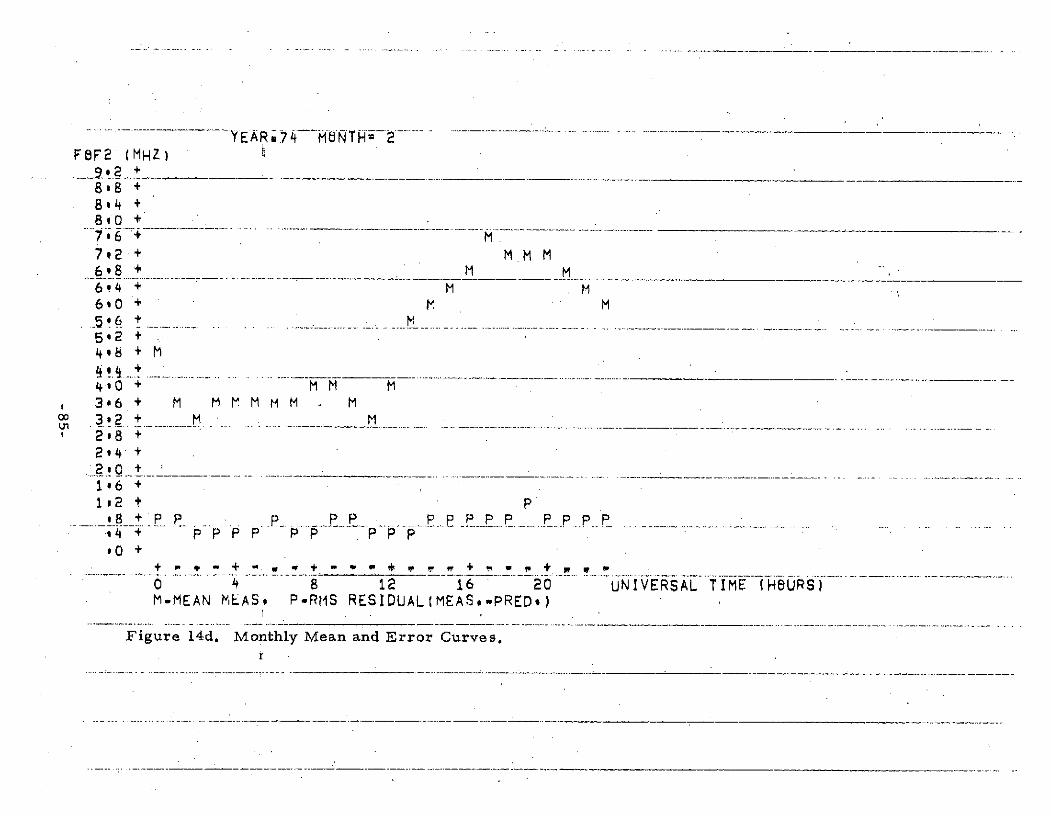
........ ......... --.-- -. .... -E R • .7 4.--M-i- -- - .. .. . .FBF2 (MHZ)
__ _2 +
8,8 +8.4 +8,0 +
7,2 MMM6,8+ M. M
6*4 + M M60 + M M5*6 +0 M . -- -.- -5.2 +498 + M
4,0 + MM M3.6 + M M r. M r M M
o 3,2 + M M2o8 +2*4 +2 0 +......1*6 +1,2 + P.8 + P P P... - P P P P P P P__ P P P . -44 + P P P P P P p p p.0 +
+ + " + " - - + -V + - +. w R0 4 8 12 16 20 UNIVERSAL TIME (HBURS)M-MEAN MEAS. P-RMS RESIDUAL(MEAS,-PRED)
Figure 14d. Monthly Mean and Error Curves.
- --- --- -- --- ------- ----------- -.-. .~.-I- .- -- --- - - - --. -~..- I-.

YEARx74 MONTH= 3FBF2 (MHZ) i:
8,8 +8o4 +8 I0 .. . - - . .... ____ M ... __
7v6 + M M M M792 + M6 .8._ +.... ... ..... .... M M6,4 . MM6*0 +5 M.6 +_ ..M . . -... .. ... . - tM _ ____ _5,2 +498 + M4,4 + M... - - 4 . . .. M . .. ......... .....4,0 + M M M3,6 + M M M..2.+. M M2@8 +2,4 +
16 + P1,2 + P PP P P P p p p
. ... . . P. P. ._ .......
.......... ... ........ .... -______
I@4 + P P p P P P P P
'0 ++ * r - + + +.. _._ , . + w ...o 4 8 12 16 20 UNIVERSAL TIME tHOURS)M-MEAN MEAS* P-RMS RESIDUAL(MEAS,-PRED,)
.Figure 14e. Monthly Mean and Error Curves.
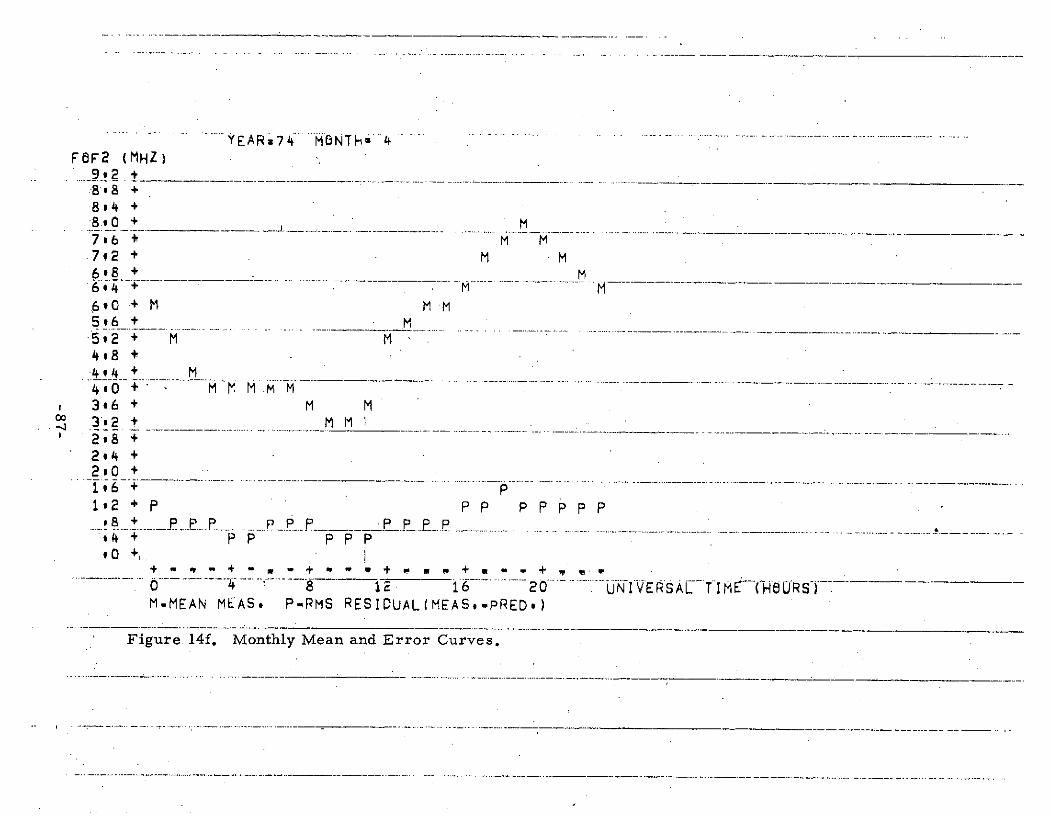
Y.... E A.. 7 4 .. NT 4 .. ..... . ...........
F8F2 (MHZ)....9,2 +8.8 +8,94 +8.0 + , M7,6 + M M792 + M M6,8 + M6,4 + M .M
690 + M M M5,6 + M5o2 + M M4v8 +4,4 + M
3,6 + M Mc 3,2 + M M
2,8 +2.4 +2,0 +
1,2 + P PP p p p p..... P.------.... .
- -.. .-... ..... ... ........ .....
*4 + P P P P P,0 +,
+ - , - + - W + g o + a. p + 0 + 9 ,-
O 4 8 12 16 20 UNIVERSAL -TIM -(-H URS)M-MEAN MEAS, P-PMS RESIDUAL(MEAS,-PRED*)
Figure 14f. Monthly Mean and Error Curves.

YEAR74 MONTH- 5F8F2 (MHZ).... 2.. ...... ......
8,8 +8.4 + M8,0 + M7,6 + M M M M792 + M M M
....6 .8 . ..M I .6.4 +6v0 + M M
502 + M M48 + M M M. M.. ... .......... _ __..__. . .M...____ __4,0 + M M3.6 + M M3 1 2. +2,8 +2,4 +., P. _ _. ___ . _ _....._ __.. _...:_.P.1.6 + p p pi2 + P P P p p p
8 + PP...P P p p _ _ P .
4 . P*0 +
+ 0 . *+ - . , + V * " + a + V . , a * ,0 4 8 12 16 20 UNIVERSAL TIME (HOURS)M.MEAN MEAS,. PwRMS RESIDUAL(MEAS,,PRED,)
Figure 14g. Monthly Mean and Error Curves.
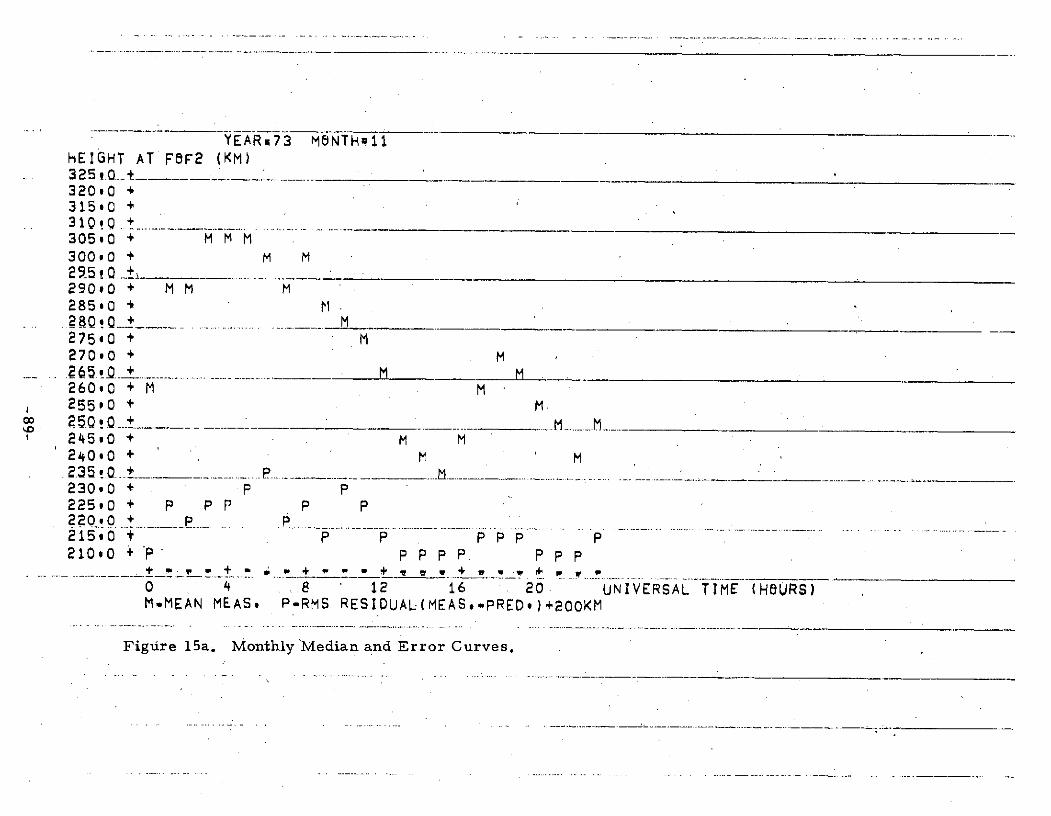
YEARm73 MONTH 11HEIGHT AT FBF2 (KM)325 t.O..0_ ___320.0 +315.0 +3 10 Q. + _........ _... . .. _... ... ..............305,0 + M M M300.0 + M M29_5 ! O..-_t . ..290.0 + M M M285*0 + M
SM... Q,.Q_ .............. .... M275,0 + M27090 + M2 6 65.;.-. _ ... .. . ...... .... ... .. M M260,0 + M M255,0 + M25.Q Q + M M.... __._... _245.0 + M M240.0 + M.. 5 ....... P_ ..... ... .... .. .......... .... ...... , .. .................... . . I ___ __ __230.0 + P P225.0 + p P P P P22Q.0 + P215.0 1 P P P P p p210.0 + P P P. p PPP
W . ,+ .3. + P+ w + . - W) , _ _ __+_V
0 4 . 12 16 20. UNIVERSAL TIME (HBURS)MIMEAN MEAS. P-RMS RESIDUAL(MEAS.*PRED*)+200KM
Figtire 15a. Monthly Median and Error Curves.

.... .. .....: ... ... . ..Y'E L -A; R -7 *3 ---H O N 'T H 1 2 ...... .... ...... .... .. ... ......... .... ...... ..... ..... ....... .HEIGHT AT F8F2 (KM)325,0 +320.0 +315,0 + M310.0 +305 0 " + M - - - -------- ------ -- ---------.--- ---.--..-.... ... . ___300.0 + M295,0 * M . M M M M M29090 + M285,0 + M280,0 + M275.0 +270,0 + M265,0 + M M M260,0 + M255.0 +2500 +
S245*0 + MM M M240,0 + P P M235.0 + M230.0 + 6 p P P P225,0 + P p P P p220*0 + p P p p Pp215,0 + P pp210.0 .+ p P p
+ * * " - - +' * * + p + p .-- 4 8 12 16 20 UNIVERS LATI ME HH6 RS)M-MEAN MEAS, P-RMS RESIDUAL(MEAS.-PRED,)+200KM
F4gure 15b. Monthly Mean and Error Curves.
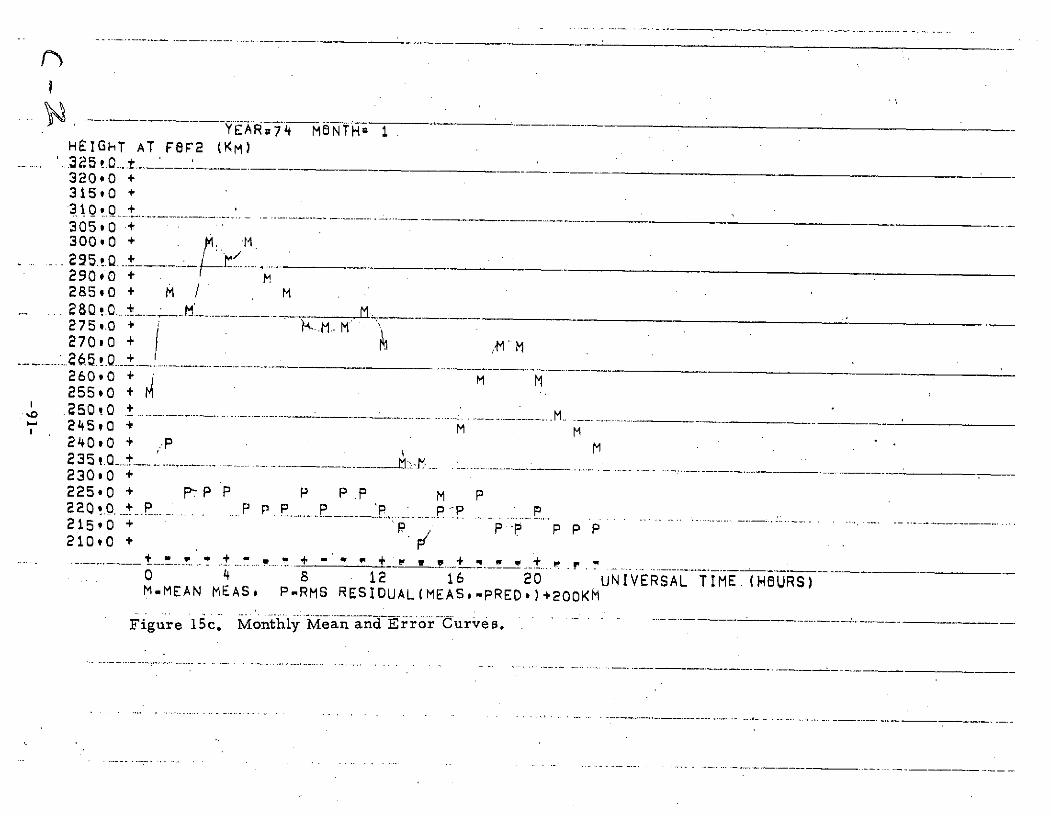
YEAR 74 MNTH2
HEIGHT AT FBF2 (KM)
32090 +315,0 +310*0 +305.0 +300.0 +
2 9 5.!. 0 +290,0 + I m285,0 + M i M280 ,....+.. ._____ ' ..__ _ __ _ _ _ _ _275,.0 + .. M27010 + ,M
260,0 + M M255,0 +M.2500 +245.0 + M M240,0 + ..P M2351.0.... .- .... _.... . .... .. -230,0 +225*0 + FP-P P P P P M P220.....+.P P P. P . P.' p...21590 + .p -P.- PPP210.0 +
+ t. + _. .. +.. ..... _+0 4 8 12 16 20 UNIVERSAL TIME (H6URS)M-MEAN MEAS. P-RMS RESIDUAL(MEAS.-PRED*)+200KM
Figure 15c. Monthly Mean and Error Curves.

HEIGHT AT FBF2 (KM)325,0 +320,0 + .31590 +310,0 +
300.0 +295*0 + M M
290,0 +285,0 + M2800 + MM M
25s"- -~-~ --To + ---
270*0 +265,0 +' M M M M260 90 + M255,0 + M250*0 + M
N 245.0 + M M24040 + M M235.0 + M2.300 + P PP P225,0 + P P22 .0 + ....P .p......... P PP ... P. ..P P215,0 + . P p p p210,0 + P p p
+ . + + - + , - + - . . *
0 4 8 12 16 20 . UNj ERSAE I ME-HlR -RSM-MEAN MEAS. P-RMS RESIDUAL(MEAS.-PREDO)+20OKM
,Figure 15d. Monthly Mean and Error Curves.
.. ...... .. - - - - - - -

YEAR=74 MONTH= 3HEIGHT AT F8F2 (KM)325. 0 + M _320*0 + M315,0 +310 .+ .......... . ... ...... M.......... ... .M .305,0 + M .M300,0 + " M295__0. +_ ___ _ ______290,0 + M285.0 +2800 ,--0 .. ------------- .... ......... _ _..275,0 +270.0 +2.65 0 + -M M260.0 + M255,0 + M M250Q.!.Q. +24590 + P P240o0 + P.2 .!Q_+ R____ _------ ______ __230,0 + P P .,R225.0 + p P p -p2 ..t _... P P - _ . .. . __ .. P.......215,0 + p210.0 + P..
+ *. . + _ + + -+- p U + + P P + B w _ _ _
0 8 12 16 20 UNIVERSAL TIME (HOURS)MqMEAN MEAS, P-RMS RESIDUAL(MEAS,-PRED,)+200KM
Figure 15e. Monthly Mean and Error Curves.
. . .- ... .. ... .- - --- -- ..-.-..-----...... ... .. ... . .

YEAR 4M 4 ONT .; .- - - -_
HEIGHT AT FOF2 (K,M)325,0 + /+. . + +320*0 +M315*0 + M /M310*0 + M M
300*0 +295.0 +290,0 +285,0 + M MM28090 + M. •'275,0 + •" -
270,0 + M-265,0 +260,0 + M F255.0 + p250*0 +) .............. _ _______________245.0 +240o0 +
... 235_9C _.- ... ..... ...............____ _:_ ___ p._230o0 + , , p p p225.0 + p P P p p- p22090 + P P P2150 p
-
210.0 ++ , , - 4 - , - + I + + ,t
O - 8 12 16 20 uNI iiVE RSAL TIME (HLjURS -M-MEAN MEAS. P-RMS RESIDUAL(MEAS.-PRED,)+200KM
....... Figure " 15f;.. - Monthly-Mleam-annd-Errr orCurves. - - - ---.
---- --. -.. .--- --. -.- ---- ,-- -.. .-. .--- --- --- ---- - .- .- . . - .-.-.--- -.-
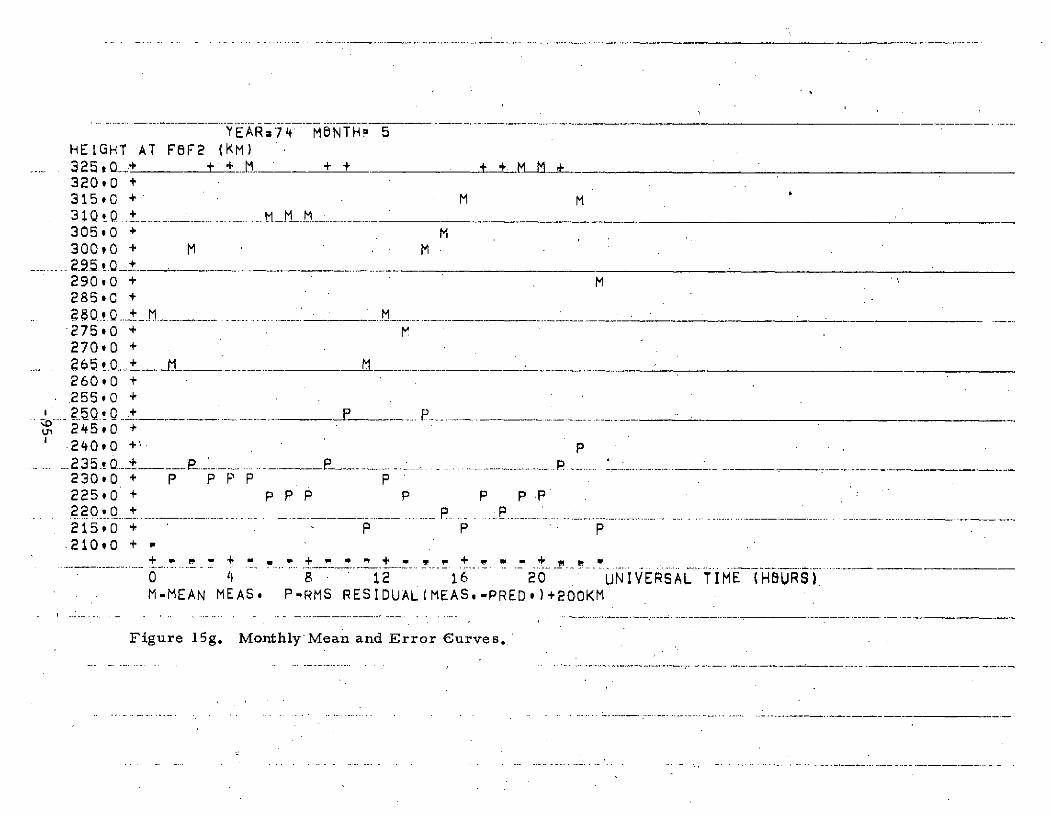
YEAR=74 MONTH! 5HEIGHT AT FBF2 (KM)3250+ t M + + + M +320,0 +315.0 + M M3 0 0.. + MIQM !M -__305,0 + M30090 + M M
.... 29 5. !.t +290,0 + M2850*C +
SQ ... + M . .. . . ..... Q_!_ __ _ _ _ _M
275,0 + M270,0 +
. 65._t + . M M____ ____260*0 +255.0 +250 0
.+ ____P _P_ _ _ _ _ _ _ _ _ _ _ _
S245.0 +240,0 +' p
..... 235. .0._. . . ___ P . . .. .. ........... ...... --..... ..-..- - ___
230,0 + P P P P P225,0 + p P P P P p .P220.0_ + P P
215,0 + P P P210,0 +
+. . , - + a- . + ,+ , s + V + .
0 4 8 12 16 20 UNIVERSAL TIME (HOURS)M-MEAN MEAS. P-RMS RESIDUAL(MEAS,-PRED)+200KM
Figure 15g. Monthly Mean and Error Curves.

Table 5a. Monthly Mean Statistics.
YEAR.73 MONTH= 11MEAN MEASUREMENTS RMS RESIDUALS DAYTIME RMS % ERRORS
.LL..._NL , EEL2 M.. _ NI _EL BE2_ HM .NTA.UEUDTI NTP) F8F2 HM NT(U) NeLP.BINTS
0 *000E 00 3.88 261.0 000E 00 ,97 1293 .000E 00 0 20 20 0Si000o0.._O 3.16 2.90Q3 ... 0. QE..00 .56__2.1A_. 000E0....0_. Q_ 0 0 Q..Q_2 *CODE 00 3.18 289,5 OO00E 00 *27 21.0 .000E 00 0 22 22 03 *COOE 00 3.37 306,6 000E 00 .39 227 00OOE 00 0 21 21 04 * 0QQE_ 00.. 3.~~. _. 0b5 ...00. E !. _39_ 25.t3_.Q.0OEO . 0 3 23 05 ,000E 00 3v58 3032 .OOO00E 00 ,50 30l8 OO00E 00 0 23 23 06 ,COOE 00 3.74 301,9 OO00E 00 .53 33*3 .OOOE 00 0 23 23 07 .COQE 00 _3.90 288.888_ .OOoE 00 *52 21.5 000E 0 0 23 23 08 ,COOE 00 3.91 298.6 OO00E 00 v56 25o2 .000E 00 0 23 23 09 ,000E 00 3.98 286o7 OO00E 00 ,91 15,6 OOOE 00 0 23 23 0
_..Q..QE _Q.Q 3-57 2808 QQ0_E 2Q81.__0. iQQ.E0. 0 .0 22 22 011 COOE 00 3.44 277.4 ,O00E 00 .44 27,4 .000E 00 0 20 20 012 ,COOE 00 4,88 265,6 OOOE 00 .59 1491 000E 00 0 21 21 0.1 13 0.0OE 0 OQ.... 6!17_ 96 ! 00E9 .98 . 2 1000E.0_.O0 ........ 1 *0 0 0.D._2O. 0 Q_.Q..14 ,COOE 00 6,85 238.6 OO00E 00 *84 10.1 OO00E 00 .0 12.3 4o2 *0 0 20 20 015 *COOE 00 7,34 237.3 9000E 00 .73 11*4 OO00E 00 *0 10*0 .498 .0 0 21 21 016 QE 0 _2* 2OQ 24 00 QQ.00E0 . 1018._ ,QQE 00 ___ 03 4Q 0 0 21 21 017 ,OOE-00 771 259.1 *OOOE 00 .78 16.6 ,000E 00 .0 10.1 6.4 *0 0 22 22 018 ,000E 00 7.70 269.1 OO00E 00 ,70 16*9 OO00E 00 ,0 9,1 6,3 .0 0 22 22 019 ,COOE 00 834 264.1 OOOE 00 ,88 14,1 ,000E 00 90 0106 5.4 ,0 0 21 21 020 000E 00 8,32 253.8 ,OQOE 00 1.05 12,1 .00E 00 .0 12.6 4.8 .0 0 22 22 021 000E 00 7.72 248.3 OO00E 00 1*05 94 .OO00E 00 .0 13.6 3,8 0, 0 22 22 0.22 0E .Q .... 2395 .00 ... O 21 1 1 O ..0 ........ 17 5 .... 9 Q ...Q 21 21 .Q23 *COOE 00 5.54 250.4 ,OOOE 00 1.24 12,7 OO00E 00 .0 22*3 51 0,O 0 21 21 0

Table 5b. Monthly Mean Statistics.
... YEAR 73 M6 NTH~ 12 ................ ____.......
MEAN tEASUREMENTS RMS RESIDUALS DAyTIME RMS % ERRBRSUT NT FOF2 HM NT(PRED) FBF2 HM NT(UPDT NT(P) FF2 HM NT(U) NBPBJNTS
0 *563E 17 3,82 293.5 *146E 17 *63 41,7 .119E 17 12 9 9 91 *507E 17 3t33 .286.7 ,189E 17 .43 31P0 '150E 17 -12 9 9 92 510 1i7 3,51-305.1 - .233E 17 .;69 293 1E 17 12 10 10 103 *536E 17 3:81 303.1 *263E 17 1,00 19:4 .655E 16 12 10 10 104 *526E 17 3990 301.1 *244E 17 1,09 25.6 .481E 16 12 11 11 115 :531E 17 393 296.4 *232E 17 1,03 28,2 ,431E 16 12 11 11 116 ,519E 17 3t95 290.5 *226E 17 1.12 27,0 .525E 16 12 11 11 117 ,507E 17 4,1.9 294.9 ,178E 17 1.15 24,7 ,938E 16 12 9 9 98 ,470E 17 3.88 296;1 i116E 17 ,65 21o2 .673E 16 12 11 11 119 *459E 17 3976 315.2 ,991E 16" .53 41,0 .904E 16 12 11 11 11
10 9445E 17 3.73 303,3 ,149E 17 ,72 2914 .484E 16 12 10 10 1011- *442E -i7 363 2975 *13317 .61 23.6 -634E 16 12 11 -T 11
' 12 ,588E 17 4,30 279,3 ,113E 17 ,61 16:4 *935E 16 12 11 11 113 13 ,914E 17 5,97 240,4 ,159E 17 .77 8*3 *233E 17 17.4 12.9 3.4 25.5 12 10 10 10
14 *113E 18 6,53 247,1 ,290E 17 ,47 18,5 .256E 17 25,7 7 2 7.5 22,7 12 11 1 1115 *131E 18 7.24 244.7 *341E 17 .72 21.7 .359E 17 26.1 10.0 8*9 27.5 12 10 10 1016 *144E 18 7,65 236,8 .,316E 17 .84 8.5 .484E 17 -21.9 10,9.9 36 33,5 12 11 11 1117 *146E 18 7.07 246.7 " 421E 17 ,70 17-2 316E 17 . 30,1 . 99 7*-0 22.6 1--2 1111 11-18 ,141E 18 6,98 265, *348E 17 .55 14.5 ,185E 17 24' 6 7,8 594 13,1 12 11 11 1119 9145E 18 6,86 267.7 *252E 17 ,53 25,7 .152E 17 17,4 7.7 9.6 10,5 12 12 12 1220 - f44E-- 18' 6198 266 0.263E 17 58 216 *4 .173E 17 18 .2 8.2 81 12.0 12 1- 1"2 1221 *126E 18 6.50 258.4 ,260E 17 65 19,2 ,974E 16 20.6 10,0 7,4 7,7 12 12 12 1222 *102E 18 5.99 246.9 .-172E 17 ,40 12.1 .846E 16 16.8 6.7 4.9 8,3 12 11 11 1123 ,754E 17 471 267.2 ,124E 17. .68 28,0 ,115E 17 16.4 14 4 10.5 15.3 12 10 1010
. . . . .. . .. . . . . . . . .-- - - . . . . . . .. ... .. .. . ...

Table 5c. Monthly Mean Statistics.
YEAR.74 MONTH= 1MEAN MEASUREMENTS RMS RESIDUALS DAYTIME RMS % ERRORS
S.... . N..... .M._.. .NT.(eRE )_ BE2 HM HM.( U.( t LLE_F_L 2 HM T.ILU) N. L! _I NTS
0 *531E 17 3.75 255,9 ,219E 17 ,77 18,7 ,176E 17 30 26 26 25S1 441E 17_ 3130 28,?7 190QE.1 . 79 38'6_15E 17 __._.SE___. 30 26 25 252 *436E 17 3.46 281.1 ,186E 17 ,76 24,6 .569E 16 30 25 25 243 ,438E 17 3.47. 299,9 ,178E 17 .74 27,4 .671E 16 31 27 27274 *53E 17 3i55 295o8 *185E 17 @85 23v9 *553E 16 31 2 24 245 *470E 17 3,72 299,4 ,184E 17 .88 19.8 .621E 16 31 24 24 246 *509E 17 4t02 292.3 ,191E 17 1,02 19.4 .645E 16 31 28 28 287. * 5E 17 .. 40 2864 . 19017. 1- ..20 h 3115E-1.7..r ______ 3L 28 27 288 *562E 17 4.47.27b.1 ,167E 17. 10C9 23,4 ,112E 17 31 24 24'249 ,503E 17 4.11 275.6 161E 17 1.00 21.6 .135E 17 31 26 26 26
10 .9.2E 17 3.65 2774 1E 17 -2 26.8 65E 16 31 23 23 2311 *394E 17 3.45 281.0 9120L 17 ,71 25,2 .682E 16 31 25 25 25
112 ,459E 17. 376 273.3 ,138E 17 s56 17,8 .788E 16 31 27 27 27.13. 8 0 4 E 1A7 5. 3. 16E 11 9- .3 1F-17-.. 2O2 15 .9.- _28_3 1 ?27 27 27_14 ,989E 17 6t25 233,2 ,297E 17, .54 11,1 .253E 17 30,0 8.7 4*8 25*5 31 26 26 2615 *111E 18 6,28 227,1 ,398E 17 74 19.7 .209E 17 35,8 11*9 8.7 18,8 30 28 28 2716.. 12ZE1-6.6At._3, .0 4Q.E 17 81 2123 4_,2~E82_17 31!7 12.. 8_.r8-19r6 30 ?7 2 26 _17 *142E 18 6,73 260,4 .408E 17 ,92 24,8 ,240E 17 28.8 13.7 95- 16.9 31 26 26 2618 *151E 18 7*06 268.6 ,406E 17 .81 16.7 ,234E 17 26.9 11,4 6.2 15,5 31 27 27 2719 ,144E 18 6.96 270,b .341E 17 ,70 14,3 *176E 17 23,7 10.1 5.3 12.2 31 26 26 2620 .135E 18 6.59 261.3 .340E 17 .74 21.8 .201E 17 25,1 11.2 8.3 14.9 31 28 28 2821 .127E 18 6.47 251.3 ,354E 17 ,82 15,7 .167E 17 27.9 12,7 6*3 13,2 31 29 29 2922 113E 18 629 244t8 28E..... 8_7 .67 12,6 .2E.17 255 .106 .... 5!118.8 3129 2 9 2923 *847E 17 5E47 239,9 *288E. 17 *97 12,6 .173E 17 34.0 17-7 5.2 204 31 29 29 29

Table 15d. Monthly Mean Statistics.
. . . . . . YEAR .. MONTR 2MEAN MEASUREMENTS RMS RESIDUALS DAYTIME RMS % ERRBRS
UT. NT F hF2 HM NT(PRED) FBF2 HM NT(UPDT) NT(P) F6F2 HM.NT(U) NOBPBINTS
0 ,639E 17 461 251*9 *165E 17 *80 11.6 ,874E 16 22 25 24 .191 *446E 17 3t59 256.8 *14.9E 17 .89 22,4 .599E 16 22 23 23 182 ,385E--17 . 3;38 2963 .-102E I -17 . 7 31i .54--52E16 i 2-25-24 --T93 *384E 17 3,44 302.6 *885E 16 .40 25,7 ,693E 16 22 27 26 214 #399E 17 3,49 305.2 *912E 16 959 22,0 .658E 16 22 24 23 19. -396 7 3,62 294.3 .i06E 17 ,56 17.6 ,93E 16 19 27-9 7 186 *406E 17 3.72 28C.6 ,113E 17 .67 20.8 .774E 16 20 26 26 1.87 *433E 17 3.70 282.5 .102E 17 ,47 18.9 .688E 16 22 26 26 218 4 47E 17 3.85 284.2 .993E 16 .52 185 ,825E 16 22 26.26 209 #431E 17 3.83 276.2 ,118E 17' 70 25,7 *901E 16 22 24 24 19
10 ,376E 17 3.50 277.0 ,124E 17 .66 3091 ,639E 16 22 22 22 1711 ;323E 17 3;26 282.6 .i11E 17 ,48 277 ".720E 16 22 26 25 20
S12 ,479E 17 3:99 257.6 :174E 17 .36 12.8 .144E 17 22 26 25 20S13 *828E 17 5.57 235.1 -239E 17 ,39 17,0 .209E 17 28.9 7.0 7.2 25,2 22 26 26 2014 i07E 18 6,07--241.7 36"i -17 .-70 .. 15;6-.26 50E -1 i 3317-6 6i5---;5 23 23 28-28-2315' 132E 18 6,58 242.0 ,381E 17 ,63 17,8 .236E 17 28,8 9.6 7.4 17*8 23 28 27 2316 *151E 18 6.90 266.7 *409E 17 .70 29.4 .266E 17 . 2791 101. 11.0 17*6 22 28 27 22... 7 68E--8- 7. 266,6... .46-7 ,81 17,1 .349E17 2798 0f96i-20-2-2828-2f
18 ,168E 18 7.02 267.4 ,517E 17 .84 22.2 .346E 17 30.8 12*0 8,3 20.6 21 27 26 2019 #163E 18 7.16 27.2 .475E 17 1,03 17.5 .373E 17 29.1 14*4 6.4 22.9 22 24 23 1920 "152E 18 7i14 265.1 .453E 17 .73 21 1 .399E 17 297 10.2 8.0 262 -22-27-25-2121 t131E 18 6,62 259.9 .552E 17 .98 13,5 ,167E 17 42.2 14.8 5i2 1298 22 27 26 2122 ,117E 18 6,27 246,1 ,393E 17 ,89 10,5 .166E 17 33*7 14*2 4*3 14*2 22 26 26 2123 9E7 07474 201E17 *62 10.1 173E 17 20ot7 10.2 4 i 799722 - 27 27'1
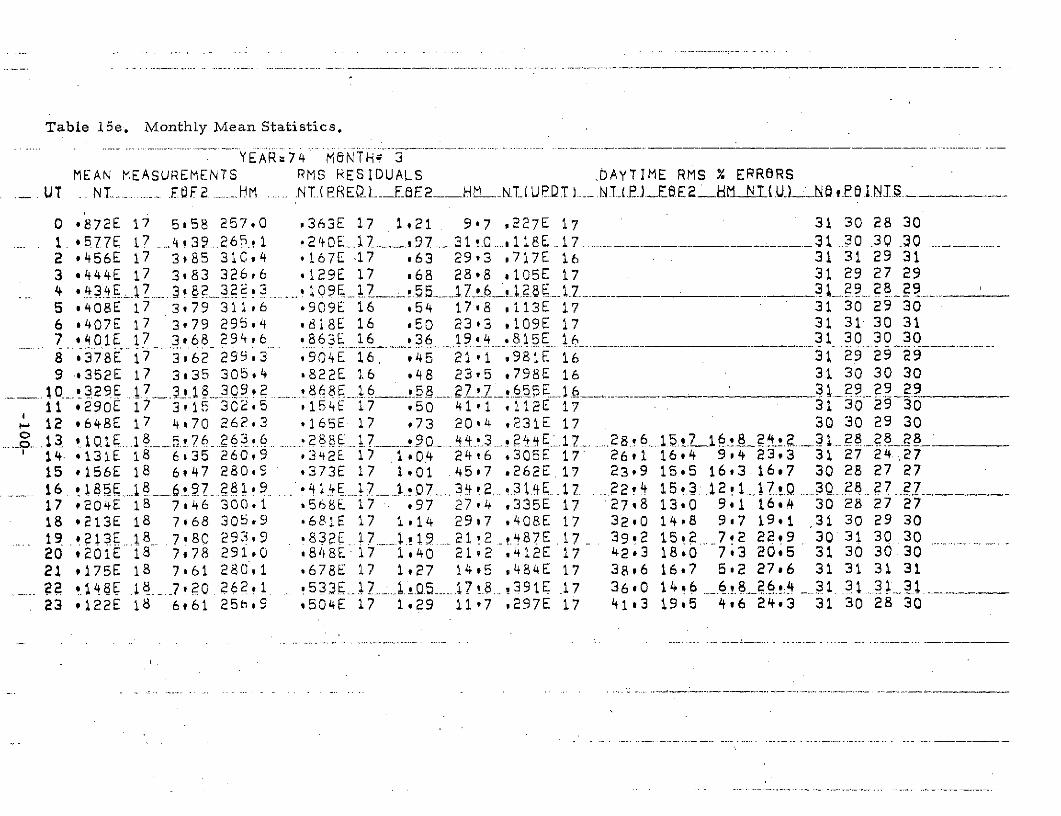
Table 15e. Monthly Mean Statistics.
YEAR=74 MONTHg 3MEAN MEASUREMENTS RMS RESIDUALS .DAYTIME RMS % ERRORS
UT .. NT -- E2. . - HM N... T.(REQl... E2__.HL NIU ... NI_.EEE 2 N T (U.LN.f01..NI._
0 *872E 17 5,58 257*0 .363E 17 1,21 9.7 ,227E 17 31 30 28 301 .577E 17 . 39...26 . 1 2 10 ...1 .... , 97 .....31 .. 118E 17 ............. .. 31 30 .30 . .30
2 *456E 17 3#85 31C04 ,167E 17 .63 29t3 .717E 16 31 31 29 313 .444E 17 3.83 326,6 .129E 17 .68 28,8 ,105E 17 31 29 27 294 4*AE7 83. 3
.... 17 E _ __31_29 28 29 _19_76'_
5 *408E 17 3,79 311,6 .909E 16 o54 17.8 ,113E 17 31 30 29 306 *407E 17 3,79 295,4 ,818E 16 *50- 23o3 #109E 17 31 31- 30 317 .01E 17 3.68 294,6 *863E 16 _36 19.4 *815E 16 31 30 30 30
8 o378E 17 3o62 299,3 *904E 16. ,45 2191 ,981E 16 31 29 29 299 *352E 17 3t35 305,4 ,822E 16 e48 23,5 .798E 16 31 30 30 30
10 *329E 17 7_18 309,2 868E 16 *58 27_ 7 .655E16 31 29 29 2911 *290E 17 3,15 302.5 154E 17 ,50 41,1 ,112E 17 31 30 29 3012 ,648E 17 4.70 262.3 .165E 17 ,73 20*4 .231E 17 30 30 29 30
._.. 1 3 210161 8 76 6 3. 6 -28817 90 r !3 1117 6 2176l42l 301 28 28 28 __
14. *131E 18 6s35 260.9 .342E 17 1,04 24t6 ,305E 17 26,1 16.4 9.4 23.3 31 27 24 2715 *156E 18 6.47 280.9 *373E 17 1,01 .457 .262E 17 23,9 15.5 16.3 16,7 30 28 27 2716 .185E 1..8 __6.97 281,9 . 414E _17 17 . 7.. .. . 3 .2 .31.tE..17 . 82 15 .121 17. 3Q 28 27 2717 *204E 18 7.46 300.1 .568E 17 .97 27,4 .335E 17 27.8 13.0 9.1 16.4 30 28 27 2718 *213E 18 7.68 305.9 .681E 17 1.14 29,7 *408E 17 32.0 14P8 9v7 19*1 31 30 29 3019 .213E 18 7.80 293,9 .832E 17 119 ..212 r487E 17 39P2 15s2 7.2 22.9 30 31 30 3020 201E 18 7,78 291.0 848E 17 1,40 21.2 ,412E 17 42.3 18.0 7.3 20.5 31 30 30 3021 ,175E 18 7:61 280,1 ,678E 17 1.27 1495 ,484E 17 38.6 16.7 5.2 27.6 31 31 31 3122 148 .1.. 7.20 2621 !533 1 1.A.5.8.12839.1 1:7 36.0 14 33 31 3123 ,122E 18 6.61 25h,9 t504E 17 1.29 11,7 .297E 17 41,3 19.5 496 24.3 31 30 28 30
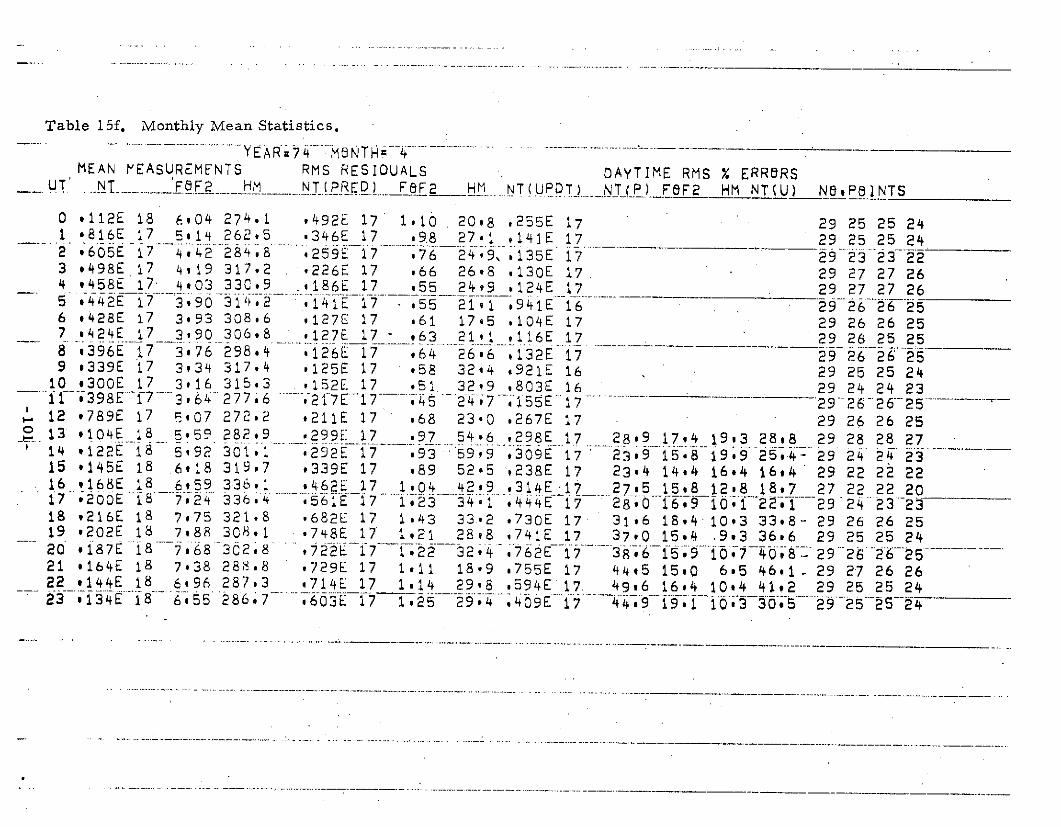
Table 15f. Monthly Mean Statistics.
MEAN 'EASUREMENTS RMS RESIDUALS DAYTIME RMS % ERRBRS__UT .. T.. FF2 HM NT(PRED) FF2 HM NT(UPDT) NT(P) F8F2 HM NT(U) Ne,PeNTS
0 .112E 18 6.04 274.1 #492E 17 1.10 20,8 .255E 17 29 25 25 241 *816E 17 5,14 262,5 *346E 17 .98 27,1 ,141E 17 29 25 25 242 *605E 17 4.42 288 o259E17 . 476 49 *.135E, 17 29 223 23 223 ,498E 17 4,19 317.2 ,226E 17 ,66 26*8 ,130E 17, 29 27 27 264 ,458E 17. 4,03 330,9 .186E 17 ,55 24,9 *124E 17 29 27 27 265 ,442E 17 390 314.2 14E 17 .55 211 .941E 16 29 26 26 256 #428E 17 3.93 308.6 #127E 17 .61 17,5 *104E 17 29 26 26 257 1424E 17 3,90 306.8 .127E 17 .63 21,1 .116E 17 29 26 25 258 .396E 17 376 298*4 *126E 17 .64 26.*6 .132E 17 29 26 26 259 ,339E 17 3,34 317,4 ,125E 17 *58 32.4 ,921E 16 29 25 25 24
10 ,300E 17 3.16 315.3 .152E 17 .51. 32,9 .803E 16 29 24 24 23S-398E- 17 - 364-277;6 2f7E--17 -- 45 247 155E 17 . 29-26-26 25
S12 *789E 17 E,07 272.2 .211E 17 .68 23.0 .267E 17 29 26 26 25. 13 P104E 18 _ 5 59 282.9 .299E 17 *97 54,6 ,298E 17 28o9 17,4 19v3 28,8 29 28 28 27
14 ,122E 18 5.92 301,1 *292E 17 .93 59.9 .309E 17 23.9 15*8 19.9 24- 29 24 24 2315 *145E 18 .618 319.7 *339E 17 989 52,5 .238E 17 23.4 14,4 16*4 16,4 29 22 22 2216 ,168E 18 6P59 336.1 ,462E 17 1.04 42.9 .314E 17 27.5 15.8 12.8 18,7 27 22 22 2017 *2002 18 7,2 336.4 561E 17 1.23 341 *4+1i4E 17 28 016-I-9 1i0 ;22i . 29 24 23-2318 ,216E 18 7,75 321.8 .682E 17 1.43 33.2 .730E 17 31.6 18.4 10.3 33.8- 29 26 26 2519 ,202E 18 7.88 308.1 .748E 17 1,21 28,8 .741E 17 37,0 15*4 .9,3 36.6 29 25 25 2420 *187E 18 7.68 302.8 ,722E 17- 122 32.4 .762E-17 386159 -107 -40-8- '29 26 26-2521 *164E 18 7,38 288.8 .729E 17 1,11 18.9 ,755E 17 44,5 15.0 6.5 46,1- 29 27 26 2622 v144E 18 6l96 287.3 ,714E 17 1,14 29,8 ,594E 17 49t6 16,4 10*4 41,2 29 25 25 2423- 134E 18 655 286.7 1259 6403E 17 125 *4 17 49 191 103 30.5 29 25 25 2
.. .. . . . . . ..... .-.... .... .. ... .. .

Table 15g. Monthly Mean Statistics.
YEARm74 MUNTHF 5MEAN MEASUREMENTS RMS RESIDUALS DAyTIME RMS X ERRORS
UT ..... N. E.E2 .. lM_ NIT EE . E2 M UIIJU _ NT..._E HM NTULU-..OF i_IlNITS
0 *147E 18 6.62 278*0 ,582L 17 1.13 7,2 .306E 17 7 6 6 61 *108E _ 18 6.10 266s9 ,441E 17 95 286 .297E 17 _____. -.6 6 62 *789E 17 4,96 298.1 .340E 17 .96 34.1 .218E 17 7 5 5 53 *697E 17 4,71 330.9 *219E 17 ,77 3192 .170E 17 7 7 7 7
e -683E .17 466 336,6 2__ 7__2-.33 155E 17 7 7 7 7 _
5 ,660E 17 4.36 326*9 .223E 17 *75 29o7 .174E 17 7 5 5 56 ,626E 17 4,43 309.8 ,248E 17 1.13 242 .,145E 17 7 7 7 -77 .565E 17 4#13 308.1 . t134E. ..7 7 . 12.1 E 1.7 7 7 7.. 78 *498E 17 4813 309.8 ,834E 16 .84 25,6 .204E 17 7 7 '7 79 *393E 17 3!58 330,2 #728E 16 ,40 34,0 .117E 17 7 6 6 6
10 *342E 17 3.45 331.3 *.149E 17 *26 50,3 *118E 17 7 6 6 611 ,611E 17 4,38 264,2 ,145E 17 ,69 16'2 ,263E 17 7 6 6 612 101E 18 5,22 279.5 ,248E 17 1,01 28,7 .244E 17 7 6 6 6
1 -... 134E 18 5.32 279 325E 17 993 25 221E 17 24.2 176 2 165 7 55 514 *161E 18 6v00 300.6 .470E 17 1.64 47.8 *277E 17 29.2 27.4 15.9 17.2 7 4 4 415 *187E 18 7.20 306.7 ,662E 17 1.92 18.4 .438E 17 35.4 26.7 6.0 23,4 7 4 4 41_ 20E 1 -..... 2 3 1_6 21_1 0216.t.. ,.6E 17.. 34 .25.9 52 22,1 7 4 4 417 *203E 18 7984 337.7 ,634E 17 1,72 23,7 *458E 17 31.2 22,0 7.0 22.6 6 5 5 418 *204E 18 8t30 328.0 *716E 17 2,01 18,3 .555E 17 35,0 24,2. 5.6 27*2. 6 5 5 419 *204E 18 7#73 326,0 ,726E 17 1.49 26,0 .621E 17 35.6 19,3 .8! 30.5 _ 6 6 6. 520' 195E 18 747 324.3 . 739E 17 .98 25.8 .682E 17 37.9 13.1 8.0 35,0 :6 6 6 521 ,186E 18 7.27 330.1 *749E 17 1.10 3523 .810E 17 4092 15*2 10.7 43.5 6 6 6 622 *179E 18 7#.44 314.9 .749E_17.? 17..1.8.. 3708 .739E- 17 ._ 41 8. 15.9 120. 41.2 .. 6 5 5 .523 ,171E 18 7,40 291.7 *640E 17 1.05 14,6 .679E 17 37 .5 14*2 590 39.8 6 5 5 5

Table 6. Daytime RMS Percent Errors (for 8-18 hours local time).
Time Daytime RMS Percent Errors and Number of Observations forPeriod NT Predicted No. NT Updated No. foF 2 1 No. hm. No.
Nov 73 -- 0 -- 0 13.7 233 5.0 233
Dec 73 21. 8 132 19.7 121 9. 9 121 7. 3 121
Jan 74 28. 4 339 19. 1 300 12. 5 302 6. 9 302
Feb 74 30.7 242 20. 3 232 11. 6 296 7. 0 289
Mar 74 33. 3 337 22. 1 318 16..0 322 10. 3 312
Apr 74 35. 5 317 32. 7 263 16. 5 274 13. 0 272
May 74 34. 9 70 31.4 51 20. 8 55 9.0 55
Nov 73 -May 74 31. 5 1437 24. 0 1285 14. 2 1603 8.6 1584
Jan 74-Mar 74 30.9 918 20.6 850 13.6 920 8.3 903

APPENDIX B
Brief Plan Regarding the- Collection, Intercomparison, and Analysisof the INTASAT Worldwide Data
The NASA Space Science Data Center is not at present, scheduled
to receive any polarimeter data from INTASAT. It is suggested that
the NSSDC request this data from the worldwide users of INTASAT in
the same way that they do with many other international satellite
experiments. The format should be compatible with the NSSDC computers
and be on magnetic tapes or punched cards.
The data should be collected from users throughout the world and
could provide a unique data base for many ionospheric investigations.
It has been suggested that the data could be used for modeling the total
electron content (TEC) on a worldwide basis, but we do not recommend
this because much larger and more comprehensive data bases of foF2
already exist from which TEC can be deduced.
The data could be used for investigating traveling ionospheric disturbances
or sudden ionospheric disturbances. Such areas of research are of
particular interest at the present time for the development of two global
navigation satellite systems, GPS and AEROSAT. In these areas the
behavior and movement of ionospheric disturbances are important. If
two or more INTASAT users are simultaneously recording Faraday data
from INTASAT, then the disturbances can be monitored along these two
or more different paths through the ionosphere as the satellite moves across
the sky. These results will provide a unique analysis tool for such effects.
Comparisons of INTASAT data from its low orbit could also be made
with similar Faraday satellites and two frequency satellites such as ATS-F
and Timation II at highter orbits. Analysis of TEC above 1500 km could
be undertaken along with the investigation of Faraday factor errors using
group delay and Faraday techniques.
-104-

The unmodeled part of the ionosphere just above the height of the
maximum of the F2 layer in the Bent model could also be investigated
in detail around the world rather than at the few sites on the continental
United States reported in the model description.
-105-

RE FE RENCES
1. R. B. Bent, S. K. Llewellyn, M. K. Walloch, "Descriptionand Evaluation cfthe Bent Ionospheric Model", SAMSO TR-72-239,October, 197Z.
2. S. Chapman & J. Bartels, "Geomagnetism," Vol II, Oxford at theClarendon Press (1962).
3. D. C. Jensen & J. C. Cain, "Iterim Geomagnetic Field, " J. Georgr.Res., No. 9, 3568-3569 (August, 1962).
4. J. A. Klobuchar, M. J. Mendifllo, "Model Studies of the Conversionof Faraday Rotation Measurements from a Geostationary Satelliteto Total Electron Content," JSSG Report No. 4, October, 1971.
-106-
Related Documents