APS Equity Audit 1 Atlanta Public Schools Equity Audit Report Authors: C. Kevin Fortner Anita Faust-Berryman Gabriel T. Keehn The authors thank the following individuals from Atlanta Public Schools and Georgia State University for their advice, assistance, and reviews to improve the quality of the information provided in this report: Dr. Rubye Sullivan, Dr. Paul Alberto, Adam Churney, Dr. Curtis Grier, Dr. Joy Johnson, John Keltz, and Naber Sohrab.

Welcome message from author
This document is posted to help you gain knowledge. Please leave a comment to let me know what you think about it! Share it to your friends and learn new things together.
Transcript
APS Equity Audit 1
Atlanta Public Schools
Equity Audit Report
Authors:
C. Kevin Fortner
Anita Faust-Berryman
Gabriel T. Keehn
The authors thank the following individuals from Atlanta Public Schools and Georgia State
University for their advice, assistance, and reviews to improve the quality of the information
provided in this report: Dr. Rubye Sullivan, Dr. Paul Alberto, Adam Churney, Dr. Curtis Grier,
Dr. Joy Johnson, John Keltz, and Naber Sohrab.
APS Equity Audit 2
I. Executive Summary ................................................................................................................ 4
II. Introduction ............................................................................................................................. 6
A. Purpose of the audit ............................................................................................................ 6
III. Literature ............................................................................................................................. 7
IV. Data and Methods ............................................................................................................. 10
V. Community characteristics by school zone........................................................................... 14
VI. School characteristics........................................................................................................ 22
A. Introduction ....................................................................................................................... 22
B. Finance .............................................................................................................................. 22
C. Facilities ............................................................................................................................ 26
1. Playgrounds................................................................................................................... 26
2. Science Labs ................................................................................................................. 29
D. PTA and Foundation ......................................................................................................... 32
E. School Characteristics ....................................................................................................... 32
F. Teacher Characteristics ..................................................................................................... 35
G. Individual student characteristics ...................................................................................... 42
VII. Additional Appendices ...................................................................................................... 53
VIII. Discussion ......................................................................................................................... 63
IX. Appendix A ....................................................................................................................... 67
A. Finance Figures ................................................................................................................. 67

APS Equity Audit 3
B. Region Figures .................................................................................................................. 78
C. Cluster Figures .................................................................................................................. 88
APS Equity Audit 4
I. Executive Summary
In order to conduct this equity audit, we reviewed recent literature related to the practice of
equity audits and compiled data from a variety of sources including the U.S. Census Bureau,
administrative data on schools, principals, teachers, and students across the Atlanta Public
Schools (APS) system, recent APS reports, and financial reporting data. Products known as
equity audits vary widely in the information contained within them and in the thresholds for
determining whether or not conditions within a system are equitable. The aim of this report is to
convey information about the state of the system at the region, cluster, and school levels using a
variety of indicators. These indicators include community characteristics, financial data, and the
characteristics of schools. School characteristics are represented by measures of school
leadership, classroom and teacher characteristics, and student characteristics. In addition, the
appendices further describe some school characteristics while limiting data to specific subgroups
of students. The data for this report are largely restricted to the 2012-13 school year.
Equity audits are a relatively new tool for school systems and there are large variations in their
thresholds for determining whether or not characteristics are substantially different across
schools. Simple percentage difference cutoffs or using standard error calculations to generate
confidence intervals of means both avoid complex questions of whether or not differences across
schools are practically meaningful. This report finds substantial variations across schools on
numerous characteristics, but leaves questions of whether and how to address these differences to
the broad group of stakeholders concerned with educational outcomes for the students of APS.
While the report in its entirety may appear overwhelming, we hope that this report will serve as a
resource document for those concerned about variations across schools within the district. The
main report provides a narrative description of a variety of tables and graphs to guide the reader
in understanding and interpreting the information contained within the main report and the
appendices organized by school level.
Conducting this equity audit also revealed some additional important themes. There exist
substantial variations across schools in the APS system in all of the areas where equity was
examined. These include differences in indicators of teacher quality, academic programming,
financial resources (particularly represented by PTA and foundation funds), playgrounds, student
APS Equity Audit 5
academic achievement, and classroom instruction. Also, while numerous sources of data on
personnel, students, and facilities are housed within APS, there are no systemic mechanisms for
the compilation of these disparate data sources into information tools to guide decision-making
within the district. Additionally, it should be noted that the time constraints involved in this
analysis required a restriction to a single year of information. This single year ‘snapshot’ does
not allow an examination of the trends of the indicators compiled. We cannot speak to whether
or not these measures represent positive, negative, or no changes over recent years. Finally,
should policymakers within APS respond to the information in this report with specific actions
intended to alter the characteristics of schools, a plan must also be developed that will allow the
district to monitor the changes that occur due to these actions.
APS Equity Audit 6
II. Introduction
A. Purpose of the audit
While educational stakeholders across the United States may recognize that there are differences
between states, schools, and districts in terms of the populations served by schools, the personnel
working within them, and the outcomes experienced by students, the nature and magnitude of
those differences may not be known. Differences within districts and between schools potentially
exist as well and while some disclosure of differences based on subgroup populations is required
by current accountability policies at the state and federal level, only limited information on a
specified set of student characteristics and outcomes is known. In addition, the required
disclosures may only require reporting based on a single characteristic – (i.e., race or special
education status) instead of other categories of interest such as female students.
Equity audits are an emerging inquiry method that appears to be gaining momentum in the
educational policy arena (Skrla, Scheurich, Garcia, & Nolly, 2004). Equity audits typically
provide information on the characteristics of students, school personnel, and other resources at
the school level to provide information that may inform questions of equity. There is currently a
high degree of variability in the content of equity audits and this report will continue that trend
by examining school characteristics at the community, school leadership, classroom teacher, and
student levels. In addition, this equity audit will use roster level information to examine school
characteristics based on particular subgroups of students.
Atlanta Public Schools (APS) engaged the services of researchers at Georgia State University to
examine differences in the characteristics across schools within the district. Data sources for the
audit include administrative data provided by personnel in the Research & Evaluation for School
Improvement division of APS and data from the US Census Bureau’s 2012 American
Community Survey. The audit examines data from the 2012-2013 school year and focuses on
between school comparisons. This audit includes all non-residential public schools within the
district and organizes those schools into the following groups: high schools, middle schools,
elementary schools, charter schools, and alternative schools.
APS Equity Audit 7
The report continues with a literature review related to equity audits and a discussion of the data
and methods utilized in the study. Next, we present data on the community characteristics of
school zones in APS utilizing data from the US Census Bureau, school characteristics using APS
data at the region and cluster level, and present selected school characteristics based on an
analysis of student subgroups of particular interest for an equity audit. Complete school
characteristics organized by school subgroups are contained in the appendices. Finally, in the
discussion section we review the major findings, limitations, and implications of the equity audit.
III. Literature
Equity audits are an emerging research endeavor and the academic literature related to these
types of analyses is somewhat sparse. There is no methodological consensus as the “right” way
to go about the process. There are, however, three distinct aspects of equity audits consistently
mentioned in this literature. Among these are the conceptual definition of the equity audit, the
goals of equity audits, and some salient school characteristics that equity audits should consider.
We organize this survey of the literature along these three aspects of the equity audit literature.
Definitional Considerations
The most influential work on the method and reasoning behind equity audits is a series of papers
and subsequent book led by Linda Skrla (for an overview of this work, see Skrla, Scheurich,
Garcia, & Nolly, 2004). The term itself has a long history stemming from its use in civil rights
more generally as well as curriculum auditing (English, 1988; Poston, 1992; Skrla, Scheurich,
Garcia, & Nolly, 2004). Originally, equity audits were conducted either voluntarily or under
pressure from activists by school districts to measure compliance with various civil rights
statutes which made non-discrimination a condition of receipt of federal funding (Groenke,
2010). While the impetus for conducting an equity audit will generally no longer be related to
specific legislation, the general reasoning behind the practice remains similar, namely to provide
administrators, teachers, and districts with “clear, accurate, [and] useful understanding of the
degree of inequity present in their own schools and school districts” (Skrla, Scheurich, Garcia, &
Nolly, 2004, p. 141). An equity audit then, is the collection of data relevant to equity (see
below), the organization of those data in a clear and comprehensible way so as to facilitate
APS Equity Audit 8
positive change on the part of stakeholders, and the interpretation of those data to expose areas of
both weakness and strength within a district with respect to equity.
Goals of an Equity Audit
The goals of an equity audit will be somewhat different in each case, with different districts
focusing on their specific needs and particular areas of concern. For instance, in the well-
publicized case of Montgomery County Public Schools (MCPS), which, in the course of just
over a decade was able to nearly erase racially driven academic inequity, they outlined six
specific concrete goals of their process before undertaking it (Childress, Doyle, & Thomas,
2009). Some of these goals were more universal, such as “developing a system of shared
accountability” and “workforce excellence through targeted training and action research”
(Childress, Doyle, & Thomas, 2009, p. 22). Other goals, however, related specifically to the
needs of MCPS, such as “broadening the concept of literacy” and establishing “family and
community partnerships” (2009, p. 22). Some communities may, for example, already have
strong existing family and community ties within their schools which can be used to help put the
findings of the equity audit into practice or a given district may want to focus their efforts on
examining STEM subjects rather than literacy.
Equity audits may sometimes focus on a particular subset of schools within a district. Brown
(2010) describes the findings of an equity audit which was focused exclusively on “state-
recognized 'Honor Schools of Excellence.'” The district undertook this audit in order to expose
potentially flawed systems of positive recognition for schools and some of the deeper signs of
disparate achievement within schools which seem initially to be quite similar with respect to
equity considerations (Brown, 2010). Interestingly, Brown found that while there was indeed
significant equity between the schools in terms of demographic, teacher, and programmatic
comparisons (which accounted for the publicly visible equity), there remained significant
inequity with respect to achievement. This ability to expose deep, hidden types of inequity across
schools which initially appear very similar is a great strength of equity audits as a tool for district
leaders.
A more general goal which is often cited as the long-term objective of an equity audit is Scott's
(2001) conception of “systemic equity.” Scott defines the term as follows:

APS Equity Audit 9
Systemic equity is defined as the transformed ways in which systems and
individuals habitually operate to ensure that every learner-in whatever learning
environment that learner is found-has the greatest opportunity to learn enhanced
by the resources and supports necessary to achieve competence, excellence,
independence, responsibility, and self-sufficiency for school and for life. (p. 6)
Scott's vision of systemic equity requires, according to Skrla, McKenzie, & Scheurich (2009),
the use of equity audits as a practical tool for educators and leaders to promote equity across the
entirety of the public school system.
A further, more personal, goal of equity audits, as suggested by McKenzie & Scheurich (2004) is
to enable educators and leaders to avoid so-called “equity traps” in their thinking about students.
Equity traps are defined as “patterns of thinking and behavior that trap the possibilities of
creating equitable schools for children of color,” an example being the attitudes often expressed
by teachers that their students are failing because of poor attitude or cultural deficit (McKenzie
& Scheurich, 2004, p. 603). The exposure of the systemic nature of inequity within a district
goes a long way toward undermining these patterns of thought and opening the door to
examinations of systemic equity.
Measurement
While there will be distinctions between districts as to the particular goals of their equity audit
and hence differences on the things that they measure, Skrla, Scheurich, Garcia, & Nolly (2004)
suggest three broad categories of performance indicators that ought to be examined in an equity
audit, with 12 specific indicators spread across these categories. The three categories are
“Teacher Quality Equity,” “Programmatic Equity,” and “Achievement Equity” (2004). All of
these categories come to bear in one way or another on achievement, but they are grouped
separately for simplicity.
Teacher quality is increasingly tied to student achievement, and there is strong evidence
suggesting that high quality teachers are unevenly distributed across student populations
(Ingersoll, 1999; Lankford, Loeb, & Wyckoff, 2002). Skrla, Scheurich, Garcia, & Nolly (2004)
suggest four major variables which can be used to get a picture of teacher quality equity
APS Equity Audit 10
throughout a district, namely teacher education, teacher experience, teacher mobility, and
teachers teaching outside of certification area or without certification. Precisely which of these
factors is selected for a given audit will depend on available data and the interpretation of which
variables are most salient. Variables may be added or dropped accordingly, but it is critical in
any equity audit to get a sense of the distribution of quality teachers across the population being
served.
Programmatic equity refers to “the quality of the programs in which students are placed” (Skrla,
Scheurich, Garcia, & Nolly 2004, p. 145), and perhaps more importantly, those from which
certain students may be excluded. Skrla, Scheurich, Garcia, & Nolly (2004) and Skrla,
McKenzie, & Scheurich (2009) cite literature on large-scale inequities in placement in gifted and
talented programs, special education, and the like, both in terms of over assignment of certain
groups to special education classes and under assignment of those same groups to gifted and
talented classes, which suggests that equity in these areas is critical for districts to examine. The
four specific sub-areas which are to be examined here are special education placement, gifted
and talented placement, bilingual education, and student discipline (2004, 2009).
Finally, there is achievement equity. As mentioned, none of the above variables are isolated from
achievement in any way, but the ones singled out as particularly salient by Skrla, Scheurich,
Garcia, & Nolly (2004) are state achievement test results, dropout rates, graduation tracks, and
SAT/ACT/AP results (Skrla, Scheurich, Garcia, & Nolly, 2004, p. 150). Again, these variables
will differ from case to case, and it could be argued that AP class placement, for example, might
be a better fit under the heading of programmatic equity, but nonetheless these are clearly
important factors to examine in an equity audit of any kind.
IV. Data and Methods
The two major sources of data for this equity audit are the 2012 American Community Survey
(ACS) data from the US Census Bureau and administrative data from the 2012-13 school year
provided by APS. The ACS provides detailed information on residents across the United States
at the ‘block group’ level. While block groups vary in geographic size and population, these data
APS Equity Audit 11
provide information on a representative sample of individuals in units smaller than the
elementary school zones that exist within APS (Bureau of the Census, 1994).
For the community characteristics analysis, we utilized ESRI ArcMap 10.0 to overlay the APS
attendance zone data with US Census Bureau Tiger Line files which designate block group
boundaries. While many block groups are completely within the attendance zone boundary of
particular schools, many block groups lie in more than one school zone. We used the overlapping
geographic area of block group and school zone boundaries to attribute block group information
to multiple school zones as appropriate. For example, if a 20 percent of a block group overlapped
with school A and 80 percent with school B, we allocated 20 percent of the block group
characteristics to school A and 80 percent to school B. This provided a geographic weight for
block groups that overlapped multiple school zones. We then summed the resulting values within
school zones to produce estimates of population characteristics that were weighted by the
number of individuals within the block group. We created four different sets of estimates based
on the boundaries of region, high school, middle school, and elementary school within the
district.
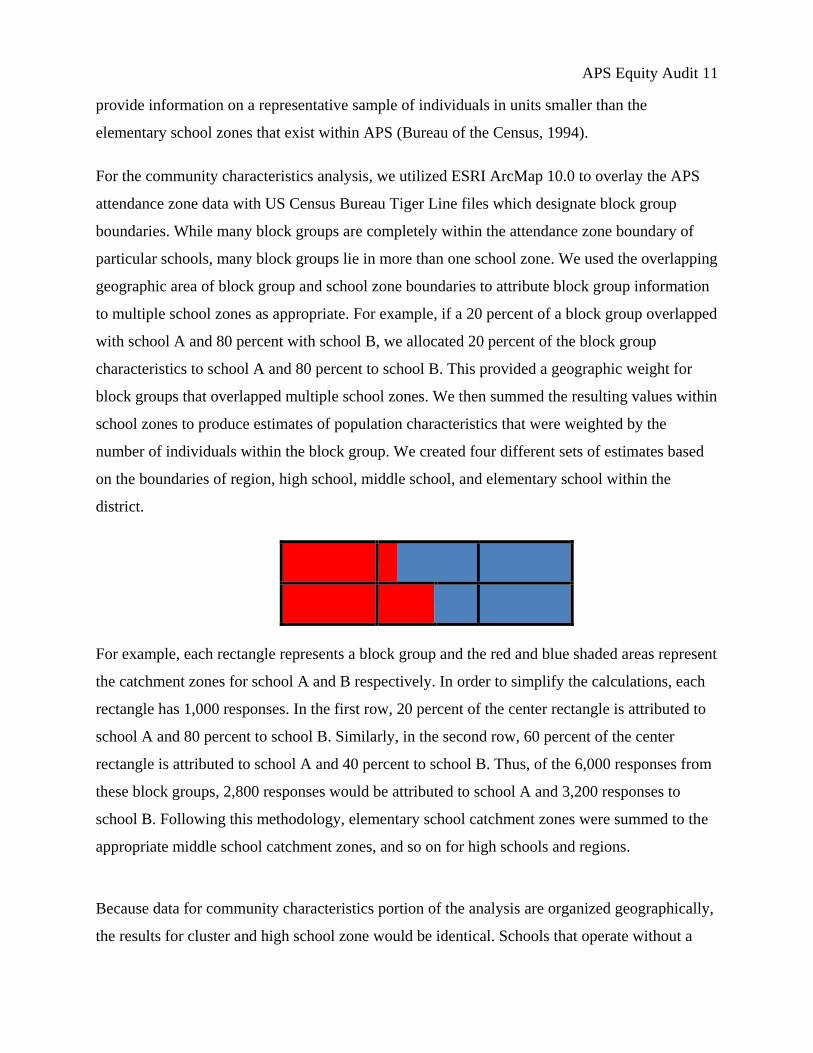
For example, each rectangle represents a block group and the red and blue shaded areas represent
the catchment zones for school A and B respectively. In order to simplify the calculations, each
rectangle has 1,000 responses. In the first row, 20 percent of the center rectangle is attributed to
school A and 80 percent to school B. Similarly, in the second row, 60 percent of the center
rectangle is attributed to school A and 40 percent to school B. Thus, of the 6,000 responses from
these block groups, 2,800 responses would be attributed to school A and 3,200 responses to
school B. Following this methodology, elementary school catchment zones were summed to the
appropriate middle school catchment zones, and so on for high schools and regions.
Because data for community characteristics portion of the analysis are organized geographically,
the results for cluster and high school zone would be identical. Schools that operate without a
APS Equity Audit 12
designated attendance zone boundary are not able to be included in this analysis (charter and
alternative schools). In addition, to the extent that individual students attend schools outside their
designated school zone, these data will not truly reflect the population of students within schools.
Data regarding school characteristics from APS are compiled from a variety of sources. Student
characteristics include student demographic information, test score information, school location,
course enrollment and roster information linked to the teacher of record, attendance, and
discipline information. School personnel characteristics include an individual’s years of
experience, years of experience in the current school, student survey results, and value added
scores when applicable. In addition to this administrative data on students and personnel working
in schools as teachers and school leaders, APS provided information on Parent Teacher
Association budgets and membership for some schools, the results of an audit of school
playground equipment installed at schools, and school finance data.
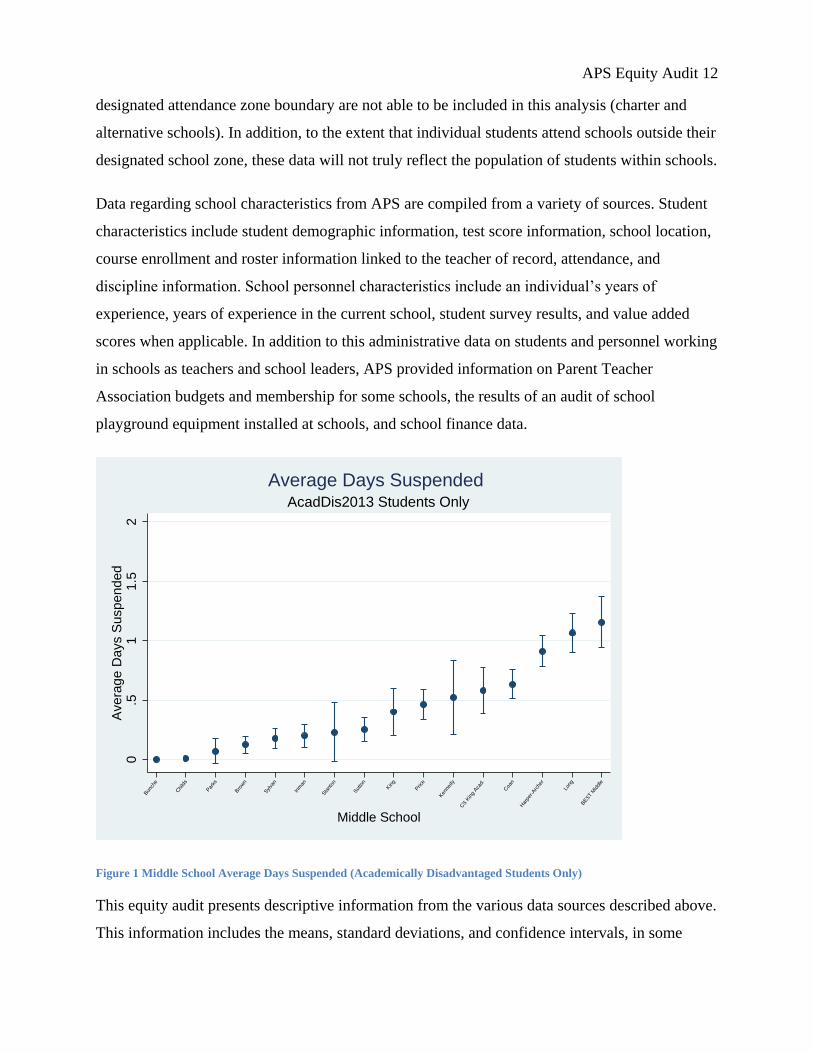
Figure 1 Middle School Average Days Suspended (Academically Disadvantaged Students Only)
This equity audit presents descriptive information from the various data sources described above.
This information includes the means, standard deviations, and confidence intervals, in some
0.5
11.5
2A
vera
ge
Days S
usp
ended
Bun
che
Chi
lds
Par
ks
Bro
wn
Sylva
n
Inm
an
Sta
nton
Sut
ton
Kin
g
Pric
e
Ken
nedy
CS K
ing
Aca
d.
Coa
n
Har
per-Arc
her
Long
BEST
Mid
dle
Middle School
AcadDis2013 Students Only
Average Days Suspended

APS Equity Audit 13
graphical displays, related to school level characteristics. Figure 1 above is an example of data
presented with confidence intervals. Here, data are restricted to students categorized as
Academically Disadvantaged Only (meaning students who scored not proficient on one or more
state CRCT or EOCT exams in the 2012-13 academic year.) The dot element of the data point is
the average number of suspension days served by academically disadvantaged students in the
corresponding schools during the 2012-13 school year. In Coan Middle school academically
disadvantaged students were suspended for about 0.60 school days, on average. The bars
extending above and below this mean value represent the range of possible values that are
similar considering the variation in the data within Coan Middle School and the number of
student roster entries for academically disadvantaged students in the school. The bars represent
values that are two standard errors above and below the average (mean) value within the school.
Where there is an overlap between the bars for schools, we would conclude that there is not a
statistically significant difference in the number of days suspended across academically
disadvantaged students in the two schools. For example academically disadvantaged students in
Harper-Archer Middle School experience similar rates of suspension days to students in four
other middle schools: Long, BEST Middle, Coretta Scott King Academy, and Kennedy.
Academically disadvantaged students in Bunche and Childs middle schools experience the
lowest average suspension rates and the rate for these students is significantly lower (in a
statistical sense) than the suspension rates compared to academically disadvantaged students in
all other APS middle schools with the exception of Parks Middle School.
Judging whether or not the differences are practically or meaningfully different is largely a
normative question beyond the scope of this report. It is, however, striking to note that the rates
of remediation are three to four times higher in some schools compared to others. Equity audit
approaches have not yet reached consensus on what constitutes a practical or meaningful
difference between school means. Because data within the study are based on the population of
persons within a school versus a random sample of individuals, the information presented
frequently represents the true population mean. Confidence intervals rely on formulas intended
to infer a statistically likely value range for a parameter in the population based on a random
sample of individuals from that population. Here, we utilize the confidence interval approach in
graphical displays to give an indication of the range of plausible values for a parameter based on
the size of the population of individuals in the group. When confidence intervals do not overlap
APS Equity Audit 14
values, they can be interpreted as situations where there is a statistically significant difference
between values at one school compared to another. However, statistical significance does not
indicate whether differences are meaningful or practically significant. Whether or not observed
differences are of practical significance requires normative judgments about what amount and
types of inequity between schools requires district action. While it is possible to look beyond
descriptive information and utilize regression modeling to predict resource allocation to students
based on individual characteristics as in Bastian, Henry, and Thompson (2012), time and
resource constraints prevented an execution of this type of analysis.
V. Community characteristics by school zone
Utilizing data from the US Census Bureau’s 2012 American Community survey, this section
provides descriptive characteristics on school attendance zones within the APS system. The
method used to calculate the presented information is located in the Data and Methods section
above. We present data on the racial and ethnic characteristics of school zone populations, as
well as data on income, education levels, family configurations, and housing. As noted above,
schools which function without catchment zones including charter schools and alternative
schools are excluded from this analysis as data are grouped based on the attendance zones of
schools with geographically defined attendance zones. The intent of these data is to provide
information regarding the communities in which the Atlanta Public Schools reside and are not
intended to reflect the actual demographics of a particular school. The data should be interpreted
as the proportion of households providing a specific response, for example, for the entire school
district, .4002 of all respondents indicated their race/ethnicity as White, .5362 as Black, and
.0518 as Latino. These proportions can be converted to percents by multiplying them by 100, for
example, 40.02 percent of respondents identified their race/ethnicity as White.
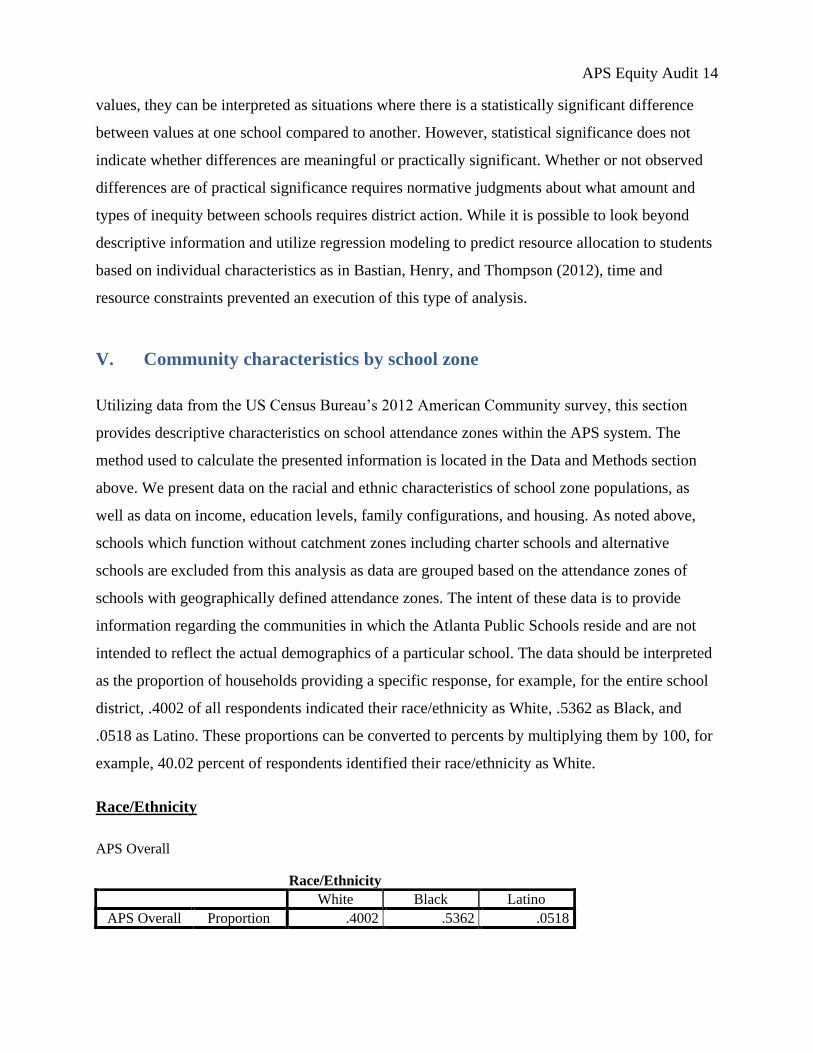
Race/Ethnicity
APS Overall
Race/Ethnicity
White Black Latino
APS Overall Proportion .4002 .5362 .0518
APS Equity Audit 15
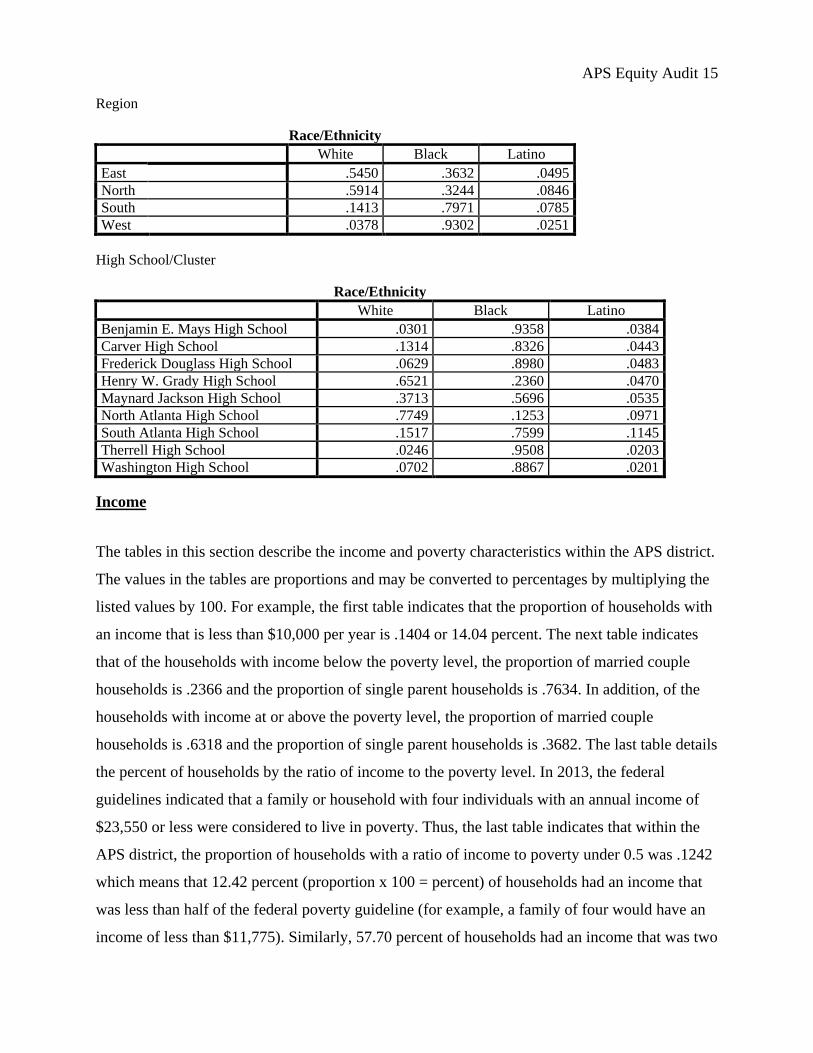
Region
Race/Ethnicity
White Black Latino
East .5450 .3632 .0495
North .5914 .3244 .0846
South .1413 .7971 .0785
West .0378 .9302 .0251
High School/Cluster
Race/Ethnicity
White Black Latino
Benjamin E. Mays High School .0301 .9358 .0384
Carver High School .1314 .8326 .0443
Frederick Douglass High School .0629 .8980 .0483
Henry W. Grady High School .6521 .2360 .0470
Maynard Jackson High School .3713 .5696 .0535
North Atlanta High School .7749 .1253 .0971
South Atlanta High School .1517 .7599 .1145
Therrell High School .0246 .9508 .0203
Washington High School .0702 .8867 .0201
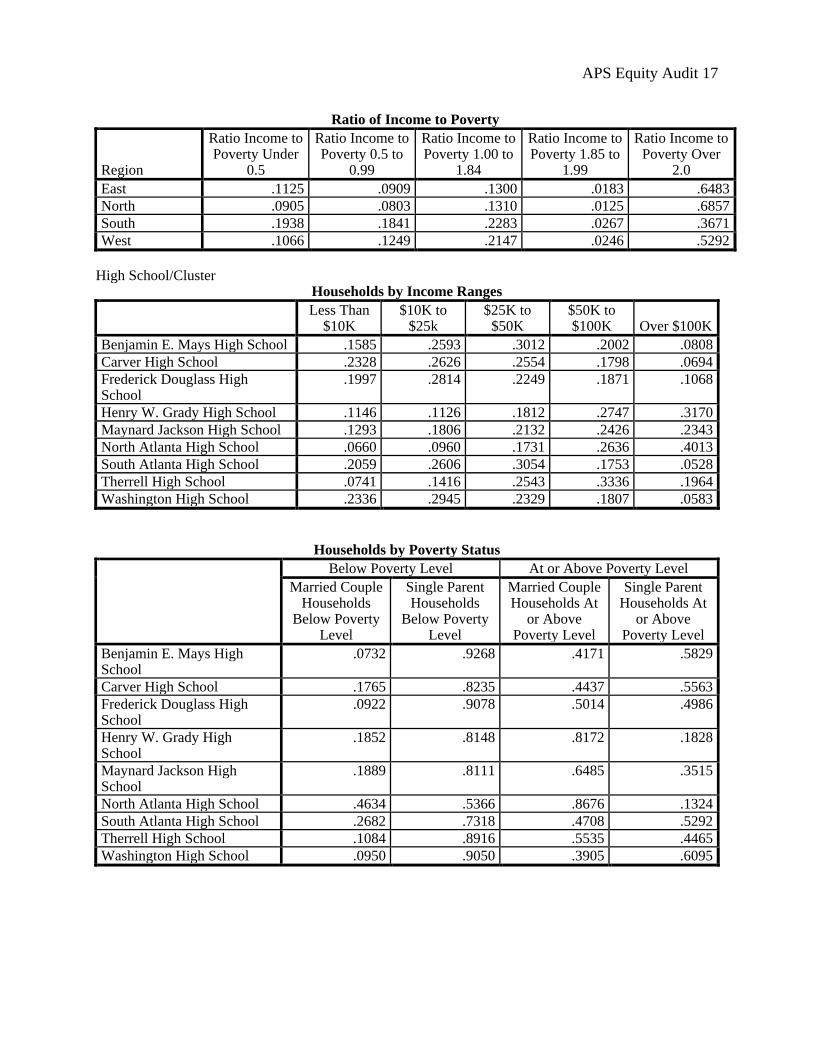
Income
The tables in this section describe the income and poverty characteristics within the APS district.
The values in the tables are proportions and may be converted to percentages by multiplying the
listed values by 100. For example, the first table indicates that the proportion of households with
an income that is less than $10,000 per year is .1404 or 14.04 percent. The next table indicates
that of the households with income below the poverty level, the proportion of married couple
households is .2366 and the proportion of single parent households is .7634. In addition, of the
households with income at or above the poverty level, the proportion of married couple
households is .6318 and the proportion of single parent households is .3682. The last table details
the percent of households by the ratio of income to the poverty level. In 2013, the federal
guidelines indicated that a family or household with four individuals with an annual income of
$23,550 or less were considered to live in poverty. Thus, the last table indicates that within the
APS district, the proportion of households with a ratio of income to poverty under 0.5 was .1242
which means that 12.42 percent (proportion x 100 = percent) of households had an income that
was less than half of the federal poverty guideline (for example, a family of four would have an
income of less than $11,775). Similarly, 57.70 percent of households had an income that was two
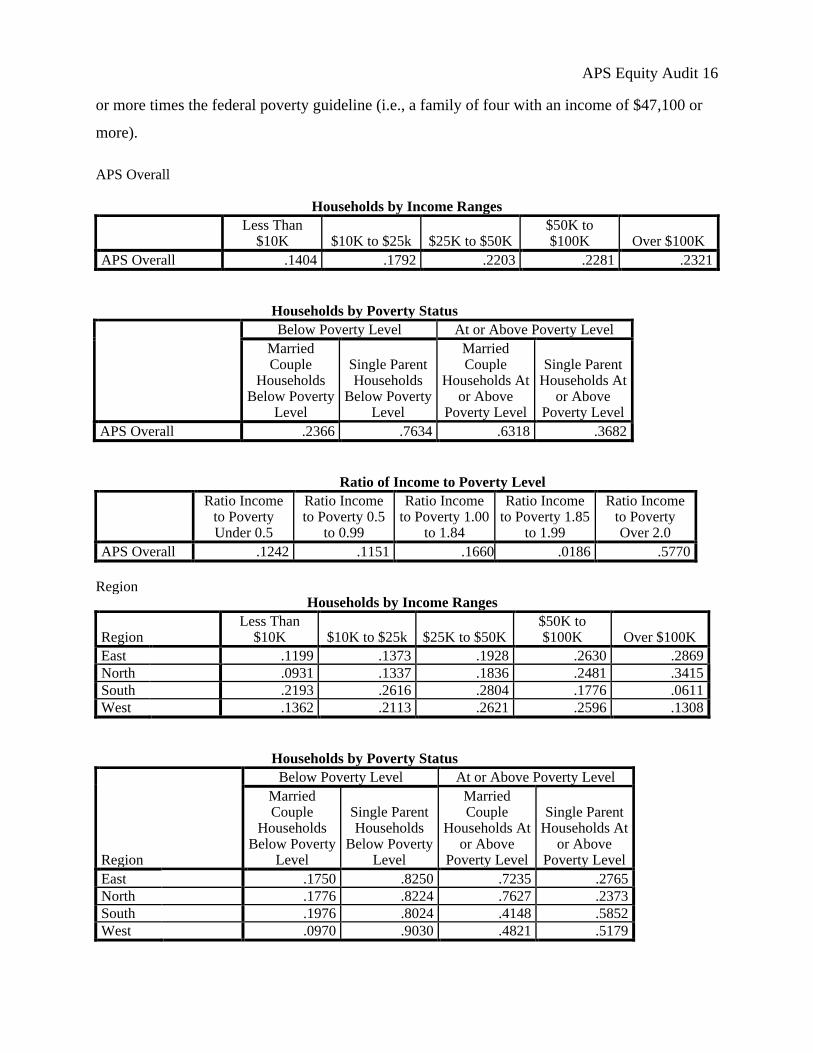
APS Equity Audit 16
or more times the federal poverty guideline (i.e., a family of four with an income of $47,100 or
more).
APS Overall
Households by Income Ranges
Less Than
$10K $10K to $25k $25K to $50K $50K to $100K Over $100K
APS Overall .1404 .1792 .2203 .2281 .2321
Households by Poverty Status
Below Poverty Level At or Above Poverty Level
Married Couple
Households Below Poverty
Level
Single Parent Households
Below Poverty Level
Married Couple
Households At or Above
Poverty Level
Single Parent Households At
or Above Poverty Level
APS Overall .2366 .7634 .6318 .3682
Ratio of Income to Poverty Level
Ratio Income to Poverty Under 0.5
Ratio Income to Poverty 0.5
to 0.99
Ratio Income to Poverty 1.00
to 1.84
Ratio Income to Poverty 1.85
to 1.99
Ratio Income to Poverty Over 2.0
APS Overall .1242 .1151 .1660 .0186 .5770
Region
Households by Income Ranges
Region Less Than
$10K $10K to $25k $25K to $50K $50K to $100K Over $100K
East .1199 .1373 .1928 .2630 .2869
North .0931 .1337 .1836 .2481 .3415
South .2193 .2616 .2804 .1776 .0611
West .1362 .2113 .2621 .2596 .1308
Households by Poverty Status
Region
Below Poverty Level At or Above Poverty Level
Married Couple
Households Below Poverty
Level
Single Parent Households
Below Poverty Level
Married Couple
Households At or Above
Poverty Level
Single Parent Households At
or Above Poverty Level
East .1750 .8250 .7235 .2765
North .1776 .8224 .7627 .2373
South .1976 .8024 .4148 .5852
West .0970 .9030 .4821 .5179
APS Equity Audit 17
Ratio of Income to Poverty
Region
Ratio Income to Poverty Under
0.5
Ratio Income to Poverty 0.5 to
0.99
Ratio Income to Poverty 1.00 to
1.84
Ratio Income to Poverty 1.85 to
1.99
Ratio Income to Poverty Over
2.0
East .1125 .0909 .1300 .0183 .6483
North .0905 .0803 .1310 .0125 .6857
South .1938 .1841 .2283 .0267 .3671
West .1066 .1249 .2147 .0246 .5292
High School/Cluster
Households by Income Ranges
Less Than
$10K $10K to
$25k $25K to
$50K $50K to $100K Over $100K
Benjamin E. Mays High School .1585 .2593 .3012 .2002 .0808
Carver High School .2328 .2626 .2554 .1798 .0694
Frederick Douglass High School
.1997 .2814 .2249 .1871 .1068
Henry W. Grady High School .1146 .1126 .1812 .2747 .3170
Maynard Jackson High School .1293 .1806 .2132 .2426 .2343
North Atlanta High School .0660 .0960 .1731 .2636 .4013
South Atlanta High School .2059 .2606 .3054 .1753 .0528
Therrell High School .0741 .1416 .2543 .3336 .1964
Washington High School .2336 .2945 .2329 .1807 .0583
Households by Poverty Status
Below Poverty Level At or Above Poverty Level
Married Couple Households
Below Poverty Level
Single Parent Households
Below Poverty Level
Married Couple Households At
or Above Poverty Level
Single Parent Households At
or Above Poverty Level
Benjamin E. Mays High School
.0732 .9268 .4171 .5829
Carver High School .1765 .8235 .4437 .5563
Frederick Douglass High School
.0922 .9078 .5014 .4986
Henry W. Grady High School
.1852 .8148 .8172 .1828
Maynard Jackson High School
.1889 .8111 .6485 .3515
North Atlanta High School .4634 .5366 .8676 .1324
South Atlanta High School .2682 .7318 .4708 .5292
Therrell High School .1084 .8916 .5535 .4465
Washington High School .0950 .9050 .3905 .6095
APS Equity Audit 18
Ratio of Income to Poverty
Ratio Income to Poverty
Under 0.5
Ratio Income to
Poverty 0.5 to 0.99
Ratio Income to
Poverty 1.00 to 1.84
Ratio Income to
Poverty 1.85 to 1.99
Ratio Income to Poverty Over 2.0
Benjamin E. Mays High School
.1222 .1611 .2629 .0279 .4259
Carver High School .2167 .1868 .1906 .0277 .3782
Frederick Douglass High School
.2122 .1598 .2468 .0155 .3657
Henry W. Grady High School
.1136 .0687 .0955 .0145 .7077
Maynard Jackson High School
.1109 .1216 .1777 .0236 .5662
North Atlanta High School .0489 .0531 .0914 .0114 .7952
South Atlanta High School .1722 .1816 .2638 .0257 .3567
Therrell High School .0667 .0701 .1765 .0245 .6622
Washington High School .1755 .2005 .2381 .0206 .3653
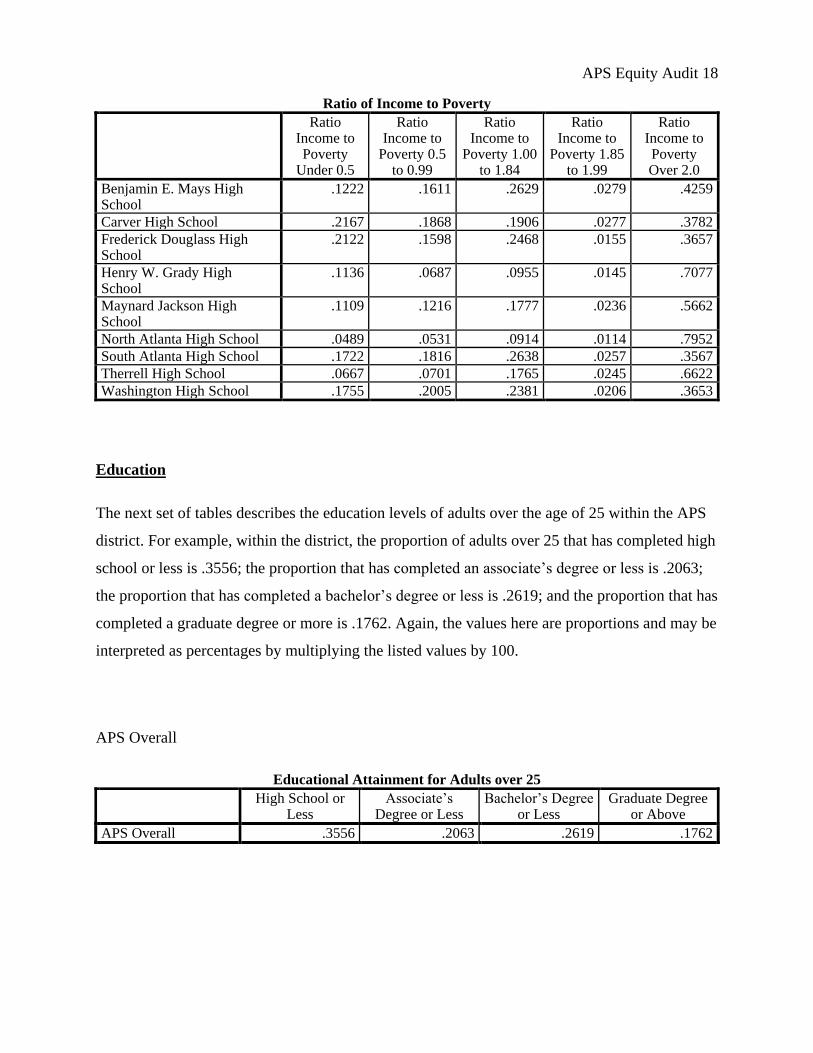
Education
The next set of tables describes the education levels of adults over the age of 25 within the APS
district. For example, within the district, the proportion of adults over 25 that has completed high
school or less is .3556; the proportion that has completed an associate’s degree or less is .2063;
the proportion that has completed a bachelor’s degree or less is .2619; and the proportion that has
completed a graduate degree or more is .1762. Again, the values here are proportions and may be
interpreted as percentages by multiplying the listed values by 100.
APS Overall
Educational Attainment for Adults over 25
High School or
Less Associate’s
Degree or Less Bachelor’s Degree
or Less Graduate Degree
or Above
APS Overall .3556 .2063 .2619 .1762
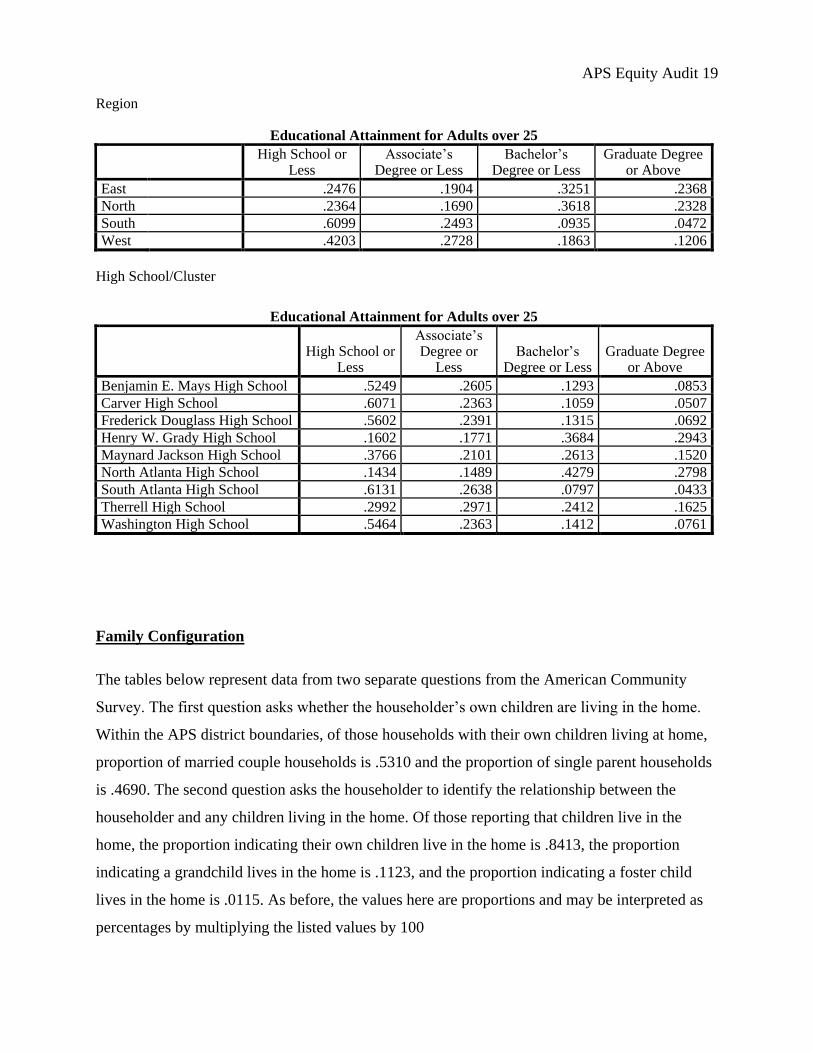
APS Equity Audit 19
Region
Educational Attainment for Adults over 25
High School or
Less Associate’s
Degree or Less Bachelor’s
Degree or Less Graduate Degree
or Above
East .2476 .1904 .3251 .2368
North .2364 .1690 .3618 .2328
South .6099 .2493 .0935 .0472
West .4203 .2728 .1863 .1206
High School/Cluster
Educational Attainment for Adults over 25
High School or
Less
Associate’s Degree or
Less Bachelor’s
Degree or Less Graduate Degree
or Above
Benjamin E. Mays High School .5249 .2605 .1293 .0853
Carver High School .6071 .2363 .1059 .0507
Frederick Douglass High School .5602 .2391 .1315 .0692
Henry W. Grady High School .1602 .1771 .3684 .2943
Maynard Jackson High School .3766 .2101 .2613 .1520
North Atlanta High School .1434 .1489 .4279 .2798
South Atlanta High School .6131 .2638 .0797 .0433
Therrell High School .2992 .2971 .2412 .1625
Washington High School .5464 .2363 .1412 .0761
Family Configuration
The tables below represent data from two separate questions from the American Community
Survey. The first question asks whether the householder’s own children are living in the home.
Within the APS district boundaries, of those households with their own children living at home,
proportion of married couple households is .5310 and the proportion of single parent households
is .4690. The second question asks the householder to identify the relationship between the
householder and any children living in the home. Of those reporting that children live in the
home, the proportion indicating their own children live in the home is .8413, the proportion
indicating a grandchild lives in the home is .1123, and the proportion indicating a foster child
lives in the home is .0115. As before, the values here are proportions and may be interpreted as
percentages by multiplying the listed values by 100

APS Equity Audit 20
APS Overall
Children in Households
Own Children in Household Children by Relationship to Householder
Married Couple
Households Single Parent Households Own Children Grandchild Foster Child
Proportion .5310 .4690 .8413 .1123 .0115
Std. Deviation .36489 .36489 .19082 .16157 .05322
Region
Children in Households
Own Children in Household Children by Relationship to Householder
Married Couple
Households Single Parent Households Own Children Grandchild Foster Child
East .6123 .3877 .8700 .0870 .0124
North .6586 .3414 .9070 .0558 .0110
South .3631 .6369 .7999 .1558 .0050
West .3599 .6401 .7630 .1720 .0094
High School/Cluster
Children in Households
Own Children in Household Children by Relationship to Householder
Married Couple
Households
Single Parent
Households Own Children Grandchild Foster Child
Benjamin E. Mays High School
.2141 .7859 .6974 .2113 .0203
Carver High School .2568 .7432 .7802 .1762 .0075
Frederick Douglass High School
.2312 .7688 .7696 .1523 .0228
Henry W. Grady High School .6941 .3059 .9459 .0358 .0099
Maynard Jackson High School .5273 .4727 .8030 .1321 .0146
North Atlanta High School .8306 .1694 .9773 .0065 .0050
South Atlanta High School .4513 .5487 .8170 .1381 .0027
Therrell High School .4650 .5350 .8152 .1442 .0007
Washington High School .2604 .7396 .7240 .1868 .0162
Housing
The Census Bureau also reports on the proportion of housing which is occupied or vacant across
communities. The values here are proportions and may be interpreted as percentages by
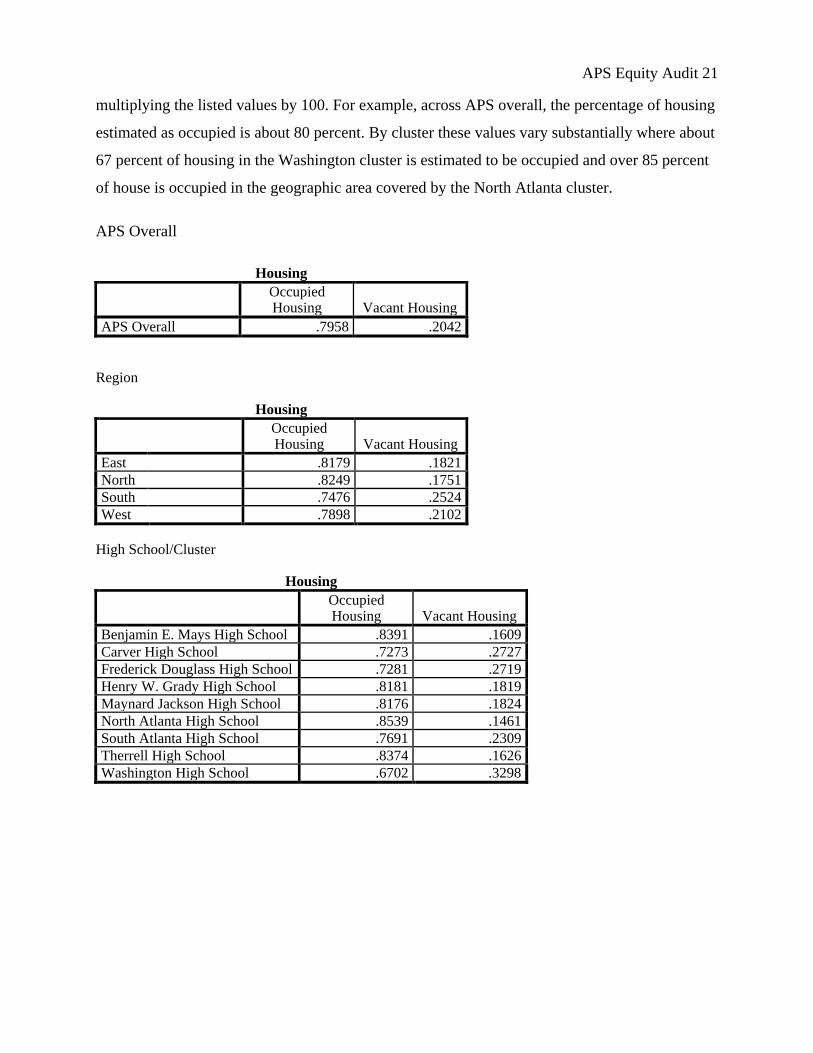
APS Equity Audit 21
multiplying the listed values by 100. For example, across APS overall, the percentage of housing
estimated as occupied is about 80 percent. By cluster these values vary substantially where about
67 percent of housing in the Washington cluster is estimated to be occupied and over 85 percent
of house is occupied in the geographic area covered by the North Atlanta cluster.
APS Overall
Housing
Occupied Housing Vacant Housing
APS Overall .7958 .2042
Region
Housing
Occupied Housing Vacant Housing
East .8179 .1821
North .8249 .1751
South .7476 .2524
West .7898 .2102
High School/Cluster
Housing
Occupied Housing Vacant Housing
Benjamin E. Mays High School .8391 .1609
Carver High School .7273 .2727
Frederick Douglass High School .7281 .2719
Henry W. Grady High School .8181 .1819
Maynard Jackson High School .8176 .1824
North Atlanta High School .8539 .1461
South Atlanta High School .7691 .2309
Therrell High School .8374 .1626
Washington High School .6702 .3298
APS Equity Audit 22
VI. School characteristics
A. Introduction
This section presents information on school level characteristics that impact students including
expenditures at the school level based on financial reporting data, playground and science lab
information, PTA and Foundation information from schools, and finally the characteristics of
individuals within schools at the leadership, teacher/classroom level, and individual student
level. Guided by prior education policy research, equity audits, and discussions with APS
leaders, we selected a variety of characteristics to examine across schools.
B. Finance
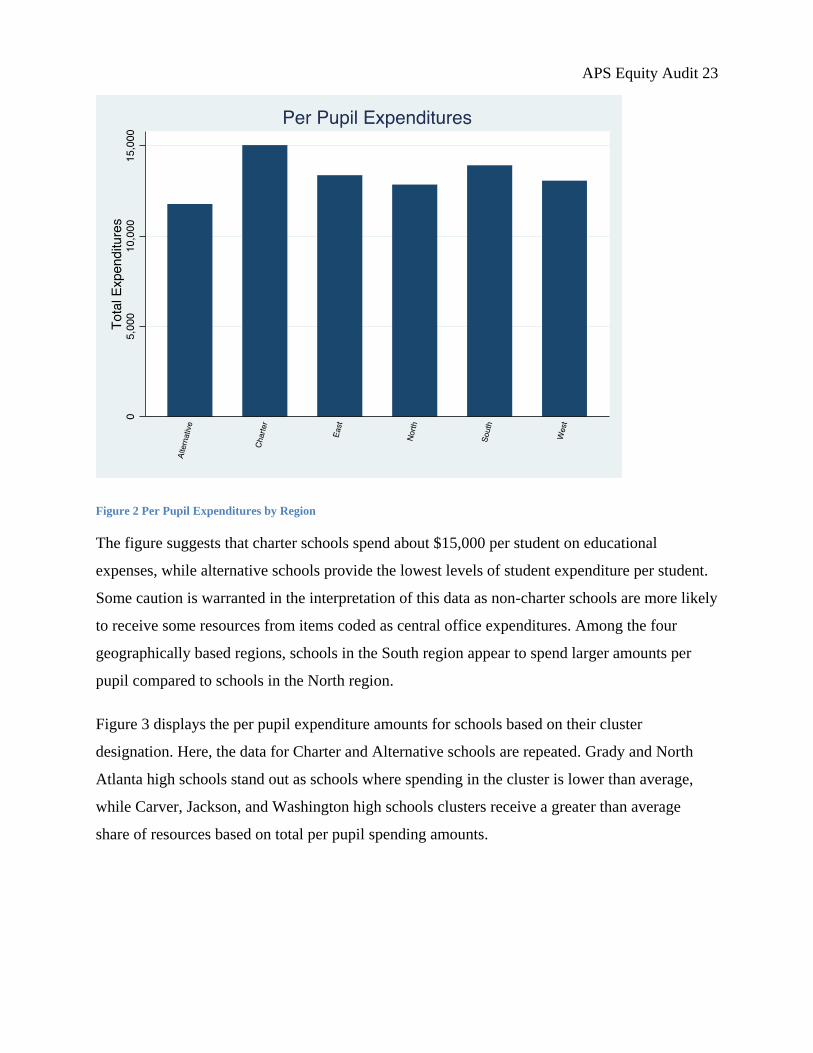
APS provided finance data with detailed information on expenditures coded using the Georgia
Department of Education’s Uniform Chart of Accounts. This coding scheme allows expenditures
to be categorized based on the intended use of the dollars expended. Fig. 2 below provides
information on the total average per pupil expenditure amounts based on district region.
Alternative and charter schools are separated into their own regions for the purposes of this audit.
Regional data are averaged here without weighting so that each school contributes an equal
amount to the regional average total per pupil expenditure amount. Central office expenditures
are allocated to each school based on their share of the district’s student population and school
populations were calculated using student level demographic files from APS.
APS Equity Audit 23
Figure 2 Per Pupil Expenditures by Region
The figure suggests that charter schools spend about $15,000 per student on educational
expenses, while alternative schools provide the lowest levels of student expenditure per student.
Some caution is warranted in the interpretation of this data as non-charter schools are more likely
to receive some resources from items coded as central office expenditures. Among the four
geographically based regions, schools in the South region appear to spend larger amounts per
pupil compared to schools in the North region.
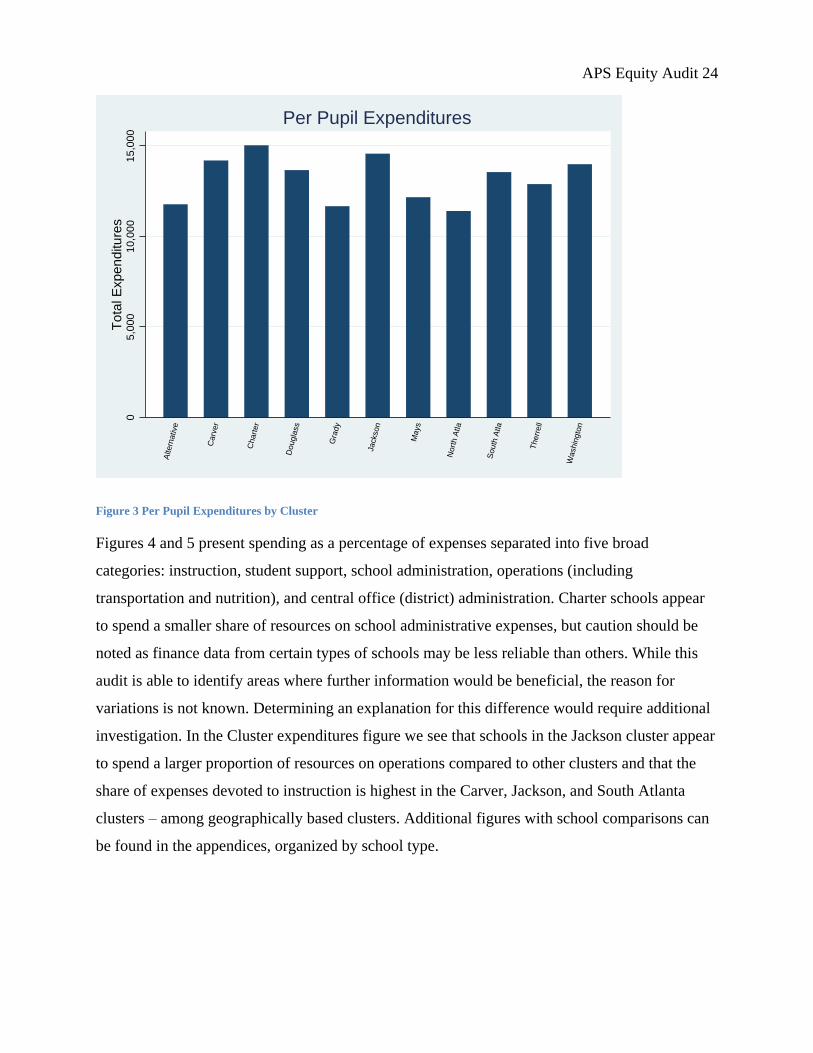
Figure 3 displays the per pupil expenditure amounts for schools based on their cluster
designation. Here, the data for Charter and Alternative schools are repeated. Grady and North
Atlanta high schools stand out as schools where spending in the cluster is lower than average,
while Carver, Jackson, and Washington high schools clusters receive a greater than average
share of resources based on total per pupil spending amounts.
APS Equity Audit 24
Figure 3 Per Pupil Expenditures by Cluster
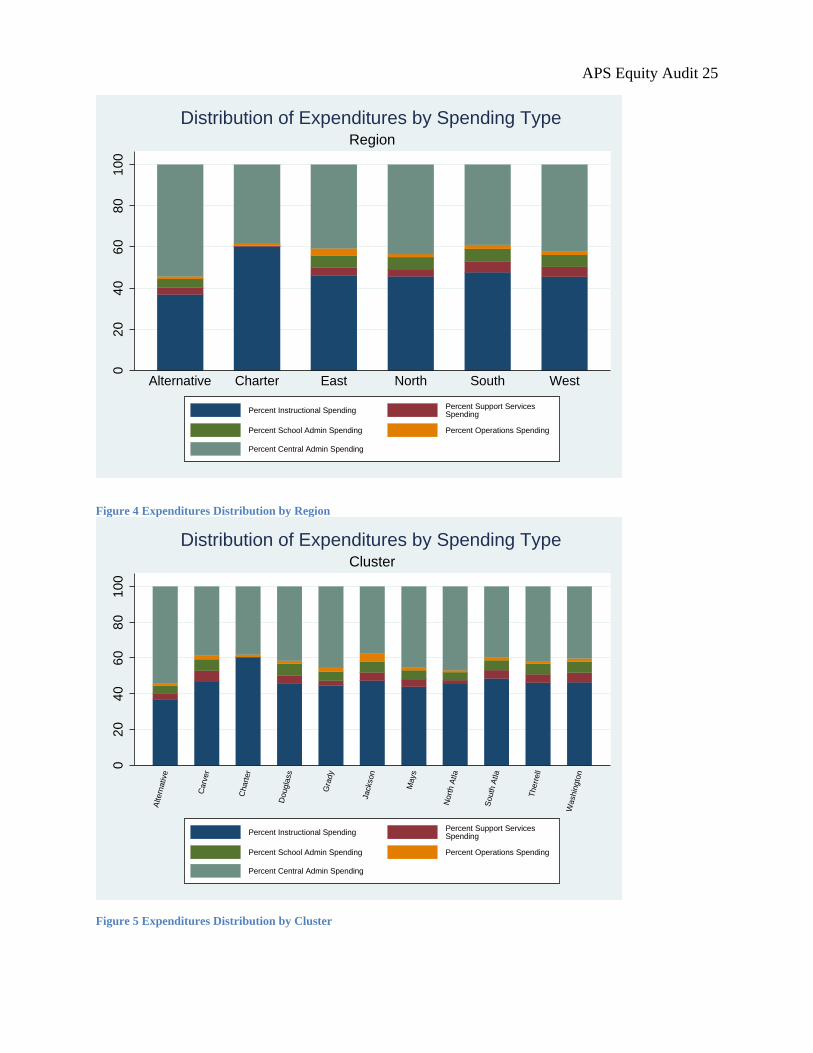
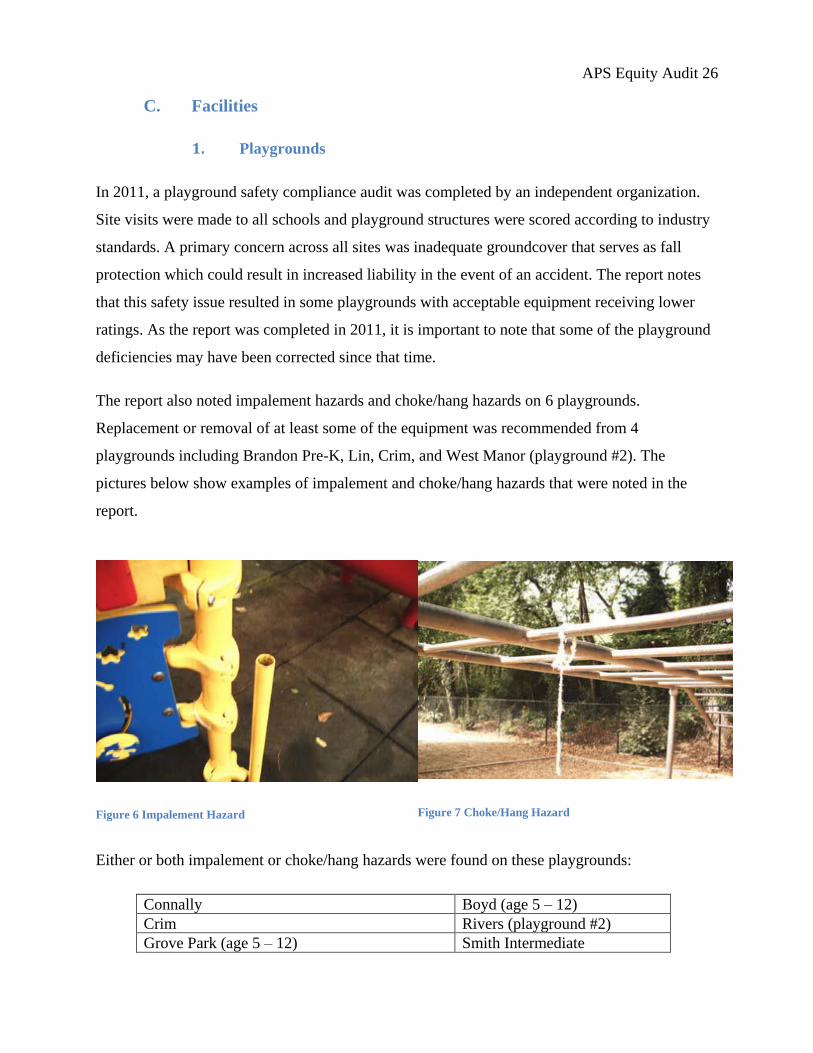
Figures 4 and 5 present spending as a percentage of expenses separated into five broad
categories: instruction, student support, school administration, operations (including
transportation and nutrition), and central office (district) administration. Charter schools appear
to spend a smaller share of resources on school administrative expenses, but caution should be
noted as finance data from certain types of schools may be less reliable than others. While this
audit is able to identify areas where further information would be beneficial, the reason for
variations is not known. Determining an explanation for this difference would require additional
investigation. In the Cluster expenditures figure we see that schools in the Jackson cluster appear
to spend a larger proportion of resources on operations compared to other clusters and that the
share of expenses devoted to instruction is highest in the Carver, Jackson, and South Atlanta
clusters – among geographically based clusters. Additional figures with school comparisons can
be found in the appendices, organized by school type.
05
,000
10,0
00
15
,00
0
To
tal E
xpen
ditu
res
Altern
ative
Carv
er
Chart
er
Dougla
ss
Gra
dy
Jackson
Mays
Nort
h A
tla
South
Atla
Therr
ell
Washin
gto
n
Per Pupil Expenditures
APS Equity Audit 25
Figure 4 Expenditures Distribution by Region
Figure 5 Expenditures Distribution by Cluster
020
40
60
80
100
Alternative Charter East North South West
Region
Distribution of Expenditures by Spending Type
Percent Instructional SpendingPercent Support Services Spending
Percent School Admin Spending Percent Operations Spending
Percent Central Admin Spending
020
40
60
80
100
Altern
ative
Carv
er
Chart
er
Dougla
ss
Gra
dy
Jackson
Mays
Nort
h A
tla
South
Atla
Therr
ell
Washin
gto
n
Cluster
Distribution of Expenditures by Spending Type
Percent Instructional SpendingPercent Support Services Spending
Percent School Admin Spending Percent Operations Spending
Percent Central Admin Spending
APS Equity Audit 26
C. Facilities
1. Playgrounds
In 2011, a playground safety compliance audit was completed by an independent organization.
Site visits were made to all schools and playground structures were scored according to industry
standards. A primary concern across all sites was inadequate groundcover that serves as fall
protection which could result in increased liability in the event of an accident. The report notes
that this safety issue resulted in some playgrounds with acceptable equipment receiving lower
ratings. As the report was completed in 2011, it is important to note that some of the playground
deficiencies may have been corrected since that time.
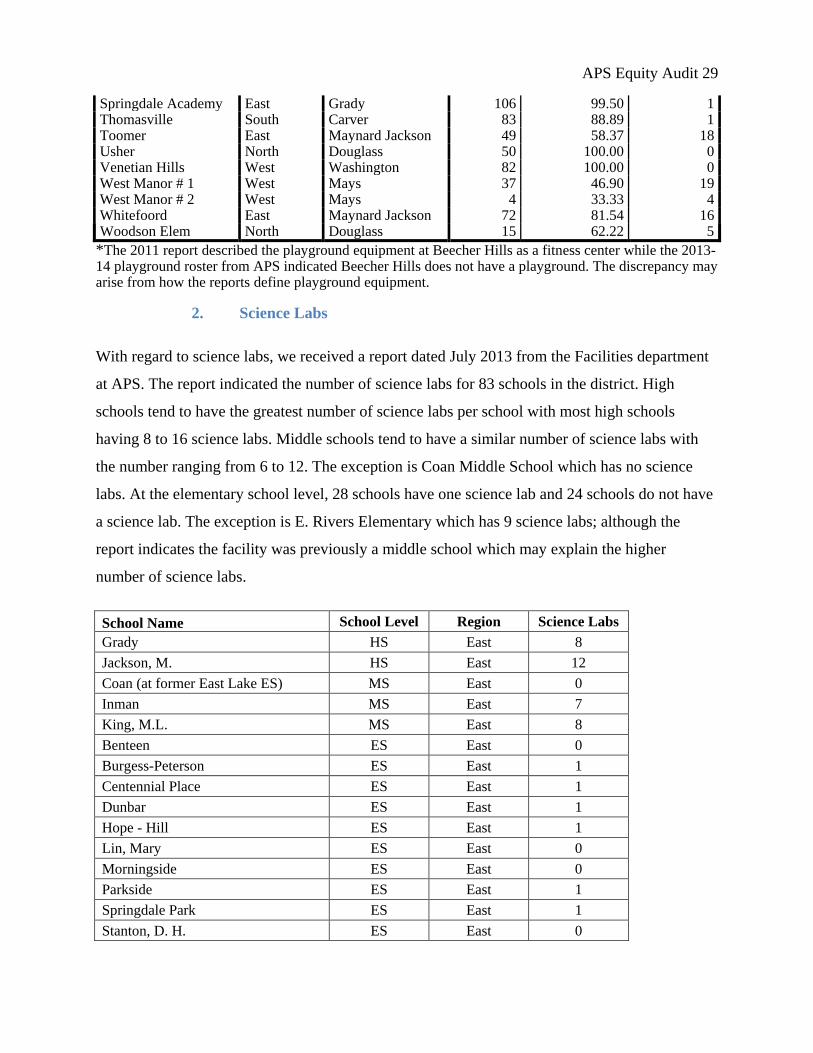
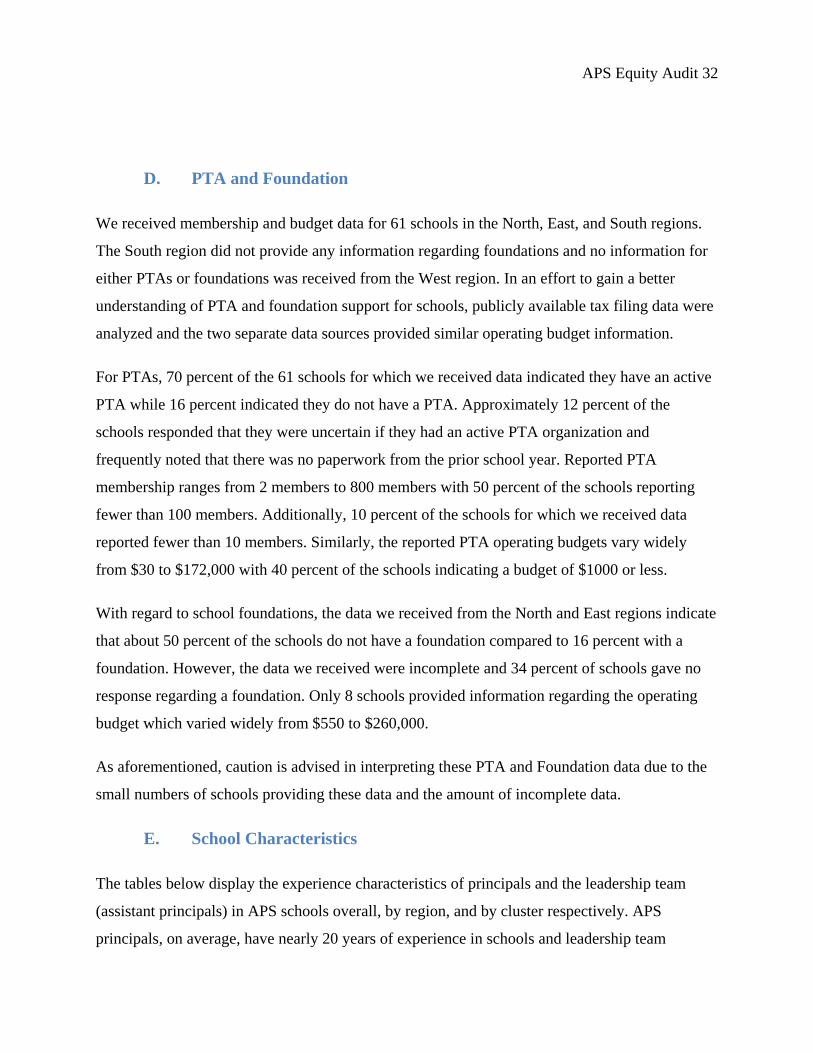
The report also noted impalement hazards and choke/hang hazards on 6 playgrounds.
Replacement or removal of at least some of the equipment was recommended from 4
playgrounds including Brandon Pre-K, Lin, Crim, and West Manor (playground #2). The
pictures below show examples of impalement and choke/hang hazards that were noted in the
report.
Figure 6 Impalement Hazard
Figure 7 Choke/Hang Hazard
Either or both impalement or choke/hang hazards were found on these playgrounds:
Connally Boyd (age 5 – 12)
Crim Rivers (playground #2)
Grove Park (age 5 – 12) Smith Intermediate

APS Equity Audit 27
In addition, the Garden Hills playground had an electrical panel and well pump house that could
be accessed by children. More positively, the report noted that the equipment at both M. Agnes
Jones and Venetian Hills elementary schools were in exceptionally good condition.
Separately, the 2013-14 playground roster from the APS facilities department indicates that the
following 9 schools do not have playgrounds:
Adamsville Finch
Beecher Hills Heritage
Cascade Humphries
Continental Colony Benteen
Hill/Hope
In the 2011 audit, playground safety in three areas was assessed: composite structures, free
standing, and site amenities. For composite structures, individual elements, such as, crawl
tunnels, hand rails, and slides, were rated. Free standing equipment includes merry-go-rounds,
see-saws, sand boxes, swings, and so on. Playground amenities include bike racks, benches, litter
containers and the play surface. Each element in these three categories was rated and these
ratings were summed across the three categories resulting in an overall score with higher
numbers indicating compliance with safety requirements.
Overall scores ranged from 4 to 118 and the average overall score was 55.79. In addition to the
overall score, the average total percent compliance across all three categories was also calculated
by dividing the number of inspected elements for each category by the number of substandard
elements. A substandard element represents a non-compliant safety concern that could result in
permanent disability and should be corrected immediately. Then, the percent compliance for
each of the categories was averaged together to get the average total percent compliance which
ranged from 19.44% compliance to 100% compliance. The number of substandard elements
ranged from zero to 24 with an average number of substandard elements of 7 per playground.

APS Equity Audit 28
Playground Region Cluster or Other Overall Score
Average Total Percent
Compliance
Number of Substandard
Elements
Beecher Hills* West Mays 90 64.81 6 Bolton Academy North North Atlanta 45 66.35 15 Boyd # 1 North Douglass 37 32.46 13 Boyd # 2, 5-12 North Douglass 28 71.94 9 Brandon North North Atlanta 84 99.66 1 Brandon Pre K North North Atlanta 25 19.44 7 Brandon Primary North North Atlanta 95 96.67 1 Burgess-Peterson East Maynard Jackson 64 69.52 9 Centennial East Grady 58 75.26 16 Cleveland South South Atlanta 65 65.78 13 Connally West Washington 41 98.81 1 Crim East Alternative School 19 54.17 8 D. H. Stanton East Maynard Jackson 14 68.06 7 Deerwood West Therrell 66 51.15 9 Dunbar East Maynard Jackson 29 60.42 11 F L Stanton North Douglass 73 83.33 1 Fain 5-12 North Douglass 59 69.46 24 Fain Pr K North Douglass 44 72.96 12 Fickett West Therrell 60 87.96 2 G A Towns North Douglass 65 100.00 0 Garden Hills North North Atlanta 47 57.62 14 Gideons South Carver 74 91.88 2 Grove Park North Douglass 60 100.00 0 Grove Park 5-12 North Douglass 84 95.83 1 Hutchinson South South Atlanta 65 58.84 14 Jackson # 1 North North Atlanta 89 97.78 2 Jackson # 2 North North Atlanta 118 100.00 0 Jackson Primary North North Atlanta 50 100.00 0 John F Kennedy West Alternative School 65 100.00 0 Kimberly 5-12 West Therrell 54 65.59 6 Kimberly Pre K 1 West Therrell 36 82.01 4 Lin East Grady 75 84.39 10 M A Jones West Washington 94 91.67 1 Miles West Mays 71 97.53 2 Morningside Elem East Grady 31 63.10 7 Morningside Elem 5 - 12
East Grady 80 91.67 2
Parkside East Maynard Jackson 40 81.72 17 Perkerson Elem South Carver 4 78.89 13 Peyton Forrest West Mays 37 77.78 2 Rivers # 1 North North Atlanta 43 43.80 12 Rivers # 2 North North Atlanta 61 71.43 15 Scott 5 - 12 North Douglass 28 62.08 9 Scott Pre K North Douglass 78 91.67 1 Slater South Carver 100 92.80 2 Smith intermediate North North Atlanta 26 42.06 7 Smith Primary # 1 North North Atlanta 54 87.83 3 Smith Primary # 2 North North Atlanta 27 48.89 9 Smith Primary # 3 North North Atlanta 30 41.67 17
APS Equity Audit 29
Springdale Academy East Grady 106 99.50 1 Thomasville South Carver 83 88.89 1 Toomer East Maynard Jackson 49 58.37 18 Usher North Douglass 50 100.00 0 Venetian Hills West Washington 82 100.00 0 West Manor # 1 West Mays 37 46.90 19 West Manor # 2 West Mays 4 33.33 4 Whitefoord East Maynard Jackson 72 81.54 16 Woodson Elem North Douglass 15 62.22 5
*The 2011 report described the playground equipment at Beecher Hills as a fitness center while the 2013-14 playground roster from APS indicated Beecher Hills does not have a playground. The discrepancy may arise from how the reports define playground equipment.
2. Science Labs
With regard to science labs, we received a report dated July 2013 from the Facilities department
at APS. The report indicated the number of science labs for 83 schools in the district. High
schools tend to have the greatest number of science labs per school with most high schools
having 8 to 16 science labs. Middle schools tend to have a similar number of science labs with
the number ranging from 6 to 12. The exception is Coan Middle School which has no science
labs. At the elementary school level, 28 schools have one science lab and 24 schools do not have
a science lab. The exception is E. Rivers Elementary which has 9 science labs; although the
report indicates the facility was previously a middle school which may explain the higher
number of science labs.
School Name School Level Region Science Labs
Grady HS East 8
Jackson, M. HS East 12
Coan (at former East Lake ES) MS East 0
Inman MS East 7
King, M.L. MS East 8
Benteen ES East 0
Burgess-Peterson ES East 1
Centennial Place ES East 1
Dunbar ES East 1
Hope - Hill ES East 1
Lin, Mary ES East 0
Morningside ES East 0
Parkside ES East 1
Springdale Park ES East 1
Stanton, D. H. ES East 0

APS Equity Audit 30
Toomer ES East 0
Whitefoord ES East 0
Douglass HS North 10
North Atlanta (New) HS North 16
BEST (includes MS) HS North 14
BEST (see HS) MS
King, C.S. (includes MS) HS North 10
King, C.S. (see HS) MS
Harper - Archer MS North 9
Sutton (at former N. Atlanta HS) MS North 10
Bolton Academy ES North 1
Boyd ES North 1
Brandon ES North 1
Brandon Primary ES North 0
Fain ES North 1
Garden Hills ES North 1
Grove Park ES North 0
Jackson ES North 0
Jackson Primary ES North 0
Rivers (at former Sutton MS) ES North 9
Scott ES North 0
Smith Intermediate ES North 1
Smith, Sarah ES North 0
Stanton, F. L. ES North 1
Towns ES North 0
Usher - Collier ES North 1
Woodson ES North 0
Carver HS South 10
South Atlanta HS South 11
Long MS South 9
Price MS South 9
Sylvan (at former Parks MS) MS South 6
Cleveland ES South 1
Dobbs ES South 1
Finch ES South 1
Gideons ES South 1
Heritage Academy ES South 1
Humphries ES South 0
Hutchinson ES South 0
Perkerson ES South 1
Slater ES South 1

APS Equity Audit 31
Thomasville Heights ES South 0
Mays HS West 12
Therrell HS West 12
Washington HS West 12
Brown MS West 9
Bunche (at former Archer HS) MS West 12
Kennedy MS West 9
Young MS West 9
Adamsville ES West 0
Beecher Hills ES West 0
Bethune ES West 0
Cascade ES West 0
Connally ES West 1
Continental Colony ES West 1
Deerwood Academy ES West 1
Fickett ES West 1
Jones, M. A. ES West 1
Kimberly ES West 0
Miles ES West 1
Peyton Forest ES West 0
Venetian Hills ES West 1
West Manor ES West 0
Crim Alternative East 4
Forrest Hill Alternative South 0
North Metro (Oglethorpe) Alternative West 0
South Metro (Marshall) Alternative East 4
West End Academy (Blalock) Alternative West 1
APS Equity Audit 32
D. PTA and Foundation
We received membership and budget data for 61 schools in the North, East, and South regions.
The South region did not provide any information regarding foundations and no information for
either PTAs or foundations was received from the West region. In an effort to gain a better
understanding of PTA and foundation support for schools, publicly available tax filing data were
analyzed and the two separate data sources provided similar operating budget information.
For PTAs, 70 percent of the 61 schools for which we received data indicated they have an active
PTA while 16 percent indicated they do not have a PTA. Approximately 12 percent of the
schools responded that they were uncertain if they had an active PTA organization and
frequently noted that there was no paperwork from the prior school year. Reported PTA
membership ranges from 2 members to 800 members with 50 percent of the schools reporting
fewer than 100 members. Additionally, 10 percent of the schools for which we received data
reported fewer than 10 members. Similarly, the reported PTA operating budgets vary widely
from $30 to $172,000 with 40 percent of the schools indicating a budget of $1000 or less.
With regard to school foundations, the data we received from the North and East regions indicate
that about 50 percent of the schools do not have a foundation compared to 16 percent with a
foundation. However, the data we received were incomplete and 34 percent of schools gave no
response regarding a foundation. Only 8 schools provided information regarding the operating
budget which varied widely from $550 to $260,000.
As aforementioned, caution is advised in interpreting these PTA and Foundation data due to the
small numbers of schools providing these data and the amount of incomplete data.
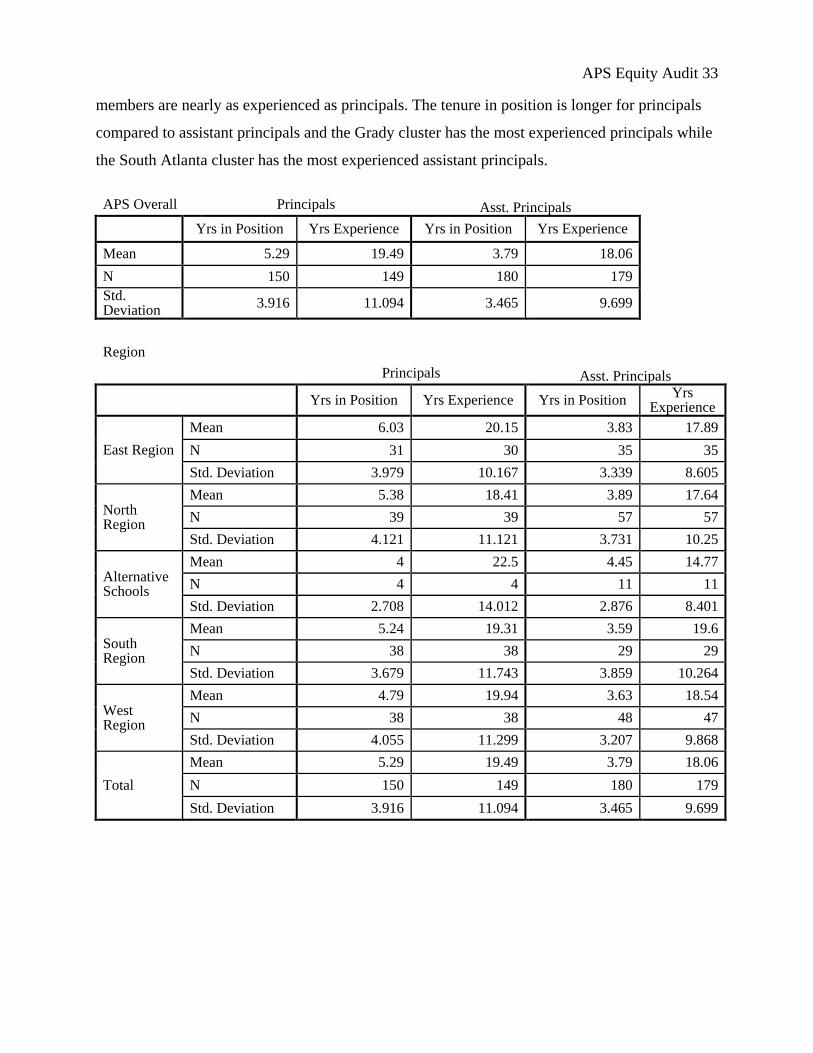
E. School Characteristics
The tables below display the experience characteristics of principals and the leadership team
(assistant principals) in APS schools overall, by region, and by cluster respectively. APS
principals, on average, have nearly 20 years of experience in schools and leadership team
APS Equity Audit 33
members are nearly as experienced as principals. The tenure in position is longer for principals
compared to assistant principals and the Grady cluster has the most experienced principals while
the South Atlanta cluster has the most experienced assistant principals.
APS Overall Principals Asst. Principals
Yrs in Position Yrs Experience Yrs in Position Yrs Experience
Mean 5.29 19.49 3.79 18.06
N 150 149 180 179
Std. Deviation
3.916 11.094 3.465 9.699
Region
Principals Asst. Principals
Yrs in Position Yrs Experience Yrs in Position
Yrs Experience
East Region
Mean 6.03 20.15 3.83 17.89
N 31 30 35 35
Std. Deviation 3.979 10.167 3.339 8.605
North Region
Mean 5.38 18.41 3.89 17.64
N 39 39 57 57
Std. Deviation 4.121 11.121 3.731 10.25
Alternative Schools
Mean 4 22.5 4.45 14.77
N 4 4 11 11
Std. Deviation 2.708 14.012 2.876 8.401
South Region
Mean 5.24 19.31 3.59 19.6
N 38 38 29 29
Std. Deviation 3.679 11.743 3.859 10.264
West Region
Mean 4.79 19.94 3.63 18.54
N 38 38 48 47
Std. Deviation 4.055 11.299 3.207 9.868
Total
Mean 5.29 19.49 3.79 18.06
N 150 149 180 179
Std. Deviation 3.916 11.094 3.465 9.699

APS Equity Audit 34
Cluster
Principals Asst. Principals
Yrs in Position Yrs Experience Yrs in Position
Yrs Experience
Carver Cluster
Mean 5.1 20.85 3.63 18.5
N 20 20 16 16
Std. Deviation 3.796 12.654 3.897 9.98
Douglass Cluster
Mean 4.89 18.98 3.53 15.97
N 27 27 30 30
Std. Deviation 3.955 10.635 3.511 9.727
Grady Cluster
Mean 7.33 22.6 4.8 19.7
N 15 14 20 20
Std. Deviation 3.658 10.56 3.778 8.523
Jackson Cluster
Mean 4.81 18 2.53 15.47
N 16 16 15 15
Std. Deviation 3.987 9.626 2.134 8.383
Mays Cluster
Mean 5.3 19.3 3.05 19.05
N 10 10 21 21
Std. Deviation 4.218 14.492 2.291 8.152
North Atlanta Cluster
Mean 6.5 17.13 4.3 19.5
N 12 12 27 27
Std. Deviation 4.442 12.542 3.989 10.675
Alternative Schools
Mean 4 22.5 4.45 14.77
N 4 4 11 11
Std. Deviation 2.708 14.012 2.876 8.401
South Atlanta Cluster
Mean 5.39 17.61 3.54 20.95
N 18 18 13 13
Std. Deviation 3.648 10.738 3.971 10.85
Therrell Cluster
Mean 5.6 19.77 4 19.45
N 15 15 12 11
Std. Deviation 4.306 9.745 3.885 10.113
Washington Cluster
Mean 3.46 20.63 4.13 17.14
N 13 13 15 15
Std. Deviation 3.573 11.156 3.777 12.2
Total
Mean 5.29 19.49 3.79 18.06
N 150 149 180 179
Std. Deviation 3.916 11.094 3.465 9.699
APS Equity Audit 35
F. Teacher Characteristics
Teacher data compiled for the equity audit includes information on teachers’ years of experience
and an indicator variable for teachers with less than three years of teaching experience.
Inexperienced teachers demonstrate decreased effectiveness measured by student math and
reading achievement tests (Boyd, Grossman, Langford, Loeb, & Wycoff, 2008; Henry, Fortner,
and Bastian, 2012). Additional teacher characteristics include the proportion of students testing
proficient on CRCT or EOCT exams, the teachers APS calculated value added score, the number
of teacher absences during the 2012-13 school year, and four ratings of the classroom
environment as rated by student surveys.
These tables represent the mean values weighted by unique student within subject observations.
Because many students have multiple teachers during a school day, a simple average of teacher
characteristics where each teacher represents an equal contribution to the average does not truly
reflect the average student’s experience in the classroom. This method counts each students entry
in the system wide roster as a unique observation. If a student is listed six times, once for each
course period during a typical day, the experience of each of the six unique teachers is averaged
to reflect the average level of teacher experience encountered by a specific student over the
course of the school day. In this way, a teacher who teaches 25 students provides more weight to
the school’s average experience level than a teacher who teaches only 20 unique students. This
weighting scheme will bias estimates toward teachers with larger numbers of students, which is
likely to be the case in middle and high schools. Estimates in the appendix which compare values
across specific school types will not suffer from this limitation. Because school regions and
clusters are relatively uniform in their distribution of students across grades, values for region
and cluster should be comparable. Also, the tables presented here include all students enrolled in
APS for which there are available data. The appendices include tables restricted to individual
students based on specific characteristics, such as gender, race/ethnicity, or economic
disadvantage.
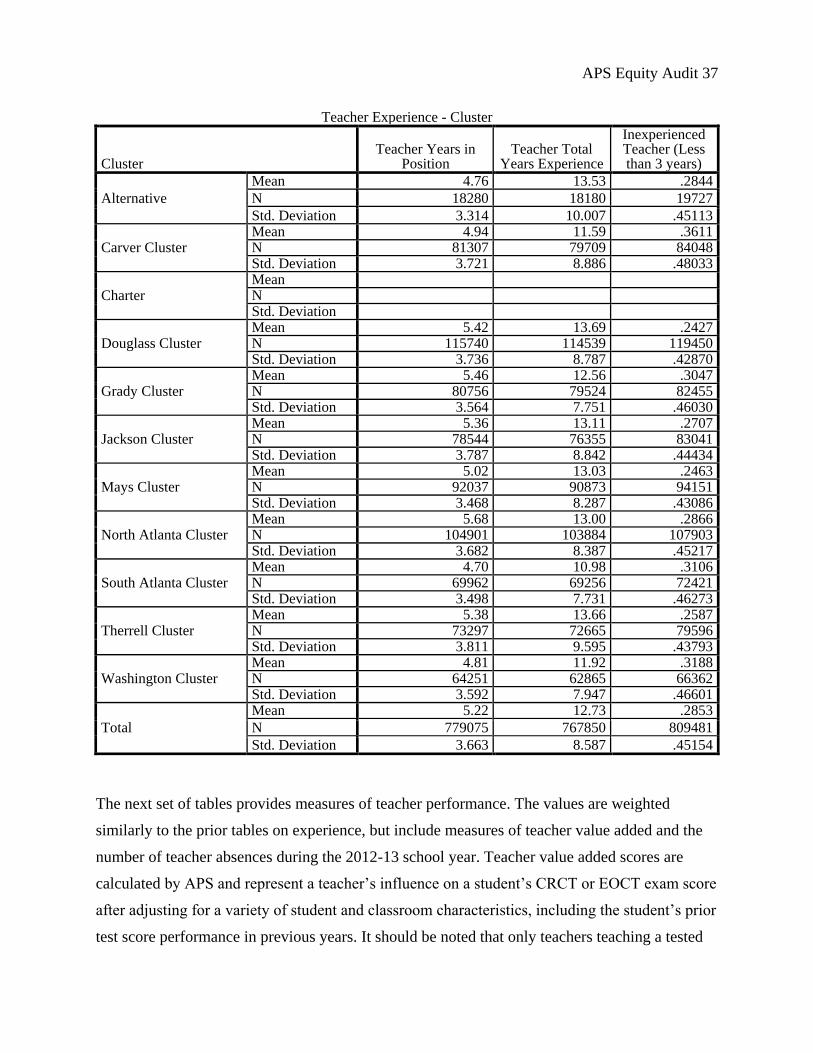
The Teacher Experience tables below present information on the average number of years that
teachers have been working in a particular school. Across the APS system, the average student is
in a classroom with a teacher who has been working in a particular school for about 5.22 years.

APS Equity Audit 36
The average student’s teacher has about 12.7 years of teaching experience overall. Because prior
literature indicates that inexperienced teachers (those with less than three years of teaching
experience) are usually less effective at increasing student test score performance, we include an
indication of the proportion of time that students are taught by an inexperienced teacher.
Students in Alternative schools spent about 28 percent of their time in classrooms with
inexperienced teachers (0.2844) in comparison to the Carver cluster where students had an
inexperienced teacher about 36 percent of the school day (0.3611). A number of characteristics
for teachers in charter schools were unavailable for this report and are omitted from these tables.
Teacher Experience - APS Overall
Teacher Years in Position Teacher Total Years
Experience
Inexperienced Teacher (Less than 3
years)
Mean 5.22 12.73 .2853 N 779075 767850 809481 Std. Deviation 3.663 8.587 .45154
Teacher Experience - Region
Region Teacher Years in
Position Teacher Total
Years Experience
Inexperienced Teacher (Less than 3 years)
Alternative
Mean 4.76 13.53 .2844
N 18280 18180 19727
Std. Deviation 3.314 10.007 .45113
Charter Mean N Std. Deviation
East Region Mean 5.41 12.83 .2877 N 159300 155879 165496 Std. Deviation 3.676 8.308 .45268
North Region Mean 5.55 13.36 .2635 N 220641 218423 227353 Std. Deviation 3.713 8.606 .44054
South Region Mean 4.83 11.30 .3377 N 151269 148965 156469 Std. Deviation 3.622 8.375 .47293
West Region Mean 5.07 12.92 .2704 N 229585 226403 240109 Std. Deviation 3.622 8.666 .44419
Total
Mean 5.22 12.73 .2853
N 779075 767850 809481
Std. Deviation 3.663 8.587 .45154
APS Equity Audit 37
Teacher Experience - Cluster
Cluster Teacher Years in
Position Teacher Total
Years Experience
Inexperienced Teacher (Less than 3 years)
Alternative
Mean 4.76 13.53 .2844
N 18280 18180 19727
Std. Deviation 3.314 10.007 .45113
Carver Cluster Mean 4.94 11.59 .3611 N 81307 79709 84048 Std. Deviation 3.721 8.886 .48033
Charter Mean N Std. Deviation
Douglass Cluster Mean 5.42 13.69 .2427 N 115740 114539 119450 Std. Deviation 3.736 8.787 .42870
Grady Cluster Mean 5.46 12.56 .3047 N 80756 79524 82455 Std. Deviation 3.564 7.751 .46030
Jackson Cluster Mean 5.36 13.11 .2707 N 78544 76355 83041 Std. Deviation 3.787 8.842 .44434
Mays Cluster Mean 5.02 13.03 .2463 N 92037 90873 94151 Std. Deviation 3.468 8.287 .43086
North Atlanta Cluster Mean 5.68 13.00 .2866 N 104901 103884 107903 Std. Deviation 3.682 8.387 .45217
South Atlanta Cluster Mean 4.70 10.98 .3106 N 69962 69256 72421 Std. Deviation 3.498 7.731 .46273
Therrell Cluster Mean 5.38 13.66 .2587 N 73297 72665 79596 Std. Deviation 3.811 9.595 .43793
Washington Cluster Mean 4.81 11.92 .3188 N 64251 62865 66362 Std. Deviation 3.592 7.947 .46601
Total
Mean 5.22 12.73 .2853
N 779075 767850 809481
Std. Deviation 3.663 8.587 .45154
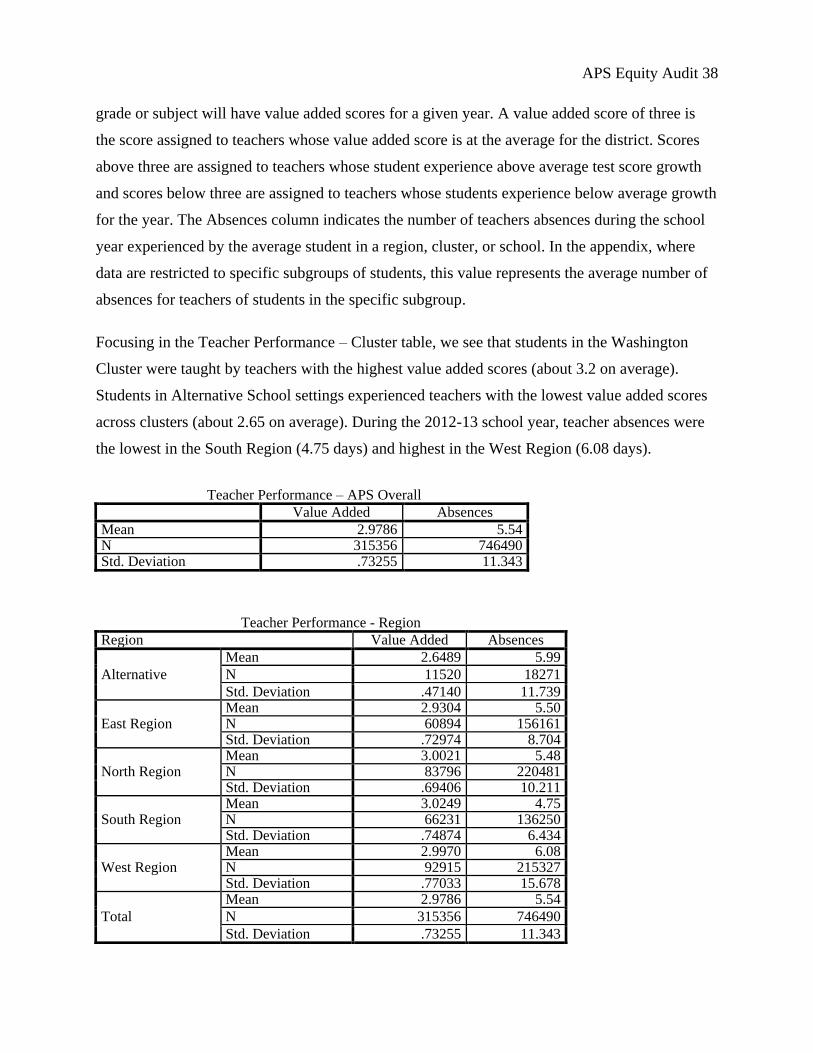
The next set of tables provides measures of teacher performance. The values are weighted
similarly to the prior tables on experience, but include measures of teacher value added and the
number of teacher absences during the 2012-13 school year. Teacher value added scores are
calculated by APS and represent a teacher’s influence on a student’s CRCT or EOCT exam score
after adjusting for a variety of student and classroom characteristics, including the student’s prior
test score performance in previous years. It should be noted that only teachers teaching a tested
APS Equity Audit 38
grade or subject will have value added scores for a given year. A value added score of three is
the score assigned to teachers whose value added score is at the average for the district. Scores
above three are assigned to teachers whose student experience above average test score growth
and scores below three are assigned to teachers whose students experience below average growth
for the year. The Absences column indicates the number of teachers absences during the school
year experienced by the average student in a region, cluster, or school. In the appendix, where
data are restricted to specific subgroups of students, this value represents the average number of
absences for teachers of students in the specific subgroup.
Focusing in the Teacher Performance – Cluster table, we see that students in the Washington
Cluster were taught by teachers with the highest value added scores (about 3.2 on average).
Students in Alternative School settings experienced teachers with the lowest value added scores
across clusters (about 2.65 on average). During the 2012-13 school year, teacher absences were
the lowest in the South Region (4.75 days) and highest in the West Region (6.08 days).
Teacher Performance – APS Overall
Value Added Absences
Mean 2.9786 5.54 N 315356 746490 Std. Deviation .73255 11.343
Teacher Performance - Region
Region Value Added Absences
Alternative
Mean 2.6489 5.99
N 11520 18271
Std. Deviation .47140 11.739
East Region Mean 2.9304 5.50 N 60894 156161 Std. Deviation .72974 8.704
North Region Mean 3.0021 5.48 N 83796 220481 Std. Deviation .69406 10.211
South Region Mean 3.0249 4.75 N 66231 136250 Std. Deviation .74874 6.434
West Region Mean 2.9970 6.08 N 92915 215327 Std. Deviation .77033 15.678
Total
Mean 2.9786 5.54
N 315356 746490
Std. Deviation .73255 11.343

APS Equity Audit 39
Teacher Performance - Cluster
Cluster Value Added Absences
Alternative
Mean 2.6489 5.99
N 11520 18271
Std. Deviation .47140 11.739
Carver Cluster Mean 3.0314 5.25 N 37660 74169 Std. Deviation .69493 7.246
Douglass Cluster Mean 2.9765 5.53 N 47947 115590 Std. Deviation .68266 11.106
Grady Cluster Mean 2.9530 5.28 N 28800 80644 Std. Deviation .80482 7.994
Jackson Cluster Mean 2.9101 5.74 N 32094 75517 Std. Deviation .65443 9.397
Mays Cluster Mean 2.8053 6.19 N 39364 85932 Std. Deviation .69458 11.378
North Atlanta Cluster Mean 3.0362 5.42 N 35849 104891 Std. Deviation .70758 9.123
South Atlanta Cluster Mean 3.0163 4.16 N 28571 62081 Std. Deviation .81419 5.241
Therrell Cluster Mean 3.0741 7.18 N 28260 65144 Std. Deviation .70798 20.639
Washington Cluster Mean 3.2092 4.80 N 25291 64251 Std. Deviation .87193 14.691
Total
Mean 2.9786 5.54
N 315356 746490
Std. Deviation .73255 11.343
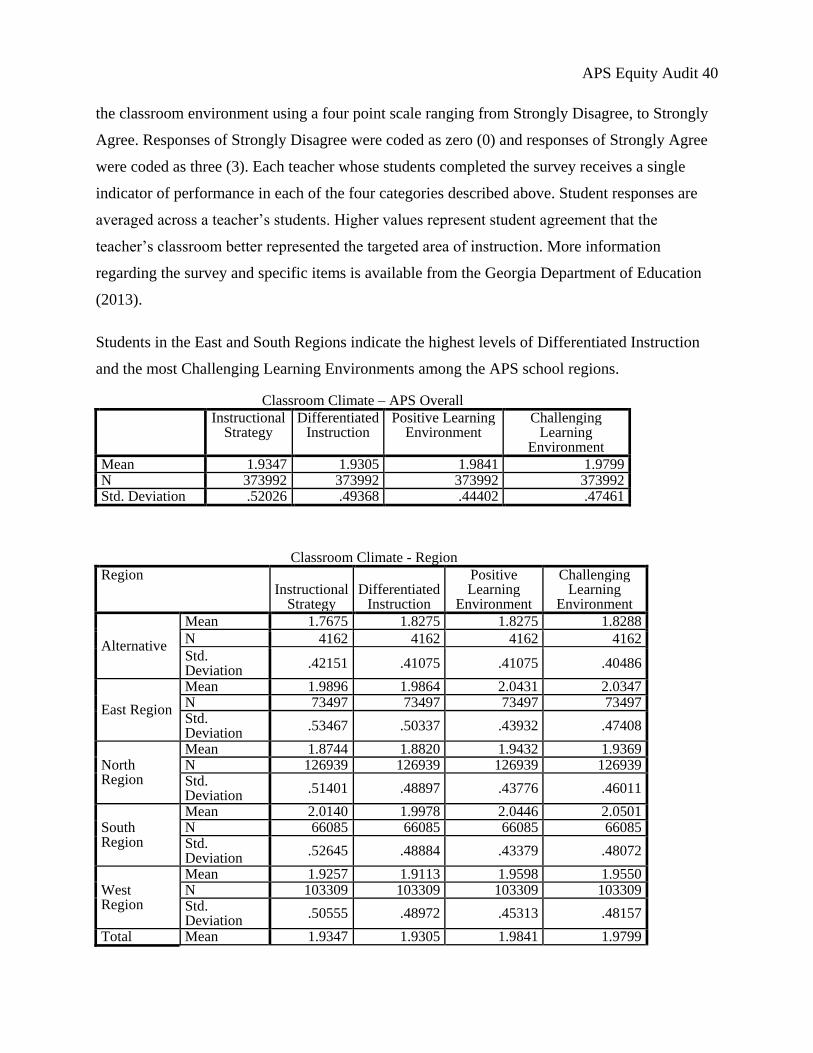
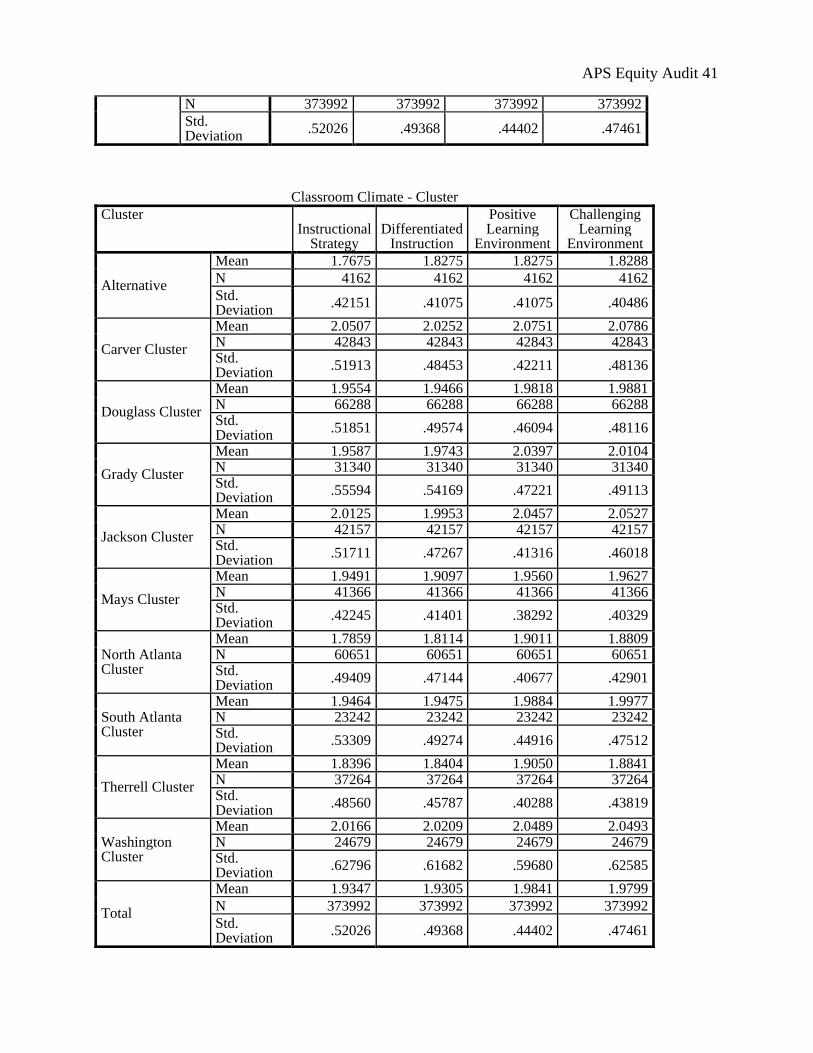
The final set of tables linked to teachers is a classroom level measure of the climate within APS
schools. During the 2012-13 school year, students in non-charter schools completed surveys
regarding the characteristics of teacher’s classrooms. These data were linked to teachers and is
displayed here in table format. The survey focuses on four characteristics of classrooms
described as Instructional Strategy, Differentiated Instruction, Positive Learning Environment,
and Challenging Learning Environment. Student survey responses were completed using a Likert
scale where students indicated their disagreement or agreement with specific statements about
APS Equity Audit 40
the classroom environment using a four point scale ranging from Strongly Disagree, to Strongly
Agree. Responses of Strongly Disagree were coded as zero (0) and responses of Strongly Agree
were coded as three (3). Each teacher whose students completed the survey receives a single
indicator of performance in each of the four categories described above. Student responses are
averaged across a teacher’s students. Higher values represent student agreement that the
teacher’s classroom better represented the targeted area of instruction. More information
regarding the survey and specific items is available from the Georgia Department of Education
(2013).
Students in the East and South Regions indicate the highest levels of Differentiated Instruction
and the most Challenging Learning Environments among the APS school regions.
Classroom Climate – APS Overall
Instructional Strategy
Differentiated Instruction
Positive Learning Environment
Challenging Learning
Environment
Mean 1.9347 1.9305 1.9841 1.9799 N 373992 373992 373992 373992 Std. Deviation .52026 .49368 .44402 .47461
Classroom Climate - Region
Region Instructional
Strategy Differentiated
Instruction
Positive Learning
Environment
Challenging Learning
Environment
Alternative
Mean 1.7675 1.8275 1.8275 1.8288
N 4162 4162 4162 4162
Std. Deviation
.42151 .41075 .41075 .40486
East Region
Mean 1.9896 1.9864 2.0431 2.0347 N 73497 73497 73497 73497 Std. Deviation
.53467 .50337 .43932 .47408
North Region
Mean 1.8744 1.8820 1.9432 1.9369 N 126939 126939 126939 126939 Std. Deviation
.51401 .48897 .43776 .46011
South Region
Mean 2.0140 1.9978 2.0446 2.0501 N 66085 66085 66085 66085 Std. Deviation
.52645 .48884 .43379 .48072
West Region
Mean 1.9257 1.9113 1.9598 1.9550 N 103309 103309 103309 103309 Std. Deviation
.50555 .48972 .45313 .48157
Total Mean 1.9347 1.9305 1.9841 1.9799
APS Equity Audit 41
N 373992 373992 373992 373992
Std. Deviation
.52026 .49368 .44402 .47461
Classroom Climate - Cluster
Cluster Instructional
Strategy Differentiated
Instruction
Positive Learning
Environment
Challenging Learning
Environment
Alternative
Mean 1.7675 1.8275 1.8275 1.8288
N 4162 4162 4162 4162
Std. Deviation
.42151 .41075 .41075 .40486
Carver Cluster
Mean 2.0507 2.0252 2.0751 2.0786 N 42843 42843 42843 42843 Std. Deviation
.51913 .48453 .42211 .48136
Douglass Cluster
Mean 1.9554 1.9466 1.9818 1.9881 N 66288 66288 66288 66288 Std. Deviation
.51851 .49574 .46094 .48116
Grady Cluster
Mean 1.9587 1.9743 2.0397 2.0104 N 31340 31340 31340 31340 Std. Deviation
.55594 .54169 .47221 .49113
Jackson Cluster
Mean 2.0125 1.9953 2.0457 2.0527 N 42157 42157 42157 42157 Std. Deviation
.51711 .47267 .41316 .46018
Mays Cluster
Mean 1.9491 1.9097 1.9560 1.9627 N 41366 41366 41366 41366 Std. Deviation
.42245 .41401 .38292 .40329
North Atlanta Cluster
Mean 1.7859 1.8114 1.9011 1.8809 N 60651 60651 60651 60651 Std. Deviation
.49409 .47144 .40677 .42901
South Atlanta Cluster
Mean 1.9464 1.9475 1.9884 1.9977 N 23242 23242 23242 23242 Std. Deviation
.53309 .49274 .44916 .47512
Therrell Cluster
Mean 1.8396 1.8404 1.9050 1.8841 N 37264 37264 37264 37264 Std. Deviation
.48560 .45787 .40288 .43819
Washington Cluster
Mean 2.0166 2.0209 2.0489 2.0493 N 24679 24679 24679 24679 Std. Deviation
.62796 .61682 .59680 .62585
Total
Mean 1.9347 1.9305 1.9841 1.9799
N 373992 373992 373992 373992
Std. Deviation
.52026 .49368 .44402 .47461
APS Equity Audit 42
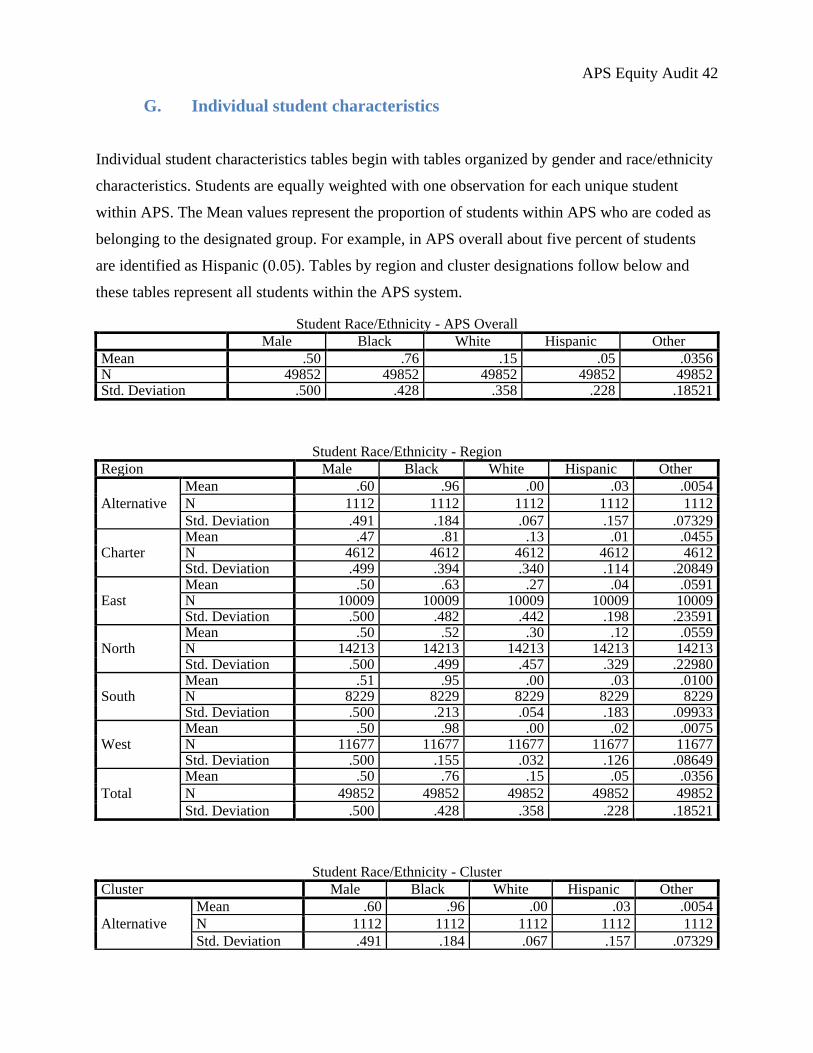
G. Individual student characteristics
Individual student characteristics tables begin with tables organized by gender and race/ethnicity
characteristics. Students are equally weighted with one observation for each unique student
within APS. The Mean values represent the proportion of students within APS who are coded as
belonging to the designated group. For example, in APS overall about five percent of students
are identified as Hispanic (0.05). Tables by region and cluster designations follow below and
these tables represent all students within the APS system.
Student Race/Ethnicity - APS Overall
Male Black White Hispanic Other
Mean .50 .76 .15 .05 .0356 N 49852 49852 49852 49852 49852 Std. Deviation .500 .428 .358 .228 .18521
Student Race/Ethnicity - Region
Region Male Black White Hispanic Other
Alternative
Mean .60 .96 .00 .03 .0054
N 1112 1112 1112 1112 1112
Std. Deviation .491 .184 .067 .157 .07329
Charter Mean .47 .81 .13 .01 .0455 N 4612 4612 4612 4612 4612 Std. Deviation .499 .394 .340 .114 .20849
East Mean .50 .63 .27 .04 .0591 N 10009 10009 10009 10009 10009 Std. Deviation .500 .482 .442 .198 .23591
North Mean .50 .52 .30 .12 .0559 N 14213 14213 14213 14213 14213 Std. Deviation .500 .499 .457 .329 .22980
South Mean .51 .95 .00 .03 .0100 N 8229 8229 8229 8229 8229 Std. Deviation .500 .213 .054 .183 .09933
West Mean .50 .98 .00 .02 .0075 N 11677 11677 11677 11677 11677 Std. Deviation .500 .155 .032 .126 .08649
Total
Mean .50 .76 .15 .05 .0356
N 49852 49852 49852 49852 49852
Std. Deviation .500 .428 .358 .228 .18521
Student Race/Ethnicity - Cluster
Cluster Male Black White Hispanic Other
Alternative
Mean .60 .96 .00 .03 .0054
N 1112 1112 1112 1112 1112
Std. Deviation .491 .184 .067 .157 .07329
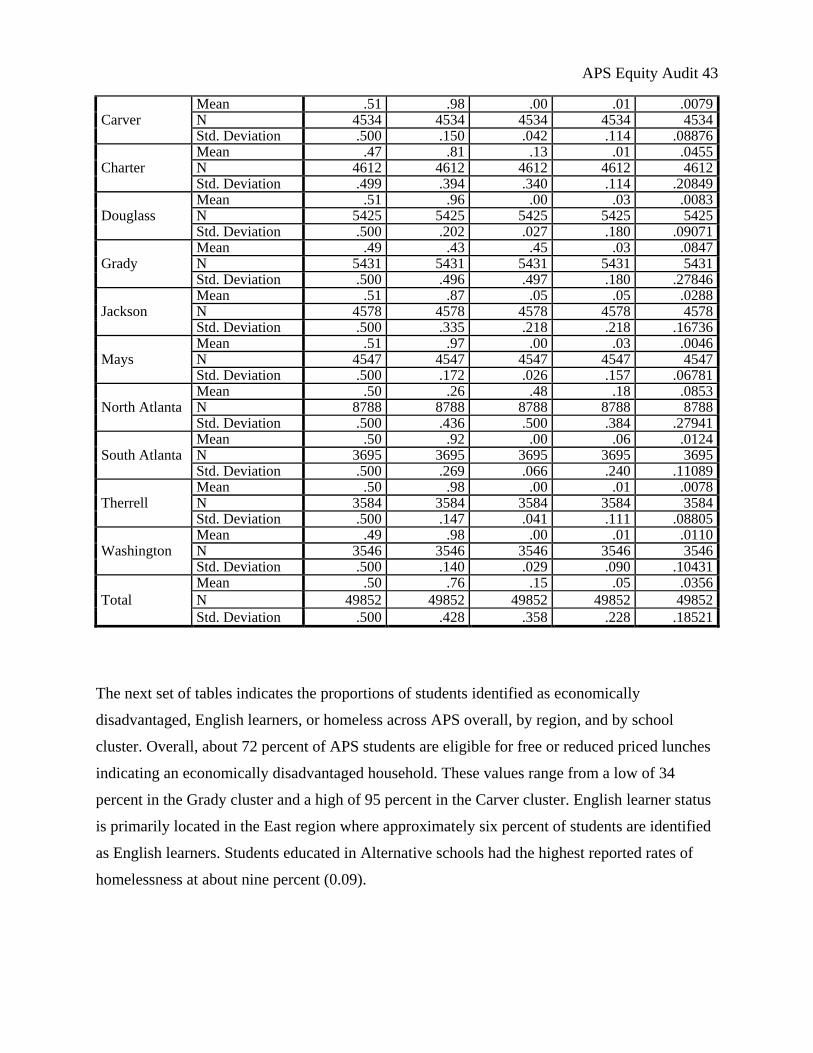
APS Equity Audit 43
Carver Mean .51 .98 .00 .01 .0079 N 4534 4534 4534 4534 4534 Std. Deviation .500 .150 .042 .114 .08876
Charter Mean .47 .81 .13 .01 .0455 N 4612 4612 4612 4612 4612 Std. Deviation .499 .394 .340 .114 .20849
Douglass Mean .51 .96 .00 .03 .0083 N 5425 5425 5425 5425 5425 Std. Deviation .500 .202 .027 .180 .09071
Grady Mean .49 .43 .45 .03 .0847 N 5431 5431 5431 5431 5431 Std. Deviation .500 .496 .497 .180 .27846
Jackson Mean .51 .87 .05 .05 .0288 N 4578 4578 4578 4578 4578 Std. Deviation .500 .335 .218 .218 .16736
Mays Mean .51 .97 .00 .03 .0046 N 4547 4547 4547 4547 4547 Std. Deviation .500 .172 .026 .157 .06781
North Atlanta Mean .50 .26 .48 .18 .0853 N 8788 8788 8788 8788 8788 Std. Deviation .500 .436 .500 .384 .27941
South Atlanta Mean .50 .92 .00 .06 .0124 N 3695 3695 3695 3695 3695 Std. Deviation .500 .269 .066 .240 .11089
Therrell Mean .50 .98 .00 .01 .0078 N 3584 3584 3584 3584 3584 Std. Deviation .500 .147 .041 .111 .08805
Washington Mean .49 .98 .00 .01 .0110 N 3546 3546 3546 3546 3546 Std. Deviation .500 .140 .029 .090 .10431
Total
Mean .50 .76 .15 .05 .0356
N 49852 49852 49852 49852 49852
Std. Deviation .500 .428 .358 .228 .18521
The next set of tables indicates the proportions of students identified as economically
disadvantaged, English learners, or homeless across APS overall, by region, and by school
cluster. Overall, about 72 percent of APS students are eligible for free or reduced priced lunches
indicating an economically disadvantaged household. These values range from a low of 34
percent in the Grady cluster and a high of 95 percent in the Carver cluster. English learner status
is primarily located in the East region where approximately six percent of students are identified
as English learners. Students educated in Alternative schools had the highest reported rates of
homelessness at about nine percent (0.09).

APS Equity Audit 44
Student Characteristics - APS Overall
Economic Disadvantage English Learner Homeless
Mean .72 .03 .04 N 49852 49852 49852 Std. Deviation .450 .163 .196
Student Characteristics - Region
Region Economic Disadvantage English Learner
Homeless
Alternative
Mean .84 .01 .09
N 1112 1112 1112
Std. Deviation .368 .073 .284
Charter Mean .61 .00 .01 N 4612 4612 4612 Std. Deviation .487 .069 .118
East Mean .58 .02 .04 N 10009 10009 10009 Std. Deviation .494 .138 .200
North Mean .57 .06 .02 N 14213 14213 14213 Std. Deviation .494 .240 .151
South Mean .94 .02 .05 N 8229 8229 8229 Std. Deviation .230 .123 .227
West Mean .89 .01 .05 N 11677 11677 11677 Std. Deviation .317 .107 .225
Total
Mean .72 .03 .04
N 49852 49852 49852
Std. Deviation .450 .163 .196
Student Characteristics - Cluster
Cluster Economic Disadvantage English Learner
Homeless
Alternative
Mean .84 .01 .09
N 1112 1112 1112
Std. Deviation .368 .073 .284
Carver Mean .95 .00 .05 N 4534 4534 4534 Std. Deviation .213 .047 .212
Charter Mean .61 .00 .01 N 4612 4612 4612 Std. Deviation .487 .069 .118
Douglass Mean .94 .02 .05 N 5425 5425 5425 Std. Deviation .244 .140 .210
Grady Mean .35 .02 .04 N 5431 5431 5431 Std. Deviation .478 .132 .198
Jackson Mean .85 .02 .04
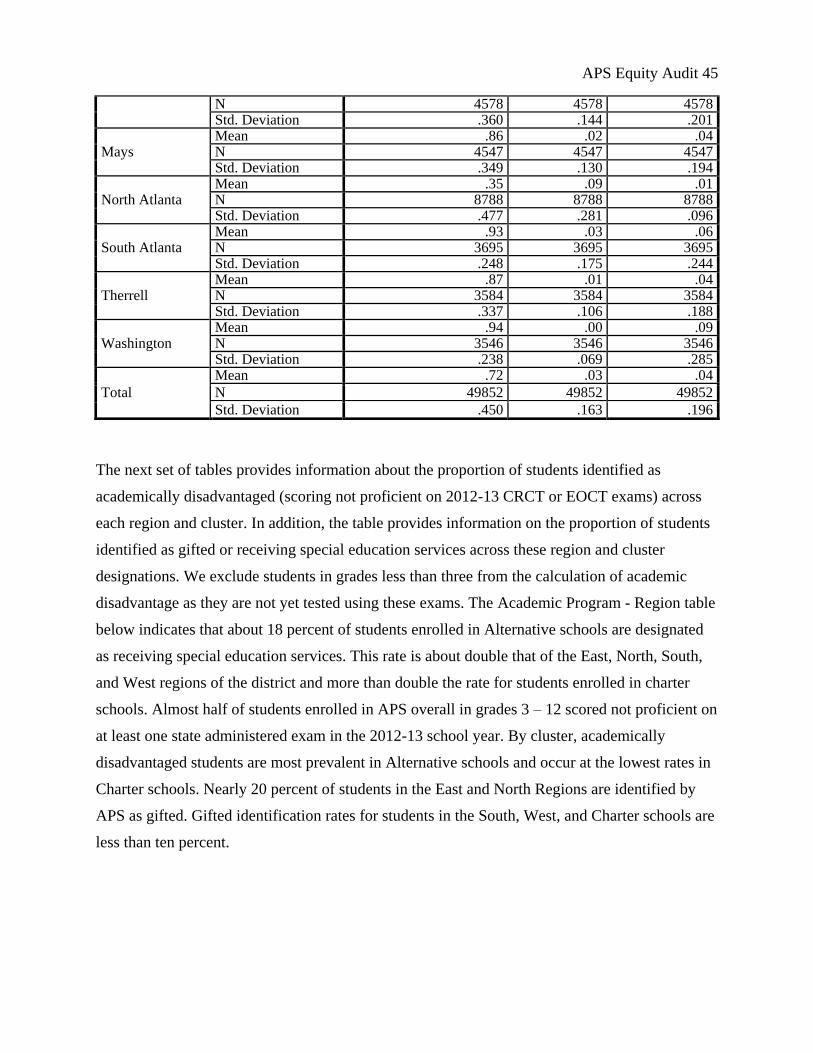
APS Equity Audit 45
N 4578 4578 4578 Std. Deviation .360 .144 .201
Mays Mean .86 .02 .04 N 4547 4547 4547 Std. Deviation .349 .130 .194
North Atlanta Mean .35 .09 .01 N 8788 8788 8788 Std. Deviation .477 .281 .096
South Atlanta Mean .93 .03 .06 N 3695 3695 3695 Std. Deviation .248 .175 .244
Therrell Mean .87 .01 .04 N 3584 3584 3584 Std. Deviation .337 .106 .188
Washington Mean .94 .00 .09 N 3546 3546 3546 Std. Deviation .238 .069 .285
Total
Mean .72 .03 .04
N 49852 49852 49852
Std. Deviation .450 .163 .196
The next set of tables provides information about the proportion of students identified as
academically disadvantaged (scoring not proficient on 2012-13 CRCT or EOCT exams) across
each region and cluster. In addition, the table provides information on the proportion of students
identified as gifted or receiving special education services across these region and cluster
designations. We exclude students in grades less than three from the calculation of academic
disadvantage as they are not yet tested using these exams. The Academic Program - Region table
below indicates that about 18 percent of students enrolled in Alternative schools are designated
as receiving special education services. This rate is about double that of the East, North, South,
and West regions of the district and more than double the rate for students enrolled in charter
schools. Almost half of students enrolled in APS overall in grades 3 – 12 scored not proficient on
at least one state administered exam in the 2012-13 school year. By cluster, academically
disadvantaged students are most prevalent in Alternative schools and occur at the lowest rates in
Charter schools. Nearly 20 percent of students in the East and North Regions are identified by
APS as gifted. Gifted identification rates for students in the South, West, and Charter schools are
less than ten percent.
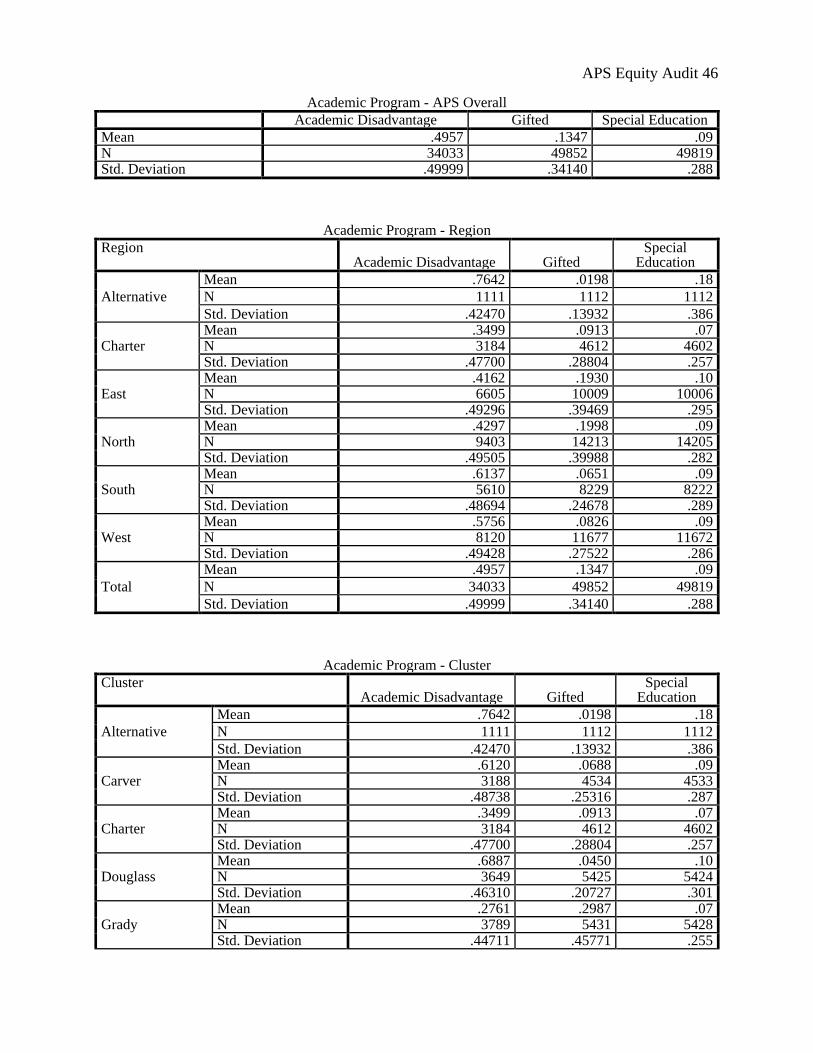
APS Equity Audit 46
Academic Program - APS Overall
Academic Disadvantage Gifted Special Education
Mean .4957 .1347 .09 N 34033 49852 49819 Std. Deviation .49999 .34140 .288
Academic Program - Region
Region Academic Disadvantage Gifted
Special Education
Alternative
Mean .7642 .0198 .18
N 1111 1112 1112
Std. Deviation .42470 .13932 .386
Charter Mean .3499 .0913 .07 N 3184 4612 4602 Std. Deviation .47700 .28804 .257
East Mean .4162 .1930 .10 N 6605 10009 10006 Std. Deviation .49296 .39469 .295
North Mean .4297 .1998 .09 N 9403 14213 14205 Std. Deviation .49505 .39988 .282
South Mean .6137 .0651 .09 N 5610 8229 8222 Std. Deviation .48694 .24678 .289
West Mean .5756 .0826 .09 N 8120 11677 11672 Std. Deviation .49428 .27522 .286
Total
Mean .4957 .1347 .09
N 34033 49852 49819
Std. Deviation .49999 .34140 .288
Academic Program - Cluster
Cluster Academic Disadvantage Gifted
Special Education
Alternative
Mean .7642 .0198 .18
N 1111 1112 1112
Std. Deviation .42470 .13932 .386
Carver Mean .6120 .0688 .09 N 3188 4534 4533 Std. Deviation .48738 .25316 .287
Charter Mean .3499 .0913 .07 N 3184 4612 4602 Std. Deviation .47700 .28804 .257
Douglass Mean .6887 .0450 .10 N 3649 5425 5424 Std. Deviation .46310 .20727 .301
Grady Mean .2761 .2987 .07 N 3789 5431 5428 Std. Deviation .44711 .45771 .255
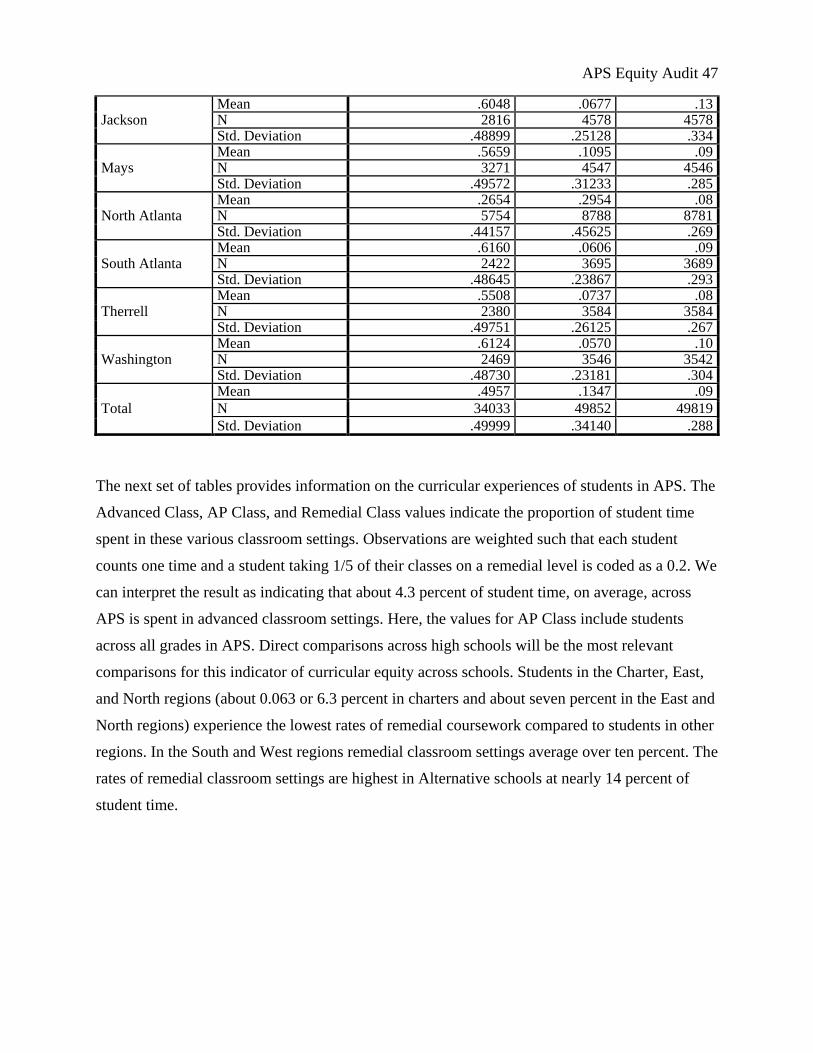
APS Equity Audit 47
Jackson Mean .6048 .0677 .13 N 2816 4578 4578 Std. Deviation .48899 .25128 .334
Mays Mean .5659 .1095 .09 N 3271 4547 4546 Std. Deviation .49572 .31233 .285
North Atlanta Mean .2654 .2954 .08 N 5754 8788 8781 Std. Deviation .44157 .45625 .269
South Atlanta Mean .6160 .0606 .09 N 2422 3695 3689 Std. Deviation .48645 .23867 .293
Therrell Mean .5508 .0737 .08 N 2380 3584 3584 Std. Deviation .49751 .26125 .267
Washington Mean .6124 .0570 .10 N 2469 3546 3542 Std. Deviation .48730 .23181 .304
Total
Mean .4957 .1347 .09
N 34033 49852 49819
Std. Deviation .49999 .34140 .288
The next set of tables provides information on the curricular experiences of students in APS. The
Advanced Class, AP Class, and Remedial Class values indicate the proportion of student time
spent in these various classroom settings. Observations are weighted such that each student
counts one time and a student taking 1/5 of their classes on a remedial level is coded as a 0.2. We
can interpret the result as indicating that about 4.3 percent of student time, on average, across
APS is spent in advanced classroom settings. Here, the values for AP Class include students
across all grades in APS. Direct comparisons across high schools will be the most relevant
comparisons for this indicator of curricular equity across schools. Students in the Charter, East,
and North regions (about 0.063 or 6.3 percent in charters and about seven percent in the East and
North regions) experience the lowest rates of remedial coursework compared to students in other
regions. In the South and West regions remedial classroom settings average over ten percent. The
rates of remedial classroom settings are highest in Alternative schools at nearly 14 percent of
student time.
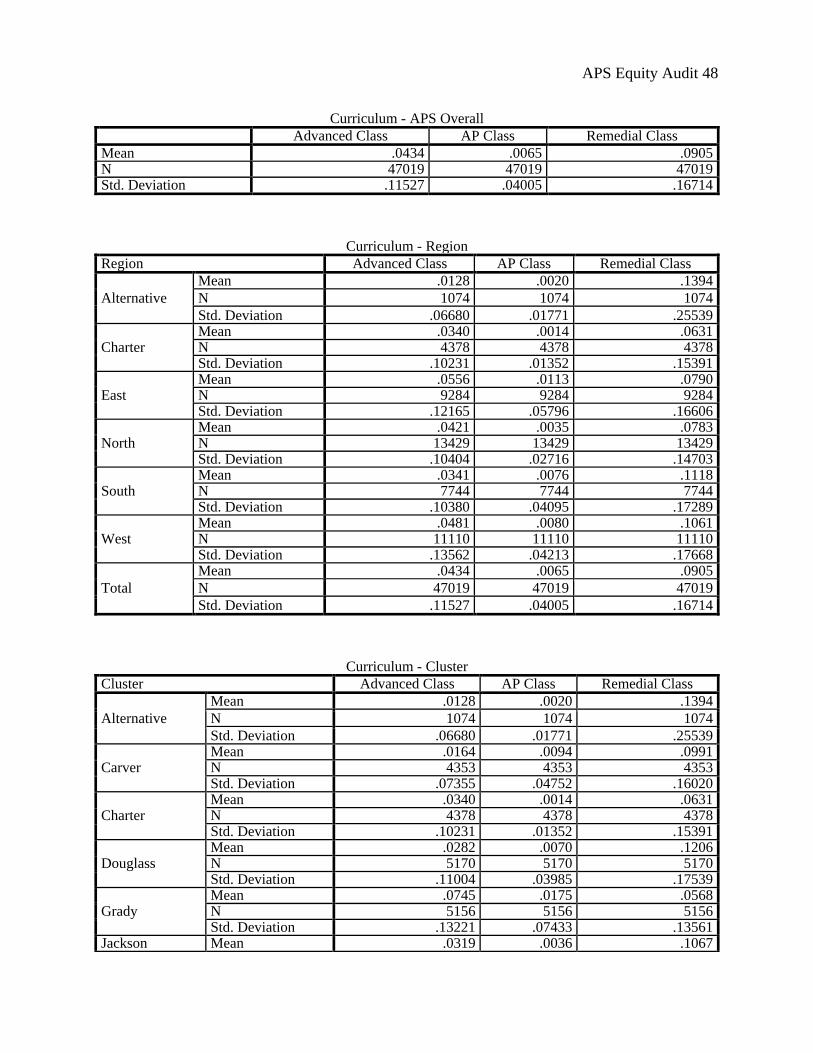
APS Equity Audit 48
Curriculum - APS Overall
Advanced Class AP Class Remedial Class
Mean .0434 .0065 .0905 N 47019 47019 47019 Std. Deviation .11527 .04005 .16714
Curriculum - Region
Region Advanced Class AP Class Remedial Class
Alternative
Mean .0128 .0020 .1394
N 1074 1074 1074
Std. Deviation .06680 .01771 .25539
Charter Mean .0340 .0014 .0631 N 4378 4378 4378 Std. Deviation .10231 .01352 .15391
East Mean .0556 .0113 .0790 N 9284 9284 9284 Std. Deviation .12165 .05796 .16606
North Mean .0421 .0035 .0783 N 13429 13429 13429 Std. Deviation .10404 .02716 .14703
South Mean .0341 .0076 .1118 N 7744 7744 7744 Std. Deviation .10380 .04095 .17289
West Mean .0481 .0080 .1061 N 11110 11110 11110 Std. Deviation .13562 .04213 .17668
Total
Mean .0434 .0065 .0905
N 47019 47019 47019
Std. Deviation .11527 .04005 .16714
Curriculum - Cluster
Cluster Advanced Class AP Class Remedial Class
Alternative
Mean .0128 .0020 .1394
N 1074 1074 1074
Std. Deviation .06680 .01771 .25539
Carver Mean .0164 .0094 .0991 N 4353 4353 4353 Std. Deviation .07355 .04752 .16020
Charter Mean .0340 .0014 .0631 N 4378 4378 4378 Std. Deviation .10231 .01352 .15391
Douglass Mean .0282 .0070 .1206 N 5170 5170 5170 Std. Deviation .11004 .03985 .17539
Grady Mean .0745 .0175 .0568 N 5156 5156 5156 Std. Deviation .13221 .07433 .13561
Jackson Mean .0319 .0036 .1067
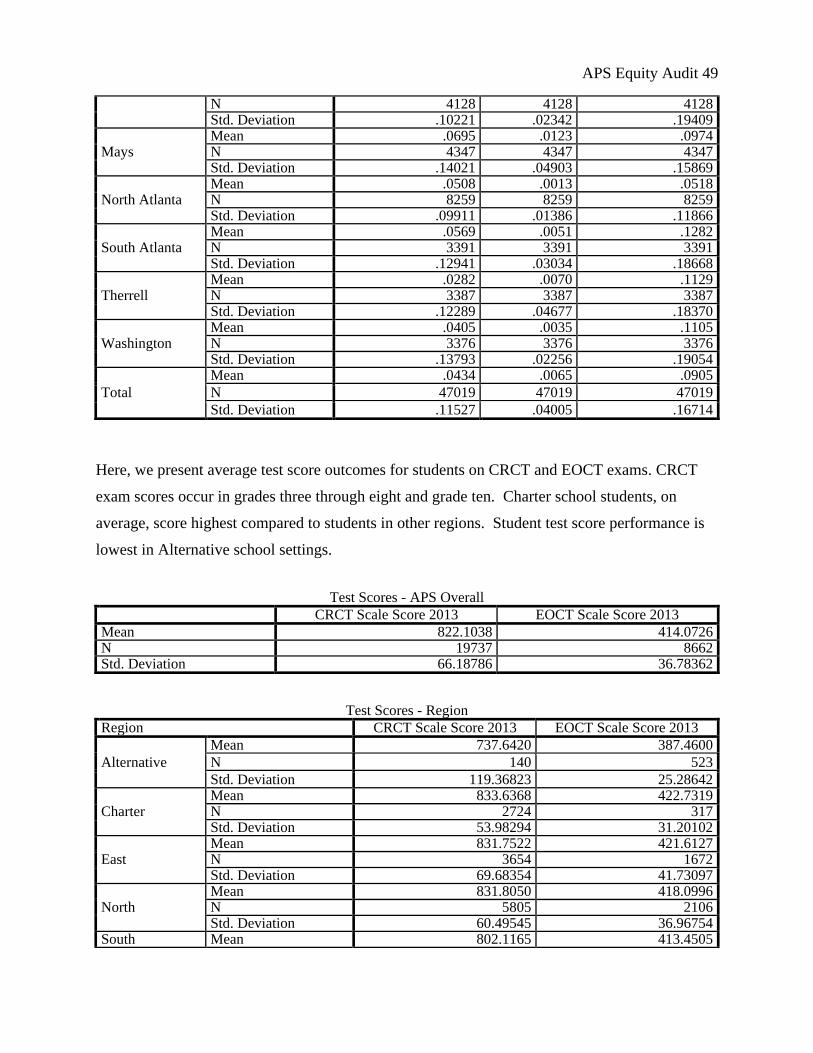
APS Equity Audit 49
N 4128 4128 4128 Std. Deviation .10221 .02342 .19409
Mays Mean .0695 .0123 .0974 N 4347 4347 4347 Std. Deviation .14021 .04903 .15869
North Atlanta Mean .0508 .0013 .0518 N 8259 8259 8259 Std. Deviation .09911 .01386 .11866
South Atlanta Mean .0569 .0051 .1282 N 3391 3391 3391 Std. Deviation .12941 .03034 .18668
Therrell Mean .0282 .0070 .1129 N 3387 3387 3387 Std. Deviation .12289 .04677 .18370
Washington Mean .0405 .0035 .1105 N 3376 3376 3376 Std. Deviation .13793 .02256 .19054
Total
Mean .0434 .0065 .0905
N 47019 47019 47019
Std. Deviation .11527 .04005 .16714
Here, we present average test score outcomes for students on CRCT and EOCT exams. CRCT
exam scores occur in grades three through eight and grade ten. Charter school students, on
average, score highest compared to students in other regions. Student test score performance is
lowest in Alternative school settings.
Test Scores - APS Overall
CRCT Scale Score 2013 EOCT Scale Score 2013
Mean 822.1038 414.0726 N 19737 8662 Std. Deviation 66.18786 36.78362
Test Scores - Region
Region CRCT Scale Score 2013 EOCT Scale Score 2013
Alternative
Mean 737.6420 387.4600
N 140 523
Std. Deviation 119.36823 25.28642
Charter Mean 833.6368 422.7319 N 2724 317 Std. Deviation 53.98294 31.20102
East Mean 831.7522 421.6127 N 3654 1672 Std. Deviation 69.68354 41.73097
North Mean 831.8050 418.0996 N 5805 2106 Std. Deviation 60.49545 36.96754
South Mean 802.1165 413.4505

APS Equity Audit 50
N 3031 1640 Std. Deviation 69.17998 35.54940
West Mean 810.5638 410.3728 N 4383 2404 Std. Deviation 65.88561 33.28536
Total
Mean 822.1038 414.0726
N 19737 8662
Std. Deviation 66.18786 36.78362
Test Scores - Cluster
Cluster CRCT Scale Score 2013 EOCT Scale Score 2013
Alternative
Mean 737.6420 387.4600
N 140 523
Std. Deviation 119.36823 25.28642
Carver Mean 799.5438 415.3819 N 1679 1003 Std. Deviation 72.39954 36.48426
Charter Mean 833.6368 422.7319 N 2724 317 Std. Deviation 53.98294 31.20102
Douglass Mean 800.9266 406.0806 N 2237 953 Std. Deviation 64.53182 30.72328
Grady Mean 851.5568 434.6144 N 2150 963 Std. Deviation 57.08280 44.14006
Jackson Mean 803.4412 403.9532 N 1504 709 Std. Deviation 76.02515 30.34172
Mays Mean 813.9294 409.3313 N 1672 1212 Std. Deviation 62.45233 33.23909
North Atlanta Mean 851.1646 428.0338 N 3568 1153 Std. Deviation 48.69824 38.71441
South Atlanta Mean 805.3115 410.4093 N 1352 637 Std. Deviation 64.84458 33.83053
Therrell Mean 815.4975 409.8834 N 1261 581 Std. Deviation 60.95678 33.79827
Washington Mean 802.3921 412.9043 N 1450 611 Std. Deviation 72.78459 32.80460
Total
Mean 822.1038 414.0726
N 19737 8662
Std. Deviation 66.18786 36.78362
Individual student attendance and discipline data include these variables: attendance rate, out-of-
school suspensions (OSS), in-school suspensions (ISS), bus suspensions (BUS), total
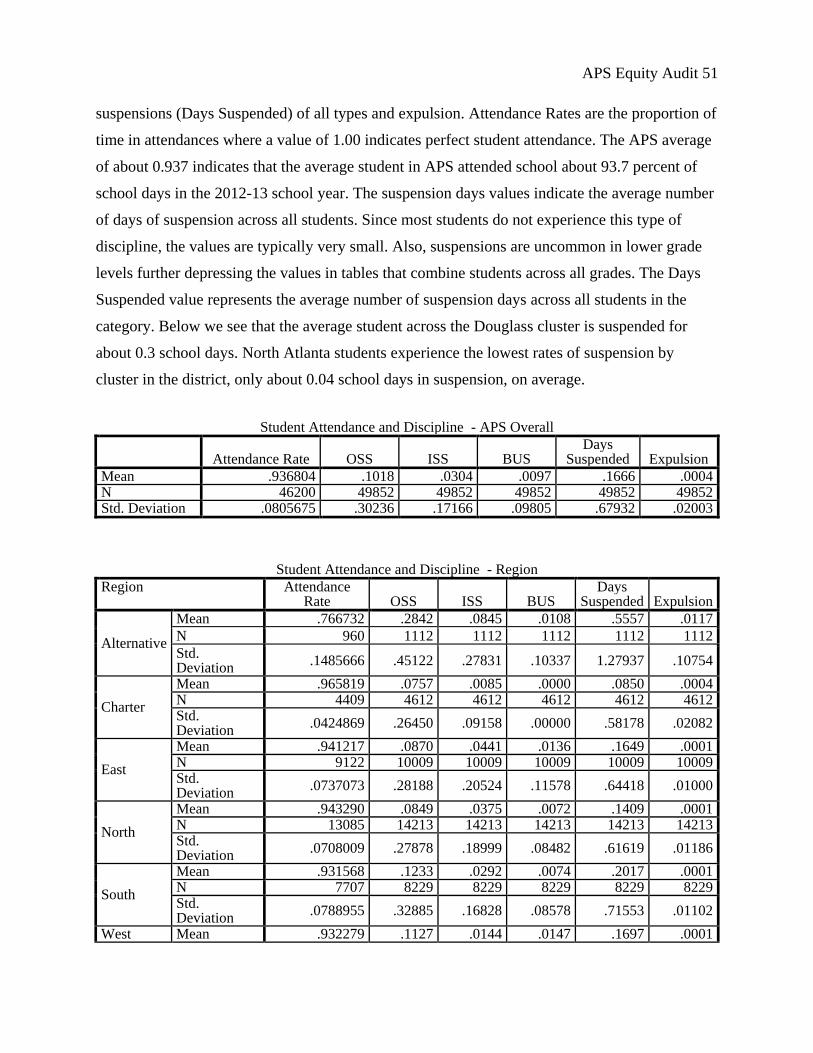
APS Equity Audit 51
suspensions (Days Suspended) of all types and expulsion. Attendance Rates are the proportion of
time in attendances where a value of 1.00 indicates perfect student attendance. The APS average
of about 0.937 indicates that the average student in APS attended school about 93.7 percent of
school days in the 2012-13 school year. The suspension days values indicate the average number
of days of suspension across all students. Since most students do not experience this type of
discipline, the values are typically very small. Also, suspensions are uncommon in lower grade
levels further depressing the values in tables that combine students across all grades. The Days
Suspended value represents the average number of suspension days across all students in the
category. Below we see that the average student across the Douglass cluster is suspended for
about 0.3 school days. North Atlanta students experience the lowest rates of suspension by
cluster in the district, only about 0.04 school days in suspension, on average.
Student Attendance and Discipline - APS Overall
Attendance Rate OSS ISS BUS
Days Suspended Expulsion
Mean .936804 .1018 .0304 .0097 .1666 .0004 N 46200 49852 49852 49852 49852 49852 Std. Deviation .0805675 .30236 .17166 .09805 .67932 .02003
Student Attendance and Discipline - Region
Region Attendance Rate OSS ISS BUS
Days Suspended Expulsion
Alternative
Mean .766732 .2842 .0845 .0108 .5557 .0117
N 960 1112 1112 1112 1112 1112
Std. Deviation
.1485666 .45122 .27831 .10337 1.27937 .10754
Charter
Mean .965819 .0757 .0085 .0000 .0850 .0004 N 4409 4612 4612 4612 4612 4612 Std. Deviation
.0424869 .26450 .09158 .00000 .58178 .02082
East
Mean .941217 .0870 .0441 .0136 .1649 .0001 N 9122 10009 10009 10009 10009 10009 Std. Deviation
.0737073 .28188 .20524 .11578 .64418 .01000
North
Mean .943290 .0849 .0375 .0072 .1409 .0001 N 13085 14213 14213 14213 14213 14213 Std. Deviation
.0708009 .27878 .18999 .08482 .61619 .01186
South
Mean .931568 .1233 .0292 .0074 .2017 .0001 N 7707 8229 8229 8229 8229 8229 Std. Deviation
.0788955 .32885 .16828 .08578 .71553 .01102
West Mean .932279 .1127 .0144 .0147 .1697 .0001
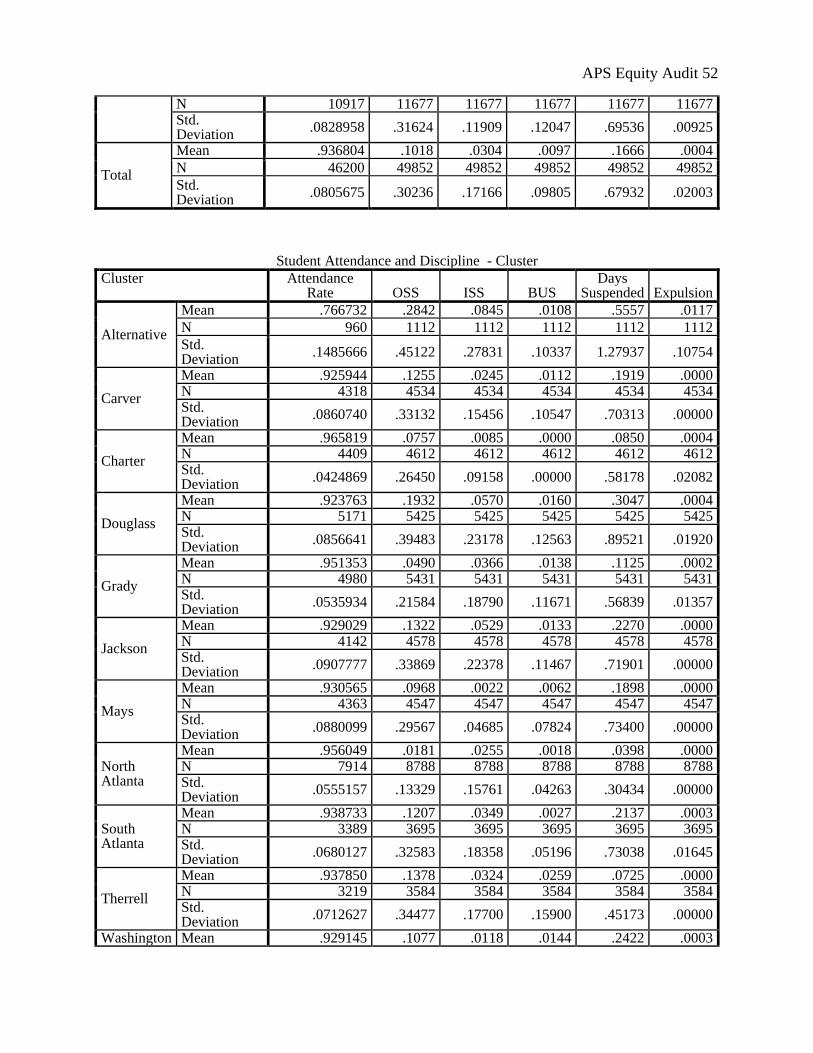
APS Equity Audit 52
N 10917 11677 11677 11677 11677 11677 Std. Deviation
.0828958 .31624 .11909 .12047 .69536 .00925
Total
Mean .936804 .1018 .0304 .0097 .1666 .0004
N 46200 49852 49852 49852 49852 49852
Std. Deviation
.0805675 .30236 .17166 .09805 .67932 .02003
Student Attendance and Discipline - Cluster
Cluster Attendance Rate OSS ISS BUS
Days Suspended Expulsion
Alternative
Mean .766732 .2842 .0845 .0108 .5557 .0117
N 960 1112 1112 1112 1112 1112
Std. Deviation
.1485666 .45122 .27831 .10337 1.27937 .10754
Carver
Mean .925944 .1255 .0245 .0112 .1919 .0000 N 4318 4534 4534 4534 4534 4534 Std. Deviation
.0860740 .33132 .15456 .10547 .70313 .00000
Charter
Mean .965819 .0757 .0085 .0000 .0850 .0004 N 4409 4612 4612 4612 4612 4612 Std. Deviation
.0424869 .26450 .09158 .00000 .58178 .02082
Douglass
Mean .923763 .1932 .0570 .0160 .3047 .0004 N 5171 5425 5425 5425 5425 5425 Std. Deviation
.0856641 .39483 .23178 .12563 .89521 .01920
Grady
Mean .951353 .0490 .0366 .0138 .1125 .0002 N 4980 5431 5431 5431 5431 5431 Std. Deviation
.0535934 .21584 .18790 .11671 .56839 .01357
Jackson
Mean .929029 .1322 .0529 .0133 .2270 .0000 N 4142 4578 4578 4578 4578 4578 Std. Deviation
.0907777 .33869 .22378 .11467 .71901 .00000
Mays
Mean .930565 .0968 .0022 .0062 .1898 .0000 N 4363 4547 4547 4547 4547 4547 Std. Deviation
.0880099 .29567 .04685 .07824 .73400 .00000
North Atlanta
Mean .956049 .0181 .0255 .0018 .0398 .0000 N 7914 8788 8788 8788 8788 8788 Std. Deviation
.0555157 .13329 .15761 .04263 .30434 .00000
South Atlanta
Mean .938733 .1207 .0349 .0027 .2137 .0003 N 3389 3695 3695 3695 3695 3695 Std. Deviation
.0680127 .32583 .18358 .05196 .73038 .01645
Therrell
Mean .937850 .1378 .0324 .0259 .0725 .0000 N 3219 3584 3584 3584 3584 3584 Std. Deviation
.0712627 .34477 .17700 .15900 .45173 .00000
Washington Mean .929145 .1077 .0118 .0144 .2422 .0003

APS Equity Audit 53
N 3335 3546 3546 3546 3546 3546 Std. Deviation
.0861373 .31008 .10820 .11908 .82467 .01679
Total
Mean .936804 .1018 .0304 .0097 .1666 .0004
N 46200 49852 49852 49852 49852 49852
Std. Deviation
.0805675 .30236 .17166 .09805 .67932 .02003
While this section of the report has focused on data for all students within APS at the region and
cluster level, the included appendices provide further characteristics for all students at the school
level separated by type of school: high schools, middle schools, elementary schools, charter
school, and alternative schools. In addition, school characteristics are repeated for specific
subgroups of students that may be of interest to APS stakeholders including categorical
subgroups based on race/ethnicity, gender, academic disadvantage, etc.
VII. Additional Appendices
The report Appendices provide further descriptive data on the characteristics of students by
school and include tables and graphs for specific subgroups of students. We present information
on groups of students who research shows frequently lag behind their peers in terms of
achievement including students scoring as not proficient on end-of-grade or end-of-course exams
in the prior school year, female students, students enrolled in special education services,
economically disadvantaged students (based on eligibility for free or reduced price lunch),
English learner students, and students by race/ethnicity categories according to district records.
In cases where fewer than ten students are present in a particular category, all data elements for
that school are omitted. For example, in the listing for English learners if only six English learner
students are enrolled in a specific school, that school’s data are omitted from reports on the
characteristics of this specific group of students.
The Appendices are organized by school type, but in this section, we present some examples of
the graphs found in the various Appendices to aid in interpretation of their meaning. To locate a
specific graph of interest to readers, please refer to the Appendix containing data on the school
type of interest: Alternative Schools, Charter Schools, Elementary Schools, High Schools, or
Middle Schools.

APS Equity Audit 54
Figure 8 below displays information on the percentage of students by race in APS high schools.
Clearly, the most racially diverse schools in APS are North Atlanta, Grady, and, to a lesser
extent, Jackson. This stacked bar graph conveys information regarding the distribution of race
for all students in APS high schools. Similar graphs exist for the other school levels and graphs
which display race characteristics by specific subgroups of students (i.e. English learners, female
students, etc.).
Figure 8 High School Race/Ethnicity (All Students)
Figure 9 below describes APS middle schools and the percentages of students by Male, Gifted
designation, and Special Education designation. BEST Middle is a gender specific school for
boys and Coretta Scott King Academy is a gender specific school for girls. Inman and Sutton
middle schools appear to have rates of Gifted designation approaching 40 percent, and Bunche
and Coretta Scott King Academy appear to have lower than average rates of students designated
as eligible for Special Education services. Again, this graph includes data for all students in APS
middle schools.
020
40
60
80
100
BE
ST
Hig
hC
S K
ing A
cad.
Carv
er
Art
sC
arv
er
Early C
oll.
Carv
er
Health
Carv
er
Tech
Dougla
ss
Gra
dy
Jackson
Mays
Nort
h A
tlanta
South
Atlanta
CA
DS
outh
Atlanta
H&
MS
South
Atlanta
L&
SJ
Therr
ell
HS
&R
Therr
ell
LG
&P
PT
herr
ell
ST
EM
SW
ashin
gto
n B
ank.
Washin
gto
n E
CW
asth
ingto
n H
ealth
All Students
Percent by Race
Black Hispanic
White Other
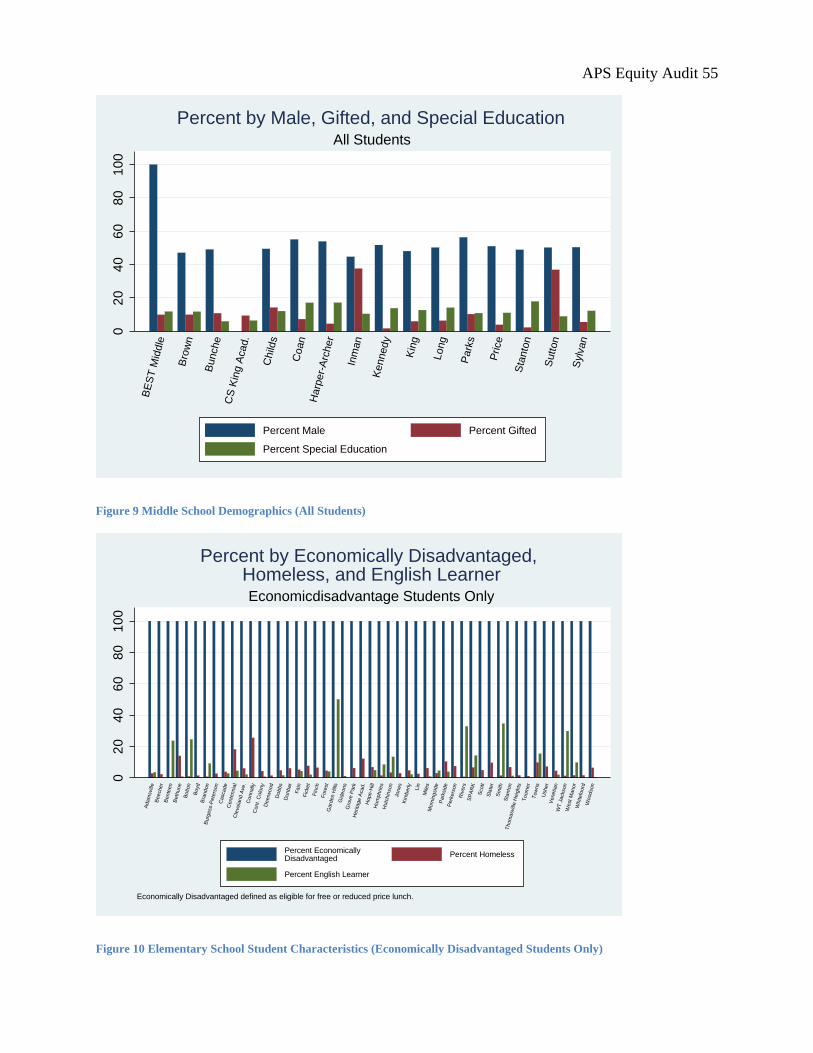
APS Equity Audit 55
Figure 9 Middle School Demographics (All Students)
Figure 10 Elementary School Student Characteristics (Economically Disadvantaged Students Only)
02
040
60
80
100
BE
ST
Mid
dle
Bro
wn
Bunche
CS
Kin
g A
cad.
Child
s
Coan
Harp
er-
Arc
her
Inm
an
Kennedy
Kin
g
Long
Park
s
Price
Sta
nto
n
Sutton
Sylv
an
All Students
Percent by Male, Gifted, and Special Education
Percent Male Percent Gifted
Percent Special Education
02
040
60
80
100
Adam
svill
eB
eecher
Bente
en
Beth
une
Bolton
Boyd
Bra
ndon
Burg
ess-P
ete
rson
Casc
ade
Cente
nnia
lC
levela
nd A
ve.
Connally
Cont. C
olo
ny
Deerw
ood
Dobbs
Dunbar
Fain
Fic
ket
Fin
ch
Fore
st
Gard
en H
ills
Gid
eons
Gro
ve P
ark
Herita
ge A
cad.
Hope-H
illH
um
phries
Hutc
hin
son
Jones
Kim
berly
Lin
Mile
sM
orn
ingsid
eP
ark
sid
eP
erk
ers
on
Riv
ers
SP
AR
K
Scott
Sla
ter
Sm
ith
Sta
nto
nT
hom
asvill
e H
eig
hts
Toom
er
Tow
ns
Usher
Venetian
WT
Jack
son
West M
anor
Whitefo
ord
Woodson
Economically Disadvantaged defined as eligible for free or reduced price lunch.
Economicdisadvantage Students Only
Percent by Economically Disadvantaged, Homeless, and English Learner
Percent Economically Disadvantaged
Percent Homeless
Percent English Learner

APS Equity Audit 56
Figure 10 above restricts data to economically disadvantaged students only and displays the
percentage of economically disadvantaged, homeless, and English learner students in APS
elementary schools. The first thing to note about this graph is that all schools show a one
hundred percent rate of economically disadvantaged students. This is because the table is
restricted to only include this specific group of students. We would have a similar graph for race
Hispanic when viewing the race graph restricted to only Hispanic identified students. Here, we
see higher rates of English learners at Garden Hills Elementary. Somewhat higher rates exist at
selected schools and similarly, the rate of homeless children is higher at some particular schools
within APS.
Figure 11 below is limited to academically disadvantaged students in APS high schools. Here we
see wide variations in the proportion of inexperienced teachers (teachers with less than three
years of teaching experience) matched to academically disadvantaged students across the APS
system in high schools. One should note that the scaling of the graph only rises to the 60 percent
mark and not 100 as in some other graphs. There are substantial variations across schools on this
characteristic and the between school differences easily meet tests of statistical significance.
While this graph does not show a confidence interval band for values, some caterpillar plots do
show confidence intervals based on standard error calculations. When the confidence intervals
overlap, we conclude that while two means or averages are similar in value, they cannot be
statistically differentiated from each other. See the data and methods section for a discussion of
the confidence interval calculations and an example graph.
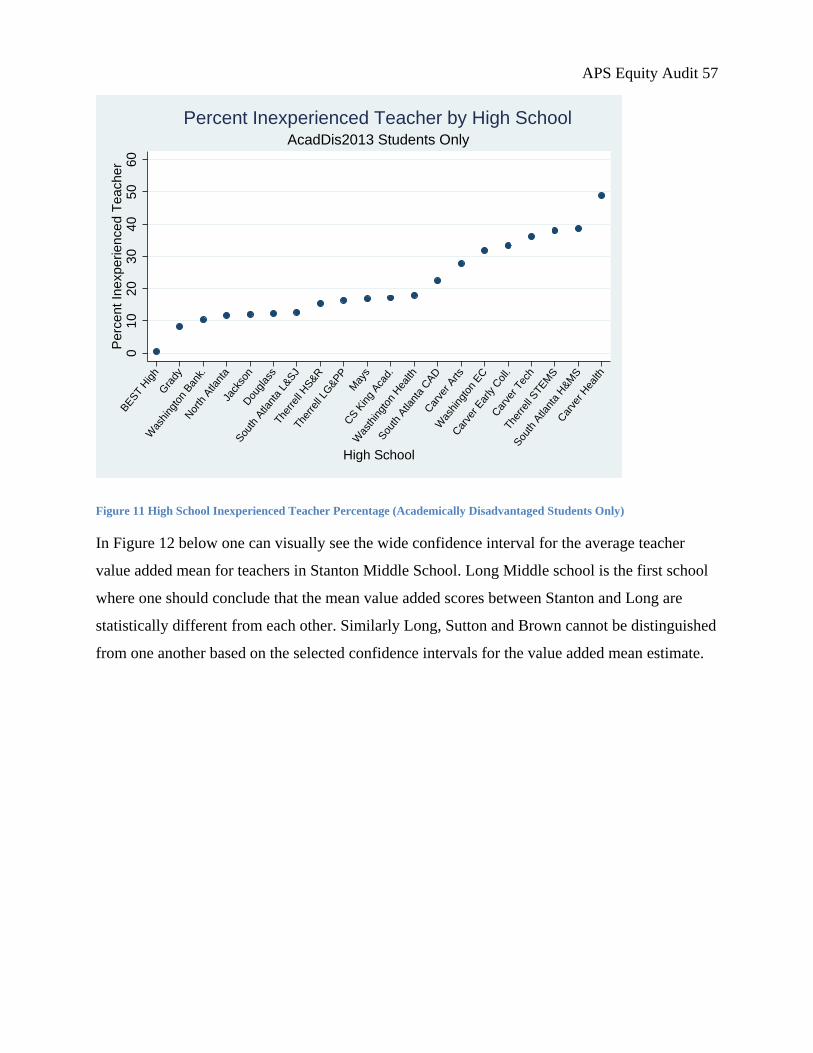
APS Equity Audit 57
Figure 11 High School Inexperienced Teacher Percentage (Academically Disadvantaged Students Only)
In Figure 12 below one can visually see the wide confidence interval for the average teacher
value added mean for teachers in Stanton Middle School. Long Middle school is the first school
where one should conclude that the mean value added scores between Stanton and Long are
statistically different from each other. Similarly Long, Sutton and Brown cannot be distinguished
from one another based on the selected confidence intervals for the value added mean estimate.
01
020
30
40
50
60
Perc
en
t In
experien
ce
d T
each
er
BEST H
igh
Gra
dy
Was
hing
ton
Ban
k.
Nor
th A
tlant
aJa
ckso
nD
ougl
ass
Sou
th A
tlant
a L&
SJ
The
rrel
l HS&R
The
rrel
l LG
&PP
May
s
CS K
ing
Aca
d.
Was
thin
gton
Hea
lth
Sou
th A
tlant
a C
AD
Car
ver Arts
Was
hing
ton
EC
Car
ver Ear
ly C
oll.
Car
ver Tec
h
The
rrel
l STEM
S
Sou
th A
tlant
a H
&M
S
Car
ver H
ealth
High School
AcadDis2013 Students Only
Percent Inexperienced Teacher by High School
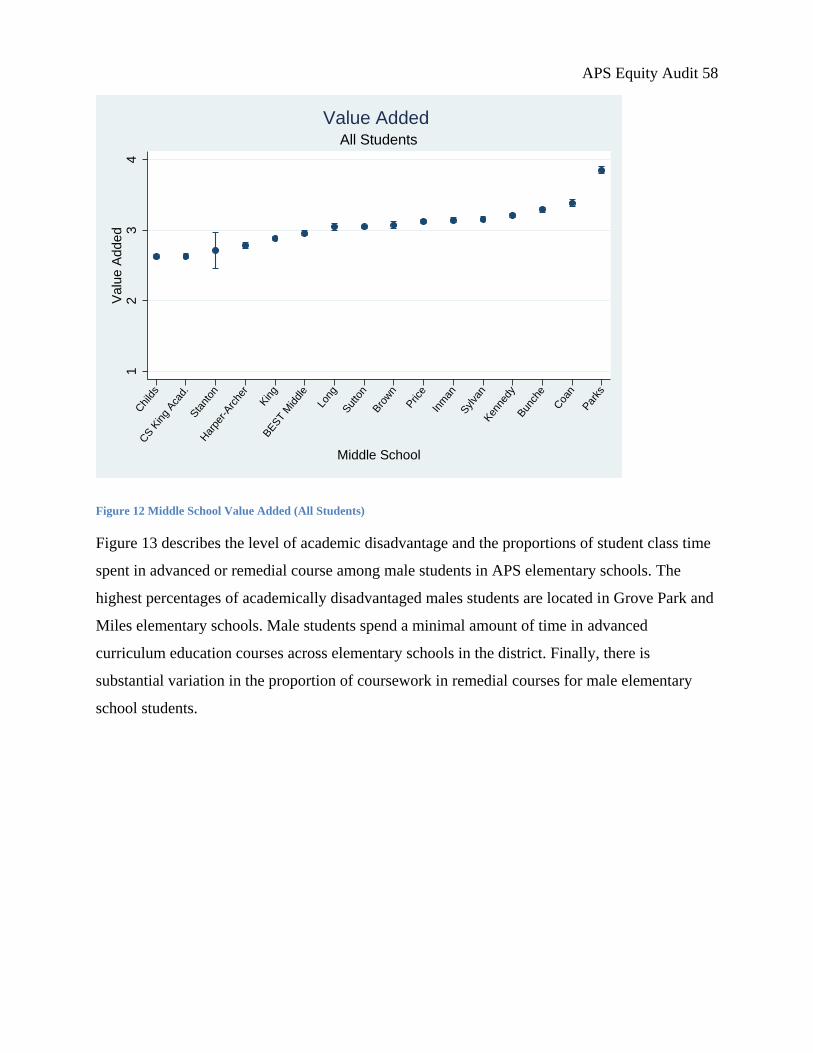
APS Equity Audit 58
Figure 12 Middle School Value Added (All Students)
Figure 13 describes the level of academic disadvantage and the proportions of student class time
spent in advanced or remedial course among male students in APS elementary schools. The
highest percentages of academically disadvantaged males students are located in Grove Park and
Miles elementary schools. Male students spend a minimal amount of time in advanced
curriculum education courses across elementary schools in the district. Finally, there is
substantial variation in the proportion of coursework in remedial courses for male elementary
school students.
12
34
Valu
e A
dde
d
Chi
lds
CS K
ing
Aca
d.Sta
nton
Har
per-Arc
her
Kin
gBEST M
iddl
e
Long
Sut
ton
Bro
wn
Pric
e
Inm
an
Syl
van
Ken
nedy
Bun
che
Coa
n
Par
ks
Middle School
All Students
Value Added

APS Equity Audit 59
Figure 13 Elementary School Academic Program (Male Students Only)
Figure 14 Percent Academically Disadvantaged (Hispanic Students Only)
02
040
60
80
100
Adam
svill
eB
eecher
Bente
en
Beth
une
Bolton
Boyd
Bra
ndon
Burg
ess-P
ete
rson
Casc
ade
Cente
nnia
lC
levela
nd A
ve.
Connally
Cont. C
olo
ny
Deerw
ood
Dobbs
Dunbar
Fain
Fic
ket
Fin
ch
Fore
st
Gard
en H
ills
Gid
eons
Gro
ve P
ark
Herita
ge A
cad.
Hope-H
illH
um
phries
Hutc
hin
son
Jones
Kim
berly
Lin
Mile
sM
orn
ingsid
eP
ark
sid
eP
erk
ers
on
Riv
ers
SP
AR
K
Scott
Sla
ter
Sm
ith
Sta
nto
nT
hom
asvill
e H
eig
hts
Toom
er
Tow
ns
Usher
Venetian
WT
Jack
son
West M
anor
Whitefo
ord
Woodson
Academically Disadvantaged defined as a score of not proficient on any CRCT or EOCT exam in 2013.
Male Students Only
Percent by Academically Disadvantaged, Advanced Courses, and Remedial Courses
Percent Academically Disadvantaged 2013
Percent Advanced Classes
Percent Remedial Classes
02
04
060
80
Pe
rcen
t A
ca
dem
ically
Dis
adva
nta
ged 2
01
3
Inm
an
Kin
g
Sut
ton
Chi
lds
Long
Pric
e
Har
per-Arc
her
Middle SchoolAcademically Disadvantaged defined as a score of not proficient on any CRCT or EOCT exam in 2013.
Hispanic Students Only
Percent Academically Disadvantaged 2013
APS Equity Audit 60
Figure 14 above displays the proportion of Hispanic students classified as academically
disadvantaged in APS middle schools. Only schools with more than 10 Hispanic students are
reported across figures. We note here that more than 60 percent of Hispanic students attending
Harper-Archer Middle School score not proficient on at least one CRCT exam during the 2013-
14 school year. This rate of academic disadvantaged is higher than the rate at other APS middle
schools with a sufficient number of students for reporting and nearly three times higher than the
rate at Inman Middle School where approximately 22 percent of Hispanic students were
identified as academically disadvantaged.
Figures 15 and 16 report on the characteristics of high school students in two different
subgroups. Figure 15 restricts the data to only students identified as homeless according to APS
administrative records. Among these students, more than 10 percent of course time is spent in
Advanced Placement (AP) courses for students at Carver Health High School. AP course
participation rates among homeless students are approximately similar across other APS system
high schools.
Figure 16 restricts data to students identified as economically disadvantaged (eligible for free or
reduced price lunches). Attendance rates here are reported as the percentage of time that students
were marked in attendance during the 2012-13 school year. Attendance rates among
economically disadvantaged students were lowest at Douglass and Washington Health high
schools.
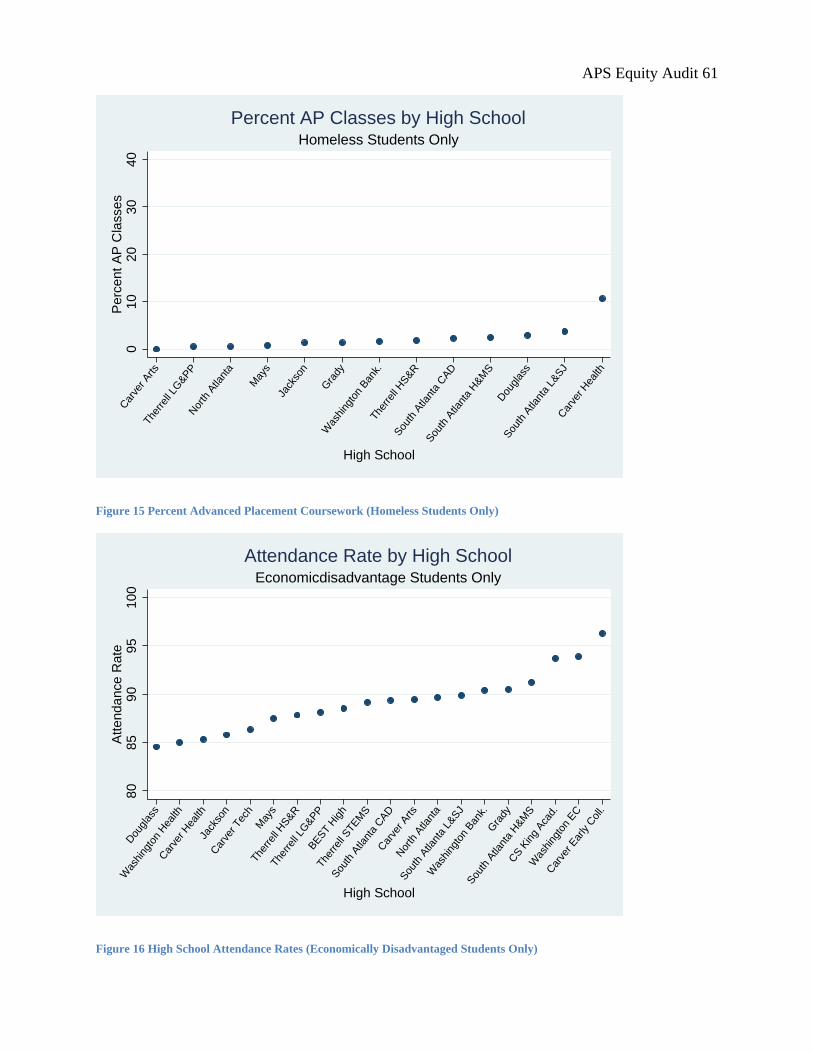
APS Equity Audit 61
Figure 15 Percent Advanced Placement Coursework (Homeless Students Only)
Figure 16 High School Attendance Rates (Economically Disadvantaged Students Only)
01
020
30
40
Perc
ent
AP
Cla
sses
Car
ver Arts
The
rrel
l LG
&PP
Nor
th A
tlant
a
May
s
Jack
son
Gra
dy
Was
hing
ton
Ban
k.The
rrel
l HS&R
Sou
th A
tlant
a C
AD
Sou
th A
tlant
a H
&M
S
Dou
glas
s
Sou
th A
tlant
a L&
SJ
Car
ver H
ealth
High School
Homeless Students Only
Percent AP Classes by High School8
085
90
95
100
Attend
ance
Ra
teD
ougl
ass
Was
hing
ton
Hea
lth
Car
ver H
ealth
Jack
son
Car
ver Tec
hM
ays
The
rrel
l HS&R
The
rrel
l LG
&PP
BEST H
igh
The
rrel
l STEM
S
Sou
th A
tlant
a C
AD
Car
ver Arts
Nor
th A
tlant
a
Sou
th A
tlant
a L&
SJ
Was
hing
ton
Ban
k.G
rady
Sou
th A
tlant
a H
&M
S
CS K
ing
Aca
d.
Was
hing
ton
EC
Car
ver Ear
ly C
oll.
High School
Economicdisadvantage Students Only
Attendance Rate by High School

APS Equity Audit 62
Figure 17 displays the average classroom environment experienced by female students in APS
high schools. Classroom characteristics are linked to specific teachers and then restricted here to
only female students. We first note that ratings of classroom environment across the four
characteristics of classrooms are largely consistent with each school. There are, however,
differences in the classroom environment ratings across schools. Female students attend classes
with higher ratings of the classroom environment in Washington Banking and Washington Early
College. The lowest ratings of the classroom environment occurred with female students in two
high schools: Therrell LG&PP and Therrell STEMS.
Figure 17 High School Classroom Environment Ratings (Female Students Only)
The figures described above are representative of those contained in the various appendices that
accompany this report. The appendices are organized by school level and contain both tables and
descriptive figures which describe the characteristics of schools across the APS system for all
students and for selected subgroups of students based on a variety of characteristics.
01
23
CS
Kin
g A
cad.
Carv
er
Art
sC
arv
er
Early C
oll.
Carv
er
Health
Carv
er
Tech
Dougla
ss
Gra
dy
Jackson
Mays
Nort
h A
tlanta
South
Atlanta
CA
DS
outh
Atlanta
H&
MS
South
Atlanta
L&
SJ
Therr
ell
HS
&R
Therr
ell
LG
&P
PT
herr
ell
ST
EM
SW
ashin
gto
n B
ank.
Washin
gto
n E
CW
ashin
gto
n H
ealth
Female Students Only
Classroom Environment Ratings
Instructional Strategy Differentiated Instruction
Positive Environment Challenging Environment
APS Equity Audit 63
VIII. Discussion
We find substantial variation in a variety of student, personnel, and community characteristics
across schools. In this main report, the focus is on comparisons across regions and clusters for all
students in APS, but a close examination across schools in the district will provide additional
information on the high degree of variability that exists across schools in the district on the
included indicators of equity. We hope that this document can guide interested individuals in
understanding the information presented in the appendices and provides a framework to easily
locate specific information desired by APS stakeholders. The appendices also provide data
presented on specific subgroups defined by a single characteristic – i.e. males only, economically
disadvantaged students only, Hispanic students only, etc. These tables and figures will also be of
interest to stakeholders across the district and speak to between school differences that exist for
subgroups of students. In this way, this document and the five appendices are intended as a
resource for those interested in equity across schools in the APS system.
In short, there exist substantial variations across schools in the APS system in all of the areas
where equity was examined. These include differences in indicators of teacher quality, academic
programming, financial resources (particularly represented by PTA and foundation funds),
playgrounds, student academic achievement, and classroom instruction. This equity audit may
prove useful in facilitating a discussion of the current state of equity in the district. While we
fully expect that there will be disagreements over what might be the best measures for any
particular characteristics of communities, schools, classrooms, or students, we hope that the
focus will remain on the usefulness of data within.
While this equity audit will provide useful information to those interested in comparisons across
schools in the APS system, it does possess a number of important limitations. First, the
information enclosed comes from a single year, the 2012-13 school year. This limitation is
significant in that we cannot make a determination of the magnitude or direction of any changes
in equity over time between schools within the district. Similarly, this report’s focus on between
school measures of equity may mask important differences in outcomes, resource access, or
classroom assignment practices that potentially result in within-school differences in equity. The
information contained within this report may be used to compare measures associated with
APS Equity Audit 64
particular subgroups of students and comparing their values to the overall school means may
provide some indication of differences across subgroups within schools, but within-school
comparisons were not a focus of this report.
This report documents a number of differences, sometimes dramatic, in observable community,
school personnel, and student characteristics across schools within the APS system. The context
of neighborhood settings within the APS system varies substantially with regard to measures of
income, education, and ethnic composition. Between school differences also exist based on a
variety of personnel and student characteristics within the district. Whether and how to address
observed differences involve highly contentious tradeoffs of resource allocation and will also
involve questions regarding the goals and purposes of public education. Stakeholders are likely
to disagree about any preferred response to these findings. Should the district implement changes
in reaction to the information contained in this report, a plan to evaluate the effectiveness of any
reforms is strongly recommended.
APS Equity Audit 65
References
Boyd, D., Grossman, P., Lankford, H., Loeb, S., & Wyckoff, J. (2009). Teacher preparation and
student achievement. Educational Evaluation and Policy Analysis, 31, 416–444.
Brown, K. M. (2010). Schools of excellence and equity? Using equity audits as a tool to expose a
flawed system of recognition. International Journal of Education Policy and
Leadership, 5(5), 1–12.
Bureau of the Census. (1994). Geographic areas reference manual. Washington, DC: United
States Department of Commerce, Economics and Statistics Administration, Bureau of the
Census.
Childress, S.M., Doyle, D.P., & Thomas, D.A. (2009). Leading for equity: The pursuit of
excellence in montgomery county public schools. Cambridge: Harvard Education Press.
English, F.W. (1988). Curriculum auditing. Lancaster, PA: Technomic.
Georgia Department of Education. (2013). Teacher Keys Effectiveness System. Accessed from
http://www.gadoe.org/School-Improvement/Teacher-and-Leader-
Effectiveness/Documents/TKES%20Handbook%20FINAL%207-18-2013.pdf.
Groenke, S.L. (2010). Seeing, inquiring, witnessing: Using equity audits in practitioner inquiry
to rethink inequity in public schools. English Education, 43(1), 83-96.
Henry, G.T., Bastian, K.C., & Fortner, C.K. (2011). Stayers and leavers early-career teacher
effectiveness and attrition. Educational Researcher, 40(6), 271-280.
Ingersoll, R.M. (1999). The problem of underqualified teachers in american secondary schools.
Educational Researcher, 28(2), 26-37.
Lankford, H., Loeb, S., & Wyckoff, J. (2002). Teacher sorting and the plight of urban schools: A
descriptive analysis. Educational Evaluation and Policy Analysis, 24, 37-62.
McKenzie, K.B., & Scheurich, J.J. (2004). Equity traps: A useful construct for preparing
principals to lead schools that are successful with racially diverse students. Educational
Administration Quarterly 40(5), 601-632.
Mitchell, J. K., & Poston, W. K. (1992). The equity audit in school reform: Three case studies of
educational disparity and incongruity. International Journal of Educational Reform, 1(3),
242–247.
APS Equity Audit 66
Scott, B. (2001). Coming of age. IDRA Newsletter. Retrieved from
http://www.idra.org/Newslttr/2001/Mar/Bradley.htm
Skrla, L., Scheurich, J. J., Garcia, J., & Nolly, G. (2004). Equity audits: A practical leadership
tool for developing equitable and excellent schools. Educational Administration
Quarterly, 40(1), 133-161.
Skrla, L., McKenzie, K. B., & Scheurich, J. J. (2009). Using equity audits to create equitable
and excellent schools. New York: SAGE Publications.

APS Equity Audit 67
IX. Appendix A
A. Finance Figures
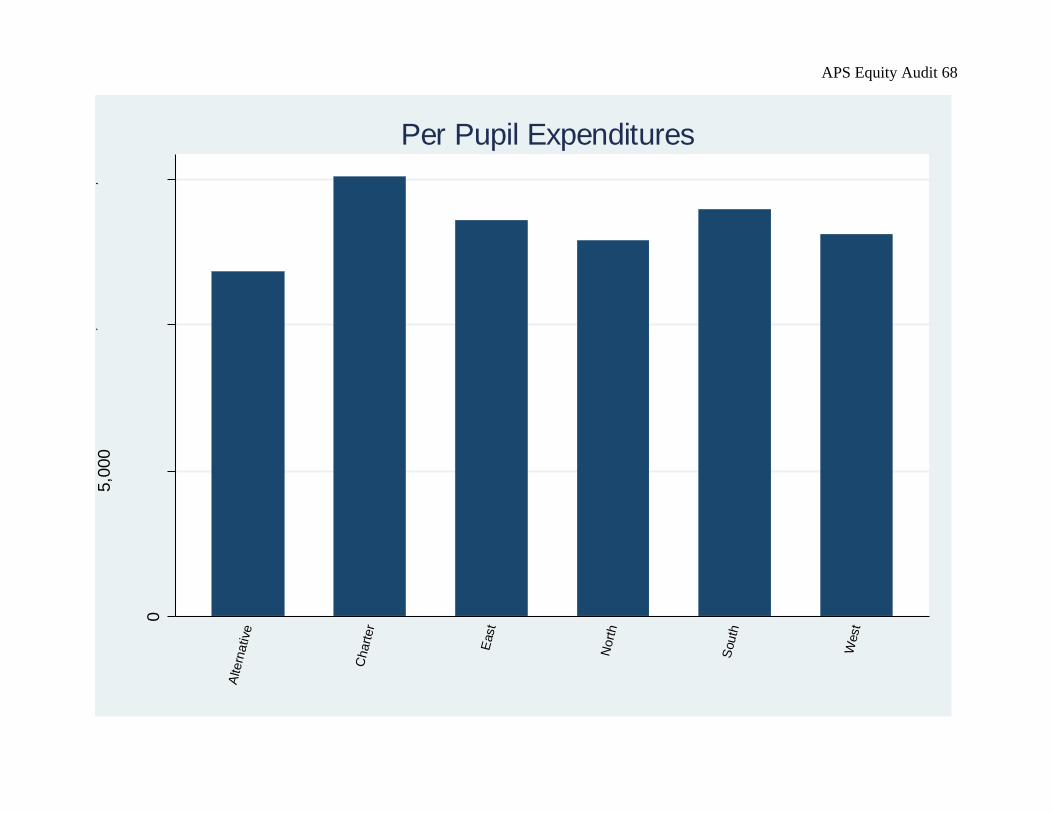
APS Equity Audit 68
0
5,0
00
10,0
00
15,0
00
Tota
l E
xpenditure
s
Alte
rnative
Chart
er
East
Nort
h
South
West
Per Pupil Expenditures

APS Equity Audit 69
0
5,0
00
10,0
00
15,0
00
Tota
l E
xpenditure
s
Alte
rnative
Carv
er
Chart
er
Dougla
ss
Gra
dy
Jacks
on
Mays
Nort
h A
tla
South
Atla
Therr
ell
Washin
gto
n
Per Pupil Expenditures
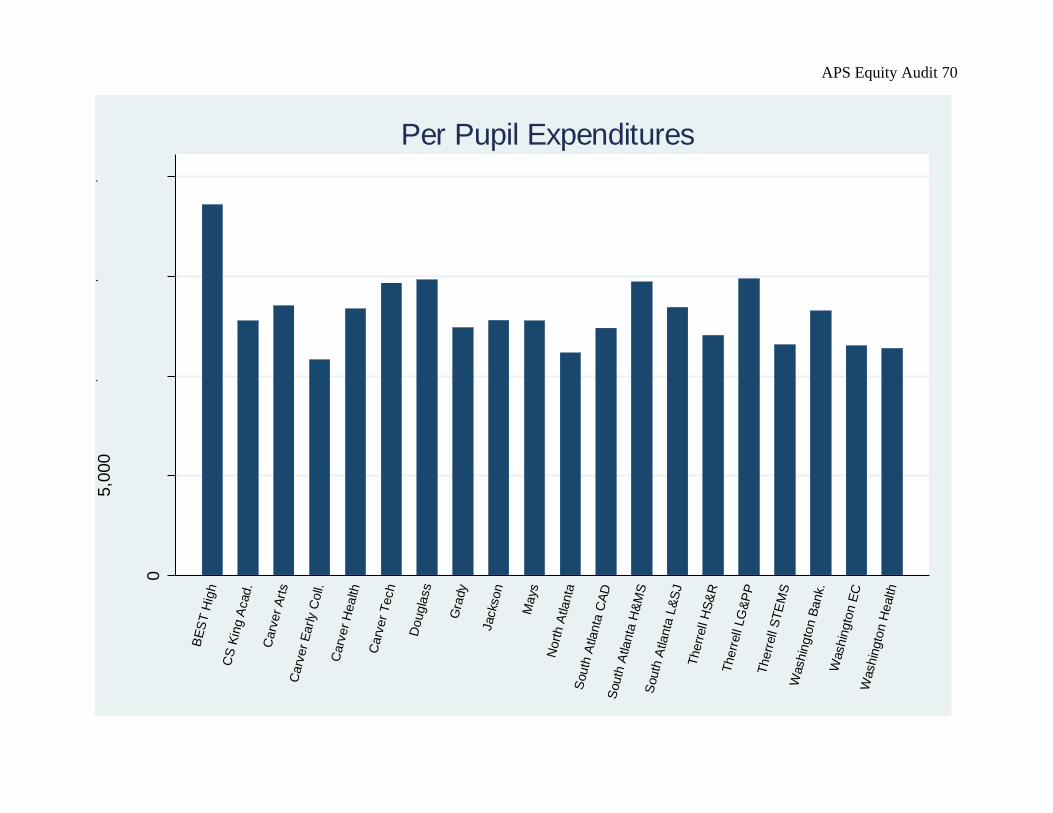
APS Equity Audit 70
0
5,0
00
10,0
00
15,0
00
20,0
00
Tota
l E
xpenditure
s
BE
ST
Hig
h
CS
Kin
g A
cad.
Carv
er
Art
sC
arv
er
Early C
oll.
Carv
er
Health
Carv
er
Tech
Dougla
ss
Gra
dy
Jacks
on
Mays
Nort
h A
tlanta
South
Atla
nta
CA
DS
outh
Atla
nta
H&
MS
South
Atla
nta
L&
SJ
Therr
ell
HS
&R
Therr
ell
LG
&P
PT
herr
ell
ST
EM
SW
ashin
gto
n B
ank.
Washin
gto
n E
CW
ashin
gto
n H
ealth
Per Pupil Expenditures

APS Equity Audit 71
0
5,0
00
10,0
00
15,0
00
20,0
00
25,0
00
Tota
l E
xpenditure
s
BE
ST
Mid
dle
Bro
wn
Bunche
CS
Kin
g A
cad.
Child
s
Coan
Harp
er-
Arc
her
Inm
an
Kennedy
Kin
g
Long
Park
s
Price
Sta
nto
n
Sutton
Syl
van
Per Pupil Expenditures

APS Equity Audit 72
0
5,0
00
10,0
00
15,0
00
20,0
00
Tota
l E
xpenditure
s
Adam
svi
lleB
eecher
Bente
en
Beth
une
Bolton
Boyd
Bra
ndon
Burg
ess-P
ete
rson
Casc
ade
Cente
nnia
lC
levela
nd A
ve.
Connally
Cont. C
olo
ny
Deerw
ood
Dobbs
Dunbar
Fain
Fic
ket
Fin
chF
ore
st
Gard
en H
ills
Gid
eons
Gro
ve P
ark
Herita
ge A
cad.
Hope-H
illH
um
phries
Hutc
hin
son
Jones
Kim
berly
Lin
Mile
sM
orn
ingsid
eP
ark
sid
eP
erk
ers
on
Riv
ers
Sco
ttS
late
rS
mith
Sta
nto
nT
hom
asv
ille H
eig
hts
Toom
er
Tow
ns
Usher
Venetian
WT
Jacks
on
West M
anor
Whitefo
ord
Woodson
Per Pupil Expenditures

APS Equity Audit 73
020
40
60
80
100
Alternative Charter East North South West
Region
Distribution of Expenditures by Spending Type
Percent Instructional SpendingPercent Support Services Spending
Percent School Admin Spending Percent Operations Spending
Percent Central Admin Spending

APS Equity Audit 74
020
40
60
80
100
Alte
rnative
Carv
er
Chart
er
Dougla
ss
Gra
dy
Jacks
on
Mays
Nort
h A
tla
South
Atla
Therr
ell
Washin
gto
n
Cluster
Distribution of Expenditures by Spending Type
Percent Instructional SpendingPercent Support Services Spending
Percent School Admin Spending Percent Operations Spending
Percent Central Admin Spending
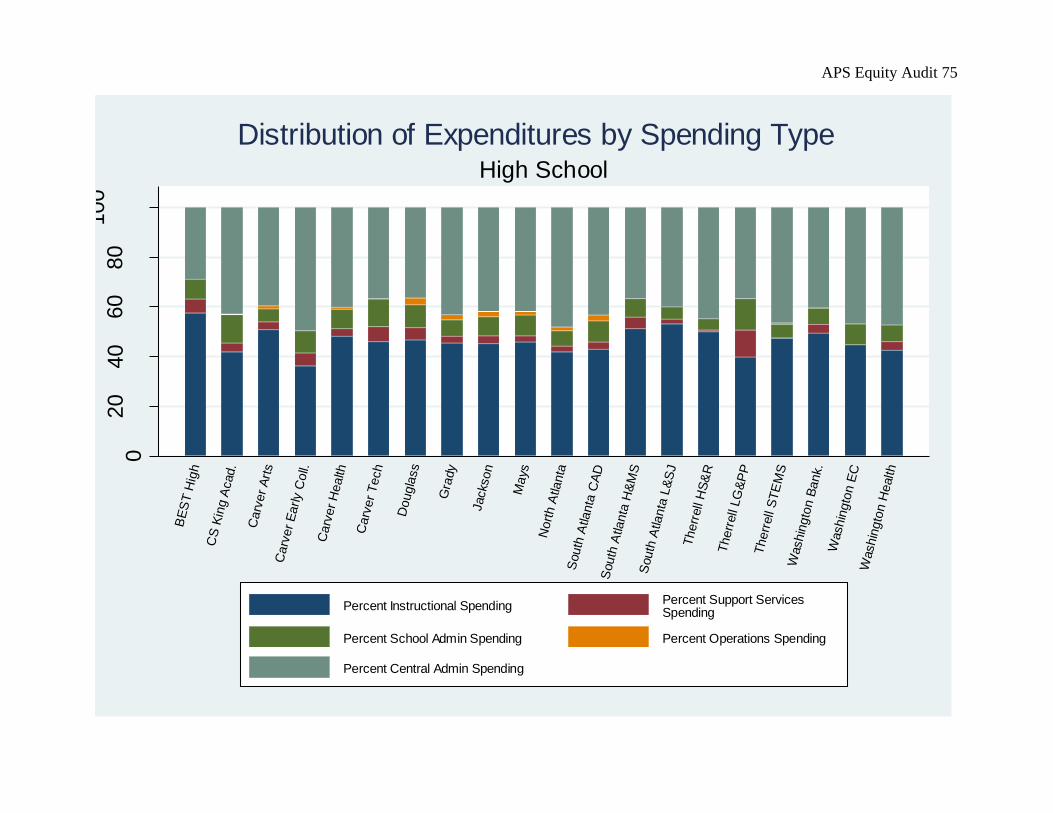
APS Equity Audit 75
020
40
60
80
100
BE
ST
Hig
h
CS
Kin
g A
cad.
Carv
er
Art
sC
arv
er
Early C
oll.
Carv
er
Health
Carv
er
Tech
Dougla
ss
Gra
dy
Jacks
on
Mays
Nort
h A
tlanta
South
Atla
nta
CA
DS
outh
Atla
nta
H&
MS
South
Atla
nta
L&
SJ
Therr
ell
HS
&R
Therr
ell
LG
&P
PT
herr
ell
ST
EM
SW
ashin
gto
n B
ank.
Washin
gto
n E
CW
ashin
gto
n H
ealth
High School
Distribution of Expenditures by Spending Type
Percent Instructional SpendingPercent Support Services Spending
Percent School Admin Spending Percent Operations Spending
Percent Central Admin Spending
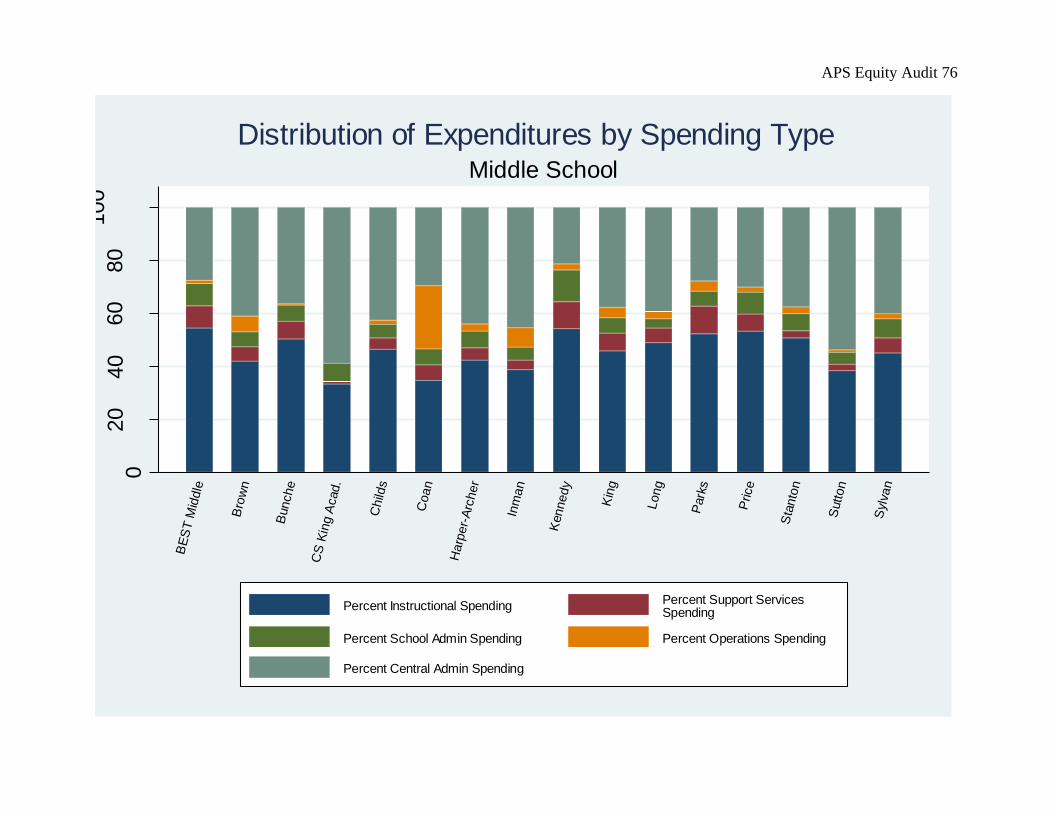
APS Equity Audit 76
020
40
60
80
100
BE
ST
Mid
dle
Bro
wn
Bunche
CS
Kin
g A
cad.
Child
s
Coan
Harp
er-
Arc
her
Inm
an
Kennedy
Kin
g
Long
Park
s
Price
Sta
nto
n
Sutton
Syl
van
Middle School
Distribution of Expenditures by Spending Type
Percent Instructional SpendingPercent Support Services Spending
Percent School Admin Spending Percent Operations Spending
Percent Central Admin Spending
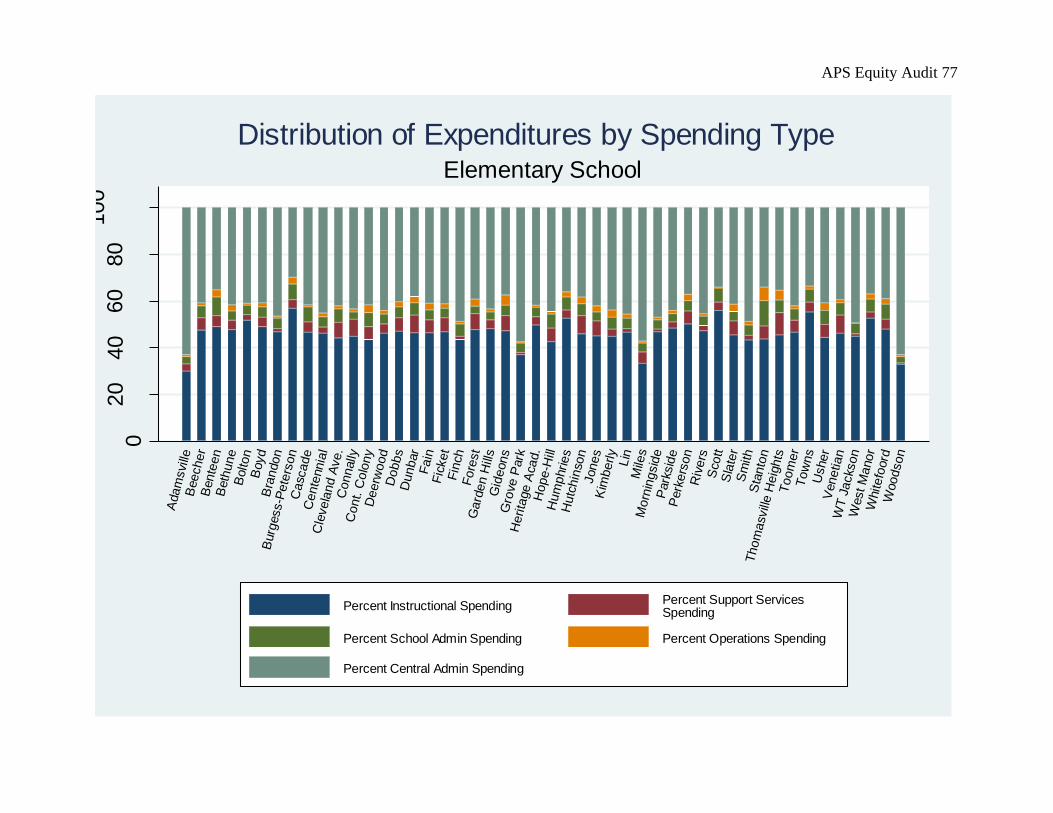
APS Equity Audit 77
020
40
60
80
100
Adam
svi
lleB
eecher
Bente
en
Beth
une
Bolton
Boyd
Bra
ndon
Burg
ess-P
ete
rson
Casc
ade
Cente
nnia
lC
levela
nd A
ve.
Connally
Cont. C
olo
ny
Deerw
ood
Dobbs
Dunbar
Fain
Fic
ket
Fin
chF
ore
st
Gard
en H
ills
Gid
eons
Gro
ve P
ark
Herita
ge A
cad.
Hope-H
illH
um
phries
Hutc
hin
son
Jones
Kim
berly
Lin
Mile
sM
orn
ingsid
eP
ark
sid
eP
erk
ers
on
Riv
ers
Sco
ttS
late
rS
mith
Sta
nto
nT
hom
asv
ille H
eig
hts
Toom
er
Tow
ns
Usher
Venetian
WT
Jacks
on
West M
anor
Whitefo
ord
Woodson
Elementary School
Distribution of Expenditures by Spending Type
Percent Instructional SpendingPercent Support Services Spending
Percent School Admin Spending Percent Operations Spending
Percent Central Admin Spending

APS Equity Audit 78
B. Region Figures
020
40
60
80
100
Alternative Charter East North South West
All Students
Percent by Race
Black Hispanic
White Other
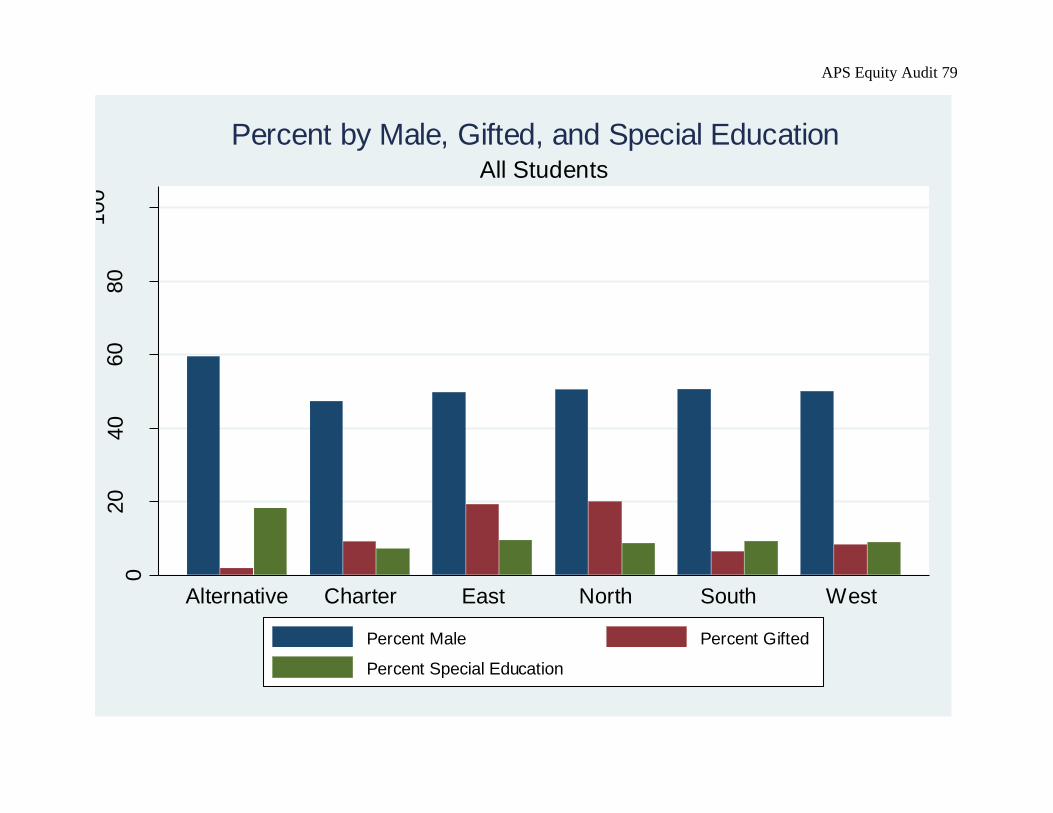
APS Equity Audit 79
020
40
60
80
100
Alternative Charter East North South West
All Students
Percent by Male, Gifted, and Special Education
Percent Male Percent Gifted
Percent Special Education

APS Equity Audit 80
020
40
60
80
100
Alternative Charter East North South West
Economically Disadvantaged defined as eligible for free or reduced price lunch.
All Students
Percent by Economically Disadvantaged, Homeless, and English Learner
Percent Economically Disadvantaged
Percent Homeless
Percent English Learner
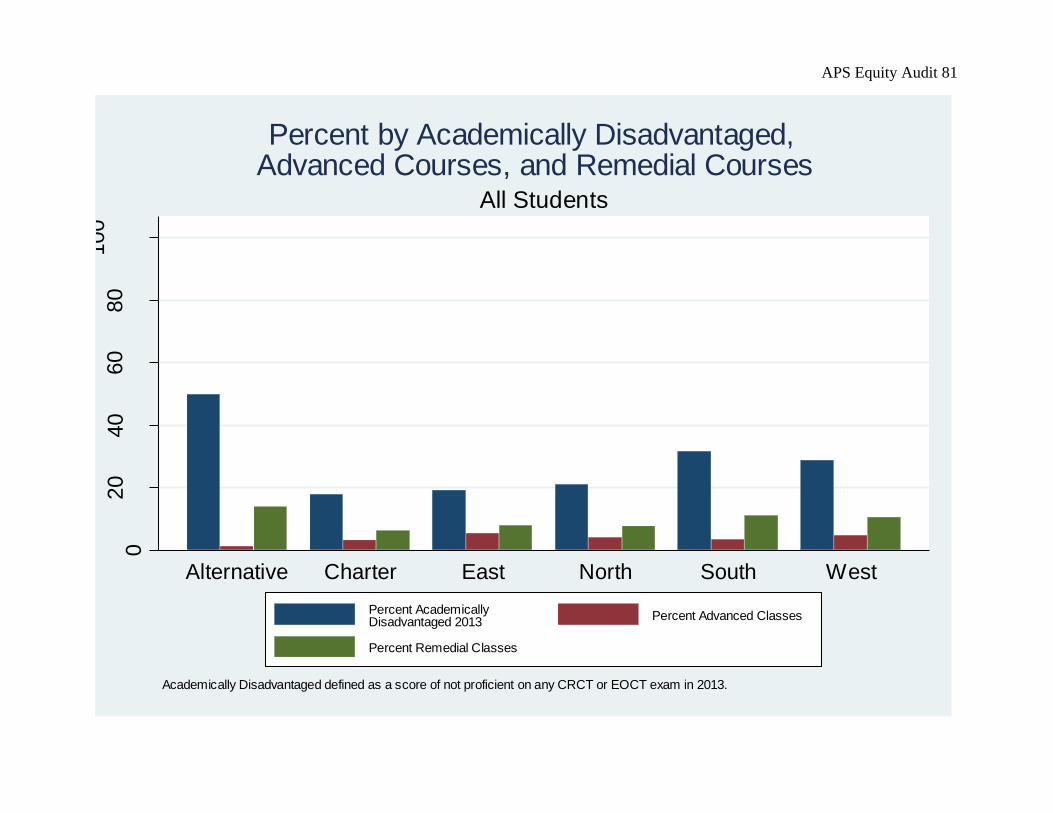
APS Equity Audit 81
020
40
60
80
100
Alternative Charter East North South West
Academically Disadvantaged defined as a score of not proficient on any CRCT or EOCT exam in 2013.
All Students
Percent by Academically Disadvantaged, Advanced Courses, and Remedial Courses
Percent Academically Disadvantaged 2013
Percent Advanced Classes
Percent Remedial Classes
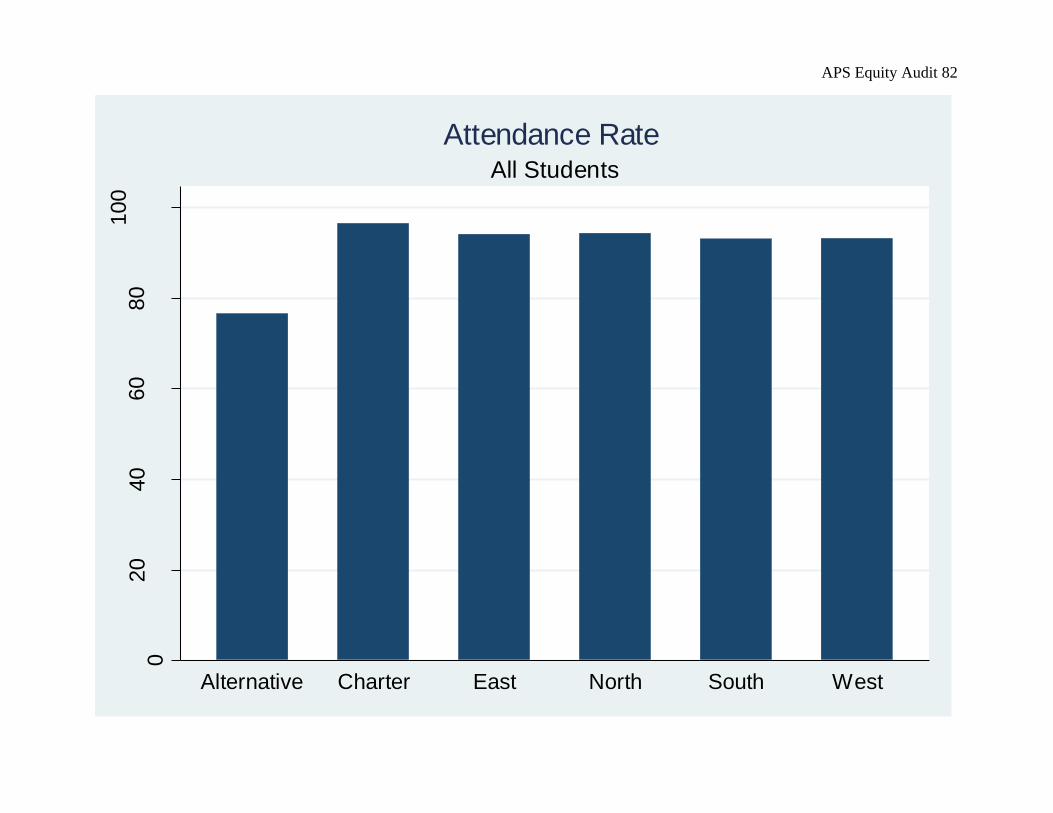
APS Equity Audit 82
020
40
60
80
100
Avera
ge A
ttendance R
ate
Alternative Charter East North South West
All Students
Attendance Rate
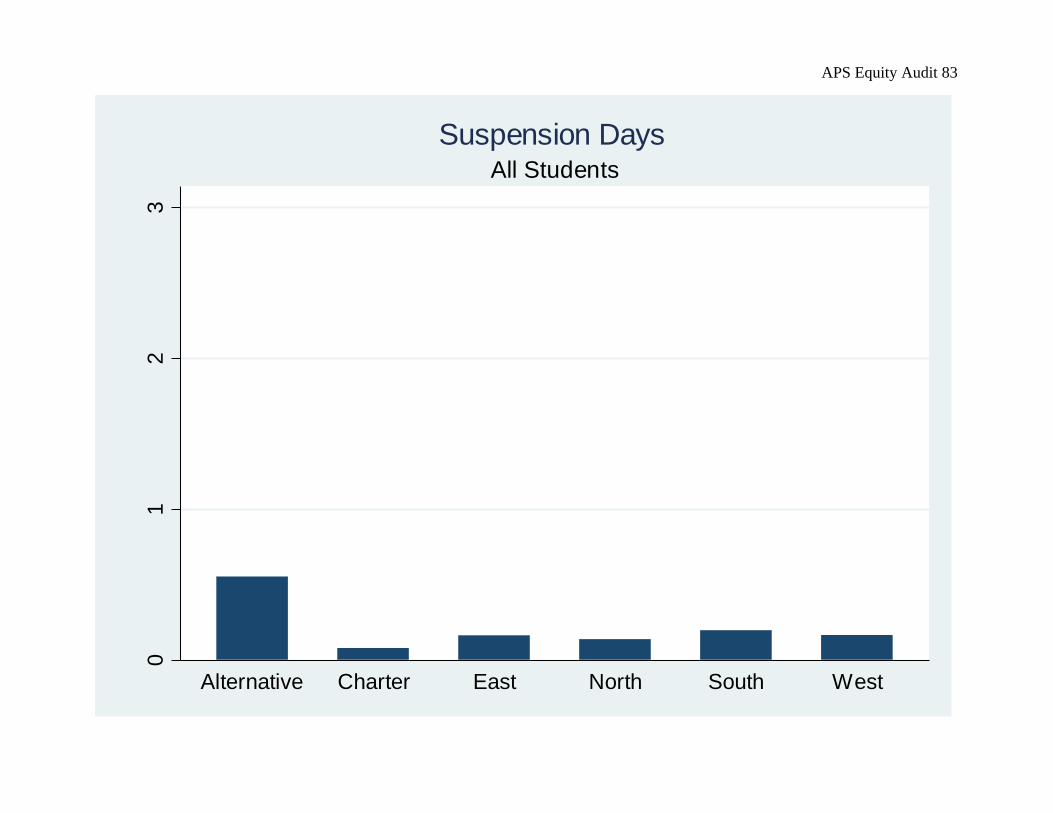
APS Equity Audit 83
01
23
Avera
ge S
uspensio
n D
ays
Alternative Charter East North South West
All Students
Suspension Days
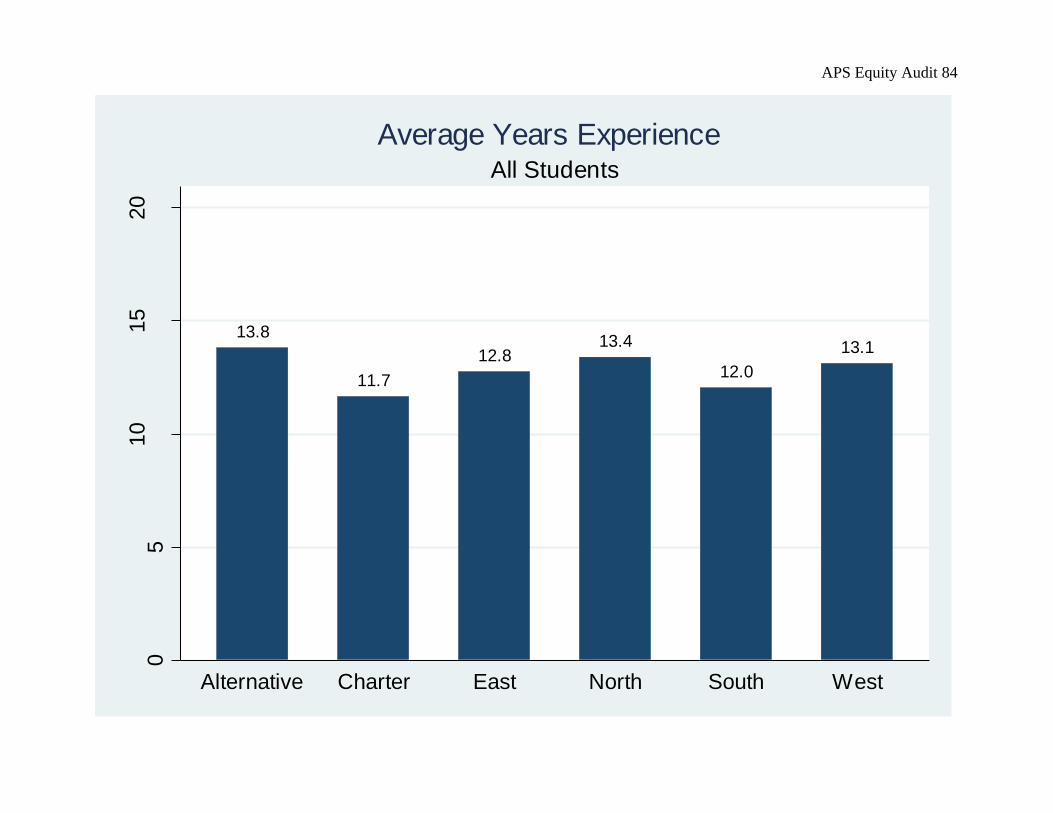
APS Equity Audit 84
13.8
11.7
12.813.4
12.0
13.1
05
10
15
20
Years
Experi
ence
Alternative Charter East North South West
All Students
Average Years Experience
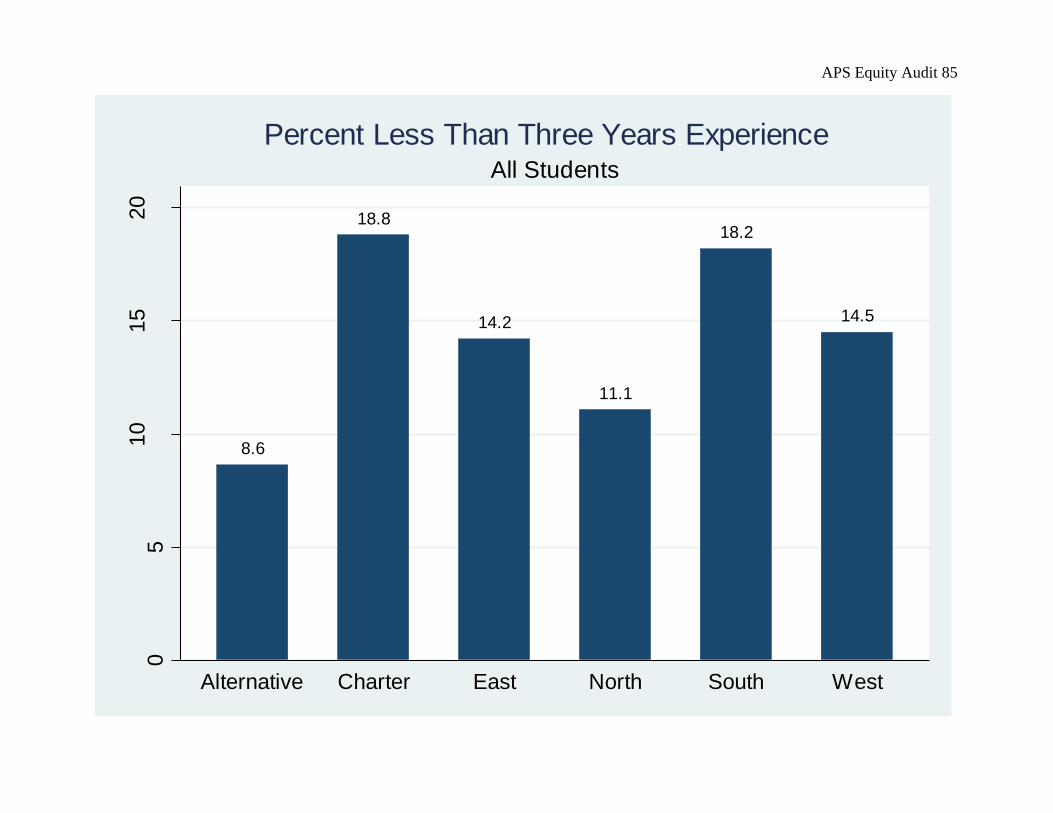
APS Equity Audit 85
8.6
18.8
14.2
11.1
18.2
14.5
05
10
15
20
Perc
ent In
experi
enced
Alternative Charter East North South West
All Students
Percent Less Than Three Years Experience

APS Equity Audit 86
2.82.9 3.0 3.0 3.1 3.0
01
23
4
Avera
ge T
eacher
Valu
e A
dded
Alternative Charter East North South West
All Students
Teacher Value Added
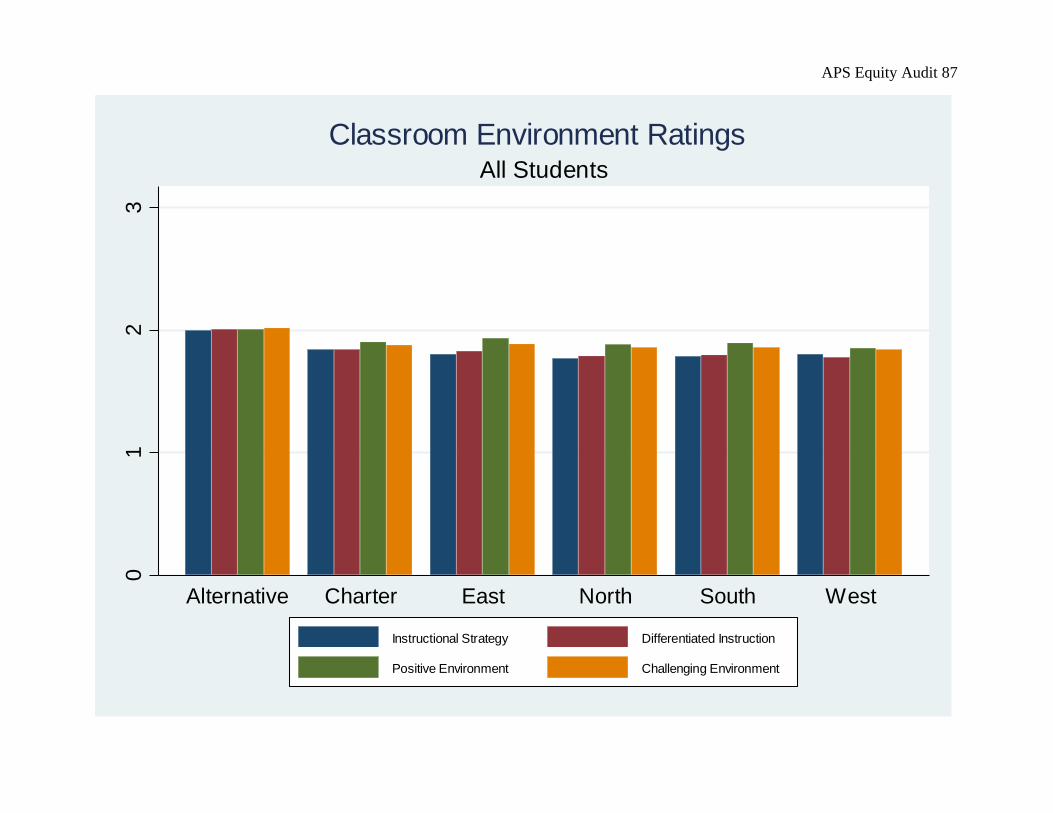
APS Equity Audit 87
01
23
Alternative Charter East North South West
All Students
Classroom Environment Ratings
Instructional Strategy Differentiated Instruction
Positive Environment Challenging Environment

APS Equity Audit 88
C. Cluster Figures
020
40
60
80
100
Altern
ative
Carv
er
Chart
er
Dougla
ss
Gra
dy
Jackson
Mays
Nort
h A
tla
South
Atla
Therr
ell
Washin
gto
n
All Students
Percent by Race
Black Hispanic
White Other
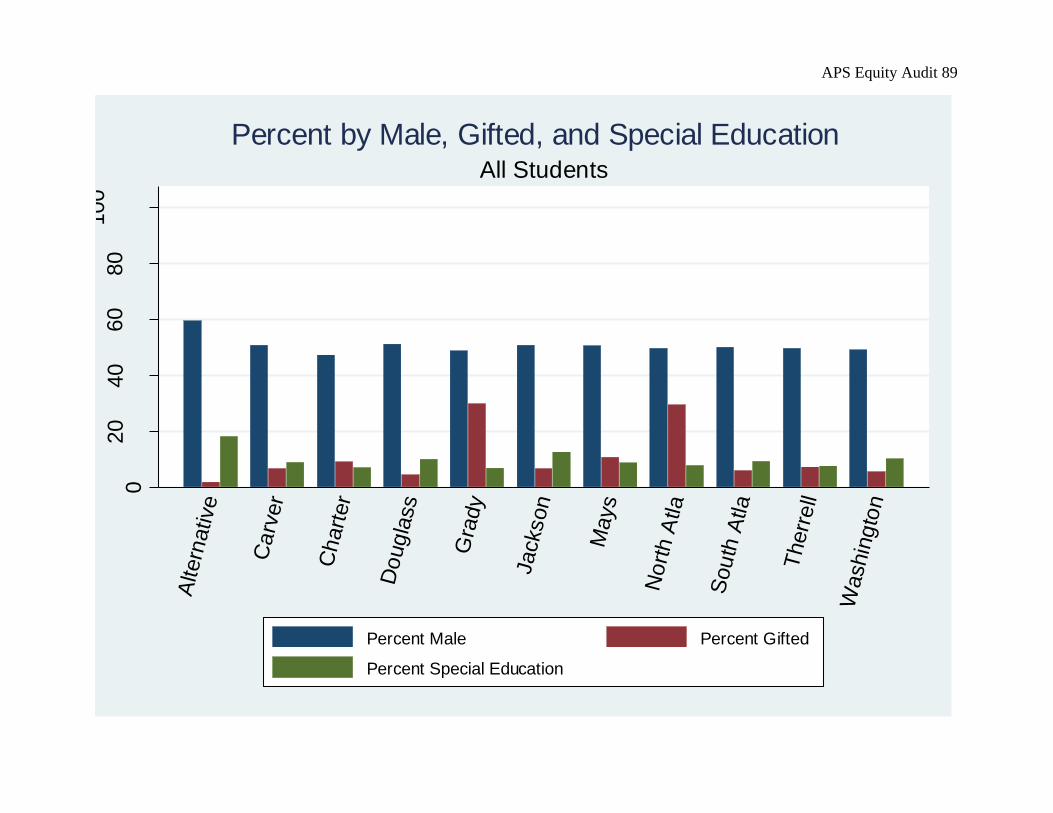
APS Equity Audit 89
020
40
60
80
100
Altern
ative
Carv
er
Chart
er
Dougla
ss
Gra
dy
Jackson
Mays
Nort
h A
tla
South
Atla
Therr
ell
Washin
gto
n
All Students
Percent by Male, Gifted, and Special Education
Percent Male Percent Gifted
Percent Special Education

APS Equity Audit 90
020
40
60
80
100
Altern
ative
Carv
er
Chart
er
Dougla
ss
Gra
dy
Jackson
Mays
Nort
h A
tla
South
Atla
Therr
ell
Washin
gto
n
Economically Disadvantaged defined as eligible for free or reduced price lunch.
All Students
Percent by Economically Disadvantaged, Homeless, and English Learner
Percent Economically Disadvantaged
Percent Homeless
Percent English Learner
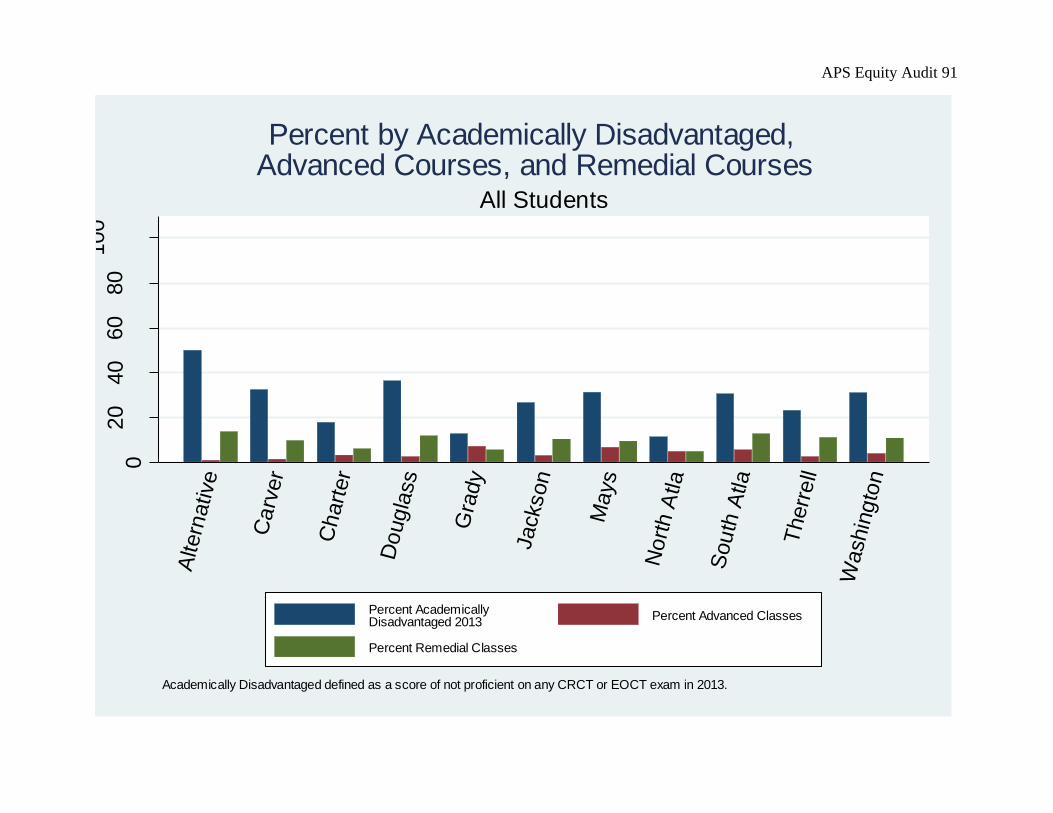
APS Equity Audit 91
020
40
60
80
100
Altern
ative
Carv
er
Chart
er
Dougla
ss
Gra
dy
Jackson
Mays
Nort
h A
tla
South
Atla
Therr
ell
Washin
gto
n
Academically Disadvantaged defined as a score of not proficient on any CRCT or EOCT exam in 2013.
All Students
Percent by Academically Disadvantaged, Advanced Courses, and Remedial Courses
Percent Academically Disadvantaged 2013
Percent Advanced Classes
Percent Remedial Classes

APS Equity Audit 92
020
40
60
80
100
Avera
ge A
ttendance R
ate
Altern
ative
Carv
er
Chart
er
Dougla
ss
Gra
dy
Jackson
Mays
Nort
h A
tla
South
Atla
Therr
ell
Washin
gto
n
All Students
Attendance Rate

APS Equity Audit 93
01
23
Avera
ge S
uspensio
n D
ays
Altern
ative
Carv
er
Chart
er
Dougla
ss
Gra
dy
Jackson
Mays
Nort
h A
tla
South
Atla
Therr
ell
Washin
gto
n
All Students
Average Suspension Days
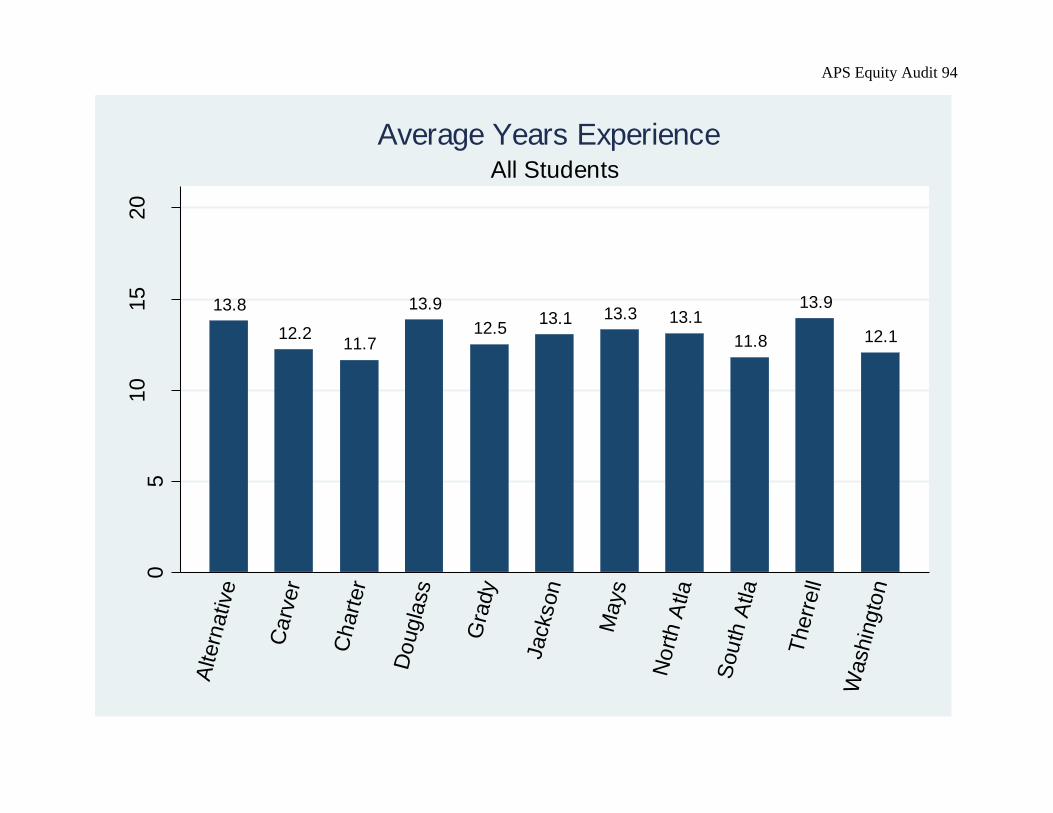
APS Equity Audit 94
13.8
12.211.7
13.9
12.513.1 13.3 13.1
11.8
13.9
12.1
05
10
15
20
Years
Experi
ence
Altern
ative
Carv
er
Chart
er
Dougla
ss
Gra
dy
Jackson
Mays
Nort
h A
tla
South
Atla
Therr
ell
Washin
gto
n
All Students
Average Years Experience
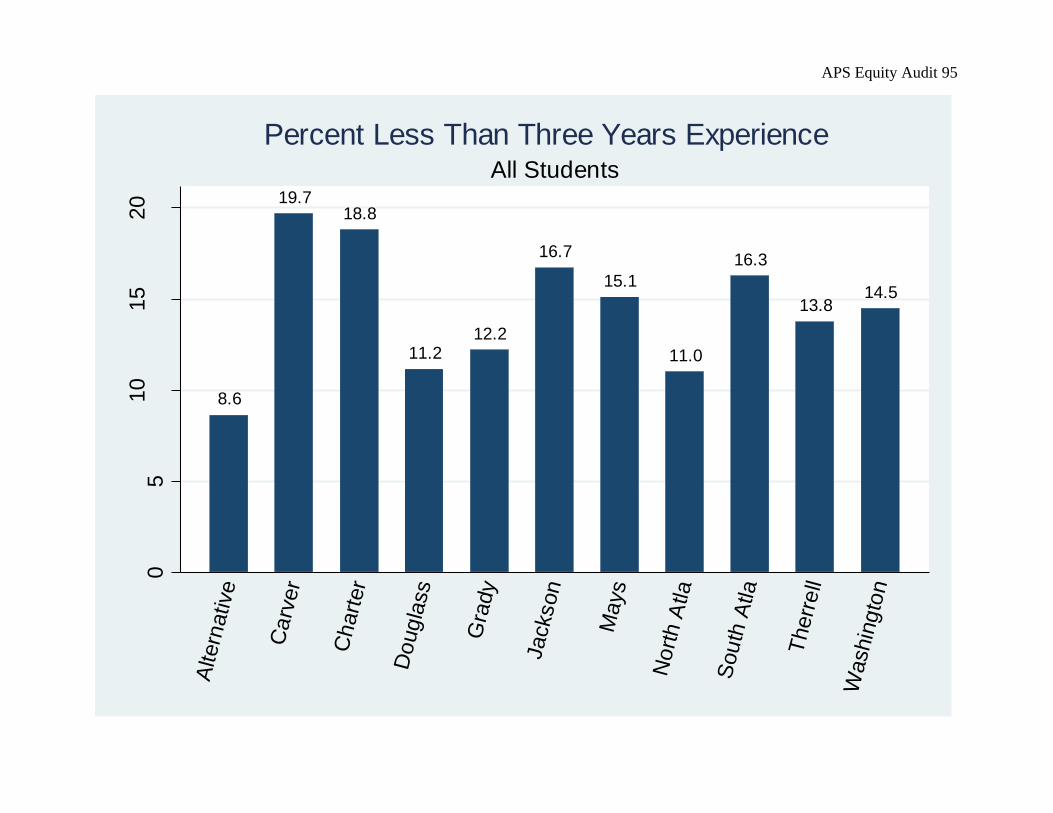
APS Equity Audit 95
8.6
19.718.8
11.212.2
16.7
15.1
11.0
16.3
13.814.5
05
10
15
20
Perc
ent In
experi
enced
Altern
ative
Carv
er
Chart
er
Dougla
ss
Gra
dy
Jackson
Mays
Nort
h A
tla
South
Atla
Therr
ell
Washin
gto
n
All Students
Percent Less Than Three Years Experience

APS Equity Audit 96
2.8
3.12.9 3.0 3.0 2.9
2.83.0 3.0
3.1 3.2
01
23
4
Avera
ge T
eacher
Valu
e A
dded
Altern
ative
Carv
er
Chart
er
Dougla
ss
Gra
dy
Jackson
Mays
Nort
h A
tla
South
Atla
Therr
ell
Washin
gto
n
All Students
Teacher Value Added

APS Equity Audit 97
01
23
Altern
ative
Carv
er
Chart
er
Dougla
ss
Gra
dy
Jackson
Mays
Nort
h A
tla
South
Atla
Therr
ell
Washin
gto
n
All Students
Classroom Environment Ratings
Instructional Strategy Differentiated Instruction
Positive Environment Challenging Environment
Related Documents


