A THESIS entitled REGIONAL GEOCHEMICAL STUDIES IN COUNTY LIMERICK, IRELAND, WITH PARTICULAR REeERENCE TO SELENIUM AND MOLYBDENUM Submitted for the degree of DOCTOR OF PHILOSOPHY in the FACULTY OF SCIENCE IN THE UNIVERSITY OF LONDON By WARREN JOHN ATKINSON Royal School of Mines, Imperial College. January, 1967

Welcome message from author
This document is posted to help you gain knowledge. Please leave a comment to let me know what you think about it! Share it to your friends and learn new things together.
Transcript

A
THESIS
entitled
REGIONAL GEOCHEMICAL STUDIES IN COUNTY LIMERICK,
IRELAND, WITH PARTICULAR REeERENCE TO
SELENIUM AND MOLYBDENUM
Submitted for the
degree of
DOCTOR OF PHILOSOPHY
in the
FACULTY OF SCIENCE IN THE UNIVERSITY OF LONDON
By
WARREN JOHN ATKINSON
Royal School of Mines, Imperial College. January, 1967

ABSTRACT
Geochemical studies of an area in Co. Limerick, Ireland, containing Mo and Se-rich Namurian black shales (Clare Shales) show that the metal content of stream sediments sampled at a density of 1-2 samples per sq. mile can be related to patterns in the bedrock and overburden. Anomalous concentrations of Mo and Se in the drainage also reflect the metal content of pasture herbage and afford a means of detecting areas in which toxic or sub-toxic levels in the herbage are related to problems of animal nutrition.
Primary dispersion studies define characteristic minor element patterns for the various bedrock types and investigations are made of the modes of dispersion of Mo, Se and some other metals, in the black shale facies.
Metal patterns in the soils and overburden are described and the dispersion of Mo and Se is shown to be predominantly controlled by the origin of the overburden, the effects of glacia-tion, drainage and the distribution of secondary iron oxides and organic carbon. Particular attention is paid to modes of forma-tion leading to toxic concentrations of Mo and Se in swamp and alluvial soils.
The distribution of Mo and Se in common pasture species is described and it is shown that the Mo content of topsoil, modified by soil 44ction is the major influence on uptake by herbage. However, toxic concentrations of Se in herbage.are re-stricted to Se-rich organic, poorly drained soils with pH greater than 5.5.
Concentrations of Mo and Se in near-surface groundwaters are closely related to the total metal content of the soil profile. Accumulation of Mo and Se in peaty-swamps is attributed to metal introduced in groundwater and fixed by sorption on organic matter and iron oxides. Decomposition of metal-rich organic soils has led to high concentrations of Mo and Se in near-surface groundwater.
Mo and Se precipitate at seepage zones mainly in associa-tion with iron oxides and organic matter respectively, but dispersion downstream in sediments is mainly mechanical. In stream sediments and alluvial deposits, Se only is enriched by sorption on organic carbon which accumulates in calcareous precipitates. The Se content of stream waters can probably be related to the presence of soluble and hence available Se in the catchment soils.
Examples are given of the application of stream sediment reconnaissance to problems of agriculture and geology.

ii
CONTENTS
Page
ABSTRACT
LIST OF TABLES
LIST OF FIGURES
•••
•••
• • •
•••
•••
• • •
••• •••
• • • • • •
• • • • • •
CHAPTER I. INTRODUCTION 1
1. ORIGIN OF THE RESEARCH ... ... 2
(i) Regional Geochemistry ... ... 2 (ii) Regional Biogeochemistry .00 5
2. PREVIOUS WORK ... ... ... 8 (i) Selenium in Relation to Nutrition 8 (ii) Molybdenum in Relation to Nutrition 10
3. PRESENTATION OF THESIS 0.8 • s 4 12
4. ACKNOWLEDGEMENTS .. . 000 006 13
PART A
CHAPTER II. DESCRIPTION OF AREA • • • 15
1. LOCATION ... • • • • • • ... 15
2. GEOLOGY ... me. .06 • • • 15
(a) Pre-Quaternary Geology ... 000 16 (b) Quaternary Geology ... 6.6 21
3. CLIMATE ... ... O.. • • • 26 4. GEOMORPHOLOGY 006 O.. 6.6 27
5. SOILS ... ... • • • ... 28
CHAPTER III. SAMPLING AND ANALYTICAL TECHNIQUES 32
1. FIELD SAMPLING ... 0.0 .00 32
(a) Rocks ... ••• ••• 33 (b) Stream Sediments ••• ••• 33 (c) Soils ... ••• ••• 34 (d) Herbage ••• ••• 35 (e) Natural Waters .00 ••• ••• 36

2. SAMPLE PREPARATION ... 44.
(a) Rocks ... •••
(b) Soils and Sediments •••
(c) Drift ... •••
(d) Peat ... (e) Herbage • • •
3. ANALYTICAL TECHNIQUES 900
.00
•••
•••
•••
• • •
• • •
Page
36
36 36 37 37 37 38
(a) Spectrographic Techniques • • • 38 (b) Selenium • • • • • • 41 (c) Molybdenum • • • 42 (d) Iron ... • • • 43 (e) Copper 044. Os. • • • 43 (f) Zinc ... 4.4 609 • • • 44 (g) Phosphorus • • • 44 (h) Arsenic • • • 44 (i) Sulphate • • • 45 (j) Sulphur GOO .00 • • • 45 (k) Organic Carbon ... 45 (1) Carbonate and Bicarbonate • • • 46
4. MISCELLANEOUS TECHNIQUES • • • • • • 46
(a) pH ... ... .40 00 • 46 (b) Eh ... ... • • • ••• 47 (c) Size Analysis by Wet Dispersion ••• 48 (d) Heavy Liquid Separation ... • • • 50
PART B
CHAPTER IV. THE REGIONAL METAL PATTERNS 44. 51
1. STREAM SEDIMENTS 0.11 • • • 0.6 52
2. BEDROCK ... ... • . • 6.6 57 3. OVERBURDEN ... .64 040 066 61 4. HERBAGE ... 0.. 6.0 468 66
5. DISCUSSION ... • • • ... 68
CHAPTER V. DISTRIBUTION OF METAL IN THE FLYNN'S FARM AREA 40. ... 4.4 72
1. GENERAL DESCRIPTION OF THE AREA 6.1 72
2. STREAM SEDIMENT METAL PATTERNS ... 74
3. NhTAL PATTERNS IN THE SOILS ... ... 77 4. METAL PATTERNS IN PASTURE HERBAGE ... 81
5. DISCUSSION ... 060 004 00. 83

iv
Page
PART C
CHAPTER VI. DISTRIBUTION OF METAL IN THE CLARE SHALES 86
1. VARIATION OF METAL CONTENT WITH LITHOLOGY IN THE CLARE SHALES ... 0.0 0.0 87
2. VERTICAL AND LATERAL DISTRIBUTION OF METAL IN THE CLARE SHALES ... ... 4.. 90
3. MODE OF OCCURRENCE OF METAL IN THE SHALES 96
(i) Relationship Between Sulphur and Selenium 96 (ii) Relationship Between Sulphur and Molybdenum 97 (iii) Selenium and Molybdenum in Relation to
Organic Carbon ... 00. 98 (iv) Selenium and Molybdenum in Relation to
Iron ... 420 000 99 (v) Distribution of Metal in Mineral Fractions 100
SUMMARY OF RESULTS ... 044 107
5. ORIGIN OF MOLYBDENUM AND SELENIUM IN THE CLARE SHALES ••• ••• ••• •••
111
CHAPTER VII. DISTRIBUTION OF METAL IN OVERBURDEN 119
1. RESIDUAL SOILS ... .00 .06 119
(i) Distribution of Metal in the Soil Profiles 120
(a) Molybdenum and Selenium 120 (b) Other Metals 000 004 128
(ii) Size Analysis of Residual Soil Samples 132
(a) Molybdenum and Selenium ... 133
(b) Other Metals .20 000 135
2,. TRANSPORTRD OVERBURDEN ... 000 135
(i) Colluvium •••
•••
•••
138 (ii) Glacial Drift •••
•••
•••
139 (a) Areal Distribution of Metal in Drift 140 (b) Distribution of Metal in Drift Profiles 142 (c) Mechanical Analysis of Drift and the
Distribution of Metal Between Size Fractions 158
(iii)Alluvium .40 .00 166
(a) Distribution of Metal in Profile 167 (b) Size Analysis of Alluvium 0.0 183

220 222 232 233 238 239 240 243
' v
Page
(iv) Peaty-Swamp Deposits • • • • • • 184
(a) Distribution of Metal in Peaty-Swamp Profiles ... 187
(b) Lateral Metal Distribution Patterns in the Peaty-Swamps and Adjacent Over- burden 000 &•• 000
193 (c) Accumulation of Mo and Se in Peaty-
Swamp Soils 198
3. COMPARISON OF -2 mm AND -80 MESH ANALYSES 207
4. SUMMARY OF CONCLUSIONS CONCERNING THE ORIGIN OF MOLYBDENUM AND SELENIUM PATTERNS IN OVER- BURDEN ... 000 ... 00. 209
CHAPTER VIII. METAL DISTRIBUTION IN HERBAGE 213
1. DISTRIBUTION OF MOLYBDENUM, SELENIUM AND COPPER IN SOME COMMON PASTURE SPECIES ... 213
2. FACTORS INFLUUCING METAL UPTAKE BY PLANTS' 219
(a) Metal Content of the Topsoil (b) Soil Reaction ... (c) Eh of the Soil Environment (d) Drainage (e) Organic Matter ... (f) Iron ... solo ...
(g) Sulphate and Phosphate
3. DISCUSSION AND SUMMARY
CHAPTER IX. DISTRIBUTION OF MOLYBDENUM AND SELENIUM IN DRAINAGE ... ... 247
1. GENERAL DESCRIPTION OF FLYNN'S FARM DRAINAGE SYSTEM ... 000 ... 000 247
2. MOLYBDENUM AND SELENIUM CONTENT OF GROUNDWATERS 250
(a) Molybdenum and Selenium in Fackground Areas 250 (b) Groundwaters from Clare Shales 006 251
(c) Groundwaters Draining Drift ... 251
(d) Groundwaters from Peaty-Swamp Deposits 255 (e) Groundwaters from Alluvial Deposits 256 (f) Summary - Molybdenum and Selenium Content
of Groundwaters see ... 258 3. MOLYBDENUM AND SELENIUM CONTENT OF SURFACE WATERS 261
(a) Molybdenum and Selenium Content of Stream
Waters from Background Areas 4.0 261

vi
Page
(b) Distribution of Molybdenum and Selenium in Surface Waters Draining the Flynn's Farm Area ... ... 262
(0) Possible Relationship of Metal Concentrations in Stream Waters to Toxic Soils ... 274
(d) Summary - Molybdenum and Selenium in Stream Waters ... 27? ... ...
4. DISTRIBUTION OF MOLYBDENUM AND SELENIUM IN STREAM SEDIMENTS ... ... ... 278
(a) Molybdenum and Selenium in Sediments from Background Areas 400 WOO 278
(b) Molybdenum and Selenium in Sediments from Flynn's Farm Drainage ... ... 279
(c) Factors Influencing the Metal Content of Stream Sediments 00. 400 281
(i) Mechanical Composition (ii) Physio-Chemical Associations ... (iii) Mode of Occurrence of Molybdenum and
Selenium in Stream Sediments ... (iv) The Distribution of Molybdenum and
Selenium in Bank Soils (d) Summary of Conclusions on the Dispersion
of Molybdenum and Selenium in Stream Sediments • • • • • •
281 282
288
295
304
PART D
CHAPTER X. THE APPLICATION OF REGIONAL GEOCHEMISTRY 308
1. REGIONAL GEOCHEMICAL SURVEYS AND AGRICULTURAL PROBLEMS ... .e. ..• 308
(a) Geochemical Environment Maps 310 (b) Potential Toxic Selenium Occurrences and
Geochemical Environment Maps in Co. Limerick 311
(c) Relationship of Molybdenum Stream Sediment Anomalies to Bovine Hypocuprosis 312
(d) Biogeochemical Reconnaissance in Other Areas 315
2. THE APPLICATION OF REGIONAL GEOCHEMICAL SURVEYS TO GEOLOGICAL MAPPING ... 44. 317
CHAPTER XI. CONCLUSIONS AND RECOMMENDATIONS FOR FUTURE RESEARCH 0.4 0.6 O..
320
LIST OF REFERENCES .... 490 444 .041 329

vii.
LIST OF TABLES
No. Title Page
1 Major Rock Formations in the Area 21
2 Main Glacial Events of the Quaternary Period in Ireland 22
3 Climatic Features of the Area 26
4 Spectrographic Equipment and Conditions 39 5 Wavelengths and Usable Concentration Ranges of
Spectral Lines 40 6 Size Fractions Obtained from Mechanical Analysis 49
7 Metal Contents of Stream Sediments from Different Bedrock Areas 53
8 Metal Content of the Major Rock Types Compared with Average Values for Common Sedimentary Rocks 60
9 Metal Content of Soils and Drift from Different Bedrock Areas 63
10 Regional Distribution of Metal - Comparison of the Mean Metal Contents of Bedrock, Overburden and ' Stream Sediments 69
11 Mean Metal Content of Different Shale Types - Kilcolman Creek Section 89
12 Minor Element Content of the Clare Shales 92
13 Organic Carbon Content of Clare Shale Samples in Relation to the Molybdenum and Selenium Content 99
14 Separation of the Pyrite Fraction from Some Clare Shale Samples 102
15 The Distribution of Minor Elements in Mineral Fractions of the Clare Shales 103
16 Distribution of Molybdenum and Selenium in Residual Soil Profiles 121
17 Other Metal Content of Residual Soil Profiles 129
18 Distribution of Other Metals in Size Fractions of Residual Soils 136
19 Drift Soil Profiles Selected for Study 143
20 Some Physical Characteristics of Elton, Howards- town and Kilrush Series Soils of Drift Origin 144
21 Glacial Drift Profiles in Background Areas. 146

viii
No. Title Page
22 Glacial Drift Profiles with Anomalous Molybdenum and Selenium Contents 148
23 Metal Content of Selected Glacial Drift Profiles 159
24 Distribution of Metal in Size Fractions of Glacial Drift 162
25 Description and Molybdenum and Selenium Content of Alluvial Profiles from Background Areas 168
26 Metal Content of Background Alluvial Profiles 170
27 Profile (BP 28) of Anomalous Alluvium of Pre- dominantly Clare Shale Origin 172
28 Metal Content of Alluvium of Predominantly Clare Shale Origin 173
29 Profile and Molybdenum and Selenium Content of Alluvium of Mixed Limestone and Clare Shale Origin 176
30 Profiles of Anomalous Alluvium of Predominantly Limestone Origin 178
31 General Metal Content of Alluvium of Predominantly Limestone Origin 180
32 Distribution of Metal Between Size Fractions of Alluvium 185
33 Distribution of Molybdenum and Selenium in Peaty- Swamp Profiles from a Background Area 188
34 Profile (BP 6) and Distribution of Molybdenum and Selenium in Peaty-Swamp Deposits, Flynn's Farm Area 189
35 General Metal Content of Peaty-Swamp Soils - Flynn's Farm Selenium Toxic Field 192
36 Comparison of the Metal Content of Peaty and Non- Peaty Soils on the Margin of Peat-Swamp Deposits 197
37 Metal Content of Typical Pasture Species 215
38 Influence of Soil Reaction on Availability of Molybdenum 223
39 Effect of pH on Selenium Uptake by Herbage from Peaty-Swamp Soils 228
40 Relationship Between pH and Selenium Uptake by Red Clover Growing on Alluvial Soils 231
41 Metal Uptake by Plants Under Varying Conditions of Drainage 236

ix
No. Title Page
42 Metal Content of Groundwater from Background Areas 250
43 Molybdenum and Selenium Content of Groundwater from Clare Shale Overburden 251
44 Relationship of Molybdenum and Selenium Content of Groundwater to that of the Soil 253
45 Relationship of Molybdenum and Selenium in Groundwater to Molybdenum and Selenium Content of Alluvium 257
46 Relationship of Molybdenum and Selenium in Groundwater to Molybdenum and Selenium Content of Overburden 260
47 Metal Content of Stream Waters from Background Areas 262
48 Summary - pH, Eh and Bicarbonate Content of Surface Waters Compared to Groundwaters 263
49 Bicarbonate Content of Waters from Non-Limestone Areas 264
50 Comparison of Calculated and Observed Molybdenum and Iron Contents of Stream Waters 268
51 Comparison of Molybdenum and Selenium Content of Flynn's Creek Stream Waters Collected During Two Field Seasons at Similar Sites 276
52 Molybdenum and Selenium Content of Stream Sediments from Background Areas 279
53 Distribution of Metal Between Size Fractions of Stream Sediments 283
54 Comparison of Molybdenum and Selenium Content of Normal Stream Sediment and CaCO
3 Concretions 288
55 Molybdenum and Selenium Content of Stream Sediments in Relation to Organic Carbon and Iron Oxide Content of the Sample 290
56 Blood Copper Values from Dairy Herds Grouped According to Molybdenum Content of Local Stream Sediment 314

x
No.
1
LIST OF FIGURES
Following Page No.
Title
Location of Area, Principal Cities and Locali- ties Mentioned in Text 15
2 Major Roads, Principal Towns and Localities Mentioned in the Regional Study Area 15
3 Simplified Geology of the Area Covered by the Regional Geochemical Survey 16
4 Extent of the Wiechsel Glaciation in Ireland 21
5 Glacial Drift and Overburden Map of the Area 23
6 Topography, Regional Study Area 27
7 Generalized Soil Map of the Area 28
8 Regional Distribution of Molybdenum in Stream Sediments of Tributary Drainage 53
9 Regional Distribution of Selenium in Stream Sediments of Tributary Drainage 54
10 Regional Distribution of Metal in Stream Sediments. Logarithmic Frequency Plots for Molybdenum and Selenium 54
11 Regional Distribution of Metal in Stream Sediments. Logarithmic Frequency Plots for Copper and Vanadium 55
12 Regional Distribution of Molybdenum in Soil and Drift 55
13 Trace Element Content of Major Rock Units 57 14 Regional Distribution of Molybdenum in Rock 58
15 Regional Distribution of Selenium in Rock 58
16 Diagram Illustrating the Mean Values and Range of Metal in the Four Major Rock Types 60
17 Regional Metal Content of Herbage 66 18 Topography and Place Names - Flynn's Farm Area 72
19 Distribution of Molybdenum in Stream Sediment, Soil and Mixed Herbage and Simplified Overburden Map 74
20 Distribution of Selenium in Stream Sediment, Soil and Mixed Herbage and Geology 75

xi
Following No. Title
Page
Distribution of Copper in Stream Sediments and Topsoil - Flynn's Farm Area 76
22 Distribution of Vanadium in Stream Sediments and Topsoil - Flynn's Farm Area 77
23 pH of Topsoil - Flynn's Farm Area 81
24 Thin Sections of Clare Shales 87
25 Stratigraphical Sections of the Clare Shales Showing the Molybdenum and Selenium Content 92
26 Vertical Sections of the South Shelf of the Clare Shale Basin Showing Metal Distribution in Strati- graphic Zones 92
27 Variation of Molybdenum and Selenium Clare Shales 92
28 The Stratigraphic Relationships of Molybdenum : Selenium Ratios in the Clare Shales 93
29 Variation of Molybdenum and Copper in Clare Shales 94
30 Variation of Sulphur - Selenium in Clare Shales 96
31 Variation of Sulphur - Molybdenum in Clare Shales 97
32 Relationship of Molybdenum and Selenium to Iron in Clare Shales 99
33 Size Analysis of Residual Soils 132
34 North-South Section Across South Margin of Peaty- Swamp Area - Flynn's Farm 138
35 Size Analysis of Glacial Drift Samples 161
36 Distribution of Selenium in Alluvium, North-South Section Across Alluvial Flat - Toxic Soil Site B 169
37 Distribution of Molybdenum in Alluvium, North- South Section Across Alluvial Flat - Toxic Soil Site B 169
38 Size Analysis of Alluvium Samples 183
39 West-East Vertical Section Across Mat Margin of Flynn's Toxic Field 187
40 Flynn's Farm Peaty-Swamp Area - Molybdenum and Selenium Content of Ground and Stream Waters 199
41 Stability Fields of Some Ionic Species of Molybdenum Selenium and Iron 201
42 pH-Eh Status of Groundwaters 201

xii
Following No. Title
Page
43 Solubility of Ferric Molybdate at Varying pH 202
44 Relationship Between Molybdenum Content of Topsoil and Pasture Herbage 220
45 Molybdenum Content of Topsoil and Red Clover Under Various Soil pH Conditions 221
46 Relationship Between the Selenium Content of Topsoil and Pasture Herbage 221
47 Relationship between Molybdenum Uptake by Red Clover and Soil Reaction 223
48 Relationship Between Selenium Uptake and Soil Reaction 227
49 pH-Eh Environment of Natural Waters of Study Area 249
50 Relationship Between Metal Content of Soil and Near-Surface Groundwater 252
51 Relationship Between Molybdenum and Selenium in Ground and Surface Waters 252
52 Metal Content of Ground and Stream Waters at the Head of North Creek 265
53 Metal Content of Stream Waters - Flynn's and South Creeks 269
54 Distribution of Molybdenum and Selenium in Stream Waters, Sediments and Bank Soils of Flynn's Creek 270
55 Distribution of Molybdenum and Selenium in Stream Waters, Sediments and Bank Soils of South Creek 271
56 Size Analysis of Stream Sediments 282
57 Distribution of Organic Carbon and Acid Soluble Iron with Reference to the Molybdenum and Selenium Content of Stream Sediment - South Creek 285
58 Relationship of Molybdenum and Selenium to Acid Soluble Iron in Stream Sediments 286
59 Relationship of Molybdenum and Selenium to Organic Carbon in Stream Sediments 286
6o Metal Distribution in Stream Sediments and Bank Soils of Crook Creek 286
61 Metal Content of Stream Sediments at the Head of North Creek 286

Following No. Title Page
62 Stream Bank Cross-Sections Showing Molybdenum and Selenium Content
296
63 Regional Geochemical Environment Map for Selenium 312
64 Location of Dairy Herds Sampled in Relation to Anomalous Molybdenum Stream Sediment Patterns
313

"It is a fact that when they take that road they cannot venture among the mountains with any beast of burden excepting those accustomed to the country, on account of a poisonous plant growing there, which if eaten by them has the effect of causing the hoofs of the animals to drop off. Those of the country, however,'being aware of its dangerous quality, take care to avoid it."
Marco Polo - circa 1275 A.D.
CHAPTER I. INTRODUCTION
The above excerpt from "The Travels of Marco Polo"
is the first recorded instance of what was almost certainly
the accumulation of toxic quantities of Se in plants. Since
then, numerous additional instances of Se poisoning have been
recorded and in general our knowledge of the effects of defi-
ciences or excesses of a large number of metals in plants has
been extended to cover many aspects of agriculture and the
health of human populations as well.
At the same time, but more particularly in recent
years, a vast amount of data on the geochemical distribution
of metals has accumulated, partly from straight geological
studies but also as the result of mineral exploration programmes.
It is estimated (Webb, 1964) that as the result of current world-
wide geochemical surveys involving the sampling of rocks, soils,
herbage, waters and drainage sediments, in the order of
150,000,000 analytical determinations are made each year.

2
In view of the large amount of knowledge that is
accumulating on the geochemical patterns in the upper part of
the earth's crust and on the agricultural and health aspects
of trace element distribution, an obvious problem that arises
is the best means of applyihg the full benefits of the develop-
ing geochemical techniques and data to trace element problems
of agriculture and health. This thesis primarily deals with an
investigation of geochemical mapping techniques applied to the
definition of areas in which abnormal concentrations of trace
elements exist. More specifically, it is concerned with relating
the gbological and geochemical occurrence of excessive concentra-
tions of Se and Mo in the bedrock and soil of an area in Ireland
to the Se and Mo contents of natural herbage by means of regional
stream sediment sampling, as first proposed by Webb (1964).
1. ORIGIN OF THE RESEARCH ssr,onvxan
1122.12221 Geochemistry
In the 1930's the original research by Vernadsky and
Fersman in the U.S.S.R. and Goldschmidt in Scandinavia showed
that anomalous concentrations of metal in soils and plants could
indicate the presence of concealed mineral deposits in the bed-
rock. Since then, and particularly during the last twenty years,
geochemical techniques have advanced rapidly in scale and range
of applications. The dominant impetus to development of the
sampling and analytical methods required has been the needs of

3
the mineral exploration industry.
Geochemical surveys which were intially aimed at the
location of anomalies directly due to mineralisation are now also
employed on a regional scale to delimit by reconnaissance broad
areas or geochemical provinces in which mineral deposits may
occur. More detailed studies are then initiated in these areas.
Regional surveys to disclose broad patterns of metal
distribution related to mineral deposits have involved wide-
spaced sampling of the bedrock, glacial drift, soils, herbage
and waters and sediments of the natural drainage. Although rock
and soil samples may be more closely linked with the metal
content of the bedrock mineral deposits, the present tendency
is to employ stream sediment samples becausel by virtue of their
origini they are more representative of the metal content of the
stream catchment as a whole. It has been shown in many cases
that the presence of mineral deposits located within the catch-
ment is reflected in the metal content of the stream sediments
draining the area (e.g. Case Histories, Chapter 17, Hawkes and
Webb, 1962).
Hawkes et al (1956) showed during the course of a
geochemical mineral reconnaissance carried out in New Brunswick
in 1954 that the background concentrations of base metals in
stream sediments could be related to the distribution of the
principal bedrock units. From this the concept of regional
geochemistry arose in which multi-element analysis of stream

4
sediment samples serves as a means of compiling maps that
reflect the distribution of metals, not only in the drainage
sediments but in the rocks and the bedrock from which they
were ultimately derived. Pioneer studies by Webb et al (1964)
in the Namwala Concession Area, Zambia, in the early 1960's
demonstrated that the overriding control of the metal patterns
in the stream sediment was the bedrock geology. Subsequent
work by Viewing (1962) and James (1964) in Sierra Leone con-
firmed this.
It is true that secondary environmental factors
modify the trace element content of the material as it passes,
during weathering and transport, from rock to soil and thence
to stream sediment. However, the overall bedrock patterns are
retained provided that the drainage takes place along reasonably
well-defined channelways. The greater representivity of stream
sediment samples, compared with rocks and soils which are only
representative of a relatively small area, makes it practical
to map large regions geochemically using widely spaced samples.
Water sampling has the advantage of providing a more homogeneous
sample but is subject to seasonal variations and the influence
of other factors on the composition of natural waters in addi-
tion to problems of analysis and the transport of relatively
bulky samples.

5
(ii) Regional Biogeochemistry
Studies in agriculture and general health have shown
the essentiality of balanced amounts of trace elements to the
well-being of plants, animals and man. Many examples of the
effects of excesses and deficiences of such elements as Co, Cu,
Fe, I, Mn, Mo, Pb, Se and Zn have been recorded (Underwood,
1962; Schutte, 1964).
Although the primary source of trace elements in
the biochemical cycle lies in the bedrock, the actual links
between the metal content of the rock, the soil, water, plants,
and animals are subject to the influence of many factors. Not
only is soil composition dependent on the nature of the bedrock
and the overburden, but it also depends on the mobility of the
elements concerned, the nature and intensity of weathering,
topography and other environmental factors. The soil-plant
relationship is also complicated by other factors in addition
to the total metal content of the soil, in particular the form
of the metal in the soil, interrelationships with other elements,
soil reaction and drainage, the effects of fertilizers, etc.
The assimilation of trace elements by animals is,
of course, influenced by the composition of the herbage they
consume, the relative proportions of the elements in the herbage
being determined by the soil types on which it is grown. The
composition of supplementary feeds, particularly if they are
not of local origin, and drinking water and various physiolo-
gical factors will also affect the proportions of trace

6
elements consumed.
In humans, because of the greater complexity and
variety of diet, in addition to the fact that many populations
move from one geological environment to another, the associa-
tion of health and geology is more tenuous. However, instances
of close relations between human health and trace element
distributions are well known, for example the association of
goitre and widespread I deficiency, F and dental health and
Mo and dental caries in New Zealand.
Many cases of trace element problems in agriculture
have been well-documented. Notable examples of trace element
deficiencies which have been recorded in many parts of the
world are Mn and Mo deficiencies in crops and Cu and Co defici-
ences which affect grazing stock. Cases of toxicity due to
excess concentrations of Cu, Mo and Se in the diet are common.
Trace element problems in plants and animals and the
geochemical distribution of trace elements pointed to an obvious
linkage between the two, in which the areal distribution of
nutrition problems could be associated with the geology and
geochemistry of an area. This led to the recognition of
"biogeochemical provinces" in which work of the Russian
geochemists, Vinogradov (1952,. 1957, 1963), Malyuga (1963) and
Kovalskii (1958, 1960) is particularly noteworthy. Other major
contributions to the biogeochemical field have been made by
Cannon (1960), Warren (1960, 1963, 1965), Griffith (1960),
Hewat and Eastcott (1955) and Pieve (1958).

7
In view of the increasing usage of regional geochemical
stream sediment mapping for
Webb in 1963 suggested that
applied to the detection of
geological and prospecting purposes,
similar techniques could be usefully
biogeochemical provinces or more
localised areas in which deficiencies or excesses of trace
elements were of agricultural significance or involved in pro-
blems of human health. Subsequently, experimental stream
sediment surveys were initiated with the following results
(Webb, 1964):
(a) In Ireland low levels of Co in stream sediments
outlined an area in Counties Wicklow and Carlow in which "pining"
in sheep, due to Co deficient soils, had been previously reported
by the Irish Agricultural Institute.
(b) In England, a preliminary drainage reconnaissance
survey of about 350 squake miles in Devon indicated a hitherto
unsuspected zone of anomalous Mo values in sediment draining an
area of Culm Measures. Local farmers had reported difficulties
in rearing lambs and "scouring" in calves from the area of high
Mo values. The symptoms pointed to a possible occurrence of Mo-
induced Cu deficiency.
(c) In Co. Limerick (Fig. 1 and 2), in an area from
which toxic seleniferous soils accompanied by high Mo values had
been reported by the Irish Agricultural Institute, analysis of
stream sediment samples collected by a mining company during
the course of a prospecting survey (see Acknowledgements)
revealed an extensive area in which anomalous concentrations
of Mo occurred. This area was centred on the toxic Se

8
occurrences and the anomalous Mo patterns showed a certain
degree of correlation with the geology of the area. Cu, a metal
which interacts with Mo in metabolism, accompanied the Mo in a
-roughly-similar but less-proncluw.ed pattern.
It was decided.that_this latter-area_would be suit-
able.for.the present.resparch-which-involves-study of the_bio-
geonhemical features of-Mo_andSe and the application _o-f... _
regional geochemical.surveys to agricultural problems.--Before
proceeding to the-detailscifthe study it- is necesqnry-to give
a brief review of the previous work on Se and Mo in relation
to animal health.
2. PREVIOUS WORK
(i) Selenium in Relation to Nutrition
An extensive literature concerning toxic seleniferous
vegetation associated with Se-bearing rocks and soils has
accumulated mainly since 1930. Most of these reports are
concerned with occurrences in the western United States but
examples have also been recorded from Mexico, Canada, Columbia,
Israel, South Africa, Australia, U.S.S.R. and Ireland.
Comprehensive summaries of these are given by Lakin (in
Anderson et al, 1961) and Rosenfeld and Beath (1964).
Briefly, Se was known to be toxic to animals as early
as 1842 (Moxon, 1937) but prior to 1930 the presence of toxic
quantities of any particular element in certain plants that
grew on soils containing excessive amounts of that element was

9
not accepted as an important factor in animal poisoning.
However, some thirty years ago work by officers of the U.S.
Dept. of Agriculture, particularly at the S. Dakota and
Wyoming Agricultural Experimental Stations, proved that the
symptoms of "alkali disease" and "blind staggers" were due to
high concentrations of Se in certain plants growing in grazing
areas (Byers, 1935; Munsell, 1936).
Further work proved that these plants only grew on
soils containing greater than normal amounts of Se and that
these soils were derived from seleniferous bedrock. Some plants,
often characteristic species and in particular some varieties
of Astragalus sp., accumulated quantities of Se much greater
than other species growing on the same soils. From this the
concepts of "indicator" and "accumulator" plants were formulated.
It was found that a general relationship existed between the
total concentration of Se in the soil and the concentration in
any given species growing on it. However, the form of Se in
the soil varied from relatively insoluble selenite to more soluble,
available selenate, and that only some forms of plant life, the
"accumulatole, were capable of absorbing the less available
forms of the element in toxic quantities, but when these
accumulator plants died and decomposed the element was released
again into the soil in more generally available forms. Such
plants are regarded as "converters" of Se.

10
In general, "indicator", "accumulator" and "converter"
plants are often one and the same species, but it was found
and this is the case in Ireland (Walsh and Fleming, 1952) -
that recognisable "indicator" or "accumulator" species may
not always be present and that toxic concentrations may exist
in the general pasture herbage, including grasses.
In the western U.S. the biogeochemical correlation
.of toxic vegetation with seleniferous soils, known seleniferous
rock horizons and the recognition of "indicator" plant species,
has led to the mapping of seleniferous areas by plant surveys.
Similar methods have also been used for the detection of other
metals associated with Se (Cannon, 1957). The technique is,
of course, dependent on the presence and recognition of suitable
indicator plants. Furthermore, in addition to natural factors
controlling the distribution of individual plants, interpreta-
tion of the results can be particularly difficult in semi-
cultivated areas or where new pasture species have been intro-
duced.
In Ireland, Fleming and Walsh (1957) recorded the
biogeochemical correlation of seleniferous herbage and soils with
Se-bearing shales.
(ii) Molybdenum in Relation to Nutrition
It is now well established (Underwood, 1962) that Mo
is an essential element for plant growth due to its involvement
in the nitrogen cycle and is particularly important for the

11
growth of legumes e.g. clover, where it concentrates in the
nitrogen-fixing nodules (Vinogradova, 1943). As a consequence
of this discovery, many Mo-deficient soils have been located
in various parts of the world and the addition of Mo salts to
the soil have resulted in great improvements to the pasture.
The discovery that Mo is also an essential element in animal
nutrition in its capacity as an ingredient of several enzymes
has naturally augmented interest in Mo deficiency in soils and
herbage.
The toxic effects of excessive amounts of Mo are
more closely related to the subject of the thesis. It has
been established that when present in even moderate excess
in herbage it can cause serious nutritional disorders in live-
stock, especially cattle and to a less extend some other species.
The interaction between Cu and Mo in the animal so that excessive
intake of Mo manifests itself as an Mo-induced Cu deficiency,
has been demonstrated, particularly in Australia and New
Zealand. Inorganic sulphate also plays a part in the relation-
ship by suppressing the effect of Mo on the action of Cu in the
animal. Examples of the biogeochemical relationship between
animal health problems and excessive intake of Mo from herbage
growing on molybdeniferous soils have been reported by Britton
and Goss (1946) and Barshad (1948) in California, Kubota et al
(1961) in Nevada, Cunningham (1950) in New Ze-aland and Marston
(1951) in Australia.

12
One of the earliest and the classic case of this
relationship is the work carried out on the "teart" pastures
of Somerset, England (Ferguson et al, 1943; Muir, 1941; Le
Riche, 1958). It was shown that the disease known as "teartness"
in cattle was due to excessive amounts of Mo in the herbage
growing on molybdeniferous soils. These soils were related
to Mo-bearing shales of the Lower Lias. "Teartness" was not
related to soil type and non-toxic soils only carried normal
amounts of Mo.
Work in Ireland on cases of toxic concentrations of
Se and Mo in herbage has been carried out by workers of the
Irish Agricultural Institute and Dept. of Agriculture. Seleni-
ferous soils and herbage often associated with abnormal con-
centrations of Mo have been recorded in a number of localities
(Walsh et al, 1951; Walsh and Fleming, 1952; Fleming, 1962).
A number of investigations concerned solely with the occurrence
of Mo in soils and herbage have also been undertaken (Walsh et
al, 1952, 1953).
PRESENTATION OF THESIS
The results of the present study follow in four
main sections. Part A is purely descriptive and gives details
of the study area and the techniques employed. In Part B the
regional geochemical patterns are presented empirically with
notes concerning their use in locating abnormal concentrations

13
of metal in herbage. Part C describes the detailed geochemical
investigations of the factors involved in the distribution of
metal in the bedrock, soil, stream sediments, water and herbage.
Finally, the application of geochemical stream sediment recon-
naissance to problems of agriculture and geology are described
in Part D with suggestions for further work.
4. ACKNOWLEDGEMENTS
This work forms part of the continuing programme
in applied biogeochemistry of the Applied Geochemistry Research
Group at Imperial College under the direction of Professor J.S.
Webb. The writer wishes to express his gratitude for help to
all the staff of the group but in particular to his supervisor,
Professor Webb, who initiated the study and helped throughout
with advice and criticism. Also to Mr R.E. Stanton and Dr I.
Nichol for much help and advice in the analytical field and to
Mr I. Thornton for discussion of agricultural problems.
In Ireland the assistance of the Irish Agricultural
Institute was invaluable both at the initiation of the study
and during the course of the investigation. The writer would
like to thank in particular, Dr, T. Walsh, the Director, Mr
G. Fleming of the Dept. of Plant Physiology, Dr Pierce Ryan
and Mr T. Finch of the Soil Survey and Mr D.B.R. Poole of the
Veterinary Research Laboratory. The co-operation of the Irish
Geological Survey is acknowledged and the writer wishes to
thank the Director Mr M, Cunningham and Mr M. O'Meara, also

14
the past Director, Mr M. O'Brien, for helpful discussions.
Thanks are also due to Messrs. Halet, Broadhurst and Ogden
who, on behalf of their clients Messrs. Zenmac Mines and
Tusko Syndicate Limited made available the stream sediment
samples used in the early part of the survey.
The biogeochemical work of the Department is
aided by a Special Research Grant originally awarded by the
Department of Scientific and Industrial Research and now
received from the Natural Environment Research Couhcil. The
writer also wishes to express his gratitude to Rio Tinto-Zinc
Corporation for the financial assistance of a research bursary.

15
PART A
CHAPTER II. DESCRIPTION OF AREA
1. LOCATION
The area selected for regional study comprises about
275 sq. miles situated in Co. Limerick, Ireland, south of the
River Shannon and extending westwards a few miles into Co. Kerry
(Fig. 1): The principal towns, major access roads and localities
mentioned in the text are given in Fig. 2; which also shows the
area of 3 sq. miles chosen for detailed study of metal distri-
bution and dispersion. This area is centred on Flynn's Farm
near the village of Ardagh, where toxic occurrences of Se are
known to occur.
2. GEOLOGY
Detailed descriptions of the geology of Ireland can be
found in the works of Charlesworth (1963), Meehan and Webb (1957),
Nevill (1963) and others. The 3rd Edition of the Geological Map
of Ireland at scale 1:750,000 was published by the Geological
Survey of Ireland in 1962.
The bedrock (pre-Quaternary) geology of the regional
study area is first described, followed by a review of the geo-
chemically important glacial period and recent deposits.

• Buttevant Ballagh
Orchardstown•
Wexford
Belfast
• Enniskillen
••••• ••••%
:•••••••
Mace Hea Galway
• Lisdoonvarna
Batlivor • Naulio
Dublin
*Carlow
Leighlinbridge •
Ballybunnio
Limerick
Cork
0 40 80
miles
FIG.1. LOCATION OF AREA, PRINCIPAL CITIES AND
LOCALITIES NOTED IN TEXT

t4.
FOYNES IS.
ti° gib S
Cliff vxt, et n
°FOYNE
•07%. LOGHILL
SHANAGOLOEN
• ••• •..
• ASIKEATON
CREEVES 3.
DENLEI?
/11).,./ /4 . MAJOR ROADS
• PRINCIPAL TOWNS AND VILLAGES
LIN
RALLYHANILL
/
I.C.OAMAIt
FLYNN'S FARMAD "Mouth Ck.
•
♦
• ..„ RATHKEALNIP..i"
▪ ••• am 40. ▪ 111
GCS.
CAR IGNERRY
•• •
— .0 e •• ........ •riR DAG H
t / I / 1 • .0 /
* i e• / I e• ".... ...• / ...• ...• ...•
‘ •KNOCKADERRY / NEWCASTLE
..---"........ WEST • ../
,
• •
..../ I
.0 • I
STRAN
I 40 • I
ATHEA • • •
I
I I
/ I I
... • . o • / . • " •
....„e ... i ..., O• 4., 40 ..
..• % I
•. / •
KILMEEDV•3
ABBEYFEALE.-
L
0. % lehannegh
• •• • • I
Rellagh\ Sec
..
•
im on ea an re OM On AMA Am MO OM r a OD Am ma /AO
0 2 4 6
miles
FIG. 2. MAJOR ROADS, PRINCIPAL TOWNS AND LOCALITIES •
MENTIONED IN THE REGIONAL STUDY AREA.

16
(a) Pre-Quaternary Geology
As shown in Fig. 3, Old Red Sandstone (O.R.S.) non-
marine sediments occur in the south-east and occupy about 3 per
cent of the area. The O.R.S. apparently rests unconformably on
older Pre-Caledonian structures not exposed in the area. Forming
prominant hills above the surrounding plain, these rocks have the
characteristic purple-red colour of the series and are mainly
represented by fine sandstones, siltstones and shales. Some
greyish-green shales and yellowish sandstones typical of the
uppermost O.R.S. oocur. Charlesworth (1963) describes these
sediments as being accumulated in depressions between mountain
tracts, under freshwater and terrestrial, semi-arid conditions.
The finer, upper O.R.S. sediments present in the area probably
represent lacustrine or lagoonal deposits.
In the Co. Limerick area, the O.R.S. is succeeded
conformably by Carboniferous rocks of the Lower Limestone Shale
series. These shales are about 150 ft in thickness (Charlesworth,
1963) but if present in the study area are concealed by drift.
The area of sub-outcrop is probably small and as fragments are
not readily located in the overlying drift, are of minor geo-
chemical significance.
Carboniferous limestones occupy about 48 per cent
of the area, underlying the mainly drift-covered low-lying
plain in the eastern half of the area. The limestones, including
the basal shale series, are conformable with the O.R.S. and

Glacial striae Carboniferous limestone
Namurian sandstones and siltstones
Clare Shales tiqe:41gli Old Red- Sandstone
ele Limit of glacial drift
* Detailed surve area Figs i8—
=---Th'i*IIIS/110101MOINNIUMMIONW4OWAK. ,===wmwmammulawsmouwwww-mumAmmommmumumumwonnur ==;.inswwwmmatommomocwwww
MMOOMIMIMMIVOMMMONIS,111SMID % --MMOMOWNWWWWWWWOMSNMWMMi% - 41oraNNXIIhi.4141111
Emumiummownwsw mrimmnmwmommmommunril:im
ifiglierral# I t I
1rt [1
111
I1-1
31
--j111 1111111 1.111 .11111 Mil anlinliNi MO in. OM air MO IIMP " lie MI MON gial WI OW OW MOM Mal r". MO
111111111111111=1801 .1111111111111111111111111111111 • NM TWA 111116 willn Er Iv:* memsams 1111111111111111111111111111111— 111111111111111.11111111.11111111WF Eimanas imiu .iararr.maraai
FIG. 3. SIMPLIFIED GEOLOGY OF THE AREA COVERED BY THE REGIONAL GEOCHEMICAL SURVEY. (After Hodson and Le Warne (1961) ' and Irish Geological Survey)

17
probably represent a full sequence of Tournaisean and Visean
stages. Bedded limestones predominate but, in addition to the
shales, oolites and extensively developed and reef limestones
are also present. Some dolomite may also occur but little is
known of its age or origin.
Of possible geochemical significance is the extensive
area of Visean volcanics which mainly outcrop south and south-
east of Limerick city (Gill, in Meenan and Webb, 1957). These
appear to have erupted from a number of small vents and consist
principally of basic and intermediate lavas with some tuff and
agglomerate pyroclastio members. Within the study area, these
volcanics are represented by dark grey to brown coarse tuffs
and agglomerates frequently cemented by a calcareous matrix.
They probably form lenticular deposits interbedded with the
Upper Limestone formations near the village of Kilcolman.
Vent sites or plugs are not recognisable. These rocks occupy
somewhat less than 1 per cent of the study area.
At the close of the Visean a marked change in sedi-
mentation took place. The junction of the Carboniferous
limestones with the overlying Namurian detrital sediments is
non-sequential and marked by an unconformity of mid-Carboniferous,
Sudetian age. The basal rocks of the Namurian in the area,
consist of a sequence of marine black shales which, it will
be shown, are the pre-eminent factor determining the Mo and
Se geochemical patterns in the area. For this reason the
environment to which their deposition is attributed is described
in some detail.

18
Charlesworth (1963) and Hodson and Le Warne (1961)
describe the Namurian as being deposited in a downwarp in the
limestone which extended in a Caledonoid direction from the
Shannon Estuary (the Clare-Limerick basin) near the study area,
across Ireland to the north of Dublin. The extension of this
trough is represented by rocks of similar age in England. The
work of Hodson and Le Warne in Co. Clare and Co. Limerick showed
that the initiation of the trough was Mid-Carboniferous and sub-
sequent to a sedimentary hiatus, but probably followed a pattern
of subsiding tracts in the Lower Carboniferous described by
Lees (1961).
In the study area, the trough had a channel-like
central depressior, closely corresponding to the present
position of the River Shannon, in which the Clare Shales
reached a maximum thickness, flanked to the north (Co. Clare
line of outcrop) and south (Co. Limerick) by sloping shelves.
The form of the basin is the result of differential subsidence
during sedimentation. The line of outcrop of Clare Shales in
the study area (Fig. 3) represents the southern shelf of the
basin. Hodson and Le Warne have shown by mapping stratigraphic
sections and goniatite zones that thinning of the sequence and
overlap of younger horizons takes place southward from near
the centre of the basin at Foynes to Ballagh near the margin.
The basal zone of the Clare Shales, El (Eumorphoceras zone) is
only present in the channel-like centre of the basin, i.e. north
of Foynes on the other side of the Shannon, where the shales

19
are about 1600 ft thick. At Foynes the thickness mapped by
Hodson and Le Warne is about 600 ft, less than half that at
the exact centre of the basin to the north. This represents
the E2
zone, through the H (Homoceras) to the uppermost R1
(Reticuloceras) zones. Moving southwards the shales become
successively thinner until at Ballagh in the south of the study
area, there is not more than 100 ft consisting mainly of the R1
and H zones, the E2 zone being either very thin or absent.
Lithologically the Clare Shales are characteristically
well-bedded black shales, often pyritic and rich in carbonaceous
material. Bullions and nodules, often calcareous or pyritic, are
common at some horizons, particularly on Foynes Island. Siliceous
shales, spongolites (Le Warne, 1963), occur in some areas, inter-
digitating with black shales of equivalent age. These rocks are
made up almost completely of siliceous sponge spicules. In some
areas grey, only slightly carbonaceous shales are present, often
near the top of the sequence.
The "Ribbed Beds" consisting of sandy shales are
present at the top of the Foynes Island section and are included
by Hodson and Le Warne (1961) in the Clare Shales. The fauna is
marine, mainly pelagic forms of goniatites and lamellibranchs.
It is believed that the depositional environment was typical for
black shales, in that circulation in the lower levels of the basin
was limited, resulting in reducing anaerobic conditions.

20
The top of the Clare Shales is marked by an abrupt
change in rock type and sedimentary environment. The black
shales are followed by Namurian non-marine, buff and grey silt-
stones and mudstones with abundant interbedded sandstones. Some
sedimentary coal measures are present. The actual proportion
of sandstone, which constitutes a different geochemical environ-
ment to the argillaceous rocks is not known, but despite the
effects of differential weathering, probably approaches the
ratio established by random sampling, i.e. about 30 per cent
sandstone. Leaf remains are common in the non-marine sediments.
These rocks occupy about 44 per cent of the total study area.
Hodson and Le Warne (1961) consider that the change
from black shales to non-marine, more arenaceous sediments
took place at the same stratigraphic horizon along the length
of outcrop in the area. They use this as a horizontal marker
horizon in the measurement of sections. At some places the
junction is marked by massive sandstones up to 5 ft. thick.
At others it consists of thinner sandstones interbedded with
grey silstones.
The following table summarizes the areal extent of
the major bedrock units that go to make up the primary geo-
chemical environment of the area.

21
Table 1: Major Rock Formations in the Area
Rock Unit Approx. percentage of area covered Environment
Sandstones 13 Namurian
Tuffs
Limestones
Lower Limestone Shales
Old Red Sandstones
44 Non-marine detrital sediments. Some coal measures.
Marine black shale. Organic-rich, reducing.
0.5
Pyroclastic.
48
Chemical-organic, Marine.
Calcareous, detrital.
3 Non-marine, detrital sediments.
Argillites 31
Clare Shales 4
cb) Quaternary Geology
Glacial activity was extremely widespread in Ireland
during the Pleistocene, and extensive deposits of glacial and
fluvio-glacial origin occur in the area. The general Quaternary
succession in Ireland is summarized in the following table which
is based mainly on Mitchell (1957) and Synge and Stephens (1960).
Other workers, in particular Charlesworth (1963) and Nevill (1963),
also record details of this period.
The study area has been affected by both the Saale
and Weichsel glaciations but by far the most extensive deposits
remaining after erosion are of Weichsel origin. Fig. 4 illus-
trates the extent and principal ice-flow directions of the two
major glaciations in Ireland. In the regional study area, the
ground north and east of the terminal moraine was covered by

EASTERN GENERAL (Saale)
Direction of Ice Movement - Saale and Weichsel Glaciations. (After Synge and Stephens 1960)
• Unglaciated areas.
Tipperary Moraine.
Older drift.
Extent of Weichsel Glaciation in Ireland. (After Mitthell1957)
(Synge and Stephens1960) FIG.No.4.

Remarks European Stages Irish Equivalents
Recent Hillwash, swamp deposits and alluvium
Pleistocene.
Weichsel Glaciation
Interglacial Period
Saale Glaciation
Midland General = Last Glaciation
Ardcavan Interglacial Period
Eastern General = Munster General
Main deposits terminated to south by Tipperary Moraine. S.W. Glaciation in West Cork - S.E. Kerry (Refer Fig. 4)
Covered entire country except for a few small areas in south.
Great Interglacial Period
Elster Glaciation
Gort, Co. Galway and Kilbeg, Co. Waterford. Interglacial deposits.
Only limited remnants of drift remain.
Kildromin, Co, Wexford and Kildicomin, Co. Limerick
Table 2: Main Glacial Events of the Quaternary Period in Ireland

23
the Weichsel glaciation. The general composition and type of
the drift is shown in Fig. 5.
Saale deposits, which have been subsequently
destroyed or obscured by the last glaciation over most of the
area, occur as limited remnants in the S.W. as small pockets
in valleys protected from erosion.. The general direction of
ice movement as indicated by striations was east to west, i.e.
from the limestone across the Namurian rocks.
The Weichsel deposits are dominantly boulder clays,
with some minor fluvio-glacial occurrences. Deposits of clayey
gravels are common along the base of the Namurian escarpment that .
terminated the ice sheet in the south of the area, and are possibly
associated with damming by the ice on retreat. The effects of
topography on the extent of the ice sheet are not so pronounced
in the north where the ice transgressed over the basal Namurian,
eroding the escarpment which was probably not so abrupt as in the
south. It penetrated as far south as the village of Carrigkerry
where the terminal moraine, an extension of the Tipperary moraine
shown in Fig. 4, is a prominant feature of the landsoape.
Because of the relatively simple pattern of the
Weichsel ice-sheet in the area, the drift material is generally
readily correlated with the sources of bedrock supply, as noted
by Synge in Finch and Ryan (1966). He states - "the glacial drifts bear a close relationship in composition to the rocks over which they lie. Nevertheless, where ice cross a major geological boundary, there is a 'carry-over' of material from one formation to the other, which becomes progressively more dilute, with distance from the boundary". Over the eastern
half of the area, with the exception of the south-east corner
where O.R.S. fragments are common, aimestone is the dominant

BOULDER CLAY, PREDOM. L IMES TONE
F771
MORAINIC DRIFT DRUMLINS
ALLUVIUM
.PEAT
BOULDER CLAY. PREDOM. NAMURIAN.
BEDROCK MAINLY WITH THIN ROC* WASTE OR DRIFT COVER.
GLACIAL STRIAE .
[-71 \\\N
socT DRIFT PROFILE SITES.
FLuVIO-GLACIAL SAND AND GRAVEL
0 I 2 as 5 1
GLACIAL DRIFT AND OVERBURDEN MAP OF AREA. ( After F.M.Synge.-Irish Geological Survey) FIG. No 5.

24
constituent of the drift. Because of the more or less uniform
south-west direction of movement, Clare Shale and Namurian
detritus is confined to the area west of the escsvpment, the
porportion of Namurian rocks to transported limestone increasing
westwards. Abundant Clare Shale fragments are limited to a
zone "down-ice" from the escarpment, aligned parallel to the
striae direction and terminated by the Carrigkerry moraine.
Ground moraine composed of rock material re-
deposited close to its point of origin is apparently common, as
deduced from the presence of Clare Shale and Namurian drift close
to the nearest available bedrock source of supply. Also much of
the limestone boulder clay may similarly be of local origin.
However, the vast amount of limestone material deposited on the
Namurian areas and the presence of abundant Clare Shale fragments
up to five miles from the nearest outcrop, indicates that much
of the drift has been transported over considerable distances.
In the N.W. section of the area the drift is predominantly
Namurian sandstones and siltstones but also probably includes
muds dredged from the Shannon estuary and geologically similar
Namurian rock material from Co. Clare, north of the river. Erratics,
of rocks not recognised as types of local origin are extremely rare,
but a few granite specimens, possibly of Galway origin and asso-
ciated with the Saale glaciations, have been recorded.
Except for the gravel deposits of fluvio-glacial origin,
which consist of water-sorted sand and gravel beds, the drift is
mainly boulder clay, consisting of partially rounded fragments

25
from sand to boulder size in an abundant matrix of very fine
rock flour. The matrix, where limestone is the dominant
constituent is blue-grey in colour when fresh, weathering to
buff and light brown. Boulder clay of dominantly Clare Shale
origin is dark grey to almost black and the fragments are much
more angular than the limestone. Being less resistant to
mechanical erosion than the limestone the more carbonaceous,
softer shales rapidly break down to form rock-flour, the sili-
ceous types along with the limestone tending to form the bulk
of the coarse material.
In drift of Namurian origin the resistant sand-
stones form the bulk of the coarse material, a greater proportion
of the softer argillaceous rocks presumably tending to grind
away to rock flour.
After the close of the glacial period, the dis-
tribution of more recent deposits was in part controlled by
the post-glacial topography. Erosion of the unconsolidated
drift material resulted in the formation of swamp and lacu-
strine deposits in post-glacial depressions and in alluvium
flanking some of the larger streams, the courses of which were
determined by both glacial and pre-glacial topography.
Extensive peat deposits have formed on both
residual and glacial material, the principal areas occupying
the higher land to the west of the escarpment. Swamp peats
also occupy post-glacial poorly-drained depressions where
they often overly the older lacustrine sediments.

26
3. CLIMATE
Co. Limerick has a relatively mild maritime climate
with moist winters and cool, cloudy summers. The average humidity
is high and the prevailing winds vary from westerly to south-
westerly. Within the regional study area the annual rainfall
varies slightly with relief, the highest fall being recorded in
the western, higher regions.
The following general data on the climatic conditions
of the area (Table 3) are taken from the Irish Soil Survey Bulletin
on Co. Limerick (Finch and Ryan, 1966). Not all the sites where
records have been kept are within the study area but can be taken
to refer to Co. Limerick as a whole.
Table 3: Climatic Features of the Area
Rainfall
Average Monthly and Annual Rainfall 1950-1960, Inches
.Abbeyfeale. (Western part of area)
Highest - Dec. 6.22, Lowest - Apr. 2.41.
Mean Yearly Total - 46.66.
Rathkeale. (Eastern part of area)
Highest - Dec. 5.10, Lowest- Apr. 1.96.
Mean Yearly Total - 37.45
Temperature
Recorded at Pallaskenry, 5 miles east of the study area.
Mean Monthly Temperatures -
Highest - July. 58.9°F, Lowest - Jan. 40.1°F.

27
Table 3 (continued)
Humidity
Recorded at Shannon Airport, about 20 miles east of the study area.
Range 69 to 92 per cent.
Sunshine
Shannon Airport - Average hours per day.
Highest - June 5.95, Lowest - Dec. 1.52.
Frost
Shannon Airport - Average number of days ground frost recorded -
Highest - Feb. 11.7, Lowest - July & Aug. 0.0.
4. GEOMORPHOLOGY
The topography of the area (Fig. 6), which varies
in height from sea level along the River Shannon to 1132 ft. at
Knockanimpaha, is to a large extent controlled by the bedrock
geology.
The "lowland" eastern half of the area consists of flat
to slightly hilly country on the limestone which is mostly masked
by glacial drift. In the S.E. the Old Red Sandstone is marked
by hills that rise above the plain. The drainage is by relatively
slow-moving streams draining north into the River Shannon.
The western "hilly" to mountainous region is separated
from the lowlands by a well-defined escarpment, where the
resistant Namurian sandstones and Clare Shales overly the

Height in Fee t
800 A Spot heights
1:7400
71 200 L
Sea Level
600
0 2 4 6
miles
FIG.6. TOPOGRAPHY,REGIONAL STUDY AREA

28
limestone. The escarpment divides the regional study area on
a north-south line from Foynes on the River Shannon south to
Ballagh. It is highest and most abrupt in the south where it
formed the terminal line of the Weichsel glaciation. In the
north it is less well defined and was transgressed by the ice-
sheet, which probably further contributed to its erosion.
Streams are generally fast flowing. North of the Carrigkerry
moraine in the western half of the area, drainage is northward
into the Shannon. To the south the main streams flow west
into Co. Kerry.
5. SOILS
The soils of the region have been described in
detail by Finch and Ryan (1966) and are classified into the
Great Soil Groups and sub-divided into series. The distri-
7 bution of the more extensive series are shown in Fig. "which
has been adapted from the work of Finch and Ryan.
In the western half of the area the dominant soil
types are gleys; roughly divided between the Kilrush series
in the north and the Abbeyfeale Series in the south. Extensive
tracts of blanket peat also occur over much of this area. The
gley soils are characteristically poorly drained and have
developed under conditions of permanent or intermittent water-
logging. The horizons are usually grey or bluish-grey with
distinctive mottling due to iron staining. In mem cases
organic matter accumulates at the surface in which case the

5 0 1 2 3
MILES
GENERALIZED SOIL MAP OF AREA. ( Adapted from Finch and Ryan-Irish Soil Survey)
ii5BP BROWN EARTH • Ballincurra Series. Miseettaneous soils of limited areal extent.
[0:1•4 in
FR BROWN P00201.1C-Meunteollins Sir. A A Ashvove Complex
GREY-BROWN 1100ZOLIC-Etton Ser.
U11 u A00,10614 Series.
ral Rineanna
V pi Blanket Peat
• • • • .1 • • •
ccm,g, Hostordstown
Kilrush
Shannon
Dreinbanny
FIG.No.7.

29
soils are referred to as humic-gleys. Many of the soils of
the area fall into this class. Both the Kilrush and Abbeyfeale
soils are moderately acid to acid in reaction, pH values within
the profile varying from 5.0 to 5.3 in the non-peaty phase of
the Abbeyfeale series and from 4.4 to 5.8 in the peaty phase.
The pH of the Kilrush series varies from 5.9 to 6.3.. These
data refer to profiles described by the Irish Soil Survey.
The soils of the eastern half of the area are
slightly more complex with extensive development of gleys,
brown-earths and grey-brown podzolic soils on the dominantly
limestone-drift parent material. Gley soils of the Howard-
stown Series occupy much of the southern part extending into the
detailed study area near Ardagh. They are poorly drained soils,
commonly with up to 10 per cent organic matter in the surface
horizon and reaction varies from slightly acid to alkaline.
A profile by the Irish Soil Survey shows an acid toposoil
horizon of pH 5.8 increasing to 8.3 in the lower part of the
lime-rich B horizon.
The other major soils of the eastern part of the
area are the Elton Series, a grey-brown podzolic and the
Ballincurra Series, a brown earth. The latter is a relatively
mature, well-drained mineral soil with a rather uniform profile.
The Ballincurra Series is of high-base status due to its
development from limestone parent material and neutral to
alkaline in reaction (pH 7.7 to 8.0 in a profile by the Irish
Soil Survey). Up to about 5 per cent organic carbon is

30
developed in the topsoil horizon. The grey-brown podzolics
of the Elton Series are developed from limestone drift generally
similar to that of the Ballincurra and Howardstown Series. They
are moderately well-drained and of high base status. Much of
the better drained soils on limestone drift of the detailed
study area belong to this series. There is accumulation of
organic carbont up to several per cent, in the topsoil horizon.
This horizon is slightly acid with a pH of 5.5 which increases
downward to 7.3 in the lower part of the B horizon in the
profile described by the Irish Soil Survey.
Of limited extent, but important from the point of
view of Mo and Se distributionl is the Drombanny Series, described
by the Soil Survey as being of lake alluvial origin and
classified as a humic-gley. This soil type is typical of the
toxic seleniferous soils in the vicinity of Flynn's Farm.
Characteristically it is very poorly drained with an organic-
rich, often peaty, topsoil horizon underlain by a distinctive
marl layer. They are generally neutral to alkaline in reaction
and of very high base status.
6. AGRICULTURE
The agricultural pattern of the area, reflects the
general suitability of the main soil classes.
The gley soils of the Abbeyfeale and Kilrush Series
on the hilly land to the west are poorly drained and of low
nutrient status. They are unsuitable for tillage crops and

31
support small holdings of partly fenced, poor to moderate
grassland. Drainage and liming is required to maintain the
optimum yield. The industry is mostly dairying with cross-
bred cattle.
The limestone soils are more suited to agriculture
and the holdings range in size from about 20 to 40 acres at
the base of the scarp to as much as 200 acres on the more
prosperous undulating land to the east. Dairying is the major
industry, since the soils of the Ballincurra, Elton and
Howardstown Series support good grassland. The Elton Series
have a wide use range and may also carry some cultivated crops.
There is some production of beef cattle and some herds from
the hilly land to the west are fattened on the lowlands. Stud
farms for bloodstock horses are not uncommon and are mainly
situated on the better drained soils of the Elton and Ballincurra
Series.

32
CHAPTER III. SAMPLING AND ANALYTICAL TECHNIQUES
Over 4300 samples were collected during the course
of the survey, of which about 75 per cent were analysed for
up to 17 elements. In addition, about 2700 samples had pre-
viously been analysed during Professor Webb's preliminary
studies in Eire preceeding the selection of the writer's
study area. To date these investigations have yielded in all
approximately 51,000 individual items of analytical data.
The techniques employed for collection, preparation
and analysis of samples are generally similar to those which
had been developed for research in mineral exploration. These
methods can be readily adapted to regional geochemical and
biogeochemical surveys, with minor modifications as described
below.
1. FIELD SAMPLING
Except for waters, samples were collected in water-
resistant kraft paper envelopes with non-contaminating metal
tabs. These are supplied in two standard sizes of 3 x 5 ins
and 11 x 5 ins.
In the case of damp samples, particularly sediments,
initial air-drying to a state adequate for safe transport was
carried out in the field and final drying by electric or
kerosene ovens in the laboratory. Because of the volatile
nature of Se, the oven temperature was limited to not more

33
than 60o (up to 100oC should be safe, with the possible exception
of vegetation samples).
(a) Rocks
Regional rock samples consisted of grab samples
(500-1000 g) taken at random from available outcrops, road
exposures etc. Where the lithology varied in a particular
exposure, an attempt was made to collect representative composite
samples. Weathered material was avoided. Cross sections of the
Clare Shales were chip sampled, the sample length being based
on visible lithological characteristics and corrected for dip
and strike so that throughout the thesis true stratigraphic
widths are quoted. It was considered that chip samples, although
not as accurate as channels, were adequate for the purpose of
this study.
(b) Stream Sediments
Wherever possible, samples were collected from the
active sediment near the centre of the channel, avoiding any
collapsed bank material. To give sufficient fine material for
analysis, fine sands and silts were preferred to coarse material.
Organic or iron-rich samples were avoided except where they
constituted the main sediment type for that locality. The small
sample bags carry about 75 to 100 g of sediment, this normally
produces sufficient minus 80-mesh fraction. for analysis. The
advantage of the kraft paper envelope is that samples can be
dried in the original collection packets.

34
For routine regional surveys the following record
system is recommended:-
1. Sample locations are plotted in the field
directly onto ordnance survey sheets at scales of 1 or 2 miles
to the inch depending on the sampling density. Ordnance survey
sheets also provide a convenient grid reference if automatic
data plotting is to be used (see Nichol et al, 1966). Sample
location points are subsequently transferred to a base map
showing drainage and orientation points only; the sample numbers
are entered on a separate overlay. Both plots are made on trans-
parent paper which allows convenient reproduction of drainage maps
on which metal values can be plotted directly without confusion
from the sample numbers.
2. Records made in duplicate at each sample site
give:- sample no., size of stream, type of sediment (e.g. sand,
silt, organic-rich, calcareous, etc.), the colluvial or alluvial
nature of the bank material, notes on the local agriculture and
any special features such as contamination from mine workings,
etc. The pH of the stream waters are taken using B.D.H. liquid
Universal Indicator.
(c) Soils
Regional soil samples were collected at j- and 1
mile intervals and the detailed grid in the Flynn's Farm area
was sampled on 88o ft. squares. Soil samples (including drift)
were collected using a 1-inch screw auger 3 ft. long graduated

35
at 6 inch intervals. For routine work, 50-100 g samples were
collected at two depths, a "grass-roots" horizon 0-4 inches
and at 18-24 inches in less weathered primary material.
Soil profiles were sampled using a 3-inch 'buoket
auger, 7 ft. in length. Sample intervals down-profile were
based on soil horizon changes; in undifferentiated drift
the sample interval was 1 ft. The bucket auger was capable
of penetrating most soils except where large boulders were
present in drift. Some trouble with recovery was experienced
in soft clays or gravel below the water table.
Bank soils were sampled from vertical channels
after removal of surface vegetation or by horizontal bucket
auger holes. Profile and bank soil samples were generally
500-1000 g in weight.
(d) Herbage
For routine survey purposes grab samples of herbage
weighing about 20-50 g were collected at random around each soil
sample site, approximating to the general forage consumed by
grazing animals. Samples were cut above ground level, avoiding
contamination by root material and soil particles. For the -
investigation of metal uptake, plant material was sampled by
cropping selected species from areas of 100-400 sq. ft. and
where necessary, dividing the material into heads, leaves and
stems.

36
(e) Natural Waters
Water samples were collected in polythene bottles
and filtered on-site through Whatman No. 1 filter paper. Two-
litre samples provided ample material for the analyses required.
pH and Eh readings were made on-site before removal from the
stream or bore hole. CO3
and HCO3 determinations were also
carried out at the time of collection. Groundwaters were
collected from 3 in, bucket auger holes with a glass or alu-
minium ladle. In well-drained hilly areas groundwaters could
only be collected when they came within 7 fti from the surfacey
adjacent to or in topographic depression. Seepage and spring
waters were collected at the point where the flow reached the
surface. Whenever possible, series of samples were collected
over short periods to avoid fluctuations in groundwater level
or composition due to rain.
2. SAMPLE PREPARATION
(a) Rocks
Chip samples were ground to minus 10-mesh in a
small jawcrusheri quartered down to about 5 g, and then pul-
verized in .a Coor's ceramic ball mill to minus 200-mesh. Six
samples can be pulverized simultaneously using this equipment
giving a production rate of 60 samples per man-day.
(b) Soils and Sediments
tt.
Samples for routine analysis were lightly pulverized

37
in a porcelain mortar and sieved to minus 80-mesh.*
Bulk samples were treated in the same way except
that after breaking up the larger aggregates, they were roughly
quartered down prior to pulverizing.
(c) Drift
Samples of boulder-clay were prepared in much the same
manner as for soils including sieving to minus 80-mesh.
(d) Peat
Peat samples required more vigorous crushing in the
mortar before sufficient minus 80-mesh material could be
obtained for analysis. In the case of peaty-soils, which
tended to form very hard aggregates on drying, care had to
be taken to avoid undue fragmentation of mineral particles.
(e) Herbage
After final drying at 60°C in an electric oven,
herbage samples were ground to minus 38-mesh in a Christy Norris
mill. This was considered fine enough to achieve reasonable
representivity.
*The actual mesh size was 82-mesh i.e. 204 microns diameter, which for convenience is referred to as 80-mesh throughout this thesis. The reason for using this mesh size, which passes fine sand, silt and clay, is that it has become standard practice on geochemical surveys and allows the ready comparison of results with observations of other workers.
Agricultural workers more commonly refer to minus 2 mm material, which includes coarse sands. The relationship of the metal content of the two size fractions has been investigated and is discussed in Chapter VII.

38
3. ANALYTICAL TECHNIQUES
A multi-element spectrographic technique is in
routine use at the A.G.R.G. for regional geochemical and bio-
geochemical surveys and this was employed wherever possible.
Colorimetric and other techniques were used in cases where
the spectrographic technique was not applicable.
For routine analyses, accuracy control was main-
tained using the method of Craven (1954, see also A.G.R.G.
Teph. Comm. No. 46, 1963). Control samples constituting a
statistical series were inserted at intervals throughout the
various batches of samples and the precision calculated or
obtained graphically.
The techniques employed are indicated below in
outline only and for details the reader is referred to the references
cited. Any modifications that have been made are, however,
described in full.
(a) Spectrographic Techniques
The semi-quantitative emission spectrographic tech-
nique employed is that described by Nichol and Henderson-
Hamilton (1965). For routine purposes the following elements
are generally determined, Ag, Bi, Co, Cr, Ga, Mn, Mo, Ni, Pb,
Sn, Ti, V, Zn, Zr and sometimes Fe. This method was also used
for Mo determinations alone, on maw rock, soil and stream
sediment samples but was not used for herbage and water samples.

39
In brief, the method entails prior ignition of minus
80-mesh material in a silica crucible at 400-500°C for three
hours to oxidize organic matter and eliminate combined water.
A Li2CO3 buffer is added to the sample to reduce matrix effects
and germanium is added as an internal standard to give a con-
centration of 400 ppm in the final mixture with carbon. The
mixture is homogenized by shaking in a Wig-L-Bug for 30 seconds
and loaded into a carbon electrode. Details of the spectrographic
equipment are given in Table 4 and the wavelengths and useful
ranges of concentration of the elements routinely analysed in
Table 5. This information is taken from Nichol and Henderson-
Hamilton (1965) and Webb et al (1964).
Table 4: Spectrographic Equipment and Conditions
Source Unit Spectrograph Arc Stand Comparator Wavelength Range R Emulsion Anode
Cathode Exposure Gap Arc Current Slit Collimator Step sector
Hilger FS 131 Hilger Large Quartz FR 55 Hilger FS 56 Hilger JS Co,L.90 2800-4950 Ilford N.30 Morganite SG.305 H - 5 mm. carbon, 2.91 mm. diam. crater, 5 mm. deep crater. Morganite SG.305 H - flat ended 20 seconds 3 mms. 12.5 amps 15 µ Internal Two steps giving three intensities in proportion 1.1.1

Table 5: Wavelengths and Usable Concentration Ranges of Spectral Lines
Element Wavelength Range (ppm)
Ag 3382.9 0.2 - 1000 Bi 3067.7 5 - 200 Co 3453.5 5 - 10,000 Cr 4254.3 2 - 1000
2843.2 500 - 10,000 Cu 3274.0 1 - 500
2961.2 500 - 10,000 Ga 2943.6 2 - 10,000 Mn 4034.5 5 - 500
2933.0 500 - 10,000 Igo 3170.3 2 - 10,000 Ni 3414.8 1 - 1000
3050.8 1000 - 10,000 Pb 2833.1 1 - 1000 Sn 2840.0 2 - 10,000 Ti 3377.6 50 - 10,000 V 3185.4 2 - 10,000 Zn 3345.0 50 - 10,000 Zr 3438.2 200 - 10,000
1+0

La
, Estimation of the concentration of each element in
the sample is made visually by comparison of the spectra with
the spectra from a synthetic standard plate. In certain cases
greater precision (in particular for some Mo and Fe determinations)
was obtained by determination of the spectral density by means of
a microphotometer.
Productivity is 26 samples per man-day for 15 elements.
Precision is 135 - 45% at the 95% confidence level.
Because the samples are ignited before being spectro-
graphed, the results for highly organic samples have to be adjusted
for the loss of combustable material. For normal mineral samples
the loss on ignition is not significant.
(b) Selenium
Selenium was determined in soils, sediment, rocks
and herbage by the method of Stanton and McDonald (1965)
using 3,3/-diaminobenzidene after co-precipitation of Se with
As. A 4:1 nitric-perchloric acid attack is used. The method
has a precision of better than 25% at the 95% confidence level
and productivity is 20 to 25 samples per man-day. The lower
limit of detection is about 0.2 ppm Se using a 1 g sample but
this can be extended and the accuracy at the lower levels
increased by use of larger sample weights up to 10 gms. For
waters, the same technique was used on the residue obtained by
evaporating 500 or 1000 ml of sample (with 20 ml of nitric-
perchloric acid mixture added) to fumes.

42
(c) Molybdenum
The Mo content of herbage was determined colorimetri-
cally by a method adapted from North (1956) using zinc dithiol
(see also A.G.R.G., 1962). The techniques used diverged from
the normal A.G.R.G. method by utilizing an acid sample attack
(perchloric and nitric) and extracting the Mo from the residue
after evaporation to dryness by warming with 2N Na2CO3
solution.
This is done in order to eliminate Fe which interferes with the
colour comparison. Precision is ± 25% at the 95% confidence
level and the lower limit of detection is about 0,4 ppm depending
on the sample size and aliquot taken for determination.
Mo in water was initially determined by solvent
extraction from a buffered sample with 8-hydroxyquinolene in
chloroform. The extract is evaporated to dryness with nitric
acid and the Mo then taken up with 2N Na2CO3 as for herbage.
In order to include non-ionic Mo, later analyses were made by
evaporating water samples with a nitric-perchloric acid mixture
to dryness followed by the above procedure from the Na2CO3 stage.
Water samples to be analysed for the three elements
Se, Mo and Fe, were prepared by evaporating 1 to 2 litres with
40 mis of 4:1 nitric-perchloric acid mixture, down to perchloric
acid fumes. The residue was then dissolved in 6N HC1 and aliquots
taken to be treated individually for each element.

43
(d) Iron
Iron in rock samples was determined spectrographically
(Nichol and Henderson-Hamilton, 1965). In soils and sediments,
the amount of Fe present as secondary iron oxides was determined
colorimetrically by extraction with 6N HC1 followed by estimation
with thioglycollic acid. This is a modification of the method
of Sandell (1959) (see also A.G.R.G., 1962). Because of the
highly calcareous nature of many of the samples a greater acid
strength than usual was employed to avoid excessive neutraliza-
tion of the acid.
In waters, total Fe was also determined using
thioglycollic acid, after evaporation of the sample with nitric
and perchloric acid.
The expected precision of the colorimetric method
. + is - 25% at the 95% confidence level.
(e) Copper
Cu in rocks, soils and sediments was determined by
the spectrographic method. For herbage the sample was first
decomposed by nitric-perchloric acid mixture followed by esti-
mation of Cu using 2-2' diquinolyl in amyl alcohol. The method
was adapted from that proposed by Almond (1955) and except for
using the acid mixture instead of KHSO4 in attack, the process
is similar to that described in the A.G.R.G'. (1962). The
expected precision is 1: 25% at the 95% confidence level over
the range 5-2000 ppm.

44
An alternative method used for Cu analysis of
herbage was by atomic absorption using a Perkin Elmer 303
spectrophotometer with a hollow cathode Cu lamp. The samples
were decomposed with a nitric-perchloric acid mixture, evaporated
and made up to volume with water. The solution was sprayed and
the absorption measured at 32478. Unless stated otherwise, the
data for Cu in herbage were obtained by atomic absorption which
gives more consistent results than those obtained by colorimetry.
(f) Zinc
A few colorimetric analyses for Zn in rocks and
sediments were made using dithizone and potassium bisulphate
attack. The method has been described elsewhere (A.G.R.G.,
1962).
(g) Phosphorus
Phosphorus was determined by a method adapted from
Ward et al (1963) involving fusion of the sample with potassium
bisulphate and colour comparison of an ammonium vanadate-
molybdate complex (also refer A.G..R.G.., 1966).
(h) Arsenic
A few arsenic determinations were made on rocks
and stream sediments. The method was the modified Gutzeit
test described by Stanton (1964) and A.G.R.G. (1965).

45
(i) Sulphate
Sulphate analyses of soils and herbage were carried
out using a modification of the method of Scott and Furman (1955)
as detailed in A.G.R.G. (1962). Herbage samples were first
digested in a nitric-perchloric acid mixture and evaporated
to dryness. The residue or soil, as the case may be, is digested
in 1M HC1 and SO4 estimated turbimetrically after precipitation
as BaS04'
(j) Sulphur
Total sulphur was determined by a modification of
the sulphate method. The sample was first fused with a NaOH
and Na202 mixture to oxidize all sulphur minerals, particularly
pyrite, to sulphate. The melt was then leached with water,
filtered and sulphur estimated turbimetrically after precipi-
tation as BaS04'
(k) Organic Carbon
Analyses for organic carbon were based on the method
of Schollenberger (1927) as described in A.G.R.G. (1962). The
sample is oxidised with chromic acid, and organic carbon is
estimated by titration with ferrous ammonium sulphate. Results
are generally lower than those obtained by combustion methods
and the method was not suitable for determination of organic
carbon in the black shales because of the probable presence of
elemental graphitic material.

46
(1) Carbonate and Bicarbonate
These determinations were based on the method of
Scott and Furman (1955) as also described in A.G.R.G. (1962).
The few carbonate analyses of soils and rocks
involved decomposition of the sample with HC1 followed by tit-
ration with NaOH solution.
Carbonate analysis of waters was attempted but it
was found that in almost all waters in the area pH was below
8.35 thus precluding the presence of CO3 ions.
The bicarbonate content of stream and groundwaters
was determined on-site by titration of a 100 ml sample with
HC1 using screened methyl red as an indicator.
4. NiISCFLLANEOUS TECHNIQUES
(a) .pLi
Soils
Soil pH measurements were made in the laboratory
on a soil-water suspension. It has been shown by Huberty and
Hans (1940) that pH values made in this manner are'from 0.5 to
1.4 units higher than those made in the field on freshly
collected material. A 1 g sample was added to 5 ml of freshly
boiled deionized water in a screw top polythene container and
the slurry vigorously agitated for one hour on a mechanical
shaker. The pH was then read on a Pye Model 605 pH meter after
pouring the slurry into a polythene cup surrounding the standard
glass-calomel electrode. The meter was calibrated using pH

1+7
buffer tablets at 4.01 and 9.27 units. It is unfortunate that
this method, the standard one in operation at A.G.R.G., is
different from that used by the National Soil Survey of Ireland,
where the pH is determined on a 2:1 water-soil suspension of
minus 2 mm material. Donovan (1965) gives data on soils ranging
in pH from 6.8 to 8.4 showing that the N.S.S. measurements are
from 0.05 - 0.4 units higher than the A.G.R.G. method. Thus
pH measurements quoted are only relative and may vary slightly
from values taken by other methods.
The pH of natural waters was determined on-site
using a battery-powered pH meter manufactured by Analytical
Measurements Ltd. For groundwaters, the electrode was lowered
down the bore-hole wherever possible, while for stream waters
the electrode was placed several inches below the surface.
(b) Eh
Eh of natural waters was taken in the same manner
as pH using the same instrument but with a platinum electrode
and calibrated by using a standard solution of Eh value equal
to + 0.430 V at 25° with respect to the standard hydrogen
electrode. This solution was made up by dissolving 1.408 g
of potassium ferro-cyanide trihydrate, 1.098 g of potassium
ferri-cyanide and 7.455 g of potassium chloride in 1 litre
of deionized water.

1+8
In the case of groundwaters it was not possible to
exclude air from the bore-hole. The measurements were not
therefore made under truly natural conditions since the redox
equilibrium was upset by exposure to oxygen in the air. However,
the determinations were carried out as soon as possible after
opening up the bore-hole and related groups of measurements
were taken as close as possible in time to one another.
(c) Size Analysis by Wet Dispersion
Soil, drift and sediment samples were dispersik by
the method described by Nicals (1964) and is a modification of
that given in Piper (1950, p. 77-79), In brief, 100 g samples
of minus 2 mm material were dispersed in a solution of "Calgon"
(sodium hexametaphosphate). Separation of particles was achieved
by frequent stirring in a sonic vibrator. The suspension was
transferred to a 1 litre cylinder, made up to volume with water
and the proportion of silt and clay measured after sedimentation
with a Bouyoucous hydrometer. Times of sedimentation and tempera-
ture corrections were given by Piper (1950). Sufficient silt-
plus-clay fraction for analysis was decanted off and evaporated
to dryness. The remaining fine material was removed from the
sand fraction by repeated decantations and the residue dried.
The clean sand fraction was dry-sieved into six size-fractions
and the proportions determined by weighing. For the purpose
of the experiment it was not considered necessary to separate

49
the silt and clay fractions which would have involved lengthy
sedimentation times. The size fractions obtained and their
international standard equivalents are given in the following
table.
Table 6: Size Fractions Obtained from Mechanical Analysis (after Watts, 1960)
Sieve Size
Approx. Aperture International Convention (microns)
-10 mesh 2000 -20 mesh 1075 -38 mesh 520 -82 mesh 204 -125 mesh 107 -197 mesh 53 Silt and Clay 20
2
Coarse sand
Fine sand
I/
Silt Clay
In conventional soil surveys it is customary to
destroy CaCO3 and organic matter prior to mechanical size
analysis. However, this was not possible in the present study
where the object was to determine the distribution of metals in
the different size fractions. Not only would metals have been
extracted during the course of HC1 and H202 digestions but samples
containing an appreciable amount of limestone parent material
would have given entirely misleading size analyses. However,
an important disadvantage of the technique employed is that the
organic matter which acts as a cementing agent was not destroyed.
Consequently, soils from organic surface horizons and sediments

50
draining peaty areas could not be completely separated into
their different size fractions.
It is not known what effect the very dilute calgon
solution has on the distribution of exchangeable metal in the
samples but it is not expected to have achieved any significant
extraction of the total metal content. This method has become
standard practice at the A,G.R.G. and previous work on a variety
of metals has not indicated any serious extraction of metal by
sodium hexametaphosphate.
(d) Heavy Liquid Separation
Pyrite was separated from black shales by crushing
the sample to -80 mesh and removing silt and clay size particles
by decantation. The residue was washed with acetone and then
dry-sieved on a mechanical shaker into three fractions, 82-125,
125-197 and <197 mesh. Separation of the pyrite was obtained
by repeated eezttrifuging using tetra-bromoethane and the purity
of the fractions checked visually under the microscope.
Attempted separation using a Franz isodynamic magnetic separator
was not successful.

51
PART B
CHAPTER IV. THE REGIONAL METAL PATTERNS
As stated previously in the introduction, selection
of the study area of about 275 sq. mi. was initially based on
the recognition of distinct patterns of Mo distribution in the
stream sediments centred on an area of recorded Se toxicity.
To establish the validity of regional stream
sediment reconnaissance as a means of recognising broad patterns
of metal distribution in the natural environments, sampling of
the region as a whole was undertaken prior to any studies of
detailed relationships. The stream sediment coverage was inten-
sified and the original samples which were collected for mineral
exploration purposes, checked by re-sampling. Rocks, soils and
herbage were sampled by means of three widely spaced east-west
traverses and additional samples were also taken either at
random or on a widely-spaced grid in certain critical areas.
This work also enabled background or normal metal values to
be determined well away from the toxic localities where excessive
metal concentrations were known to occur.
To facilitate the comparison of regional metal
patterns in soils and sediments, the background area surrounding
the zones of anomalous Mo content shown in Fig. 8 have been sub-
divided into blocks (A-F) according to the dominant bedrock
type and the extent of drift cover (Fig. 12).

52
1. STREAM SEDIMENTS
In addition to the mean concentration and range of
values for Mo, Se and Cu in sediments from streams draining the
basic rock units of the area (Fig. 12 A-F), available data on
some other elements are also presented in Table 7. The distri-
bution of these elements reflects basic differences in the
bedrock and drift composition but are less directly concerned
with the agricultural aspects of the study.
The geometric value of the mean is used, (a) because
of the approach towards apparent lognormal distribution of the
geochemical data, and (b) because of the logarithmic spacing
of the spectrographic standards against which metal concentra-
tions are estimated. The logarithmic groupings of Mo, Se, Cu
and V values in the frequency plots (Figs. 10 and 11) correspond
to the spacing of the spectrographic standards used for analysis
and are also related to the groupings assigned symbols in Figs.
8, 9 and 12.
(i) Molybdenum
Referring to the histograms given in Fig. 10 most
samples from streams draining the Namurian,Carboniferous and
O.R.S. (areas A, B and C, Fig. 12) contained less than 2 ppm
Mo which is the detection limit of the spectrographic method.
The background level for Mo was therefore established at less
than 2 ppm.

AREAS Mo Se Cu V Pb Ga Ti Ni Co Mn Cr cxZn
A. O.R.S. L.L.'Stone Shale and Basal Limestone
B. Limestone
C. Namurian
n 27 19 27 27 27 27 27 27 27 27 27 27 R <2 0.2-1.0 15-80 20-150 30-120 6-30 1000-5000 15-80 5-20 150-4000 20-100 0-28 M <2 0.54 35 55 66 9.4 2600 45 13.5 950 89 9.0
n 39 40 39 39 39 39 39 39 39 39 39 39 R <2 0.2-2.0 10-60 40-80 10-70 2-10 500-3000 15-70 5-30 150-2000 20-80 0-26 M <2 0.64 29 66 29 5.1 1180 49 8.2 430 44 7.3
n 62 40 62 62 62 62 62 62 62 62 62 62 R <2-4 <0.2-1.2 15-90 30-180 7-60 12-40 1000-7000 40-120 7-90 70-6000 12-250 0-57 M <2 0.3 44 102 21 25 4940 66 30 1240 93 4.0
D. Namurian plus Weichsel drift
• 29 31 29 29 29 29 29 29 29 R <2-7 <0.2-1.2 20-80 80-150 15-180 15-40 4000-7000 60-150 15-90 M 2.6 0.55 53 104 36 24 5300 75 32
29 29 28 900-1% 70-180 2-118 2020 100 11
L. Drift of mixed oriGin incl. Clare Shales. "High Mo Zone"
F. Drift ;•f mixed orit;in incl. Clare Shales "Moderate Mo Zone"
n 67 54 22 22 R 2-200 0.3-21.0 50-300 120-400 M 14.5 2.75 92 187
n 80 46 36 36 R 2-15 0.2-5.0 30-200 80-300 M 5.7 1.2 61 121
32 32 32 32 32 32 32 32 '8-150 4-30 700-8000 60-250 10-60 70-3000 60-5000 4-51 30 13 2970 97 31 960 103 14
Table 7: Metal Contents of Stream Sediments Prom Different Bedrock Areas (Minus 80-mesh traction, values in ppm)
•Areas A-F, refer Fig. 12 n = No. of samples. R • Range of values. M - Geometric Mean.

Mo In stream sediment (ppm)
+ <2 o 2-5 O 5-10'
10-20 • >20.
2 4 6
miles
FIG. 8 REGIONAL DISTRIBUTION OF Mo IN STREAM SEDIMENT OF TRIBUTARY DRAINAGE
(Data refer to —SO mesh fraction)

54
Comparison of the patterns of Mo distribution
(Fig. 8) with the geological map of the area (Fig. 3) revealed
that the zones with the highest Mo values (blocks E and F
greater than 5 ppm) are roughly centred on the line of outcrop
of Clare Shale in the northern and central parts of the area.
Towards the south the Mo pattern becomes less well defined and
is finally indistinguishable from the background areas. This
is attributed to the structural thinning of the molybdeniferous
Clare Shale horizon as described in the section concerned with
general geology and in Chapter VI, and to topographic features
which also decrease the width of the sub-outcrop.
The extension of the anomalous zone to the west of
the line of outcrop of the Clare Shales roughly coincides with
the "fan" of glacially dispersed Clare Shale material in Fig. 12
and was investigated further in the studies of metal distribution
in soil and drift. The apparent extension of the Mo pattern
to the east is attributed to alluvial action by present-day
streams flowing east from the Clare Shale areas.
The molybdeniferous stream sediment zones (E and F)
centred on the Clare Shale outcrop are markedly anomalous (mean
Mo contents of 14.5 and 5.7 ppm respectively) compared with
the background areas underlain by O.R.S., limestone and
Namurian rocks (A, B and C - less than 2 ppm Mo). The area
of Namurian rocks in the north-west (D, Fig. 12) which is
partly covered by the Weichsel drift, is not appreciably
anomalous but has a mean stream sediment Mo content of 2.6 ppm.

Se in stream sediment (ppM)
+ <1.5 0 1.5-3.0 0 3.0-6.0 • >6.0
9 miles
FIG. 9 REGIONAL DISTRIBUTION OF Se IN STREAM SEDIMENT OF TRIBUTARY DRAINAGE
(Data refer to -80 mesh fraction)

foZ 0 =11
1111•11•MIIP
SELENIUM
A. O.R.S., L.1. 4St.Sh. etc.
TOTAL AREA. n = 19
10Z G 0.54.
so%
MOLYBDENUM
TOTAL AREA
fl a 720
10 20 SO 100 100 PPM
E. Mo "HIGH"ZONE.
n = 67 rl 0 = 14.5
0' 0 4 6' to so to too Ate
TA F. Mo "MODERATE" ZONE.
3p- n= SO
= 5.7 a
O 0
C. NAMURIAN. S.W. (no drift.)
n= 62.
Ga <2
11 a 312.
At%
0 • 01 1.1 2 7 is 50 7.
PPM
E. Mo "HIGH" ZONE.
n = 54
0 = 2.76.
F. Mo "MODERATE ZONE.
0 •7 PI;
B. LIMESTONE. n = 40
0 = 0.64.
0 o 14'.▪ ▪ 3
a C. NAMURIAN. S.W. IL.
n a 40
0= 0.29 ro%
n a 46 0 moirrome
0 O a r
D. NAMURIAN.N.W.
n = 29.
G 2.6 or o .7 7
PPM.
D. NAMURIAN. N.W.
(37, n = 31
G= 0.55
(drift.)
o 0 07 ,94.
0 • to
0
REGIONAL DISTRIBUTION OF METAL IN STREAM SEDIMENTS.
LOGARITHMIC FREQUENCY PLOTS FOR Mo AND Se. FIG. No.10.

55
This is sufficiently greater than background to suggest that
some molybdeniferous material has been added by the drift
cover.
(ii) Selenium
The pattern of Se distribution in stream sediments
(Fig. 9) is substantially the same as the Mo pattern, indicating
a common bedrock source. Mean Se values and ranges (Table 7) and
the frequency plots (Fig. 10) illustrate that, within the back-
ground range, stream sediments from the O.R.S. and limestone
areas (A and B, Fig. 12) contain more Se (0.54 and 0.64 ppm
mean values) than streams draining Namurian rocks (area C -
0.3 ppm Se).
The areas that were anomalous for Mo (E and F) also
carry appreciable concentrations of Se in the drainage sediment,
i.e. mean concentrations of 2.75 and 1.2 ppm Se respectively.
The area of drift-covered Namurian in the north-
west (area D) is anomalous with a mean Se level of 0.55 ppm
compared to the Namurian rocks in the south but the values are
comparable to those detected over the limestone in the east.
(iii) Copper and Vanadium
The mean Cu and V values on the different rock
types (Table 7) and the sample frequency histograms (Fig. 11)
indicate that these metals have a generally similar pattern
of distribution in the drainage to Mo and Se, the highest

PPM 0 10 26 56 limin
A. O.R.S..L.L'st.Sh. etc.
••••••••••
n=27
G=34.7
r
TOTAL AREA
11011•11•1111.1.
r-
D. NAMURIAN. N.W. n 29
—11: 53.3
1•111•11.1•1,
0 187.4.
1111••••4
F.Mo "MODERATE " ZONE.
n 36
0 = 121.0
41110•0010
O. NAMURIAN.
n 29
a 104.
COPPER
n = 296 B. L IMESTONE.
B. LIMESTONE.
C. NAMURIAN. S.W
E. Mo "HIGH" ZONE. n = 39. z n = 22 G=65.8
w a.
In , I
PPM 0 10 20 50 100200500
TOTAL AREA
411••••••,
n a 295
N CH
:-. 5
0 PE
RC E
NT.
FREQ
UENC
Y
E. Mo "HIGH" ZONE.
n a 22 .110111.1•11
G =92.5
F. Mo Mo "MODERATE" ZONE.
n a 36
mmomerm•
G 61.5
VANADIUM PPM PPM
a 20 50 1-2-5_ 0 10 20 iO 103200590
A. O.R.S. etc. Gm 55.4
n = 2 7 r—
•••••••••
r
M11•1111
n = 39
G = 29.2
••••••=1,
n a 62
0 = 44.3 FREQ
UEN CY
••••••••10,
C. NAMURIAN. S.W.
n a 62
0:102.4
•
REGIONAL DISTRIBUTION OF METAL IN STREAM SEDIMENTS. LOGARITHMIC FREQUENCY PLOTS FOR Cu AND V.
FIG. No.11.

Mo in soil 18-24 ins. A-F (ppm)
< 2 0 2 — 5 0 5-10 ® 10-20 • > 20
Bedrock and anomalous areas used for calculation of mean soil and sediment metal contents.
N Projected "Fan-shaped" zone of glacially dispersed Clare Shale matenal.
oii 2 4 6
M'rrosii l miles
FIG.12. REGIONAL DISTRIBUTION OF Mo IN SOIL AND DRIFT
Outline of anomalous stream sediment Mo patterns.
/Limit of glacial drift.
Glacial striae.

56
values occurring in the areas of Clare Shale and Clare Shale
drift. However, the contrast between background and anomalous
areas is much lower than for Mo or Se.
(iv) Other Elements
Mean values for Pb, Ga, Ti, Ni, Co, Mn and Cr
(Table 7) indicate some apparently significant variations
in stream sediments draining the different rock types:-
(a) The Pb content of sediment from the O.R.S.
and Lower Limestone Shales area is significantly high compared
with those derived from other rock types. This corresponds
with results obtained by Donovan (1965) and is in line with
the apparent stratigraphic control of some lead-zinc ore-bodies
in Ireland where the lower horizons of the Carboniferous lime-
stone are a favourable zone for mineralisation and contain an
overall higher background Pb content.
(b) Ga, Ti and Mn are enriched in the Namurian
areas. The higher Ga and Ti values possibly correspond to the
greater clay content of the argillaceous rocks compared with the
limestones.
(c) Ni apparently follows Mo, Se, Cu and V in
being enriched in the Clare Shale areas (zones E and F) but
the contrast is small and the apparent correlation may be due
to inadequate data or local dispersion features involving
secondary concentration in the stream sediments.

57
2. BEDROCK
Following the detection of anomalous geochemical
patterns in the drainage it is necessary to define them with
regard to metal distribution in the parent bedrock from which
the stream sediments are ultimately derived.
The stratigraphy and lithological characteristics
of the principal bedrock units has been reviewed in Chapter II.
The relative stratigraphic positions of these formations is
shown diagrammatically in Fig. 13, which also gives the mean
metal content of each unit and the range of values present.
All the major formations were sampled along the
regional traverse lines except the poorly exposed Lower Limestone
Shale horizon. This is unfortunate as it was therefore not
possible to confirm the presence in this horizon of the higher
concentrations of Pb indicated by the stream sediment samples.
Data are included for tuff and spongolite rocks although the
actual areal extent of these formations is limited. Values
for Clare Shales are based on serial samples collected along
semi-continuous sections as well as random outcrops. Data for
the non-marine Namurian rocks are divided into sandy and argil-
laceous types and composite values for the whole sequence are
also given.
(i) Molybdenum
Only the Clare Shales carry Mo values greater than
2 ppm which is the limit of detection by the spectrographic

Se Mo Pb Ni Co Mn P As SO4 PPM Zn
0/4, Cr Fe ,O
METAL CONTENT PPM Ga V Cu Ti
DEV
ON
IAN
Old
Red
Sandstone
—= Not Determined. M = Geometric Mean. n= No. of Samples. R = Range of Values.
n
R
M
8
<2
<2
6
01-05
0.18
7
4 - 35
11
7
1 - 16
12
8
40 -70
53
8
6 - 30
12
7
3000 - 6000
4720
8
30- 60
41
8
10 - 30
18
7
100-600
177
7
60-100
82
_ ..
5-6
5.7
7
— — — —
n
R
21
<2
6
01-01
19
5- 40
19
16 -30
21
70 -150
21
30 - 45
19
5000 - 8500
21
40-80
21
5 -40
19
130-900
19
100 - 200 6-20
20
-,-. — •
—
M <2 0.14 19 26 95 36 6420 58 24 406 124 79
n 29 12 26 26 29 29 26 29 29 26 26 27 4 4 4 4
R ..2 01-0 .5 4-40 7-30 40-150 6 -45 3000-8500 30-80 5 -40 100-900 60-200 5-20 <5 - 7 75-90 200 .<100-3000
M <2 0.16 17 21 81 27 5910 53 22 325 111 7.6 <5 80 200 48-2300
n 79 75 79 79 79 79 79 79 79 79 79 65 16 16 15 16
R 2 - 300 0.2 - 30 7 - 80 4 - 50 30 -4000 20 - 200 400- 8500 7 - 200 <5-85 3 - 6000 50 -300 0.5 -45 <5 -55 25 -125 <20-1000 150-34,000
M 27 2.90 22 15 365 79 2420 54 13.-20 335 130 4.5 4.3-11 50 100-135 3300
n 5 5 5 5 5 5 5 5 5 5 5 5
R 4-50 0.7- F6 6 -40 5-8 30-800 30-70 400-600 7-20 <5-7 40-400 50-85 0.5-1 .6 — — — M 16 1.3 10 5.6 365 45 550 12 <5 110 72 1.0
n 1 1 1 1 1 1 1 1 1 1 1 1 _ _ — ____ M <2 1.0 2 8 85 <2 6000 60 40 400 160
n 28 6 13 13 14 14 13 14 14 13 13 14 4 4 4 4
R <2 015-0-5 2 - 8 <2 - 10 40-100 2 - 15 10-600 <5 -60 <5 -8 40 -500 <2 - 30 <0 2-1.6 <5 30 - 65 100-200 <100 .
M <2 0.27 3.5 <2 61 4.3 88 8-10 <5 115 4.3-6- 8 012-11 <5 39 151 <100
Not exposed in area . , Not sampled.
n 2 2 2 2 2 2 2 2 2 2 2 2
R <2 01-01 7 30 70 -80 10 - 35 7000-8000 35 -40 8 - 15 700 80-1 50 6.0 — — —
M <2 . 014 7 30 75 19 7480 37 11.0 700 110 6.0
TRACE ELEMENT CONTENT OF MAJOR ROCK UNITS.
EMEMiniMPP EM Pi" Eir Nor-- 11111.11111111M.-
11111111111111-11111 1111•1111111111111-
111111-110111-1 111-1•11_11111- 111111111—M1111111
ommito rimaram Mal MEM INIZIMI 011•111111111MIENOM CICIMMICIIIIIM 1 --a--.
Sandstones
Siltstones
and
Mudstones.
Namurian (non-marine) Composite.
CLARE
SHALES
(marine)
Spongolite
Tuff
Limestones.
Lower Limestone Shales.
FIG. No.13.
4—T
ou
rna
isi
tr)
0 re
u_
0
ce
U
Na
mu
ria
n
1
a

58
method (Fig. 13 and Table 8). Since the contrast in Mo content
between the shales and the other rock types was so great, the
very considerable effort required to determine the actual lower
limit of concentration in these rocks was not considered to be
justified. However, the results are consistent with the average
values for the appropriate sedimentary rocks given by Krauskopf
(1955, p. 416), namely, shale, 1 ppm; sandstone, 0.1-1.0 ppm;
and limestone 0.1-0.5 ppm. The average value of 27 ppm obtained
from Clare Shales is also within the range expected for black
shales. Assuming the average values given by Krauskopf apply
in the study area, then the contrast in Mo content between the
Clare Shales and the neighbouring shales, sandstone and limestone
ranges from 25 - 250 : 1.
The regional distribution of Mo in rocks is given
in Fig. 14.
(ii) Selenium
As for Mo, Se is also concentrated in the black
shales (Figs. 13 and 15), the enrichment factor being in the
order of 15, which is somewhat less than that of Mo. Considering
the very low levels encountered and the precision of the analyti-
cal method employed, it is unlikely that differences in Se
content between the sandstones, Namurian shales and the lime-
stone are significant.

Mo in rock (ppm)
<2 0 2-5 • 5-10 O 10-20 • > 20
0 2 4 6
mites
FIG.14 . REGIONAL DISTRIBUTION OF Mo IN ROCK.

Sat in rock (PPrn)
<1 0 1 — 2 02-5
5 —10 • > 10
0
0
0 2 4 6
milts
FIG.15. REGIONAL DISTRIBUTION OF Se IN ROCK.

59
(iii) Other Metals
Data for the other elements analysed (Fig. 13)
is compared with the average concentrations in common sedi-
mentary rocks in Table 8. In the main they are of the same
order or fall within the range indicated.
With regard to the study area, it is apparent that
Cu and V follow Mo and Se in being concentrated in the Clare
Shales but as was the case in stream sediment, the anomaly
contrast is less pronounced.
The limestone, as would be expected from its compo-
sition is generally impoverished in most metals compared with
other rocks, the main exception being V. The two sandstone
members, the Old Red Sandstone and the Namurian, appear to
contain slightly higher proportions of some elements when
compared with the average sandstone (in particular Ga, Ti, Ni,
Co, Fe) but they are not pure sandstones and this discrepancy
is attributed to the relatively high proportion of argillaceous
matter in them.
The differences in metal content between the con-
formable marine Clare Shales and the non-marine Namurian
argillaceous rocks are attributed to the contrasting deposi-
tional environments. A more detailed study of the Clare Shales,
involving distribution of the elements, their mode of occur-
rence and possible means of concentration is given in Chapter VI.
Fig. 16 illustrates, in the form of a line diagram,
differences in metal content between the major rock types.

Namurian .iii L;tone Old Rod Sandstone
Average Black Shale 75-225 100-1000
AveraTe Sandstone 5-20 Carboniferous Lime- stone <5 39
Silts.:ones and Nulstones
Avera7e Limestone 4-20
Average Shale . 4 50-300 Crustal Abundance 5 130
Clare Shales 4.3-11.2
50
Table 8: Metal Content of the Major Rock Types Compared with Average Values
for Common Sedimentary Rocks
Average values from Krauskopf (1955) except where marked (*) and ("). (') Goldschmidt, (1954) (4") Green, (1959)
Mo Se Pb Ga V
PPm
Cu Ti Ni Co Mn Cr Fe203 %
Namurian Sandstone <2 0.18 10.7 11.6 53 12.0 4720 41 18 177 82 5.7 Old Red Sandstone <2 0.14 7 30 75 19.0 7480 37 11 700 110 6.0 Average Sandstone 0.1-1.0 1.0 10-40 5 10-60 10-40 3000" 2-10 1-10 385** 10-100 4.4**
Namuriar, siltstones and Nudotones <2 0.14 19.5 26 95 36 6420 58 24 406 124 7.9
Average Shale 1 0.5-1.0 20 15 50-300 30-150 4400** 20-100 10-50' - 100-400 6.2"
Clare Shales 27 2.90 22 15 365 79 2420 54 13-20 340 87 4.5 Average Black Shale 10-300 - 20-400 70 50-2000 20-300 - 20-300 5-50 - 10-500 -
Carboniferous L'stone <2 0.27 3.5 <2 61 4.3 88 8-10.4 <5 115 4.3-6.8 0.12-11 Avera4e Limestne 0.1-0.5 0.1-1.0 5-13 3 2-20 5-20 400** 3-10 0.2-2 1300" 5 1.85
Crustal Abundance 1 0.01 16 15 150 70 4400" 80 23 100* 200 7.1.
m PP As In As rpm Zn
rn

Other rock typos .2 ppm •
Other rock typos -40 5 ppm
------
O
•
0- • •
0-
METAL CONTENT (ppm)
2
5 10 20 50 100 200 500 t000
2000 5000 n:1003
O
•
-+-
7 0
-• 0 -4-
10
Mo
Se
Pb
Go
V
Cu
-0 ----- - Ti -4-
Ni
Co
-=-b--- ---- Mn
Cr
Mo
Pb
Go
V
Cu
Ti
Ni
Co
Mn
Cr
Fe203
F1G.16.DIAGRAM ILLUSTRATING THE MEAN METAL VALUES AND RANGE OF METAL IN THE FOUR MAJOR ROCK TYPES. O NAMURIAN. • CLARE SHALES 0 LIMESTONE • OLD RED SANDSTONE.

6].
Readily apparent contrasts in metal content that may form geo-
chemically mappable units or assemblages, characteristic of the
different lithologies, can be summarised as follows:-
Clare Shales - enriched in Mo and Se, Cu and V.
The contrasts for Cu and V are less pronounced than for Mo and
Se.
Limestone - appreciably lower than the other rock
types in Pb, Ga, Cu, Ti, Ni, Co, Cr, and Fe203.
Non-marine Namurian rocks - containing more than
twice as much Ti as the marine Clare Shales.
Because of the possible agricultural association
= of P and inorganic SO4 in the Mo cycle, a limited number of
samples were analysed for these constituents. The results
show little variation in the mean P content of the Clare Shales,
the limestones and the Namurian rocks., although phosphatic hori.'
zons are known to exist in some parts of the Clare Shales and
this may explain the high values of up to 1000 ppm P (O'Brien,
1953). With regard to SO4 there is an apparent enrichment in
the Clare Shales, compared with the limestone and Namurian
rocks.
3. OVERBURDEN
Regional sampling to determine the distribution
of metal in the overburden in relation to the stream sediment
and bedrock patterns was carried out at the sites shown in
Fig. 12; the sampling depth in both residual soil and drift

62
was 18-24 ins. The Mo content and other elements that could
be readily determined by the spectrograph were recorded for each
sample but because of time restrictions on the number of chemical
analyses the data for Se is limited to about one-third of the
samples.
The data summarized in Table 9 have been sub-
divided into zones, based on the bedrock and drift constitution
similar to those used for the presentation of the regional
stream sediment data (see Table 7).
(i) Molybdenum
Mo levels in overburden overlying background Namurian,
limestone and Old Red Sandstone rocks (Fig. 12, zones A-D)
averages less than 2 ppm (Table 9). The highest values, up to
30 ppm, occur over the line of outcrop of the Clare Shales.
The pattern of anomalous Mo values in the overburden
(Fig. 12) is in general closely related to the anomalous stream
sediment zones (E and F) which are also shown in outline in
Fig. 12. The range of Mo levels in the overburden is generally
greater and the distribution of anomalous samples more erratic
than the corresponding stream sediment patterns but this
apparently reflects the more sporadic nature of metal values in
the soils compared with stream sediments. However, the average
soil values 10-11 ppm and 3.6-4.7 ppm in the anomalous zones E
and F respectively, are roughly of the same order as in stream
sediments, namely 14.5 and 5.7 ppm Mo.

AREA No Se Cu V Pb Ga Ti Ni Co Ma Cr
24 20-300 60
24 20-400 74
24 10-160
34
24 24 5-40 850-1% 10 1860
24 24 <5-85 100-1% 14-15 470
B. Limestone 24 24 8-130 30-300 27 75
• 25 10 R <2-5 <0.2-1.3 M <2 <0.5
25 8-40 24
25 8-40 19
25 20-85 45
25 60-200
114
25 25 8-40 4000-1% 25 7760
C. 4.W. Namurian Weichsel drift absent
• 25 4 R <2-3 0.3-2.3 M <2 0.8
25 25 25 10-30 85-600 85-400 15 162 150
21 60-300
120
21 21 5-40 100-600 18 280
21 8-30 22
21 16-40 22
21 20-85 46
21 5000-1% 6670
D. N.W. Namurian and drift
21 6-50 27
21 30-200
105
n 22 1 R <2-6 0.6 M <2 0.6
E. "Mo" High Zone Cl. Sh. and mixed drift
II 27 14 R <2-30 0.5-8.0 • 10-11 2.7
19 14 <2-15 0.5-4 3.6-4.7 1.1
P. "Mo" Moderate II Zone. Cl. Sh• and R mixed drift
26 26 5-30 3000-1% 16 5310
26 13-85 27
A. O.R.S. L.L'st.Sh. n and basal limestone
8 2 <2-2 <0.2-0.5
<2 <0.5
8 8 8 30-100 50-200 40-130 52 82 77
8 8 6-30 2000-85000 16 5390
8 40-100 62
8 8 10-40 300-3000 25 690
8 60-130 98
20 20 30-160 60-600 87 250
14 14 30-70 50-400 50 130
26 26 26 26 20-300 <5-60 20-6000 60-500 63 16-20 350 130
Table 9: Metal Content of Soils and Drift from Different Bedrock Areas (Minus 80-mesh fraction, values in ppm; Horizon sampled 18-24 inches)
n • no. of samples. H • Range of values. M • Geometric mean. rn
km

64
The extension of the anomalous stream sediment zones
to the west is reflected in the overburden patterns. This has been
attributed to the 'carry-over' of molybdeniferous Clare Shale
material by the Weichsel ice-sheet (ref. glacial geology, Chapter
II) which advanced in a south-westerly direction across the area.
The Mo pattern in the drift in general corresponds to the expected
'fan-shaped' zone of glacially dispersed material from the Clare
Shale escarpment and is markedly limited to the south by the
terminal moraine. The influence of glacially transported Clare
Shale material on metal dispersion in the area is further
discussed in Chapter VII.
(ii) Selenium
Because of the limited number of Se analyses a map
of Se distribution in the overburden is not presented. However,
mean metal values for the various bedrock zones (Table 9) indi-
cate that Se is enriched in the areas that are anomalous for Mo
and in view of the similar stream sediment patterns of the two
elements it is probable that the regional overburden patterns
are also more or less identical.
Background levels of less than 0.5 ppm Se in the
O.R.S. and limestone areas to the east (areas A and B) and 0.8
and 0.6 ppm on the Namurian rocks (areas C and D) contrast with
average anomalous levels of 2.7 and 1.1 ppm in soils centred on
the Clare Shale sub.outcrop and drift in the Mo anomalous areas
E and IP .(Fig. 12).

65
(iii) Other Elements
Cu and V, which have been shown to be concentrated
in the Clare Shales along with Mo and Se, are similarly con-
centrated in the overburden of the molybdeniferous zones E and
F (Table 9).
There is also an apparent association of Cu with
the O.R.S. and the basal horizons of the limestone (area A).
Values for Cu in the overburden of this area are about twice
the concentration in the adjacent limestone (area B) and
Namurian soils (areas C and D). These data are not confirmed
by the stream sediment patterns however, and its validity may
be doubted in view of the limited number of samples (8) involved.
Data for the other elements examined are also given
in Table 9. Of particular interest are the high Pb values
associated with the basal limestone and O.R.S. soils (area A).
This trend is similar to that of Cu and confirms the Pb patterns
indicated by the stream sediment survey. The incidence of both
high Pb and Cu values in the vicinity of the O.R.S.-limestone
contact is interesting in view of the occurrence of Irish base
metal deposits in this horizon. It is of course more probable
that metal values detected in the study area reflect strati-
graphic variations in the bedrock rather than actual mineralisation.

66
4.. HERBAGE
Data on the regional metal patterns in herbage are
restricted to Mo, Se and Cu in samples collected along the
northern most east-west regional traverse (Fig. 17).
(i) Molybdenum
There is a very close correspondence between the
highest Mo values in the herbage (Fig. 17) and the anomalous
zones delimited by the stream sediment and soil surveys (Figs. 8
and 12).
Background levels in herbage range from 0.8 to 1.2 ppm
over the limestone and rise to 3.2 ppm approaching the anomalous
stream sediment zones. Anomalous values range up to 16 ppm Mo
near the line of outcrop of the Clare Shales. Over the Namurian
rocks and drift in the N.W. of the area (area D) background
levels range from 0,4 to 3.2 ppm Mo. Samples of herbage from
the background area of mainly limestone drift with some O.R.S.
and L. Limestone Shale material in the south-east also ranged
from 1.4 to 3.6 ppm Mo.
The established background levels of less than 3.6
ppm Mo for the area lie below the provisional threshold limit
of toxic herbage given by Walsh et al (1952) of 5 ppm Mo. The
potentially toxic levels of 8 to 16 ppm Mo in herbage coincide
with the anomalous stream sediment zones (greater than 5 ppm),
indicating a considerable area of potentially toxic herbage. The
more detailed relationship between the Mo patterns of the herbage
and the soil is examined in later chapters.

West.
t a- High. Anomalous Mo Stream Sediment
-*Moderate.. Zones.
Namurian4-- A—I,Limestone East
1 inch .= 2 miles. +-----I- Cu Dry Weight.
•-----• Mo .•
o----o Se
Projected outcrop Clare Shales.
0 s
I •
0 \
e
FIG.No.17. REGIONAL METAL CONTENT OF HERBAGE
Co.Limerick. North-end of Area, East-West Traverse.
VI A •1 Cob VI
N. OD 04 N NI NI Ira
to? ••▪ •• - CD ._
•st
30 30
10
3
2 a. 0.
1
0.5
0.3
0.2
01
10
5
3
0,5
0.3
0.2
01
0
• . o----o.. o. . ,,
b." 'oo
0
-d Other Se values .c0•2 ppm.

67
(ii) Selenium
Analysis of herbage from the northern regional
traverse (Fig. 17) and background studies in the south-east
indicate that on the generally well-drained soils the Se
content of the herbage does not exceed 0.5 ppm, which is well
below the accepted toxic threshold of 5 ppm (Fleming and Walsh,
1957), or even the lower level of 2 ppm suggested by Smith and
Lillie (1940). The absence of any excess of Se in the herbage
samples collected within the stream sediment anomaly is believed
to be due to local environmental factors. The sample sites were
mainly positioned on well-drained soils which, it will be demon-
strated in the following chapter, do not produce toxic concentra-
tions in the herbage.
(iii) Copper
Analysis of a limited number of samples from the
regional herbage traverse (Fig. 17) indicated that a fairly
broad anomalous.Cu zone, with levels in herbage ranging from
7.3 to 10.1 ppm Cu, was centred on the Mo anomaly. Background
Cu levels were in the range 3.9 to 6.1 ppm. Compared with Mo,
the contrast between background and anomalous Cu levels is low
and this corresponds with the pattern of Cu distribution in
soils, rocks and stream sediments.

68
5. DISCUSSION
The distribution of No and Se in the bedrock, soil
and stream sediment environments (summarized in Table 10)
indicates that they have generally similar regional dispersion
characteristics. This is confirmed by the similarity of the
regional bedrock and stream sediment plans (Figs. 14 and 15 and
Figs. 8 and 9, respectively).
Cu and V, the elements which along with Mo and Se
are most obviously concentrated in the black shale bedrock,
bear a similar relationship in soils and stream sediments.
The reflection of the bedrock relationship of Cu and Mo in the
soils of the area is of particular significance when the inter-
action of these elements in nutrition is considered later.
Anomalous concentrations of Mo in herbage are also accompanied
by a rise in the Cu content.
Comparison of the average data presented for the
bedrock, soil and drainage environments (Table 10) demonstrates
that for most elements the bedrock patterns are repeated in the
insoluble products of secondary dispersion represented by the
soils and stream sediments.
In the case of the more chemically-resistant rocks,
i.e. the Clare Shales and the Namurian argillaceous and arena-
ceous sediments, the metal content of the secondary products,
with the exception of Mn, is roughly the same order as the
bedrock content; However, the limestone, in which chemical
weathering factors involving the removal of CaCO3 in solution

Table 10: Comparison of the Man metal Contents of Bedrock. Soil and Drift and Stream Sediments
AREA SAMPLE TYPE Se Cu V Pb Ga Ti Ni Co Mn Cr
Old Red Sandstone Rock <2 0.14 19 75 7 30 7480 37 11 700 110
A. Mixed O.R.S., Lower Soil <2 <0.5 52 82 77 16 5390 62 25 690 98 L'st Shiles and basal
limestone Str. Sed. <2 0.54 35 55 66 9.4 2600 45 13.5 950 89
B. Limestone Rock <2 0.27 4.3 61 3.5 <2 88 8-10 4:5 115 4.3.6.8 Soil <2 <0.5 27 75 34 10 1860 60 14-15 470 74 Sed. <2 0.64 29 66 29 5 1180 49 8.2 429 44
C. S.W. Namurian. Rock <2 0.16 27 81 16.5 21 5910 53 22 325 111 Drift absent Soil <2 0.8 24 114 19 25 7760 45 15 162 150
Sed. <2 0.3 44 102 21 25 4940 66 30 1240 93
D. N.W. Namurian. Soil <2 0.6 27 105 22 22 6670 46 18 280 120 Some drift cover Sed. 2.6 0.55 53 104 36 24 5300 75 32 2020 100
Clare Shale Rock 27 2.9 79 365 22 15 2420 54 13-20 340 87
E. "Mo High" Anomalous Soil 10-11 2.7 87 248 Soil Zone Sed. 14.5 2.75 92 187 'Pr- 16 5310 63 16-20 350 130
F. "Mo Moderate" Anomalous Zone
Soil Sed.
3.6-4.7 5.7
1.1 1.2
50 61
132 121
Sed.177 13 2970 97 31 960 103 .'"'
ot

70
are pre-dominant, shows a postive enrichment of Cu, Pb, Ga, Ti,
Ni, Co and Cr in the soils and sediments compared with the
primary material.
From this it is apparent that while the primary geo-
chemical patterns may be retained in the secondary environment,
the mode of weathering of a particular bedrock can appreciably
affect the actual metal levels. Because of this, the contrast
with adjoining bedrock types having a different mode of weathering
may also be affected. Thus, although the limestone (Table 10)
contains appreciably less Cu, Pb, Ni and Co than the Namurian
rocks, the metal levels in the soil and sediment derived from
both sources are not significantly different.
However, the amount of V is not appreciably enriched
in the transition from limestone rock to soil to sediment, and
this demonstrates that the mode of dispersion of an individual
element may also influence the resultant secondary patterns.
Furthermore, Mn, which is appreciably enriched in the stream
sediments of the Namurian areas compared with the soil content,
shows that variations in the metal level can be quite large
between different environments.
The effect of secondary dispersion mechanisms on
the resultant geochemical pattern is discussed in greater
detail in Part C of this thesis, mainly with reference to
Mo and Se.

71
The relationships established between the stream
sediment patterns and the distribution of metal in the soils
and bedrock confirm the validity of stream sediment reconnais-
sance as a means of defining regional geochemical patterns.
With regard to biogeochemical studies, an area of
about 30 sq. miles was indicated in which anomalous, potentially
toxic concentrations of Mo and Se are present in the soils and,
in the case of Mo, probably also in the herbage. The relation-
ship of Se in the soil to the amount accumulated by pasture
herbage is obscure at this stage but is obviously affected by
environmental features other than the total content in the
soils.

72
CHAPTER V. DISTRIBUTION OF METAL IN THE FLYNN'S
FARM AREA
In order to examine more closely the relationship
between the stream sediment patterns and the metal content of the
local soils and vegetation more detailed sampling was undertaken
in the area where Se toxicity had already been recorded (Figs. 3
and 20). In addition to close-spaced stream sediment samples
(250 to 500 ft. apart) the soils and pasture herbage were
collected systematically on an 880 ft. square grid giving a
total of about 220 sample points over 5 sq. miles.
For convenience this area is referred to as Flynn's
Faro after the property at toxic soil site A (Fig. 20) where
much of the detailed work has taken place.
1. GENERAL DESCRIPTION OF THE AREA
The bedrock geology in relation to the region as a
whole is shown in Fig. 3 and in greater detail in Fig. 20.
The South Creek Clare Shale section referred to in
'Chapter VI is located roughly along strike from toxic site A
(Fig. 18) and comprises the basal horizons of the Clare Shales.
This section contains mean values of 71 and 15 ppm Mo and Se
respectively (other constituents are given in Table 12). The
extensive drift cover obscures the overlying horizons and their
metal content is not known. However, evidence from other rock
sections suggests that the overlying strata may contain some-
what lower values.

1 4. \ C'''..,.. ‘
II %'4%. , -, "4,0 • I e
I .rct on-rd.Frits.$6,37
I \ KILCOLMAN SCHOOL \
• AREA. .... •-• • 1,-..... r •"•, ''''..-1 , • trert-rot.Fig.3, • I ri/1 • ..,, t ..• - • 00-• I e . %
1 • • • .I...
..• I
i ' ► I I I • I . rr
I f .0 i
I I
I
r I
r • • I t
o i
. • . ,, i
I i r r , VA I r : .1 I , SP i ♦ / i il En • :..... .....
, ,... ...... , , ..., ... " 1 I
/
• 16/ / e / I /
.._ -
/. / frtsen-reLF*2.014-. , ....
r / I 4:- ) , --,
........, I .- J 1 I J I) I 0. 4. • I i .., • .. 11
/ `ea..
e i (LISOOR0011 HO. tar /
/ / t....-- t / II, . ,
.... ... .., ... I
I
It I I I ••"" "".. I Crook.C11. • • Vs .. i •
•,....,- • i , .- •
1/4'• r .../ 4•11.0.''.. O ( •
• I SOUTH CS. ROCK • • i i • SECg.,TION. iht?
....'' '40W...1 / I / •..„, , t 1 6,11 i
11. a , \
Cdr • , e" I
I /
1
CONTOUR INTERVAL 100 FEET. A, B KNOWN S. TOXIC sitsTuns NILE.
FIG. NO.18. TOPOGRAPHY AND PLACE NAMES-FLYNN'S FARM AREA.

73
The topography (Fig. 18) is controlled to a large
extent by the bedrock geology. Limestone occupies the flat to
gently undulating plain to the east and the more resistant Clare
Shales form the hilly area in the west which rises to more than
300 ft. above the plain.
The overburden is predominantly glacial drift with
the exception of minor occurrences of residual and alluvial
soils (Fig. 19). The drift is mainly boulder clay with some
gravel and sand deposits of fluvio-glacial origin. The material
composing the drift is largely determined by the rocks traversed
by the ice in a general westerly and south-westerly direction.
Thus over the limestone the drift is almost entirely composed
of limestone fragments and rock flour, whereas in the area
underlain by Clare Shales, the drift is made up of various
mixtures of the two rock types.
Alluvial deposits occupy flats flanking some of the
streams and are most extensive in the limestone area.
Peat deposits are rare and are confined to small
post-glacial depressions in which the major streams generally
rise. Underlying the peat, thin clay and marl horizons are
often present indicating that the initial stages of formation
took the form of shallow post-glacial lakes which developed
into swamps with severely impeded drainage.
The drainage conditions of the soils vary with
topography and the composition of the parent material. Residual
Clare Shale soils and much of the drift on the hill slopes is

71+
moderately well drained. However, soils of poor drainage may
be found on some of the slopes where the lower horizons are of
poor permeability. This particularly applies to some of the
limestone-rich boulder-clay deposits containing a large propor-
tion of fine rock flour which retards water movement. In
topographic depressions and along some of the stream flats,
drainage is usually poor to severely impeded. This is
especially so in the case of the peaty-swamp and alluvial
deposits. Recent land improvement programmes of ploughing and
channelling have slightly improved some of the poorly drained
areas by lowering the water table.
The streams follow artificial drainage channels
where they drain the old swamps but in the upper reaches they
are incised with colluvial banks and follow their natural course.
Agriculture is mainly devoted to grazing of dairy
cattle on small holdings of 10 to 30 acres. There is some
grazing of beef cattle and stud horses but very little tillage.
The known occurrences of toxic seleniferous soils,
originally investigated by the Agricultural Institute are
located on poorly drained peaty-swamp and alluvial soils
respectively (Fig. 20, sites A and B).
2. STREAM SEDIMENT METAL PATTERNS
(i) Molybdenum
The distribution of Mo in the drainage sediments
around Flynn's Farm (Fig. 19a) shows that the highest values

(a) 21 140' • 5=0111644450
450 Mo In stream sediment (ppm)
R A 0 1 : R NOW001 soil
Glacial drift ma. NA 4.01
Alluvium
(b) Mo In soil at 18-24 111.5 (ppm) <5 5-15 :-Me***.V 15-45 >45
(c) Mo In herbage (ppm dry matter) r"---1<5 :.::••:::. 5-to 1020 >2Q
FIG. 19. DISTRIBUTION OF Mo IN STREAM SEDIMENT, SOIL AND MIXED HERBAGE AND SIMPLIFIED OVERBURDEN MAP (after Irish Geological Survey, shown in (a) )

75
occur in the headwaters of streams draining the Clare Shales.
Peak values up to 800 ppm in organic-rich sediments are
associated with peaty and alluvial seepage areas overlying or
adjacent to the Clare Shales. Anomalous values in the range
50 to 100 ppm occur in South-West Creek where the stream drains
drift and residual soils of largely Clare Shale origin.
Downstream from the metal-rich headwaters there is
a general decrease in values as the streams pass onto the
limestone. Tributary streams draining the limestone, Namurian
sandstones and siltstones in the south-west, contain only
background values of less than 2 ppm Mo.
Relatively strongly anomalous samples of greater
than 10 ppm extend about 2000 and 2300 ft. downstream from the
peak values in Flynn's and South Creek respectively. Samples
of 5 ppm or greater extend 2500 and 7000 ft. downstream
respectively in the two streams. Below the confluence of
Flynn's and South Creeks slightly anomalous values in the range
2 to 5 ppm do occur but the distribution is somewhat erratic
and the contrast with background values low.
(ii) Selenium
The distribution of Se in stream sediments is
closely related to the Mo pattern (Fig. 20a). Peak values up
to 175 ppm at toxic soil site A, occur in the headwaters of the
streams draining peaty seepage areas on or near to the Clare
Shales. Values from 5 to 20 ppm are present in the sediments

(a) Z 10 50Z$O I . .1 t I mlimlSlOllt • CIGre Shales
S. in strum Mdiment (ppm)
(II) Sf in soli It 18-Zo1m. (ppm) rvstta 1'5-5 .>15
(C) S. In ~trbaq. (ppm dry matlcr) [--""ld5 [«::':'11'5-5 W1tJ 5"15 • >;s
FIG. :W. DISTRIBUTION OF Se IX ~1'RF:A?-1 SEDL'IENT, SOIL .~~D NIXED HERBAGE 'AND GEOL\)GY (aftel' Hodson Cr Le \~arne, 1961 shO\m in (a) )

76
of South-West Creek which drains residual Clare Shale soils and
glacial drift. Downstream from the headwaters the metal content
decreases as the stream passes onto the limestone. The drainage
train is maintained at anomalous levels where the stream is
flanked by alluvial but quickly drops to local background levels
(less than 2 ppm) where alluvium is absent as in the lower
reaches of South Creek. Tributary streams draining alluvium
deposited along the main stream also tend to carry anomalous
concentrations of Se.
The mean regional background is 0.7 ppm Se but may
fluctuate as high as 2 ppm. Values in excess of 2 ppm extend
about 3 miles downstream from the peak levels at the head of
the stream but clearly anomalous values of 5 ppm or greater are
limited to about 9000 ft. from the headwaters.
It is obvious that the length of the drainage train
is determined to a large extent by the presence or absence of
flanking alluvium.
(iii) Copper
Like Mo and Se, Cu also tends to be concentrated in
the stream sediments at the headwaters of the streams draining
the Clare Shales (Fig. 21).
Values range from 50 to 100 and 80 to 200 ppm Cu in
the headwaters of Flynn's and South Creeks, respectively, and
from 40 to 150 ppm in the drainage of the alluvium near the base
of the Clare Shales on South Creek. These compare with local

cOPPER'cotT.:gNT :k ponlY-s.bt:TREANt4.E.1) • • „ • 1.-0,0101.74
FIG. 21. DISTRIBUTION OF Cu IN STREAM SEDIMENTS
AND TOPSOIL-FLYNN'S FARM AREA

77
background values in the range 15 to 60 ppm in streams draining
the limestone. Anomalous levels greater than 60 ppm do not
extend more than 2000 ft. downstream from the base of the Clare
Shales.
The influence of the Clare Shales on the metal content
of the stream sediment is readily detectable but the contrast
between background and anomalous values' is relatively low com-
pared with Se and Mo.,
(iv) Vanadium
Vanadium is also concentrated in the headwaters of
the streams rising on the Clare Shales though the contrast with
local background values is even less marked than Cu (Fig. 22).
Background levels range from about 50 to 100 ppm V whereas
anomalous samples from the headwaters of Flynn's and South Creeks
range from 100 to 300 and 100 to 500 ppm, respectively.
3. METAL PATTERNS IN THE SOILS
(i) Molybdenum
The distribution of Mo in the soil at 18-24 ins. is
shown in Fig. 19b. Topsoil samples from 0-4 ins. showed a simi-
lar pattern but with slight variations in overall metal content.
The profile distribution of Mo in different soil types is des-
cribed in Chapter VII.
It is apparent that there is a close relationship
between the Mo content of the soil and the bedrock. Most of

VANADIUM CONTENT (ppm) of STREAM SEDIMENT (a) (- 80 mesh fraction)
VANADIUM CONTENT (ppm) of TOPSOIL (0"-4") (b) so 100 200 >200
FIG.22. DISTRIBUTION OF V IN STREAM SEDIMENTS AND TOPSOIL-FLYNN'S FARM AREA

78
the extensive anomalous soil areas in the west are related to
the metal-rich glacial drift or residuum derived from the Clare
Shales. The soil patterns reflect such features as the faulted
embayment in the eastern boundary of the Clare Shales and the
area of barren Namurian rocks in the south-west corner.
The influence of the bedrock on the metal content of
the soil is modified by secondary factors, in particular the
type of overburden and the drainage. Thus, peak Mo values up
to 3000 ppm occur in the poorly drained peaty-swamp deposits over-
lying or adjacent to the Clare Shales. On the better drained
Clare Shale residuum and drift the highest values are in the
order of 70 ppm Mo. The drift soils of limestone origin in the
east mostly contain less than 2 ppm Mo.
The extension of Mo values greater than 5 ppm east
of the Clare Shales in alluvium is apparently related to the
erosion and transport of metal-rich material from the headwaters
of the main streams. Peak values of 800 ppm occur in alluvium
directly downslope from the Clare Shale boundary on South Creek
where the deposits are subject to seepage from the shales.
However, alluvium on the limestone further downstream rarely
contains more than 15 ppm Mo. Alluvium derived from tributary
streams draining barren limestone drift contain background
concentrations usually less than 2 ppm.
Molybdeniferous soils in the range 15-45 ppm Mo east
of the Clare Shale boundary mid-way between Flynn's and South
Creeks is believed to be due to the occurrence of fluvio-glacial

79
gravels containing Clare Shale fragments. This material is
not associated with the more recent alluvial deposits but was
probably formed as the result of damming during the retreat of
the ice.
(ii) Selenium
The pattern of distribution of Se in the soils
is essentially the same as that for Mo (Fig. 20b). The Clare
Shale bedrock ic major feature controlling metal distribu-
tion in the soil and drift but as with Mo, peak Se values up
to 500 ppm are found in the peaty-swamps. Most drift and resi-
dual soils on the Clare Shales contain from 1.5 to 15 ppm Se.
The occurrence of seleniferous soils on the limestone
east of the Clare Shales is closely related to the alluvial depo-
sits. Concentrations up to 90 ppm are present in the alluvial
soils flanking Flynn's Creek at toxic site B. The dispersion
of Se downstream from the metal-rich headwaters has been much
more extensive than Mo as is also shown by the length of the
present day drainage trains.
(iii) Copper
Only topsoil samples were analysed for Cu but
the distribution is basically similar to that of Mo and Se
at 18-24 inches (Fig. 21b).
The greater part of the anomalous soil patterns
(more than 50 ppm Cu) is related to the metal-rich drift and
swamp deposits overlying the Clare Shales and to alluvial

8o
deposits flanking South Creek near the base of the Clare Shales
but elsewhere anomalous values seldom exceed 150 ppm. Most of
the limestone drift soils contain local background levels of
less than 50 ppm Cu.
One noticeable deviation of Cu from the Mo and Se
patterns is the area of background values (20-50 ppm) roughly
coincident with the residual Clare Shale soils (Fig. 19a) in
the north-west. Also, slightly anomalous concentrations of
Cu (50-80 ppm) on the limestone drift broadly correspond to
areas of alkaline soils (Fig. 23). It is believed that these
variations probably represent basic differences in the secondary
dispersion mechanisms of Cu compared with Se and Mo that modify
the original bedrock patterns.
(iv) Vanadium
The distribution of V in the topsoil is also closely
related to the bedrock patterns (Fig. 22h). Levels range from
100 to 500 ppm in soils over the Clare Shales, compared with
local background values of 60 to 100 ppm over the limestone.
The peak value of 700 ppm occurs in the alluvium on South Creek
and there are some slightly anomalous concentrations of V (100-
150 ppm) vaguely related to alluvium in the east.
Unlike Mo and Se there is no marked concentration of
V in the peaty-swamp soils.

81
4, METAL PATTERNS IN THE PASTURE HERBAGE
The areal distribution of Mo, Se and Cu was determined
by analysis of oven-dried herbage. The samples were mainly grasses
with some clover. Herbs were rarely collected unless they formed
a dominant part of the pasture.
(i) Molybdenum
Broadly speaking, the patterns of Mo in herbage
show a fair degree of correlation with the Mo content of the soil
irrespective of the local variations in soil type (Fig. 19c).
Anomalous herbage patterns are related to the Clare Shale residuum
and to Mo-rich drift and alluvium.
Local background levels for herbage growing on barren
limestone drift range from 0.6 to 7.2 ppm Mo, most values lying
between 1 and 3 ppm. This is comparable with the levels indi-
cated by the regional herbage traverse (Fig. 17).
Within the anomalous zone, peak herbage values occur
on the peaty-swamps and alluvial soils flanking South Creek. On
the better drained residual Clare Shale soils and molybdeniferous
drift, the peak values range up to 74 ppm.
The extent of higher than background concentrations
of Mo in herbage growing on alluvial soils overlying limestone
is in general greater in area than the readily detectable anomalous
patterns in the soil at 18-24 inches. Profile studies (Chapter VII)
have shown that slightly higher Mo values may accumulate in the
topsoil horizons. Also these areas of anomalous herbage can often

pH of TOPSOIL (0"-4") 5.3-6.5 Slight to
moderately acid.
6.6-7-5 Neutral to slightly alkaline.
<5.2 Strongly acid.
FIG. 23. pH of TOPSOIL-FLYNN'S FARM AREA

82
be related to alkaline soils (Fig. 23). The significance of this
in the light of relative metal availability is discussed in
Chapter VIII.
(ii) Selenium
Anomalous Se concentrations are found only on the
more alkaline seepage and alluvial soils within the seleniferous
area (Fig. 20c).
The peak values of 100 ppm Se occur in herbage growing
at toxic soilhcality A at the head of Flynn's Creek. Values up
to 10 ppm are recorded from toxic area B on alluvial soils. Local
loackground levels for herbage growing on barren limestone drift
are generally 0.3 ppm or less, with a few higher values reaching
0.9 ppm on alkaline soils.
On the moderately well-drained acid seleniferous,
residual and drift soils in the west, Se levels lie within the
background range, most herbage contents recorded being less than
0.5 ppm Se. The seleniferous vegetation growing on drift
between Flynn's and South Creeks adjacent to the base of the
Clare Shales is in an area subject to seepage and the soils are
alkaline in reaction.
The seleniferous alluvial soils flanking the North-
blast greek are strongly acid (pH 4.62-4.83) and the Se content
of herbage is small (less than 0.3 ppm). Thib is in contrast
to the high levels encountered in alkaline seleniferous alluvium.
Thus, in addition to the Se content of the soil it is apparent
that other environmental factors, in particular drainage and

83
soil reaction play a part in the uptake of Se by plants.
(iii) Copper
The Cu content of herbage ranged between 5 and 14 ppm
with no obvious pattern that could be correlated with the soil
metal contents or soil type. This contrasts with the regional
herbage traverse (Fig. 17) which featured background values in
the order of 0.4-3.6 ppm with a very broad anomaly about 3 miles
in width centred on the narrower molybdeniferous zone. Peak
values in this zone ranged from 7.3 to 10.7 ppm Cu. The lack
of correlation between soil and herbage patterns in the Flynn's
Farm area, is mainly attributed to the relatively low range of
soil Cu values compared with Mo and also the influence of other
factors involved in Cu uptake by plants.
5. DISCUSSION
The distribution of Mo, Se and Cu in the Flynn's
Farm grid confirmed the broad relationship between the metal
contents of drainage sediments and the bedrock, soil and pasture
herbage of the catchment area that had been indicated by the
regional stildieS. The study of V was restricted to rock, soil
and drainage sediment relationships. However, detailed examina-
tion of the overburden patterns showed that a number of features
reflected the influence of secondary geochemical factors on the
bedrock metal contents. Most notable were the effects of over-
burden type and drainage on the accumulation of very high con-
centrations of Mo and Se in peaty-swamp soils and of Se in

84
alluvium.
The foremost feature of the herbage-soil relation-
ship is the contrast between the Mo and Se patterns in herbage.
There is some degree of correlation between the total Mo content
of the soil and of the herbage irrespective of local variations
in soil type. In contrast, Se-rich herbage is only present on
more or less alkaline, poorly-drained seleniferous soils of swamp
or alluvial origin. It would thus appear that the effects of
local environmental features (e.g. soil type, drainage, pH) are
less restrictive on the uptake of Mo by plants than Se. As a
result, correlation of stream sediment patterns with the Se
content of herbage is dependent upon the interpretation of the
influence of other environmental factors in addition to the
metal content of the soil. Further attention is given to the
factors involved in the rock-soil relationship and the uptake
of Mo and Se in Chapters VII and VIII, respectively.
With regard to the interpretation of the geochemical
patterns in the light of animal health problems it is apparent
that there are considerable areas of herbage in which the metal
levels are far above normal. In the case of Se, the occurrence
of toxic pastures at sites A and B has already been reported
(Walsh and Fleming, 1952). On the basis of a toxic threshold
level of 5 ppm in oven-dried herbage (Fleming and Walsh, 1957)
there are at least four additional seleniferous localities
that may be considered toxic. There is also evidence that

85
sub-clinical toxicity may be induced by a much lower Se intake
in the order of 1 ppm (Smith and Lillie, 1940). Contouring the
herbage content at 1.5 ppm Se indicates there may be much more
extensive toxic pastures at a sub-clinical level.
Turning to Mo, Fleming and Walsh (1957) consider
10 ppm in dry matter to be definitely toxic and 5 ppm can be
taken provisionally as a threshold level in toxic herbage
(Walsh et al, 1952). There are therefore widespread potentially
toxic pastures associated with the anomalous soils. Some
symptoms of Mo toxicity, probably in the form of Mo-induced
Cu deficiency, have been reported from Co. Limerick (Fleming
and Walsh, 1957). Assuming similar plant-soil-sediment rela-
tionships for the region as a whole, the patterns revealed by
the regional stream sediment study outline a considerable area
in which clinical or sub-clinical Mo toxicity could exist
(Fig. 8).

86
PART C
CHAPTER VI. DISTRIBUTION OF METAL IN THE CLARE SHALES
Regional studies indicated that the Clare Shale
formation, deposited in a marine black shale environment, con-
tained concentrations of Mo and Se and to a lesser extent V
and Cu, far in excess of the amounts present in the adjacent
rock types. This confirmed data by the Agricultural Institute
(Fleming and Walsh) that the Clare Shale were the primary
source of Se in the soils of Co. Limerick. This chapter
describes the distribution of metals in the parent bedrock and
their possible mode of occurrence with particular reference to
Mo, Se, Cu and V. Proposals are also advanced as to possible
reasons for the concentration of Mo, Se and some other elements
in this horizon.
Study of metal distribution in the Clare Shales is
principally based on the sampling and analysis of four strati-
graphic sections (Figs. 2 and 25). The completeness of these
sections was governed by the exposures available, the major
shortcoming being lack of coverage across the limestone-shale
contact, which is totally obscured by drift.
Work by Hodson (1954 A and B) and Hodson and Le
Warne (1961) resulted in more detailed stratigraphic defini-
tion and mapping of the Clare Shales than hitherto. Hodson
and Le Warne's sub-division of the Clare Shales into zones

87
by means of the goniatite faunas has been adopted in this thesis
as the basis for stratigraphic contrD1 of the sections sampled.
Three principal zones are recognised, namely the E (Enmorphoceras),
H (Homoceras) and R (Reticuloceras) zones, respectively.
For convenience and partly because of incomplete
exposures, the R and H zones, which are relatively narrow, have
been combined and the E2
zone has been divided into upper and
lower sections of approximately equal thickness for the calcu-
lation of composite metal contents. The basal part of the E
zone (E1) is not represented in the study area.
1. VARIATION OF METAL CONTENT WITH LITHOLOGY IN THE
CLARE SHALFS
Within the Clare Shale formation, although they are
basically described as a typical black shale sequence, variations
in lithology do occur. Sample intervals were based on readily
definable features, such as colour, pyrite content, bedding, etc.,
indicating changing conditions of sedimentation that may be
reflected in variations in the metal content.
The shales are generally very well bedded and in
thin section are seen to consist of slightly rounded quartz
grains interspersed with a varying amount of argillaceous and
carbonaceous material (Fig. 24). The amount of carbonaceous
matter is greatest in the darker coloured shales and obscures
much of the other material in the thin sections. Very fine
bedding is seen as light and dark bands representing varia-

• or 111fr -16 •
"?•• "pp • 10. • •• s; 40p ..;
• E. ; , - 4, • alp*:.• -4 git . • 0...„1. • •:, 01110 *Or-
• °P-1/01111 .. • I. • .4. 0 ih6e.
• oleo. .1644 .•`° • g. • stet*:• : '4644- " •
..ar •••• ..t4r0 • . • • .4Ir. 04. ;41 0. • r` 4gie..11P.pir
fOr .;;;;;;;• • . . .1.14
..••;" r • . • Mk ? • • ,
lmm.
Well-bedded black shale, cut perpendicular to bedding. Angular quartz fragments in a matrix of opaque carbonaceous matter,microcrystalline quartz and argillaceous material. ( Sample 2215,basal E2 Zone,
South Creek Section.)
Spongolite. Siliceous spicules of recrystallited,microgranular quartz and radiating fibrous chalcedony, in a matrix of mainly opaque carbonaceous material, microcrystalline quartz and argillaceous matter. ( Sample 2217,basal E2 Zone,
South Creek Section.)
Highly pyritic black shale. Large,opaque,granular pyrite aggregates bordered by quartz in amatrix of quartz, carbonaceous material and smaller irregular pyrite grains. ( Sample 2246 ,upper E2 Zone,
Kilco1man Section.)
FIG.24. THIN SECTIONS OF CLARE SHALES.

88
tions in the carbon content. Pyrite occurs in several forms:
(a) usually as fine cubic grains forming aggregates aligned
roughly parallel to the bedding, (b) occasionally in concre-
tionary forms up to 1 inch in diameter, and (c) as large cubes
up to -i-1,-inch in size which are generally concentrated in thin
beds. All these forms would appear to represent re-crystalli-
zation of iron sulphide during diagenesis.
The presence of carbonaceous matter and iron sul-
phides is characteristic of the reducing, anaerobic depositional
environment of black shales. The siliceous shales described are
most probably all spongolites as described in detail by Le Warne
(1961).
The metal content of the different lithological
types characteristic of the Clare Shales varies as shown in
Table 11. The different shale species have been sub-divided
into the types most readily recognised in the field. The
criteria on which the descriptions are based are the amounts
of carbonaceous matter and pyrite visable in the field speci-
mens. Samples were restricted to the Kilcolman Creek section,
in which all types are represented, in order to avoid variations
due to differing depositional environments related to location
in the sedimentary basin.
The marked concentration of Mo and Se as well as
Pb, Cu, Ni and Co in the carbonaceous and highly pyritic black
shales is in accordance with the results recorded by other
workers, in particular Kuroda and Sandell (1954), Krauskopf

Table 11: Mean Metal Content of Different Shale Types.
Kilcolman Creek Section
Type of Shale
Black Dark-grey Light-grey Black Grey Siliceous carbonaceous semi-carbonaceous carbonaceous pyritic (Spongolite)
and pyritic
No. of samples 13 7 4 4 3 .5
Mo 15 10.8 5.0 69 22 16 Se 3.2 0.8 1.4 4.2 2.3 1.3 Pb 26 24 24 36 27 10 Ga 16 34 29 24 32 5.6 V 360 245 183 217 254 365 Cu 54 76 52 288 166 45 Ti 3150 5470 7520 5160 6950 548 Ni 38 81 68 116 121 11.5 Co 10 28 39 79 6o <5 Mn 194 510 418 200 722 109 Cr 164 150 164 121 147 72 Fe203 2.9 9.1 9.1 >35 9.5 1.0
(Mean metal values are weighted for sample width and are in ppm, except Fe203 which is given as a percentage)
00 ss0

90
(1956), Goldschmidt (1957) and Tourtelot (1962). The Mo and Se
content is lowest in the grey poorly carbonaceous, non-pyritic
shales and the spongolites. Pb, Cu and Ni also follow this
trend. The spongolites are deficient in most metals particularly
Pb, Ga, Ti, Ni, Co, Mn, Cr and Fe203 but are not markedly low in
Mo, Se and Cu and, in fact, contain the highest concentrations
of V.
The results show a distinct tendency for the highest
Mo values to be associated with the iron-rich, pyritic shale.
However, the Se content would appear to be more closely related
to the amount of carbonaceous matter present since the second
highest concentration of Se (3.2 ppm Se) occurs in the black
carbonaceous shales which are relatively deficient in iron
(2.% Fe203).
The possible mechanisms by which these patterns of
metal concentration have developed are discussed later in this
chapter.
24 VERTICAL AND LATERAL DISTRIBUTION OF METAL IN THE
CLARE SHALRS
The variation in metal content between the various
stratigraphic divisions of the Clare Shale sections is given in
Table 12 and Figures 25 and 26. It is apparent that there is
no obvious stratigraphic correlation of overall metal content
between sections and insufficient complete sections are available
to establish if there are consistent vertical patterns. However,

91
certain trends, the significance of which must be doubted in view
of the limited number of sections sampled, do exist and may throw
some light on the metal assemblages to be expected both laterally
and vertically within the sedimentary basin. The dispersion
patterns of the elements relative to one another may also be
some indication of environmental conditions existing at the
time of deposition. The variation in metal content due to
lithological differences in the shales as described in the
previous section must also be taken into account.
(i) Molybdenum and Selenium
Mo and Se demonstrate a degree of co-variance
(Figs. 25, 26a and 27) when restricted stratigraphic sections
are examined, i.e. over a period of sedimentation when relatively
uniform physio-chemical conditions of deposition existed.
However, where conditions favouring concentration of Mo differ
from those for Se, corresponding variations in the ratio of
abundance between the two elements should be apparent. For
example, the abrupt change in the Mo:Se ratio that occurs near
the top of the Kilcolman basal E2 section (Fig. 25), must indi-
cate changes in the factors controlling concentration of the
elements whether they be environment (pH, Eh) or compositional
(e.g. changes in major components such as iron sulphide or
carbon, or in the supply of Se and Mo into the basin).
Although no characteristic metal contents for either
Mo or Se can be defined for any particular horizon, the following
tentative conclusions may be drawn from the data:-

SECTION ZONE METAL CONTENT PPM Mo Se Pb Ga V Cu Ti Ni Co Mn
7. Cr Fe 203
71: ft F 7 - Sr 7 sr , 7 : sr 7 : 51' 1 7 : sr i 7 : Sr 7 • Sr 1 7 51* 7 51' 7 • 51' 7 51' 7 Si' BALLAGH R * H P S- 70 1.2-14 40-60 30 -SO 150-500 : 40 -10 0 5000 -8500 IS -150 ' < 5 -40 85 -200 100- 200 8-30
M 24 3-6 43 i38 280 60 6430 43.5 .7.3-9.8 110 1 130 89 i t It
SOUTH BASAL n: ft n : 115' 11 . 115' ; II 115. j 11 e 315- n e 1.15. : n . ns. n - ns• 11 Hs. . II : ns• II e 115 - II 11 s• n 11 5- ft -to-Iso s - 25 : 7 -40 1 S -IS 700 -4000' 40-ISO 400-SOD 10-ISO 1 5 -30 65-700 0 - 500 I 3 -90 CREEK E2 M 71 15 : 20 5.9 1220 92 710 79 13 220 130 3.0
n:ft 12 12 :127' 12 127'. 12 127' 12 . 127' 12 : 127' ; 12 • 127' 12 127' 12 . 127'. 12 127' 12 127' 12 127' 12 .27'
R + H R 2-70 0-2-9-0 . 7 - SO 14 -45 40 -500 30-200 3000- 8000 50 -150 20-80 300-3000 150- 2 50 8-70 M '4 1.1 , 27 34 180 110 6190 86 ; 43 510 120 i 7.5
KILCOLMAN UPPER n:ft 11 • 71I• 11 . 71 • 11 • 71I• 11 - 78' 11 • 711' 1 11 78' t If . 71' II : 71' j 11 ! 71 • 11 76' 11 , 70' . 11 . 711'
R s - las 0-2 -30 : 12- 40 ' 1- 30 160-1500 , 35-400 700-1000 30-100 <5 -70 100- 700 70-150 1.3- 45 CREEK E2 N4 20 1.2 20 , 23 440 59 4530 68 15-16 330 120 6.2
BASAL n: ft 9 113' ' 3 113.1 9 113' 9 113' 9 . 113' 9 , 113' 5 113' 9 • 113' 9 113' 9 • 113' 9 113' : 9 113'
R 3-50 . 0.7-5.0 ! 0 - so 5 -13 150 -1000 20 -150 400-4000 7- 70 <5 -10 40-600 40-300 0.5-1•6 E2 M 12 I 3.0 20 7.3 480 42 1460 19 41-6.5 300 150 1.2
..._ n:ft 10 • 122' , 10 122' tO : 122' 10: 122' 10 . 122' 10 . 122' 10.122' 10 - 12 2' 1 10 . 122' 10 122' 10 . 122' 10 122'
R +H R 2 -120 1.5-30 /3 - 40 0-30 30 - ISO 4 0 -200 800-4000 2 0 - 200 <5-$5 1 100-9000 50-200 , 4-35
.FOY NES A1 42 5.7 26 20 255 120 3180 62 ; 24 540 100 ! 9.3
ISLAND UPPER n:ft S : 139' S • I39' 5 , 119' 5 : 136' S - 1311' 5 - 139' 5 135' 5 139' 5 139' , i 5 130' 5 139' 5 731'
; R 3-70 0.5 - 5.11 1-30 4-20 100-500 30-100 400-4000 30 - 65 <5 - 30 20-600 60 -200 1 1.3-4.0
E2 /A 17 1.5 17 13 260 64 22 75 53 12-16 ' 270 , 130 Ii 3.8
COMPOSITE n 71 75 70 79 75 71 76 71 711 ; 79 I 76 1 •, 15
(incl. 0/c R 2 - 900 0-2- 3 0 7-10 4 -SO 90 -4 000 20 -200 400-8500 7 - 2 90 <5 - 65 I 3 - 6000 5 0- 300 I 0.S- 45
samples.) M 27 2.9 22 15 365 79 24 20 54 13-20 ! 335 130 1 4.5 _
n : ft = No. of Samples : Sect ion Feet. R = Range of Values. M = Geometric Mean
TABLE 12. MINOR ELEMENT CONTENT OF THE CLARE SHALES


I 1 3 I. NIMMIENSAFiNiint
ok Ms
6790134) 3I90.(70) 4530.(73) 2275(13)
1460,(33)
(d) TITANIUM ppm
(GALLIUM) (ppm)
64
COPPER ppm (VANADIUM) (ppm)
smog 11.03001
LEAD ppm (CHROMIUM)topm)
30) 27.020) 30.020) 20,050)
(f)
■ Nomorion sediments
' 4(36) R • H Zane f .114.(1.1) 42.(S7)
Clare Shales 12011-2) UPPof E2 Zone 17,(1411.._ Ltmtstons 71 5) 12,(3) Sasat E2 Zone
(a) MOLYBDENUM ppm
(SELENIUM) (PPlo)
I
ei
14
(Metal values shown are the geometric mean content of the section Sompled.rof a mote tlettatittl definition of the sections refer to fie. 2S.)

10 01 1 Selenium (ppm)
01 1 10 Selenium (ppm)
FIG. No.27 VARIATION OF MOLYBDENUM AND SELENIUM IN CLARE SHALES
+ H Zone
100 + Ballagh.
• Kilcoiman. 0. 0.
0 Foynes. C 0 .0 >. 10 0
1
•
II •
• o •
•
•
• •
0 00
Upper E2 Zone
• Kilcolman.
• Foynes
a.
C vs• .0
Basal E2 Zone 15 10
+ South Ck.
o Kilcolman.
1
100
or%
•
++ +
• • • • • • + + o • •
• •
• 40
0
• • • 0
0 0
+ 0 0 •
+ + 0 0 0

93
(a) The basal 150 ft. or so contain a relatively
high proportion of Se to Mo compared with the upper horizons,
when the basal E2
horizon from the South Creek and Kilcolman
sections are considered. However, these sections are very close
to one another with respect to the whole basin and may only
represent a restricted area.
(b) Again referring to the basal portion of the
South Creek and Kilcolman sections, large variations in metal
content can occur laterally over a short distance, in this case
about 1 mile, within the one general horizon. This would seem
to indicate abrupt lateral changes of sedimentary environment.
(c) There is a general similarity of pattern
between the uppermost R and H horizons of the three sections
sampled. Both Mo and Se show an overall decrease as the transi-
tion to non-marine conditions is approached. Within the R and
H horizon there is also an apparent increase in the thickness
of the zone of higher metal values in each section towards the
centre of the basin, i.e. from Ballagh to Foynes. This most
probably represents a thickening of the lithological succession,
characterised by a particular metal pattern towards the deeper
central part of the basin of deposition..
(d) Plotting of Mo/Se ratios against stratigraphy
for the R and H horizons shows some correlation between sections
(Fig. 28). The increase of the ratio down the section would
indicate a decrease in the proportion of Mo precipitated as
non-marine conditions are approached. Mo/Se ratios in the lower

Namur la n. I Ratio '4/Content
541 5 10 15 20 25 30 35 40
A
• _ 4-
It
• South Ck
-- Kik& man
Foynes
UPPER Ea Zone
Vertical Stale.
120
20 30 40 10
40 feet
BASAL E2.7.03, 80
L EOENQ Etallagh Section. •
R.H Zons
Clam Shales.
STRATIGRAPHIC RELATIONSHIPS OF Mo:Se RATIOS IN THE CLARE SHALES
JIG. 2S Limestone.
(For location of sections refer Fig. 25.)

94
parts of the sections do not show any common patterns, but this
may possibly be due to inaccurate stratigraphic positioning in
the absence of a well-defined marker horizon, in contrast to
the relatively well-defined transition to non-marine sediments
which marks the top of the Clare Shales.
(e) The concentration of Mo and Se in the uppermost
R and H horizon of the Foynes Inland section is not repeated in
the Kilcolman section and is probably the result of a strictly
local change in the environment.
(ii) Other Metals
The broad distribution of the other elements determined
is given in Fig. 26 and Table 12. Some brief comments on the more
prominent features of these patterns are as follows:-
Lead (Fig. 26f): The highest concentration is pre-
sent near the basin margin at Ballagh and there is a slight
tendency to concentrate in the uppermost horizons of the Kilcolman
and Foynes sections.
Copper (Fig. 26b): Co-variance of Cut. and Mo is
shown in Fig. 29. The concentrations of Cu increases towards
the centre of the basin and there is also a trend towards con-
centration in the upper horizons of the Fo7nes and Kilcolman
sections.
Nickel and Cobalt (Fig. 26c): These elements show
identical patterns of distribution with a slight increase in
values in the Kilcolman area, intermediate between the margin

0
0 + 00
+ O 0
• •
• •
•
• •
•
•
R + H Zone
100 + BaHugh.
S Kite°Irnah. a.
o Foynes. C •
a,0
10 O
1000 10 100
Copper (ppm)
100
Upper E2 Zone
• KlIcolman.
• Foynes
10 Basal E2 Zone
+ South Ck.
O Kilcolman.
•
• o•
o • • 0
• 0 • 0
• •
0 0 0
1 10
100
1000 Copper ( ppm )
FIG.No.29. VARIATION OF MOLYBDENUM AND COPPER IN CLARE SHALES
Mol
ybde
num
(p
pm
)

05
and centre of the basin, and a well-defined increase in the upper
horizons of this section.
Vanadium (Fig. 26b): V shows some similarity to
the Mo and Se patterns, being highest in the South Creek basal
horizon and with a similar distribution in the R and H horizons.
Gallium and Titanium (Fig. 26d): These two elements
have similar patterns of distribution with a well-defined tendency
to concentrate in the upper horizons. The Foynes section near the
centre of the basin carries the lowest values. It would seem
probable that the distribution of these metals reflects the
amount of argillaceous matter in the sediments with an increase
in detrital, terrigenous material towards the margins of the
basin and in the upper horizons as the basin filled up. The
overlying non-marine rocks carry greater concentrations of Ga
and Ti than the Clare Shales or the limestone.
Manganese (Fig. 26e): The Mn pattern is poorly
defined. In the upper zone the lowest value is at the basin
margin and there is a slight trend towards enrichment in the
upper horizons compared to the lower areas. In this respect,
the distribution of Mn is generally similar to that of Cu, Ni
and Co.
Chromium (Fig. 26f): This element appears to be
more or less uniformly distributed throughout the basin.
Fe 203 (Fig. 26e): Iron tends to increase in the
upper horizons. The pattern of lateral distribution is poorly
defined. It is noticeable that Mn, Cu, Ni and Co have a similar

96
vertical trend and that the Ti and Ga patterns are also somewhat
similar. The enrichment of Mo and Se in the basal South Creek
section is accompanied by a marked decrease in the overall iron
content. This is probably due to strongly reducing conditions
which favoured the precipitation of Mo and Se, whereas Fe largely
remained in the soluble Fe++ state.
3. MODE OF OCCURRENCE OF METAL IN THE SHALES
Observations on the lithological associations of Mo
and Se as well as Cu, Ni and Co, indicate that they reach their
greatest concentrations in the more carbonaceous or pyritic shale
types. This is in line with field observations by other workers
on the distribution of metals in black shales.
In the present study, attention was also given to the
mineralogical associations involving the quantitative examination
of the relationship of Mo and Se to S, C and Fe and the analysis
of mineral fractions.
(i) Relationship Between Sulphur and Selenium
Under the reducing conditions of deposition of black
shales it is considered that the proportion of primary sulphate
minerals present would be negligible. Sulphur analyses of shale
samples should therefore reflect, in the absence of epigenetic
sulphide material, the original sulphide content, most probably
as syngenetic iron sulphide, of the sediments.

0•
• •
•• •• •
0 Os 0
•
• •
•
. 0
0
0 0 O 0
„ Upper E2 0 Kilcolman
01 1 10 100 Selenium (ppm)
FIG. No.30 VARIATION OF SULPHUR-SELENIUM IN CLARE SHALES.
•
10
1
a.
0.01
Lower limit of o0 — detection.
+ South Ck.-Basal E2 • Kilcolman- R + H.

97
Sulphur analyses indicated a sympathetic relation-
ship between S and Se in stratigraphic horizons of limited
thickness within a given section (Fig. 30). No such relation-
ship is apparent, however, in samples that are widely separated
laterally. This is believed to be due to (a) variation in the
environmental conditions of deposition leading to corresponding
variations in the proportion of the two elements precipitated,
and perhaps (b) to differences in the composition of the material
entering the basin at different points.
(ii) Relationship Between Sulphur and Molybdenum
Mo also demonstrates a considerable degree of co-
variance with S in samples from restricted thicknesses within
individual sections. For example, the relationship is well
marked in the R and H zone of the Kilcolman section but the
amounts of Mo and S in this part of the section are not related
to those in the E2 zone of the same section (Fig. 31). Samples
from the upper E2 zone of the Kilcolman section fall into two
well-defined groups in which the Mo9 S relationship is also
apparent. In each group the samples represent consecutive-
horizons. The smaller group represents the lower horixons of
the upper E2 zone and from this it would appear that moving
upwards through the Clare Shales to the R and H zone the
amount of S deposited in general, increased relative to the
amount of Mo. A similar pattern can be detected for Se.

0 0
0 0 0 — Lower limit of detection.
10
• •
• •
•
0
1 o 0
•
0
• 0 4. 00
+ 0
0-01
+South Ck. Basal E2 Zone. • Kilcolman R +H Zon e.
OKilcolman OI 0. o " " Upper E2
10 100
1000 Molybdenum (ppm)
FIG. 31. VARIATION OF SULPHUR-MOLYBDENUM
IN CLARE SHALES

98
From this it would appear that in addition to the
amount of S accumulated in the shales another factor, possibly
the amount of Mo and Se available for precipitation from the
sea water, also controls the concentration of Mo and Se in the
sediments.
(iii) Selenium and Molybdenum in Relation to Organic
Carbon
Only four analyses of organic carbon were obtained
due to difficulties of analysis*. The amount of carbon present
was determined by combustion of the sample followed by absorb-
tion of CO2 in an alkaline base after removal of interferring
compounds. The results were adjusted for C present in car-
bonates, the amounts present being negligible at 0.4-0.8 per
cent.
The results showed only a low range of organic
carbon values from 4.27 to 5.76 per cent (Table 13). The
extreme range of Mo and Se contents was not reflected in any
marked variation in C content.
This result is in line with the work of La Riche
(1959) who, working on somewhat similar types of shale from
the L. Lias of England, did not find a linear relationship
between the amounts of Mo and organic carbon in the rock. He
did show that high Mo was always associated with high C but
that a high proportion of C did not necessarily involve a
*By Messrs. Herdsman, Chemical and Analytical Laboratories, Glasgow.

99
similar concentration of Mo.
Table 13: Organic Carbon Content of Clare Shale
Samples in Relation to the Mo and Se.
Content
Sample Mo Se Organic No. (ppm) (ppm) Caron
2210 Black, carbonaceous shale, South 150 20 5.31 Creek basal E2 zone.
2215 Black, carbonaceous, pyritic shale, South Creek, basal E
2 zone. 80 13 5.44
2217 Spongolite. South Creek basal E2 zone. 10 5 4.27
2246 Highly pyritic, black carbonaceous shale. Kilcolman Upper E
2 zone. 80 3.8 ,5.76
(iv) Selenium and Molybdenum in Relation to Iron
The total iron content of the Clare Shales was
determined spectrographically and is expressed as the equivalent
Fe203. The iron contents quoted will, therefore, include detrital
iron minerals deposited in the Clare Shale basin in addition to
iron precipitated with the sediments. It is probable that the
increased iron content of the upper horizons of the Clare Shales
(Fig. 26e) reflects, either the addition of a greater proportion
of detritial iron minerals into the basin as it filled up prior
to the transition to non-marine conditions, or, increased

O • 0
4 + •
0
10 • • • 0 • 0 • • • • • • • p• + to
+ * 0 54. ++o o •
A • It • 0 • o •
0 0
Legend
O Bottogh.R•H Zone.
• South Ck. Basal E2 . 01
• Kileolman. R•H
0 Upper Er 100
0
Oa ••
Basal E2.
Foynes. R • H.
• o • •
,tt o
0• t %.
0 0
0
10 100 MOLYBDENUM (ppm)
• • 00. • • (a t .0 • • « O® sk• +
.0 5 • « + 40 O e . + • • •
0 .0 • • 0 • • 0 O 0 . 0 o •
0 CO
0
01 01 1 10 30
SELENIUM (ppm)
FIG.32. RELATIONSHIP OF MOLYBDENUM AND
SELENIUM TO IRON IN CLARE SHALES.
.. • " Upper E2.
10
zt co 0 eNi co u.
1

100
precipitation of insoluble ferric compounds under more oxidizing
conditions of deposition in the upper part of the basin.
In either event, it is apparent from the overall
distribution of iron in the stratigraphic zones of the Clare
Shales that there is no overall correlation with the Mo and Se
patterns (Fig. 26a and e). For example, the basal E2 zone in
the South Creek section, which contains the highest concentra-
tions of Mo and Se, is characterised by a low iron content.
In the Kilcolman section which represents almost the total
thickness of the Clare Shales there is also no correlation of
Fe with Mo or Se.
The poor relationship between Fe and Mo or Se
indicated by the distribution of these elements in the Clare
Shald-:Basin as a whole is confirmed in individual samples
(Fig. 32). There is a vague correlation, however, when limited
number of closely related samples from the basal zone of the
Kilcolman section are considered.
(v) Distribution of Metal in Mineral Fractions
The variations of metal content in the different
lithological groupings of the Clare Shales described earlier,
as well as the relationship established between SI Mo and Se
suggested that the metal content of shale samples would vary
between the different mineral fractions present. Bearing in
mind the generally very fine nature of most of the shale
minerals, it was apparent that the most readily separable

101
constituent that might be closely associated with the distribution
of metal in the shale was the pyrite. Accordingly, selected samples
in which pyrite grains were visible, were separated into pyritic
and carbonaceous fractions using heavy liquids as described in
Chapter II.
It was hoped that the distribution of metals between
these fractions would indicate the probable modes of occurrence
and hence the probable behaviour of the elements during weathering.
It is possible, wf course,that there will be some migration of
metal during diagenesis, as pointed out by Korolev (1958) in
studies of Mo in sediments. The recrystallized nature of the
pyrite in the shales, as coarse cubes and granular aggregates,
points to considerable diagenetic changes of this type.
The optimum size for separation was from 80 mesh
(approx. 200 microns) down to silt size (20 microns). Conse-
quently, no account can be taken of the amount of metal held in
any microscopic sulphide grains that may be present in the finer
carbonaceous fraction. However, it is believed that for the
purpose of the experiment an adequate separation was achieved.
Of the three samples examined, sample 2246 contained
the greater proportion of pyrite and gave the most satisfactory
separation. The other two samples, nos. 2215 and 2261, contained
much smaller amounts of pyrite and the pyrite fractions had,
therefore, to be bulked. Nevertheless, the results served to
confirm the distribution pattern observed in sample 2246. Details
of the separation and the results of analysis of the different
fractions are given in Tables 14 and 15, respectively.

Table 14: Separation of the Pyrite Fraction from Some Clare Shale Samples
*Amount Carbonaceous Recovered Pyrite Fraction -argillaceous
Fraction
Weight Weight Weight qo (g) (g) of sample (g) of sample
Sample Size Weight`.
Fraction after Sample
(mjer)ns) sieving (g)
!Highly pyritic, black, 100-200 carbonaceous shale. 50-100 Kilcolman Lower E2 zone 20-50
(2246) Total sample
Pyritic, black carbona- 100-200 ceous shale. South Ck. 50-100
Basal E2 zone 20-50 Total
(2215) Sample
Pyritic, grey shale 100-200 Kilcolman R and H zone 50-100
(2261) 20-50 Total sample
18.4
17.8 96.7 4.8 26.97 13.0 73.03 28.0
27.1 96.9 6.7 24.7 20.43 75.3 27'.0
25.6 94.8 4.15 16.21 21.45 83.79 73.4
70.5 95.8 15.65 22.2 54.88 77.8
18 20 30 68 63.075 92.76 0.425 0.67 62.65 99.33
58 57.1 98.4 0.675 1.18 56.4 98,82 25 24.55 98.2 0.275 1.12 24.275 98.88 17 15.47 91.0 0.32 2.06 15.15 97.93 100.0 97.1 97.1 1.2? 1.30 95.825 98.9
63.075 92.76 0.425 0.67 62.65 99.33 (Insufficient pyrite for separation into size fractions)
*To ensure complete separation a small proportion of material was lost after sieving during separation of the sample into heavy and light fractions with tetra-bromo ethane.

Table 15: The Distribution of Minor Elements in Mineral Fractions of Clare Shale
Sample 2246
Element
Analysis of
Total Sample (ppm)
PYRITE FRACTION CARBONACEOUS-ARGILLACEOUS FRACTION
Metal Content of Size Fractions Percent Held of Total Metal in Shale
Metal Content of Size Fractions Percent Held of Total Metal in Shale
100-200 Microns
50-100 Microns
20-50 Microns
Mean 100-200 Microns
50-100 Microns
20-50 Microns
Mean
Mo 35 28 28 22 26 18.8 25 36 35 32 81.2 Se 2.5 25 20 20 22 75.6 2.0 2.0 2.0 2.0 24.4 Pb 30 20 13 10 14 10.8 30 30 40 33 89.2 Sn <5 200160 160 173 >91 <5 <5 <5 <5 <9 Ga 13 <2 <2 <2 <2 <4.9 10 10 13 11 >95.1 V 130 <5 <5 <5 <5 <1.5 60 100 130 97 >98.5 Cu 160 200 160 130 163 26.4 130 130 130 130 73.7 Zn 130 130 130 100 120 28.2 100 60 100 87 71.7 Ti 1600 300 300 300 300 5.0 1300 1600 2000 1630 95 Ni 85 200 200 160 187 62 30 30 40 33 38.2 Zr <200 500 500 500 500 >42 <200 <200 <200 <200 <58 Co 30 160 130 100 130 84 <5 10 10 6-8 16 Mn 400 130 100 85 105 8.3 300 300 400 330 91.7 Cr 60 5 5 3 4.3 1.6 50 100 85 78 98.4
Fe203 15% >30% >30% >30% >30% 75.6 3.7 4.2 5.0 4.3 24.4
0

Table 15 (continued)
Semple 2215'
Element
Analysis of Total Sample (ppm)
PYRITE FRACTION CARBONACEOUS-ARGILLACECUS FRACTION
Metal Content of Size Fractions Percent Held of Total Metal in Shale
Metal Content of Size Fractions Percent
20-200 Microns
Mean 100-200 Microns
50-100 Microns
20-50 Microns
Mean Held of Total Metal in Shale
No 5 31 31 2.6 5 ' 5 13 7.7 97.4 Se 9.5 175 175 11.8 8.0 9.5 9.0 8.8 88.2
Snmrle 2261
Mo 7.4 20 20 3.5 7 10 5 7.3 96.5 Se 2.3 26 26 16.0 2.0 2.0 1.5 1.8 84.0 Pb 30 30 30 1.2 40 30 30 33.3 98.8 Sn 5 <5 <5 <1.3 5 5 5 5 >1.3 Co 16 x 3 0.2 20 20 16 18.7 99.8 V 200 10 10 0.1 160 200 160 173 99.9 Cu 85 85 85 2.5 40 50 40 43.3 97.5 Zn 100 600 600 9.2 100 85 50 78.3 90.8 Ti 3000 1300 1300 0.5 3000 3000 4000 3330 99.5 Ni 85 500 500 9.9 60 60 60 60 90.1 Zr <200 <200 <200 < 200 4: 200 <200 <200 - Co 30 300 300 19.5 13 16 20 16.3 80.5 Mn 850 600 600 1.5 600 500 500 530 98.5 Cr 160 20 20 0.2 160 130 160 150 99.8 Fe203 5.6% >30% >30% 11.5 4.7 4.4 5.0 4.7 88.4
1 'Sample 2215 - insufficient samrle for complete spectrographic analysis of the pyrite fraction. The Mo content quoted for both fractions was determined chemically and may therefore be slightly lower than the equivalent spectrographic value.

105
It is apparent from the distribution of constituent
elements in sample no. 2246 that firstly, different metals have
varying affinities for concentration in the pyrite and carbona-
ceous fractions and secondly, there are trends for the degree
of concentration to vary with grain-size, particularly with
regard to the carbonaceous fraction. The significance of this
second feature is problematical because of the possible analy-
tical error involved.
Briefly, Mo in sample 2246 is not appreciably
concentrated in either the pyritic or carbonaceous-argillaceous
fraction. On the other hand, in samples 2215 and 2261, which have
a much smaller pyrite content (0.67 and 1.3 per cent, respectively
compared with 22.2 per cent), Mo is enriched in the pyrite by a
factor of 2.7 and 4 respectively. This feature can be specu-
latively attributed to variations in the amount of pyrite
available for including Mo. Nevertheless, in view of the wide
spatial separation of the samples in the sedimentary basin the
observed enrichment is just as likely to be due to variations
in the mode of deposition in a different environment. In all
samples the bulk of the total Mo present in the shale is held
in the carbonaceous fraction. In samples 2215 and 2261, the
proportion held in the pyrite is negligible, amounting to only
a few per cent and in sample 2246 only 18.8 per cent of the
total is included in the pyritic fraction.
In sample 2246, Se is concentrated in the pyrite
by a factor of 10.8 and in the other two samples the enrichment
factor is even higher at 20 and 14,.4. In view of the low

io6
pyrite content of the latter two samples (Table 14), the amount
of Se held in the pyritic fraction relative to the total amount
of Se in the shale is low, being only 11.8 and 16 per cent,
respectively. In sample 2246 however, 75.6 per cent of the
total Se in the sample is included in the pyrite fraction. In
view of the much lower average pyrite content of the Clare Shales
as a whole (approximately less than 1.7 per cent pyrite by
calculation from sulphur analyses of the Kilcolman section),
the pattern observed in the other two samples can be taken as
being more representative of the Clare Shales. Briefly, the
bulk of the Se, similar to Mo, is apparently included in the
carbonaceous fraction.
In sample 2246, Cu is distributed in a generally
similar manner to Mo, having a slight affinity for the pyrite
fraction. This is more marked in sample 2261 which contains less
pyrite. Of the other elements, Co and Sn seem to be almost
entirely concentrated in the pyrite fraction. Zn, Ni and Zr show
a marked preference for the pyrite fraction but presumably also
have some association with the organic or argillaceous minerals.
Pb and Mn have a tendency to concentrate in the carbonaceous-
argillaceous fraction but also occur in the pyrite phase. Gal
V, Ti and Cr are strongly associated with the carbonaceous-
argillaceous fraction, presumably due to the organic affinities
of V and the association of Ga and Ti with Al in clay minerals.
Cr may be present as a detrital mineral but could also be
intimately associated with the clay minerals as it can be
reduced and precipitated in sediment as a hydroxide.

107
In sample 2261, the only marked exceptions to the
metal distribution observed in sample 2246, are Pb and Mn which
are more or less equally divided between the two fractions. The
partition of Sn in sample 2261 is somewhat anomalous and may
represent an analytical error, the values present being close
to the limit of detection of 5 ppm Sn.
With regard to the influence of grain-size, the
apparent variations in metal content are mostly within the
probable range of analytical and sampling errors, and no reliable
conclusions can be drawn from these data.
4. SUMMARY OF RESULTS
Prior to discussing the preceding data with regard
to the possible origin of abnormal concentrations of some metals
in the Clare Shales, a brief summary of the salient features of
metal distribution is given:-
(i) There is a marked concentration of Mo and Se
in the Clare Shales, a typical black carbonaceous, often pyritic,
marine shale facies. Cu and V are also concentrated in this
horizon but the contrast in metal content with the other adjacent
rock types is less marked.
(ii) The content of Pb, Ni, Co, Mn and Cr in the
Clare Shales and the overlying non-marine Namurian sediments, are
roughly similar. There is an apparent enrichment of Ga, Ti and
Fe in the Namurian rocks when they are compared with the Clare
Shales as a whole, but the contents of these metals in the upper-

108
most R and H zone of the Clare Shales is of the same order as in
the non-marine sediments. This is taken to indicate that the
depositional environment in the deeper, earlier deposited hori-
zons of the Clare Shales was not favourable to the accumulation
of Ga, Ti and Fe but, as the basin filled up, conditions favoured
their deposition prior to the transition to non-marine conditions.
This pattern is in many respects the reverse of that cf Mo and Se
which tend to reach their highest concentrations, particularly
in the central part of the shelf in the basal horizons of the
Clare Shales (ref. Fig. 26). The conditions that have given
rise to the enrichment of Fe and its associated metals in the
upper horizons of the Clare Shales and the non-marine Namurian
rocks may involve either an increased proportion of detrital
iron and clay minerals being introduced into the basin as the
transition to non-marine conditions approached, or to changes
in the physio-chemical depositional environment which encouraged
increased precipitation of these metals. In view of the fact
that the Mo and Se content also increases upwards in the Foynes
section the second alternative is preferred at this stage.
(iii) The patterns of Mo and Se distribution in
relation to the morphology of the Clare Shale basin of sedimenta-
tion are generally similar, indicating similar modes of concent-
ration in the sediments. Thf.s is also reflected in a certain
degree of co-variance between Mo and Se in individual samples.
Stratigraphically though, the relative abundance of each metal
to the other may vary.

109
Certain other metals with similar patterns of
distribution in relation to the basin may also be grouped
together. Notable examples are Ni and Co, and Ti and Ga. These
groups can also be expected to reflect similar modes of concent-
ration.
V and Cu follow Mo and Se in reaching their highest
concentrations in the basal horizon of the Clare Shales in the
South Creek section but otherwise the general patterns tend to
differ.
(iv) The highest concentrations of Mo and Se are
associated with the more carbonaceous and pyritic shales. Pb,
Cu, Ni and Co show a similar trend. V, however, does not show
a marked preference for any particular shale type and this may
be due to the association of this element with the more evenly
distributed carbonaceous'matter than with sulphide minerals.
(v) There is a rough degree of correlation between
the sulphur content of shale samples and the Mo and Se content.
The relationship is restricted to groups of samples that are
spatially located close together, usually within specific strati-
graphic horizons. It is most probable that, in the event of a
close relationship between the precipitation of sulphides and
Mo and Se in black shale the relative sulphur and metal contents
will be related to both environmental conditions of deposition
and the supply of the constituent elements into the basin.
These features will vary with the morphology of the basin
and also stratigraphically with time.

110
(vi) There is no definite correlation between the
total organic carbon content and Mo and Se in the shales but, in
view of the limited number of samples examined and the tendency
for high Mo and Se values to occur in the more carbonaceous rocks,
this factor cannot be discarded entirely as having no influence
on metal accumulation.
(vii) Any association between Mo, Se and Fe is
confused by the analytical method employed which included Fe
present in detrital minerals as well as precipitated material.
(viii) The distribution of metals in the mineral
fractions determined by the separation of pyrite from the carbon-
aceous and argillaceous rock matrix reveals groupings of various
elements depending on their affinity for concentration in either
fraction. In certain cases, these groupings consist of metals
with similar patterns of distribution in the Clare Shale basin
as a whole. For example, Ga and Ti which show a roughly similar
degree of concentration in the carbonaceous-argillaceous fraction
have similar patterns of distribution in the stratigraphic zones
of the Clare Shales. Co and Ni which are preferentially concent-
rated in the pyrite fraction to much the same degree are also
similarly distributed stratigraphically. This can be attri-
buted to similar modes of concentration for these elemente in
the sediments as well as similar behaviour during diagenesis.
With regard to Mo and Se, separation of the pyrite
fraction revealed that the bulk of the total metal content of the
shales is included in the carbonaceous-argillaceous fraction,
although Se in particular, is strongly concentrated in the

111
pyrite. Mo, on the other hand, tends to be more Equally distri-
buted between the two fractions implying an affinity for both
mineral phases.
(ix) Primary dispersion studies have shown that
the Clare Shales can be readily defined on the regional scale
as a bedrock unit in which abnormal concentrations of Mo and Se
are present compared with the adjacent rock types. However, in
the Clare Shales themselves, the distribution patterns of both metals
indicate that (a) the concentrations present are most likely to be
dependent on the local depositional environment, and (b) it is
not possible to define any characteristic horizon or area of the
Clare Shales in which peak metal levels can be expected to occur.
The occurrence of the highest Mo and Se values recorded in the
basal E2 zone of the South Creek section must be due to a favour-
able local lithology and physio-chemical conditions during
deposition because the equivalent horizon of the Kilcolman
section, situated a little over a mile away, does not contain
exceptionally high levels of Mo and Se. Similarly, the rise
in Mo and Se content in the uppermost horizon of the Foynes
section is not repeated in the Kilcolman section.
5. ORIGIN OF MOLYBDENUM AND SELENIUM IN THE CLARE SHALES
The basic geochemistry and geological occurrence
of Mo. and-Se in sedimentary rocks haVe been the subject of many
papers, in particular, good accounts for both elements are given
in Rankama and Sahama (1950), Goldschmidt (1954), Krauskopf (1955)

112
and Cannon (1964). Mo occurrences are well described by Kuroda
and Sandell (1964), La Riche (1958) and Korolev (1958); while
for Se the reader is referred to Goldschmidt (1933, 1935), Byers
et al (1938 - series of reports), Edwards and Carlos (1954),
Rosenfeld and Beath (1964) and Lakin (1961). A good general
review of the black shale environment in which the Clare Shales
have accumulated is given by Dunham (1961). Also Manheim (1961)
has described in detail a geochemical profile across the Baltic
Sea which may have many features in common with the basin in
which the Clare Shales were deposited. La Riche's work on Mo
in the L. Lias of Southern England is particularly pertinent
to the study because of its geographical proximity to the present
study area and the similar lithology.
The most detailed information on the stratigraphic
distribution of Se relates to the Western United States where
seleniferous rocks are not confined to black shales but include
normal shales, both marine and non-marine, sandstones, some which
are carbonaceous, and tuffs. It has been suggested that the
abundance of seleniferous rocks in this area is associated with
volcanic activity (Goldschmidt, 1954). Except for the tuff
occurrences in the limestone in the Co. Limerick area, there is
no evidence of a similar relationship in Ireland. Many of the
higher Se values recorded in the U.S. are in carbonaceous rocks,
generally shales but some carbonaceous sandstones in which high
Se also occurs. Very high Se values, as well as Mo, have been
recorded associated with vanadium-uranium ores in the sandstones
and siltstones.

113
Many writers have pointed out the association of Se
with sulphides, the ionic radii of S-2(1.74A°) and Se 2(1.94A°)
being so close that Se can readily enter the sulphide lattice.
The actual S:Se ratio appears to vary depending on the origin
of the sulphides but no hard and fast rule can be laid down for
this. Edwards and Carlos (1954) worked on the possibility of
using these ratios to differentiate between the origins of sul-
phide deposits. A high Se content is associated with some
sulphides of hydrothermal origin but a low Se content is not
positive evidence of sedimentary origin. In addition to the
records of high selenium concentrations in carbonaceous rocks,
vanadium-uranium ores and sulphides, excessive concentrations
have been noted in sedimentary iron and manganese ores, tuffs,
native sulphur, limonitic concretions, ferruginous sandstones,
meteorites, phosphate rock, coal deposits and very rarely, in
limestone. Of principal interest to this thesis though is the
relationship of Se concentrations to carbonaceous shales and
sedimentary pyrites.
Most data on Mo in sedimentary rocks are confined
to shales and it is generally agreed that the maximum concentra-
tions are found in thoSe with an appreciable amount of carbonaceous
material. As for Se, Mo is also associated with vanadium and
uranium-bearing sandstones and shales and is also found enriched
in some coals and phosphate deposits. It has also been found
concentrated in pyritic shales, e.g. in Wisconsin where the

ilk
pyritic shales contain 5 to 20 times as much Mo as adjacent
pyrite-free shales (Kuroda and Sandell, 1954). Normal shales,
sandstones, and limestones generally carry only minor concentra-
tions of Mo.
The recorded concentration of both Mo and Se in
carbonaceous and pyritic shales is in accordance with the patterns
observed in the Clare Shales in Co. Limerick. Various mechanisms
have been suggested for the concentration of these elements in
sedimentary rocks rich in organic matter and pyrite. Most of the
information however, concerns Mo. Because of the general associa-
tion of Mo and Se in the Clare Shales it is probable, however,
that similar mechanisms are involved and the possible modes of
concentration can be expanded to include both elements. However,
varying SeTMo ratios would suggest slight differences in mechan-
isms if it is assumed that the supply of both elements to the
basin was relatively even. The concentrating mechanisms suggested
by different writers are based on the facts that far greater
quantities of both metals have been supplied to the sea than are
at present in solution and that sea-water is apparently under-
saturated with respect to these elements (as well as many other
common metallic ions). The possible mechanisms for concentrating
Mo and Se can be summarized as follows:-
(i) Detrital accumulation.
(ii) Direct precipitation by changes in
temperature, pressure and pH.
(iii) Precipitation as sulphides.

115
(iv) Adsorption on hydrous Fe (or Mn) oxides, iron
sulphides or on organic matter.
(v) Organic processes.
Krauskopf (1956) and Korolev (1958), in particular, have fairly
recently done much work on the relative importance of these
processes. Little of the work has concerned Se, but Mo has
been extensively studied and possibly some of the conclusions
can be extended to Se as mentioned previously.
Detrital accumulation is not a viable mechanism
because of the generally low concentration of the elements in
the parent sources of the 4roded material and because of the
observed distribution of the elements with regard to lithology.
Krauskopf has proved experimentally that direct precipitation
due to physio-chemical changes would not be possible in a
natural environment with the concentrations present in sea
water.
Because of the common association of these elements
with carbonaceous and pyritic sediments, the other mechanisms seem
more feasible. Krauskopf (1956) considers that direct precipi-
tation as sulphides is questionable, "because observed concentra-
tions bear no apparent relation to the solubilities of the
sulphides". Organic deposition of metals after concentration in
living organisms is a possibility, as it is known that certain
metals can be concentrated in particular organisms. However,
Krauskopf does not consider this to be an adequate mechanism for
Mo, although it is a possibility for some other elements.

116
Most workers consider adsorption the most feasible
means of concentration in organic and sulphide-rich sediments.
In brief, because of their association with organic-rich and
pyritic sediments, adsorption on organic matter and iron hydro-
xides or sulphides is the most widely accepted mechanism.
Because of the varied association of Mo and Se with both carbon-
aceous and pyritic fractions in the shale specimens examined in
Co. Limerick, it is possible that adsorption on both organic
and iron material must be considered possible. Nevertheless,
the very different hypothesis put forward by Korolev (1958) with
regard to Mo, is considered particularly reasonable and could
well explain the occurrence of metal in the Clare Shales. Very
briefly, Korolev considers that the preponderance of Mo asso-
ciations with organic substances does not indicate that the organic
material itself adsorbed the metal. Instead, he has shown
experimentally that Mo is co-precipitated with iron sulphides
from solutions approximating to natural waters. Most of the Mo
is concentrated in melnikovite in the form of a sorbed sulphide
compound. During aging of the sulphide to pyrite, migration may
take place so that all the Mo does not occur in the more coarsely
crystalline forms. The sequence of mineralisation is hydro-
troilite (FeS.n H20)
melnikovite (FeS2) > pyrite.
With regard to Se, in view of its close relationship with Mo
in the Clare Shales, the writer proposes that Se may follow a
similar sequence of concentration. However, because of their

117
similar ionic radii, Se may substitute for S ions in the lattice
of the sulphide species precipitated, in addition to adsorption.
This is in line with the slightly greater affinity shown by Se
compared with Mo for the pyrite fraction in the shales (Table 15).
The reducing environment that existed in the basin during the
deposition of the black shales will of course, facilitate the
accumulation of organic matter in addition to the precipitation
of iron sulphide minerals. Larskaya (1961), working on bitumi-
nous Mezozoic sediments, demonstrated a connection between
organic matter content and authigenic Fe and S minerals. He
believed that the reducing conditions that gave rise to the
accumulation of organic matter also favoured the precipitation
of iron in the argillaceous sediments. This would explain the
characteristically carbonaceous nature of black shales
associated with the concentration of Mo and Se in Co. Limerick.
Any study of the present day distribution of metal
in the Clare Shales must of course take aconnnt of possible
diagenetic changes. Assuming that the sulphide content of the
shales was originally in the form of fine precipitates containing
Mo and Se e.g. hydro-troilite as described by Korolev, it is
apparent that considerable migration of iron sulphide has taken
place to produce the coarse cubic and aggregated forms of pyrite
present in the shales today. Metals, such as Mo and Se included
in the original sulphides, may, of course, have different mobilities
relative to the iron sulphides and to one another during recrystal-
lization. For example, the retention of most of the ready

n8
substitute Se for S in the pyrite lattice but only partial
retention of the Mo would explain the greater proportion of
Se in the pyrite fraction of the present-day shales. When the
iron sulphides recrystallized to form coarse pyrite, Mo on the
other hand, may have found a substitute host mineral in the
carbonaceous and ar,illaceous material of the shale matrix.
In view of the negligible concentrations of Mo and
Se in the overlying Namurian sediments deposited in the same
basin, there is no evidence to suggest that abnormal concentra-
tions of either metal were present in the sea water at the time
of deposition of the Clare Shales. This was suggested by La
Riche (1959) for the concentration of Mo in the generally similar
L. Lias shales of England. Concentration of Mo and Se was
therefore affected by abnormal physio-chemical conditions of
black shale deposition rather than excessive concentrations in
the sea water.
Briefly, with regard to the accumulation of other
minerals, it has been shown that only V and Cu in addition to
Mo and Se, are preferentially concentrated in the Clare Shales
compared with the argillaceous non-marine Namurian sediment
(Fig. 13). Thus the abnormal depositional environment of the
Clare Shale basin favoured the concentration of these elements
only, all the others studied being just as readily deposited
under relatively normal sedimentary conditions.

119
CHAPTER VII. DISTRIBUTION OF METAL IN OVERBURDEN
Previous chapters (IV and V) have given a broad
description of the areal extent of Mo and Se in the secondary
soil and drift environments. This chapter is concerned with the
more detailed description of the geochemical patterns in the
various soil and overburden types and the factors involved in
metal dispersion.
Under the influence of weathering agencies the
bedrock metal patterns are modified in the overburden by the
redistribution of Mo and Se as soluble or insoluble weathering
products. Soluble material may be removed in ground or surface
drainage and in certain cases be selectively re-deposited because
of environmental changes. Physical factors may involve the
transport of solid rock material or insoluble weathering pro-
ducts and again the material may be subsequently re-deposited
or removed from the area altogether in suspension or as stream
sediment. Biological factors, in particular the uptake of
metal by herbage, may halt or modify dispersion.
1. RESIDUAL SOILS
Residual soils are relatively restricted in the
area compared to the widespread occurrence of glacial drift.
The exception is the ground underlain by Namurian rocks in the
south-west beyond the terminal moraine of the Weichsel glacia-
tion (Fig. 12). Elsewhere, residual soils are generally confined

120
to those hillsides on which drift was never deposited or has
since been removed by erosion.
(i) Distribution of Metal in the Soil Profiles
(a) Molybdenum and Selenium
The distribution of Mo and Se in residual soils was
examined by analysis of selected profiles of soils developed on
each of the major rock types (Table 16). The profile formed
from metal-rich Clare Shales was taken from the extreme west
of the Flynn's Farm area (Fig. 18-BP27). Profiles on other
rock types were sited well away from any possible influence
of metal-rich drift. Only freely-drained soils could be rep-
resented because of the widespread nature of drift and peat
deposits.
Clare Shale Residuum
Under free-drainage conditions the soil developed
on Clare Shales (BF 27) shows a well marked increase in Mo
content with depth. Se follows a similar pattern but with
less contrast between the highest and lowest values.
There is a well-marked association between the
acid-soluble iron content of the profile and the Mo and Se
contents but organic carbon, which is enriched in the surface
horizons only, cannot be correlated with the Mo and Se patterns.
The pH of the soil increases down the profile. In view of the

Table 16: Distribution of Molybdenum and Selenium in Residual
Soil Profiles
Sample Depth No. (ins) Soil Description
Metal Content of -80 mesh fraction Mo Se C Fe pH Mo (ppm) (ppm) (0 (2,) Se
1. Well-drained soil developed on Clare Shales (Hole No. BP 27)
(2479) 0-4 Dark grey, organic, sandy loam (2480) 4-7 Dark grey, organic, sandy loam (2481) 7-14 Dark grey sandy loam with black shale
fragments (2482) 14-20 Grey sandy and clayey loam with semi-
decomposed shales (2483) 20-27 Grey sandy clays with black shale
fragments (2484) 27 Clare Shale bedrock (nearby shale
outcrop analysis)
5 2.3 6.27 0.4 4.68 2.2 7 3.2 8.o 1.8 4.86 2.2
18 5.0 3.8 3.2 5.35 3.6
15 3.2 2.9 3.0 5.68 4.7
25 5.5 2.9 3.6 5.54 4.5
3 0.8 - - - 3.75
2. Well-drained soil developed on limestone Hole No. BP 1)
(2002) 0-4 Medium brown, humic silty-clay loam <2 0.8 3.34 2.0 (2003) 4-8 Medium brown, silty-clay loam <2 0.8 1.8 2.2 (2004) 8-12 Brown clayey loam <2 0.8 1.03 2.3 - (2005) 12-15 Loamy clay <2 0.5 0.53 2.4 - (2001) 15 Limestone bedrock (nearby limestone
outcrop) <2 0.5 -

Table 16 (continued)
Metal Content of -80 mesh fraction
Sample Depth Soil Description ho Se C Fe pH Mo
No. (ins) (ppm) (ppm) (%) (%) Se
3. Moderately-drained soil developed on Namurian rocks (Hole No. BP 17)
(2401) 0-4 Dark brown, highly organic loam <2 4.5 6.6 2.7 (2402) 4-10 Mixed organic loam and yellow-brown
sandy clay <2 2.0 3.24 3.6 - (2403) 10-18 Yellow-brown clayey sand with decomposed
siltstone fragments <2 2.3 1.56 5.6 (2404) 18-30 Yellow-brown sandy clay with sandstone
and siltstone fragments <2 2.3 1.27 4.8 - 30 Namurian bedrock - no outcrop
(Average Namurian rocks) <2 0.16 - - - -
4. Well-drained soil developed on Namurian siltstones (Hole No. BP 108)
(4171) 0-7 Grey-brown silty loam <2 1.3 - - - (4172) 7-14 Mottled yellow-brown clays and
decomposed siltstone fragments <2 1.3 - - - - (4173) 14-24 Red-brown sandy clay with siltstone
fragments <2 1.1 - _ - - 24 Siltstone bedrock (nearby siltstone
outcrop) <2 0.5 - _ _ -
-ou• u Jam venue. a au-, - AL— •

Metal Content of -80 mesh fraction
pH Mo
Se Soil Description Sample Depth
No. (ins) 1
No Se C Fe (ppm) (ppm) (%) (c-:)
i ii, 5. Well-drained soil developed on Old Red
Sandstone (Hole No. BP 16)
0-2 Dark brown, peaty loam <2 0.2 2-7 Light grey silty leached sand <2 <0.2 7-13 Pink silty sand and siltstone pebbles <2 <0.2 13-19 Deep pink " SI SI II <2 <0.2 19-24 Red siltstone and sandstone fragments,
fine sand matrix <2 <0.2 24-36 Weathered red sandstone and siltstone <2 <0.2 36 Red siltstone bedrock <2 0.1
I
I (2394) 1 (2395) (2396)
1 (2397)
I
(2398)
2399)
Table 16 (continued)

124
low metal content of the nearby Clare Shale outcrop (3 ppm Mo,
0.8 ppm Se) and of undecomposed shale fragments from the basal,
horizon of the profile (2 ppm Mo, 0.3 ppm Se, 1.1% Fe203), the
trend for metal to be enriched in depth in the profile is
probably due to leaching of Mo and Se from the upper horizons
or from metal-rich soils upslope followed by accumulation with
iron oxides that precipitate in the less acid lower horizons.
Groundwaters from a nearby, less well-drained Clare Shale profile
contain 7.5 and 1.0 ppb Mo and Se, respectively.
The Mo:Se ratio also increases down the profile
indicating that Mo is preferentially retained in the lower
horizons. Se, which is only enriched in the lower horizons by
a factor of about 2 compared with topsoil (enrichment factor
for Mo is 5), varies less through the profile as a whole. It
may be that the enrichment of organic carbon in the upper
horizons plays a part in modifying the Se pattern and, in view
of evidence proving the affinity of Se for organic matter given
later in this thesis, it is most probable that this is the case.
Mo on the other hand, is not affected by the higher concentrations
of organic carbon in the upper horizons.
The mechanisms by which concentration of Mo has
taken place along with iron in the lower horizons of the profile,
can be explained by co-precipitation of the soluble molybdate
(M004 ) ion with ferric oxides as described by Jones (1956) or
by adsorption of molybdate on previously precipitated iron

125
oxides (Jones, 1957). Se derived from weathering of the Clare
Shales is probably present in groundwaters as the readily soluble
selenate (Se04=) ion or the slightly soluble selenite (Se03 ).
Reference to the stability field diagram of the common ionic
forms of Se (Figs. 41 and 42) shows that the pH-Eh environment
of groundwater taken from borehole BP 106 nearby to BP 27 falls
close to the equilibrium boundary between the selenite and
selenate forms; the actual values for BP 106 were pH 5.4, Eh
+0.535V, 1.0 ppb Se. It has been shown by Williams and Byers
(1936) that in the presence of ferric ions, dilute solutions
of selenites form a very insoluble precipitate that approximates
to the composition of basic ferric selenite (Fe2(OH)4 Se03),
and Byers et al (1935, 1936, 1938) give numerous examples of
the association of Se with ferruginous precipitates. The
accumulation of Se in the lower horizons of the residual soil
profile could, therefore, be due to a generally similar process
to that which has given rise to the concentration of Mo. The
formation of secondary iron oxides that have played such a
large part in the accumulation of both metals can be attributed
to the precipitation of insoluble ferric oxides, derived from
the oxidation of pyrite in the Clare Shales. With regard to
the possible modifying influence of organic carbon in the top-
soil horizons on the Se pattern, this is most likely due to
adsorption on organic material. Accumulation of Se in the
topsoil cannot be attributed to the decay of seleniferous
vegetation in situ as pasture herbage growing on the site does

126
not contain detectable amounts of Se (i.e. less than 0.2 ppm).
Molybdenum in Residual Profiles Over Other Rock Types
Profiles developed over the other rock types contain
very much lower amounts of metal, which for Mo are below the
limit of detection. Consequently, nothing can be said about
the behaviour of Mo in these environments but it is apparent
that background Mo levels of less than 2 ppm in the bedrock are
not modified to any appreciable extent by enrichment processes
during soil formation. Se patterns are however, detectable.
Selenium in Limestone Residuum
In the limestone soil profile (Table 16, BP 1)
the Se content decreases slightly in the basal clayey horizon
but this may be due to analytical error at the low levels of
concentration involved. It is just possible however, that the
higher Se level in the overlying horizons is associated with the
greater organic carbon content. The range of iron values is low
but points to a general increase downwards in the same manner as
the profile developed on the Clare Shales. The low Se content
of the limestone bedrock (0.5 ppm) indicates that no enrichment
takes place in the soils.
Selenium in Namurian Sandstone and Siltstone Residuum
The profiles developed on Namurian rocks (BP 17 and
BP 108) both show slight enrichment of Se in the upper horizons.

127
The increase is most marked in the least well-drained profile
(BP 17) and the high value of 4.5 ppm Se in the topsoil can best
be related to adsorption on organic matter accumulated in this
horizon. There is no relationship between Se content and the
distribution of iron. As in the case of the residual Clare
Shale profile, the metal content of pasture herbage at this
site is negligible and adsorption would therefore appear to be
from Se in soil water. The Namurian bedrock was not exposed
at this site but as regional rock sampling revealed that the
Se content of the Namurian sediments ranged from 0.1 to 0.5 ppm
it is apparent that a considerable degree of enrichment takes
place in the organic topsoil horizon but not in depth.
The other soil profile developed on the Namurian
rocks (BP 108) has formed under much better drainage conditions
without excessive organic matter in the topsoil. In line with
the less organic nature of this soil the amount of enrichment
of Se in the profile is small (1.2 ppm Se compared with 0.5 ppm
in shales collected from a nearby quarry).
Selenium in Old Red Sandstone Residuum
Except for the organic-rich, almost peaty topsoil
horizon of the residual soil developed on the Old Red Sandstone,
the Se content of the profile falls below the limit of detection.
Comparison of the Se content of the topsoil (0.2 ppm) with that of
bedrock adjacent to the profile site (o.1 ppm) indicates negligible
enrichment.

128
(b) Other Metals
Profile data for a number of the other elements is
given in Table 17. In addition, information on the SO4 and P
content is presented because of the possible association of
these factors with Mo in nutrition. The As content of these
soils has also been determined.
Considering the Clare Shale profile (BP 27), the
overall contents of Pb, Ga, V, Cu, Ti, Cr and Ag tend to be
higher in the soil compared to the amounts present in the bed-
rock. To this extent they follow the patterns of Mo, Se and Fe
already described. On the other hand, there is no significant
concentration of Zn, Ni, Co and Mn and it can be assumed that
these metals are more mobile under the acid conditions of soil
formation from Clare Shales. With the exception of Ag, the
vertical vayiation of metals in the profile is not so well
marked as for Mo and Se. There is some evidence that Pb, Ga,
V, Cu, Ni, P and As are slightly enriched in the lower horizons.
Enrichment of Ag in the lower horizons is well marked and the
concentration of 1.3 ppm is notable compared to the content of
<0.2 ppm in most soil, rock and sediment samples from the area.
Sulphate was only determined in the topsoil because of analytical
interference by excessive concentrations of iron in the lower
horims.
With regard to residual soils developed over lime-
stone, Old Red Sandstone and Namurian rocks, it is apparent that
few elements vary greatly through the profile.

Table 17: Metal Content of Residual Soil Profiles
(-80 mesh fraction)
Depth (ins) Pb Ga V Cu Zn Ti Ni Co Mn Cr
SO4 ppm
P ppm
Fe203
H W %JD
Limestone (BP 1) (Samples 2002-2005)
4000 4000 5000 4000
600
6o 6o 6o 85
5
16 16 20 20
<5
600 600 400 400
10o
6o 60 85 85
5
3000 3500 2500 2000
<100
200 200 120 120
200
6 6 5 6
0.3
0-4 4o 4-8 40 8-12 30 12-15 3o Bedrock (2001) 5
lo 85 4o 8 6o 3o 6 6o 4o 8 85 5o
<2 4o 3
loo 130 85 85
<50
Clare Shale (BP 27) (Sam les 2479-2483)
4000 4000 3000 3000 3000 2000
lo 13 3o 20 30 30
<5 I; 19
;r li
<5
85 loo 100
100 100 130
300 600 1000
850 500 300
1250 - - - - -
2500 4000 3000 6000 5000 -
6.o 6.o 6.6 6.o 13.0 1.1
0-4 4o 4-7 4o 7-14 6o 14-20 50 20-27 6o Bedrock 20
16 Soo 20 3o 85o 3o 3o 1300 4o 3o 85o 4o 3o 1000 3o 13 400 16
5o <50 5o <50 5o 50
Namurian (BP 17) (Samples 2401-2404)
35 35 38 38
6000 6000 10000 85oo
5910
13 16 3o 3o
52.7
10 10 13 13
21.9
400 300 400 300
325
loo 35 loo 85
111
- 1000 1000 500
48-1300
160 300 200 1000
200
8 6 20 10
7.5
0-4 20 4-10 8 10-18 10 18-30 8 Bedrock
16.6 (averse)
16 loo 6o 16 85 6o 20 100 6o 16 85 5o
20.7 81.3 26.7

Table 17 (contined)
Depth (ins)
Pb Ga V Cu Zn Ti Ni Co Mn Cr SO4 ;ppm ok
-Ppm P Fe 0
c.2 3 ppm /0
Old Red Sandstone (BP 16) (Samples 2394-2400)
0-2 13 6 3o 8 <5o 6000 20 5 130 40 1.3 2,7 8 6 3o 6 <5o 8500 lo <5 20 6o 1.0 7-13 8 8 5o 3o <5o 850o 16 <5 3o loo 2.0 13-19 8 8 5o 16 <5o 6000 16 <5 85 6o 3.0 19-24 4o lo 85 4o loo 6000 4o 10 300 100 8.o 24-36 20 8 5o 4o 5o 5000 3o 16 300 6o 6.o Bedrock 7 3o 7o lo <50 7000 4o 15 700 So 6.o
Carbonate Arsenic
Silver
- not detectable in all samples, CO.,` = <0.1% - only detectable (i.e. >5 ppm) in basal-7horizons of limestone and Clare Shale soils, i.e. B BP 1 12-15 ins 7 ppm As, BP 27 20-27 ins 7 ppm As.
- only detected (i.e. >0.2 ppm) in Clare Shale soil profile (BP 27)
0-4 ins 0.2 ppm 14-20 ins 0.8 ppm
4-7 ins 0.5 ppm 20-27 ins 1.3 ppm
7-14 ins 0.8 ppm Bedrock
<0.2 ppm

131
The pattern of distribution in the limestone profile
would seem to result simply from the removal of CaCO3 by chemical
weathering resulting in the more or less uniform concentration of
the other elements which are immobile under alkaline conditions
of soil formation. Most elements appear to have been concentrated
in the order of 5-10 times during the transition from limestone
to soil. The obvious exceptions to this are V and to a lesser
extent Zn which are presumably at least partly mobile under these
conditions. In a similar fashion Mo and Se which can form
soluble basic salts under alkaline weathering conditions would
also migrate. Organic matter in the topsoil does not appear
to h-ve influenced the patterns.
The soil profile on Namurian rocks is not distin-
guished by any well-marked variation in the amount of metal
between horizons. Pb is concentrated by a factor of two in
the peaty topsoil and the basal horizon is enriched in P. Ni
is impoverished in the upper horizons by a significant factor
of two. The bedrock from which the profile developed was not
exposed but comparison of the overall metal content of the
profile with the average composition of the Namurian sediments
indicates that the metal contents of the soil closely reflect
those of the bedrock. Compared with the marked enrichment
of most metals in the limestone soils, it. is probable that
the more uniform distribution of metals between rocks and soils
of Namurian origin reflects the dominantly mechanical weathering

132
of arenaceous and argillaceous sediments in contrast to the
more chemical nature of limestone weathering.
The profile developed from a sandy-siltstone facies
of the Old Red Sandstone shows a slight enrichment of Pb, Cu
and Zn in the basal horizons of the soil compared with the bed—
rock. Ga and Mn on the other hand are significantly lower in
the basal soil horizons than in the parent bedrock. Vertical
patterns in the profile show a general increase of most metals,
with the exception of Ti and possibly Cr, towards the base of
the profile. It is most probable that the concentration of
metal is associated with the conspicuous accumulation of iron
oxides in the lower soil horizons. The peaty topsoil is marked
by an increase in the concentration of Pb, Ni, Mn and possibly
Co.
(ii) Size Analysis of Residual Soil Samples
Size analysis was carried out on four selected
samples, two from the anomalous profile developed on Clare
Shale bedrock (BP 27) and one each from background limestone
(BP 1) and Namurian soil (BP 17) profiles. The mechanical
composition and the Mo and Se contents of the different size
fractions are shown in Fig. 33. Details of some other elements
are given in Table 18. Organic matter and secondary iron oxides
were not destroyed prior to separating the finer fractions as
this would have led to leaching of Mo, Se and other metals.

Size Fractions. A 2mm - 20mesh. B 20mesh-38 rr C 38 ^ - 80 D 80 -125 E 125 -200 if F 200 - 0.02 mm G Silt and Clay
E F G C D
0-
0
Limit of 4 Total Fe —detectionloW:
Mo
Fe r-
4-
-5.0
4.5
E a. a.
•
C ti
O
as
/1-, ofi •
40
PSe
—3
Se ..-* • AcidSolFe. •
40
4 2 •\ a. t a. / . e is. I ;,co
11...., ..
_ . cs / I •---•-- -5.. --
.c. _a' m
1:.i'- o
0._._.- f..........+.........+.........4.
.............+1- al
4 - D .. 0 o (I) A B C D E F G (ii) A B C D E F G
Topsoil.(0 -4 ins.Sample24799E3P27.) C horizon( 20-27ins. 2483• BR27 )
Well-drained, Residual Clare Shale Soil.
4 -8 ins. Sample 2003,BR1. 10-18 ins. Sample 2403,BR17.
Residual Limestone Soil. Residual Namurian Soil.
FIG.No• 33. SIZE ANALYSIS OF RESIDUAL SOILS.

133
Mineral aggregates cemented by these constituents will,
therefore, be included in the coarser fractions. Consequently
the size analysis obtained is not an accurate representation
of the true mechanical composition of the sample.,
(a) Molybdenum and Selenium
Size analysis of the two samples from the topsoil
and C horizon of the metal-rich profile developed on the Clare
Shales (samples 2479 and 2483, Fig. 33) indicated a high propor-
tion of coarse sand (particles greater than 0.2 mm in diameter,
i.e. plus 80 mesh) in these samples. This is believed to be
due to the gravelly nature of the soils formed from the
siliceous, platy shale bedrock but also includes undispersed
organic aggregates as shown by the relatively high organic
carbon content of the coarser fractions in the C horizon.
There are marked differences in the metal patterns
developed in the two samples. In the C horizon both Se and
Mo are concentrated in the fine fractions, whereas in the
topsoil the concentration of Se in the fine fractions is much
less marked and the distribution of Mo is more or less even.
In the C horizon it is apparent that there is a very close
correlation between the Se, Mo and acid-soluble iron; total
Fe203 and organic carbon also follow the same general trend.
The relationship between Se, Mo and acid-soluble iron was
expected because of the similar patterns of these elements

134
in the profile as a whole. The correlation of organic carbon
contents with Mot Se and Fe is probably due to the mode of
occurrence of this material. Organic carbon has presumably
been introduced into the C horizon by the washing down of
fine particles of organic matter from the topsoil which have
accumulated in the finer fractions. It is not possible to
determine how much the organic carbon content influences the
distribution pattern of Se although it has already been suggested
that organic carbon may accumulate Se in the topsoil of the
profile. The total Fe203
content, determined spectrographically,
reflects the pattern of distribution of acid soluble Fe but the
concentrations det•rmined are greater by a factor of about two
to three. It would appear that the pattern of Mo and Se in the
C horizon is principally controlled by the concentration of iron
oxides in the finer fractions.
In the topsoil the relatively even spread of both
Mo and Se is reflected in the distribution of total Fe203.
Acid-soluble iron and organic carbon were unfortunately not
determined. However, in view of the correlation between total
Fe203 and the other elements in the C horizon the even distri-
bution of metal between fractions is probably related to the
relatively consistent levels of iron and organic carbon. The
latter results are probably due to the formation of undis-
persed mineral aggregates bound together by organic matter
and secondary iron oxides.

135
In the limestone soil (2003) Mo was only detectable
in some of the fractions but showed a definite tendency to
concentrate with Fe203
in the -80 mesh fraction, i.e. fine
sand, silt and clay. Se was also concentrated in the finer
fractions.
Mo was not detectable in the Namurian soil sample
(2403). The distribution of Se in this sample shows the metal
concentrated in both the coarsest and finest size ranges.
This is difficult to explain but, in view of the lack of
correlation with the Fe203 pattern, it is provisionally
attributed to the association of Se with organic matter as
shown by the profile studies.
(b) Other Metals
The degree of variation in the distribution of
other metals in the different size fractions is not as well
marked as in the case of Mo and Se (Table 18). In the lime-
stone soil, most elements with the exception of Mn and Co
are slightly concentrated in the fine fractions, but
essentially no consistent trends are evident in the data for
soils derived from other rocks.
2. TRANSPORTED OVERBURDEN
Glacial drift covers by far the greater part of
the area but some other types of transported overburden, in
particular colluvial and lacustrine accumulations in swampy

Table 18: Distribution of Other Metals in Size Fractions of
Residual Soils (Metal content in ppm)
Profile BP 27 Well-drained
A
SIZE FRACTIONS*
Pb Ga v Cu Ti Ni co Mn Cr
15 10 300 8 3000 10 <5 70 300
4o 15 300 10 3000 10 <5 70 400
3o 12 300 10 3000 10 <5 70 250
4o 15 400 10 4000 20 <5 80 300
20 12 400 10 4000 20 <5 70 250
15 8 300 lo 4000 10 <5 70 250
15 8 200 15 3000 10 <5 70 200
topsoil (0-4 ins) developed on Clare Shales (Sample 2479)
Profile BP 27 C Horizon
Pb Ga V cu Ti Ni co Mn Cr
30 20 700 3o 4000 30 <5 8o 400
20 18 700 3o 4000 30 <5 80 400
4o 20 700 20 4000 30 <5 150 500
5o 20 800 30 3000 30 <5 150 500
6o 25 500 40 2000 30 <5 150 600
7o 20 600 4o 3000 20 <5 150 500
6o 12 500 30 3000 20 <5 100 500
(20-27 ins) of Clare Shale
soil (Sample 2483)

Table 18 (continued)
Profile BP 1 Limestone Soil
SIZE FRACTIONS*
Pb Ga V Cu Ti Ni
15 5 20 3o 2000 50
10 5 30 20 1000 50
10 4 30 30 1500 4o
40 4 10 20 Soo 30
3o 5 15 15 1000 4o
3o 5 30 20 4000 30
4o 18 So 4o 6000 7o
(4-8 ins) (Sample 2003)
Co 10 15 15 10 30 15 20 Mn 600 600 600 1000 Soo 700 700 Cr 50 50 50 30 40 70 100 Zn <50 <50 <50 50 <50 50 200
Pb 10 7 lo 3 8 15 15 Ga 20 15 15 15 15 15 30
Profile BP 17 Namurian Soil V 70 50 60 50 6o 6o 7o Cu 30 20 20 20 30 30 30
(10-18 ins) (Sample 2403) Ti 7000 5000 6000 4000 7000 Soo° 8000 Ni 4o 20 30 30 30 30 30 Co 15 5 15 lo lo 10 15 Mn 300 200 300 150 400 250 400 Cr 70 63 70 60 8o 100 120 Zn 1 70 70 70 50 50 50 70
* A = 2 mm (=10 mesh) -20 mesh C = 33 mesh -80 mesh B = 20 mesh -38 mesh D = 30 mesh -125 mesh
E = 125 mesh -200 mesh F = -200 mesh -0.02 mm G = Silt and Clay
(-0.02 mm)

138
depressions and valley alluvium, although of limited extent, are
of special importance because of their association with toxic Se
occurrences.
(i) Colluvium
Colluvial deposits are rare in the area. A limited
occurrence of material of this origin is present on the slope
flanking the southern edge of the swamp deposits of Flynn's
Farm (Figs. 18 and 34) and consists of mixed limestone and
Clare Shale detritus derived from the combined action of hill-
wash and gravity creep from adjacent drift and sub-outcropping
Clare Shales. The areal extent of the colluvial material is
poorly defined and these deposits combine features of both
residual and drift profiles.
Briefly, the Mo and Se patterns in the colluvial
profiles BP 8 and BP 50 (Fig. 34) are similar to the residual
Clare Shale profiles in showing a general increase in metal
content down the profile accompanied by some enrichment in the
topsoil. In BP 8 however, the Se content does not increase
down the profile along with Mo and also the iron content of
the profile is the reverse of that in Clare Shale residuum
(decreasing from 6% Fe203 in the upper horizons to a mean
value of 2.5% Fe203
in the Mo-rich basal horizons). For this
reason it is believed that the metal patterns reflect the high
metal content of unweathered Clare Shale rather than accumula-

7.5
Eh and pH of Ground Water. **.
- ---• +0•4
03- 1 pH 70 + + „• ..... -.6'.. • -----
6,5 • -------- -
PA. y 250
2 250
c, 360
•••••
70 0 airy N 0
a.00/ •rasefr mart
125 70 \ bS. ••••
•".*' . \ 4 56 40 ,i)",747.a47 4./0/ pave/ /
6 VERTICAL SCALE 20 inches to 1 inch.
TOPO.and HORIZONTAL SCALE 40 feet to 1 inch.
1430 Soil metal content-ppm.
NORTH-SOUTH VERTICAL SECTION ACROSS SOUTH MARGIN OF PEATY SWAMP AREA. -FLYNN'S FARM-
Showing Metal Content of Soils Developed under Varying Drainage Conditions from Severe Impedence at Left to Free Drainage on Right of Section.
(Mo content of peaty samples has been adjusted for loss of material on ignition prior to analysis.)
175
490
• 1# 74 Ab0Y. a
BP 3 Se Z Mo 5. 50'
I 317; ------- et. 800 5 5
1 1100 ,•-• 5 /3441.
2000
./ 7250
200
-1;; a
\ 0
B Se100.
P
O
e'r*1Y 5/5 8007
800 - 200 _5_
Y
•
0
&NOBPV°
38
_ \
spa so 150 k.
1500 .7 125
r ""7 37.6%
18
0
0 /
\ o\ 100 / ,
of,z354 rave/ q d.o
•
s • • ep tai
1 1.9.5
160 --1 /I , 05 S r--lib/ •
• 1.5
30
6
Se102. 30 it, 047, .12
•--__
13 0 5.5
k. •
0 / 30
16 s'•
3 0
??' • 63
•
Se 50.
z ----- b At eAfg. e
28 Q.7?"1",.. 0Va:yeS -lo'/X•170.0??5.5 4;1. 0...06-74;-6.i.
0 \
Metal Content of Ground Water.
Mo(ppb) Se(ppb) Eh BP 50 8.1 7.0 volts. Drain 45.0 14
P- 0
B S Se 8
/e4- 40
&ow"' ' . ..., --
260 • Semi.ofe4;...c. .c/JZ. • 5' .5
Yer...rrool/s 4,/114 -r./ • rey- a
• ‘4,4,5. e. -.A0 V4,11 . • .67.
. 70
•-•"" i I • '":>
I }Tarr Aale 86.InevA,
100 k / 0
°P •
56. /
=•••••• .0•••••
FIG.No. 34.
100
120
40
30
12
30—

139
tion with Fe oxides, the upper soil horizons having been leached
of Mo and Se. The Clare Shale rock section exposed in South
Creek nearby and along strike averages 71 ppm Mo and 15 ppm Se.
In BP 50, downslope from BP 8, the increase of Mo
and Se down the profile is reflected in an increase in 1 the iron
content from 1.1 - 2.0 Fe203 in the upper horizons to 3.8,;L
Fe203 in the basal horizon. In addition to the possible leaching
of Mo and Se from the upper soil horizons, the increase downwards
of Mo and Se values is most probably associated with the precipi-
tation of iron minerals leached from up profile and upslope as for
Clare Shale residuum.
These soils occur on the margin of the peaty-swamp
that constitutes the seleniferous toxic soil area of Flynn's Farm.
Erosion of the soil has contributed largely to the basal
"lacustrine" horizons on which the toxic peaty soils have
developed. Leaching of the metal-rich soils has also contributed
metal-rich groundwater to the swampy depressions.
(ii) Glacial Drift
Soils derived from glacial drift are the most
widespread in the area. Thus, the Ballincurra, Elton, Howard-
stown and Kilrush Series are all derived to a large extent from
drift material (Figs. 5 and 7). The distribution of trace
elements in the drift is therefore, of major agricultural
importance. Post-glacial erosion of the unconsolidated glacial

i4o
deposits has also been a major source of the detrital constituents
of alluvial and swamp deposits.
(a) Areal Distribution of Metal in Drift
Analysis of drift soils at 18-24 ins depth showed
that the metal content of glacial drift reflects the metal content
of the underlying bedrock, modified by transport of rock material
in the direction of ice movement (Fig. 12, Tables 9 and 10). The
most striking example of this is the "fan" of molybdeniferous
drift southwest of Foynes (Figs. 2 and 12) related to the Weichsel
ice advance. Within this area, the"carry-over" of Clare Shale
also noted by Synge (1966) is shown by the presence of black shale
fragments mixed with limestone and Namurian detritus up to 5 miles
"down-ice" from the line of outcrop. In the west, where the line
of advance of the ice did not cross the Clare Shale boundary,
black shale material is absent from the drift. This observation
is consistent with the regional geochemical pattern of the area
and is confirmed by analyses for Mo of drift observed to contain
Clare Shale fragments.
On a more detailed scale in the Flynn's Farm area
the areal distribution of metal in drift is closely related to
the bedrock pattern, and the highest concentrations of Mo, Se,
Cu and V occur in drift overlying the metal-rich Clare Shale
sub-outcrop (Figs. 12, 19-22). To the west the spread of metal-
rich drift onto the Namurian sandstones and siltstones corresponds

iLa
with the presence of Clare Shale fragments in the till. However,
the presence of Mo-rich drift up to 1-mile east of the base of the
Clare Shales (Fig. 19) is contrary to the movement of metal-rich
material "down-ice", the ice having advanced in a west and south-
west direction. In this case, where black shale fragments are
visible in the predominantly limestone drift (e.g. in a gravel
quarry about 800 ft east of the base of the Clare Shales between
Flynn's and South Creeks) their presence is attributed to fluvio-
glacial wash downslope from the Clare Shale escarpment.
Particularly in the topsoil horizons, anomalous concentrations
of Mo and Se are sometimes detectable in drift soils up to
several thousand feet east of the Clare Shale horizon. Where
there is no visible evidence of Clare Shale fragments in the
parent drift it is believed that damming of waters between the
escarpment and the ice front during retreat allowed flooding
by waters containing metal in solution and suspension. Part of
this metal has been retained in the drift and concentrated in the
topsoil on weathering.
In general, because of the complexity and persis-
tence of the drift, it is not possible to make any close comparison
between the actual metal content of drift and underlying bedrock.
The metal patterns in fresh Jrift are dependent both on the amount
of dilution of metal-rich black shales by barren material and the
direction of ice movement. This is modified locally by fluvio-
glacial factors and the effects of weathering during soil forma-
tion.

11+2
(b) Distribution of Metal in Drift Profiles
The Elton Series soils are derived from limestone
drift sometimes with a small admixture of other rocks including
shale. The underlying bedrock is generally limestone except
where there has been a "carry-over" of limestone drift onto
other rock types. Soils of this series are well to moderately
drained loams and generally occupy gently undulating ground.
Leaching has played a prominent part in the soil-forming
process and much or all of the parent calcareous rock has been
leached. The organic content of the topsoil is medium to high,
depending on drainage.
Gley soils comprising the Howardstown and Kilrush
Series have developed under conditions of impeded drainage and
are characterized by bluish-grey and grey colours in the mineral
horizons, commonly with ochreous mottling.
The Howardstown Series occurs on flat, poorly
drained predominantly limestone drift but may also form on
alluvium derived mainly from limestone. These soils are of
clay-loam to clay texture and the profile is characterized by
a dark-brown organic surface horizon overlying strongly gleyed,
grey and mottled lower horizons. The division between horizons
is not well marked. Leaching has not played a large part in the
soil development and much or all of the original CaCO3 remains
in the profile, except in the topsoil.

Table 19: Drift Soil Profiles Selected for Study
Bac
kgro
und
Met
al
Valu
es
Parent Drift Well Drained
-----.._
Moderately Drained Poorly Drained
Predominantly Limestone
BP 29 (Elton)*
Predominantly Namurian
BP 4? (Kilrush)
Ano
mal
ous
Met
al
Valu
es
Predominantly Clare Shale
BP 106 (Kilrush)
Predominantly Limestone
BP 3 (Elton)
B1 11 (Howardstown)
Predominantly Limestone Minor Clare Shale
BP 22 (Elton)
BP 33 (Elton-Howardstown)
BP 23 (Howardstown)
Mixed Clare Shale, Namurian and Lime- atone.
BP 36 (Elton?)
BP 37 (Kilrush)
*The classification of the profiles studied for metal distribution into soil series is based on the Irish Soil Survey classification. Actual identification is by the writer and must therefore be considered as provisional only.

144
The Kilrush Series had developed under similar
conditions of poor drainage to the Howardstown Series but occupies
the higher ground overlying the Namurian rocks and also Clare
Shales (area D, Fig. 12). The parent drift material is mostly
of Namurian and Clare Shale origin, often with some admixed lime-
stone. The poor drainage conditions under which these soils have
developed is attributed by Finch and Ryan to a high silt content
and poor structure and are considered as surface water gleys.
They have a clay-loam and silt-loam texture with an organic top-
soil horizon overlying greyish-brown gleyed horizons.
Table 20: Some Physical Characteristics of Elton, Howardstown and Kilrush Series Soils of Drift Origin (After Soil Survey of Ireland)
Elton Series
Depth (ins.) 0-8 8-15 15-23 25-40 pH 5.5 5.7 6.6 7.3 Organic Carbon (0 3.1 1.3 0.9 0.2
Howardstown Series
Depth (ins.) 0-6 6-10 10-18 18-24 24-45 pH 5.8 6.o 6.8 7.9 8.3 Organic Carbon 8.6 3.7 0.9 0.3 0.3
Kilrush Series
Depth (ins.) 0-5 5i-15 15-23 23-26 26-36 PH 6.3 6.2 5.9 5.5 5.7 Organic Carbon (%) 3.5 1.4 0.4 0.4 0.3

145
Molybdenum and Selenium in Background Soils
The glacial drift profiles selected for study include
two profiles of limestone drift and Namurian sandstone and silt-
stone composition respectively, containing only background metal
values (Table 19)
The background limestone drift profile (BP 29 -
Table 21) contains insufficient Mo for any pattern to be detected
and it is apparent that soil formation has not involved any
significant enrichment of the Mo content of the parent drift.
This corresponds with the data obtained by regional drift
sampling (Fig. 12). The profile was not analysed for Se but
it is not expected that soil development will have involved
significant changes in the Se status of the drift. This con-
clusion is based on (a) the low Mo, levels present in the profile,
(b) the low Se levels in limestone drift established by regional
sampling (mean 0.5 ppm Se), and (c) the similarity of the profile
developed on the liMestone drift to the residual profile developed
on limestone of similar composition (BP 1 - Table 16).
The soil profile developed on drift of Namurian
sandstone and siltstone origin shows a well marked increase, by
a factor of about two, of Se in the organic-rich topsoil horizon.
Mo is also slightly enriched in the topsoil compared with the
parent drift.

Table 21: Glacial Drift Profiles in Background Areas
BP 29 Moderately well-drained, predominantly limestone boulder elm. (Soil type, Elton Series)
Sample No.
Depth (ins)
2497 0-3 2498 3-9 2499 9-14 2500 14-18 2701 18-24
Medium brown, friable sandy loam
<2 Light to medium brown sandy loam with some limestone pebbles <2 Light brown gritty clay loam with some limestone -.,72ebbles <2 Light brown clay loam with some limestone pebbles
<2
Light brown loamy drift gravelly boulder clay
<2
Profile Description No Se
(ppm) (ppm)
BP 47 Moderately drained, predominantly Namurian sandstone and shale boulder clay. (Soil type, Kilrush Series)
Sample No.
Depth (ins)
3704 0-6 3705 6-11 3706 11-20 3707 20-32
3708 32-40
Dark brown, humic, sandy ca.ay loam Light grey brown, slightly mottled, sandy clay loam Grey, slightly mottled clay loam with sandstone fragments Grey-brown black clay. .Sandstone and siltstone fragments in sandy clay Grey-brown black clay. Sandstone and siltstone fragments in sandy clay
Mo (ppm)
Se (1)pm)
2 1.2 <2 0.8 <2 0.6
<2 0.5
<2 0.6
Profile Description

147
Molybdenum and Selenium in Anomalous Areas
The occurrence of anomalous concentrations of Mo
and Se in drift soils can generally be related to the presence
of Clare Shale fragments in the parent drift or, where the drift
is deposited close to the Clare Shale escarpment, to the addition
of metal-rich material from lakes dammed against the scarp during
retreat of the ice-sheet.
In describing the geochemical characteristics of
anomalous drift soil profiles it is apparent that the Mo and Se
content of the unweathered drift will be dependent on the compo-
sition and proportion of Clare Shale material mixed with barren
rock types. However, features of soil formation, in particular
groundwater movement and drainage, accumulation of organic matter
and iron oxides, leaning etc., will result in re-distribution of
metal in the weathered section of the profile. The profiles can
therefore be classified as shown in Table 19 according to (a)
the composition of the parent drift and (b) the soil series
which incorporates variations in drainage, horizon development,
etc.
Well-Drained to Moderately Well-Drained Drift Soils of
Dominantly Limestone Origin (Mainly Elton Series)
Anomalous profiles BP 3 and 22 (Table 22) and also
BP 29 containing background metal levels fall within this
category. In BP 3 and 22 which are located on moderately
sloping hillsides, the groundwater level is below the profile

Table 22: Glacial Drift Profiles with Anomalous Molybdenum and Selenium Contents
Sample Depth No. (ins) Profile Description
Mo Se Mo/Se pH Acid Total (PPM) Soluble Fe203 Fe
(%)
vrgq C ; (0 I
BP 3 Moderately well-drained, predominantly limestone, gravelly boulder clay. Moderate metal values. Soil classified as grey-brown podzolic of the aton Series.
Medium brown friable silty loam 7 3.2 Medium brown clayey loam with minor mottlin3 5 1.5 Light brown gritty clayey loam. A few limestone
pebbles 5 0.8 Light brown lsightly weathered gravelly limestone
boulder clay 5 1 Light brown less weathered gravelly limestone
clay 4 1.0 Light brown less weathered gravelly limestone
clay 2
2_ 6.65 0.75 6 3.5 3.3 7.35 0.6 6 1.8
1
6.25 8.13 0.4 4 0.8
8.41 2 0.3
3.6 8.43 1.6 '.0.2
8.40 2
2126 0-6 2127 6-10 2128 10-18
2130 18-26
2131 26-34
2133 34-38
BP 11 Moderately poorly-drained, predominantly limestone gravelly boulder clay. Moderate-high metal values. Soil is intermediate between A grey-brown podzolic of the Elton Series and a gley of the Howardstown Series.
2322 0-4 Medium brown, slightly gleyed sandy clay loam 20 5 4 2323 4-8 Light brown sandy clay loam with limestone and
black shale pebbles 12 3.8 3.2 2324 8-12 Light brown, grey weathered boulder clay 7 1.2 6 2325 12-24 Light brown-grey boulder clay 5 0.3 17 2326 24-36 Light brown-grey boulder clay 5 0.3 17

Mo Se Mo/Se pH Acid Total Org. (ppm)
Sample Depth No. (ins) Soluble
Fe203 C Fe (%) (4) (%)
Profile Description
BP 106 Poorly drained Clare Shale ground moraine. Gley soil, Kilrush Series.
4105 0-12 Dark brown-black humic loam 6 7.5 0.8 4106 12-24 Dark grey loamy clays with black shale fragments 2 2.5 0.8 4107 24-36 Grey clays with many shale fragments 16 3.7 4.3 4108 36-54 Grey gravelly clays and semi-decomposed shale
fragments 85 9.0 9.4
Table 22 t;continued)
BP 22 Moderately well-drained, predominantly limestone with some admixed Clare Shale, boulder
2428 0-6
clay. Grey-brown podzolic, Elton Series.
Light brown friable silty clay loam with some pebbles 15 3.5 4.3 2.3 8 2.75
2429 6-11 Light brown friable silty clay loam with limestone and some black shale pebbles 10 2.0 5.0 2.4 6 1.19
2430 11-17 Orange brown gritty clay with limestone and some black shale pebbles 5 2.2 2.3 2.8 8 0c57
2431 17-24 Light brown gritty, slightly weathered, boulder <2 1.8 4 0.15 2432 24-36 clay with predominantly limestone fragments, <2
very minor Clare Shale
1.5 <1.3 1.6 3 0.28

Table 22 (continued)
1 Sample Depth Igo Se Mo/Se PH Acid Total Org.1 1 No. (ins) Profile Description (ppm) Soluble Fe
203
1 Fe
W (%) (%)J
BP 23 Poorly-drained, predominantly limestone with minor Clare Shale boulder clay. Gley soil, Howardstown Series. Drift comp. similar to BP 22.
0-4 Brown-grey, mottled, gleyed silty clay loam 15 6.5 2.3 8 4-9 Dark brown-humic, gleyed loam 12 7.5 1.6 6 9-16 Dark brown-humic,gley, almost peaty 12 3.0 1.5 4 16-23 Dark brown peaty gley 8 9.5 0.85 1.6 23-29 Grey clay and sand. Limestone black shale
pebbles <2 2 <1 0.8 29-36 Light grey, sandy boulder clay. Limestone
black shale pebbles <2 2 <1 0.6 36-45 Light grey, sandy boulder clay. Limestone
black shale pebbles <2 2 <1 0.8
BP 33 Moderately poorly-drained, predominantly limestone with some Clare Shale boulder clay. Slightly gleyed intermediate between Elton and Howardstown Series.
0-4 Medium brown mottled, gleyed, humic loam 7 7.3 0.95 4-9 Medium grey-brown, gritty gleyed loam 5 4.3 1.2 9-15 Light grey, mottled, weathered sandy boulder clay 10 0.7 14 15-24 Light grey, sandy limestone and black shale
boulder clay 15 1.0 15
2434 2435 2436 2437 2438
2439
2440
2781 2782 2783 2784

Table 22 (continued)
1 Sample Depth Mo Se 1 No. (ins) Profile Description (ppm)
iff
2785 24-36 Light grey, sandy limestone and black shale boulder clay
15 1.2 9.2 2786 36-48 Light grey, sandy limestone and black shale 7
boulder clay 2787 48-6o Fresh, grey, boulder clay, predominantly
limestone some shale 3 2789 60-72 Fresh, grey, boulder clay, predominantly
limestone, some shale <2 0.4 <5.75 72-80 Fresh, grey, boulder clay, predominantly
limestone, some shale <2
Mo/Se pH Acid Total Org.! Soluble Fe203 C
Fe (;.) (2.) (i,-)
2800
2801
2802 1
2803 ! 1 2807 1 2808
BP 36 Moderately well-drained, boulder clay, predominantly Clare Shale with limestone and Namurian sandstone and siltstone. High proportion of dense clay.
0-5
5-13
Medium brown slightly mottled silty loam with some drift pebbles
Brown, slightly weathered boulder clay with Clare 12 1.3 9 5
Shale sandstones and limestone pebbles 15 1.5 10 6
13-21 Brown, slightly weathered boulder clay with Clare Shale sandstones and limestone pebbles 12 1.3 9 6
21-38 Grey, fresh boulder clay. High proportion of fine clay in matrix 7? 1.5 4.7? 6
38-50 Boulder clay, predominantly Clare Shale with 15 1.5 10 8 50-57 some limestone and sandstone 10 1.5 6.6 6

Bp 37 Poorly-drained gravelly boulder clay of predominantly Clare Shale and Namurian sandstone and siltstone with some limestone. Gley soil of Kilrush Series.
2820 2821 2822
0-4 4-10 10-14
Dark brown humic gley Dark brown peaty gley. Some shale fragments Light ,friey humic clay. Some weathered rock
12 30
fragments 7 2823 14-26 Grey boulder clays with limestone, Clare Shale
and Namurian fragments 6 2824 26-35 Grey boulder clays with limestone, Clare Shale
and Namurian fragments 6 2825 35-45 Grey boulder clays with limestone, Clare Shale
and Namurian fragments 6
1.0 12 5 1.5 20 8
0.5 14 3
0.7 8.4 5
6 1.0
8
1 1
Table 22 (continued)
---;
Sample Depth Mo Se Mo/Se pH Acid Total Org. No. (ins) Profile Description (ppm) Soluble
Fe203 C
Fe (;,,) (s,) (%)

153
depth. Mo and Se are concentrated in the surface horizons and
this can be correlated with the distribution of both iron and
organic carbon. Soil development has involved leaching of CaCO3
from the upper horizons and it would appear that the accumulation
of iron in the upper horizons represents immobile iron oxides
retained in the soil under the neutral to alkaline conditions
of weathering. The accumulation of organic carbon in the upper
horizons is the result of normal biogenic activity with some
eluviation of organic matter into the lower horizons by downward
percolating waters.
The mechanism by which Mo and Se are retained in the
.upper part of these well-drained profiles can be attributed to
adsorption on either the organic carbon or the iron oxides. In
view of the fact that the iron oxides are considered to be relic
rater than freshly precipitated compounds it is thought that
adsorption on organic matter may be the predominant factor in
metal retention. However, because of the well-marked association
of Fe with Mo and Se in some other profiles (e.g. BP 27) and the
general co-variance of both iron and carbon with No and Se, the
possible influence of iron cannot be discounted.
Well-Drained Drift Soils of Mixed Origin
Profile BP 36 has been taken from boulder clay
overlying Namurian rocks and is made up of sandstone and silt-
stone, a large proportion of Clare Shale fragments and some

154
limestone. The high iron content of the fresh drift in the
profile (approx. 6.5% Fe203) is a measure of the high Namurian
rock content (averaging 7.5% Fe203),and Clare Shale (averaging
Fe203). Much of the rock matter making up the boulder
clay at this site has been transported a considerable distance,
as indicated by the presence of Clare Shale and limestone
fragments at least five miles from the nearest outcrop source.
Movement by the ice-sheet has also involved the transport of
this material several hundred feet in altitude to its present
site. It seems reasonable that after transport of several miles
by the ice, adequate mixing of the Clare Shales with barren rock
types should have occurred. Consequently, in view of the negli-
gible quantities of Mo and Se in the barren rock types, Mo and
Se values of 10 ppm Mo and 1.5 ppm Se in the unweathered drift
will be a measure of the proportion of the Clare Shale present.
Taking into account the average Mo and Se content of Clare Shales
(27 ppm Mo and 3.0 ppm Se) it appears that this soil is developed
from drift composed of about one-third to a half Clare Shale
detritus. These proportions are in line with the iron content
of the drift mentioned previously.
Soil development has not involved any significant
redistribution of Mo and Se in the profile. This is attributed
to the only slightly weathered nature of drift due to the high
proportion of dense, impervious rock-flour of argillaceous and
arenaceous rock types in the matrix.

155
Poorly Drained Drift Soils of Dominantly Limestone
2ELFin
Profiles BP 11 and 23 are typical of the gley soils
developed under conditions of impeded drainage. BP 23 is sited
close to BP 22 and the parent drift is of generally similar
composition. The parent drift at site BP 33 is also similar
and the drainage conditions under which soil formation has taken
place are moderate, being intermediate between those of BP 22 and
BP 23. As in the freely drained profile, Mo and Se are concent-
rated in the upper horizons along with iron as shown by the Fe203
contents of BP 23. Organic carbon analyses were not made but
visual examination of profile BP 23 (Table 22) has indicated
development of a humic, almost peaty B horizon. Se has been
substantially enriched in this horizon compared with Mo. The
uppermost organic horizons of the moderate to poorly-drained
profile BP 33 also contain high concentrations of Se compared
to the amount of Mo present.
From this it can be deduced that under conditions
of poor drainage Se tends to be more enriched in the upper more
organic horizons than in the corresponding horizons of better
drained drift. Mo on the other hand, although enriched in
the topsoil does not appear to be present in much greater con-
centrations than in equivalent well drained soils. It would
appear that adsorption of Se on the organic material is the
most likely mechanism for concentration as, in BP 23 for example,
there is no correlation between Se and Fe203
in the uppermost

156
organic-rich horizons. The mechanism by which Mo accumulates
in the poorly drained soil of BP 23 also appears to be linked with
the organic nature of the upper horizons.
Poorly Drained Drift Soils of Mixed Origin
Profile BP 37 has been derived from drift boulder clay
similar to that of BP 36. Poor drainage has encouraged the develop-
ment of organic-rich A and B horizons and both Mo and Se show a
tendency to accumulate, particularly in the almost peaty, gleyed
B horizon. Iron has also concentrated in this horizon but is
not substantially enriched in the topsoil.
Poorly Drained Clare Shale Drift Soil
Soils of solely Clare Shale drift origin are very
restricted in extent and no examples of soil development under
good drainage conditions were located. The profile developed
under conditions of impeded drainage (BP 106, Table 22) exhibits
many of the characteristics of the residual profile developed on
Clare Shales (BP 27, Table 16). Both Mo and Se are enriched in
the lower horizons and in view of the general similarity of the
profile structure to the residual Clare Shale profile it is most
probable that the accumulation of metal towards the base of the
profile can be similarly attributed to the influence of
accumulated iron oxides. However, the poor drainage conditions
have modified the soil profile by encouraging the development

157
of an organic-rich humic topsoil similar to other poorly drained
soils developed on drift of mixed bedrock origin. Both Mo and Se
are enriched in tlis horizon. Comparison of the relative concentra-
tions of Mo and Se in this profile indicates that comparatively
more Se is retained in the upper part of the profile as was
recorded for poorly drained anomalous soils of mainly limestone
origin. As suggested in the discussion of the residual Clare
Shale soil it is possible that although both metals may be sorbed
or co-precipitated with secondary iron oxides, the greater affinity
of Se for organic matter leads to excessive concentrations of Se
relative to Mo in the upper horizons of the soil. The Mo:Se
ratio of 9.4 in the basal horizon of this profile very closely
reflects the average Mo:Se ratio of 9.2 in the Clare Shale bedrock.
Compared with Mo/Se ratios of 0.8 in the topsoil this is an indi-
cation of the selective retention of Se in the upper more organic
part of the profile.
Other Metals
The distribution of several other elements was
investigated in four profiles (Table 23). Under moderately good
drainage conditions, the predominantly limestone boulder clay
profiles (BP 3 and BP 22) showed a slight increase in most metals
in the upper horizons in a generally similar but less well marked
pattern to Mo and Se. Most likely this represents residual
accumulation of material remaining after leaching of CaCO3. Ga
and Ti, commonly associated with clay minerals are enriched in

158
the upper horizons. Most cationic metals, e.g. Pb, Zn, Cu, Ni,
which would tend to be insoluble under the alkaline conditions
of weathering limestone also accumulate in the upper horizons.
Under the impeded drainage conditions of BP 23, the
pattern of enrichment in the upper horizons is generally similar
to that of well-drained profiles but the concentration of most
metals is more marked. This follows the greater concentration
of Fe in the upper horizons. Cu, in particular, is similar to
Se in being markedly concentrated in the organic-rich surface
horizons.
In BP 36, limestone is subordinate to the other rock
constituents of the drift tri.ereby inducing a more acid weathering
environment. The distribution of some metals in this profile
diverges from the Mo-Se pattern. Thus, there is a marked increase
of Mn in the upper horizons and a less well marked concentration
of Pb. There is also some evidence that Cu may be slightly
leached from the upper horizons.
(c) Mechanical Analysis of Drift and the Distribution of Metal Between Size Fractions
The mechanical composition of four drift samples
was determined and analyses made of Mo, Se and in certain cases
organic carbon and acid-soluble Fe (Fig. 35). Ten other metals
and the total iron content were also determined spectrographi-
cally (Table 24). The drift investigated consisted of a topsoil

Table 23: Metal Content of Selected Glacial Drift Profiles
Sample Depth Mo Se Pb Ga V Cu Zn Ti Ag Ni Co Mn No. (ins) (Parts per million)
BP 3 Moderately well-drained drift gravel and boulder clay. Predominantly limestone origin.
2126 0-6 7 3.2 40 10 100 50 150 4000 <0.2 85 3o 600 2127 6-10 5 1.5 5o 8 loo 5o 130 5000
loo 3o 600
2128 10-18 5 0.8 4o 6 85 6o loo 4000 tt 85 3o 400 213o 18-26 5 I 3o 5 85 4o <50 3000
2133 34-38 2 1 3o 4 4o 30 <5o moo 2131 26-34 4 ? 1.0 3o 4 85 3o <5o 200
It
85 20 200 tt
6o 20 200 !I
6o 16 16o
BP 36 Moderately well-drained mixed boulder clay of Namurian, Clare Shale and limestone origin.
12 1.3 4o 13 200 85 100 4000 <0.2 50 20 600 15 1.5 20 13 200 85 100 6000 85 3o 3000 12 1.3 20 13 300 85 85 6000 It 85 30 1300 7 1.5 13 8 130 4o 5o 4000 5o 20 400 15 1.5 16 13 300 130 loo 6000 It 85 3o 600 lo 1.7 16 lo 300 13o 5o 6000 it 85 3o 400
0-5 - 5-13 13-21 21-38 38-50 50-57
BP 22 Well-drained drift of mainly limestone with some Clare Shale material.
15 3.5 50 lo loo loo loo 5000 <0.2 loo 3o 10 2.0 50 13 100 100 130 6000 tt 130 3o 5 2.2 60 16 130 100 100 600o IT 130 4o
600 600 85o
0-6 6-11 11-17
Cr Fe203 (%)
85 85 85 85 6o 6o
6 6 4 2 1.6 2
85 5 85 6 85 6 6o 6 160 8 130 6
loo 8 85 6 loo 8
2800 2801 2802 2803 2807 2808
2428 2429. 2430

Table 23 (continued)
Sample No.
Depth (ins)
Mo Se Pb Ga V Cu Zn (Parts per million)
Ti Ag Ni Co Mn Cr Fe203 (50
2431 2432
BP 22
<21 <2 1
1 •
30 16
6 6
60 85
4o 4o
<50 <50
3000 4000
<0.2 It
60 6o
30 20
500 300
85 60
4 3
17-24 24-36
2434 2435 2436 2437 2438 2439 2440
BP 23 Poorly-drained drift of mainly limestone with some Clare Shale material_
15 6.5 4o 10 300 85 130 5000 <0.2 85 30 300 fi 12 7.5 5o 16 400 loo 130 600o 100 30 500
12 8.o 4o 13 400 1000 loo 5000 85 20 200 8 9.5 30 8 200 850 50 4000 60 13 200
tl 4o lo 100 <2 2 lo 4 6o 16 <50 2000 ft 5o lo loo <2 2 13 4 6o 20 <50 3000
<2 2 13 4 6o 3o <50 2000 50 16 100
85 130 130 85 4o 4o 4o
8 6 4 1.6 0.8 0.6 0.8
0-4 4-9 9-16 16-23 23-29 29-36 36-45

161
sample (2126), slightly weathered drift from the C horizon of
the same profile (2130), slightly organic boulder clay forming
the base of a swamp deposit (2156) and fresh boulder clay of
mixed Clare Shale and Namurian origin with some limestone (2808).
The mechanical composition of the -2 mm fraction of
the drift (material larger than "coarse sand" size was not
included in the study) shows that a high proportion consists of
silt and clay-sized particles. The amount of very fine "rock-
flour" is highest in the fresh boulder clay sample (2808) and
least in the weathered topsoil and in the boulder clay underlying
the peat swamp (samples 2126 and 2156). This is attributed both
to the aggregation of particles by organic matter in these
samples and to the greater susceptibility of the finer limestone
particles to the action of weathering agencies.
Dealing with the distribution of metal (Fig. 35 and
Table 24) in the fresh boulder clay of mixed origin (2808 -
BP 36, ref. Table 22 for profile description) it can be seen
that No, Se and most other metals including iron, are relatively
evenly distributed between the size fractions. Such an even
pattern could be expected in view of the dominantly mechanical
origin of glacial till, in which unsorted freshly comminuted rock
particles have been subjected to a minimum of chemical weathering.
Ti tends to be impoverished in the 80 to 200 mesh-size and this
may be related to the grain size of the host mineral which was
probably ilmenite in the Namurian rocks.

a U
C a a)
Sec;
4 Mo.,
4
io +Total Fe403
-o
5'
Froclion - 20 mesh.
mesh. B 20mesh-38 a p
A 2mm
C 38 - 80 " (1) a
D 80 „ - 125 a 21a
E 125 - 200 a
F 200 „ - 0.02mm. -3 G Silt and Clay.
Mo A -F<2ppm.
Total Fe+
0
..1
Mod. well-drained, sandy boulder-clay. Predom. limestone orign. Sample 2126, BP 3 , 0" - 6". A B C D E ABC D E F G
Sample 2130, BP 3 , 18" - 26"
Fe a
nd
Org
.0 (%
)
E a. a.
Mo
an
d Se
BC DEFG Sample 2156, BP 6., 31" - 42" Gravelly boulder-clay, under-tying peaty-swamp.Flynn'sFm.
Mo,
Se
(PM
)
A B C D E F G• Sample 2808 . BP 36 , 50"-57". Fresh b.-clay of mixed limest. Pare Sh. and Namurian orign.
FIG.No.35. SIZE ANALYSIS OF GLACIAL DRIFT SAMPLES
SHOWING DISTRIBUTION OF METAL BETWEEN FRACTIONS.

Table 24: Distribution of Metal in Size Fractions of Glacial Drift (Metal Contents in ppm except for Fe203 which is in %)
(Size Fraction AaG as for Fig. 35-and Table 18)
Profile BP 3 Topsoil 0-6 ins,
predominantly sandy lime-
stone boulder-clay
(Sample 2126)
Profile BP 3 18-26 ins,
sandy, predominantly lime-
stone boulder clay
(Sample 2130)
A
Mo 8 8 6 4 4 3 8 Se 5.2 3.5 2.2 1.8 1.3 1.0 2.7 Pb 100 30 50 4o 7o 5o 30 Ga 10 5 7 7 10 7 15 V 7o 7o 7o 5o 40 4o 200 Cu 4o 40 40 50 4o 50 50 Zn 300 150 120 120 150 100 150 Ti 4000 3000 3000 2000 3000 5000 4000 Ni 8o 70 8o 70 70 70 100 Co 30 20 30 5o 4o 30 20 Mn 1000 500 1000 2000 3000 800 400 Cr 90 70 70 50 70 70 200 Fe203 10.0 6.o 5.o 5.0 5.o 4.o 6.o
Mo <2 <2 <2 <2 <2 <2 4 Se 1.3 1.6 1.5 1.4 1.3 1.5 1.2 Pb 8 12 10 15 15 10 30 Ga 2 2 <2 2 2 2 8 v 6o 7o 60 5o 5o 4o 70 Cu 8 10 8 10 20 10 50 Zn <50 <50 <50 <50 <50 e50 <50 Ti 300 300 400 300 5000 2000 3000 Ni 30 30 40 40 50 50 100 Co <5 <50 5 5 5 lo 30 Mn 150 200 150 200 200 150 500 Cr 30 40 40 40 4o 60 100 Fe203 1.0 1.3 1.6 1.6 1.6 1.6 4.0

Table 24 (continued)
(Size Fraction A-G as for Fig. 35 and Table 18)
A
Mo <2 <2 4 4 3 3 40 Se o.8 2.3 5.5 3.o 2.1 1.2 23.0 Pb 5 7 7 4 5 4 30
Profile BP 6 (31-42 ins) Ga <2 <2 <2 <2 2 2 8 v 70 8o 8o 5o 7o 7o 8o
Gravelly boulder-clay underlying
peaty-swamp. Flynn's Farm Cu Zn
15 <50
4 <50
7 <50
4 <50
5 <50
5 <50
4o <50
Ti 300 500 500 300 400 1000 2000 (Sample 2156) Ni 10 10 10 10 20 20 70
Co <5 <5 <5 <5 5 5 20 Mn 250 250 250 300 400 400 400 Cr 15 20 20 20 20 30 150 Fe203 0.6 0.8 1.3 o.8 1.6 1.6 3.0
Mo 5 7 6 6 8 3,2 9 Se 2.8 2.0 2.1 1.8 1.8 2.0 2.1 Pb 15 30 10 15 20 15 30
Profile BP 36 (50-57 ins) Ga 10 15 8 10 10 12 15 V 70 80 70 70 100 80 120
Unweathered boulder clay of Cu 50 6o 60 8o 80 70 8o mixed Namurian, Clare Shale Zn <50 <50 <50 <50 <50 <50 50
Ti 7000 6000 6000 2000 1500 7000 7000 and limestone (Sample 2808) Ni 50 50 40 8o 70 80 8o
Co 20 15 15 30 30 30 30 Mn 400 600 700 600 700 400 500 Cr 100 8o 80 70 8o 8o 120 Fe203 6 8 8 8 6 8 8

161+
In the other samples, in which weathering agencies
have been active, the Mo and Se content in particular, varies
markedly between the size fractions. The least altered,
sample (2130, BP 3) was collected from 18 to 26 inches in slightly
weathered limestone drift. Mo is enriched in the silt and clay
fraction and this can be correlated with a marked rise in the
Fe203
content of this fraction. Se, on the other hand, is more
evenly distributed between the fractions, except for a slight
increase in the Se content of the 125 to 200 mesh fraction which,
considering the low levels being determined, is probably not
significant. The lack of corielation between Se and Fe203
contents in the silt and clay fraction would seem to indicate
that Se, unlike Mo, is not associated with secondary iron oxides
in the slightly weathered drift. The relatively even distribu-
tion of Se between fractions is most probably the result of
association with organic matter which is distributed fairly
evenly between the size fractions with a slight increase in the
finest fraction. Most other elements (Table 24) follow both Fe
and C in being concentrated in the silt and clay fractions.
In the topsoil sample (2126) and the drift underlying
swamp deposits (2156) the effects of weathering are much more
marked and are reflected in wide variations in the Fe and organic
carbon content of the different size-fractions. The patterns of
iron and organic carbon in these two samples are basically different
in that in the topsoil there is a marked accumulation of both
constituents in both the finest and coarsest fractions. In the

165
drift unc:',erlying the swamp iron and organic carbon are enriched
only in the silt and clay fractions. Mo and Se both closely
follow these patterns.
In the topsoil (2126), the well-drained and leached
nature of the soil would indicate that the Mo and Se contents
represent relic compounds remaining after leaching of CaCO3
during soil formation. The concentration of iron and organic
carbon in the coarse fraction is attributed to the formation of
iron-rich organic aggregates that are not broken down during
mechanical analysis. The anomalous concentrations of Mo and Se
in the drift underlying the swamp (sample 2156), are believed
to be due to the hydromorphic introduction of metals and sus-
pended organic matter from metal-bearing groundwaters and the
overlying metal-rich peat deposits. Unaltered drift of similar
origin situated nearby (ref. drift and swamp section, Fig. 39)
contains <2 ppm Mo and 0.8 ppm Se in the -80 mesh fraction
compared with 30 ppm Mo and 15 ppm Se in sample 2156. Organic
carbon and precipitated iron oxides have both accumulated with
Mo and Se in the finest fractions of the altered drift.
Briefly, with regard to the distribution of other
metals between size fractions of the altered drift, it can be
seen from Table 24 that many of them tend to follow the iron
oxide pattern and in general possess a similar pattern of
distribution to Mo and Se. More obvious exceptions to this
pattern in the topsoil drift (2126) 14-40'Cu, Ni and C. which do not
vary between size fractions. These metals on the other hand,

166
are concentrated along with iron in the fine silt and clay
fraction of sample 2130 collected from 18 to 24 ins in the
same profile.
In the more organic drift from beneath the swamp
deposits (sample 2156), V and possibley Zn and Mn are obvious
exceptions to the general pattern of concentration in the finest
fraction, along with iron and organic carbon. It would seem
that the conditions giving rise to the co-precipitation or
adsorption of the other elements on iron oxides or organic carbon
do not affect V and possibly not Zn and Mn.
(iii) Alluvium
Alluvial deposits flank many of the streams in the
area and it has been shown (Chapter V) that where the streams
rise on the Clare Shales, anomalous concentrations of No and Se
in soils and herbage are often associated with these deposits.
Investigation of the alluvial material has involved
(a) analysis of related profiles containing both anomalous and
background metal concentrations, (b) sampling of a traverse
across the alluvium comprising toxic soil Site B, and (c) size
analysis of selected samples. The mechanisms by which Mo and
Se are dispersed in alluvium are also discussed.

167
(a) Distribution of Metal in Profile
Molybdenum and Selenium
Background Areas
Extensive areas of alluvium overly the limestone
drift in the eastern half of the study area (Fig. 5). Regional
soil sampling indicated that at a depth of 18-24 ins this material
carried only background metal concentrations (Fig. 12). A more
detailed description of the vertical distribution of Mo and Se
in typical profiles through these deposits is given below
(Profiles BP 14 and BP 30).
The Mo and Se contents of the alluvial horizons in
profile BP 14 are appreciably higher than in the underlying
drift and there is a slight increase in the Se content of the
uppermost alluvial horizons. In BP 30 Se was not determined
but, in view of the fact that the Mo content is very low, Se
can be expected also to be present in only small concentrations.
Mo is slightly concentrated in the uppermost topsoil horizon of
this profile and is just detectable. Although the metal content
of the alluvial soils is slightly greater than in the drift
it is apparent that significant variations, that would bring
about anomalous concentrations, do not occur in background areas.
Briefly,with regard to other elements (Table 26),
it is apparent that most metals determined in profile BP 14
are slightly enriched in the alluvial horizons compared with
the underlying unweathered drift. However, metal concentrations

2378 0-4 2379 4-10 2380 10-15 2381 15-20 2382 20-30 2383 30-42 2384 42-48 2385 48-54
Table 25: Description and Molybdenum and Selenium Content of Alluvial Profiles from Background Areas
Sample Depth Mo Se No. (ins) Profile Description (ppm) (ppm)
BP 14 Moderately poorly-drained shallow alluvium of predominantly limestone origin overlying limestone boulder clay.
Light-brown mottled silt-clay loam ) 2 1.5 Light-brown mottled sandy-clay loam ) Alluvium 2 1.8 Light-brown yellow sandy, mottled clay ) 2 1.0 Weathered, organic drift soil, mottled with limestone pebbles <2 0.5
) Boulder clay, predominantly limestone <2 0.3 ) with a few O.R.S. fragments. Clay <2 ) ) matrix grey with some iron <2 ) 0.2 ) mottling <2 )
(For other elements refer Table 24. Data refers to -80 mesh fraction)
BP 30 Alluvium of predominantly limestone origin overlying limestone boulder clay. Severely impeded drainage. Background metal values.
2702 0-4 Dark brown, humic clay loam 2 2703 4-8 Light brown mottled silty clay <2 2704 8-13 Light grey-brown, slightly mottled clay <2 2705-7 13-42 Light grey, silty alluvial clay <2 2708-9 42-46 Light grey clay with limestone fragments <2 2710-12 46-60 Limestone drift, gravel and boulder clay <2
(Profile adjacent to B/G drift profile BP 29)

169
in the upper "sub-outcropping" slightly weathered drift horizons
(15-30 ins) are not significantly lower than in the alluvial
material and it is possible that concentration is due to the
effects of weathering of the alluvial soils.
Anomalous Areas
Alluvium carrying higher than background concentrations
of Mo and Se flank many of the streams draining the Clare Shales
or areas of drift containing Clare Shales. The geochemical
environment under which the alluvial deposits has been formed
varies (a) with the dominant rock types incorporated in the
detrital fraction of the alluvium, (b) with the physio-chemical
character of the stream waters and (c) with the drainage conditions
under which later soil-forming processes have taken place.
In the detailed study area around Flynn's Farm (Figs.
18-23), it is possible to define several different types of
alluvium. Most common and of greatest agricultural importance
because of their relatively widespread extent and high Se content
are calcareous alluvial deposits on the limestone flanking
streams flowing east from the Clare Shales. These extend as
far as 3 miles downstream from the Clare Shales and include the
toxic seleniferous soils at site B (Fig. 20). Typical profiles
are described in Table 28 and shown in Figs. 36 and 37.
Characteristically., these soils are neutral to alkaline in
reaction with only minor peat development. In contrast,

•-•-•—• METAL CONTENT OF SOIL te-24 ins
RED CLOVER.
-Peaty grey lapsed
L grey Sandy and onarly clayt
Slut -grey clay
DrtIt
OP 70
at tr
IMRE SPA BPS, 1P7I 11P4I BP! RES BPAL
SCALE OF S. VALUES (SO WWI fraction )
DISTRIBUTION OF SELENIUM IN ALLUVIUM -_, , ? _: _ _ _ _-? . ,
. , . .‘ .1 i NORTH-SOUTH SECTION ACROSS ALLUVIAL FLAT
: z z .. .. - . 3 Toxic Soil Site B. .. ..
o as
VERTICAL SCALE RICHES FIG. No. 36.

MO Sentient of Sod Clover (ppm)
—4
Si t
o. 31 3 cent•ni of ground rater (pm.)
I .
alts
'.7
DP3
• e , '' .. e .• • \ • s' -
SCALE OP Me VALUES
(-SO mesh(ruction
s to PPM
DISTRIBUTION OF MOLYBDENUM IN ALLUVIUM. • • • e' •-• 7 — / • • • .•• • / • • .• • to \ •
NORTH-SOUTH SECTION ACROSS ALLUVIAL FLAT
Toxic Soil Site B. SCALE AND LEGEND AS FOR PIONs
FIG.No. 37.

Table 26: Metal Content of Background Alluvial Profiles (BP 14, ref. Table 25)
Horizon Depth Pb Ga V Cu (ins)
Zn Ti Ag Ni Co Mn Cr Fe203 Parts per million
(6-4 160 16 85 30 160 5000 Alluvium 4-10 160 20 100 30 200 6000
L10-15 130 16 130 60 160 5000 Weathered it 15-20 100 13 130 60 100 4000 Drift
(20-30 160 16 loo 85 loo 6000 ( 30-42 85 8 60 30 <50 3000 Drift 1 42-48 loo 6 4o 3o <50 2000 48-54 85 6 6o 20 <50 3000
<0.2 60 20 200 loo 5 99 85 4o 200 loo 6 It 85 5o 600 130 8
100 40 850 160 8 it 85 3o 85o 130 6
50 20 400 85 4 FI 40 20 500 60 3
50 16 16o 85 4

171
alluvium derived predominantly from Clare Shales (Table 26,
BP 28) is strongly acid in reaction and peat horizons are well
developed.
Alluvium of Predominantly Clare Shale Origin
North-west of Flynn's Farm alluvium has been
deposited flanking North-west Creek (Figs. 18 and 19). Here
the adjacent overburden consists largely of Clare Shale residuum
and drift. Detrital material in the lower horizons of the
alluvium is formed mainly from Clare Shale fragments. Severely
impeded drainage conditions have led to substantial peat develop-
ment in the upper horizons of the profile which in this respect
is similar to some of the peaty-swamp deposits (Table 27).
The profile is divided into two major horizons.
Firstly, a basal layer (47-85 ins) of essentially detrital
material consisting of blue-grey clays and rock fragments,
mainly black shale, which contains on average 9.5 ppm Mo and
2.25 ppm Se. Overlying this is a characteristically organic-
rich series of horizons of fine clays, silts and peaty material
containing significantly higher concentrations ranging from
10-30 ppm Mo and 4.5-20 ppm Se.
The acid pH of this alluvium (4.88-5.95) is in
contrast to the neutral to alkaline reaction of alluvium
deposited in the limestone areas.

Table 27: Profile (BP 28) of Anomalous Alluvium of Predominantly Clare Shale Origin
Sample No.
Depth (ins)
Profile Description pH Mo Se
(ppm) (ppm)
2485 2486 2487 2488 2489 2490 2491 2492 2493 2494
0-5 5-11 11-20 20-32 32-39 39-47 47-54 1 54-66 66-77 7?-85 .1
Dark grey, humic, silty gley. Black shale fragments Dark grey-brown peaty gley Dark brown silty peat Dark brown silty peat Dark brown silty peat Light grey, fine organic-rich clay Blue grey clay with black shale fragments
I, and some limestone and chert material. Proportion of black shale increases near base of hole. Near .bedrock?
. 5.23 5.36 5.41 4.94 4.88 5.17 5.34 5.30 5.82 5.95
15 15 25 25 25 10 8 12
ir 8 10
4.5 5.0 7.0 11.0 20.0 4.5
2.25
Metal content of groundwater in hole: 1.2 ppb Se, 6.0 ppb Mo, 1300 ppb Fe.

Horizon Depth
(ins)
Gleyed I 0-5 topsoil 1 5-11
11-20 Silty c 20-32 peat 1. 32-39 Organic clay39-47
Alluvial 47-54 I
1 54-66 clays and
sand 1 66-77 t 77-85
Table 28: Metal Content of Alluvium of Predominantly Clare Shale Origin (BP 28)
(For complete profile description refer to Table 27. Data refer to -80 mesh fraction)
(Metal contents of the peaty horizons have been adjusted by estimation for the loss of organic matter on ignition prior to spectrographic analysis)
Mo Se Pb Ga V Cu Zn (Parts per million)
Ti Ag Ni Co Mn Cr Fe2o3
1
/0
15 4.5 40 20 500 130 100 5000 0.3 60 20 160 100 8 15 5.0 30 16 400 160 85 5000 0.2 85 20 200 130 10 25 7.0 25 13 320 600 70 4000 o.4 16o 5o 65o 8o 6 25 11.0 32 8 700 1600 80 4800 0.9 320 32 48o 110 5 25 20.0 32 16 700 800 130 4000 0.8 8o 25 480 110 8 10 4.5 30 30 850 160 160 5000 <0.2 130 30 100 160 10 8 ) 30 13 400 100 16o 6000 <0.2 100 40 100 16o 3 12 (
2.25 4o 16 400 130 loo 6000 <0.2 130 6o 400 16o 8
8 30 16 300 100 130 6000 <0.2 100 60 400 130 8 10 i 40 16 200 100 130 5000 <0.2 100 50 300 160 8

174
When considering the possible mechanisms that have
influenced the dispersion of Mo and Se it is apparent that the
broad sub-division of the profile into a detrital lower horizon
and an upper organic-rich layer, reflects two different phases
of deposition and geochemical environment. It is believed that
the lower horizons of blue-grey clays and rock fragments rep-
resents mechanical alluvial conditions in which detrital material
was deposited in a post-glacial depression by the old free-
flowing stream. Following the initial filling of the depression,
severely impeded more or less swampy conditions developed, in
which fine material only was deposited by a slew-moving stream,
coincident with the growth and deposition of peaty matter.
Geochemically therefore, the Mo and Se content of the basal
horizons represents the metal content of the mechanically
deposited old stream sediment. The Mo and Se contents of this
horizon are 9.5 ppm Mo and 2.25 ppm Se, which closely correspond
to the present-day active stream sediments from North-West Creek
which contain on average 11.7 ppm Mo and 2.4 ppm Se.
The onset of impeded drainage peaty conditions with
the accumulation of organic matter in the sediments, affected a
change in the geochemical environment. It is believed that the
enrichment of Mo and Se along with Cu, Ag, Ni and Mn in the
peaty horizons (ref. Table 28) is most probably associated with
adsorption of metals by organic matter from percolating etream
waters and also groundwaters leaching from the adjacent Clare

175
Shale residuum and drift-covered hillsides. There is no signi-
ficant enrichment of Fe 02.3 (Table 28) in the peaty horizons
compared with the basal alluvial horizons, and Pb, Ga, Zn, Ti,
Co and Cr have a similarly fairly uniform distribution of values
between the organic and basal clayey horizons. Presumably these
metals do not have an affinity for organic matter under these
conditions.
In the upper gleyed topsoil layers (0-11 ins), the
levels of Mo, Se, Cu, Ag, Ni, Co and Mn are significantly lower
than in the more organic-rich, peaty horizons and the levels
approach those present in the basal horizons.
Alluvium of Mixed Clare Shale and Limestone Origin
Profile BP 10 (Table 29) was taken from the alluvium
flanking South Creek adjacent to the base of the Clare Shales
(Fig. 19). This profile is similar to BP 28 in having a peaty
horizon at 22-46 ins which is enriched in both Mo and Se,
overlying a basal mineral alluvial horizon. However, in this case,
a second silty alluvial horizon (0-22 ins), which contains an
appreciable concentration of organic matter, overlies the peaty
layer and contains roughly similar Mo and Se concentrations.
Anomalous Alluvium of Predominantly Limestone Origin
Profiles BP 2 and BP 4 (Table 30 and Figs. 36 and 37)
were collected from the alluvial flat flanking Flynn's Creek at
toxic soil Site B (Fig. 19). The nearby catchment consists of

Table 29: Profile and Molybdenum and Selenium Contents of Alluvium of Mixed Clare Shale and Limestone Origin
Sample Depth No. (ins) Profile Description
Mo Se (ppm) (ppm)
2305 0-4 Dark grey-brown humic, sandy gleyed loam 50 2306 4-10 Dark grey-brown humic, sandy gleyed loam 70 2307 10-14 Grey, silty mottled organic clay 70 2308 14-22 Dark grey clays with black shale and limestone
.fragments 70 2309 22-30 Peaty horizon of dark brown peaty clay 60 2310 30-42 Peaty clay with some black shale fragments 70 2311 42-46 Mixed grey silty clay and peaty clay 40 2312 46-60 Grey silty clay, few root fragments 12 2313 60-72 Light grey sandy clay with root fragments 15 2314 72-84 Light grey clays with grit horizons and black shale 30
and limestone fragments
9.0
1 12.0
I
5.0

177
limestone drift containing only moderate to background concentra-
tions of Mo and Se (ref. BP 3, Table 22) but the headwaters of the
stream, about one mile distant, rise in the metal-rich peaty swamp
area adjacent to the base of the Clare Shales at toxic soil Site A.
Detrital rock fragments in the alluvium are predominantly lime-
stone with only very rare black shale fragments.
The alluvium can be sub-divided into two major horizons
(Fig. 36). A basal layer of clays and sandy gravels represents
mechanically deposited, stream sediments filling depressions in
the post-glacial stream valley. Overlying these deposits are
calcareous, manly horizons with some sandy intercalations. The
marl deposits of fine sediments and precipitated CaCO3 are believed
to be similar to those being deposited in parts of the present-
day streams (refer Chapter IX). The quiet, semi-lacustrine
conditions under which this took place followed,the infilling
of the lower parts of the stream valley by detrital sediments.
Soil development in the upper horizons of the profiles has given
rise to a gleyed, organic-rich topsoil.
The characteristic feature of metal distribution in
these deposits is the high concentration of Se compared with Mo.
It has been shown that in Clare Shale source rocks the Mo:Se
ratio is in the order of 9:1 and this ratio holds for most of
the residual overburden, drift and Clare Shale alluvium previously
described. It is evident therefore, that preferential accumulation
of Se has taken place during the formation of these deposits.

5.5 ( 2138- 18-24 Light grey coarse grit, some sandy clay 8.60 0.20 <2 .1
2134 0-4 Dark brown, peaty, silty gley 7.13 1.3 8 40 2135 4-8 Mixed peaty gley and sandy grey clay 8.21 0.6, <2 5 2136 8-18 Light grey sandy clays with some limestone
pebbles 8.62 0.33 <2
Table 30: Profile Description and Molybdenum and Selenium Content of Anomalous Alluvium of Predominantly Limestone Origin (Ref. Figs. 36 and 37)
Sample Depth No. (ins) Profile Description
pH HC1 Org. Mo Se Soluble C (ppm) Fe (%) (%)
BP 2
2117 0-6 Dark brown organic-rich, gleyed silt loam 7.28 1.10 9.39 20 20 2118 6-12 it ti It ft II II ti 7.60 0.5 4.93 15 17 2119 12-17 It it II tf If It It 7.65 0.37 5.76 8 22 2120 17-24 Light grey clayey sand. Limestone and
black shale fragments 8.54 0.15 1.0 2 t 18 2121 24-32 Light grey sandy clay. Some root fragments 8.33 0.17 2.69 5 3 2122 32-36 Light cream manly clay. Some root fragments 8.4o 0.27 4.59 15 55 2123 36-45 Light cream manly clay. Root fragments 8.48 0.18 2.56 8 40
2124 45-54 Blue-grey alluvihm silty clay. Limestone pebbles 8.40 0.30 0.78 5 11
2125 54-66 Grey drift boulder clay 8.72 0.48 0.19 2 1.5
BP

pH HO]. Org. Mo Se Soluble C (ppm)
Fe(%) (%)
Sample Depth No. (ins) Profile Description
<2 18 3 14
<2
<2
<2 1 3.5
8.28 1.10 8.501
(1.4 8.50J
8.33 1
(1.8 <2
BP 4
2139 24-28 Light cream manly clay with root fragments 2140 28-40 Light grey, manly clays with root fragments 2141 40-51 Grey mottled alluvial clay, minor sands and
limestone pebbles 2142 51-63 Grey mottled alluvial clay, minor sands and
limestone pebbles 2143 63-75 Grey mottled all•ivial clay, minor sands and
limestone pebbles
2144 75-85 Grey mottled alluvial clay, minor sands and limestone pebbles
Table 30 (continued)

Depth
Se (ins)
BP 2 20 28 Peaty gley I
0-66 15 17
t 12-17 8 22
f 17-24 2 18 Manly clays
I 24-32 51
1
32-36 15 55 36-45 8 4o
Alluvial clay { 45-54 5 11
Drift 54-66 2 15
BP 4
Featy gley { 0-4 8 40
f 4-8 <2 5 1 8-18 <2I Manly clay 1 18-24 <2 f 5°5
24-28 <2 18
28-40 3 14 40-51 <2 I 51-63 <2 y Alluvial cla
[ 63-75 <2 3.5
75-85 <2 1
Table 31: General Metal Content of Anomalous Alluvium of Predominantly Limestone Origin
Pb Ga V Cu Zn ppm
Ti Ni Co Mn Cr Fe203
Organic Carbon
Acid Sol. Fe
40 6 300 loo 85 4000 6o 20 600 160 6 9.39 1.10 30 5 100 85 <50 850 50 16 160 85 3 4.93 o.5o 16 4 6o 130 " 85o 6o 13 loo 4o 2 5.76 0.37
8 2 6o 13 I, 85o 40 lo loo 3o 0.8 1.o o.15 10 8
3 3
60 50
16 20
I, it
1300 1300
60 60
10 13
100 100
4o 4o
1.3 1.6
2.69 4.59
0.17 0.27
6 <2 6o 13 n 500 3o 8 130 20 1.3 2.56 0.18
13 3 60 8 ,t 1300 50 10 100 30 1.6 0,78 0.30
13 3 85 8 II 1300 40 10 160 30 1.3 0.19 0.48
5o 8 60 100 100 4000 85 20 300 100 4.o 1.3
13 4 6o 20 <50 4000 30 13 130 60 1.3 o.6 8 3 4o 8 " 2000 30 <5 16o 16 1.0 1 5 2 50 6 ,1 600 30 5 130 16 o.8 1
0.33
10 2 100 13 " 600 3o <5 130 13 0.6 0.2
30 4 60 20 it 1 3000 50 13 200 60 3.0 1.10 85 5 60 30 " 4000 60 20 400 85 4.0 16 6 60 30 ti 4000 60 20 400 85 4.0 I
1.4
30 5 85 40 If 3000 85 20 200 85 3.0 ) 20 5 85 4o ft 2000 60 20 200 85 3.0 i
1.8 L

181
From Fig. 36 and Table 30, it is clear that the
highest concentrations of Se occur in the marly clay horizons
and the topsoil. Except for the enrichment of both acid-soluble
and total Fe in the topsoil, it is apparent that there is no
correlation between the Se content and the amount of iron present.
On the other hand, the highest Se concentrations in the marly hori-
zons can be correlated with high organic carbon contents (Table 31).
It is believed that adsorption on this material has lead to the
accumulation of Se. It will be shown (Chapter IX) that similar
processes of organic matter accumulation in calcareous marly
deposits, accompanied by an enrichment in Se, are taking place
in the present-day streams. The basal mineral alluvial clays
contain only 0.78% compared with 2.5 to 4.59% organic carbon
in the marl deposits. The mechanism of CaCO3
precipitation to
form the marl deposits is believed to be from the stream waters
under conditions probably closely similar to those in Flynn's
Creek adjacent to these deposits. Under these conditions CaCO3
with up to several percent included organic matter is being
deposited from waters at a pH of 8.25 containing 396 to 4247pg
HCO3- per litre and 7.6 to 9.0 ppb Se and 16.3 ppb Mo in
solution.
Mo on the other hand, is not significantly
concentrated in the marly horizons compared with the basal mineral
sediments and it would appear from this that the mechanism giving
rise to the accumulation of Se in the organic-marls does not
influence the dispersion of Mo. These observations are confirmed

182
by data on present-day stream sediments (Chapter IX) in which
it is shown that most of the dispersed Mo is in the iron oxides
in the sediments whereas Se accumulates in organic matter. The
amount of Mo present in the marly and basal clay horizons can
therefore be attributed to mechanically deposited mineral
sediments.
In the topsoil horizon both Mo and Se appear to be
significantly concentrated compared with the immediate underlying
horizons. In the case of Se this can be correlated with the higher
organic matter content of this horizon and reflects similar patterns
of Se distribution in other overburden profiles examined. It is
believed that the higher iron content of the topsoil (1.1-1.3%
acid-soluble iron compared with less than 0.5% in the underlying
marl) is the principal means of retention of Mo in this horizon.
It has been observed that after heavy rainfall complete satura-
tion of the topsoil horizons occurs so that the groundwater level,
normally 12-24 ins from the surface, rises to mix with the surface
water. A precipitate of fine iron oxides accumulates in the surface
waters under these conditions, presumably by the oxidation of
ferrous iron in the groundwaters to the less soluble ferric form.
Under such conditions co-precipitation or adsorption of Mo from
groundwaters (which contain from 0.25 to 4.25 ppb Mo) could occur
as shown by Jones (1956 and 1957).
Briefly, with regard to other elements, it can be seen
from BP 4 (Table 31) that most metals, including Pb, Ga, Cu, Ti,
Ni, Co, Mn, Cr, Fe and possibly V are distributed in a reverse

183
trend to Se and the highest concentrations occur in the basal
clay horizon. Zn and Ag were not present in detectable
quantities. Most metals have concentrated with iron oxides
and Mo in the topsoil horizon compared with the underlying
marl.
(b) Size Analysis of Alluvium
Two samples, one (2120) from the organic marly clay
horizon and the other (2124) from the basal alluvial clay were
subjected to mechanical analysis (Fig. 38). The marl sample
included material from one of the sandy intercalations in this
horizon. The basal clay sample consisted almost entirely of
very fine sand, silt and clay.
In the marly sample Se is highly concentrated in the
silt and clay fraction (35 ppm) compared with about 5 ppm in the
fine sands. There is also a significant rise in the Se content
of the 20-80 mesh fraction of the coarse sands. Organic carbon
has a similar pattern of distribution to Se and this substantiates
observations on the influence of organic carbon on Se accumulation
in this material. Mo was only detectable in the silt and clay
fraction in which the highest Fe concentrations also occur.
It is believed that the concentration of Mo in this fraction can
be attributed to inclusion in detrital matter containing iron
oxides. The profile studies of alluvium did not show any
evidence of the precipitation of Fe in the alluvium, except in
the topsoil horizons and for this reason a detrital origin for

10 -
oco•
(0-
40 -
SN
O1
13
VS
4 3
21S
Oft
**I
lo -
Jo
/0 -
0
A to G Size fractions as for drift size analysis. FIG.35.
317
-PC A - F Mo =<2 ppm.
of
9Se 70
- ►
ro
►
; + Org.C. +0
10
/0
( 'A
)SN
O1
1.3V
EIA
32
IS
Org
.0 a
nd
Fe(
/.)
. de lotion.
-0 A
Sample 2120 BP 2 17" -24:' Marty clayey sand.
FIG.No.38. SIZE ANALYSIS OF ALLUVIUM SAMPLES.
AND DISTRIBUTION OF METAL BETWEEN FRACTIONS.
Jr
Jo
Alf
E a. C.
.a /( C
0 /0
0
is
J0
if
,20
lb.
Mo
an
d Se
(p
pm
)
/0
0
.14
io Org
.0 a
nd
Fe (
/. )
A Sample 2124 BP 2 45"-54" Alluvial clay.

184
Mo is favoured.
In the sample from the basal alluvial clay (2124)
the distribution of both Mo and Se follow Fe203 in being
f6elatively evenly distributed between sizes with some slight
enrichment in the coarse sand and the silt and clay. Organic
carbon was not determined but the profile studies (Table 30)
indicate that the organic carbon content of this horizon was
very low (0.78%) and presumably does not play a large part
in metal distribution. The even distribution of Mo and Se
in this sample, along with Fe203, is in line with the basically
mechanical origin attributed to this horizon.
With regard to the other metals determined (Table
32), most elements, with the exception of V in the marl sample,
follow the Mo and Se patterns.
(iv) Peaty-Swamp Deposits
Although of relatively small areal extent, the three
deposits of this type in the Flynn's Farm area (Figs. 18 and 19a)
are of particular significance in that they contain the highest
concentrations of Se and Mo recorded in the area (refer Chapter V,
3). Herbage growing on these soils may also contain extremely
high concentrations of Mo and Se.
The peaty-swamps have formed in post-glacial
depressions in the till adjacent to or overlying the Clare
Shales. The Irish Soil Survey (Finch and Ryan, 1966) classify

*A
BP 2 Marly clayey sands (Sample 2120, 17-24 ins)
Mo Se Pb Ga
<2 1.9 5 <2
<2 9.5 7 <2
<2 8.o 5 <2
<2 5.o 5 2
<2 4.5 5 <2
<2 4.5 7 <2
5 35 35 7
v 60 7o 4o 40 3o 3o 5o Cu 7 8 7 6 4 3 50
(ppm) Zn <50 <50 <50 <50 <50 <50 <50 Ti 100 100 100 200 400 700 2000 Ni 8 7 7 8 10 8 70 Co <5 <5 <5 <5 <5 <5 20 Mn 200 150 150 150 400 400 300 Cr 10 10 7 7 20 20 70
CO Fe203 0.3 0.5 0.6 0.6 o.6 0.5 1.6
BP 2 Alluvial clay (Sample 2124, 45-54 ins)
Mo 2 4 4 2 2 2 4 Se 2.0 5.8 7.0 2.0 2.5 2.8 9.5 Pb 20 7 7 6 6 7 20 Ga <2 <2 <2 2 2 2 5 v 7o 7o 6o 7o 8o loo 400 Cu 5 7 7 7 7 6 20
(ppm) Zn <50 <50 <50 <50 <50 <50 <50 Ti 100 200 300 200 500 700 3000 Ni 10 20 20 20 20 20 60 Co 5 5 5 5 5 5 15 Mn 500 400 200 400 400 400 500 Cr 10 15 15 15 20 15 60
(%) Fe203 1.0 0.8 1.0 0.6 1.0 1.0 1.3
185
Table 32: Distribution of Metal Between Size Fractions of Alluvium
*A 2 mm - 20 mesh B 20 mesh - 38 mesh C 38 mesh - 80 mesh
D 80 mesh - 125 mesh E 125 mesh - 200 mesh F 200 mesh - 0.02 mm
G Silt and clay

186
these deposits as being of alluvial lacustrine origin. The early
lacustrine stages are marked by fine clays and sands eroded from
the surrounding limestone drift and Clare Shale overburden. At
the margins of the deposits this material may merge with colluvium
derived by hillwash and gravity movement of drift and Clare Shale
detritus from upslope (refer Fig. 34).
Mixed with the detrital sediments are distinctive
calcareous marl horizons probably of similar origin to CaCO3
being precipitated in the present-day streams and in the alluvial
deposits described previously. This material also contains up to
several percent organic carbon (Table 34).
Swamp conditions developed as the lake filled with
sediments and marl and these horizons are overlain by peat. Severe
decomposition during soil formation of much of the peaty matter has
since occurred and resulted in a fine, black, sticky peaty-gley B
horizon. The topsoil horizon is a dark-grey to brown peaty or
humic gley-loam.
The Irish Soil Survey (Finch and Ryan, 1966) classify
these soils in the Flynn's Farm area mainly as peaty phases of the
Drombanny Series. They describe them as low-lying, poorly drained,
rich in organic matter and neutral to alkaline in reaction. With
regard to the high concentrations of Se and Mo, Finch and Ryan
point out that these soils only contain excessive amounts of Mo
and Se where they are associated with the Clare Shale beds or drift
containing Clare Shales.

187
Studies of metal dispersion in this environment were
mostly carried out by means of profiles taken along two sections
across the east margin (Fig. 39 - toxic soil site A) and the south
edge of the peaty swamp at the head of Flynn's Creek (Fig. 34).
In the former, drainage is dominantly from limestone drift with
moderate metal values. The latter traverse flanks colluvium and
drift of dominantly Clare Shale origin with generally higher metal
values. A background profile from a peaty swamp overlying Namurian
rocks was also collected. Confirmatory profiles were sampled from
the peaty areas immediately north and south of Flynn's Farm
(Fig. 19a).
Metal values from the more peaty horizons were deter-
mined spectrographically. Where the organic matter content is known
the metal values have been adjusted for loss on ignition. Where
the organic content is not known, the adjustment was by estimation
based on the appearance of the sample. In view of the very wide
range of Mo values in particular, and the fact that organic carbon
levels seldom exceed 25 per cent even in the more peaty horizons,
it is considered that the estimates of loss by ignition will not
appreciably affect the significance of the results.
(a) Distribution of Metals in Peaty-Swamp Profiles
Background Areas
A profile (BP 109, Table 33) overlying barren Namurian
rocks situated well away from any drainage from Clare Shale soils
or drift, showed that although there is some concentration of both

pH,Eh
Mo Se
•
75x.0 50 20
7 0 3 5 $. 2
6.5 2 0 • o
Se = 2.6 ppb Mo tr 30
BPS eH =.0.49 V Se Mo Ph = 72
(En readings 28-7-65 1115 hrs.) MoSe ppb
------- ----------- 100 --- pH Eh -- + 'Vol It 73 .44
E GROUND WATER SAMPLES
r 5
011 35 533 2 .) //
, • -I- .••
4. I ‘• .3 3 -"'
<2
0
04
et.
<2
c2
<2
o sj
TOPO.and HORILSCALE (FEET) I 5 10 20 30 40
VERTICAL SCALE( INS.)
IIIS 40 Soil metal contents-ppm.
FIG. No. 39.
- 10
70-.03 5
49e44'r.
3 1,
C, C>
4°51, °
—<5-6 -050 ✓ ,
' / e. 5 / 0
- e
15 30 r' tcl 7'. \ ‘4 \ ., '. 1 , \. 0/f
40.:,;_c:,_ —,..' •-&,. 'c,'' tc;.;: <75' ' c, <:, c::, C? <="-C3 CP C; 4:3.6:1 z'
.
30/0/ C ••- e.
"‘ 4950 a
229 150 , .. = !"1:1 ! I — 4' 3 C Ground Water _ _ 2. _ top 2 ''-208,050 .- - -- - - 1- I ' '.- - - Level. .. 4
i ... „, i in too =, - i
. , 1
140 .700
• Mo content of ground water. (ppb) -0 $e
pH of ground water. Eh
BP911 Se Mo
94 911 °Pm0
6
49 Se Mb BP. 95.
SP19 DP97 DP93
Se Mo Se Mo Sc Me Se 14°S.M°25 20 fie./714:;' 25 0 -.....,
, • -.*--;-:-• 40 • 2$ 30 1.fe : t:r o t 1 ..... 2110 30 • ••• 25 30 '''' _ _ 19 3° --1.-- 41
,
.612_12.1), 95 _ S... t" ••i 35 50 1.1, .;
39 40 ..--* ', - ., e ,
- -.1. 2 -., /
0 : O
1 0
- tin 2.4
2 0---- ------ -------
Organic-rich topsoil.
Organic manly clay, Marl. Some organic tl root remnants and gastropod shells. 1,, • alack,semi-dec ornp peat soil.
'•-•
•-1; t Weathered drift with
Drift gravel and boutder-clay. some organic matter Predom.lirriest. some CLSh. frogs.
WEST - EAST VERTICAL SECTION ACROSS EAST MARGIN OF FLYNN'S TOXIC FIELD.
Showing Variation of Metal Content of Ground Water and Soil between Moderately Drained Drift and Peaty-Swamp Area with Impeded Drainage.
Boulder bed.
0

188
metals in the lower peaty horizons, values are not appreciably
greater than normal background levels.
Table 33: Distribution of Molybdenum and Selenium in Peaty-Swamp Profiles from a Background Area (BP 109)
Sample Depth No. (ins)
Horizon Description Mo Se
(ppm) (ppm)
4174 0-8 Dark grey-brown peaty, silty gley <2 1.5 4175 8-24 Dark brown to black peaty 6 1.3 4176 24-31 Dark brown to black peat 4 3.0 4177 31-54 Fine, grey-green clay <2 1.0
Peaty-Swamp Profiles from the Anomalous Flynn's Farm Area
A typical profile (BP 6) from toxic site A (refer
Fig. 39 for complete section) shows the following vertical distri-
bution of metal (Table 34).
This profile is similar to typical seleniferous soil
profiles described by the Agricultural Institute from the same
area. The neutral to alkaline nature of the soils is attributed
to alkaline waters draining the surrounding calcareous drift.
Both Mo and Se are enriched in the peaty horizons and
there is a marked increase in the proportion of Mo towards the
base of the peat and in the clay horizon. However, in the topsoil,
marl, upper peat horizons, Se and Mo contents are about equal.
The drift sampled from the bottom of the profile a6mpared with

Table 34: Profile (BP 6) and Distribution of Molybdenum and Selenium in Peaty-Swamp De-cc:telt, Flynn's Farm Area
Sample Depth No. (ins) Profile Description
pH Mo Se Organic HC1-(ppm) (ppm) Carbon Soluble
Fe (%)
2150 2151 2152 2153 2154 2155 2156
BP 6 (Ref. Fig. 39)
Dark brown, organic rich, silty clay loam Black, peaty silty gleyed loam Dark brown-black peaty loam Black, crumbly, peaty loam Dark grey-green silty organic-rich clay Light cream sandy marl Dark grey gravel drift. Predominantly limestone with some black shale. Some alteration by overlying deposits, some marl.
7.01 6.74 6.67 6.53 4.3 7.55 7.8
50 150 150 600 700 40 30
48 7.9 1.9 228 11.8 2.4 200 19.1 2.8 190 19.0 3.0 150 11.6 3.0 45 2.6 1.1 15 1.8 0.9
0-7 7-11 11-15 15-21 21-28 28-31 31-42
BP 7 (Ref. Fig. 34)
2272 0-6 Dark brown peaty gley 6.35 360 250 2273 6-12 Dark brown-black peaty gley 5.80 800 250 2274 12-18 Black, sticky, peaty material 3.25 1100 360 2275 18-25 Black, sticky, peaty material 4.82 2000 490 2276 25-36 Green-grey and cream sandy clays marly 6.69 7o 175 2277 36-49 Cream, sandy marl 7.15 7o 125 2278 49-54 Drift gravel and clay with black shale and 7.33 4o 56
limestone pebbles

Table 34 (continua-1)
Sample Depth No. (ins)
Profile Description pH No Se Organic HC1-(ppm) (ppm) Carbon Soluble
Fe (%)
BP 13
2332 0-4 Dark brown peaty gley loam 5.5 46 18 20.3 2333 4-10 Dark brown loamy peat 100 39 - 2334 10-18 Medium brown peat - 400 114 - 2335 18-24 Dark brown to black peat - 400 96 21.7 2336 24-36 Dark brown to black peat 460 84 2337 36-42 Dark brown to black peat - 460 175 - 2338 42-48 Grey, sandy, limestone gravel drift, some 20 90 -
peaty mud

191
adjacent fresh drift (Fig. 39) shows evidence of alteration, with
the introduction of organic matter, Mo and Se. Size analysis of
this sample (No. 2156, Fig. 35) showed a concentration of Mo and
Se in the silt-clay fraction and a close correlation of metal
contents with Fe and organic carbon. Throughout the profile there
is a general trend for both metals to follow acid-soluble iron and
organic carbon content. Se shows a greater affinity for the organic
marl horizons than Mo.
A profile from the south side of the peaty area (BP 7,
Fig. 34) shows a similar metal pattern to BP 6, but the peak values
are much higher, up to 2000 ppm Mo and 490 ppm Se.
Profiles adjoining BP 7 (Fig. 34) and BP 6 (Fig. 39) also
demonstrate an accumulation of metal in the peaty horizons and
confirmatory profiles from the northernmost peaty swamp area showed
a similar relationship (Fig. 19a). In this swamp there is no develop-
ment of marl or clay horizons underlying the peat which rests
directly on drift. A representative profile (BP 13) is shown in
Table 34.
With regard to other elements, Table 35 records their
distribution in the typical swamp profiles BP 6, BP 7 and BP 103
(Figs. 34 and 39).. Compared to the metal content of the underlying
drift, only Cu, Ni, Co and possibly V and Fe follow Mo and Se in
being consistently present in high concentrations in the peaty and
organic-rich clay horizons. Pb, Ga, Zn and Mn are enriched in
these horizons in only one or two of the profiles, and Ti, Ag
and Cr have no apparent affinity for the organic peaty material.

Table 35: General Metal Content of Peaty-Swamp Soils - Flynn's Farm Se Toxic Field
Horizon Depth (ins)
Mo Se Pb Ga V Cu Zn
(Parts per million)
Ti Ni Co Mn Cr Fe203
(%)
BP 6 Toxic Soil Site A (Ref. Fig. 39)
1 Topsoil gley 0-7 50 48 85 8 3O0 16o <5o 4000 6o 20 600 85 6 1 i, .1 7-11 150 228 60 8 400 300 u 4000 16o 3o 85o loo lo Peaty gley 11-15 150 200 30 4 1000 300 " 4000 300 20 600 130 30?
n n 15-21 600 190 30 3 1300 160 " 3000 300 20 400 85 >357. Organic clay 21-28 700 140 40 10 400 130 " 8500 200 50 160 130 16 Marl , 28-31 40 45 6 2 85 60 " 600 10 5 200 20 1.6 Drift 31-42 30 15 13 3 130 30 " 3000 60 13 100 60 1.6
BP 7 South side of Flynn's toxic field (Ref. Fig. 34)
Topsoil gley 0-6 360 250 35 3 360 150 90 2700 450 55 350 55 >35? II II 6-12 800 250 15 3 320 130 80 1600 48o 5o 16o 50 >35?
Peaty gley 12-18 1100 360 3 7 300 90 60 700 4000 600 100 30 >35? ,/ ft 18-25 2000 490 1 20 250 20 <50 180 5000 1500 loo 8o >35?
Organic clay 25-36 70 175 2 3 60 10 IT 50 600 60 85 5 3.0 Marl 36-49 70 125 4 3 60 6 " 300 500 60 130 8 2.0 Drift 49-54 4o 56 13 3 60 10 " 2000 130 30 400 6o 1.3
BP 103 (Ref. Fig. 34)
Topsoil gley 0-6 150 55 30 10 130 160 100 3000 300 85 300 60 2.0 Peaty gley 6-23 1500 200 10 4 4o 200 <50 850 N.D. 85 130 50 6.o Drift 23-50 100 38 10 2 30 50 <50 850 100 30 200 50 0.8
Ag not detectable, i.e. less than 0.2 ppm

193
V, although enriched in the peaty horizons, does not accumulate in
significant amounts in the clayey and organic marl material.
Topsoil development is marked by a general decrease in
the Mo and Se content compared with the lower peat horizons. The
decrease is much more marked in the case of Mo than Se. Under the
conditions of peat-swamp formation followed by soil-formation,
possibly involving freer drainage in the upper horizons, it is
evident that the conditions giving rise to retention of Mo have
favoured the lower peat horizons whereas Se is retained in much
more even amounts throughout the profiles.
The relationship between topsoil and the underlying
peaty horizons differs between the two major profiles, BP 6 and
BP 7, for many of the other elements (refer Table 35). Pb is
enriched in the topsoil of both profiles but other metals, in
particular Ga, V, Cu, Ti, Zn, Co, Mn show consistant variations
related to soil horizon.
(b) Lateral Metal Distribution Patterns in the Peaty-Swamps and Adjacent Overburden
At the margins of the swamp deposits, variations in the
soil composition largely reflect the drainage conditions under which
the soils have developed. Thus, the contents of Mo and Se (refer
Figs. 34 and 39) are lowest in the better drained soils near the
margins and reach their highest concentrations in the poorly drained
organic-rich horizons in the swamp area itself. The peaty-swamp
soils of BP 7 and adjacent profiles contain in general higher

194
concentrations of Mo and Se than profiles in the section containing
BP 6 (Fig. 39). This reflects the metal content of the overburden
flanking the swamp at these points. The slopes adjacent to BP 7
consist of dominantly Clare Shale colluvium and drift whereas the
drift near the section containing BP 6 is composed largely of
limestone material. From this it appears that local variations
in the Mo and Se content of the swamp soils will largely depend
not only on soil horizon but also on the composition of the flanking
soils and rock type.
In the north-east corner of Flynn's toxic field (Fig. 39)
the peaty-swamp soils are flanked by limestone drift containing less
than 2 ppm Mo and 0.5 to 0.8 ppm Se in the unweathered drift and
10 ppm Mo and 6 ppm Se in the topsoil. The increase in Mo and Se
values in the swamp soils is closely related to the extent of the
peaty horizons and drainage as reflected by the depth of the water
table. Near the edge of the deposit peaty material has developed
directly on top of the drift and moderately high metal values are
present in this horizon over a width of about 100 ft. Where the
swamp deposits proper commence with marly and organic-rich clays
intercalated between drift and peat, the metal levels rise rapidly
in the peaty horizons and the poorer drainage conditions are
reflected in the rise of the groundwater level to within about
one foot of the surface. It is apparent that the rise in metal
levels is most noticeable in the lower peat horizons but in the
upper peat horizons and topsoil above the water table level,

195
enrichment by a factor of about two times is involved. It can
be seen from Fig. 39 that the rise in metal level of the soils of
the marginal slopes to the swamp is marked by an abrupt drop in
the Eh and pH of groundwaters and general rise in the Mo and Se
content of groundwater.
Metal patterns on the south margin of the swamp deposit
(Fig. 54) are somewhat more complex because of the high concentra-
tions of Mo and Se present in the adjacent limestone and Clare
Shale overburden. In the topsoil horizon the Mo and Se levels
rise very rapidly over less than 40 ft. at the transition from
moderately drained gley mineral loams in profile BP 102 (30 ppm
Mo and 9.5 ppm Se) to the peaty gleys of profile BP 101 (160 ppm
Mo and 90 ppm Se).
In the sub-surface horizons upslope, the high concentra-
tions of Mo and Se in the basal horizons of profiles BP 8 and 50)
which were briefly described in the section on colluvium A has been
largely attributed to the high metal content of the adjacent Clare
Shale bedrock. Clare Shale detritus, along with limestone material
derived from drift, forms a high proportion of the soils developed.
The lower metal content of the upper horizons is believed to be
due to the leaching of Mo and Se, indicated by the relatively high
concentrations of Se (7.0 ppb) and to a lesser extent Mo (8.1 ppb)
in groundwater from BP 50. The high metal content of these waters
compared with the lower concentration in similarly drained drift
soils from the section shown in Fig. 39 is believed to be a
dominant factor controlling the higher concentrations of Mo and

196
Se in the adjacent peaty deposits downelope shown in Fig. 34.
In view of the fact that the lower soil horizon intersected by
profile BP 102 in drift boulder clay between the colluvial and
swamp deposits shown in the section, contains only low to moderate
concentrations of Mo and Se (16 and 1.5 ppm, respectively), it is
unlikely that large scale mechanical movement of metal from up-
slope is involved. The relatively high concentrations of Mo and
Se in altered drift immediately underlying the swamp deposits in
this section (in BP 7, 100, 103 and 101) is therefore attributed
to the precipitation of Mo and Se from solution following seepage
from upslope. Adsorption on organic matter in this horizon is
considered the most likely mechanism for metal retention because
of the very low Fe content of the drift underlying the peat (0.8%
Fe203 in BP 103 and 0.6% in BP 101).
With regard to other metals a comparison j.s made
between the metal contents of profile BP 102, situated just
upslope from the border of the peaty swamp shown in the section
in Fig. 34 and profile BP 101, in peaty material about 30 ft from
BP 102 (refer Table 36). Overall, the peaty profile contains)
besides high Mo and Se contents, slightly higher levels of V, Cu,
Zn, Ni, Co, Mn and Fe. Values for Pb, Ga, Ag and Cr are much
the same in both profiles and Ti is deficient in the peaty phase.
Analysis of profile BP 6 (Table 35) and profile BP 95 from the
same section gave generally similar results, although the degree
of enrichment in the more peaty profile (BP 6) was somewhat
greater. It is believed that this is at least in part related

Table 36: Comparison of the Metal Content of Peaty and Non-Peaty Soils on the Margin of Peat Swamp Deposits (Ref. section, Fig. 34)
BP 101 (Peaty) BP 102 (Non-peaty) Metal (PPm) Topsoil
0-6 ins Peat 6-20 ins
Altered Drift 20-30 ins
Topsoil 0-6 ins
Clay Loam ft-12 ins
Drift 12-37 ins
Mo 160 130 30 30 15 16 Se 1 90 125 18 9.5 5.5 1.5 Pb ' 50 32 16 30 40 16 Ga 10 5 4 6 8 10 V 130 85 50 85 85 4o cu loo 8o 3o 6o 60 10 Zn 160 8o <50 <50 50 <50
Ti 2000 180 850 3000 3000 100 Ag 0.2 0.2 <0.2 0.2 0.2 <0.2 Ni 100 18o 6o 85 loo 5o
co D 30 35 16 20 30 20
Mn 400 18o 160 200 85 200
Cr 85 85 30 60 85 60
Fe203 1.5 1.2 0.6 0.9 0.7 o.8
Organic Carbon
% 8 20 2 3 1.5 0.5 (Estimated only)

198
to the greater Fe203 content of 10-35 per cent compared to 2 per
cent in BP 95.
(c) Accumulation of Molybdenum and Selenium in Peaty-Swamp Soils
The accumulation of metals in peat deposits is a
relatively commonly recorded phenomena (Mitchell (1954 in Scotland,
Cannon (1955) in the United States and Salmi (1950) in Sweden).
The latter two authors report excessive concentrations in swamp
areas associated with nearby base metal deposits. Lakin and Byers
(1945) describe Se-enriched lacustrine deposits possibly similar
to the basal horizons in Flynn's Farm swamp. They attribute this
enrichment to mechanical erosion and leaching of Se from adjacent
seleniferous drift. The Irish Agricultural Institute (Fleming and
Walsh, 1957), recognise the association of seleniferous soils with
metal-rich Clare Shales and correlate the metal-rich horizons with
those of highest organic status. They also attributed the source
of the metal to leaching from the surrounding drift which contains
moderate amounts of both Se and Mo. The actual process of accumu-
lation is considered by them (and by Finch and Ryan (1966)) to be
a function of the organic cycle, by uptake of metal from solution
by plants with subsequent retention in peat residues. They
consider the form of Se in the soil to be mainly inorganic
selenite (Se03') because of the much greater solubility of selenate
and organic Se compounds and also because of the low levels of
water-soluble Se from toxic soils (in the order of 0.33 to 2.9%
of total Se present.

199
The recent studies confirmed that the seleniferous peat
bogs were confined to Clare Shale areas of severely impeded drainage.
The relationship between the highest Se values and the most organic-
rich horizons was also apparent. It is also clear though, that
because of the high concentrations of both metals in the relatively
organic-poor marl, clay and altered drift horizons, factors other
than the uptake of metal by plants contribute to metal accumulation.
Also the divergence of Mo patterns from those of Se in
certain horizons indicates that other mechanisms, possibly co-
precipitation or adsorption of Mo and Se, influence secondary
dispersion in these deposits.
Firstly with regard to the source of metal in the peaty
soils; the metal-rich nature of groundwaters entering the peaty
swamp area at Flynn's Farm from the adjacent drift and Clare Shale
colluvium was confirmed by the analysis of groundwaters draining
into the swamp (Figs. 40, 34 and 39). Values of 0.6-7.0 ppb Se
and 3-27 ppb Mo compare with background values of generally less
than 0.5 ppb Mo and Se for groundwaters well away from the Clare
Shale area. It is significant that the metal content of the water
in BP 8 (8.1 ppb Mo and 7.0 ppb Se) in dominantly Clare Shale
colluvium and drift is higher than that in BP 48 (3.1 and 1.0 ppb Mo
and Se) in predominantly limestone drift. This relationship is
reflected in the metal content of the adjacent peat deposits which
is generally higher at the southern edge of the deposit than in the
north-east section. It is also apparent from the above plans and
sections that the metal content of groundwaters from within the

•
o SPRINGS AND SEEPAGES.
• o 5
• • • •
"M. 1r.
•
1t,
—
100 200
20 11 • • •
•
FEET
2.5 NORTH CK.CATCHMENT AREA.(Ref.rtg.No. 52. )
3.-
4.1 69
1.6 01.25
7.5 is\ 8.75 3.1 \IV 1•5 e e 5.4
121 re
• SIO •, • • t6.25
• • ...225 •
•-•.‘ 1
1 e?
t''' e
\.„ ?•-• 2.5
•••
▪ ••• ▪ ow*
• 'L .4"
BP 50 ® 7 Section tine.
\ir-q•e..... Re f.Fig.No. 34. FIG.No. 40.
FLYNN'S FARM, PEATY-SWAMP AREA
Mo and Se CONTENT OF GROUND and STREAM WATERS.
2-1
100 4 •••
•
400 El" 7-1
1000 14 mat 38
N
• maw Or.
110 BP.6.
2.6 I
1
4.5 56
40 14
a. 66
em. •
2 5 Mo ppb Section-Ref.Fig.No. 39, 6 Se ppb
17 t
I A PEATY SWAMP 31 37.5 1
DRAINAGE 1 CHANNELS: 1 Well
CI AUGER HOLES.

200
swamp is considerably higher (up to1000 ppb Mo and Z4ppb Se)
than that of the waters draining into it. The groundwater Mo and
Se contents can be correlated with the metal content of the soil,
as described in greater detail in Chapter IX. From this it must
be assumed that changes in the swamp environment are taking place
and involve either concentration of the amount of Se and Mo in
solution by surface evaporation or re-solution of metal previously
accumulated in the swamp deposits.
In view of the climate, which does not favour evapora-
tion, and the substantial water flow in the streams and from
springs carrying high concentrations of Mo and Se (Fig. 4o), re-
solution is favoured. A third possibility is that deep ground-
waters beyond the range of sampling are introducing very high
concentrations of metal from underneath into the swamps. However,
this is discounted because of the close relationship between the
Mo and Se content of waters and the soils at the margins of the
swamps.
Having earlier discounted a mechanical origin for the
high Mo and Se concentrations in the swamp deposits because of the
generally low metal contents of much of the adjacent drift and
established that moderate concentrations of metal enter the swamp
by near-surface drainage from the surrounding catchment area, the
four main possibilities by which Mo and Se may accumulate in the
peat s and organic marly clay sediments of the swamp are:- (i)
direct precipitation of metal, (ii) co-precipitation with iron
oxides, (iii) adsorption on dead organic matter, and (iv) uptake

201
of Mo and Se by vegetation growing in the swamp followed by
retention of these metals in the peat. A fifth possibility
related to Mo accumulation, is that of sorption of molybdate ions
on clay minerals, which has been shown by Jones (1957) to take
place at pH 2 to 4, is discounted firstly, because of the high
pH of the waters tested (6.7-7.2) and secondly the calcareous and
organic, rather than clayey nature of the deposits.
Dealing firstly with the possibilities of direct
precipitation of Se and Mo compounds (i) due to changes in the
pH and redox environment, it can be seen from the data on the pH
of the groundwaters shown in the sections, Figs. 34 and 39 and in
Fig. 42 that there is little or no significant changes in pH.
This is attributed to the buffering action of the high HCO3
content of groundwaters from the ubiquious limestone drift
(347 to 521 mg/litre HCO3). With the exception of weathering
Clare Shale material, all natural waters in the area (refer
Chapter IX) contain similar concentrations.
With regard to Mo, reference to the stability fields
of the more common natural ionic forms (Fig. 41) indicates that
soluble Mo is most probably present as molybdate (Mo0147). At the
pH of groundwaters in the section shown in Figs. 39 and 42
(6.7 to 7.2) work by Jones (1957), on the precipitation of ferric
molybdate, the most likely precipitate to form under these condi-
tions, shows that the Mo content of the waters (3 to 110 ppb Mo)
is well below the saturation level of this compound at this pH

-04 Mo Fe
+ ye.
1.4 Normal range of surface
condit ions.
Temp. = 25°C
Press. 2 1 atmos.
Conc. 10 -7M.
1.2
1.0
0.8
Se 04'
0.6
4, 0.4
0 S. '
S 4 eo
0.2
Se
0*,
-0.2
Mo+"
Fe
-06
•—•••
se,
%.1
0 2 4 6 6 10 12 pH
FIG. No. 41. STABILITY FIELDS OF SOME IONIC
SPECIES OF Mo, Se and Fe.
(after Krauskopf 1955.)
—ye.

Se \ I •
•98 •
11006
6° /23' 7 9',
e
•
H2Mo04 •
0
4-- pH range normal surface conditions
+0.6
+0.5
•
+0.4
Weathering CI.Sh.
106 • Se 04=
-a 0 Sca
197•:93`‘'l •
\9496.95;\
• 4902
+0.1
0.0 2 4 6
8
10 pH
• Flynn's Farm Peaty Swamp. ° Alluvium-Toxic Site B
Numbers refer to profile sites -Ref. sections Fig.Nos.34,39.
F1G.No. 42. pH-Eh STATUS OF GROUND WATERS
With Reference to Stability Fields of Se,Mo&Fe. (For complete fields refer Fig•Na 41. )
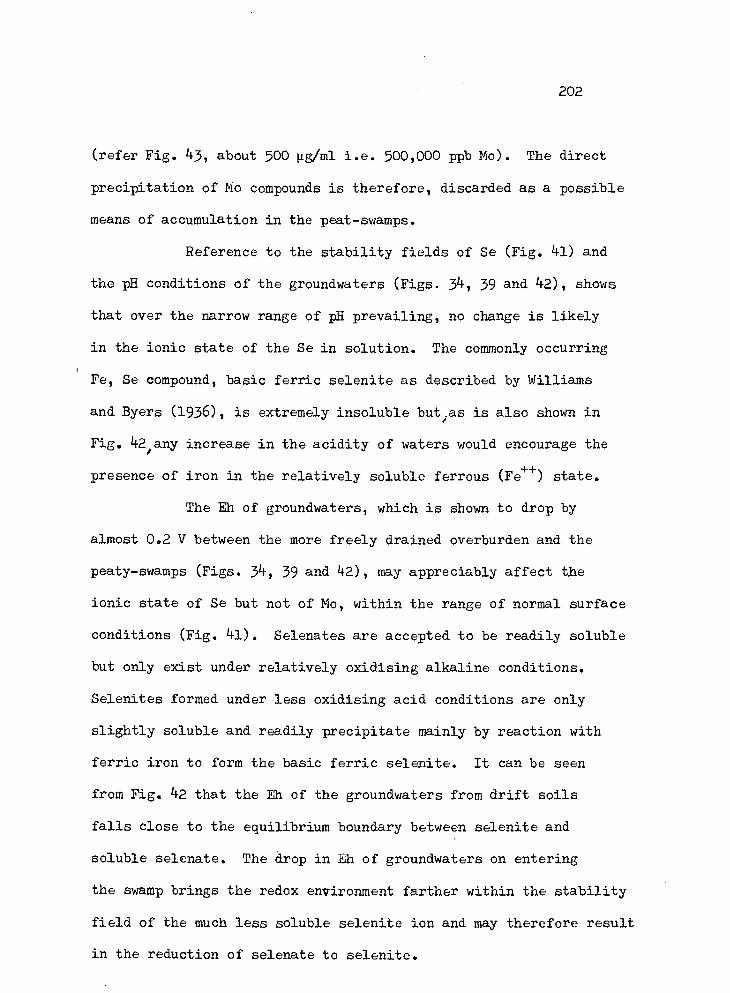
202
(refer Fig. 43, about 500 µg/ml i.e. 500,000 ppb Mo). The direct
precipitation of Mo compounds is therefore, discarded as a possible
means of accumulation in the peat-swamps.
Reference to the stability fields of Se (Fig. 41) and
the pH conditions of the groundwaters (Figs. 34, 39 and 42), shows
that over the narrow range of pH prevailing, no change is likely
in the ionic state of the Se in solution. The commonly occurring
Fe, Se compound, basic ferric selenite as described by Williams
and Byers (1936), is extremely insoluble but as is also shown in
Fig. 42/any increase in the acidity of waters would encourage the
presence of iron in the relatively soluble ferrous (Fe++) state.
The Eh of groundwaters, which is shown to drop by
almost 0.2 V between the more freely drained overburden and the
peaty-swamps (Figs. 34, 39 and 42), may appreciably affect the
ionic state of Se but not of Mo, within the range of normal surface
conditions (Fig. 41). Selenates are accepted to be readily soluble
but only exist under relatively oxidising alkaline conditions.
Selenites formed under less oxidising acid conditions are only
slightly soluble and readily precipitate mainly by reaction with
ferric iron to form the basic ferric selenite. It can be seen
from Fig. 42 that the Eh of the groundwaters from drift soils
falls close to the equilibrium boundary between selenite and
soluble selenate. The drop in Eh of groundwaters on entering
the swamp brings the redox environment farther within the stability
field of the much less soluble selenite ion and may therefore result
in the reduction of selenate to selenite.

+1
. / C
/ /
1
500
400
E
300
C
200 C
0
100
2
4
6
8
10 pH
SOLUBILITY OF FERRIC MOLYBDATE AT VARYING pH.
(Adapted from Jones 1957)
F1G.No. 43.

203
It is considered that while direct precipitation of
some Se compounds may take place it is hardly likely that this
constitutes the principal mechanism by which metal accumulates
in the swamps. Also it has been pointed out on the previous
page that Mo,which follows a generally similar pattern of
dispersion to Se, would not be affected by the pH-Eh changes pre-
vailing.
With regard to the co4precipitation with iron oxides
(ii), iron has been shown to be closely associated with the
retention of Mo and Se in some of the residual soils of the area,
most probably by sorption or co-precipitation. The accumulation
of theSe elements by iron oxides has also been described by other
workers, amongst them Williams and Byers (1936) for Se and Jones
(1957) for Mo. There is a certain degree of correlation between
the Mo and Se contents of the swamp soils and the iron content of
the profile (Table 35) but this correlation is also paralleled by
the organic carbon distribution. The occurrence of very high
total Fe203 contents in profiles BP 6 and 7 is not consistent
for all peaty profiles from the Flynn's peaty-swamp. The peaty
horizons from profiles BP 101 and BP 103 (refer Fig. 34) do not
contain excessively high amounts of iron (1.2 and 6.0% respectively)
although they are of similar appearance to the equivalent horizons
in BP 7 and contain high Mo and Se values (130 ppm Mo, 125 ppm Se
and 1500 ppm Mo and 200 ppm Se respectively).
The overall correlation between Mo, Se and Fe is, if
anything, more marked between Mo than Se specifically, particularly

201+
if the lower marly-clay and altered drift horizons of BP 6 are
considered. This is, in general, in line with data from other
soil types and in stream sediments.
The reducing, more acid environment of a peaty-swamp
at the time of formation should tend to favour the mobilization
of iron in the more soluble ferrous form. For this reason, it is
considered that the concentration of iron in certain horizons may
largely be due to post-depositional processes that have taken
place subsequent to initial Mo and Se concentration in the swamp.
However, re-distribution of iron has quite possibly modified the
Mo and Se patterns. Efimov (1962), working on transitional peat
bogs in the Leningrad area, attributed the concentration of iron
in certain lower horizons to the reaction between an aerated upper
peaty zone and reducing basal zones. Iron present in groundwaters
in the basal horizons rises by capillary action in the profile
during the summer months until, on reaching the upper aerated zone,
oxidation to the insoluble ferric form takes place with subsequent
precipitation and concentration. It is believed that such a process
may in part at least explain the distribution of iron in the peaty
profile BP 6, for example. It may of course involve the co-
precipitation of Mo and Se from solution but would not affect metal
already present in the profile sorbed, for example, on organic
matter. The low iron values in profiles BP 101 and 103 (Fig. 34)
at the shallow margins of the peaty swamp may indicate that re-
distribution of iron by this means only takes place in the deeper

205
parts of the swamp as in BP 6 and 7. Evidence has already been
presented of a similar process influencing the Mo patterns in
alluvial deposits (p. 182).
A major feature of the peaty-swamps is their high
organic matter status (Table 35, BP 6) which can also be correlated
with distribution of Mo and Se in profile. Studies of the marly
alluvial deposits indicated that Se was concentrated by sorption
on organic matter and that, except in the topsoil horizons, iron
did not enter into the process of metal retention. Later drainage
studies (Chapter IX) have confirmed the sorption of Se by organic
matter. In view of the close correlation between Se and organic
matter in the peaty deposits it is considered most probable that
sorption of Se from groundwaters entering the swamps is a major
factor in the retention of this element. With regard to Mo it
is difficult to define the relative influence of sorption on
organic carbon in relation to the effect of co-precipitation or
sorption on the secondary iron oxides. However, it is believed
that the presence of high concentrations of Mo and Se in ground-
waters from the swamp may be an indication of the relationship
between metal and organic matter. This is because cultivation
of these areas, which has involved drainage and subsequent aeration
of the surface horizons, has contributed to the weathering of these
soils. Breakdown of organic matter in the upper horizons with
consequent release of metal would be a ready contributor of Mo
and Se in a soluble form to near-surface groundwaters. This would
explain the apparent contradiction of high metal concentrations in

206
the present-day groundwater in the swamps and the proposal that
the swamp soils originally obtained their metal content by sorbtion
from groundwaters entering it from solution. Metal held on iron
oxides would not seem to be so readily released.
An alternative method by which organic matter may have
contributed to the accumulation of Mo and Se in these deposits is
by the uptake of metal by growing plants followed by retention in
the peat formed from this vegetation. This is the method suggested
by Fleming and Walsh (1957) who had noted the generally similar
levels of Se in the herbage and the supporting soil (Chapter VIII).
However, the writer does not consider that such a process will
adequately explain the accumulation of metal for the following
reasons:-
(a) the high concentrations of both Mo and Se
associated with some of the non-peaty basal marl, clay and under-
lying drift horizons;
(b) the divergence of Mo and Se in certain adjacent
horizons (cf. the horizons at 11-15 and 15-21 ins, BP 6, Table 35)
because it is not considered likely that the relative uptake rates
of the two elements in plants would differ so greatly;
(c) studies of metal uptake by plants in the following
Chapter VIII show that the concentration of Mo and Se in plants is
roughly proportional to the Mo and Se content of the soil. The
basal drift deposits of the swamp areas do not contain sufficiently
high concentrations of metal on which such high herbage contents
could develop.

207
Briefly reviewing the data on the accumulation of
metal in the swamp deposit, it is considered most probable that
mechanisms by which excessive concentrations have been precipitated
from groundwaters entering the swamp can be attributed to sorption
on organic matter and possibly also, sorption or co-precipitation
with iron oxides. It is not possible to strictly define the
relative importance of these two main factors to the concentration
in the swamp of Mo, Se and also the other elements V, Cu, Zn, Ni,
Co and Mn. However, the evidence and also the results of other
workers suggest that while Se in particular, may be closely related
to sorption processes on organic matter, Fe oxides may also contri-
bute largely to the retention of Mo and the other elements with
which the patterns can be correlated.
3. COMPARISON OF -2mm AND -80 MESH ANALYSES
The -80 mesh soil fraction used for most analyses in
the present study conflicts with the -2 mm fraction conventionally
analysed for most agricultural purposes. In order to investigate
the relationship of metal levels quoted during the present study
to the contents of the -2 mm fraction of soil samples, a comparison
is made of the results obtained from size analysis of residual and
drift soils described earlier in this chapter (Figs. 33 and 35).
Residual Soils (Fig. 33)
In the limestone and Namurian soil samples, where
the coarse sand fraction, i.e. 0.2-2 mm, comprises only 11 and

208
17% of each sample respectively, there will not be any significant
difference between-results with the analytical methods employed.
For- example4 -in the Namurian soilf-the._analytical.-value of_a.3. ppm
Se in the -80 mesh fraction is not significantly different from the
calculated value of 1.4 ppm Se for the -2 mm fraction.
Due to the relatively even distribution of metal in
the organic-rich topsoil horizon of the Clare Shale soil, the
metal content of the -2 mm and -80 mesh fractions will be roughly
similar. In C horizon samples however, the metal content of the
-80 mesh fractions will be appreciably higher. It should be
pointed out though that this conclusion refers only to residual
soils of a very sandy nature and does not necessarily apply to
the drift and alluvial soils which make up the bulk of the area
and which usually contain much less coarse sand.
Drift Soils (Fig. 35)
Mechanical analysis has shown that in the order of
8o per cent or more of the -2 mm drift (-10 mesh) falls within the
-80 mesh range. In unweathered drift in which the aggregating effect
of organic matter and secondary iron oxides is minimal, the amount
of -80 mesh material is much higher. Therefore, considering the
precision limits of the analytical methods used, analysis of the
-80 mesh fraction can be considered as reasonably representative
of the total metal content of the -2 mm fraction. In the drift
topsoil (sample 2126), in which Mo and Se are concentrated in the

209
coarse sand fractions, only 15.5 and 18.5 per cent respectively,
of the total amount of Mo and Se in the sample is present in the
2 mm 80 mesh fraction. Comparison of the calculated values for
the -2 mm and -80 mesh fractions (6.25 and 6.65 ppm Mo and 2.23
and 2.17 ppm Se respectively) show that the differences between
the metal contents are not significant.
This confirms work by Donovan (1965) who, in his study
of Pb, Cu and Zn in till of similar type in the Tynagh area, Ireland,
found that there was little variation in the metal content of the
-20 and -80 mesh fractions.
4. SUMMARY OF CONCLUSIONS CONCERNING THE ORIGIN OF MOLYBDENUM AND SELENIUM PATTERNS IN THE OVERBURDEN
Anomalous concentrations of Mo and Se in soils in the
area can generally be related to the presence of Clare Shale bedrock
or fragments in the parent drift. In certain cases, in particular
some alluvial or peaty-swamp deposits, stream or groundwaters
draining from the Clare Shale bedrock and drift areas contribute
Mo and Se to the soil.
In well-drained residual Clare Shale soils the Mo and
Se content, which increases down the profile, can be correlated with
the acid-soluble iron content. Fixation of these metals in the
profile is attributed to the sorption or co-precipitation of Mo
and Se, leached from the upper horizons or from upslope, on the
secondary iron oxides, most probably in the forms ferri-molydite
and basic ferric selenite. There is some evidence that in the
topsoil horizon, organic matter may play some part in the retention

210
of Se in this horizon.
The initial dispersion of Mo and Se in glacial over-
burden is mainly mechanical, by ice-action, the metal content of
the till reflecting the proportion of Clare Shale detritus mixed
with other rock types. In most well-drained anomalous drift soils
which consist mainly of mixed limestone and Clare Shales, soil
formation results in a concentration of Mo and Se in the upper
horizons. The higher concentrations in the topsoil are associated
with the accumulation of organic matter and iron oxides. In
poorly drained drift soils, concentration of Mo and Se also occurs
in the upper horizons but the relative concentration of Se is
greater than that of Mo. This is believed to be due to the
relatively greater accumulation of organic matter in the upper
horizons of soils developed under impeded drainage conditions,
Se being predominantly sorbed on organic matter whereas the fixa-
tion of Mo is more influenced by sorption or co-precipitation with
iron oxides.
Anomalous Mo and Se patterns in alluvial deposits vary
with the proportion of the major source rocks. In alluvium deposited
by streams draining directly from dominantly Clare Shale areas,
anomalous concentrations of both Mo and Se are accumulated through-
out the profile. Anomalous concentrations in the basal horizons are
related to the composition of mechanically deposited detrital
material. Peat development in the upper horizons has involved
the accumulation of Mo and Se mainly by adsorption on the abundant
organic matter. Alluvium overlying limestone that has been

211
deposited by streams having their headwaters in the metal-rich
peaty-swamps adjacent to the Clare Shales, has preferentially
accumulated high concentrations of Se in marly-clay horizons and
the topsoil. The concentrations of Se are attributed to sorption
on organic matter in these horizons. Mo however, has no affinity
for the organic-marl. The basal alluvial horizons consisting of
detrital mineral sediments do not contain excessive concentrations
of either metal. In the topsoil Mo has accumulated along with Se.
This feature can be correlated with the precipitation of ferric
oxides by oxidation of ferrous iron in sub-surface groundwaters
which reach the aerated surface zone during periods of heavy rain.
Peaty-swamp and lacustrine deposits that have
accumulated in post glacial depressions on or adjacent to the
Clare Shales contain very high concentrations of both metals in
the peaty horizons and moderately high concentrations in the under-
lying clays and marls. Groundwaters draining into these deposits
contain anomalous concentrations of Mo and Se and fixation of these
metals in the swamp deposits is attributed to sorption on the
abundant organic matter or co-precipitation or sorption with iron
oxides. It is not possible to define strictly the relative
influence of iron or organic matter on the Mo and Se fixation.
Possibly, in view of the distribution of Mo and Se in other
overburden types, organic matter may be the predominant influence
on Se whereas iron oxides may play a considerable part on the

212
retention of Mo. Groundwaters from these deposits and the
stream waters draining them carry high concentrations of both
metals and this is believed to be due to the breakdown of organic-
matter during soil weathering under the influence of improved
drainage.

213
CHAPTER VIII. METAL DISTRIBUTION IN HERBAGE
Analysis of general forage samples from the Flynn's
Farm grid area revealed fundamental differences in the distri-
bution of Se and Mo (Fig. 19c and 20c). In the case of Mo there
was a broad correlation between the patterns of metal distribution
in the herbage and the soil. It appears that the influence of
other environmental factors on the uptake of Mo, such as soil
type, drainage and pH, are subordinate to the total Mo content
of the soil. The distribution of Se however, showed that Se-
rich herbage at the toxic and sub-toxic levels was restricted
to poorly drained, alluvial and peaty-swamp seleniferous soils
that were generally of an organic nature and only slightly acid
to alkaline in reaction.
Studies of the environmental factors involved in the
uptake of these metals by plants have therefore been made to
investigate the relevance of soil environment to the interpre-
tation of the geochemical patterns in soil and stream sediment
in terms of the metal content of the herbage. In addition to
the effects of environment, some tests have also been made on the
relative metal contents of certain common pasture species.
1. DISTRIBUTION OF MOLYBDENUM, SELENIUM AND COPPER IN SOME COMMON PASTURE SPECIES
The distribution of metal in herbage from the Flynn's
Farm grid area was determined from grab samples at each site
which approximated to the general forage. These samples were

214
predominantly grasses, often with some red clover. These two
types were the main pasture plants of the area and other species,
such as rushes and herbs, were only included where they occurred
as a major part of the pasture.
It is known however, that the concentration of most
trace elements in plants varies with species and also in the
different plant organs (Fleming, 1963, and others). This is
particularly true in the case of Se, which in "accumulator" plants
such as Astragalus sp. may concentrate by a factor of over 100
compared with grasses growing on the same soil (Rosenfeld and
Beath, 1964). Mo also may be preferentially concentrated in
clovers, for example, when compared with grasses.(Fleming, 1962).
Some investigation was therefore required of the distribution of
metal between species growing in the area, firstly to see whether
any "accumulator" plants were present and secondly to test if
the variation of metal content with species could affect any
appreciable bias in the distribution of metal determined from
grab samples.
A selection of species was cropped from toxic site
A (Fig. 19a) and dissected into the major plant organs, head (H),
leaves (L) and stems (S). The species included two of the more
common grasses, two rushes, two herbs and red clover. Metal
distribution related to red clover morphology was also studied
from threshold and background areas.

Sample No. Species
Plant Organ*
Se ppm
Mo ppm
Cu ppm
2725 2726 2727
2729 2730 2731
2733 2734 2735
2739 2740
2741 2742
2737 2738
2743 2744 2745
Toxic Area A Soil (-80 mesh fraction) 0-6 ins. Se = 56 ppm,
8.8 59
12.0 128
9.2 136
26.0 18.8
36.0 40.0
12.0 12.0
18.o 28.o
27.2 52.0
12.4 14.4
6.2 24.0
15.0 52.0
4.o 28.0
6.o 44.o
60.0 68.0
25.2 16.0
24.0 13.6
76.0 120.0
13.2 30.4
12.4 14.8 11.2
9.3 10.2 3.9
7.8 8.8 5.8
7.3 5.0
11.2 8.0
14.2 9.9
9.9 12.7 9.3
pH = 6.65, Mo = 46 ppm, Cu = 90 ppm.
Clover H Trifolion pratense L (Red Clover) s
Grasses H Dactylus glomerata L (Cocksfoot) S
Holcus lanatus L (Yorkshire fog) S
Rushes Juncus inflexus H (a fine rush) L+S
Juncus effusus H (a coarse rush) L+S
Herbs Potentilla anserina L (Silverweed) S
H Centaura nigra L (Knapweed) S
2746 2747 2748
Area of well-drained drift soils adjacent to Toxic Soil Site A
3.5 ppm, Cu = approx. 40 ppm
<0.2 14.0 12.2
<0.2 18.8 14.5
<0.2 56.0 9.5
Soil pH = 6.2, Mo = 5 ppm, Se =
T. pratense L (Red Clover) S
•
215
Table 37: Metal Content of Typical Pasture Species (ppm oven dried material', 600 C)
*H s Head L = Leaves S = Stems

Sample No. Species
Plant Se Organ* ppm
Mo Cu
ppm ppm
Background Area of moderately poorly-drained limestone alluvium. Soil pH = 6.0, Mo = 2 ppm, Se = 0.6 ppm, Cu not
determined
2750 2751 2752
T. Pratense (Red Clover)
H 0.3 1.4 L 0.2 2.2 S <0.2 3.4
216
Table 37 (continued)
*H = Head
L = Leaves S = Stems
Selenium
Reference to Table 37 shows that in all species from
anomalous areas the highest concentrations-,of Se occur in the leaves.
In most cases the stems tend to contain more of this element than
the heads.
The two herbaceous species, silverweed and knapweed,
contain the highest concentrations of Se, but the difference in values
when compared with the commoner pasture species, grasses and clover,
would not qualify them as true "accumulator" plants. These plants
are generally avoided by grazing animals but they could contribute
to an increased Se content of the forage when incorporated in hay
from poorly managed and poorly drained pastures on which silverweed,
for example, often grows abundantly.

217
The Se contents of the two grasses are not greatly
different. This corresponds to work by Fleming (1962) who did not
detect any great difference in the Se content of common grasses.
The two grasses sampled accumulate two to three times as much Se
as the red clover and this feature was consistent for all the plots
from which both red clover and cocksfoot were sampled. However,
this relationship is not consistent with the results of pot-trials
carried out by Fleming (1962) who found that red clover accumulated
about double the amount of Se compared to cocksfoot.
Returning to Table 37, the rushes in general, contain
lower concentrations than the other plants. However, rushes only
occur in abundance in poorly drained pastures and unless cut for
hay they are generally avoided by grazing animals.
Red clover samples from threshold and background soils
contained only negligible quantities of Se and no conclusions can be
drawn from its distribution in the plant.
Bulk grass samples from background areas (Fig. 17)
contained amounts of Se less than the limit of detection and so
detailed investigation of the distribution of metal in the various
organs of grass samples from the background area was not considered
worthwhile.
Molybdenum
The distribution of Mo within the plant (Table 37)
was in general similar to that of Se with the highest concentration
being found in the leaves. The exception is red clover, in which

218
the highest concentrations tend to be in the stems. This is con-
firmed by samples of red clover from the threshold and background
soils and corresponds to the results obtained by Fleming (1965).
It is also apparent that red clover absorbs much more Mo than the
grasses. Again, this was found to be consistent for nearly all the
samples and is in line with previous observations (Fleming, 1965).
The herbs, particularly "knapweed" contain very high
concentrations of Mo in the leaves relative to the stem and heads,
the ratio of concentration being appreciably higher than for grass
and rushes.
Copper
Compared to Se and Mo, Cu showed little variation
between species and plant organs. With the exception of the rushes,
the highest concentrations again occur in the leaves. The Cu content
of the clover is somewhat higher than that of the grasses - a feature
noted by Mitchell et al (1956) to occur only when Cu levels in the
soil were high.
Influence of Species and Plant Organ on the Validity of Grab Samples
It is clear that there is not a great deal of
difference between the Mo, Se and Cu contents of the grass species
analysed. This corresponds with the results of Fleming (1962) and,
since grasses make up the bulk of the pasture in the area, there is
no reason to suspect that any variations in the patterns obtained

219
from grab samples are due to distribution of the different grass
species. Where red clover is particularly abundant there may be
a slight decrease in the Se content and a rise in Mo and Cu but this
is unlikely to invalidate the general patterns in view of the"wide
range of metal contents encountered between background and anoma-
lous areas.
Because of the generally much higher bulk of the stem
material compared with other organs, variations in metal content
between plant parts will make no significant difference to the
relative metal contents of the bulk samples analysed.
2. FACTORS INFLUENCING METAL UPTAKE BY PLANTS
In studying the effect of environmental factors on
uptake of metal by plants, red clover and cocksfoot were selected
because of their relative abundance in the area. Red clover in
particular, occurs in almost all the environments encountered.
Also, red clover is more sensitive to the presence of high con-
centrations of Mo in the soil, whereas cocksfoot grass accumulates
more Se than red clover.
Inspection of the results suggested that the metal
content of the soil, soil type, drainage and pH were the more
obvious controls on metal uptake as indicated by the metal patterns
of herbage growing on the Flynn's Farm grid (Figs. 19c and 20c).
Some other factors indicated by the literature, such as Eh, P, SO4 ,
Fe aad organic matter in the soil, are also discussed where data are
available.

220
The herbage results given below refer to the whole
plant with the exception of root material. Mature plants were
collected wherever possible from plots 100 to 400 square feet in
area.
(a) Metal Content of the Topsoil
Molybdenum
The broad correlation between the Mo patterns for
soil and herbage determined by grab sampling (Figs. 19c and 20c)
was confirmed by the results obtained on the plot samples (Fig. 44).
It is apparent that the relationship between Mo in
the soil and herbage is most obvious in the higher concentration
ranges which include marginal and anomalous soil values. At the
limit of detection in soil (2 ppm), relatively wide variations,
from 1 to 11 ppm, occur in the Mo content of red clover. It would
therefore appear that at this level other environmental factors,
such as pH or soil type, significantly affect Mo uptake. Many of
these samples with low soil Mo contents but with relatively high
values in herbage come from high pH and alluvial soils within the
general molybdeniferous area.
Davies (1955) has shown that a rise in pH greatly
increases Mo uptake. Taking this relationship into account, a
much closer correlation between Mo in the soil and Mo in red clover
is obtained in soils with a relatively uniform alkaline reaction
(Fig. 45a). Again, there is an apparent discrepency at the lower

10
Top s
oil Mo
(pp
m)
+
+
++ 100
+ E a. a ..... O 2
°'n 10 a. 0 I-
+
+ +
f
+ + 500 500
100
+ +I-
+
+ + +I- + -1-I-
10 100 Red Clover Mo(ppm)
+ +
1 10 100 Cocksfoot. Mo(ppm)
+ +
+ +
+ +
FIG.No. 44. RELATIONSHIP BETWEEN THE Mo CONTENT OF TOPSOIL AND PASTURE HERBAGE.
TOPSOIL -80 mesh fraction. 0" - 47 HERBAGE Oven- dry weight.

221
limit of detection where an exceptionally high proportion of Mo
appears to be available in some alluvial soils. In acid and
slightly acid soils the relationship is still evident but the
correlation is slightly less marked and it is obviously affected
by other factors.
Broadly speaking it can be said that the Mo content
of the herbage is closely related to the Mo content of the soil.
However, although the soil content may be the predominant factor
controlling uptake at high metal levels, soils in the threshold
and background range produce herbage containing at least sub-
toxic levels of Mo presumably due to the influence of other factors
which are discussed in the following sections. The wide range of
Mo levels in herbage growing on moderately molybdeniferous soils
of acid reaction (Fig. 45b) also points to the influence of other
factors.
Selenium
Comparison of the Se content of red clover and
cocksfoot growing on swamp and alluvial soils with Se in the
topsoil indicates a broad relationship between the Se content of
the soil and the amount of Se accumulated by herbage (Fig. 46).
Samples of alluvial and peaty-swamp soil which contain
the highest amounts of Se produce herbage with the highest conoent-
rations of metal. It is apparent however, that this relationship
is only well marked for certain soil types, namely those of alluvial
and swamp origin. Red clover growing on the generally better drained

• ALKALINE SOILS pH> 7
o SLIGHTLY ACID SOILS pH 6-7
Acid. •
• Ajkaline. • . A 6.4 ,,s.
, 41‘ / o e eja a e' • ar7.01 •
/ • • I
• •
g il i • '.
• ; 71i. ?obi •
e •P' e '7* • Dker • totli • ". • , ...,
, • •g • • ' 14 • e •• • •A Dif7t;SW or'
• e •• ? 47-4‘ • env
Figures s% pH units.
• A**2.2
Pr
• ACID SOILS pH < 6
R s Residual soil A Alluvium. D Drift. P Peaty-swamp soils.
f:4 • / • 4,7
• R • • • , Co • 1-.4 • • •
11 .4.0 4, • • • - Ra7r 4 4/90407 144,A.d.
500
100
E a
0
O 10 a. 0 -
1 TO
PS
OI L
Mo
( ppm
)
500
100
10
•
1 10 100 1 10 100
(o) RED CLOVER Mo (ppm) (b) RED CLOVER Mo (ppm)
,FIG.No. 45. Mo CONTENT OF SOIL AND RED CLOVER UNDER VARIOUS SOIL pH CONDITIONS.

•
• Peaty-swamp and Alluvial soils ( Impeded-drainage)
Residual and Drift soils. (Generally well-drained)
COCKSFOOT Se (ppm) (a) RED CLOVER Se (ppm) (b)
•
•
• •
• • •
•
•
• • •
•
• • •
O r. Range of topsoil valuesa.
with <0.2 ppm Se 2 in herbage.
0.4 i 0.4 0 1 10 0 1 10
FIG.No. 48. RELATIONSHIP BETWEEN Se CONTENT OF TOPSOIL AND PASTURE HERBAGE
•
•
• •
300
100
300
100
TOP
SOIL
Se
(PP
m)
•
• 10 •
•
•
• I
1

222
drift and residual soils contains only small non-toxic concentra-
tions of Se (0.2 to 0.3 ppm) and although the soil content ranges
from 0.5 to 8 ppm Se there is no marked increase in the herbage
Se content that can be correlated with that of the soil. The
same is more or less true for cocksfoot samples, although the
highest value in cocksfoot of 0.9 ppm corresponds with the
highest well-drained soil value of 8 ppm.
The restriction of seleniferous herbage to the peaty-
swamp and alluvial soils confirms the patterns shown by sampling
on the Flynn's Farm grid (Fig. 20c). On these organic, poorly
drained soils, it is clear that the total content of the soil
plays a large part in determining the amount of Se accumulated
by the plant. On the other hand, in the better drained areas the
Se would seem to be present largely in a non-available form and
the concentration of total Se in the soil is subordinate to other
factors involved in plant uptake.
(b) Soil Reaction
Molybdenum
It is generally considered that there is a close
relationship between Mo uptake by plants and soil reaction
(Piper and Beckwith, 1949; Moore, 1950; Davies, 1955). Many
areas of Mo-deficiency occur on acid soils and can often be
cured by "liming" (Evans et al, 1951) and many workers (Lewis,
1943; Barshad, 1951) have shown that the availability of Mo
can be increased by raising the pH of the soil. Conversely

Soil pH Total Mo *Available Mo Mo Content of
No. ppm ppm Herbage ypm
1 5.2 0.65 0.12 2.0
2 5.9 2.8o 0.27 4.5
3 7.7 0.86 0.57 14.5
223
most recorded cases of toxic excess are from alkaline or neutral
soil areas (Ferguson et al, 1943). One exception however, has
been recorded by Walsh et al (1953) who found high Mo contents
(7-13 ppm) in herbage on acid soils (pH 4.9 - 5.2) in parts of
Ireland. The increased availability of Mo with pH in Irish soils
is well illustrated by the data in Table 38 from Walsh et al (1952).
Table 38: Influence of Soil Reaction on Availability of Molybdenum (Adapted from Walsh et al, 1952)
*Available metal is that extracted by the method of Davies and Gregg (1952) using NH4 oxalate at pH 3.3.
Some indication from the present study that pH may,
be a factor influencing the availability of Mo, is apparent from
the distribution of Mo in herbage from the central and eastern
parts of the Flynn's Farm grid area (Fig. 19c). Extensive areas
of sub-toxic to toxic vegetation can be related to soils with
neutral to alkaline reaction (Fig. 23) which do not always contain
anomalous concentrations of Mo in the soil.
The ratio of Mo in topsoil and red clover plotted
against soil reaction shows some correlation between the propor-
tion of metal accumulated by the plant and pH of the peaty-swamp

• • •
a
7
PH 6
4 10 5 2 1 05 02 01 30 20 10 5 2 1 0.5 02 '04
TOPSOIL Mg/ TOPSOIL Ms... /RED CLOVER Mo (PPm) (b) 0""RED CLOVER Mo ( PPrn )
30 20
(a)
FIG.No. 47. RELATIONSHIP BETWEEN Mo UPTAKE BY RED CLOVER AND SOIL REACTION.
e• +
• 7
•
+0 • •
+ ALLUVIAL SOILS • PEATY-SWAMP SOILS
+ RESIDUAL SOILS
• DRIFT SOILS Moderately to well drained. 8
pH + + 6
5
•
•
• •
•
4 IASI I . •
•
•
• •
Poorly drained.

224
soils only (Fig. 47). Any relationship between pH and the
availability of Mo in alluvial soils is at best vague and there
is no apparent relationship for the better-drained drift and
residual soils.
The fact that a relationship was detected only in the
peaty-swamp soils is attributed to the relatively uniform envi-
ronment, aside from pH, of these soils as sampling was restricted
to the Flynn's Creek and South Creek swamps only. For the other
soil types, a greater range of environmental conditions most
probably modify the effects of pH and account for the lack of
correlation. For example, Williams and Moore (1952), in considering
the effect of pH on Mo availability, also relate the HC1-soluble
iron content of the soil to the amounts of Mo accumulated by the
plant. Williams and Moore express this as an equation in the form:
1°g100 Mo = a pH - b Fe + c
where a = 0.2546, b = 0.1011, c = 0.104 Mo = ppm in plant material at maturity Fe = per cent soluble in boiling 6N HC1
Jones (1956) shows that more Mo is absorbed from solution by iron
oxides at low pH values (range 4-6) than at neutral or alkaline
levels (pH 7 and 8), and is therefore less likely to be available
to plants at acid pH levels.
No studies were made of the validity of this concept
during the present work but since it is shown (Chapter VIII) that
a wide range of iron contents are present in many of the soils of
the area, the variation in iron concentration may account for
discrepencies in the effects of pH on Mo uptake.

225
Some evidence of increased uptake of Mo at higher pH
is shown in Fig. 45a. Red clover growing on alkaline soils (pH
>7) shows a tendency to accumulate more Mo than that growing on
slightly acid soils (pH 6-7). Data from more acid soils (pH <6)
do not completely agree with this however, and are probably subject
to the modifying action of other factors such as the influence of
iron mentioned previously.
Broadly speaking, therefore, although it can be said
that the uptake of Mo may be increased on high pH soils, the
influence of pH is subordinate in this area to the major control
which is the total metal content of the soil. Also other factors,
possibly including the effect of Fe quoted from Williams and Moore
(1952), undoubtedly modify the influence of pH. Nevertheless,
when interpreting geochemical data from potentially toxic areas,
particular attention should continue to be given to alkaline soils
with pH values in excess of 6.5. Such soils are often associated
with alluvium overlying limestone and may carry at least sub-toxic
levels in the herbage even though the total Mo content of the soil
is relatively low. As an example of this, the reader is referred
to soil-herbage maps of the eastern part of the Flynn's Farm study
area (Fig. 19b and c and Fig. 25).
Selenium
It is generally accepted that most seleniferous soils
producing toxic levels in vegetation are (a) developed under arid
conditions, (b) alkaline in reaction, and (c) often contain free

226
CaCO3 (Lakin - in Anderson et al, 1961). Soils of the western
U.S. from which the most extensive occurrences of toxicity have
been reported fall in this category and this is also true for
toxic soils in Canada, South America and Israel. Lakin also
states that non-toxic seleniferous soils are (a) acid in reaction
with pH ranging from 4.5 to 6.5, (b) developed under humid condi-
tions, and (c) often characterized by zones of accumulated iron
and aluminium compounds, as for example, the soils of Puerto Rico
and Hawaii. Fleming and Walsh (1957) have shown that the toxic
soils of Ireland are generally neutral to alkaline in reaction,
but the Irish soils are unique in that toxic herbage is produced
under humid conditions.
Most of the recorded instances of toxicity occur where
the Se is present as the relatively soluble selenate, compared to
selenite. It is impossible, therefore, to exclude the effects of
Eh in addition to pH, on the availability of this element.
Reference to the stability fields for the various ionic species
of Se (Fig. 41) shows that, just as readily as pH, a rise in Eh
can affect transition from the poorly available selenite to
readily available selenate.
Water-soluble organic forms of Se, as reported by
Williams and Byers (1936), are also quite likely to be present
in the commonly organic-rich soils of the area. The occurrence
of such compounds may be independent of pH and would act as an
additional factor to confuse interpretation of the effects of
pH under natural conditions.

227
Data collected from the herbage-topsoil plots show
no correlation between pH and the proportion of Se accumulated
by red clover from the soil (Fig. 48). Only peaty-swamp and
alluvial soils were considered because of the restriction of
appreciable quantities of Se in herbage to these particular soil
types. Despite the negative nature of these reeults, an attempt
to minimise the influence of other factors was made by comparing
the results from four sites situated close together in Flynn's
Farm toxic fields (Table 39). These sites were selected from
the one swamp area on the basis of generally similar drainage
conditions, soil type (black peaty gleys) and organic content.
It is admitted that the data are very few in number
and therefore not conclusive, but if it is assumed that the
influence of other factors is negligible, there is a definite
indication of the increase of availability of Se with higher
pH values.
Fleming and Walsh (1957) consider levels greater
than 5 ppm and possibly as low as 2 ppm to be potentially toxic.
It is therefore apparent from the above data that toxic concentra-
tions of Se may accumulate in herbage growing on relatively acid
soils (pH 5.7 and 5.8). This is a lower pH level than the toxic
occurrence previously noted by Fleming and Walsh and is below
the accepted non-toxic range (4.5 - 6.5) quoted by Lakin
(Anderson et al, 1961). Samples of herbage from a peaty soil
collected from the seepage area in the northern part of the

•
•
•
• 7
• • •
6
• pH
4 I • • • • • e • a • • . •
200 100 50 20 10 5 2 1 2 I
(PPm)
200 100 50 20 10 5 TOPSOIL Siv
ED CLOVER Se TOPSOIL Ss..
/RED CLOVER Se (PPm)
PEATY-SWAMP SOILS ALLUVIAL SOILS. 8 8
•
5
6
pH
5
4
7
FIG.No. 48. RELATIONSHIP BETWEEN Se UPTAKE BY RED CLOVER AND SOIL REACTION
• •
•
•
• •
•

Table 39: Effect of pH on Selenium Uptake by Herbage from Peaty-Swamp Soils
Se Content (ppm) Sample Site pH Ratio Ratio
Topsoil Se: Topsoil Se: Topsoil Red Clover Cocksfoot Red Clover Se Cocksfoot Se
Site BP 6 North edge of swamp
Site 20 ft. from BP 6
BP 54 Centre of swamp
BP 7 South edge of swamp
7.01
6.55
5.7
5.8
48
56
165
280
10
5
9
6.5
26
12
12
4.8
11.2
18.3
43.0
1.8
4.66
13.75

229
Ylynnis Farm grid contained 0.9 ppm Se in red clover and 4.0 ppm
in cocksfoot grass. The soil in this case had a pH value of 5.5
and contained 12.0 ppm Se. This was the lowest pH value recorded
at which appreciable concentrations of Se were accumulated by
plants.
These instances of toxic vegetation growing on
more acid soils than have hitherto been recorded must be considered
in relation to the highly organic nature of the peaty soil involved.
It is generally accepted that the influence of pH on Se availability
is related to the stability fields of the selenite and selenate ions,
transition to the generally soluble and more available selenate form
being affected by a rise in pH or by oxidizing conditions (Fig. 41).
However, the possible presence of soluble organic Se complexes,
which may form in these soils independent of the pH-Eh environment,
should also be taken into account. Williams and Byers (1936)
record soluble Se in soil that is neither selenate or selenite and
which they believe to be present as an organic compound. Also in
some plant species, a large proportion of the Se in the plant is
present as soluble organic compounds in addition to selenates
(Beath et al, 1934). Groundwaters draining acid peaty-swamp soils
(pH 5.5 to 5.8), from which these instances of toxic vegetation
are recorded, contain 26 to 30 ppb Se in solution although the
pH-Eh environment of the waters falls within the stability field
of generally insoluble selenite (Fig. 42). This may point to
the presence of available organic Se derived from decomposing
pasture herbage or peat independent of pH-Eh conditions.

230
Instances of Se uptake were not detected below pH
of 5.5. It would appear that the lower limit for uptake lies
somewhere between 5.2 and 5.5 as seleniferous acid alluvial soils
(pH 4.2 to 5.2) which flank the stream in the north-west part of
Flynn's Farm grid (Fig. 20a and c) support non-toxic vegetation
containing 0.3 ppm Se or less. These soils have generally similar
drainage characteristics and organic matter status to the peaty-
swamp soils and the Se content at 18-24 ins ranges from 5-15 ppm
Se. Information from profiles and two topsoil samples indicates
that the topsoil content is probably slightly less than this,
approximately in the range of 2-10 ppm.
Studies of Se uptake by herbage growing on alkaline
and neutral alluvium overlying limestone (toxic site B), did not
reveal any close correlation between pH and the proportion of metal
accumulated by the plant over the low pH range of 6.75-7.75
(Table 40). The results do show that in most cases the propor-
tion taken up by red clover in relation to the total Se content of
the soil was greater than that accumulated from more acid peaty-
swamp soils shown in Table 39.
The data obtained on the effects of pH on Se uptake
are in basic agreement with the observations of other workers.
However, it is shown that accumulation of toxic levels in herbage
may occur on poorly drained, peaty soils with a ilH'as low as 5.5,
whereas previously it was generally considered that such acid
soils could be classified as non-toxic.

Table 40: Relationship Between pH and Selenium Uptake by_ Red Clover Growing on Alluvial Soils
Site pH of soil
Se content of topsoil (ppm)
Se content of red clover (ppm)
Ratio Soil Se:
Red clover Se
BP 2 65-toxic site B (ref. Fig. 36)
7.4 25 9.0 2.1
BP 67 7.2 18 1.5 12.0
BP 68 6.75 14 1.5 9.0
BP 69 7.5 2.5 0.3 8.3 Anomalous alluvium east edge of Flynn's Grid 7.75 8.o 1.2 6.7
BP 30 Background area 7.45 3.0 0.2 15.0

232
At higher pH ranges there is a general trend towards
a greater availability of Se but no close relationship can be
drawn between pH and the proportion of Se accumulated from the
soil. It would appear that other environmental factors possibly
including soil type also affect Se uptake rates. In any assess-
ment of geochemical patterns it is probably safe to assume that
soils with pH below 5.2-5.5 are non-toxic but seleniferous
alkaline soils, and this will apply particularly to alluvium
overlying limestone, may very readily produce toxic herbage.
(c) Eh of the Soil Environment
No data were obtained on the influence of Eh on
uptake of either Mo or Se by plants and there is very little
reference to this factor in the literature. Normally, it is
probable that the ready exposure of the topsoil horizon to the
atmosphere would produce uniform oxidizing conditions but in the
case of peaty-swamp and poorly drained soils plant roots may
penetrate to horizons below the shallow water-table where
relatively reducing conditions may exist.
From theoretical considerations it is not likely that
the natural range of soil Eh conditions would have any direct
effect on the availability of Mo. Indirectly however, reducing
conditions under which soluble ferrous iron is stable would
inhibit any fixation of Mo as ferri-molybdite.
Se is readily susceptible to changes in Eh which will
affect the stability fields of the ionic forms occurring in nature

233
(Fig. 41). In general, a rise in the redox potential of the soil
system will encourage the transition from selenite to selenate,
in the same way that a rise in pH will affect the ionic form and
hence the availability of the metal. No relevant data are
available but although the topsoil horizons of most soils may be
uniformly oxidizing, the Eh of poorly drained soils may be de-
creased if the natural water-table is lowered by artificial
drainage ditches. This may in turn influence the solubility
and hence availability of the metal.
0) Drainage
The distribution patterns of Mo and Se in herbage
from the Flynn's Farm grid survey (Figs. 19c and 20c) showed a
distinct contrast in the soil-plant relationships for each element.
The Mo content of the pasture herbage could be broadly correlated
with the Mo patterns in the soil mainly irrespective of other
environmental features. Toxic concentrations of Se in herbage
were however, restricted to poorly drained soils, mostly of swamp
and alluvial origin within the seleniferous area. It is true that
these soils generally contain the highest concentrations of Se
and are often neutral to alkaline in reaction, both being factors
which encourage the uptake of Se. Apart from the influence of
these factors, it would appear that the severely impeded drainage
of these soils Also influences the availability of Se.
It is generally accepted that Se available to normal
plants is usually in a readily soluble form, mainly as selenates

234
or soluble organic complexes and that toxic soils contain water-
soluble Se irrespective of the total Se content of the soil
(Lakin - in Anderson et al, 1961). Anderson et al also state that
in areas with a rainfall in excess of 25 inches soils are generally
non-toxic because readily soluble and available Se is leached from
the topsoil. The annual rainfall in the study area is in the range
40-50 inches and it would appear that this is sufficient to leach
soluble Se from the generally well-drained drift and residual soils.
It has been shown (Chapter VII) that near-surface groundwaters
draining from the drift soils carry low concentrations of Se
(0.2 to 0.8 ppb) into the swamps (Fig. 40) and this has been the
means by which Se has been introduced into the swamp environment
and subsequently fixed in the soil material.
Leaching of the better-drained non-toxic drift and
residual soils by rainwater would be quite efficient as the ground-
water lies well below the level of root penetration. However, in
the toxic alluvial and peaty-swamp soils metal values in the near-
surface groundwaters are high (1-26 ppb Se) and especially at times
of rain the water level rises to the level of root penetration. As
discussed in the previous chapter, it is believed that the high
concentration of Se in the groundwaters of the swamp soils is due
to environmental changes leading to the formation of soluble
selenate or organic Se compounds. It will be shown in the following
chapter that the concentration of Se in these waters is closely
related to the total Se of the soil profile.

235
It would appear in these circumstances, that it is
the retention of water-soluble Se in the soil solution, as indi-
cated by the metal content of near-surface groundwater, that leads
to the restriction of toxicity to the poorly-drained soils of the
area. The impeded drainage conditions are essential to the presence
of water-soluble Se in the topsoil as well as being initially con-
cerned with the accumulation of metal in these soils.
This point is illustrated by comparing Se-uptake from
very poorly drained and moderately poorly drained, peaty-gley soils
with similar pH and total Se content near toxic site A (Table 41).
The two plots at profile sites BP 6 and BP 97 (Fig. 39) are situated
about 120 feet apart, BP 97 being situated near the margin of the
peaty-swamp and BP 6 located nearer the centre in an area of
severely impeded drainage.
Although the total Se contents of the topsoil were about
equal, Se uptake by herbage was least from the better drained soil
(site BP 97) containing the lowest amount of water-soluble Se as
indicated by the Se content of the groundwater.
As discussed in greater detail in the following chapter,
the metal content of near-surface groundwaters is closely related
to the total content of the soil profile. It would seem in this
case, therefore, that the effect of drainage, by bringing sub-
surface water within the reach of plant roots, allows the uptake
of high concentrations of Se in groundwater derived from the high
concentrations of Se in the deeper peaty horizons. As shown in

Table 41: Metal Uptake by Plants Under Varying Conditions of Drainage
Site
'
Drainage PIT of
Soil
Se Mo
Ground- water ppb
Topsoil
PPm
Red clover
ppm
Cocks- foot PPm
Ground- water ppb
Topsoil
PPm
Red clover ppm
Cocks-foot PPm
BP 6
BP 97
Very poor; water-table at 10 ins.
Moderately poor; water- table at 15 ins.
7.01
7.4
8.5
i 0.8- L 3.0
56
50
5.0
1.5
12.0
3.5
110
3.0- 7.0
46
15.5
22
26
22
6

237
the section given in Fig. 39, the lower horizons of profile BP 6
contain up to 200 ppm Se, whereas the lower horizons from profile
BP 97 contain much lower concentrations in the order of 35 ppm.
This difference in the soil is reflected in the groundwater and
herbage Se contents.
In assessing the importance of severely impeded
drainage on Se toxicity in alluvial and peaty-swamp soils it
would appear that the effects are mainly indirect. Firstly,
conditions of poor drainage have been an inherent factor in
accumulation of high concentrations of Se in these deposits and
secondly, poor drainage encourages the retention of water-soluble
and available Se in the soil waters that could otherwise be leached
away. The availability of Se in these soils is attributed either
to changes in the redox environment of the deposit or to the break-
down of organic matter in near-surface horizons due to artifically
improved drainage with the subsequent release of soluble Se compounds.
Although Anderson et al (1961) report that irrigation of toxic
seleniferous soils may lead to a reduction in toxicity by leaching
of soluble Se it would appear in this case that the large reser-
voir of Se in the soil and the slow rate of leaching would not
affect toxicity in the forseeable future.
Mo results are not consistent with data on the
relative uptake rates of the two species discussed earlier in
this chapter or with the influence of total soil content on the
Mo content of the plant and therefore conclusions cannot be drawn
from them.

238
(e) Organic Matter
It is not known to what extent the characteristically
high organic status of some of the soils of the area may affect
the metal uptake. It would seem in the case of Mo, that the
effects are mainly indirect, the organic-rich soils accumulating
the highest concentrations of Mo. Also, Mo in peaty soils could
be expected to be in a readily available form where it is held by
adsorption on organic matter or accumulated as the result of plant
growth and peat formation. Barshad (1951) and Grigg (1953) both
show that available Mo is increased by the ignition of soils
allowing the liberation of the fraction held by soil organic matter.
It would appear that the weathering of peaty soils induced by
lowering of the water-table by drainage improvement would
similarly release organically bound Mo. Such a process may
account for the high concentrations of Mo in near-surface ground-
waters from the peaty-swamp soils, which range from 5 to 400 ppb
Mo, compared with less than 10 ppb in non-organic soils. Any
such effects in the area appear to be masked though, by the
dominant influence of total soil Mo content and pH on Mo uptake
by herbage.
Soluble organic Se compounds are known to be present
in soils and are probably due to the decay of seleniferous plants
(Beath et al, 1935). Such compounds are readily available for
plant uptake (Olson and Moxon, 1939). By virtue of their origin
as seleniferous peaty-swamp and lake deposits, it is probable that

239
decay of the organic-rich swamp soils will contribute at least
in part to the water-soluble Se recorded from near-surface ground-
waters. Se in this form may exist as organic complexes.
No data were obtained to indicate what proportion of
the Se in the near-surface groundwaters is in an organic form or
how much is present as inorganic selenate. However, the peaty
nature of the swamp and alluvial soils makes it likely that on
breakdown, the high organic content plays some part in the supply
of available Se as soluble organic forms.
(f) Iron
The part that iron plays in modifying the influence
of pH on Mo uptake as described by the equation of Williams and
Moore (1952) has already been noted. No data have been collected
from the study area to determine the influence of iron concentra-
tions in the soil, but in view of the wide range of Mo concentra-
tions present in the soil and the overriding effect of these on
plant-uptake it is unlikely that the effects are significant from
the point of view of the interpretation of geochemical patterns in
this area.
It has already been noted that the non-available Se
fixed in the soils of the area is probably basic ferric selenite
similar to the form reported by Byers et al (1938), or the Se may
be held unavailable by sorption on iron oxides. Experimental
studies by Byers et al with a clay loam containing 11 per cent

240
iron oxide indicated that the iron oxide reduced the solubility
of both selenate and selenite. No evidence has been collected
from the area however, to show that variations in the amount of
iron in the soil significantly affect the availability of Se to
plants, compared to the influence of the other factors discussed.
However, in view of the non-available nature of Se in the iron-
rich topsoil horizons of well-drained residual and drift soils,
it is possible that an appreciable amount of the Se is held by
iron oxides.
(g) Sulphate and Phosphate
Various workers, have investigated the influence of
the common soil additives, phosphate and sulphate, on the uptake
of Mo and Se. Both compounds are usually applied in the form of
superphosphate but may also be present in exceptional amounts as
the result of the breakdown of phosphorous or sulphur-rich bed-
rock.
In the case of Mot Stout et al (1951) have shown that
the sulphate ion depresses the uptake of Mo. Because of the
similar size of the divalent ions he attributes the interference
by sulphate to competition with Mo for absorption at the root
hair surface. Phosphate, also studied by Stout et al, tends to
increase the uptake of Mo in many crops and this has been attri-
buted to anion exchange, replacement of MoOk by PO4= on clays
= making the Mo04 ion available for uptake by plants. Walsh et

241
al (1951 and 1952) recorded an increase in Mo toxicity of moly-
bdeniferous soils after the application of basic slag containing
a high proportion of phosphate. Basic slag however, tends to
increase soil pH and this alone would tend to increase Mo availa-
bility.
Analysis of topsoil and herbage samples collected for
metal-uptake studies did not reveal any obvious correlation between
the amount of metal accumulated by the plant and the sulphate and
phosphorus status of the soils.
The range of sulphate contents was not great, only
the peaty-swamp soils containing appreciably high concentrations
(10,000 - 35,000 ppm) compared with the other soil types (4,000 -
10,000 ppm). Any effect of sulphate on uptake of Mo was masked
by the influence of the high Mo content of these soils. The
sulphate content of herbage ranged from 5,000 - 15,000 ppm and
was apparently independent of the amount present in the soil.
Phosphorus ranged from 8o-800 ppm in soils and from
750 to 2750 in herbage. There was a trend for slightly higher
concentrations to be present in poorly drained soils of partly
Clare Shale origin but there was no apparent relationship between
P and the uptake of Mo. As with Mo, red clover absorbed about
twice as much phosphate as cocksfoot.
It would appear that the amount of naturally-
occurring sulphate and phosphorus in the soils has no signi-
ficant effect on the uptake of Mo. However, studies by other
workers indicate that the application of these materials as

242
fertilizers may cause changes in uptake rates. With regard to
Mo toxicity it would seem that the effects of sulphate and phos-
phorus applied as superphosphate would counteract one another
to a large extent but in areas of potentially molybdeniferous
soils the application of phosphorus. as basic slag should be
avoided.
Hurd-Karrer (1953) showed that the application of
sulphate decreased the absorption of Se by crop plants. This
antagonism between sulphate and selenate was attributed by
Leggett and Epstein (1956) to competition between the ions at the
cell membrane absorption site. However, Beath (1937) showed that
selenium derived from seleniferous plant extract, presumably an
organic complex, was not affected by the addition of sulphate
or gypsum to soil plots. Nor was the uptake of Se as selenite
affected by sulphate addition to culture solutions (Freleane and
Beath, 1949). The possible inability of sulphate to affect the
uptake of organic Se compounds may be pertinent to problems of
toxicity in Irish soils if much of the soluble Se accumulated in
the peaty-swamp deposits is in an organic form.
Fleming (1965) shows that sodium and calcium phos-
phate increased the uptake of Se but the application of super-
phosphate depressed it. This is presumably due to the high
CaSO4 content (about 50%) counteracting the effect of the phosphate.
Study of the effect of naturally-occurring sulphate
and phosphorOus in the topsoil and herbage, of the area did not

243
indicate any significant influence on the uptake of Se that could
not also be attributed to other factors, such as pH.
3. DISCUSSION AND SUMMARY
The geochemical reconnaissance survey was concerned
with determining the total metal content of stream sediments with
a view to delimiting connections between the total metal content
of the sediments, soil and herbage. The problem hinges on the
degree of correlation that exists between total metal in the
drainage and available metal in the soil.
In the case of Mo, the broad correlation between the
total amount present in the sediments and topsoil and the amount
accumulated by herbage indicates that the interpretation of geo-
chemical patterns based in total Mo is a fair indicator of poten-
tially molybdeniferous herbage. The modifying effect of pH on the
availability of Mo has been pointed out and the data generally
confirm the results of other workers that uptake from alkaline
soils is generally greater than from acid soils. Within a moly-
bdeniferous area particular attention should be paid therefore, to
areas of alkaline soils, even if the actual total Mo content of
the soil is not exceptionally high. In the area studied, alluvial
deposits overlying limestone are particularly suspect for this
reason. Associated with the influence of pH, the application
of basic fertilizers, in particular lime or basic slag, should
be carefully considered with regard to their effect on Mo-uptake

244
in areas of potentially toxic molybdeniferous soils. The over-
riding influence of the total Mo soil content apparently masks,
for all practical purposes the influence of the other eAviron-
mental factors.
The correlation of total Mo soil contents with the
amount accumulated by herbage only applies of course to the
particular environmental conditions of this area. La Riche
and Weir (1963) and Dobritskaya (1964) summarize the forms of
Mo present in the soil as:-
(i) Metal unavailable to plants, which would include
that held as a constituent of the crystal lattice of other minerals.
(ii) Anionic Mo04 adsorbed by clay minerals and
available depending on soil pH, phosphate and sulphate status.
(iii) Mot generally Mo04 held in association with
iron, aluminium or manganese oxides. The availability of this
would largely depend on the pH environment.
(iv) Organic Mo complexes which would probably
become available on breakdown of the organic matter.
(v) Water-soluble forms.
It is considered unlikely that significant amounts
of Mo in the first two forms are present in the soils of the area.
Totally unavailable material (i) is most probably only represented
by unweathered Clare Shale fragments and forms only a very minor
fraction of most topsoils. Because of the organic nature of the
topsoil and the common association between Mo and iron oxides and

245
organic matter, it is also unlikely that molybdate ions adsrobed on
clay minerals (ii) forms a significant proportion of Mo in the
soils.
Organic forms are quite likely to be present in the
poorly-drained peaty-swamp deposits. Also water-soluble Mo is
known to be present in near-surface groundwaters in these soils
and so almost undoubtedly forms part of the readily available metal
present in soil solution.
In more freely drained soils, the general relationship
of Mo in soil to Mo accumulated by plants most likely reflects the
proportion available from Mo bound with iron oxides and organic
matter. This conclusion probably also applies to much of the metal
held in the swamp and alluvial topsoils with possibly some modifi-
cation for a higher proportion of organically-held Mo.
Se in herbage, although primarily related to the metal
content of the soil, is also closely dependent on the drainage
conditions and to a lesser extent on pH. Severely impeded drainage,
in addition to contributing indirectly to the concentration of Se
on the organic matter which readily accumulates under these condi-
tions, also entails the retention in groundwaters of available Se
in solution, derived from decomposition of Se-rich organic matter.
The effect of a rise in pH on uptake is to encourage the stability
of the readily available selenate form.
Se has been recorded in soils (Rosenfeld and Beath,
1964) in the form of selenides, sulphide ores, in pyrite, elemental
selenium, organic Se compounds, selenites and selenates. As stated

246
previously, selenates and soluble organic complexes are the most
readily available to plants and are responsible for most cases of
the toxicity. The weathering conditions of the study area leading
to the fixation of Se in the soils are such that it is most unlikely
that selenide or sulphide forms should be present in any significant
quantity and, except under the most extreme reducing circumstances,
the presence of elemental Se is also unlikely. It is considered that
the bulk of the Se fixed in the well-drained soils in a generally
unavailable form is the selenite, most likely associated with iron
as basic ferric selenite. The available forms in the poorly
drained soils are probably selenates or soluble organic compounds.
Se may be fixed as a temporarily unavailable element on organic
matter in peats and released as decomposition proceeds under the
influence of cultivation and better drainage.
As in the case of Mo, environmental features such as
the amount of naturally occurring sulphate and phosphate did not
have an appreciable affect on uptake. The application of lime or
basic slag to seleniferous soils may increase the potential toxicity
of the soil by raising the pH. Liming of poorly drained soils in
particular, which tend to contain higher total Se concentrations,
should therefore be avoided. Local experience has also shown that
ploughing of the Se-rich swamp fields increases their toxicity. It
is considered that the reason for this may be two-fold. Firstly by
raising material from the more seleniferous lower horizons to the
level of root penetration, and secondly, by improving surface drainage
and aeration which accelerates the release of soluble Se compounds
from decomposing metal-rich peaty matter.

21+7
CHAPTER IX. DISTRIBUTION OF MOLYBDENUM AND SELENIUM IN DRAINAGE
It has been shown empirically that at both regional
and relatively detailed scales, metal patterns revealed by analysis
of the -80 mesh fraction of stream sediment broadly reflect the
metal content of soils in the stream catchment areas (Chapters
IV and V). This relationship is now examined in greater detail
by study of the dispersion mechanisms by which Mo and Se, either
in solution or by mechanical erosion, enter the drainage system.
Aside from some comparative data on the metal contents
of waters and sediments from background areas, most of the informa-
tion presented refers to the drainage patterns developed from the
soils of the Flynn's Farm area. Within this area, the effects of
land improvement, drainage and dredging of stream channels on the
natural drainage patterns, can also be examined.
Data on the metal content of natural waters refer
to the total Mo and Se contents, unless stated otherwise. The
total content will include non-ionic and organic compounds as
well as ionic metal in solution. The amount of suspended matter
has been limited by filtering samples at the time of collection.
1. GENERAL DESCRIPTION OF THE FLYNN'S YARN DRAINAGE SYSTEM
Flynn's Creek rises by springs and groundwater seepage
from the metal-rich peaty swamp at toxic soil site A (Fig. 18).
The present-day drainage system consists of man-made channels

248
within the swamp but about a .k-mile from the source the stream
follows its natural course. In the lower reaches however, the
natural channel has been deepened, the waste being dumped alongside
the str= to form low "levee" banks. In some places,.particularly
near the alluvial deposits flanking the stream at toxic soil site
B, there has been some reinforcement of short stretches of bank
by stone walls. About 2i miles downstream from the swamp, the
channel was dredged during the period of the writer's field
work and this allowed comparison of the effects of dredging on
the dispersion patterns in the stream sediment.
Except where Flynn's Creek passes over the remnants
of the Clare Shale escarpment the gradient is low and the flow-
rate moderate to very slow. In slow-flowing waters, the sediment
is very fine and usually characterized by a high content of
organic matter. The excessive growth of water plants common
in slow-running stretches of the stream enhances this feature.
Mineral sediments predominate in the faster-flowing parts of the
stream.
South Creek, immediately south of Flynn's Creek
(Fig. 18), has a generally similar course but its source is in
springs that come to the surface just upslope from a peaty-swamp.
Downstream, there is a development of flanking alluvium of mixed
Clare Shale and limestone composition in contrast to the mainly
calcareous alluvium flanking Flynn's Creek. This alluvium is
deposited immediately adjacent to the base of the Clare Shales and

249
is subject to seepage from these rocks.
The source of North Creek is at the western end of
the peaty-swamp of toxic soil site A. The headwaters are formed
of freshly dug drains (about 1-year old) in both peaty and gleyed
drift soils.
The general drainage environment is to a large extent
controlled by the constitution of the bedrock or drift material
in the catchment. Except in the immediate vicinity of the
relatively small areas occupied by Clare Shale bedrock and drift,
the influence of limestone both as bedrock and as a major consti-
tuent of drift is apparent in the development of a mainly calcareous
environment. This is generally characterized by neutral to alkaline
ground and surface waters (pH 6.o-8.45) containing high concentra-
tions of bicarbonate (317-677 mg per litre) and in the precipita-
tion of CaCO3 in stream channels. In contrast to the limestone
areas, drainage in the vicinity of the Clare Shales and peaty-
swamp deposits is noticeably iron-rich with abundant precipitation
of iron oxides at seepage points and, because of the slightly more
acid environment, an absence of precipitated CaCO3
in the streams.
The redox environment of the drainage varies over a
wide range, the most oxidizing conditions recorded (+0.535 volts)
occur in groundwaters draining weathering Clare Shales and the
most reducing (+0.095 volts) in some organic alluvial deposits;
intermediate values were recorded in groundwaters draining lime-
stone drift and most of the alluvium (Fig. 49). The Eh of stream
waters is fairly uniformly oxidizing (from +0.390 to +0.500 volts).

5 6 7
8
9 pH
• Groundwater —Flynn's peaty swamp. 4. Stream water-Flynn'sC-k. O re " SouthCk. " " 0 " " South Ck.
e Groundwater from alluvium flanking Flynn's Creek.
pH-Eh ENVIRONMENT OF NATURAL WATERS OF STUDY AREA
(Part of the stability fields of some ionic species of Se and Fe are included. At the range of conditions present Mo will be stable as the Alo04 '''. form.)
FIG. No. 49.

Site pH (mg/litre)
Se (ppb)
Mo (ppb)
S.W. Corner of the regional area (Fig. 12). 7.8 491 <0.4 0.5 Limestone drift
N.W. Corner of the regional area (Fig. 12). 7.7 518.5 0.3 <0.5 Limestone alluvium
- HCO3
250
2. MOLYBDENUM AND SELENIUM CONTENT OF GROUNDWATER
Apart from mechanical processes, the initial stage of
entry of metal into the secondary geochemical cycle and from thence
to the drainage system is by solution in groundwater. It has
already been shown (Chapter VII) that the weathering of Clare Shale
drift produces anomalous concentrations of Mo and Se in groundwater
and also that the movement of metal in groundwater is a major
factor contributing to the accumulation of Mo and Se in the peaty-
swamp deposits.
(a) Molybdenum and Selenium in Background Areas
Two samples of groundwater from limestone areas far
removed from the influence of Clare Shales and containing only
background concentrations of Mo and Se in the soils, had the
following characteristics (Table 42).
Table 42: Metal Content of Groundwater from Background Areas

Site pH Eh Se Mo (ppb) (ppb)
Clare Shale Drift 5.4 +0.535V 1.0 7.5 (BP 106)
Clare Shale Alluvium 6.3 1.2 6.0 (BP 28)
251
(b) Groundwaters from Clare Shales
One sample of groundwater from weathering Clare Shale
drift, the profile of which contained 2.5-9.0 ppm Se and 2-85 ppm
Mo in the -80 mesh fraction, carried moderate amounts of Mo and Se
in solution (Table 43).
Table 43: Molybdenum and Selenium Content of Groundwater from Clare Shale Over-burden
These data indicate that even in the relatively acid
environment of weathering Clare Shales (Fig. 49) metal is intro-
duced into the drainage system in solution. Rather more alkaline
groundwaters draining alluvium of predominantly Clare Shale origin
also contained roughly similar concentrations of metal.
(c) Groundwaters Draining Drift
Most of the catchment area of the Flynn's Farm drainage
system is covered by drift of mixed limestone and Clare Shale
origin. The metal content of the drift broadly reflects the
metal content of the bedrock constituents (Chapters IV and VII).

252
Groundwaters entering the surface drainage and swampy seepage
areas mostly drain from this material and the underlying bedrock.
A certain amount of data on the metal content of
groundwater draining drift has already been given in Chapter VII
(ref. Fig. 39) where the accumulation of Mo and Se in the peaty-
swamp soils is attributed to metal drained from the adjacent
overburden and subsequently precipitated. Groundwaters in the
drift from the catchment area at the head of Flynn's Creek and
North Creek contain from 0.2-7.0 ppb Se and 2.0-100 ppb Mo
(Figs. 40 and 52 and Table 44). The very high value of 100 ppb
is exceptional however, and may be spurious since all other values
from well drained drift were below 9 ppb. The pH-Eh environment
of these waters is more or less neutral and oxidizing, pH
ranging from 6.6 to 7.2 and Eh from +0.350 to 0.455 volts (Fig.
49). Under such conditions Mo and Se should be relatively mobile,
since ferric molybdate is relatively soluble at pH greater than
6 (Fig. 43; Jones, 1957) and Se is most probably present as the
soluble selenate 6r possibly as the slightly soluble selenite
(ref. stability field of Se, Fig. 41).
There is no apparent correlation between the amount
of either Mo or Se in solution and the pH-Eh environment (Table 44).
The principal factor controlling the concentration of metal in
groundwaters is the amount present in the soil (Fig. 50). The
lack of an obvious relationship between the metal in solution and
the pH-Eh conditions may be due to the limited range of conditions
examined.

1000 •
• • e• • • • •
•
•
• •
•. • Se in
gr o
un
d w
ate
r
0.2
0.1
1
0.5
100
20
10
S
50
Mo
in g
rou
nd
wa
ter
Epp
b)
500
200
100
50
20
10
5
2
• •
•
•
•
•
• • •
•
•
•
• • • • •
ere • •
• • •
• • •
• • • • •
• 0
•
•
• •
•
•
2 5 10 20 50 100 200 2 5 10 20 50 100 200 500 (a) Se in soil (ppm) (b) Mo in soil (ppm)
FIG.No.50 RELATIONSHIP BETWEEN METAL CONTENT OF SOIL AND NEAR-SURFACE GROUNDWATER.
(Metal content of soil calculated as the mean composition of the soil or weathered drift profile. j (Samples from Flynn's and North Ck. cathment areas)

+ Ground sites. waters-number refer to profile • Spring and stream waters.
•
• Spring and stream waters. mop + Ground waters from peaty soils.
• " ,. " drift
50 Surface Peaty
50-
- 0 fe •• " alluvial
Drift soils V
/
20 , soils ' 20- / 24+ /X •• •
/ / / •• • i e A • 5 •At
10 % , / 10- • • • / . • +
/ • / • • /• /"'•88 0
+ .
•
• . ? o •• +
5 / / 5 - / • ? .ca • 2 ♦It G. / 90 0. 0 /
+ e , a.
/ / ..... i II) 0 + a. • • / • / /
2 0, / a 2,0 ...- a i+23 X in in ./
a ,' , • 89 o .
1 • i • / 91 • 1- 0
? o • 0 0
05 0-5 - •
0-2 • - 0-2
0.1 5 10 20 50 100 200
Mo (ppb) DRAINAGE AT HEAD OF NORTH CK.
01 2 5 10 20 50 100 200 500
Mo(ppb) ( b) FLYNN'S CREEK DRAINAGE
500 I 2
(a)
FIG.No.51 RELATIONSHIP BETWEEN Mo AND Se IN GROUND AND SURFACE WATERS.

Table 44: Relationship of Molybdenum, that of the Soil
(Groundwater samples from d at head of Flynn's Creek.
Selenium Content of Groundwater to
rift and peaty-swamp catchment area Ref. Fig. 40)
Hole No.
pH Eh (4. volts)
Se Content Mo Content
Water (ppb)
Soil* (ppm)
90 Se in Solution
Water (ppb)
Soil* (ppm)
Mo in Solution
Moderately well-drained .redominantl drift and colluvial soils
95 7.2 0.43 0.2 3.8 0.006 5.0 6 0.083 48 7.0 0.455 1.0 12.0 0.008 3.1 11 0.027 96 7.1 0.43 0.6 20.0 0.003 5.0 25 0.020 94 6.95 0.435 0.6 26.5 0.002 3.1 33 0.009 93 7.0 0.450 0.8 26.5 0.003 3.0 40 0.0075 97 6.8 0.445 3.0 31.5 0.009 7.0 40 0.017 49 6.6 0.350 3.0 12.0 0.025 2.5 13.0 0.020 50 6.9 0.380 7.0 28.0 0.025 8.1 111.0 0.007 52A 6.6 0.355 4.0 100 19.0 0.530 53 6.75 0.355 1.5 8.75 2.5 0.028
Very poorly drained, peaty-swamp soils
99 6.85 0.26 5.0 34.0 0.015 10.0 46 0.022 98 6.7 0.28 8.o 65.0 0.012 37.5 157 0.024 6 6.8 0.275 8.5 122.0 0.007 110.0 210 0.052 7 6.85 0.24 26.0 244.0 0.011 400.o 634 0.063 51 6.9 0.28 38.0 83.o 0.045 1000 162 0.60

Se Content Mo Content Hole pH Eh No. (+ volts) % Se in
Solution Water Soil* % Mo in (ppb) (ppm) Solution
Water Soil*
(ppb)
(ppm)
Weathering Clare Shale (for comparison)
106 5.4 0.535 1.o 5.5 0.013 7.5 27 0.028
Groundwater from North Creek Catchment Area
Drift Soils
23A 7.05 0.33 1.6 8.o 0.02 6.7 12.0 0.056
88. 7.o 0.31 6.25 14.0 0.044 27.0 20.0 0.135 90 7.1 0.43 3.1 15.0 0.027 7.5 3.0 0.25 91 6.95 0.38 1.25 - - 4.1 -
Peaty Soils
24A 7.35 0.39 89 7.o 0.42
17.5 51.5 0.034 600 400 0.15
1.25 11.0 0.011 67.0 8o 0.084
Table 44 (continued)
*(Metal content of soil refers to the average content of the weathered horizons. In the case of Mo the value given has been corrected for the estimated loss on ignition prior to spectrographic analysis)

255
The close correlation between the concentrations
of Mo and Se in groundwater in drift (Fig. 51a) is apparent when
samples sited close together with similar environmental charac-
teristics are considered, as is the case for the North Creek
samples (Fig. 51a). There is however, no close relationship
when a wide range of environments is examined, as in Flynn's
Creek (Fig. 51b).
(d) Groundwaters from Peaty-Swamp Deposits
In the metal-rich peaty-swamp soils in which Flynn's
Creek rises, the groundwater environment is slightly more acid and
reducing (pH 6.7-6.9, Eh +0.24-0.28 volts) than that of the waters
draining into it (Table 44, Fig. 39). The accumulation of Se in
these organic-rich deposits is possibly partly due to the relatively
reducing environment causing fixation of the less soluble selenite
ion (Chapter VI, Figs. 39 and 42). Groundwaters from the peaty-
swamp at the head of South Creek show a similar drop in Eh (+0.120-
+0.180 volts) compared with groundwaters draining from the adjacent
drift (+0.210-+0.335 volts).
The metal content of groundwater from Flynn's peaty-
swamp is high (5-38 ppb Se and 10-1000 ppb Mo) compared with the
drift waters entering it (Table 44 and Figs. 39 and 40). The
values in groundwater from both drift and swamp are generally
proportional to the metal content of the soil (included in Fig. 50)
and this factor apparently overrides the influence of pH-Eh

256
conditions as determined from open boreholes. Although by
theory and observation the relatively reducing, organic-rich
environment of the swamp should encourage fixation of metal in
an insoluble form it is believed that oxidation of the deposits
has allowed resolution of metal by the groundwaters (Chapter VII).
Hesse (1961) and Ekpete and Cornfield (1965) show
that drainage of waterlogged organic-rich soil leads to accele-
rated "mineralisation" of organic matter and it is considered
that such an effect would lead to the release of organically
held metals.
There is a fairly close correlation between the Mo
and Se content of groundwaters from Flynn's peaty-swamp (Fig. 51b)
which, allied to the close relationship between soil and water
contents, indicates that the relative release of both metals from
the soils is more or less the same. This would be consistent with
the release of both metals simultaneously on decomposition of
organic matter and affords further confirmation of the effect of
organic matter by adsorption on the accumulation of Mo and Se in
the peaty-swamp.
(e) Groundwaters from Alluvial Deposits
Groundwaters from the alluvium flanking Flynn's
Creek at toxic soil site B (Figs. 36 and 37) are slightly acid
and reducing (Fig. 42, Table 45). Water in bore-holes at the
better drained edge of the deposits is slightly more oxidizing

Table 45: Relationship of Molybdenum and Selenium in Groundwater to Molybdenum and Selenium Content of Alluvium
Hole No.
pH Eh Se Mo
(+ volts) Water (ppb)
Soi1" (ppm)
96Se in Solution
Water (ppb)
Soil** (ppm)
% Mo in Solution
64 6.35 0.295 0.8 4.5 0.018 1.5 3.o 0.05 65 6.3 0.200 2.6 22.0 0.012 2.0 6.0 0.033 2 - - 5.0 26.0 0.019 3.0 10.0 0.03 66 6.6 0.205 3.o 11.o 0.027 4.25 <2 >0.21 71 6.6 0.095 3.6 30.0 0.012 2.5 5 0.05 67 6.0 0.160 2.0 15.0 0.013 1.0 <4 >0.025 4 - - 2.3 13.0 0.017 2.0 2 0.10 68 6.4 0.110 1.0 6.0 0.017 0.25 <2 >0.12 69A 6.9 0.295 1.2 6.o 0.020 1.25 <2 >0.062
*For location of bore holes refer section, Fig. 36
**Metal content of soil is mean metal content of alluvial profile.

258
(Eh +0.295 volts) than those nearer the centre of the deposit
(+0.095 - +0.205 volts). The Se content of the groundwater
compared to Mo is relatively high compared with groundwaters
from the catchment of the head of the stream (Fig. 40) and this
reflects the relative metal contents of the alluvium itself
(Table 45). There is no readily apparent relationship between
the proportion of either metal in solution and the pH-Eh environ-
ment. The correlation between metal in groundwater and the
amount present in alluvium is more apparent in the case of Se
than it is for Mo (Table 45).
(f) Summary - Molybdenum and Selenium Content of Groundwaters
Groundwater from the generally anomalous region of
Flynn's Farm contains appreciably more Mo and Se than waters
from an area carrying background metal levels in soils and stream
sediments.
Although the accumulation of metal, Se in particular,
has been in part attributed to the relatively reducing groundwater
environment of some of the poorly drained soils, present-day pH
and redox potentials as measured from open bore-holes have no
appreCiable effect on the proportion of either Mo and Se in the
groundwater. The metal content of the groundwaters bears a fairly
close relationship to the metal content of the upper horizons
of the overburden from which it was collected. The most metal-
rich soils are accompanied by the highest concentrations of metal

259
in the groundwater regardless of variation within the limited
range of pH-Eh conditions encountered.
The proportion of Se in the groundwater compared to
the Se content of the soil varies within only very narrow limits,
regardless of soil type (Table 46). Mo varies to a somewhat
greater extent. It is tentatively considered that the greater
variation of Mo compared to Se in groundwaters relative to the
metal content of the soil may reflect the different modes of
fixation of these metals in the soil. Data from the overburden
metal patterns (Chapter VII) suggests that both organic matter
and iron oxides are involved in the accumulation of Mo in poorly
drained soils whereas the retention of Se is probably controlled
to a much greater degree than Mo by adsorption on organic matter.
In the event of the decomposition of soil organic matter, with
the subsequent release of adsorbed metal into the soil waters,
the proportion of additional Mo held on iron oxides in the soil
will cause variations in the relative amounts of the two metals
in solution compared to the total content in the soil.
The ratio between the Mo and Se contents of the
groundwater is close only when similar soil types, with similar
relative metal contents and situated close together are considered.
Mo is consistently more mobile (more soluble) than Se
in all the environments studied when the metal content of the
groundwater is compared with that in the soil (Table 46). A
slightly greater proportion of Mo is therefore available for
release in solution into the surface drainage.

Table 46: Relationship of Molybdenum and Selenium in Groundwater to Molybdenum and Selenium Content of Overburden
Overburden Type
Percentage Metal Present in Groundwater
Selenium
Range % Average%
Molybdenum
Range 5 Average %
Weathering Clare Shale drift 0.018 0.018 0.028 0.028 (1) (1)
Alluvium of predominant Clare 0.02 0.036 Shale origin (1) 0.02 (1) 0.036
Limestone and Clare Shale drift 0.002-0.044 0.007-0.530 - Flynn's and North Creeks catchment area
(11) 0.016 (13) 0.091
Peaty-swamp deposits Flynn's 0.007-0.045 0.022-0.60 and North Creeks catchment area
(7) 0.019 (7) 0.143 (one very high sample present)
Alluvium, predominantely lime- 0.012-0.027 0.03->0.12 stone flanking Flynn's Creek (9) 0.016 (9) >0.074
(3) = no. of groundwater samples
(% metal in groundwater = Metal content of groundwater (ppb)
Average Metal content of overburden profile (ppm) x 10)

261
The actual mode of occurrence of either metal in the
groundwater is problematical. It is most likely that a considerable
proportion is present as soluble inorganic Mo04 or Se04 ions but
soluble organic complexes of both metals are known to exist and may
play a part in the mobilization of either element. The presence
of some suspended solid matter is possible although samples were
filtered to a clear solution at the time of collection.
3. MOLYBDENUM AND SELENIUM CONTENT OF SURFACE WATERS
Except during periods of rain when surface run-off
contributes to the stream flow, the source waters of the streams
studied (Flynn's, South and North Creeks) are to a large degree
derived from the groundwaters described previously. The intro-
duction of these waters occurs at springs and seepage zones.
This allows some comparison of the effect of the environmental
change from sub-surface to surface on the composition of the water.
(a) Molybdenum and Selenium Content of Stream Waters from, Background Areas
Four samples of stream waters from a background area
of limestone and one from a stream on the Namurian rocks had the
following characteristics.

Bedrock Sample pH HCO3 Se Mo No. (mg/litre) (ppb) (ppb)
Limestone (2375) 8.4 323 0.4 <0.5 it (2220) 8.4 563 0.2 0.25 TI (2228) 8.3 241 0.2 0.5 1 (2224) 8.2 .557 <0.2 <0.5
Namurian (2817) 7.65 11.6 <0.2 <0.5
262
Table 47: Metal Content of Stream Water from Background Areas
(b) Distribution of Molybdenum and Selenium in Surface Waters Draining the Flynn's Farm Area
(1) Physical and Chemical Environment of Surface Waters
The three streams studied all show a general rise in
pH where the groundwaters reach the surface at springs and seepage
points (Table 48). The rise is not well marked and is generally
less than 0.5 pH units. The pH in the headwaters of Flynn's and
South Creeks, where they flow through peaty-swamps and mixed Clare
Shale and limestone drift soils is in the order of 7.0 to 7.5.
Downstream the pH gradually rises to a maximum of 8.45 where the
streams flow over limestone (Figs. 55 and 56). North Creek
(Fig. 52) shows a similar rise in pH downstream from its source.
Eh
Where waters enter the surface drainage at springs
and seepages there is a rise in the redox potential compared with
the Eh of the peaty-swamp groundwaters from which they are derived

Table 48: Summary - pH, Eh and Bicarbonate Content of Surface Waters Compared with Groundwaters
pH
Eh (+ volts)
ZTT:re)
Flynn's Creek
Groundwaters from drift 6.8-7.2 6.7-6.85 7.2
7.1-7.8
0.43-0.455 0.26-0.28 0.435-0.485
0.390-0.470
348-494 395-521 354-488
384-482
?? " peaty-swamp Springs near head of Creek Stream waters - from the upper part of the catchment near Flynn's Farm, bedrock Clare Shales. Stream waters - downstream, bedrock
8.1-8.45 0.420-0.490 397-467 limestone
South Creek
Groundwaters from drift 6.45-6.95 0.21-0.335 323-488 of li peaty-swamp 6.3-6.5 0.12-0.18 397-506
Springs near head of Creek 6.7-7.0 0.39-0.395 354-384 Stream waters at head of Creek with Clare Shale bedrock 7.05-7.9 0.25-0.42 390-464 Stream waters downstream 7.85-8.3. 0.42-0.500 351-463
North Creek
Groundwaters 6.9-7.35 0.330-0.430 293-415 Seepage waters 6.8-7.25 0.355-0.405 378-403 Stream waters 7.0-7.8 0.415-0.485 286-390

264
(Table 48). This probably accounts for the commonly observed
precipitation of hydrous iron oxides at seepage points in bank
soils and at springs due to oxidation of soluble ferrous iron
to the much less soluble ferric state. Downstream, the surface
waters maintain a more or less uniform oxidizing Eh level.
The relative pH-Eh status of ground and surface
waters is also shown in Fig:. 49.
Bicatbonate
No significant variation in the bicarbonate content
of ground and stream waters was detected. Within the area of
dominantly limestone drift in the vicinity of Flynn's Farm all
waters are relatively high in dissolved bicarbonate (Table 48).
The bicarbonate content of waters draining dominantly
Namurian or Clare Shale areas is much lower than those draining
limestone (Table 49).
Table 49: Bicarbonate Content of Waters from Non-Limestone Areas
PH HCD3
(mg/litre)
Namurian rocks (stream water) 7.65 11.6 Clare Shale Alluvium (groundwater) 6.3 24.4
" and Limestone Alluvium (stream water) 7.4 103.7
Mixed Namurian, Limestone and Clare Shale drift (stream water) 7.9 57.95

265
(III Molybdenum and Selenium in North Creek Surface Drainge
The North Creek drainage study was restricted to a
relatively small area at the head of a recently excavated system
of drains in poorly-drained drift and peaty soils (Figs. 40 and 52).
Because of the small size of the area a reasonably reliable compari-
son can be made between the metal contents of ground and surface
waters. Except in the peaty-soils, the recent nature of the
drainage has not permitted much organic matter to accumulate in
the principal drains and the precipitates present are mainly
ferric oxides. There is no visible precipitation of CaCO3.
Surface water samples show a roughly linear relation-
ship between the Mo and Se contents (Fig. 51a). It is apparent
though from this diagram and Fig. 52 that the transition from
groundwater to surface conditions has involved the precipitation
of considerable amounts of Mo but with little change in the Se
content of the water. The change in the relative abundance of
the two metals is most marked in the decrease in Mo content of
groundwaters of peaty soil origin. At this stage the loss of
Mo from solution is tentatively attributed to co-precipitation
with iron oxides which commonly occur at seepage points at the
heads and along the banks of the drains.
The Mo and Se contents of the water at the head of the
main east-west drain which rises in drift soils are low but rise
r&pidly with the introduction of metal-rich waters from tributary
drains in the peaty soils (Fig. 52). This is directly related

Ci Auger-how. 0 Spring or setpisso. Drain water sample Ste
• 100
•
2
20-
+—+ TOTAL Fa CONTENT OF WATER.
•—• " Mo "
" Se
N
0
• •
METAL CONTENT Eh and pH of MAIN DRAIN
------- ---• pN OF MATER
+---+ Eh " "
• -*Flow
pH Eh volts
II -.OS
.045.
7 •.64
6-S .035
0̂
1-7 S.0 ID A (so)
(1130) c350) (52)
625 'Fr (.3)
SCALE SCALE.
20 H. to 1 inch 100 ft to I inch 0 10 20 0 50 100
T.T riA (7514SO°)
FIG.No 52.
1030- 102.-
6-25 (40) Peaty Vey. 17.5
0701
+/6 1E9 (292) 219 10-0 124
0 gas (115) (73) R2) OP 53, 250 f t west
at head of drain
Foot soil .114 C)
irtot
0
N
00 11
A
45,0 MO content of water in ppb. AS Se " "
(350) Ft -
METAL CONTENT OF GROUND AND STREAM WATERS.
Plan of Recent Drainage Channels at the Head at North Ck.

266
to the metal contents of the soils, the profiles of which average
from 11-51.5 ppm Se and 80-400 ppm Mo in the peaty soils, and from
8-15 ppm Se and 3-20 ppm Mo in the drift soils (Table 44). Down-
stream from the confluence of the drains the metal content of the
stream remains fairly uniform, decreasing slightly before entering
the main drain to the east of Fig. 52.
There is usually a general drop in the Fe content
between ground and stream waters as would be expected from the
abundant precipitation of iron oxides at the seepage points.
The seep near the head of the main east-west drain contains an
exceptionally high proportion of Fe and this is reflected in the
abrupt rise in the Fe content of the drain waters after they pass
this point. Downstream the Fe content drops due to dilution by
waters from the tributary drains which contain relatively little
Fe in solution.
The general dispersion pattern suggests that after
precipitation of metal takes place at the transition from ground
to surface water (as undoubtedly occurs in the case of Mo), the
metal content of downstream surface waters is controlled by
simple dilution and mixing without any further significant preci-
pitation. This can be proved mathematically, if it is assumed
that Se, as indicated by the relatively similar Se contents of
ground and surface waters (Fig. 51a) is more or less completely
mobile in the non-organic oxidizing, alkaline environment of the
stream waters. Such an enviornment should encourage the formation

267
of the soluble selenate ion and also the non-organic nature of
the stream sediments should preclude the absorption of Se.
(X + Y + Z) I —›
Let X, Y and Z be the flow rates of the three major drains at the
head of North Creek (for location and metal content of water
refer Fig. 52). (There is no other visible drainage into the
stream in this section.) Using the observed Se content of the
stream waters relative values for X, Y and Z can be calculated.
(X x 1.25) + (Y x 10) = (X + I) x 8.75
w 10 Y - 8.75 Y = 8.75 X - 1.25 X
Y = 7.5 Z 1.25
Relative flow rate X:Y = 1:6
Similarly Z-(X + Y) 8.757 /-z m 12.32= g + Y + Z 7 11.25
• • (Z x 12.3) - (Z x 11.25) = (X + Y) 11.25 - (X + Y) 8.75
1.05 Z = 2.5 (x + Y)
But X + Y = 7 z = 16.6 •
Relative stream rates are X : Y Z = 1 : : 16.6
Therefore, using the observed Mo and Fe contents at points X, Y
and Z, metal contents at the points (X + Y) and (X + Y + Z) can
be calculated far simple dispersion of Mo and Fe by mixing of
waters from the tributary drains (Table 50).

268
Table 50: Comparison of Calculated and Observed Molybdenum and Iron Contents of Stream Waters
Site Mo (ppb) Fe (ppb)
Observed Calculated Observed Calculated
(X + Y) 5.0 5.4 350 36o
(x + Y + z) 6.o 6.2 135 155
The extremely close correspondence of the observed
and calculated values indicates that no significant changes in
the mobility of Mo or Fe occur in the surface waters. The con-
sistently slightly lower values observed may indicate a negligible
precipitation of metal but, within the limits of accuracy of the
sampling and analytical methods, this is probably not significant.
Summarising the studies of waters from the head of
North Creek it is apparent that a substantial precipitation of
Mo takes place (probably in association with Fe) during the
transition from ground to surface conditions but Se is not
greatly affected. In the surface waters of the streams no
further significant change takes place and the content of Mo,
Se and Fe is the result of simple dilution or enrichment by
tributary drains.
(iii) Molybdenum and Selenium in the Waters of Flynn's Creek
Unlike the headwaters of the North Creek drains in
which the catchment is mainly composed of drift deposits, Flynn's

269
Creek rises almost entirely in the old peaty swamp comprising
toxic areaA. Long established drainage has lowered the water- (
table and it has been suggested that the resultant weathering
of the peaty, metal-rich soils has contributed to the mobiliza-
tion of Mo and Se into the groundwaters.
Because of the large size of the peaty-swamp at the
head of Flynn's Creek and the limited number of groundwater samples
(Fig. 40), it is not possible to make a direct comparison
between the Mo and Se contents of the ground and stream waters.
Also, it is most probable that not all the groundwaters entering
the stream headwaters are derived from the metal-rich horizons
of the peat deposits. There may be some direct drainage from
drift particularly in the case of free-running springs, e.g.
near BP 6 and near the confluence of the two main drains forming
the source of the stream (Figs. 40 and 53).
The metal contents of the stream waters (Fig. 51b)
are more closely related to the groundwaters from the peaty swamp
deposits than to those from the drift. It is probable that,
similar to North Creek, there is a tendency for Mo to precipitate
on entering the surface drainage whereas Se shows little change.
The metal contents of the two drains forming the head
of the stream are not similar. The southernmost, which drains
the peaty-swamp adjacent to Clare Shale colluvium and drift,
contains a much higher concentration of both Se and Mo, and
this corresponds to the much higher metal content of groundwaters

14 25 .at 66 11
10.6
IL 3
1.-714 372" parts per billion (10-9) Stream Sample Site.
o Spring or Seepage.
4--- I SCALE - 880 feet to 1 inch) SCALE-1650 feet to 1 inch.
(approx.) I I t
14 MILE 1/4 MILE
Samples c ollected, AUGUST,1965.
METAL CONTENT OF STREAM WATERS Flynn's and South Creeks.
FIG. No. 53.

270
in this area (Fig. 4o). Waters from the other drain, although
of lower overall metal content contain a much higher proportion
of Se relative to Mo. This does not correspond with the ground-
water content and possibly represents a greater proportional
precipitation of Mo from solution. At the confluence of the two
drains (ref. longitudinal profile of stream metal contents, Figs.
53 and 54) the waters mix and intermediate values are present
in the downstream waters.
Downstream the metal contents of the waters remain
high until several hundred feet past the boundary of the Clare
Shales where a gradual decrease in value commences, presumably
due to dilution by barren waters, e.g. the spring near site 4209.
There is no appreciable increase in metal content as the stream
passes the alluvium of toxic soil site B, where the metal content
of the local groundwater is roughly of the same order as the stream
water (Table 45).
After the confluence with South Creek the stream waters
maintain a uniform anomalous level of 6.5 ppb Mo and 2.6 ppb Se for
more than 10,000 feet downstream. Sampling was terminated at this
point. The anomalous drainage train of both Mo and Se is therefore
detectable at least three miles downstream from the major toxic
soil source at the head of the stream. There is, of course, some
reinforcement of the metal content of the stream waters by seepage
of metal-rich waters from flanking alluvium and it is not possible
to give the probable length of a detectable train in the absence
of such deposits.

WI to 0-0 Se Mo Ow Bank Soils
WO
MIXED PEAT AND DRIFT SOILS
Swamp colluvial banks. Some levees.
Man-made drain, swampy colluvial banks.
PEATY SWAMP DEPOSITS
0Seepage
+._. ....... pH of Stream Water. • • Mo Content of Stream Water.
- - - 0 Se to
I 0 O Csi
O t.• O
CD
-4
O 80r 01 o 01 1.0 01 O 80 rs.
F2 8
50 8.5
7.5 PH
,Spring • •
1 Dram
-oo
• •
8.0 • •
a. 0.
0
C C
0
7.0
to Spring 6.5
500 •
Seepage' • sediment.
- 0 , 0,
SCALE SCALE
0 200 400 ! 0 1000 2000
• • / • •' / +
100 • O
50
20
Mo
and Se
in S
edime
nt s
and
Ba
nk S
oils
4e +.,..
\ • • • • •
• / — — - - 4.• 2
Mo
an
d S
e i
n S
ed
ime
nts
and
B
ank Soi
ls (p
pm
)
ALLUVIUM DRIFT AND THIN ALLUVIUM Mixed alluvial and Banks mainly colluvial with some thin overlying alluvium. Levee banks. levee banks.
LIMESTONE DRIFT WITH THIN ALLUVIAL COVER IN PARTS.
4
3
1 • 5 0
10 • 0
20
4.\ • \
50
•
100
•
200 feet feet
0.5
500
200
0-5
2
0
• •
Approx.position,of bedrock boundary.—Z.3
Clare Shale
0
20 a.
10
5
-o -o a-
..... . ..... .+
Confluence with ! South Ck.
fD
7.7
pH
Mo •
Se
O C.1 O
•
O c•i .4
U) O
50 -
20
10
5
2
1 -
o
• 0-
\r\ Spring
Direction of Flow.
• • Mo Content of Stream Sediment (-80 mesh fraction)
Limestone
10
5
2
DRIFT-MIXED CL.SH.and L'ST.
Colluvial banks.
o
In
•+-
FIG. No. 54. DISTRIBUTION OF Mo AND Sc IN STREAM WATERS, SEDIMENTS AND BANK SOILS OF FLYNN'S CREEK

271
The relatively high concentrations of Se compared to
Mo in the stream waters compared to the relative concentrations
of Mo and Se in rocks points to the greater mobility of Se in
this environment (Mo:Se in Clare Shales = 9:1. Mo:Se in Flynn's
Creek waters draining the Flynn's Farm grid = 2.5:1). The
presence of excess concentrations of Se in stream waters conflicts
with the selective precipitation of Se in alluvium (Chapter VII)
for example at toxic soil site B, and in organic sediments des-
cribed in the following section. However, it is most likely
that any Se precipitated in this manner is in insignificant
quantities compared with the total amount discharged in stream
waters. Also, present-day conditions of artifically improved AID
drainage prohibit the deposition of major marly-organic alluvial
deposits.
(iv) Molybdenum and Selenium in the Waters of South Creek
-'The_metal contents of groundwater from the catchment
of South Creek were not determined at the time of collection of
the stream samples and so no direct comparison can be made with
the amount removed in stream water.
The eouroe of South Creek is at two springs which
rise through drift a short distance upslope from the peaty-swamp
area, through which the water flows in man-made drains (Figs. 19
and 55). The Mo content of the spring waters at the surface is
very low (0.3 and 0.6 ppb) but rises rapidly on passing into the

•
1 + • • Total Mo in Stream Water(ppb).
06 OM o o " Se
Scale 200 ! 0 1000 + -- pH of Of I•
feet
icz--Dratn.
co
7.7 I 74- V •
• 11
-- - 0-- ---- ------- --o-
8.0 2
1
0.5
pH 7.5
70
0 6.5 0.2
100
50
20
10
5
2
1
0.5
Scalc 0
feet
I T I I
ID F-) el
.,:t —_
•
..... o- - 0 ------ -- 4
ft-'-Spring
CO C.4 Cs.
-77
-- • + pH
-- -
Springs at head of stream.
• ..... ...
0.5
0•
Str
eam
Wat
er (
pp
b)
0
Mo
an
d S
e
Co
nte
nt •
t ibutary
o drain
C',
Sit
e N
o. 4
121
• •
-o -
20
10
0-0 Mo in Stream Sediment,-80 mesh fraction (ppm)
VI
OS
100
50 In
20
•
S.
+--- —+ .. Bank Soils
Se .. Stream Sediment
+............+ Bank Soils
10
Confluence with Flynn's Ck.
Direction of, flow ›i•
1
05
• 0
• -------
Clare Shale Limestone.
Approx. posit ion of bedrock boundary
CO
Mo •
50
20
10
5 8.5
IStream •
Drain.
•
.t?
I.
•
DRIFT
PEATY SWAMP DEPOSITS
CLARE SHALE,SOME L'ST. DRIFT LIMESTONE WITH MINOR CL.SH.DRIFT
i ALLUVIAL SWAMP
LIMESTONE DRIFT.THIN ALLUVIUM IN PLACES. Colluvial banks Swamp banks,man-made drain. Colluvial banks, natural stream course. Alluvial banks, overlies drift. Predominantly colluvial banks.
F1G.No.55. DISTRIBUTION OF Mo AND Se IN STREAM WATERS, SEDIMENTS AND BANK SOILS OF SOUTH CREEK. 1

272
peaty-swamp area, presumably by the addition of metal-rich ground-
waters from the swamp. The Se content of the spring water is much
higher than Mo (at 2.5 ppb Se) but there is no appreciable rise as
the stream waters enter the swamp (Fig. 55).
This would seem to indicate that Se is not being
leached from the peaty deposits as happens in the peaty-swamp
at the head of Flynn's Creek. No definite reason can be put forward
for this but it can be postulated that this may be due to the
different drainage status of the two swamps. Both deposits have
developed under roughly similar conditions with the formation of
peat deposits on old lacustrine beds. Accumulation of metal in the
soils of the swamps has taken place as the result of leaching from
the surrounding molybdeniferous and seleniferous drift. In the
case of Flynn's Farm howeveriland improvement by drainage has led
to a general lowering of the water-table with a subsequent release
of metal into the groundwater due to decomposition of organic
matter. Little improvement of the South Creek swamp drainage has
taken place and the field consists of rough pasture with a high
water-table. The different drainage status of the two deposits
is reflected in the Eh of the groundwaters, those from South Creek
(+0.120 - +0.180 volts) being substantially lower than those from
the Flynn's Farm deposits (+0.26 - 0.28 volts). The pH of South
Creek swamp groundwaters (6.3 - 6.5) is also lower than Flynn's
swamp (6.7 - 6.85). Reference to the stability fields of the
common Se ions (Figs. 41 and 42) show that at such a pH-Eh level

273
Se is more likely to be present as the more-or-less insoluble
elemental or selenite forms. If such a process has inhibited
the release of Se in solution from the South Creek swamp it is
not unreasonable that Mo, whose solubility is not subject to the
same Eh controls, should not be effected.
Downstream from the peaty-swamp the Se content remains
at a fairly constant level until the confluence with Flynn's Creek.
The highest level of 4.0 ppb occurs in that part of the stream
underlain by the Clare Shale and there is a slight fall in Se
after passing onto the limestone country. A spring entering the
stream at Site 4194 contains only a negligible quantity of Se
although the Mo content is about equal to that of the stream
waters.
The Mo content, which remains constant where the
stream passes over the peaty-swamp, Clare Shale and drift areas,
rises sharply where alluvium flanks the stream near the base of
the Clare Shakes (Fig. 19a). This is attributed to the entry of
waters from the drain in the alluvium near side 4153 which contains
high concentrations of Mo (43.5 ppb Mo) but only normal amounts
of Se (2.5 ppb). This relationship is also reflected in the metal
contents of the stream sediments in the drain (up to 300 ppm Mo
but less than 2 ppm Se, Figs. 19a, 20a and 20b). The Mo content
of South Creek then decreases gradually down to the confluence
with Flynn's Creek.

274
(c) Possible Relationship of Metal Concentrations in Stream Waters to Toxic Soils
The drainage train of both Mo and Se in the waters
of Flynn's Creek showed that under suitable environmental condi-
tions - in this case neutral and alkaline waters - anomalous
concentrations of metal could be detected at least three miles
downstream from the major source of metal in the toxic soils of
the catchment area. At this distance downstream the contrast
between anomalous and background values in the stream waters
is mach more apparent than that in the stream sediments, which
approach background levels. The extended length of the drainage
train is an advantage in that for geochemical reconnaissance, a
lesser sample density is required.
Although at times the analysis of stream waters has
been used in geochemical prospecting the difficulties of collecting
and storing large samples, often lengthy analytical methods and the
wide variations of the metal content of waters with changing condi-
tions (e.g. rainfall), has discouraged the use of such techniques.
Also, the metals most commonly used in the search for base metal
deposits (Cu, Zn, Pb), unlike Mo and Se, have limited mobilities
under most natural surface conditions. However, in the present
case, in addition to the long detectable drainage train in the
stream waters, there is the possibility of a relationship between
the soluble metal in stream waters and soil toxicity. It has
already been pointed out that with regard to Se, soil toxicity
is related to the presence of soluble, i.e. "available" Se in

275
the soil, rather than to the total metal content. It has also
been shown that the toxic soils are accompanied by relatively
high concentrations of Se in solution in groundwaters and that
much of this material passes into the stream waters in a similar
state. Non-toxic better drained seleniferous soils however,
contain only small concentrations in the groundwater.
The obvious assumption therefore, is that the presence
of anomalous concentrations of Se in solution in stream waters may
provide direct identification of the presence of toxic seleniferous
soils in the catchment. Anomalous concentrations of metal in the
insoluble fraction of the drainage is only an indication of toxic
soils when certain other environmental features promoting soil
toxicity are present, e.g. poor drainage and neutral to alkaline
soil reaction.
Although no detailed investigation has been made of
this possibility it can be pointed out that drains at the head of
the streams referred to in Fig. 18 as the Kilcolman School Area,
contain only 0.4 and 0.6 ppb Se in solution before they enter the
peaty-swamp area of toxic soils. The soils in the catchment area
of the drain are non-toxic but contain from 5-15 ppm Se. Simi-
larly, a sample of stream water from the non-toxic, but anomalous
alluvial soils flanking North-West Creek (Fig. 20) contained
<0.4 ppb Se which is a direct indication of the insoluble and
therefore non-toxic nature of the metal accumulated in the soil.
This is attributed to the acid nature of these deposits as pointed
out in Chapter VII.

276
Because of the greater range of conditions under which
Mo is available to plants it is obvious that the analysis of stream
waters for Mo is not necessary for detecting the possible presence
of toxic soils, as this function is adequately fulfilled by normal
sediment and soil analyses.
With regard to the reproducibility of stream water
analyses it is apparent from Table 51, which gives the metal
contents of waters from Flynn's Creek collected during different
field seasons, that although there is quite a wide divergence of
values they all fall within generally similar anomalous ranges.
Table 51: Comparison of Molybdenum and Selenium Contents of Flynn's Creek Stream Waters Collected During Two Field Seasons at Similar Sites
Samples from the 1965 season were collected on the one day.
Samples from the 1964 season were collected over several days.
1964 Season 1965 Season
Mo (ppb)
Se (ppb)
Mo (ppb)
Se (ppb)
18.o 3.o #6.5 2.6 4o.o 4.4 6.5 2.6 15.o 4.o 6.5 5.o 25.o 7.o 12.5 7.6 - 3.8 12.5 11.o
62.5 4.o 18.75 11.o 1.1 15.o 4.5 5.6 7.o 0.9 3.o 2.6 55.o 16.o 45.o 14.o
(Se analysed by similar acid decomposition techniques. 1965 Mo is by acid decomposition and 1964 Mo by "oxime" solvent extraction)

277
The evaluation of stream water analysis as a means
of detecting "available" Se in soils will, of course, require
much more detailed investigation. It is also obvious that stream
water environments (e.g. acid water) that inhibit the mobility of
Se would prohibit its use. Also, a wide range of seasonal climatic
conditions would make any interpretation difficult. The present
indications are that, in the alkaline environments and under
reasonably steady rainfall, there may be a definite correlation
between the Se content of stream water and toxic seleniferous
soils.
(d) Summary - Molybdenum and Selenium in Stream Waters
(i) The Mo and Se content of stream waters draining
the toxic soil areas of the Flynn's Creek catchment are consider-
ably higher than in streams from areas containing backgroud metal
concentrations in the soil.
(ii) Where the groundwaters enter the surface drainage
the change in conditions involves the loss of appreciable concent-
rations of Mo from solution. This is attributed to co-precipitation
with iron oxides caused by oxidation of ferrous iron to the insoluble
ferric state. Se, on the other hand, is not greatly affected by
the change from ground to surface conditions and concentrations
in the stream waters at the head of the drainage channels roughly
correspond to the amounts present in the groundwaters. Thus,
there is a general decrease in the relative abundance of Mo
proportional to Se as waters enter the surface drainage.

278
(iii) Downstream the gradual decrease in the Mo and
Se content of the stream water is attributed to dilution by barren
seepage waters. There is no evidence that a significant amount of
metal is lost by further precipitation from solution and there is
no correlation between metal and bicarbonate in solution.
(iv) In Flynn's Creek the detectable anomalous drainage
train extends for at least three miles, which is longer than that
shown by stream sediment material.
(v) There is some evidence that the presence of
soluble Se in the stream waters can be related to the presence
of toxic soils in the catchment area. One of the criteria of
toxic seleniferous soils is that some Se must be present in a
soluble form. The continuous leaching of well-drained soils
does not contribute anomalous concentrations to the drainage
whereas toxic swamp soils on weathering of Se-rich organic con-
stituents due to improved drainage, liberate high concentrations
into the drainage via the near-surface groundwaters.
4. DISTRIBUTION OF MOLYBDENUM AND SETANIUM IN STREAM SEDIMENTS
(a) Molybdenum and Selenium in Sediments from Background Areas
Reconnaissance stream sediment sampling (Chapter IV,
Table 7) established mean background levels for the -80 mesh
fraction of stream sediments (Table 52).
There is no detectable difference in the Mo content
of sediments from streams draining the O.R.S., limestone and

279
Namurian rocks, the background level falling below the limit of
detection, i.e. 2 ppm. Se levels in the Namurian areas are about
half those in streams draining the limestone. The mean background
level in either case is very low but a few samples range as high
as 2 ppm Se.
Table 52: Molybdenum and Selenium Content of Stream Sediments From Background Areas (Data refer to -80 mesh fraction)
Underlying Bedrock Mo (ppm)
Se (ppm)
Old Red Sandstone, Lower n 27 19 Limestone Shales and R <2 0.2-1.0 Basal Limestone M <2 0.54
Limestone n 39 ko R <2 0.2-2.0 M <2 0.64
Namurian Sandstones and n 62 40 Siltstones R <2-4 <0.2-1.2
M <2 0.3
n No. of samples R Wp Range of values M = Geometric mean
(b) Molybdenum and Selenium in Sediments from the Flynn's Farm Drainage
A general description of the Mo and Se content of the
-80 mesh fraction of sediments from streams draining the anomalous
soils of the Flynn's Farm area was given in Chapter V (Figs. 19a
and 20a). The detailed study of the dispersion mechanisms involved

280
in the distribution of these metals in the drainage sediment was
undertaken using material from this area.
Salient features of the drainage trains in Flynn's
and South Creeks downstream from metal-rich soils are shown in
Figs. 54 and 55, the metal content of the sediments being plotted
in relation to the bedrock and principal overburden types flanking
the stream.
Peak Se values of 175 and 40 ppm in Flynn's Creek
and South Creek respectively, are present in the headwaters of
the streams where they flow through metal-rich peaty swamps.
The Se values decline steadily downstream where the streams flow
through drift material but are reinforced where seleniferous
alluvium flanks the stream. Sediments from Flynn's Creek contain
marginally anomalous concentrations of 1.5 ppm Se up to five miles
downstream from the metal-rich soil areas. At this point, the
stream joins a major river.
High Mo values in the headwaters of Flynn's Creek
(up to 100 ppm) occur where the stream passes through both
peaty-swamp and Clare Shale drift areas. Downstream from the
Clare Shale limestone boundary the values depreciate, the maximum
length of the drainage train at the marginally anomalous 2 ppm
level being about three miles but definitely anomalous levels of
5 ppm or greater only extend about 7000 ft downstream. In South
Creek the highest values (50-70 ppm) are found along the section
of the stream that is flanked by Clare Shale drift and outcrop.
The levels in the peaty-swamp area near the headwaters are

281
substantially lower (15-30 ppm Mo). Downstream, levels of about
50 ppm are maintained where the stream is flanked by molybdeniferous
alluvium but drop-off rapidly where the stream passes onto limestone
drift with predominantly colluvial banks.
Mo and Se patterns in the other anomalous streams of
the area are substantially similar to Flynn's and South Creeks.
The highest overall metal values occurring in stream
sediments (up to 800 ppm Mo and 225 ppm Se) are associated with
seepage zones from the metal-rich peaty-swamps overlying the Clare
Shales. Sediments at these points are commonly rich in organic
matter and iron oxide precipitates.
(c) Factors Influencing the Metal Content of Stream Sediments
(i) Mechanical Composition
The mechanical composition of the stream sediments
varies with the stream environment and is also dependent on the
proportion of certain major constituents present. In general,
coarser sediments are characteristic of the more swiftly running
parts of the stream whereas in quiet waters fine material, often
rich in organic matter or iron precipitates, is common. It was
also apparent that where material was being precipitated in the
stream, in particular CaCO3 and possibly Fe oxides, coarse
aggregates of sediment and organic matter formed. Organic-
rich samples on drying also formed aggregates which proved
difficult to disperse during size analysis.

282
Size analysis of selected samples (Fig. 56) indicated
the sandy nature of the sediments, the silt and clay fraction
comprising only from 10 to 18 per cent of most samples. The soils
contain a greater proportion of fine material (Figs. 33, 35, 38)
and it is clear that a large amount of fine material is removed
in suspension by the stream waters in addition to the aggregation
of particles by precipitates and organic matter.
There is a definite tendency for the highest
concentrations of Mo and Se to occur in the silt and clay fraction.
However, there is an even closer association of metal content with
the amount of iron and organic carbon indicating that these con-
stituents, rather than the mechanical composition of the sediment,
control the distribution of Mo and Se between fractions. Rela-
tively high concentrations of Mo.and Se may occur in the coarse
fractions (ref. Fig. 56a and b, samples 2302, 2218 and 2779)
and in these cases the rise in metal content is usually accompanied
by a rise in the iron and organic carbon content.
The distribution of ten other elements in the size
fractions of three samples was also determined (Table 53).
Very briefly, the patterns of most elements are similar to
those of Mo and Se in having a tendency to follow iron and
organic carbon with the highest concentrations occurring in
the silt and clay fraction.
(ii) Physio-Chemical Associations •
Certain major constituents of the secondary
environment in the area, in particular Fe oxides and organic C

8.87, Org.0
I f
8 160 40
6 -30 120
20 80 -4
-2 40 Aci
d So
l.Fe
an
d O
rg.0
(%
)
10
Mo
(ppm
) a
nd
Total
Fe
0
0 -0
cidSol.Fe
III MO
/ Total ," Fel Os s's
' i/
/* \
E F G
?Se 50-
40.
30
20
10.
0 4
S.
A
Sample 2427, Se-rich. Organic stream sediment, Flynn's Creek.
30
Mol
y bde
nurn
(pp
m)
20
Se (p
pm).
Org
.0 a
nd
Fe (
V.)
-10
0
(%)S
NO
113
1/21d
3
21S
('
h) SN
0 1.1.3
V84
3
ZI S
Sele
niu
m (p
pm
)
6
-4
2
0
Most\
Total Fe203
A B C 0 E F G
2mm 20mesh
38 "
82 "
125 "
197 "
Silt and
—20 mesh. — 38
— 82 -- 125 — 197 - 0.02
Clay.
mesh. " " "
mm.)
Coarse sand.
t Fine i sand.
I
9Se
, , ,
;/
i Imo , Total
Fe203 i ,,
1 I r *Org.0
50-
40-
30-
20-
10-
0
•
/ Acid.So Fe
r—j A B C 0 E F
Sample 23 0 2 , Mo-rich, Mineral stream sediment.
FIG. No. 56 (a) SIZE ANALYSIS OF STREAM SEDIMENTS.
AND DISTRIBUTION OF METAL BETWEEN FRACTIONS.

44; P Se
Sele
n iu
m(p
pm)
1
0
3
Mo <2ppm
2
40
30
Mo <2 ppm
20 ,oSe
10-
0
Size fractions A to G as in Fig, 56 A.
ABC D E F G. A B C 0 E F G Sample 2218, Organic rich, Sample 2221, Mineral, cal- calcareous, B/G sediment. careous B/G sediment.
u. as 46'
0 X
Org
. 0 a
nd A
cad
Sol F
e W
O
frOrg.C. / \ : /
* -I \ ,..f 6 i .„....„4,,,, •Mo
--
V ; , \ ,
. , 4 \ , ,
-3
-2
-1
60
*50
-40
-30
•20
-10
-0
Org,C 40
A and B Mo <2 ppm. 30
/ 2C \ • Ac .SoiFe
Mo 3Y
d4
3ZI
S
ABCOEFG Sample 2779 , Flynn's Creek. Organic and mineral sediment.
A BCDEF G Sample 2875, South Creek. Calcareous,mineral sediment.
FIG.No. 56 (b) SIZE ANALYSIS OF STREAM SEDIMENTS
AND DISTRIBUTION OF METAL BETWEEN FRACTIONS.

Table 53: Distribution of Metal Between Size Fractions of Stream Sediments
Sample Type Element* A B
Size Fractions** C D F G
Se-rich, organic stream Mo 8.5 9.5 11.0 17.0 15.5 8.5 17.0 sediment, Flynn's Creek Se 7.3 34.o 58.0 68.0 58.0 50.0 102.0 (Sample No. 2427) Pb 7 10 10 20 20 7 4o
Ga 3 3 4 4 5 4 7 V 70 70 80 100 100 70 150 Cu 10 30 50 8o 8o 7o 100 Zn <50 <50 <50 <50 <50 <50 50 Ti 800 1000 2000 3000 3000 3000 3000 Ni 20 30 60 70 70 60 8o co 5 5 10 20 20 15 20 Mn 200 200 200 300 300 300 300 Cr 40 40 50 60 60 60 100
Fe203 2 4 8 16 20 8 13
Mo-rich, mineral Mo 20 15 7 10 4 6 20 sediment. Crook Se - 1.2 0.8 0.5 0.5 1.0 5.8 Creek. Pb 5 7 5 7 7 7 20 (Sample No. 2302) Ga <2 <2 <2 2 2 3 5
v 70 70 6o 6o 5o 6o 60 Cu 40 70 60 6o 6o 6o 200 Zn <50 <50 :50 <50 <50 <50 <50 Ti 400 700 500 500 600 1500 3000 Ni 70 6o 30 60 70 70 200 Co 15 15 10 15 15 15 80 Mn 400 200 150 150 150 200 300 Cr 40 40 30 30 30 70 70
Fe203 2.0 1.0 1.0 1.3 1.3 1.0 4.0

Table 53 (continued)
Sample Type Element* A Size Fractions**
Calcareous mineral Mo <2 <2 3.0 7.4 9.6 5.0 12.5 sediment, South Se 0.3 0.6 1.2 1.7 2.2 2.3 7.5 Creek. Pb 6 8 10 7 10 7 50 (Sample No. 2875) Ga <2 <2 2 <2 <2 2 7
v 7o 70 6o 6o 6o 3o 6o Cu 3 15 7 7 10 20 70 Zn <50 <50 <50 50 <50 <50 50 Ti 100 200 300 200 700 8o0 3000 Ni 5 lo 30 20 50 50 150 Co 5 lo 15 lo 3o 4o 70 Mn 400 400 400 400 600 500 1500 Cr 10 10 10 15 15 30 60
Fe2o3
0.8 0.8 1.3 1.3 2 3 8
* Metal contents in ppm except Fe203 which is in % **Fractions A-G as for Fig. 56a.

285
have been shown to be closely associated with the dispersion of
Mo and Se in soils (Chapter VII). These constituents can also
be correlated with the distribution of Mo and Se in size fractions
of stream sediments (Fig. 56a). In the streams draining the Flynn's
Farm area, organic C and Fe oxides possess generally similar
dispersion patterns to Mo and Se downstream from the metal-rich
headwaters. This is illustrated by the distribution of metal
in South Creek (Fig. 57) and a similar pattern is present in
Flynn's Creek.
CaCO3
precipitates also contribute a major proportion
of the active sediments in certain parts of the streams and, in
view of the association of Se with calcareous alluvium, may also
influence the mode of occurrence of metal in the drainage. The
association of these constituents with the distribution of Mo
and Se in sediments is therefore examined in some detail.
Iron Oxides and Organic Carbon
The correlation between the Fe oxides and organic C
patterns in the drainage sediments can be best explained by (i)
erosion of topsoils and peaty-swamp material from the headwaters
of the streams in which the two constituents are intimately
associated, and (ii) the possible effect of organic particles
on freshly precipitated Fe oxides at seepage points whereby the
carbonaceous particles may form nuclei about which colloidal
precipitates possibly collect. In the drainage environment the

O C
c ue we. ;/"4" e e 4 •
2
1-
0.5
,09440 ,W 4 / .00,7,0r es 910 e
m tD CO a)
N
a)
N
N a) N
a) tD co %Ns
an co N
100
-50
20
10
-0.5
1W;e1-11w17-140rnie7 C/4 Pe 4/7,),/,4 a...v.0' prise.
Direction of flow --a. 100
• Samples collected 1964 field season. 50
—80 mesh fraction.
Scale 880 ft. to 1 inch. 20
10
• • Ma
5
Mo
an
d S
e(p p
rn).
Aci
d S
ol.
Fa a
nd
Org
an
ic C
(•/
.)
FIG. 57. DISTRIBUTION OF ORGANIC CARBON AND ACID SOLUBLE IRON WITH
REFERENCE TO THE Mo AND Se CONTENT OF STREAM SEDIMENT, SOUTH CK.
-2
e/rpe .fi:;e71 /4.2 es 96,e. Sot. Fe
,L,..?" 0.2-

286
fine nature of both constituents should ensure generally similar
mobilities during mechanical dispersion by stream waters.
The close relationship of both Mo and Se in sediment
to the Fe oxide and organic C contents is shown in Figs. 57, 58,
59 and 60. This relationship is also evident in the different
size fractions of stream sediment (Fig. 56).
The covariance between these constituents in indi-
vidual samples is most evident when considering samples from one
stream of limited length, thereby minimizing the effects of other
environmental changes.
The correlation between Se and organic C (Fig. 59b)
is most marked for the South Creek samples but is also evident
in the samples from the other streams. The correlation between
Mo and organic C in sediments is poor, only in the South Creek
samples is there a distinct trend for high Mo contents to be
associated with high carbon (Fig. 59a). This may in part be due
to the lower precision of the Mo analytical method.
The relationship between Se and acid-soluble iron in
stream sediments (Fig. 58b) is less marked than that with carbon
but for Mo the relationship with Fe is quite evident in all three
streams sampled (Fig. 58a). Empirically, these data indicate
that Mo is more closely related to the acid-soluble iron content
of stream sediments and Se can be more closely correlated with the
amount of organic carbon present.
In the headwaters of the streams the high concentra-
tions of iron and organic carbon (Fig. 57) have a common origin

200
100
50
20
10
5
2
0.5
0.2 al
0
• 0
+
0 •
+
•
•
•
• 44
*
• * +
• • + •
South Ck. samples (ref.Fig.57.) Crook Ck .. ( re f.N.60.) Flynn's Ck. "
a.
E 2 C
6" in
200
100
50 -
20 -
10
5
2
1
0.5
0.2 01
6 •
•+
0 •
•
+
• + •
0
•
++
•
•
•
• •
02 05 1 2 5 10 20 30 0-2 OS 1 2 5 10 20 30 Acid soluble Fe V. Acid soluble Fe T.
(a.) (b.)
FIG.No. 58. RELATIONSHIP OF Mo AND Se TO ACID SOLUBLE Fe IN STREAM SEDIMENTS.
( - 80 mesh fraction only)
Mo l
ybde
num

• •
• 0 •0
rr
• 200
100
50
2
1
0.5
•
• 20
10
5
Mol
ybd
enu
m p
pm.
• •
• •
• 4.
200
100
50
1
0-5 Se
len
ium
pp
m.
20
10
5
• South Cie. samples.(ref.Frg.57.) *Crook Ck. -trib.ot South Ck.(retFig.60.) + Flynn's Ck.
0
• •
• • • 16
0 • + •
Re f.Fig.60.Sampte
it7collected from drain upstream from entry point of groundwater.
0
01 i . 0.2 01 0-2 0.5 1 2 5 10 20 30 01 02 05 1 2 5 10 20 30
Organic Carbon /. Organic Carbon'/. (a.) (b.)
FIG. No. 59. RELATIONSHIP OF Mo AND Se TO ORGANIC CARBON IN STREAM SEDIMENT.
(- 80 mesh fraction only.)

Scale 100 ft. to 1 in. (approx)
x
- • ........
Direction of flow.
Se
(pp
m),
Aci
d s
ol.F
e,O
rga
ntc
C(
/.
2
1
0.5
50
20
10
5
-500
200
•100
• 50
oill s
/ %. .0 ....
" ......• N. . \ . ... ..•
. • •
Point of entryof seepage water into drain.
0.2
01
3 20
10
5
2
1 • • Mo content of Stream Sediment • . • Mo Content of Bank Soil.
Se Organic C + Organic C
X x Acid Sol.Fe z••....... ..-x Acid Sot.Fe. • (minus 80 mesh fraction)
FIG. No. 60. METAL DISTRIBUTION IN STREAM SEDIMENTS AND BANK SOILS OF CROOK CK.

2,6,4
30,12,>3 3,4-5,5 4,4,2
Bank Section B. Fig.62.
512,735 4,4,3
5,81,1-6 3,5,2
2,3,1
4,4,4
it
3,3-5,4
20,14,5
6,4.5,4 4e-- —a. SCALE SCALE
10,9-5,2 0 ip 20 50 100
0 Auger hole ()Spring or seepage. 2YSediment sample site.
25,4,3.5 Mo.Se(ppm)and Fe203 WO Content (-80 mesh fraction)
eaty gley• (Metal content at auger-holes is the mean content of the upper.weathered
Section of the profile.) 16,12,2
METAL CONTENT OF STREAM SEDIMENT
RECENT DRAINAGE CHANNELS AT THE HEAD OF NORTH CK.
(Metal content of waters,refer Fig.N0-52. ) 14,90,8
Fl G. No. 61. 13,20,3

287
with Mo and Se in the metal-rich peaty-swamps at the head of
Flynn's and South Creek. In addition to erosion of highly
organic peat soils to form organic sediments, appreciable con-
centrations of iron oxides are precipitated at springs and
seepages in the swamps and the adjacent Clare Shale overburden.
The peak Mo and Se values which are coincident with the high
Fe and C contents decrease downstream in an identical pattern
to Fe and C where the streams pass onto the limestone and
limestone drift areas.
Calcium Carbonate
Variations in the dispersion pattern of Mo and Se
in the streams could also be related to the precence of CaCO3
which occurs as concretions on rocks and vegetation or as calca-
reous ooze. CaCO3 precipitation commences in the streams approxi-
mately where they cross from the Clare Shale areas onto the lime-
stone at a stream water pH of 7.5-7.8. Downstream from this
point, the calcareous deposits may constitute a considerable
proportion of the sediment. Precipitation is particularly active
on the exposed surfaces of the stream bottom, vegetation and
rocks where the accumulations may reach half-inch in thickness.
Samples of CaCO3
concretions sampled from Flynn's
and South Creeks showed that the concretions contained signifi-
cantly less Mo than normal sediments from the same site whereas
the Se content remained relatively constant (Sites 1-4, Table 54).

288
Table 54: Comparison of Molybdenum and Selenium Content of Normal Stream Sediment and CaCO
3 Concre-
tions
Sample No. Material Site Mo Se ,Mo/Se
4145 Sediment 1 50 8 6.25 4148 CaCO
3 13 7 1.9
4149 Sediment 2 50 6 8.3 4152 CaCO
3 5 4.5 1.1
4182 Sediment 3 6 2 3.0 4185 CaCO
3 3 4.5 0.66
4207 Sediment 4 16 12 1.3 4238 CaCO
3 3 14 0.2
(iii) Mode of Occurrence of Molybdenum and Selenium in Stream Sediments
Studies of the metal content of ground and stream
waters showed that considerable concentrations of Mo and Se enter
the surface drainage in solution in the headwaters of the streams.
On entering the surface environment, however, there is a substan-
tial drop in the Mo content whereas Se remains at generally
similar levels. Because of the prevalence of freshly precipitated
iron-oxides at spring and seepage points the loss of Mo from
solution was attributed to co-precipitation with the iron.
However, at seepage points in the swamps organic-rich sediments
also contain high concentrations of both Mo and Se. Data from
stream waters in the head of North Creek indicate that over a
short distance in a mainly ferruginous, non-organic drainage
environment no further loss of either element occurs from stream

289
water.
The correlations established between Mo, Se and
the iron oxide and organic C contents of sediments poses the
problem of which of the latter two components is the principal
factor in the dispersion of Mo and Se. Given that the principal
source of Mo and Se is the erosion of bank and seepage soils in
the stream headwaters as shown in Figs. 54 and 55, the Mo and Se
patterns downstream will be largely determined by the process
of dispersion of the major components with which they are asso-
ciated and by dilution by barren bank material. Also, despite
the evidence to the contrary described earlier, the possibilities
of precipitation or adsorption of either Mo or Se from solution
cannot be completely ignored.
The relative influences of Fe and C in the sediments
could only be satisfactorily investigated where a natural sepa-
ration of the two components occurred. This condition was
satisfied by sampling CaCO3
concretions and normal sediments
from the same sites and also active sediments from different
horizons in the stream bed as shown in Table 55. These data
show that there is a postive correlation between the Se and
organic C content of the sediment and between Mo and Fe oxides.
The association of Se with calcareous sediments (and also marly
alluvial and swamp deposits) can also be attributed to the organic
C content of the material.

Table 55: Molybdenum and Selenium Content of Stream Sediments in Relation to the Organic Carbon and Iron Oxide Content of the Sample
Sample site Sample Type and Location Mo FeoO3
(ppm) (6) Se Organic
(ppm) Carbon (%)
4145 Mixed mineral sediment - South Creek 50 5 8 2.3 4148 CaCO
3 concretions 13 2 7 2.4
4149 2 Mixed mineral sediment - South Creek 50 6 6 3.1 4152 11 II CaCO
3 concretions 5 3 4.5 2.5
4182 3 Mixed mineral sediment - South Creek 6 1.6 2 1.5 4185 11 Pt CaCO
3 concretions 3 o.8 4.5 2.1
4207 4 Mixed mineral sediment - Flynn's Creek 16 2.0 12 1.8 4238 CaCO
3 concretions 3 o.8 14 2.0
5 Calcareous sediments collected at 0-2 and 2-4 ins from bed of stream (ref. diagram A, Fig. 62)
3886 3887
0-2 ins north side of stream bed 2-4 ins II tt It
2 2
0.8 o.8
5.5 10
1.04 1.82
3888 0-2 ins south side of stream bed 3 1.3 12 1.98 3889 PI It tt 2-4 ins 2 0.8 24 2.96
2890 6 Fine suspension collected from water plants near site 5 above
<2 1.0 13 2.0
7 Ref. D, Fig. 62. Samples collected from surface, sub-surface of the stream bed.
3955 0-fins High in precipitated CaCaz <2 1.3 2 3.0Q 3956 1-2 ins Mainly mineral sand and silt <2 1.3 1 0.246

291
For example, comparison of the metal content of the
four samples of CaCO3
concretions and active sediment from the
same site (sites 1-4, Table 55) shows basic differences in the
distribution of the major components, Fe203
and organic carbon
which are reflected in the Mo and Se patterns. The lower Fe203
content of the calcareous concretions compared with sediment can
be correlated with the distribution of Mo. Organic carbon on the
other hand, is present in relatively equal amounts in both media,
and this distribution pattern is followed by Se.
A similar relationship is established at sites 5 and
7. In the ease of site 5, the sediments at 2-4 ins from the
surface of the stream bed (shown in Fig. 62a) are enriched in
organic matter compared with the more freely washed surface
material. This has resulted in relative enrichment of the lower
horizon in Se. A moderate rise in the iron oxide content of the
surface sample 3888 is reflected in the Mo content. At site 7,
the reverse occurs and the Se-rich surface horizon of the sediment
contains a much higher concentration of organic carbon than the
lower horizon which consists predominantly of mineral matter.
The higher concentration of organic carbon in the surface horizon
is associated with an abundance of precipitated CaCO3.
The association of Se with fine suspended organic
matter in the streams and the apparent deficiency of Mo in organic
sediments is also well shown in sample 2890 (Table 55). This
sample consists of a fine brown deposit containing 2 per cent
organic carbon collected from the leaves of water plants in Flynn's
Creek, near toxic soil site B.

292
The common association of organic matter with cal-
careous deposits in the streams, which is not shown by the iron
oxide component of stream sediments, is tentatively attributed
to the participation of carbonaceous particles in CaCO3
preci-
pitation during formation of the concretions. Although the
process is not fully understood it is believed that precipi-
tation of CaCO3 from solution in stream waters may be initiated
on reactive particles of organic matter. This may explain the
preferential inclusion of organic matter in the precipitates
rather than other components of the sediments. This is reflected
by the lower Fe203
and hence Mo content of CaCO3
concretions
compared with normal sediments. It is also commonly observed
that calcareous concretions form on the stems of water plants
growing in the stream channels. The initiation of precipitation
by organic dust contaminants from saturated solution for example,
is a commonly observed laboratory phenomena, the exact reasons
for which are still somewhat obscure.
Although metal patterns in Flynn's and South Creeks
illustrated in Figs. 54, 55 and 57 indicate that the principal
source of Mo and Se, as well as Fe and C, is by erosion of the
Clare Shale and swamp soils in the headwaters, the divergence
of Mo-iron oxides and Se-organic carbon patterns downstream
point to changes in the dispersion patterns during transportation
of material in the surface drainage.
Precipitation of Mo at seepage points was proved by
comparison of ground and stream water metal contents in the head-

293
waters of North and Flynn's Creek. This corresponds to data from
Jones (1956 and 1957) who shows that molybdates may be co-precipitated
with iron oxides and also sorbed on precipitated iron oxides. Tooms
et al (1965), during work in Sierra Leone, also report data on the
precipitation of Mo from groundwater with iron oxides where they
enter the surface drainage. Iron precipitates are common at seepage
points in the Flynn's Farm drainage, particularly in swamp and
Clare Shale areas, but following initial precipitation no further
precipitation is apparent downstream in the surface waters. The
association of Mo with Fe in sediments downstream therefore indi-
cates that dispersion of Mo in the surface drainage is dominantly
mechanical by erosion of metal-rich soils and seepages from the
headwaters. The gradual fall-off in Mo levels in sediments and
stream waters (Fig. 54) is attributed to dilution from barren
groundwater and bank soils entering the drainage.
The close association of Se with the organic carbon
content, can be attributed to the sorption of Se on organic
matter (Table 55). Similar processes of absorption have already
been described for the accumulation of Se in the organic horizons
of some soils, particularly poorly-drained types, including those
of swamp and alluvial origin. The developgtent of Se-rich organic-
marl horizons in alluvial soils is believed to represent, on a
large scale, similar processes to those taking place in present-
day calcareous stream deposits.

294
The relatively high Se levels associated with organic
C in calcareous sediments in the present-day drainage (up to 24 ppm)
and in alluvial marls (up to 55 ppm) raises the question of the
origin of the Se. The principal alternatives involved are (a)
that the Se-rich organic matter is mechanically transported from
the seleniferous peat-swamp deposits in the headwaters of the
streams, or (b) is due to adsorption of Se from seleniferous
stream waters on relatively barren organic C included in normal
stream sediments and CaCO3
deposits. A third possibility that
seleniferous organic matter is concretions is the result of the
decay of Se-rich water vegetation growing in metal-rich sediments
and waters is discounted because of the relative deficiency of Mo
in the organic matter. Data from herbage studies indicate that
Mo is just as readily accumulated by plants as Se.
In addition to the processes that have given rise to
high concentrations of Se in organic carbon, it is also apparent
that the coincidence of high Se with calcareous precipitates could
possibly indicate selective co-precipitation of Se with CaCO3. It
has been pointed out that Se in the stream waters is probably
present as the soluble-selenate which is stable in the alkaline,
oxidizing environments of streams on the limestone. CaSe04 is
known to exist in calcareous arid soils (Rosenfeld and Beath,
1964) but as it is also considered to be highly soluble, co-
precipitation mechanisms can be discounted.
Returning to the association of seleniferous organic
carbon with calcareous sediments, it is not possible to state

295
definitely if Se is adsorbed by organic matter from the stream
waters or whether the erosion of Se-rich organic soils in the
headwaters is the principal source of supply. Direct evidence
from the gradual decrease downstream from the headwaters shown
by the Se content of Flynn's and South Creeks water (in which
Se-rich CaCO3 precipitates are common) is not indicative of
precipitation because it may well be solely due to dilution
by barren waters added to the flow from the limestone areas.
On the other hand, the high concentration of Se (up to 24 ppm
in calcareous sediments and up to 55 ppm in organic alluvial
marls which contain less than 3 per cent organic C) compared
with much lower Se contents of equally organic topsoils which
flank a much greater length of the stream courses, points to
some process of enrichment of organic matter by Se in the stream.
However, regardless of inconclusive data on the actual
origin of the Se, it iu apparent that the direct association of
CaCO3 and Se-rich organic matter largely controls Se dispersion
in stream sediments on the limestone.
(iv) The Distribution of Molybdenum and Selenium in Bank Soils
In addition to the entry of metal into the surface
drainage in solution and by precipitation at seepage points, the
mechanical erosion of bank soils, seepage zones and sheet wash
of topsoils contribute insoluble weathering products to the
streams. The close relationship between the total Mo and Se

296
content of bank soils and the stream sediments illustrated for
Flynn's and South Creeks in Figs. 54 and 55, respectively, points
to the dominant influence of mechanical processes on metal dis-
persion in the sediments.
Therefore, it is necessary to describe in some detail
the patterns developed in the transition zone between soils and
the bank material which is liable to be eroded to form the stream
sediment. Aside from the direct influence of bank material on
the distribution of metals in sediments, investigation of dis-
persion in the banks is also aimed at establishing relationships
between the agriculturally important topsoil horizons and drainage
sediments, as distinct from the overall metal content of overburden.
Possible modifications to the soil-sediment relationship by
dredging of the stream channels and the construction of "levee"
banks are also discussed.
Typical cross-sections of stream channels in the area
are shown in Fig. 62, diagrams A-E. Diagrams B and E represent
bank sections in drift and peaty-swamp soils from the metal-rich
headwaters of North Creek and Kilcolman School areas, respectively.
The Kilcolman School area was selected in preference to Flynn's
Farm because of the more natural state of the banks. The banks
of Flynn's Creek where it flows through the peaty-swamp in the
headwaters are poorly defined.
Colluvial Drift Banks
The section illustrated in diagram B, Fig. 62,
is of a drain in mixed limestone and Clare Shale boulder-clay at

A SCALE 4 ft to 1 in.
N <---
2:11
10:45 6:32
B.F. 74 C... CO
- o,op
B
cn Nc
CSI .4 ln 0) CO
N.4
N-7 .. €% ,s; i.-3,,' in _ cv V
N -we-
10 : 6 :1.5
Fe-rich seepage
BP 92.-1ft.
t
Scale. 2 ft to 1 in.
= Mo, Se (ppm) and Fe203 WO content.
6:16 c i; >,. >. 0 a -6 ,:, i u C# -
CL U ti.
5:24 6:16 8:18 i
›, 7: 5, 0 0 x 7,
/, „ ..,
BP. 74.
/ .----.--------\--‘...
Levee Bank. / 5:9-5
Alluvium
' -1_
5:24
--- /
3:75
zone.
- 10:6:4 10:10:8
8:5:6
St rsed. 13:7:20 2:3-5:2 i 1 ....
Gleyed drift soil. Fe precipitates at surface.
1 Drift gravel. 1
-,,--N/1
,
73:32 - : ck, .7-1 3:12
2:24
soil site B.
Mud fiat.
topsoil.
SECTION-FLYNN'S
usually rich in Fe precipitates. 9?
• • 2:5-5 r-7. ,
,,,,,):4:,.. ...\ 2:10
CK. Near toxic
77-27,/, Humic-gley A 1.• , n) C ca - c:.) in
a
ta 0 1...) 3:45:5
lali CROSS-SECTION
-j - ... • • &, r. ,-:, 1.4 0) "1.• 1,0
i;) .'t S' — ,,,:, co Z.71 o zz 0, OF DRAIN IN DRIFT
'emaxaews% Seepage muds,
.:::,: '. :...':. ...:. Stream sediment.
BANK and STREAM 30 ft. from the head of North Ck.(Ref.Fig.No.61.)
Flanking soils are Seleniterous alluvium. (refer section Figs. 36,37.)
N
C Levee sediment excavated
< 2 : 35
of organicgley soils and muddy
from stream. 68:15
6.4 :- 6.4:20 BP72
See age zone.
7-5:35
Alluvium with stone wall facing.
_ Str.seds. - _ _ _
- _ -
— ....,•........••••...•.•.••
D Approx. scale. 8 ft. to 1 inch. N -->
BP.71. / \ ' \ " \ / 5: 205.
,,,,. , • , /‘ / t. , / t / 2:5
'"♦\ / " \ \ / /17:30 \--/ \./ \ --- ‘ / _, _Z__ 2`_ - - - - - - -
_ _--- __ 6.4:25 - - -
_ -
clays. -
— —
< 2:1-5
FLANKING FLYNN'S
/ 1 <2:15 s... „ Ni/ <2:22 -_-_,„;-__
V <2:20 /
4:4
below
CREEK.Nepr
11 '9 - ----Alluvium Fe - --_ precipitates at --surface. : c'. 0 Limestone boulder- 0 ,, clay. 0
AFTER DREDGING.
-_ -_- - 20:9 - - — 20-3-3 11-5:2.
_ __ . -
0 6 <2:1.3 <2:07 c,
e 0 <2:25 <2:09 -r -1 o
0 • .-t- . .- .-7-tr-:.•.-..7-
i\ _ _ - - -
-
CROSS-SECTION
5.5:90 / N.- / \. / \ / \ -' \ / \ - _ _ _ _ _ _ _ _ ____ _- - _ __ - _ _ 7-4:40 - _ - - - Marly alluvial - - _
- - - - - Scale 4 ft to I inch.
OF LEVEE
X xXX X,.
- — _
Alluvium
2:12 3:20 --- - Seepage muds.
sampled water level.
toxic soil B.
St r. se d.saples - T 0-1 ins. <2:2.0 <2:20 <2:26 1-2 .. <210.8 <2:1-0 <2:1-0
CROSS-SECTION OF FLYNN'S CK. Metal content of stream sediment before dredging
Mo 4 ppm. Se 3 ppm.
E Bank
---›N
20:48
BP84
/ /
c, o8 ,:,,,,- it -
Scale 2 ft to 1
6040 '
50:30
40:35
SCHOOL CREEK
inch.
130:56 300:100
100:90
%., ' O,
bank
Mo:Se Content 5:40 Channel
, samples.Approx-1 inch deep.
fraction)
-SECTIONS
FIG.No. 62.
soils, black peaty gleys. (minus 80-mesh
STREAM BANK CROSS ,4 SHOWING
Mo and Se DISTRIBUTION
0 N 0 0 N.,
!'3 '• '!
$`'..4,1';.. 2.
it'4- , ,..i t,i ol
soils.
\ / 60:56
30:18 i iii
8 f3
CROSS
Strseds.organic-rich silts. \
-SECTIONS OF KILCOLMAN -Peaty-swamp

297
the head of North Creek (ref. Fig. 61). The drain has been
excavated relatively recently iabout 1 to 2 years ago) and the
drift, except for some iron oxide precipitates in the outer
layers of the bank due to groundwater seepage, shows little
evidence of weathering.
A horizontal bore-hole in the bank (BP 92) shows
that Mo and Se have concentrated in the outer four inches of the
bank surface, compared to unexposed drift at the end of the hole.
The distribution of Mo and Se can be very closely correlated with
a similar accumulation of organic carbon. Iron oxides on the other
handl are highly concentrated in the surface zone of the bank (20
Fe203) but this has not affected the accumulation of
Mo or compared with the less Fe-rich adjacent sample. Se
It is considered that the close association of Mol Se
and organic C in the bank reflects the occurrence of metal sorbed
on organic matter. The influence of Fe-oxides on the distribution
of Mo in particular, although evident in many soil and sediment
studies, would seem in this case to be of relatively minor importance.
The means by which C and the associated metals have accumulated in
the outer bank layers is believed to be due, in view of the absence
of any visible herbage growth, to (a) seepage of waters carrying
organic matter with Mo and Se in suspension from the overlying
metal and organic-rich topsoils or (b) the growth of minute plants,
algae mosses etc., in the exposed drift banks with subsequent
adsorption of Mo and Se from seepage waters on organic products.
per cent either

298
It is not possible to distinguish between the relative importance
of these two mechanisms and it may be that they both contribute
to the concentration of metal in the banks. The important feature
however, is that the concentration of metal and organic C in the
bank soils which are available for erosion into the channels,
reflects in many aspects the patterns developed in the topsoils.
Thus the metal content of sediments derived from the erosion of
bank soils will tend towards the total metal content of the topsoil
in the adjacent pastures.
One anomalous feature of this pattern that conflicts
with evidence from the relative metal contents of ground and
stream waters in the North Creek catchment discussed earlier,
is the enrichment of Se along with Mo in the seepage zones of
the bank. Water studies did not indicate any appreciable loss
of Se in the transition from ground to surface conditions. It
can only be assumed that the loss of Se by adsorption in the
bank soils is negligible in comparison with the total amount in
seepage waters.
Peaty-Swamp Banks
Diagram E (Fig. 62) of peaty-swamp bank profiles does
not demonstrate any enrichment of Mo and Se in the outer layers
of the bank material. Variations in the metal content of the
lowermost bore-hole into the bank in each section is believed
to be due to variation of metal content in horizons of the soil
profile intersected by the slightly inclined bore-holes. The

299
uniform metal distribution in the horizontal bore-hole in the
upper part of the section is believed to represent more closely
the dispersion pattern in these banks. In the highly organic
and metal-rich environment of a peat-swamp, any addition of
metal adsorbed on organic matter in the outer layers of the
bank, as has been described for the drift soil bank (Fig. 62,
Diagram B), will not significantly affect the amounts of Mo and
Se present.
The sections illustrate the close relationship of
the Mo and Se content of the stream sediment to the amount of
metal in the outer layers of the bank. The slightly lower values
in the sediment is due to dilution by barren mineral matter in
the stream. Similarly, the generally lower values in the stream
sediment in diagram B is attributed to an excess of barren sand
fragments from the drift in the stream bed compared with the
organic-rich bank material.
Alluvial and "Levee" Banks
Typical bank sections of Flynn's Creek downstream
from the peaty-swamp headwaters are shown in diagrams A and C,
Fig. 62. At this point the stream flows through the alluvial
soils of toxic soil site B (Fig. 19) and parts of the stream
oourse are flanked by low levees formed of material dredged from
the stream during old drainage programmes. Dredging of this
type has affected a large proportion of the streams in the agri-
cultural limestone areas of Ireland. The effect of dredging on

300
the relationship between the metal content of the soil and the
adjacent stream sediments is therefore particularly pertinent to
the applicability of stream sediment reconnaissance to agricul-
tural problems.
The levees shown in cross-section in diagrams A and
C are formed of old stream sediment dredged from the stream bed,
with most probably some included bank and topsoil added during
general widening and straightening of the stream course. Soil-
forming processes have continued so that the surface layers of
the levee and bank bear many of the characteristics of normal
topsoil. There is extensive humus development and some preci-
pitation of iron oxides in the topsoil and seepage horizons similar
to patterns in the adjacent alluvial topsoils (Chapter VII). The
right-hand (southern) bank of the stream in diagram A, in which
the horizontal bore-hole BP 74 is situated, consists of a normal
section of the alluvial deposits without any levee structure. The
corresponding bank in diagram C is faced by a stone wall to prevent
erosion.
Erosion and the effects of periodic flooding have given
rise to characteristically muddy flats, adjacent to and just above
the present-day water level. These flats consist of mineral sedi-
ment, collapsed bank soils and levee material and are shown on the
north side of the stream in diagrams A and C. They contain appre-
ciable quantities of fine organic matter and also iron oxides
precipitated as the result of groundwater seepage.

301
Study of the distribution of Se in these sections
indicates that the Se content of the sediments (see also Fig. 54)
is of the same order as the amount of Se present in the upper
horizons of the flanking toxic alluvial soils (which mostly range
from 10 to 50 ppm Se). Similarly, the Se content of sediment
also closely corresponds to the Se content of the undisturbed
alluvial bank soils, the levee material and the muddy seepage
flat adjacent to the active stream sediments. From this it is
deduced that the processes by which Se is added to the active
sediment in the environment is largely mechanical, specifically,
by erosion of bank material often via the muddy seepage flats
shown in each diagram. The higher concentrations of metal in
topsoils and the muddy seepage area presumably reflect the
visibly more organic and iron-rich nature of this material
compared with the active sediments. Groundwater seepage through
the banks and levee material by waters containing from 1 to 5 ppb
Se (ref. Fig. 36) as well as flooding by stream waters which contain
from 5 to 10 ppb Se at this point most probably contributes to the
accumulation of Se in this environment. It is not known how much
of the Se present in the levee and surface horizons of the banks
has been added by adsorption or precipitation in the surface
layers. The overall metal content of the upper parts of the levee
and the natural alluvial banks (e.g. BP 74, diagram A) is of the
same order as the present-day active stream sediments but the
increased concentrations at the base of the northern bank in each
diagram, just above the muddy flat that is marked as a seepage

302
zone with iron precipitates and containing 75 and 40 ppm Se,
indicates that some accumulation from seepage waters takes place.
With regard to Mo in these sections (diagrams A and
C), it seems most likely that many of the features described for
the flanking alluvial deposits (Chapter VII) are duplicated in
the present-day bank and seepage environments. The Mo content
is much lower than the amount of Se present in the flanking allu-
viuM and this is reflected in the stream sediment contents. The
higher concentrations of Mo in the topsoils and seepage flats
can be correlated with the iron- and organic-rich nature of this
material compared with the stream sediments and normal alluvial
clays.
Effects of Dredging
In many of the streams that have been recently dredged,
the established stream sediment patterns have been substantially
altered by (a) the partial or complete removal of anomalous active
sediments, and (b) exposure of barren boulder clay underlying the
stream bed. A typical example or this is shown by the section
illustrated in Fig. 62 D, taken from Flynn's Creek, about 2 miles
downstream from the headwaters. This part of the stream had
been dredged within the past year. Much of the underlying boulder
clay is broken up and the fine fractions of the till matrix
constitute a large proportion of the sediment. Where a stream is
traversing an anomalous area of metal-rich residual soils, drift
or deep alluvium, this will not, of course, greatly affect the
metal patterns.

303
However, where much of the bank Material and the drift
or colluvium forming the base of the stream carries only background
metal values it is obvious that the length of an anomalous sediment
drainage train derived from metal-rich soils occurring further up-
stream will be greatly affected.
It is apparent that the Mo content of all six sediment
samples collected after dredging fall in the background range of
less than 2 ppm, which is much less than the pre-dredging anoma-
lous level of 4 ppm. However, the Se content of the surface layer
of sediment (2-2.6 ppm) closely approaches the pre-dredging level
of 3 ppm although the sub-surface sediment samples contain only
0.8-1.0 ppm Se. As shown previously (Table 55), the re-accumulation
of Se in the surface samples can be correlated with the presence of
organic CaCO3
concretions which have been deposited relatively
rapidly after dredging. Mol on the other hand, is not absorbed
by organic carbon and consequently has not attained pre-dredging
levels.
Therefore, it is in the presence of precipitating
CaCO3
containing organic matter that dredging will not affect
anomalous Se patterns except perhaps in the immediate period
prior to the re-development of CaCO3
precipitates. The re-
development of Mo patterns however, will be dependent on the
mechanical replacement of anomalous sediments by material from
upstream or by bank erosion.
It is time that at the site portrayed in diagram D
the Mo content of the stream sedifient, because of the greater

304
thickness of barren drift excavated, gives no indication of the
presence of moderately high Mo values in the upper alluvial
horizons. Such concentrations would be sufficient to give rise
to toxic levels in herbage (Chapter VIII). In this case, though,
the flanking alluvium extends only 10 to 20 feet in width from
the stream and represents the old swampy channel prior to any
man-made improvements.
With regard to the conduct of regional drainage
surveys in freshly dredged areas, supplementary sampling of
old sediments visible in the excavated material should be carried
out to determine if anomalous material has been completely re-
moved.
(d) Summary of Conclusions on the Dispersion of Molybdenum and Selenium in Stream Sediments
Briefly reviewing the results of the studies of Mo
and Se in stream sediments the most obvious features relevant
to the interpretation of reconnaissance patterns in relation to
the metal content of the topsoil are:-
1. The presence of greater than 1.5 ppm Se or
greater than 2 ppm Mo in the -80 mesh fraction of stream sediment
can be considered definitely suspect and warrant closer investi-
gation by more detailed sampling upstream.
2. The mechanical composition of stream sediments
is characterized by a smaller proportion of silt and clay frac-
tions than the soils and drift of the catchment. Mo and Se,

305
although exhibiting a tendency to concentrate in the finer fractions,
are principally distributed in accordance with the organic carbon
and iron content of each fraction. The presence of high concentra-
tions of Mo, Se, C and Fe in some of the coarser fractions can be
attributed to the formation of undispersed aggregates of particles.
3. The presence of CaCO3
precipitated from anomalous
stream waters is marked by higher concentrations of Se relative to
Mo compared to the relative concentrations in non-calcareous sedi-
ments from the same site. The association of Se with CaCO3 con-
cretions can be correlated with the accumulation of fine organic
matter in the concretionary CaCO3 and this leads to the extension
of the length of the Se drainage train. Mo on the other hand,
is associated with iron oxides which do not accumulate in the
CaCO3
precipitates.
4. Organic carbon and iron oxides are often closely
associated in the soils of the catchment areas, in the general
drainage sediments and in size fractions of stream sediments.
Consequently, because of the correlation of Mo and Se with these
components, this leads to similar dispersion patterns for Mo and
Se. Variation in the patterns occur, however, when the patterns
of the major components diverge, as for example in CaCO3
concre-
tionary deposits or alluvial marls which preferentially accumulate
organic carbon and hence Se.
5. There is a close relationship between the metal
content of stream sediments and that of the bank material flanking

306
the stream. This in turn is closely related to the metal content
of the upper horizons of the adjacent soils. Processes of metal
dispersion taking place in the bank soil environment involve the
adsorption or co-precipitation of Mo or Se on organic matter and
iron oxides and closely reflect processes that take place in the
upper soil horizons.
6. The construction of levees along streams does
not significantly alter the relationship between Mo and Se in
the drainage sediments and in the flanking soils. In the case
of recent dredging, removal of active sediments from the stream
bed results in the mixing of large quantities of the material,
usually drift,wwhich forms the base of the stream. Where the
metal content of this material falls in the background range, a
depreciation of metal values and consequently the length of any
anomalous drainage train, takes place. However, because of the
association of organic matter with CaCO3
precipitation which takes
place fairly rapidly, Se patterns quickly redevelop. Mo on the
other hand, is associated mainly with iron oxides which are not
associated with CaCO3
precipitation and therefore the re-accumulation
of Mo would seem to be dependent on the collapse of Fe- and Mo-rich
bank soils (if present) or the transport of iron minerals in stream
sediments from anomalous areas upstream.
However, geochemical reconnaissance is normally carried
out by sampling only tributary drainage. Consequently, the results
are not liable to be markedly affected by recent dredging which is

307
mainly confined to larger streams. In any event, supplementary
sampling of active sediment recently dredged from streams and
dumped on the bank should help to overcome this problem.

308
PART D
CHAPTER X. THE APPLICATION OF REGIONAL GEOCHEMISTRY
1. REGIONAL GEOCHEMICAL SURVEYS AND AGRICULTURAL PROBLEMS
The primary advantage of reconnaissance stream
sediment sampling in the delineation of areas of trace element
excesses or deficiencies of agricultural significance, lies in
the relative economy by which relatively large areas may be
surveyed. By comparison, conventional soil survey methods,
although conducted in greater detail are more limited in scale
by the time and cost necessary to cover a given area. For this
reason, geochemical reconnaissance is particularly applicable
to large areas, even a whole tliountry or region, when a rapid
multi-element assessment of the trace element status of the soils
is required. This also allows the rapid pin-pointing of poten-
tially toxic areas wherein to concentrate detailed studies by
more conventional methods. Not only can this be applied to
agriculturally developed countries where the trace element
status of large areas is even still relatively unknown but also
to newly developing countries where programmes for the develop-
ment of agricultural resources require the assessment of extensive
areas.
The basic requirements of drainage surveys for
agricultural purposes are of course that, firstly, the broad
metal patterns in the topsoil are reflected in the drainage

309
sediments and secondly, that the form of the metal analysed can
be related to the "available" metal in the soil.
With regard to the first feature it is apparent that
some modification of the metal contents of the soil will take
place during the transition from soil to stream sediments and
that essentially local concentrations may be obscured. However,
it is only essential that at a regional scale the contrasting
patterns of suspect areas with those of non-toxic areas be
maintained in the drainage metal patterns. The definition of
small local patterns and accurate metal lev.gls in the topsoil
horizons can be defined by later detailed follow-up work in
suspect areas as described in Chapter V. To illustrate the
regional aspects of biogeochemistry, sampling of dairy herds
for symptoms of Mo-induced Cu deficiency was undertaken in the
suspect area of excessive Mo in stream sediments in Co. Limerick
(Fig. 64). The results of this investigation are described
later in this chapter.
With regard to the second feature involving the
relationship between the total metal content of stream sediments
and the availability of metal in the soil, it has been shown that
in addition to the total'thetal.00ntent of the soil, metal accumu-
lated by plants can be related to specific soil environmental
features particularly drainage, pH and organic matter status.
In the case of Mo, despite the modifying influence of soil pH
on metal uptake, the relationship between total metal in the
stream sediment and the metal content of herbage was fairly

310
direct in the Co. Limerick area. However, anomalous Se patterns
in the sediments were not directly related to the amount of Se
in the herbage and it was shown that toxic concentrations were
restricted to certain types of seleniferous soil. In view of
the marked effect of soil environment on the availability of Se,
the interpretation of total Se patterns in drainage must there-
fore take into account the distribution of environmental factors
controlling the uptake of Se by plants.
(a) Geochemical Environment Mats
To allow the ready comparison of stream sediment
data and the distribution of soil from which the uptake of
toxic concentrations of metal may occur, it has been suggested
by J.S. Webb that a series of overlay maps be prepared that
show, in addition to anomalous drainage patterns, the distri-
bution of soils favourable to toxic herbage. By also showing
topographic features that influence the dispersion of metal it
should be possible by examination of the overlays to define
areas where anomalous total metal patterns and potentially toxic
soil types overlap. Such a series of maps can be referred to as
"Geochemical Environment Maps".
Webb proposes that, for any particular element in each
area surveyed, pilot studies should be carried out to determine
the soil environments under which toxic concentrations may develop
in herbage. A study of this sort would be carried out in conjunc-

311
tion with the normal orientation survey that preys:ass any
geochemical survey. In addition to defining anomalous (for
agricultural purposes, potentially toxic) metal levels in sedi-
ments and soils, the study would also define potentially toxic
or metal-deficient environments as the case may be.
Following definition of the environments on which
toxic herbage may grow, the distribution of these environments
in the vicinity of anomalous drainage patterns must be determined.
Where soil
overburden
ments will
Where this
from which
maps of the area are available, or possibly geological
maps, it is most likely that potentially toxic environ-
correspond to particular soil or overburden types.
information is not available, aerial photographs
soil drainage for example, may be mapped may suffice.
(b) Potential Toxic Selenium Occurrences and Geochemical Environment Maps in Co. Limerick
In Co. Limerick the use of geochemical environment
maps is particularly applicable to assessment of the anomalous
Se stream sediment patterns. Soil-herbage relationships (Chapters
1,:and,VIII) showed that toxic levels in herbage were limited to
metal-rich soils of swampy-lacustrine or alluvial origin that
were generally of high organic matter status and very slightly
acid to alkaline in reaction. Soils of this type were mainly
located on limestone bedrock or in areas containing substantial
amounts of limestone drift. Accordingly therefore, the overlay
of a map showing the distribution of such environments on the

312
regional stream sediment map (Fig. 9) will pin-point areas within
the Se-rich zone where toxic vegetation is most likely to occur.
Points where suspect alluvial and lacustrine soils overlap the
Se anomalous area are shown on the regional geochemical envi-
ronment map for Se of the study area (Fig. 63).
It is readily apparent that in addition to the toxic
soils already recorded, there are several other occurrences of
similar soils within the anomalous stream sediment area that can
be considered suspect and worthy of check sampling of soils and
herbage. The detailed studies in Flynn's Farm area showed that
toxic pasture herbage did not occur on the acid alluvial soils
deposited in Clare Sale and Namurian rock areas. For this reason,
alluvial soils in the far west of the anomalous stream sediment
zone overlying Namurian rocks are not likely to be toxic.
Detailed check work was not carried out on the poten-
tially toxic areas shown in Fig. 63 but in addition to the known
toxic areas (at sites A and B), preliminary investigations at
site C revealed symptoms of Se toxicity in dairy cattle, namely
excessive hoof growth and fading of the coat.
(c) Relationship of Molybdenum Stream Sediment Anomalies to Bovine Hypocuprosis
In order to investigate further the relationship
that was established between anomalous concentrations of Mo in
the drainage and toxic concentrations in pasture herbage, studies
of the actual incidence of Mo-induced animal diseases was under-

Se in stream sediment -80 mesh (ppm)
Sit es A,8 and C -symptoms of Se toxicityin farm animals.
1.5
1.5-3.0
X 30
drained alluvial and lacustrine soils. (from Finch and Ryan) Suspect soil areas. (excluding acid alluvial soils on the Namurian rocks.).
0 2 4 6 m es
FIG.63. REGIONAL GEOCHEMICAL ENVIRONMENT MAP for SELENIUM. Showing potentially toxic areas worthy of further investigation.

313
taken by sampling dairy herds for blood-Cu deficiency.
Field observations and reports from local farmers
and agricultural officers had previously indicated symptoms of
unthriftiness and persistent scouring, consistent with Cu
deficiency, in the Mo anomalous area, In view of the generally
high levels of Cu in herbage in this zone (Fig. 17) compared with
the surrounding area, any Cu deficiency would in all probability
be Mo induced.
To investigate the Cu status of the livestock, blood
samples were collected from seven mature dairy cattle from eight
herds which were grazed on broadly comparable environments in
both anomalous and background control areas*. The animals chosen
had been pastured on the farms for at least two years.
The location of the herds is shown in Fig. 64 and
the results obtained are given in Table 56. Herds 1-3 were from
the highly anomalous zone and herds 4-5 from the area carrying
moderate Mo values in the stream sediments. Herds 6-8 were from
an area of background levels on the limestone.
It is apparent that all three herds on the highly
anomalous area have mean blood-Cu values below the recognized
threshold level of 0.07 mg Cu per 100 ml blood, with an overall
average of 0.063. This is almost half the blood-Cu level (0.11)
in the control herds. Herds from the moderately anomalous area
gave an intermediate value of 0.092.
*The samples were collected by Mr J.P. Donovan, Veterinary Surgeon, Shanagolden, Co. Limerick and analyses were arranged by Mr D.B.R. Poole of the Irish Agricultural Institute, Dunsinea, Co. Dublin. A report has already been prepared (Thornton et al, 1966).

, Nc• ict < 5
5-10
> 10
*6
Location of herds sampled.
Mo in stream sediment. —80 mesh (ppm.)
0 2 4 6 yam— miles
FIG.64. LOCATION OF DAIRY HERDS SAMPLED IN RELATION• TO
ANOMALOUS Mo STREAM SEDIMENT PATTERNS.

Table 56: Blood Copper Values from Dairy Herds Grouped According to Molybdenum Content of Local Stream Sediment
Farm (ref. Fig.64)
No. of Animals sampled
Blood copper values mg Cu/100 ml blood
+ Range Mean - S.D.
Relative Mo content of stream sediment
1 7 0.045 - 0.082 0.057 - + 0.012 High
2 7 0.050 - 0.113 0.068 2: 0.021 High
3 7 0.045 - 0.094 0.065 - + 0.015 High
4 7 0.082 - 0.104 0.094 I 0.012 Moderate
7 0.055 - 0.115 0.091 ± 0.022 Moderate
6 7 0.104 - 0.127 + 0.115 - 0.009 Low
7 7 0.086 - 0.145 + 0.111 - 0.020 Low 8 7 0.100 - 0.172 + 0.120 - 0.024 Low

315
There are drawbacks to the use of blood Cu levels as
a means of diagnosing hypocuprosis but in the limited area studied
it is clear that there is a marked difference in Cu status between
the background and anomalous areas. On the basis of this it is
considered most probable that in the area of approximately 35 sq.
mi. of anomalous soils indicated by the regional stream sediment
survey (Fig. 8) clinical or sub-clinical conditions of hypocup-
rosis could exist over extensive areas and limit the productivity
of livestock. In view of the known effect of liming on soil pH
and on the increased availability of Mo, the application of lime
to farms in this area should therefore be approached with caution.
(d) Biogeochemical Reconnaissance in Other Areas
Following advice from the Irish Agricultural Institute
that Se toxicity had been recorded at two localities and that Mo
induced Cu deficiency was suspected,an additional brief regional
survey was made of an area of about 500 sq. mi. in parts of Cos.
Meath and Dublin using samples collected for mineral exploration
purposes (ref. Figs.l and 4). Geologically this area was somewhat
similar to the Limerick area in that black shale stratigraphic
equivalents of the Clare Shales overlying limestone were known to
occur. The results of the survey indicated an area of about 150
sq. mi. in which stream sediment values exceeded 4-5 ppm Mo with some
areas containing in excess of 10 ppm. In view of the similar
environment to Co. Limerick, it has been proposed that in exten-
sive areas the Mo values in herbage growing on molybdeniferous

316
soils may approach toxic ar sub-toxic levels.
As a check on the repoducibility of regional stream
sediment sampling and to familiarize local staff with geochemical
techniques, the Irish Agricultural Institute repeated the survey
of this area. The Mo stream sediment patterns obtained almost
exactly duplicated those of the first survey. Slight differences
in the average Mo content of the sediments, in which the A.G.R.G.
values were about 12% higher than the Agricultural Institute
results are believed to reflect slight differences in the ana-
lytical techniques used but do not significantly affect the
overall patterns obtained.
Follow-up sampling by officers of the Irish Agricultural
Institute of soils and herbage bac confirmed that the anomalous
stream sediment patterns reflect anomalous concentrations of Mo
in the soils and toxic and sub-toxic levels in the herbage (pers.
comm. Dr P. Kiely to Prof. J.S. Webb).
Again,using samples initially collected for mineral
exploration, a few analyses were made at the A.G.R.G. laboratories
for both Mo and Se of sediments from streams draining areas of
probable Clare Shale equivalents in various parts of Ireland.
These are generally referred to as Upper Avonian rocks on the
Geological Map of Ireland published by the Irish Geological
Survey. These included areas in Counties Carlow, Kerry, Laois,
Kilkenny and Tipperary. In the Co. Tipperary area, seleniferous
soils located in the vicinity of Upper Avonian black shales had

317
already been reported by the Agricultural Institute. In most
cases anomalous levels of either Mo or Se or both were recorded
and this information has been passed to the Irish Agricultural
Institute for investigation.
2. THE APPLICATION OF REGIONAL GEOCHEMICAL SURVEYS TO GEOLOGICAL MAPPING
Despite the fact that the present study has been
primarily concerned with the biogeochemical application of
drainage reconnaissance and the detailed dispersion processes
of Mo and Se, it has also illustrated the relationship that
exists between metal patterns revealed by stream sediment
sampling and the minor element constituents of the bedrock
and glacial drift. This relationship was initially pointed
out by Hawkes et al (1956) after work in New Brunswick and
confirmed by Webb et al (1964) and Nichol et al (1966) during
geochemical studies in Zambia and Sierra Leone respectively.
Most of the advantages that have been mentioned for
regional geochemistry applied to agriculture, equally apply to
geochemical mapping for geological purposes. In particular,
this applies to the relative economy and speed of drainage
surveys where large areas are involved. Also, because trace
element patterns in bedrock and drift can be most readily related
to the total metal content of sediments, the difficulties of
interpreting the relative "available" metal contents of the
drainage in relation to soils is avoided.

318
With regard to the definition of bedrock metal patterns,
the presence of identifiable patterns in the drainage will depend
of course on.(a) the presence of characteristic metal contents in
the various bedrock units with adequate contrast between adjacent
formations, and (b) secondary dispersion processes in which the
contrast between metal patterns in the bedrock is retained even
if some modification of the actual metal levels may occur. In
the present study, the occurrence of excessive concentrations of
Mo and Se in the Clare Shales provided a readily mappable geo-
chemical feature from which the basic structure of the area was
reflected in the drainage. It was also shown though, that the
effects of secondary dispersion, in particular the transport of
Clare Shale fragments in drift as the result of glacial activity,
extensively modified the bedrock patterns. The influence of other
secondary dispersion features, such as the accumulation of metal
in peaty-swamps and alluvial deposits, although of local significance
do not extensively alter the regional patterns.
It is also apparent from the present atudy that in
certain cases, mapping of patterns related to the dispersion of
metal in drift may provide a means by which glacial patterns
may be readily determined. Hitherto, mapping of glacial deposits
in relation to the bedrock source, has involved relatively
laborious searching for recognisable rock fragments followed
by counts to determine the proportions of the rock types present.
Where one or more particular rocks can be readily identified by

319
their metal constituents, drainage reconnaissance followed by
analysis of fresh drift may provide preliminary data on the
constituent rock material. Trace element analysis has the
advantage of including metal from rock types that have been
ground away to rock flour and therefore would not be recogni-
sable by visual examination.

320
CHAPTER XI. CONCLUSIONS AND RECOMMENDATIONS FOR FUTURE RESEARCH
1. The principal bedrock units of the Co. Limerick
area, namely the Carboniferous limestone, the Clare Shales and
non-marine Namurian sediments, each possess characteristic metal
assemblages. The most pronounced is the enrichment of the Clare
Shales (a "black shale" facies) in Mo and Se and to a lesser
extent Cu and V. The Mo and Se content of the other rock types
is negligible by comparison. With the exception of V, the lime-
stone is characteristically impoverished in most of the other
metals determined (Pb, Ga, Ti, Ni, Co, Mn, Cr and Fe), compared
with both the Clare Shales and Namurian sandstones and argillites.
The Namurian rocks are noticeably higher in Ti and Fe than the
Clare Shales.
2. The Clare Shales formation contains mean metal
contents of 27 ppm Mo and 2.9 ppm Se. This compares with less
than 2 ppm Mo and less than 0.5 ppm Se in the other rock types of
the area. In the Clare Shales, the highest concentrations of Mo
and Se (up to 300 ppm Mo and 30 ppm Se) occur in the more carbon-
aceous and pyritic shale types. Stratigraphically, no particular
horizon or area of the basin of deposition can be defined as
likely to carry the highest metal concentrations. The enrichment
of certain areas in Mo and Se would appear to be controlled by
local environmental factors.

321
3. The Se and Mo content of shale samples, that are
stratigraphically located close together, can be correlated with
one another. Also, both elements show a fair degree of correlation
with sulphur. In the absence of any evidence of epigenetic sulphide
mineralisation, sulphur in the shales is attributed to primary iron
sulphide deposition in the black shale environment. No relationship
was establiphed between the organic carbon content and amount of
Mo and Se in a limited number of shale samples. Similarly, there
was no relationship between Mo and Se and the total Fe content of
the shales, which includes detrital Fe minerals as well as iron
sulphide precipitates.
4. Se is strongly concentrated in the pyrite fraction
of shale samples whereas Mo is more or less equally distributed
between the pyrite and argillaceous-carbonaceous fractions. How-
ever, in view of the relatively small pyrite content of the shales
as a whole (less than 1.7 per cent S) the bulk of the total metal
content of the shales is held in the argillaceous and carbonaceous
raktrix minerals.
5. Various possible modes of formation of the Mo and
Se-rich black shales are discussed but it is considered that
concentration most probably took place by co-precipitation of
Mo and Se with syngenetic iron sulphides in a reducing, anaerobic,
carbonaceous shale environment. Various diagenetic changes arise,
in particular with regard to the mineral form of the iron sulphides,
which have modified the modes of occurrence of the metals.

322
6. Regional soil sampling showed that the basic bed-
rock patterns are retained in the overburden but may be extensively
modified where the area has been traversed by ice during the
Weichsel glaciation. In this case the resultant patterns in the
drift cane be related to the direction and extent of ice-flow, to
the metal constituents of the rocks traversed, and to the relative
proportions of the different rock types in the drift.
7. Modification of the overall mean metal contents
of the overburden (compared with the bedrock) by secondary
dispersion processes is related to the major constituents of the
rock. In the Clare Shale and Namurian areas most metal levels in
the overburden are of the same order as in the bedrock. In the
limestone areas however, leaching of CaCO3 has led to enrich-
ment of most metals in the overburden so that the bedrock metal
contrast, between limestone and Namarian rocks for example, is
partly obscured in the secondary environment.
8. In residual soils developed on the Clare Shales,
Mo and Se are enriched in the basal horizons compared with the
topsoil and also with the underlying bedrock. This is attributed
to a close association of metal with secondary iron oxide accumu-
lations in the C horizon; It is most probable that the metals
occur as ferric-molybdite and basic ferric selenite. In the
topsoil the association of Se with organic matter leads to a
relative enrichment of Se compared with Mo.
9. The Mo and Se content of unweathered glacial drift
reflects the proportion of admixed Clare Shale material with
barren rock types. Soil development under good to moderate

323
drainage conditions leads to an enrichment of Mo and Se in the
upper horizons along with iron oxides and organic matter. The
fixation of Mo and Se in the topsoil is attributed principally
to sorption on the accumulated iron oxides and organic matter.
Under conditions of poor drainage, gleyed, Mo and Se-rich top-
soils develop. The increased accumulation of organic matter
under these conditions leads to a relative enrichment in the Se
content compared to Mo.
10. Alluvial deposits which flank many of the streams
draining the Clare Shale areas accumulate Mo and Se, the relative
concentrations varying with the origin of the major constituents
of the alluvium. In alluvium of predominantly Clare Shale origin,
both Mo and Se are accumulated in generally acid, peaty horizons
overlying essentially detrital alluvial sands and clays. Where
alluvium is deposited in limestone areas by streams draining from
the Clare Shales, the Mo content is relatively low whereas Se is
concentratedjin association with organic matter,in calcareous marl
horizons. Detrital clays underlying the marls contain only low
concentrations of both metals. In the organic gley topsoils
both Mo and Se are enriched. The enrichment of Mo in topsoil is
attributed to co-precipitation with iron oxides in the aerated
surface zone.
11. Very high concentrations of Mo and Se occur in
peaty-swamp soils formed as semi-lacustrine deposits in post-
glacial depressions on, or adjacent to, the Clare Shales. Mo
and Se are introduced into the swamps in groundwaters by drainage

324-
from the adjacent drift and Clare Shale deposits. Fixation of
metal in the peaty soils and underlying organic marls is attri-
buted principally to adsorption of Mo and Se from solution on
organic matter. In the case of Mo, co-precipitation with iron
oxides may also contribute to concentrations. Present-day
drainage improvement of the peat-swamps has lead to the lowering
of the water-table. This is believed to have.xesulted in aeration
of the upper soil horizons and decomposition of organic matter
with the release of sorbed Mo and Se into the near-surface
groundwaters.
12. Red clover consistently contains more Mo than
common grass species in pasture herbage but in the case of Se
grasses tended to contain the most Se. However, despite
differences in the relative metal contents of separate plant
organs as well, the metal content of bulk pasture herbage
samples is unlikely to be affected significantly by differences
in uptake rates by separate species or plant parts.
13. The Mo content of pasture herbage can be broadly
correlated with the total Mo content of the topsoil. It was
also found though that uptake was slightly increased on more
alkaline soils particularly alluvium, overlying limestone areas.
Within the range of environmental conditions in the area it
was found that drainage and natural variations in Fe, SO4.
and P content of the topsoil did not significantly affect Mo
uptake.
14. Toxic and sub-toxic levels of Se were only present

325
in herbage growing on slightly acid to alkaline, poorly drained
organic soils, mostly of alluvial or swamp origin. On these
soils the Se content of herbage was related to the total Se
content of the topsoil. The lower pH range in which toxic
concentrations may be absorbed by plants was between 5.2 and 5.5
and uptake rates tended to iAcrease with a rise in pH. Uptake
of Se also tended to increase in poorly drained areas. It was
postulated that this may be due to the retention of higher con-
centrations of Se in near-surface groundwaters due to the release
of Se into solution in an available form (as selenates or soluble
organic complexes) by the breakdown of Se-rich organic matter in
the weathering topsoils.
15. Mo and Se in near-surface groundwaters are related
to the total Mo and Se contents of the soil profile, the correla-
tion for Se being particularly close. Within the range of pH-Eh
conditions present in the area the metal content of the ground-
waters does not significantly vary with changes in pH and Eh.
16. Where groundwaters enter the surface drainage
there is an appreciable loss of Mo from solution but the Se
content does not vary much. The loss of Mo is attributed to
co-precipitation with secondary iron oxides which precipitate
at seepage points. Both Mo and Se accumulate with organic matter
in bank seepage soils but the amount sorbed by organic carbon is
presumably negligible compared with the water contents. In the
surface waters there is no evidence that significant losses
occur by precipitation or adsorption on the stream sediment.

326
The gradual decrease in the Mo and Se content of stream waters
downstream from metal-rich headwaters is attributed to dilution
by barren waters entering the stream channels.
17. The detectable anomalous drainage train of Mo and
Se in stream waters downstream from anomalous soils is longer than
the equivalent train in stream sediments and extends for about
15000 ft compared with about 7000 ft for Mo in sediments and
9000 ft for Se. It is postulated that the presence of anomalous
concentrations of Se in stream waters is a direct indication of
the presence of toxic seleniferous soils in the stream catchment.
18. Potentially anomalous levels of Mo and Se in the
-8o mesh fraction of stream sediments are considered to be 2 ppm
Mo and 1.5 ppm Se. In the Clare Shale-Namurian-limestone areas
of Ireland values in excess of these are worthy of "follow-up"
investigations.
19. The dispersion of Mo in the drainage sediments is
dominantly mechanical, by erosion of metal-rich bank soils and
seepage sediments. Co-precipitation of Mo with iron oxides and
adsorption on organic matter takes place at seepage zones but
there is no evidence that additional precipitation takes place
from solution in the surface waters. The degree of enrichment
of Mo in bank soils closely corresponds to the amount of metal
accumulated in the topsoil horizons. Consequently, the metal
eroded into streams as bank soils can be related to the metal
contents of the topsoil.

327
20. The dispersion of Se in stream sediments is closely
related to the distribution of organic carbon. In addition to
normal dispersion of Se-rich organic matter by erosion of peaty
soils in the stream headwaters, CaCO3
concretionary deposits
in the stream channels accumulate organic particles. Where
CaCO3 precipitates occur in the stream, this results in the
extension of the anomalous Se drainage train beyond that of Mot
It cannot be stated definitely whether some adsorption of Se
from seleniferous stream waters takes place on the organic
matter in CaCO3
concretions but in view of the high Se levels
in deposits of this origin, the possibility is not discarded.
21. It was shown that reconnaissance sampling of
stream sediments at a density of 1-2 samples per sq. mile
adequately delineated anomalous Mo and Se drainage patterns.
These reflected the Mo and Se content of the bedrock and soil
and drift overburden. The anomalous Mo and Se stream sediment
patterns were also centred on localities where toxic concentra-
tions of Mo and Se were known to occur in herbage. In the case
of Mo, the regional survey revealed an area of about 35 sq.
miles in which toxic or sub.toxic concentrations of Mo in the
herbage were suspected. It was subsequently shown that the
excessive Mo levels in herbage in this area could be related
to symptoms of Mo-induced Cu deficiency in cattle. For Se
however, soil environmental factors also control the uptake
of metal by herbage so that toxic herbage occurrences in the
total anomalous drainage area were probably restricted to certain

328
alluvial and lacustrine soil types of neutral to alkaline reaction.
These are defined by means of a -geochemical environment map.
RECOMMENDATIONS FOR FUTURE RESEARCH
(a) In the application of regional geochemical surveys
to agricultural problems, it is obvious that the principal short-
coming of the methods suggested by the present research lies in
the definition of the relationship between the total metal content
of sediments and the form of metal in the topsoil that is avail-
able to plants. This may not be so vital in the case of Mo in
which environmental factors axe not as important as the total
Mo content of the soil. For Se however, it is obvious that
experiments should be made to attempt to develop a relationship
between extractable Se in sediments e.g. by boiling water, EDTA,
ammonium acetate or oxalate etc., and the forms available in the
toxic soil types.
(b) There also remains work to be done on the rela-
tionships of Se in ground and surface waters to the presence of
toxic concentrations in plants. Additional tests could be made
of the reliability of anomalous concentrations of Se in stream
watera_in terms of the presence of toxic soils in the catchment.
(c) With regard to the interpretation of regional metal
patterns improvements could be made on the strictly visual means by
which anomalous patterns were subjectively delineated. This should
be by the use of statistical and automatic data plotting techniques
such as are currently being developed at the Applied Geochemistry
Research Group at Imperial College.

REFERENCES
329
A.G.R.G. (1962) and rock Imperial
A.G.R.G. (1962) soil and London.
Determination of molybdenum in soil, sediment samples. Applied Geochemistry Research Group, College, London. Tech. Comm. No. 50.
Determination of copper with 2,2'-diquinolyl in sediment samples. A.G.R.G., Imperial College, Tech. Comm. No. 23.
A.G.R.G. (1962) Determination of carbonate and bicarbonate in natural water. A.G.R.G., Imperial College, London. Tech. Comm. No. 26.
A.G.R.G. (1962) Determination of zinc in soil, sediment and rock samples. A.G.R.G., Imperial College, London. Tech. Comm. No. 30.
A.G.R.G. (1962) Determination of organic carbon in soil and sediment samples. A.G.R.G., Imperial College, London. Tech. Comm. No. 32.
A.G.R.G. (1962) samples. Comm. No.
A.G.R.G. (1962) samples. Comm. No.
A.G.R.G. (19(5) samples. Comm. No.
A.G.R.G. (1966) samples. Comm. No.
A.G.R.G. (1966) A.G.R.G.,
Determination of sulphate in soil and sediment A.G.R.G., Imperial College, London. Tech. 33.
Determination of iron in soil and sediment A.G.R.G., Imperial College, London. Tech. 4o.
Determination of arsenic in soil and sediment A.G.R.G., Imperial College, London. Tech. 49.
Determination of phosphorus in soil and sediment A.G.R.G., Imperial College, London. Tech. 52
Determination of carbonate in soil samples. Imperial College, London. Tech. Comm. No. 53.
Almond, H. (1955) Rapid field and laboratory method for the determination of copper in soil and rocks. U.S.G.S. Bull. 1036-A.
Anderson, M.S., Lakin, H.W., Beeson, K.C. et al (1961) Selenium in agriculture. U.S. Dept. Agri. Handbook No. 200.
Ashby, D.F. (1939) The geological succession and petrology of the Lower Carboniferous volcanic area of Co. Limerick. Proc. Geol. Assoc., 50, 324-330.

330
Barshad, I. (1948) Molybdenum content of pasture plants in relation to toxicity in cattle. Soil Sci., 66, 187-195.
Barshad, I. (1950) Factors affecting the molybdenum content of pasture plants. I. Nature of soil molybdenum, growth and soil pH. Soil Sci. 71, 297-313. II. Effect of soluble phosphates, available nitrogen and soluble sulphates. Soil Sci., 71, 387-398.
Beath, 0.A. (1937) The occurrence of selenium and seleniferous vegetation in Wyoming. II. Seleniferous vegetation. Wyoming Agr. Expt. Sta. Bull. No. 221, 29-64.
Beath, 0.A., Draize, J.W., and Gilbert, C.S. (1934) Plants poisonous to livestock. Wyoming Agr. Expt. Sta. Bull. No. 200, 1-84.
Beath, 0.A., Epson, H.T. and Gilbert, C.S. (1935) Selenium and other toxic minerals in soils and vegetation. Wyoming Agr. Expt. Sta. Bull., No. 200, 1-84.
Beath, 0.A., Hagner, A.F. and Gilbert, C.S. (1946) Some rocks and soils of high selenium content. Geol. Surv. Wyoming Bull. No. 36.
Belyakova, E.E. (1958) Migration of elements in underground surface waters of Central Kazakhstan. Geochemistry, 2, 176.
Brindley, J.C. (1957) Geology. I. Basement rocks; in Meenan, J. and Webb, D.A. Eds. A view of Ireland. Brit. Assoc. Adv. of Sci., Dublin, 15-22.
Brindley, J.C. and Gill, W.D. (1958) Summer field meeting in southern Ireland 1957. Proc. Geol. Assoc., 69, 244-261.
Brittan, J.W. and Goss, H. (1946) Chronic molybdenum poisoning in cattle. Jour. Amer. Vet. Met. Assoc., 108, 176-178.
Byers, H.G. (1935) Selenium occurrence in certain soils in the United States, with a discussion of related topics. U.S. Dept. Agr. Tech. Bull. 530.
Byers, H.G. (1936) The origin, distribution and effects of selenium. Soil Sci. Amer. Proc. 1, 327.
Byers, H.G., Miller, J.T., Williams, K.T. and Lakin, H.W. (1938) Selenium occurrence in certain soils in the United States with a discussion of related topics. U.S. Dept. Agr. Tech. Bull. 601, Third Report.

331
Cannon, H. (1955) Geochemical relations of zinc-bearing peat to the Lockport Dolomite, Orleans County, New York. U.S.G.S. Bull. 1000-D.
Cannon, H. (1960) Botanical prospecting for ore deposits. Science, 137.
Cannon, H. (1964) Geochemistry of rocks and related soils and vegetation in the Yellow Cat area, Grand County, Utah. U.S.G.S. Bull. 1176.
Charlesworth, J.K. (1963) Historical Geology of Ireland. Oliver and Boyd.
Davies, E.B. (1956) Factors effecting molybdenum availability in soils. Soil Sci., 81, 209-221.
Degons, E.T. (1965) Geochemistry of Sediments. A brief survey. Prentice Hall Inc.
Dolukhanova, N.I. (1957) The application of hydochemical surveys to copper and molybdenum deposits in the ArMenian S.S.R. Akad. Nauk Armyanskoy S.S.R. (Yerevan). (Partial English translation in Int. Geol. Rev. 2, 20-40, 1960.)
Donovan, P.R. (1965) Geochemical dispersion in relation to base metal deposits in glacial terrain in West Central Eire. Unpub. Ph.D. Thesis, University of London.
Dunham, K.C. (1961) Black Shale, oil and sulphide ore. Adv. Sci., 18, (73), 284-290.
Edwards, A.B. and Carlos, G.C. (1954) The selenium content of some Australian sulphide deposits. Proc. Aust. Inst. Mining and Metallurgy, no. 172, 31-64.
Efimov, V.N. (1962) Forms of accumulation and migration of sub-stances in swampy soils. Zap. Leningr. Sel'skokhoz Inst. 84, 33-38.
Ekpete, D.M. and Cornfield, A.H. (1965) Effect of varying static and changing moisture levels during incubation on the mineralisation of carbon in soil. Jour. Agr. Sci.,64, 205-209.
Elliot, I.L. (1962) Dispersion of arsenic and molybdenum in surface drainage, Sierra Leone. Unpub. Ph.D. Thesis, University of London.
Evans, H.J., Purvis, E.R. and Bear, F.E. (1951) Effect of soil reaction on availability of molybdenum. Soil Sci., 71, 117-124.

332
Ferguson, W.S., Lewis, A.H. and Watson, S.J. pastures of Somerset. I. Jour. Agr.
Ferguson, W.S. (1944) "Teart" of Somerset, farm animals. Proc. Nutrition Soc.,
(1943) The teart Sci., 33, 45-51.
a molybdenosis of 1, 215-219.
Finch, T.F. and Pierce, Ryan (1966) Soils of Co. Limerick. Soil Surv. Bull. No. 16. National Soil Survey of Ireland (The Agricultural Institute).
Fleming, G.A. and Walsh, T. (1957) Selenium occurrence in certain Irish soils and its toxic effect on animals. Proc. Roy. Irish Acad., 58, Sec. B, no. 7.
Fleming, G.A. (1962) Some factors affecting the uptake of selenium by plants. Irish Jour. of Agr. Research, 1, (2), 131-138.
Fleming, G.A. (1962) Selenium in Irish soils and plants. Soil Sci., 94, 28-35.
Fleming, G.A. (1965) Trace elements in plants with particular reference to pasture species. Outlook on Agriculture, 4, (6), 270-285.
Franke, K.W. and Painter, E.P. (1937) Effect of sulphur additions on seleniferous soil. Indust. Eng. Chem. Indust. Ed., 29, 591-595.
Goldschmidt, V.M. (1954) Geochemistry. Oxford University Press, 730 p.
Goldschmidt, V.M. (1957) The principles of distribution of chemical elements in minerals and rocks. Jour. Chem. Soc. (London), 655-673.
Green, Jack (1959) Geochemical table of the elements for 1959. Geol. Soc. Amer. Bull., 70, 1127-1184.
Griffith, G.W. (1960) Soil and Cancer. The Medical Press, Great Britain.
Hawkes, H.E., Bloom, H., Riddell, J.E. and Webb, J.S. (1956) Geo-chemical reconnaissance in Eastern Canada. In Symposium on Geochemical Exploration. Trans. Int. Geol. Cong. XX Session.
Hawkes, H.E. and Webb, J.S. (1962) Geochemistry in mineral explora-tion. Harper and Row, New York and Evanston.
Hesse, P.R. (1961) The decomposition of organic matter in a mangrove swamp soil. Plant and Soil, 14, 249-263.
Hewat, R.E.T. and Eastcott, D.F. (1955) Dental caries in New Zealand. Report of an epidemiological and racial study. Med. Res. Counc. N.Z. Wellington, N.Z.
Hodson, F. (1954 A) The beds above the Carboniferous in Co. Clare, Eire. Q.J.G.S., 109, 259-283.

333
Hodson, F. (1954 B) The Carboniferous rocks of Foynes Island, Co. Limerick. Geol. Mag., 91, 153-160.
Hodson, F. and Le Warne, G.C. (1961) A mid-Caxlmiferous (Namurian) basin in parts of the Counties of Limerick and Clare, Ireland. Q.J.G.S., 117, 307-333.
Huberty, M.A., and Hass, A.R.C. (1940) The pH of soil as affected by moisture and other factors. Soil Sci., 49, 455-478.
Hurd-Karrer, A.M. (1935) Factors affecting the absorption of selenium from soils by plants. Jour. Agr. Res., 50, 413-427.
Jones, L.H.P. (1956) Interaction of iron and molybdenum in soils. Science, 123, 1116.
Jones, L.H.P. (1957) The solubility of molybdenum in simplified systems and aqueous soil suspension. Soil Sci., 8, (2), 313-327.
James, L. (1965) Regional geochemical reconnaissance in the northern and southern sections of the Sula Mountains Schist Belt, Sierra Leone. Unpub. Ph.D. Thesis, University of London.
Komroff, J. Jnr. (Ed.) (1926) The Travels of Marco Polo (circa 1275 A.D.) Liveright, New York.
Korolev, D.F. (1958) The role of iron sulphides in the accumulation of molybdenum in sedimentary rocks of the reduced zone. Geochemistry, no. 4, 452-463.
Krauskopf, Konrad B. (1956) Sedimentary deposits of rare metals. Econ. Geol. 50th Anniv.,Vol., 411-463.
Krauskopf, Konrad B. (1956) Factors controlling the concentrations of 13 rare metals in sea water. Geochim. et Cosmochim. Acta, 9, 1-32.
Kuroda, P.K. and Sandell, E.B. (1954) Geochemistry of molybdenum. Geochim. et Cosmochim. Acta., 6, 35-63.
Lakin, H.W. and Byers, H.G. (1948) Selenium occurrence in certain soils of the U.S. with a discussion of related topics -Seventh Report. U.S. Dept. Agr. Tech. Bull. 950, 36.
La Riche, H.H. (1959) Molybdenum in the Lower Lias of England in relation to the incidence of teart. Journ. Soil Sci., 10, 133-136.
La Riche, H.H. (1959) The distribution of certain trace Elements in the Lower Lias of southern England. Geochim. et Cosmochim. Acta, 16, 101-122.
Larskaya, Ye.S. (1961) The geochemical conditions of organic matter accumulation in Meszoic deposits of the Eastern Fore-Caucasus. Dokl. Akad. Nauk. S.S.S.R., 141, 201-204.

334
Lees, A. (1961) The Waulsortian !ft•eefs" of Eire: a carbonate mudbank complex of Lower Carboniferous age. Jour. Geol. 69, 101-109.
Le Warne, Gillian C. (1963) Spongolites from the Arnsbergian of Co. Limerick, Ireland. Geol. Mag., 100, (4), 289-298.
Luttrell, G.W. (1959) Annotated bibliography on the geology of selenium. U.S.G.S. Bull. 1019-M, 867-972.
Malyuga, D.P. (1964) Biogeochemical methods of prospecting (in English). Consultants Bureau, New York.
Manheim, Frank T. (1961) A geochemical profile in the Baltic Sea. Geochim. et Cosmochim. Acta, 25, 52-70.
Mason, Brian (1957) Principles of geochemistry. Wiley, New York.
Mather, A.L. (1959) Geochemical prospecting studies in Sierra Leone. Unpub. Ph.D. Thesis, University of London.
Meenan, J. and Webb, D.A. (Eds.)(1957) A view of Ireland. Brit. Assoc. for Advance. of Sci., Dublin.
M±khailor, A.S. (1962) Formation of iron hydroxides containing molybdenum. Geokhimiya, 925-928.
Mitchell, R.L. et al (1956) 2nd Symposium on Plant Analysis and Fertilizer Problems, 6th Int. Congr. Soil Sci. (Paris)
Moore, C.W.E. (1950) Pot culture studies of the copper and molybdenum content of certain pasture plants. Aust. Jour. Agr. Res. 1:43.
Moran, A.L. (1937) Alkali disease or selenium poisoning. S. Dakota Agr. Expt. Sta. Bull. No. 311, 1-91.
Munsell, H.E., De Vaney, G.M. and Kennedy, M.H. (1936) Toxicity of food containing selenium as shown by it's effect on the rat. U.S. Dept. Agr. Bull. 534.
Nevill, W.E. (1963) Geology and Ireland. Allen Figgis, Dublin, 263 p.
Nichol, I. and Henderson-Hamilton, J.C. (1965) A rapid quanti-tative spectrographic method for the analysis of rocks, soils and stream sediments. Trans. Inst. Min. Metall., 74, 955.
Nichol, I., Garrett, R.G. and Webb, J.S. (1966) Studies in regional geochemistry. Trans. Sect. B. Inst. Min. Metall., 75, 106-107.
Nichols, G.D. and Loring, D.H. (1962) The geochemistry of some British Carboniferous sediments. Geochim. et Cosmochim. Acta, 26, June-January.

335
Nicolls, 0.W. (1964) Geochemical dispersion from base metal deposits, Queensland, 1,ustralia. Unpub. Ph.D. Thesis, University of London.
North, A.A. (1956) Geochemical field methods for the determination of tungsten and molybdenum in soils. Analyst, 81, 660-668.
Oertel, A.C. (1961) Relation between trace element concentrations in soil and parent material. Jour. Soil Sci., 12, 119-128.
O'Brien, N.V. (1953) Phosphate horizons in the Upper Carboniferous el Ireland. Intern. Geol. Congr. Algeria, C.R. Sect. II (11), 135-143.
Olson, 0.E. and Jensen, C.W. (1940) The adsorption of selenate and selenite selenium by colloidal ferric hydroxide. S. Dakota Acad. Sci. Proc., 20, 115-121.
Olson, 0.E. and Moxon, A.L. (1939) The availability to crop plants of different forms of selenium in soil. Soil Sci., 305-311.
Olson 0.E., Moxon, A.L. and Whitehead, E.I. (1942) Occurrence of soluble selenium in soils and its availability to plants. Soil Sci., 54, (1), 47-53.
Pieve, J. (Ed,) and others (1958) Trace elements in agriculture. Trudy Viesoyiez Soveshchaniya, Baku.
Piper, C.S. and Beckwith, R.S. (1949) The uptake of copper and molybdenum by plants. Brit. Commonw. Sec. Offic. Conf., Spec. Conf. in Agr., Aust. Proc., 144-155 (H.M.S.O. London).
C.S. (1950) Soil and plant analysis. Interscience, York.
Rankama, K.K. and Sahama, Th.G. (1950) Geochemistry. The University of Chicago Press.
Rosenfeld, Irene and Beath, 0.A. (1964) Selenium: Geobotany, Biochemistry, Toxicity and Nutrition. Acad. Press, New York, London.
Sandell, E.B. (1959) Colorimetric determination of traces of metals. Interscience, 3rd Ed. New York and London.
Schollenberger, C.J. (1927) A rapid approximate method of deter-mining soil organic matter. Soil Sci., 24, 44.
Scott, W.W. and Furman, N.H. (1955) Standard methods of chemical analysis. Tech. Press, 5th Ed. London..
Searight, W.V., Moxon, A.L., Hilmoe, R.J. and Whitehead, E.I. (1946) Occurrence of selenium in Pliestocene deposits and their derivatives in South Dakota. Soil Sci., 61, (6), 455-463.
Smith, M.I. and Lillie, R.D. (1940) Part 1. The chronic toxicity of naturally occurring food selenium. U.S. Public Health Serv. Nat. Inst. Health Bull. No. 174, 1-13.
Piper, New

336
• • .
Smyth, L.B. et al (1939) The geology of south-east Ireland together with parts of Limerick, Clare and Galway. P.G.A. 50, 287-351.
Smyth, L.B. (1939) The Lower Carboniferous of South-East Ireland. 50,..305.
Stanton, R.E. (1964) The field determination of arsenic in soils and sediments. Econ. Geol., 59, (8), 1599-1602.
Stanton, R.E. and McDonald, Allison J. (1965) The determination of selenium in soils and sediments with 3,3'-Diaminobenzidene. Analyst, 90, (1073), 497.
Stout, P.R., Meagher, W.R., Pearson, G. and Johnson, C.M. (1951) Mo nutrition of crop plants: The influence of phosphate and sulphate on the absorption of Mo from soils and solution cultures. Plant and Soil, 3, 51.
Synge, F.M. and Stephens, N. (1960) The Quaternary period in Ireland. An assessment. Irish Geogr., 4, 121-130.
Synges F.M. (1966) in Soils of Co. Limerick (Finch and Ryan, 1966).
Swaines D.J. (1955) The trace element content of soils. Common-wealth Bureau Soil Sci. Tech. Comm.
Thornton, I., Atkinson, W.J., Webbs.J.S4,and Poole, D.B.R. (1966) Geochemical reconnaissance and bovine hypocuprosis in Co. Limerick, Ireland. Irish Jour. Agric. Res., 5, 280-283.
Tooms, J.S., Elliott, I. and Mather, A.L. (1965) Secondary dispersion of Mo from mineralisation, Sierra Leone. Econ. Geol., 50, 1478-1479.
Tourtelot, H.A. (1962) Preliminary investigation of the geologic setting and chemical composition of the Pierre Shale, Great Plains Region. U.S.G.S., Profess. Paper No. 390.
Vasillevskaya, V.D. and Krutikova, V.A. (1963) Molybdenum in the soils of the Kaluga Region. Vestn. Mock. Univ., Ser. IV, Biol. Pocknoved., 18, (6).
Viewing, K. (1963) Regional geochemical patterns related to mineralisation in Sierra Leone. Unpub. Ph.D. Thesis, University of London.
Vinogradov, A.P. (1959) The geochemistry of rare and dispersed elements in Soils. 2nd Ed. Consultants Bureau, Inc. New York.
Vinogradov, Kh.G. (1943) Mo content in plants of the family Leguminosae. Doklady Akad. Nauk, S.S.S.R., 40, (1), 31-34.
Walsh, T. and Fleming, G.A. (1952) Selenium levels in rocks, soils and herbage from a high selenium locality in Ireland. Trans. Int. Soc. Sci. Comm. ii and iv., 2, 178-183.

337
Walsh, T., Fleming, G.A., O'Connor, R. and Sweeney, A. (1951) Selenium toxicity associated with an Irish soil series. Nature, 168, 881.
Walsh, T.,Neenan, M. and O'Moore, L.B. (1953) High Mo levels on acid soils. Nature, 9, (London), (171), 1120.
Ward, F.N., Lakin, H.W., Canney, F.C. et al (1963) Analytical methods used in geochemical exploration by the U.G. Geological Survey. U.S.G.S. Bull. 1152.
Warren, H.V. (1965) Medical geology and geography. Science, 148, (3669), 534-539.
Warren, H.V., Delavault, R.E. and Routley, D.G. (1953) Preliminary studies of the biogeochemistry of molybdenum. Royal Soc. of Canada Trans., 47, 71-75.
Webb, J.S. (1965) Applied geochemistry and the community. Reprinted from Problems of Geochemistry. (Vernadsky Centennial Celebrations) Akadeffy of Sciences of the Vernadski Institute of Chemistry and Analytical Chemistry, Moscow.
Webb, J.S. (1964) Geochemistry and Life. New Scientist, 23, 504-507.
Webb, J.S. and Atkinson, W.J. (1965) Regional geochemical reconais-sance applied to some agricultural problems in Co. Limerick, Eire. Nature, 208, (5015) 1056-1059.
Webb, J.S., Fortescue, J., Nichol, I. and Tooms, J.S. (1964) Regional geochemical reconnaissance in the Namwala Concession area, Zambia. A.G.R.G., Imperial College, London, Tech.. Comm. No. 47.
Wells, N. (1956) Molybdate ion fixation in New Zealand soils. N.Z. Jour. Sci. Tech., 37, 482.
Williams, C.H. and Moore, C.W.E. (1952) The effects of stage of growth on the Cu, Zn, Mn and Mo contents of Algerian oats grown on 13 different soils. Aust. Jour. Agr. Research, 3, 343.
Williams, K.T. and Byers, H.G. (1936) Selenium compounds in soils. Indus. Eng. Chem., 28, 912-914.
Related Documents


![[PPT]Slide 1 · Web viewSSPC-SP WJ-1/NACE WJ-1, Clean to Bare Substrate SSPC-SP WJ-2/NACE WJ-2, Very Thorough Cleaning SSPC-SP WJ-3/NACE WJ-3, Thorough Cleaning SSPC-SP WJ-4/NACE](https://static.cupdf.com/doc/110x72/5b191e557f8b9a46258c50b2/pptslide-1-web-viewsspc-sp-wj-1nace-wj-1-clean-to-bare-substrate-sspc-sp.jpg)