Explore the future Automotive Test Systems | Process & Environmental | Medical | Semiconductor | Scientific CLUE

Welcome message from author
This document is posted to help you gain knowledge. Please leave a comment to let me know what you think about it! Share it to your friends and learn new things together.
Transcript
Explore the future Automotive Test Systems | Process & Environmental | Medical | Semiconductor | Scientific
Cathodoluminescence Solut ions
for Electron Microscopy
CLUE
Take a step further with cathodoluminescence techniques
Advanced CL imaging and spectroscopy
Enhance your Scanning Electron Microscope Capabilities
Cathodoluminescence (CL) is an essential non-destructive analytical technique useful in a wide range of applications including semiconductors, optoelectronics, dielectrics and ceramics. CL is also a powerful tool for investigations in geology, mineralogy, forensics, and life sciences.
In combination with electron microscopy, CL offers high spatial resolution combined with high spectral resolution and correlation with surface morphology. CL is a unique materials-characterization technique from bulk samples to nanostructures.
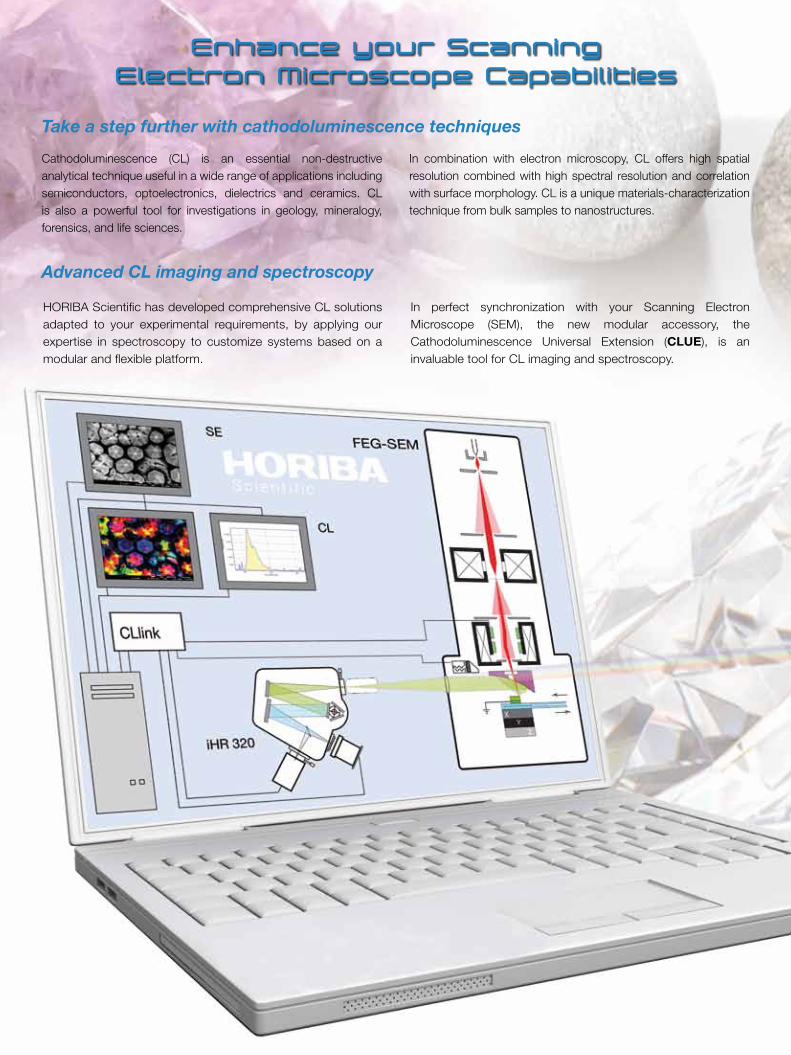
HORIBA Scientific has developed comprehensive CL solutions adapted to your experimental requirements, by applying our expertise in spectroscopy to customize systems based on a modular and flexible platform.
In perfect synchronization with your Scanning Electron Microscope (SEM), the new modular accessory, the Cathodoluminescence Universal Extension (CLUE), is an invaluable tool for CL imaging and spectroscopy.
Cathodoluminescence Spectroscopy and Imaging Analysis
Add structural identification to microscope images
EBIC
SecondaryElectrons
Xray
Electron Beam
Auger Electrons
BackscatteredElectrons
Photons
(CL)
Conduction band (CB)
Valence band (VB)E
nerg
y
Ban
d g
apTraps
Traps Traps
Traps
e- e- e-
hν hν
hν
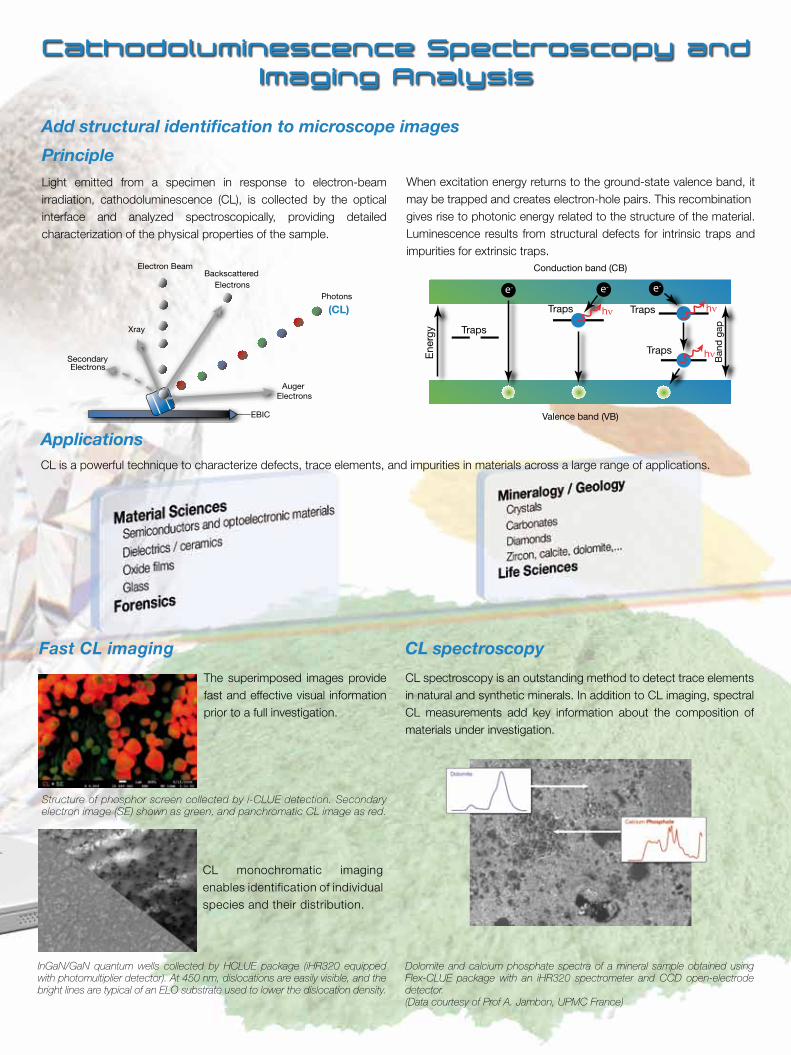
PrincipleLight emitted from a specimen in response to electron-beam irradiation, cathodoluminescence (CL), is collected by the optical interface and analyzed spectroscopically, providing detailed characterization of the physical properties of the sample.
When excitation energy returns to the ground-state valence band, it may be trapped and creates electron-hole pairs. This recombinationgives rise to photonic energy related to the structure of the material. Luminescence results from structural defects for intrinsic traps and impurities for extrinsic traps.
CL spectroscopy
CL spectroscopy is an outstanding method to detect trace elements in natural and synthetic minerals. In addition to CL imaging, spectral CL measurements add key information about the composition of materials under investigation.
Dolomite and calcium phosphate spectra of a mineral sample obtained using Flex-CLUE package with an iHR320 spectrometer and CCD open-electrode detector.(Data courtesy of Prof A. Jambon, UPMC France)
Fast CL imaging
Structure of phosphor screen collected by i-CLUE detection. Secondary electron image (SE) shown as green, and panchromatic CL image as red.
The superimposed images provide fast and effective visual information prior to a full investigation.
CL monochromatic imaging enables identification of individual species and their distribution.
InGaN/GaN quantum wells collected by HCLUE package (iHR320 equipped with photomultiplier detector). At 450 nm, dislocations are easily visible, and the bright lines are typical of an ELO substrate used to lower the dislocation density.
ApplicationsCL is a powerful technique to characterize defects, trace elements, and impurities in materials across a large range of applications.
Complete CL Solutions with Powerful Mapping Capabilities
Hyperspectral mapping
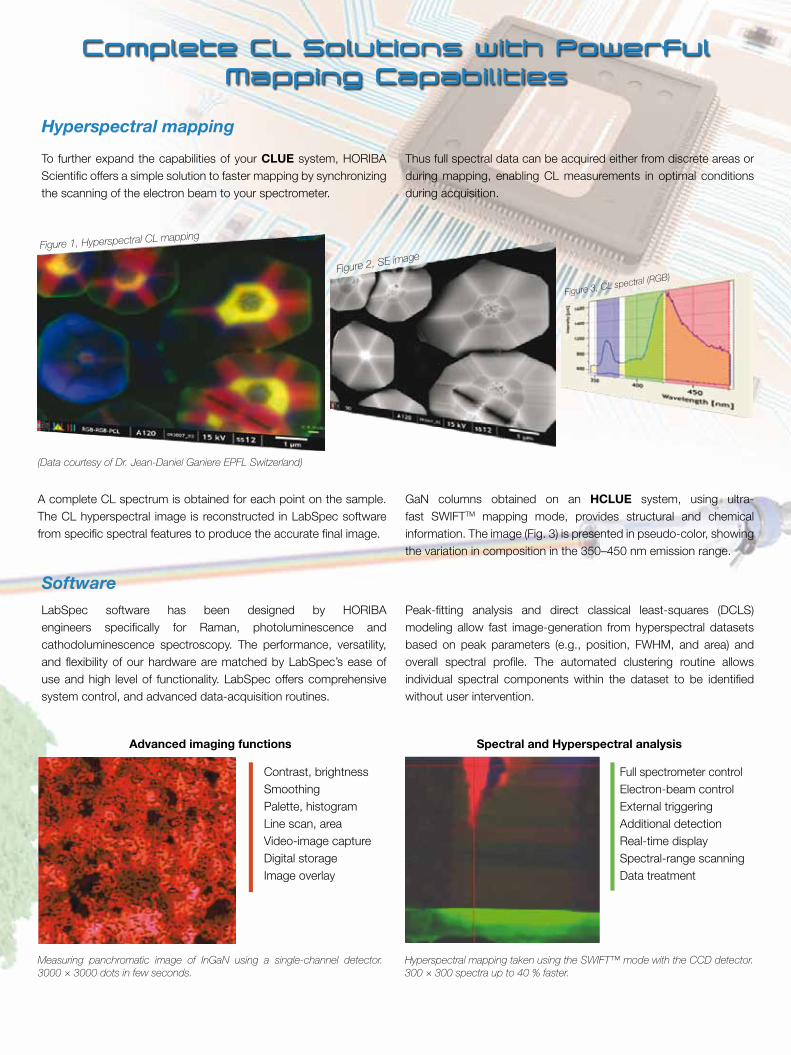
To further expand the capabilities of your CLUE system, HORIBA Scientific offers a simple solution to faster mapping by synchronizing the scanning of the electron beam to your spectrometer.
Thus full spectral data can be acquired either from discrete areas or during mapping, enabling CL measurements in optimal conditions during acquisition.
Software
Spectral and Hyperspectral analysis
Full spectrometer control Electron-beam controlExternal triggering Additional detection Real-time displaySpectral-range scanningData treatment
Hyperspectral mapping taken using the SWIFT™ mode with the CCD detector. 300 × 300 spectra up to 40 % faster.
(Data courtesy of Dr. Jean-Daniel Ganiere EPFL Switzerland)
Figure 3, CL spectral (RGB)Figure 2, SE image
Figure 1, Hyperspectral CL mapping
A complete CL spectrum is obtained for each point on the sample. The CL hyperspectral image is reconstructed in LabSpec software from specific spectral features to produce the accurate final image.
LabSpec software has been designed by HORIBA engineers specifically for Raman, photoluminescence and cathodoluminescence spectroscopy. The performance, versatility, and flexibility of our hardware are matched by LabSpec’s ease of use and high level of functionality. LabSpec offers comprehensive system control, and advanced data-acquisition routines.
GaN columns obtained on an HCLUE system, using ultra-fast SWIFTTM mapping mode, provides structural and chemical information. The image (Fig. 3) is presented in pseudo-color, showing the variation in composition in the 350–450 nm emission range.
Peak-fitting analysis and direct classical least-squares (DCLS) modeling allow fast image-generation from hyperspectral datasets based on peak parameters (e.g., position, FWHM, and area) and overall spectral profile. The automated clustering routine allows individual spectral components within the dataset to be identified without user intervention.
Advanced imaging functions
Contrast, brightnessSmoothingPalette, histogramLine scan, areaVideo-image capture Digital storageImage overlay
Measuring panchromatic image of InGaN using a single-channel detector. 3000 × 3000 dots in few seconds.

Add CLUE to your SEM
Designed for your SEM and application
Flexible spectral CL analysisBy separating the spectroscopic systems and CL-collector section, the CLUE series provides high flexibility, ensuring compatibility with various types of SEMs. In an environment of limited size, the spectrometer is coupled to the collecting optics via a fiber-optic cable. For extended capabilities, a mirror-based coupling is available, perfect for multi-spectrometer and/or multi-detector systems, thereby optimizing the efficiency over the various spectral regions of interest.
High-efficiency CL signal-collection
The customized CL-collecting system uses a diamond-turned parabolic mirror designed with optimal optical properties, e.g., wide solid angle of collection for maximum photon-capture and specific optical coatings to enhance the efficiency at your working wavelengths. The mechanical interface is adapted for large-specimen chambers, and is fully adjustable and retractable under vacuum.
Please check with your local representative for compatibility with your SEM.
The CLUE family offers dedicated CL systems for imaging and spectroscopic analysis suitable for most SEMs. In addition, when combined with other techniques such as EBIC or EDS, CLUE adds enhanced analytical capabilities to SEMs, by keeping the sample in the same spot while performing these techniques.
The modular and flexible design of the CLUE systems provides optimal CL performance for a wide range of applications, with each component configured to satisfy most rigorous experimental requirements. It also makes upgrading the system easy by adding components to the existing CL-collecting interface.
Maintains original SEM functionality
In a CL experiment, the specimen is excited by an energetic electron beam from the SEM. The emitted light is collected by a parabolic mirror installed under the electron beam. The original functionality of the SEM is maintained, for the mirror is fully retractable.
Features
Find us at www.horiba.com/scientific or telephoneFrance : +33 (0)1 64 54 13 00 USA : +1 732 549 5125 Brazil : +5511 5545 1540Germany : +49 (0)89 46 23 17-0 UK : +44 (0)20 8204 8142 Spain : +34 91 490 23 34China : +86 (0)10 8567 9966 Japan : +81 (0)3 3861 8231 Italy : +39 0 2 5760 3050Other Countries : +33 (0)1 64 54 13 00
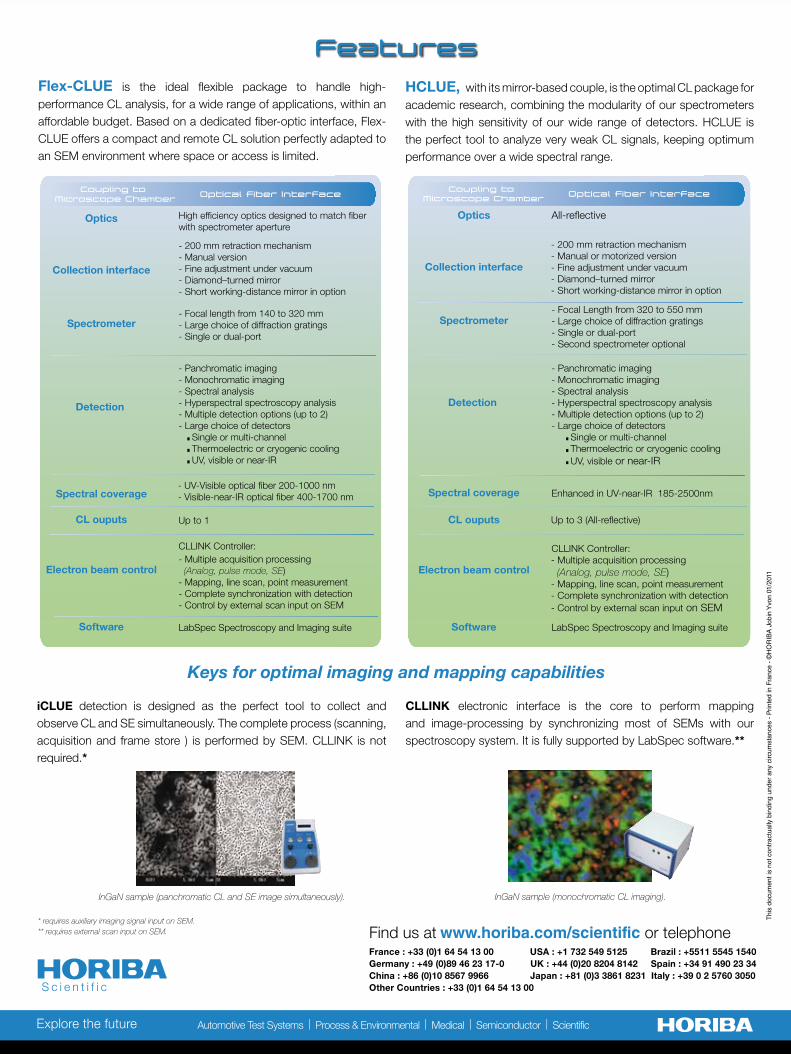
Flex-CLUE is the ideal flexible package to handle high-performance CL analysis, for a wide range of applications, within an affordable budget. Based on a dedicated fiber-optic interface, Flex-CLUE offers a compact and remote CL solution perfectly adapted to an SEM environment where space or access is limited.
HCLUE, with its mirror-based couple, is the optimal CL package for academic research, combining the modularity of our spectrometers with the high sensitivity of our wide range of detectors. HCLUE is the perfect tool to analyze very weak CL signals, keeping optimum performance over a wide spectral range.
Coupling to Microscope Chamber
Optical fiber Interface
Optics
Collection interface
Spectrometer
Detection
Spectral coverage
CL ouputs
Electron beam control
Software
High ef�ciency optics designed to match �ber with spectrometer aperture
- 200 mm retraction mechanism- Manual version - Fine adjustment under vacuum- Diamond–turned mirror- Short working-distance mirror in option
- Focal length from 140 to 320 mm - Large choice of diffraction gratings- Single or dual-port
- UV-Visible optical �ber 200-1000 nm - Visible-near-IR optical �ber 400-1700 nm
LabSpec Spectroscopy and Imaging suite
Up to 1
- Panchromatic imaging- Monochromatic imaging - Spectral analysis- Hyperspectral spectroscopy analysis- Multiple detection options (up to 2)- Large choice of detectors Single or multi-channel Thermoelectric or cryogenic cooling UV, visible or near-IR
- Multiple acquisition processing (Analog, pulse mode, SE)- Mapping, line scan, point measurement- Complete synchronization with detection- Control by external scan input on SEM
CLLINK Controller:
Coupling to Microscope Chamber
Optical fiber Interface
All-re�ective
- Focal Length from 320 to 550 mm - Large choice of diffraction gratings- Single or dual-port - Second spectrometer optional
Enhanced in UV-near-IR 185-2500nm
LabSpec Spectroscopy and Imaging suite
Up to 3 (All-re�ective)
- Panchromatic imaging- Monochromatic imaging - Spectral analysis- Hyperspectral spectroscopy analysis- Multiple detection options (up to 2)- Large choice of detectors Single or multi-channel Thermoelectric or cryogenic cooling UV, visible or near-IR
- 200 mm retraction mechanism- Manual or motorized version- Fine adjustment under vacuum- Diamond–turned mirror- Short working-distance mirror in option
- Multiple acquisition processing (Analog, pulse mode, SE)- Mapping, line scan, point measurement- Complete synchronization with detection- Control by external scan input on SEM
CLLINK Controller:
Optics
Collection interface
Spectrometer
Detection
Spectral coverage
CL ouputs
Electron beam control
Software
Explore the future Automotive Test Systems | Process & Environmental | Medical | Semiconductor | Scientific
Keys for optimal imaging and mapping capabilities
* requires auxiliary imaging signal input on SEM. ** requires external scan input on SEM.
iCLUE detection is designed as the perfect tool to collect and observe CL and SE simultaneously. The complete process (scanning, acquisition and frame store ) is performed by SEM. CLLINK is not required.*
CLLINK electronic interface is the core to perform mapping and image-processing by synchronizing most of SEMs with our spectroscopy system. It is fully supported by LabSpec software.**
InGaN sample (monochromatic CL imaging).InGaN sample (panchromatic CL and SE image simultaneously).
Thi
s do
cum
ent i
s no
t con
trac
tual
ly b
indi
ng u
nder
any
circ
umst
ance
s -
Prin
ted
in F
ranc
e -
©H
OR
IBA
Job
in Y
von
01/2
011
Related Documents