Solid Earth, 5, 1011–1026, 2014 www.solid-earth.net/5/1011/2014/ doi:10.5194/se-5-1011-2014 © Author(s) 2014. CC Attribution 3.0 License. Asymmetry of high-velocity lower crust on the South Atlantic rifted margins and implications for the interplay of magmatism and tectonics in continental breakup K. Becker 1 , D. Franke 1 , R. Trumbull 2 , M. Schnabel 1 , I. Heyde 1 , B. Schreckenberger 1 , H. Koopmann 1 , K. Bauer 2 , W. Jokat 3 , and C. M. Krawczyk 4 1 Federal Institute for Geosciences and Natural Resources (BGR), Hannover, Germany 2 German Research Centre for Geosciences (GFZ), Potsdam, Germany 3 Alfred Wegener Institute (AWI), Bremen, Germany 4 Leibniz Institute für Applied Geophysics (LIAG), Hannover, Germany Correspondence to: K. Becker ([email protected]) Received: 7 May 2014 – Published in Solid Earth Discuss.: 10 June 2014 Revised: 29 August 2014 – Accepted: 2 September 2014 – Published: 2 October 2014 Abstract. High-velocity lower crust (HVLC) and seaward- dipping reflector (SDR) sequences are typical features of volcanic rifted margins. However, the nature and origin of HVLC is under discussion. Here we provide a comprehen- sive analysis of deep crustal structures in the southern seg- ment of the South Atlantic and an assessment of HVLC along the margins. Two new seismic refraction lines off South America fill a gap in the data coverage and together with five existing velocity models allow for a detailed in- vestigation of the lower crustal properties on both margins. An important finding is the major asymmetry in volumes of HVLC on the conjugate margins. The seismic refraction lines across the South African margin reveal cross-sectional areas of HVLC 4 times larger than at the South American mar- gin, a finding that is opposite to the asymmetric distribution of the flood basalts in the Paraná–Etendeka Large Igneous Province. Also, the position of the HVLC with respect to the SDR sequences varies consistently along both margins. Close to the Falkland–Agulhas Fracture Zone in the south, a small body of HVLC is not accompanied by SDRs. In the central portion of both margins, the HVLC is below the in- ner SDR wedges while in the northern area, closer to the Rio Grande Rise-Walvis Ridge, large volumes of HVLC extend far seaward of the inner SDRs. This challenges the concept of a simple extrusive/intrusive relationship between SDR sequences and HVLC, and it pro- vides evidence for formation of the HVLC at different times during the rifting and breakup process. We suggest that the drastically different HVLC volumes are caused by asymmet- ric rifting in a simple-shear-dominated extension. 1 Introduction A lower crustal zone with high density and high seis- mic P -wave velocity is part of the magmatic “trinity” that characterizes volcanic rifted margins: continental flood basalts, seaward-dipping reflector (SDR) sequences and high-velocity lower crust (HVLC) (e.g., Menzies et al., 2002; White et al., 1987; Talwani and Abreu, 2000). There is no set definition for “high velocity” in this context, but here we use a cutoff value of 7 km s -1 as “normal”, based on the Vp values of unaltered gabbroic oceanic crust (layer 3: 6.8–7.1 km s -1 after Mooney et al., 1998). Thus, the HVLC has a P -wave velocity (and density) greater than that of typical oceanic lower crust. In general, HVLC at volcanic rifted margins is thought to represent magmatic (gabbroic) intrusions and related cumulate layers (Farne- tani et al., 1996; Furlong and Fountain, 1986; Kelemen and Holbrook, 1995; White and McKenzie, 1989; Thybo and Artemieva, 2013). Alternatively, HVLC may represent ser- pentinized peridotite (O’Reilly et al., 1996) or dense meta- morphic rocks (Gernigon et al., 2004; Mjelde et al., 2013). Published by Copernicus Publications on behalf of the European Geosciences Union.

Welcome message from author
This document is posted to help you gain knowledge. Please leave a comment to let me know what you think about it! Share it to your friends and learn new things together.
Transcript
Solid Earth, 5, 1011–1026, 2014www.solid-earth.net/5/1011/2014/doi:10.5194/se-5-1011-2014© Author(s) 2014. CC Attribution 3.0 License.
Asymmetry of high-velocity lower crust on the South Atlantic riftedmargins and implications for the interplay of magmatism andtectonics in continental breakup
K. Becker1, D. Franke1, R. Trumbull 2, M. Schnabel1, I. Heyde1, B. Schreckenberger1, H. Koopmann1, K. Bauer2,W. Jokat3, and C. M. Krawczyk4
1Federal Institute for Geosciences and Natural Resources (BGR), Hannover, Germany2German Research Centre for Geosciences (GFZ), Potsdam, Germany3Alfred Wegener Institute (AWI), Bremen, Germany4Leibniz Institute für Applied Geophysics (LIAG), Hannover, Germany
Correspondence to:K. Becker ([email protected])
Received: 7 May 2014 – Published in Solid Earth Discuss.: 10 June 2014Revised: 29 August 2014 – Accepted: 2 September 2014 – Published: 2 October 2014
Abstract. High-velocity lower crust (HVLC) and seaward-dipping reflector (SDR) sequences are typical features ofvolcanic rifted margins. However, the nature and origin ofHVLC is under discussion. Here we provide a comprehen-sive analysis of deep crustal structures in the southern seg-ment of the South Atlantic and an assessment of HVLCalong the margins. Two new seismic refraction lines offSouth America fill a gap in the data coverage and togetherwith five existing velocity models allow for a detailed in-vestigation of the lower crustal properties on both margins.An important finding is the major asymmetry in volumes ofHVLC on the conjugate margins. The seismic refraction linesacross the South African margin reveal cross-sectional areasof HVLC 4 times larger than at the South American mar-gin, a finding that is opposite to the asymmetric distributionof the flood basalts in the Paraná–Etendeka Large IgneousProvince. Also, the position of the HVLC with respect tothe SDR sequences varies consistently along both margins.Close to the Falkland–Agulhas Fracture Zone in the south,a small body of HVLC is not accompanied by SDRs. In thecentral portion of both margins, the HVLC is below the in-ner SDR wedges while in the northern area, closer to the RioGrande Rise-Walvis Ridge, large volumes of HVLC extendfar seaward of the inner SDRs.
This challenges the concept of a simple extrusive/intrusiverelationship between SDR sequences and HVLC, and it pro-vides evidence for formation of the HVLC at different times
during the rifting and breakup process. We suggest that thedrastically different HVLC volumes are caused by asymmet-ric rifting in a simple-shear-dominated extension.
1 Introduction
A lower crustal zone with high density and high seis-mic P -wave velocity is part of the magmatic “trinity”that characterizes volcanic rifted margins: continental floodbasalts, seaward-dipping reflector (SDR) sequences andhigh-velocity lower crust (HVLC) (e.g., Menzies et al., 2002;White et al., 1987; Talwani and Abreu, 2000). There is noset definition for “high velocity” in this context, but herewe use a cutoff value of 7 km s−1 as “normal”, based onthe Vp values of unaltered gabbroic oceanic crust (layer3: 6.8–7.1 km s−1 after Mooney et al., 1998). Thus, theHVLC has aP -wave velocity (and density) greater thanthat of typical oceanic lower crust. In general, HVLC atvolcanic rifted margins is thought to represent magmatic(gabbroic) intrusions and related cumulate layers (Farne-tani et al., 1996; Furlong and Fountain, 1986; Kelemen andHolbrook, 1995; White and McKenzie, 1989; Thybo andArtemieva, 2013). Alternatively, HVLC may represent ser-pentinized peridotite (O’Reilly et al., 1996) or dense meta-morphic rocks (Gernigon et al., 2004; Mjelde et al., 2013).
Published by Copernicus Publications on behalf of the European Geosciences Union.
1012 K. Becker et al.: Asymmetry of high-velocity lower crust on the South Atlantic
The lower continental crust of cratons or shields may havevelocities exceeding 7 km s−1 (Rudnick and Fountain, 1995).
A common assumption describes a close spatial relation-ship between the SDRs and HVLC, whereby the HVLC rep-resents intrusive equivalents of the erupted lavas which formthe SDRs (White et al., 2008; White and Smith, 2009; Blaichet al., 2009). HVLC can make up a large part of the totalmagmatic output along volcanic rifted margins, and as stud-ies in the North Atlantic have shown, variations in size andphysical properties of the HVLC in these settings hold im-portant clues to mantle melting scenarios (Fernàndez et al.,2010; Kelemen and Holbrook, 1995; Korenaga et al., 2002;Ridley and Richards, 2010; Voss et al., 2009; White et al.,2008). Alternatively, it might be speculated that portions ofthe HVLC form postrift (Franke, 2013).
The presence of HVLC bodies along the South Atlanticrifted margins is well established from seismic and gravitystudies (e.g., Bauer et al., 2000; Blaich et al., 2011; Franke,2013; Franke et al., 2010; Maystrenko et al., 2013; Schnabelet al., 2008), but they have not yet been studied for areal ex-tent and rifting process determination. That is the purposeof the study reported here. We provide seismic velocity andgravity models for two new margin profiles in South Amer-ica and integrate them with five others into a regional inter-pretation of breakup and magmatism in the South Atlantic.The emphasis is on variations in the size andP -wave ve-locities of the HVLC along the South American and Africanmargins, and on their distribution relative to the SDRs. Wedemonstrate a much stronger development of HVLC bod-ies on the African margin than on the conjugate margin ofSouth America, whereas the distribution of surface volcan-ism in the Paraná–Etendeka flood basalt province shows ex-actly the opposite sense of asymmetry. The development ofSDR sequences is roughly symmetrical, and there are vari-ations in the relative position of HVLC bodies with respectto the SDRs which question a simple intrusive vs. extrusiverelationship and have implications for the timing of HVLCformation relative to rifting and breakup.
2 Geologic framework
For the interpretation of the origin of HVLC on the conjugatemargins of the South Atlantic (in Sect. 5.1), it is useful tosummarize the onshore geology of the continental crust. Thecoastal zone on both margins is underlain by Neoprotero-zoic mobile belts and/or Paleozoic fold belts which borderolder cratonic provinces farther inland (see Frimmel et al.,2011, for a review). On the South American margin, the Neo-proterozoic crust at the Atlantic margin is part of the DomFeliciano Belt, which separates the inland Rio de la PlataCraton from the coast. Much of the Dom Feliciano Belt iscomposed of intermediate meta-igneous rocks that representa magmatic arc which was accreted to the inland basementterranes (Frimmel et al., 2011). Seismic line 1 crosses the
Neoproterozoic arc terrane on the Uruguay margin, whereaslines 2 and 3 cross the broad Argentine continental shelf ator south of the Colorado transform fault, an area whose base-ment geology is buried by younger rocks.
On the conjugate margin of South Africa, the coastalzone is underlain by the Neoproterozoic Kaoko, Damara andGariep belts (from north to south, respectively). These arebordered on the east by older, Mesoproterozoic metamorphicunits of the Namaqua–Natal Mobile Belt and, still farther in-land, by the Kalahari Craton. On the southern end of the mar-gin the Neoproterozoic rocks are overthrust by mainly Paleo-zoic sedimentary rocks of the Cape Fold Belt, which resultedfrom northward-directed convergence in Permian and Car-boniferous times. With respect to these basement features,the onshore parts of seismic lines 4 and 5 lie within theDamara Belt, whereas lines 6 and 7 cross the Gariep Beltat the coast and extend into the Namaqua-Natal Mobile Beltto the east. The seismic traverse across the southern marginof Africa (Stankiewicz et al., 2008) crosses the Cape FoldBelt and extends into the Namaqua–Natal Mobile Belt to thenorth (line 8 in Fig. 1).
The key point about the regional geology of the South At-lantic margins is that the zones of HVLC detected by geo-physics are located beneath the current coastline or fartherseaward, so only the Neoproterozoic belts near the marginsare potentially relevant for explaining the crustal velocities.None of the seismic traverses on either margin extend inlandas far as the cratons.
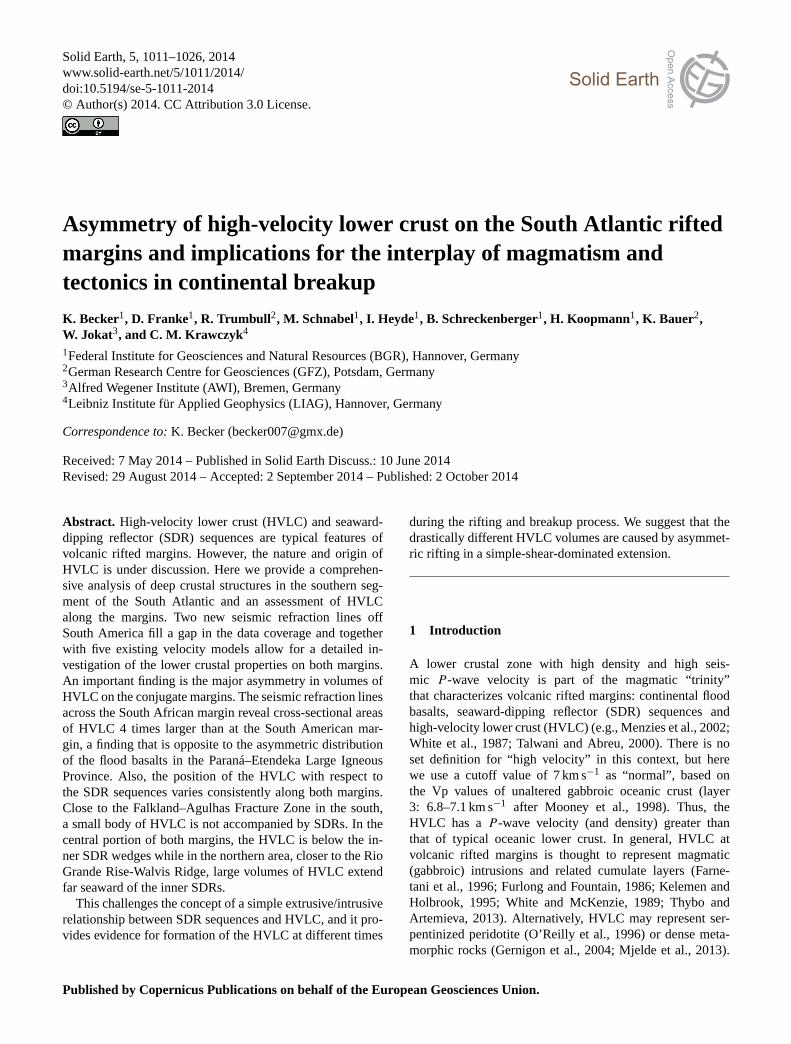
The South Atlantic Ocean formed as a consequence of thebreakup of Western Gondwana in Early Cretaceous times(ca. 140–130 Ma). South of the Walvis Ridge–Rio GrandeRise, the volcanic trail generated by the mantle plume Tris-tan da Cunha, most of the continental margins of the SouthAtlantic are of the typical volcanic rifted type, with well-developed SDR wedges and HVLC bodies mentioned above.However, the nature of the margins changes abruptly be-yond these limits. North of the Walvis Ridge–Rio GrandeRise, the margin architecture resembles the end member ofa magma-poor margin (Mohriak and Leroy, 2012). HVLCat the West African Angolan margin thus was interpreted asbeing likely unrelated to breakup (Contrucci et al., 2004).Still another style of margin occurs at the Falkland–AgulhasFracture Zone (FAFZ) in the south (Fig. 1), where the SouthAtlantic rifting likely was accommodated by strike-slip dis-placement to form a margin that is lacking SDRs and othersigns of magmatism (Becker et al., 2012; Franke et al., 2007;Koopmann et al., 2014a).
In contrast to the rifted volcanic margins in the North At-lantic, the geology and spreading history of the South At-lantic (between the FAFZ and the Walvis Ridge–Rio GrandeRise) is comparatively simple. There are no major ridgejumps as found in the Greenland–Iceland Ridge, and theopposing continental margins have a broadly similar geo-logic history. The margins of East Greenland and Norway areshaped by the Caledonian orogen, post-Caledonian basins
Solid Earth, 5, 1011–1026, 2014 www.solid-earth.net/5/1011/2014/
K. Becker et al.: Asymmetry of high-velocity lower crust on the South Atlantic 1013
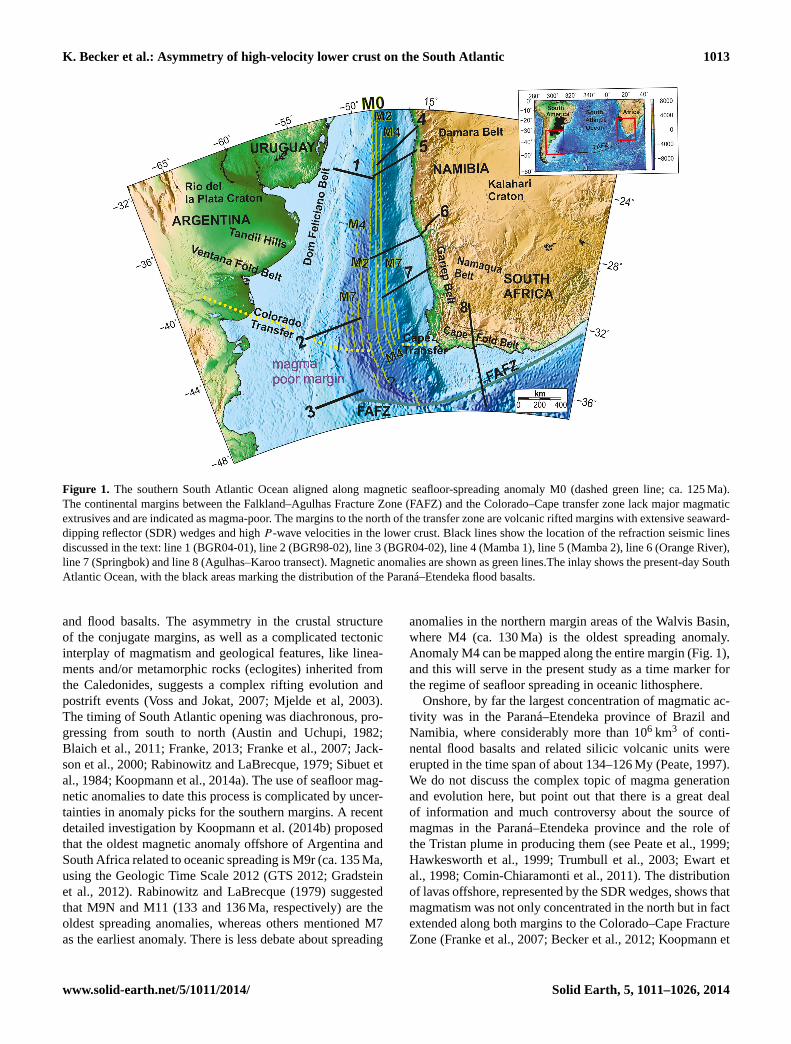
Figure 1. The southern South Atlantic Ocean aligned along magnetic seafloor-spreading anomaly M0 (dashed green line; ca. 125 Ma).The continental margins between the Falkland–Agulhas Fracture Zone (FAFZ) and the Colorado–Cape transfer zone lack major magmaticextrusives and are indicated as magma-poor. The margins to the north of the transfer zone are volcanic rifted margins with extensive seaward-dipping reflector (SDR) wedges and highP -wave velocities in the lower crust. Black lines show the location of the refraction seismic linesdiscussed in the text: line 1 (BGR04-01), line 2 (BGR98-02), line 3 (BGR04-02), line 4 (Mamba 1), line 5 (Mamba 2), line 6 (Orange River),line 7 (Springbok) and line 8 (Agulhas–Karoo transect). Magnetic anomalies are shown as green lines.The inlay shows the present-day SouthAtlantic Ocean, with the black areas marking the distribution of the Paraná–Etendeka flood basalts.
and flood basalts. The asymmetry in the crustal structureof the conjugate margins, as well as a complicated tectonicinterplay of magmatism and geological features, like linea-ments and/or metamorphic rocks (eclogites) inherited fromthe Caledonides, suggests a complex rifting evolution andpostrift events (Voss and Jokat, 2007; Mjelde et al, 2003).The timing of South Atlantic opening was diachronous, pro-gressing from south to north (Austin and Uchupi, 1982;Blaich et al., 2011; Franke, 2013; Franke et al., 2007; Jack-son et al., 2000; Rabinowitz and LaBrecque, 1979; Sibuet etal., 1984; Koopmann et al., 2014a). The use of seafloor mag-netic anomalies to date this process is complicated by uncer-tainties in anomaly picks for the southern margins. A recentdetailed investigation by Koopmann et al. (2014b) proposedthat the oldest magnetic anomaly offshore of Argentina andSouth Africa related to oceanic spreading is M9r (ca. 135 Ma,using the Geologic Time Scale 2012 (GTS 2012; Gradsteinet al., 2012). Rabinowitz and LaBrecque (1979) suggestedthat M9N and M11 (133 and 136 Ma, respectively) are theoldest spreading anomalies, whereas others mentioned M7as the earliest anomaly. There is less debate about spreading
anomalies in the northern margin areas of the Walvis Basin,where M4 (ca. 130 Ma) is the oldest spreading anomaly.Anomaly M4 can be mapped along the entire margin (Fig. 1),and this will serve in the present study as a time marker forthe regime of seafloor spreading in oceanic lithosphere.
Onshore, by far the largest concentration of magmatic ac-tivity was in the Paraná–Etendeka province of Brazil andNamibia, where considerably more than 106 km3 of conti-nental flood basalts and related silicic volcanic units wereerupted in the time span of about 134–126 My (Peate, 1997).We do not discuss the complex topic of magma generationand evolution here, but point out that there is a great dealof information and much controversy about the source ofmagmas in the Paraná–Etendeka province and the role ofthe Tristan plume in producing them (see Peate et al., 1999;Hawkesworth et al., 1999; Trumbull et al., 2003; Ewart etal., 1998; Comin-Chiaramonti et al., 2011). The distributionof lavas offshore, represented by the SDR wedges, shows thatmagmatism was not only concentrated in the north but in factextended along both margins to the Colorado–Cape FractureZone (Franke et al., 2007; Becker et al., 2012; Koopmann et
www.solid-earth.net/5/1011/2014/ Solid Earth, 5, 1011–1026, 2014
1014 K. Becker et al.: Asymmetry of high-velocity lower crust on the South Atlantic
al., 2014; Gladczenko et al., 1997) (Fig. 1). On the SouthAfrican margin onshore, mafic dikes of breakup age occur asfar south as Cape Town. A comparative geochemical studyof mafic dikes along the African margin (Trumbull et al.,2007) demonstrated a north–south decrease in crystalliza-tion temperatures by about 150◦C, which is important whendiscussing the variations and possible origin of HVLC ina later section. Finally, widespread but sporadic magmaticactivity continued well after breakup (80 Ma and younger)in southern Africa and Brazil (Gibson et al., 1995; Comin-Chiaramonti et al., 2011). The most common expression ofthis are alkaline intrusions, which are locally numerous (e.g.,kimberlite fields) but involve much smaller volumes com-pared with the Early Cretaceous activity.
3 Geophysical coverage
3.1 Existing profiles and interpretation
The upper crustal structure on both margins is well con-strained by multichannel reflection seismic data, and this hasbeen used for mapping the distribution of SDRs and theirsegmentation along the margins (e.g., Bauer et al., 2000;Franke et al., 2007; Koopmann et al., 2014a; Gladczenkoet al., 1998). In contrast to the reasonable spatial coverageof seismic reflection data, wide-angle seismic lines are few,especially on the South American margin, which motivatedthe new studies reported below. To some extent, gaps in theseismic coverage can be compensated for by regional gravityinterpretations (e.g., Blaich et al., 2009, 2011; Dragoi-Stavarand Hall, 2009; Maystrenko et al., 2013; Franke et al., 2006;Hirsch et al., 2009).
Prior to this study, five velocity profiles were availablefrom wide-angle seismic studies and four of them are onthe African margin (Fig. 1). Bauer et al. (2000) presentedseismic velocity and gravity models for two seismic refrac-tion traverses of the Namibian margin at 22–24◦ S (Fig. 1,lines 4 and 5), which show thick bodies of HVLC beneath abroad zone of SDRs (inner wedge, flat-lying flows and outerwedge). The third seismic traverse on this margin crossesthe Namibian coastline near Orange River (Fig. 1, line 6)(Schinkel, 2006). The fourth traverse is located at about 30◦ S(Fig. 1, line 7) and the seismic velocity profile derived byHirsch et al. (2009) shows a well-developed body of HVLCbelow SDRs. Finally, it is worth mentioning for referencethat Stankiewicz et al. (2008) published a seismic velocityprofile (Fig. 1, line 8) across the sheared South African mar-gin east of the Cape Peninsula in South Africa. This seismicprofile across the FAFZ shows no evidence of magmatic fea-tures at the continent–ocean boundary, but there are smallHVLC bodies well inland, which Stankiewicz et al. (2008)attributed to igneous crust formed during the 180 Ma Karooevent, but may also be interpreted as high-density metamor-
phic rocks (garnet amphibolite, mafic granulite) in the conti-nental basement (as in Norway; see Gernigon et al., 2006).
On the South American margin, Schnabel et al. (2008)identified HVLC underlying SDRs along a traverse of theArgentina margin at latitude 44◦ S (Fig. 1 line 2). They in-terpreted this HVLC as magmatic underplating at the Mohowith intruded lower crust above.
3.2 New profiles
3.2.1 Seismic velocity
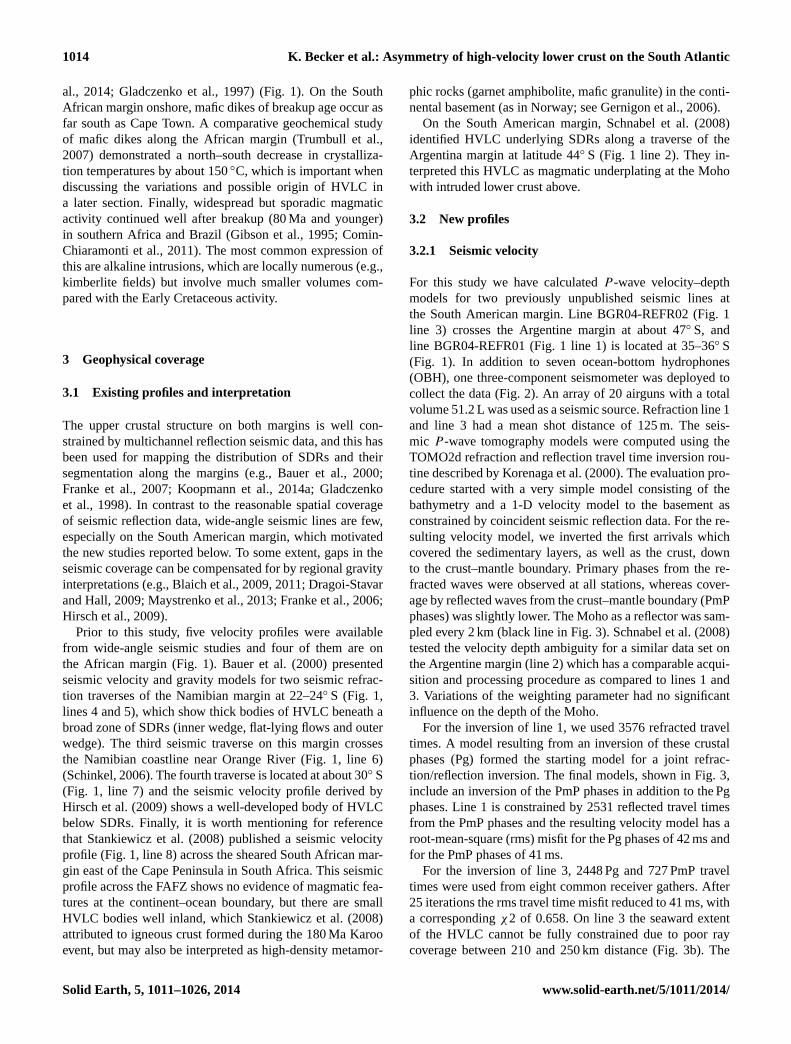
For this study we have calculatedP -wave velocity–depthmodels for two previously unpublished seismic lines atthe South American margin. Line BGR04-REFR02 (Fig. 1line 3) crosses the Argentine margin at about 47◦ S, andline BGR04-REFR01 (Fig. 1 line 1) is located at 35–36◦ S(Fig. 1). In addition to seven ocean-bottom hydrophones(OBH), one three-component seismometer was deployed tocollect the data (Fig. 2). An array of 20 airguns with a totalvolume 51.2 L was used as a seismic source. Refraction line 1and line 3 had a mean shot distance of 125 m. The seis-mic P -wave tomography models were computed using theTOMO2d refraction and reflection travel time inversion rou-tine described by Korenaga et al. (2000). The evaluation pro-cedure started with a very simple model consisting of thebathymetry and a 1-D velocity model to the basement asconstrained by coincident seismic reflection data. For the re-sulting velocity model, we inverted the first arrivals whichcovered the sedimentary layers, as well as the crust, downto the crust–mantle boundary. Primary phases from the re-fracted waves were observed at all stations, whereas cover-age by reflected waves from the crust–mantle boundary (PmPphases) was slightly lower. The Moho as a reflector was sam-pled every 2 km (black line in Fig. 3). Schnabel et al. (2008)tested the velocity depth ambiguity for a similar data set onthe Argentine margin (line 2) which has a comparable acqui-sition and processing procedure as compared to lines 1 and3. Variations of the weighting parameter had no significantinfluence on the depth of the Moho.
For the inversion of line 1, we used 3576 refracted traveltimes. A model resulting from an inversion of these crustalphases (Pg) formed the starting model for a joint refrac-tion/reflection inversion. The final models, shown in Fig. 3,include an inversion of the PmP phases in addition to the Pgphases. Line 1 is constrained by 2531 reflected travel timesfrom the PmP phases and the resulting velocity model has aroot-mean-square (rms) misfit for the Pg phases of 42 ms andfor the PmP phases of 41 ms.
For the inversion of line 3, 2448 Pg and 727 PmP traveltimes were used from eight common receiver gathers. After25 iterations the rms travel time misfit reduced to 41 ms, witha correspondingχ2 of 0.658. On line 3 the seaward extentof the HVLC cannot be fully constrained due to poor raycoverage between 210 and 250 km distance (Fig. 3b). The
Solid Earth, 5, 1011–1026, 2014 www.solid-earth.net/5/1011/2014/
K. Becker et al.: Asymmetry of high-velocity lower crust on the South Atlantic 1015
Figure 2. Data example for ocean-bottom hydrophones (OBHs) from line 1 (a: OBH1.5;b OBH1.2) and line 3 (c: OBH2.4;d OBH2.1). Thereduction velocity is 6 km s−1. Upper panels: seismic sections for OBHs. Middle panels: the middle panels represent the picked travel timesas gray circles and the calculated travel times as black dots for the final model. Lower panels: the lower panels show the ray coverage for thestations.
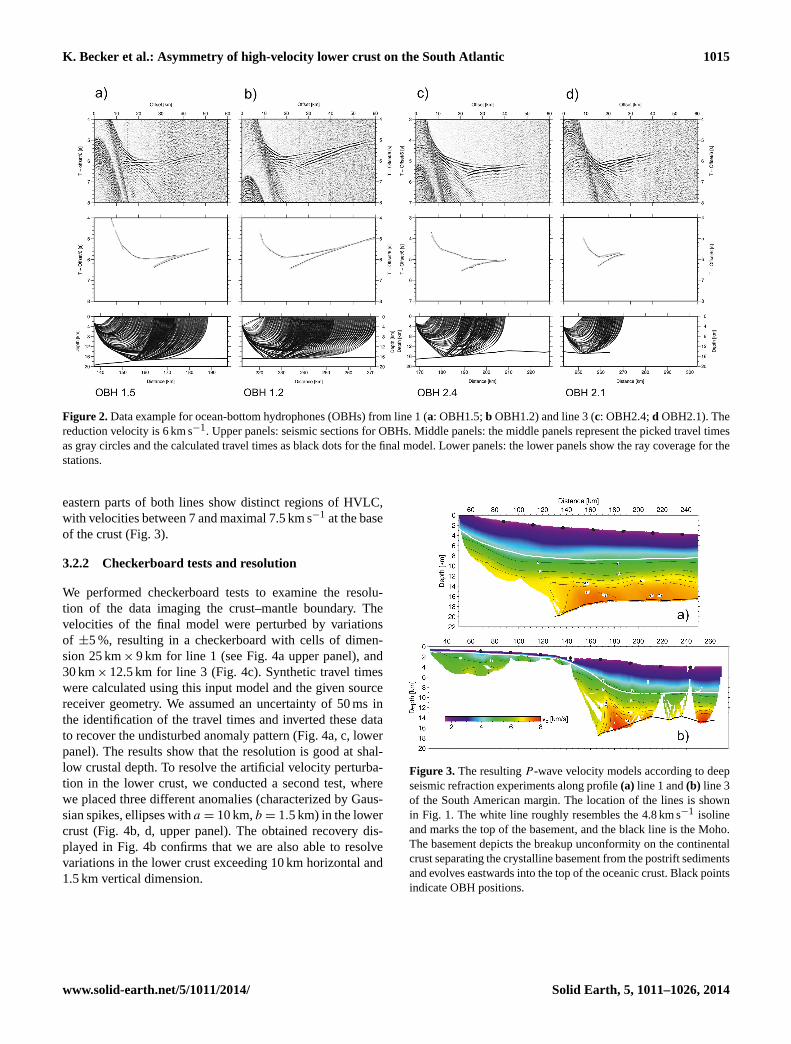
eastern parts of both lines show distinct regions of HVLC,with velocities between 7 and maximal 7.5 km s−1 at the baseof the crust (Fig. 3).
3.2.2 Checkerboard tests and resolution
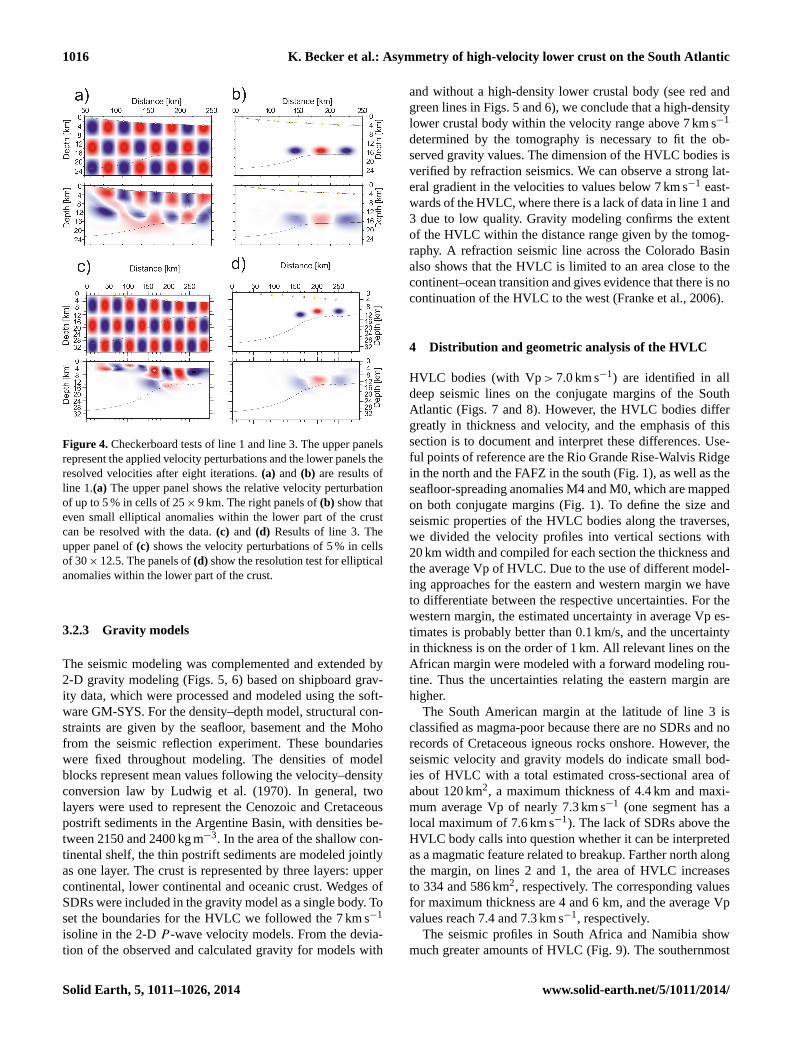
We performed checkerboard tests to examine the resolu-tion of the data imaging the crust–mantle boundary. Thevelocities of the final model were perturbed by variationsof ±5 %, resulting in a checkerboard with cells of dimen-sion 25 km× 9 km for line 1 (see Fig. 4a upper panel), and30 km× 12.5 km for line 3 (Fig. 4c). Synthetic travel timeswere calculated using this input model and the given sourcereceiver geometry. We assumed an uncertainty of 50 ms inthe identification of the travel times and inverted these datato recover the undisturbed anomaly pattern (Fig. 4a, c, lowerpanel). The results show that the resolution is good at shal-low crustal depth. To resolve the artificial velocity perturba-tion in the lower crust, we conducted a second test, wherewe placed three different anomalies (characterized by Gaus-sian spikes, ellipses witha = 10 km,b = 1.5 km) in the lowercrust (Fig. 4b, d, upper panel). The obtained recovery dis-played in Fig. 4b confirms that we are also able to resolvevariations in the lower crust exceeding 10 km horizontal and1.5 km vertical dimension.
Figure 3. The resultingP -wave velocity models according to deepseismic refraction experiments along profile(a) line 1 and(b) line 3of the South American margin. The location of the lines is shownin Fig. 1. The white line roughly resembles the 4.8 km s−1 isolineand marks the top of the basement, and the black line is the Moho.The basement depicts the breakup unconformity on the continentalcrust separating the crystalline basement from the postrift sedimentsand evolves eastwards into the top of the oceanic crust. Black pointsindicate OBH positions.
www.solid-earth.net/5/1011/2014/ Solid Earth, 5, 1011–1026, 2014
1016 K. Becker et al.: Asymmetry of high-velocity lower crust on the South Atlantic
Figure 4. Checkerboard tests of line 1 and line 3. The upper panelsrepresent the applied velocity perturbations and the lower panels theresolved velocities after eight iterations.(a) and (b) are results ofline 1.(a) The upper panel shows the relative velocity perturbationof up to 5 % in cells of 25× 9 km. The right panels of(b) show thateven small elliptical anomalies within the lower part of the crustcan be resolved with the data.(c) and (d) Results of line 3. Theupper panel of(c) shows the velocity perturbations of 5 % in cellsof 30× 12.5. The panels of(d) show the resolution test for ellipticalanomalies within the lower part of the crust.
3.2.3 Gravity models
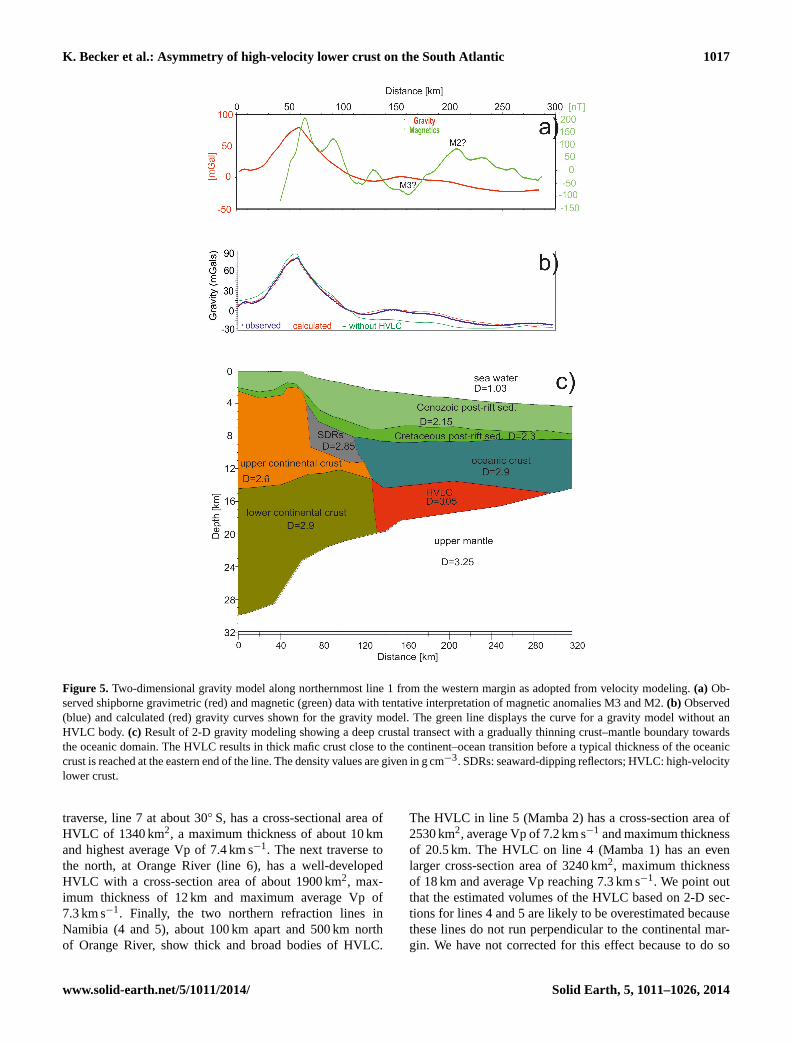
The seismic modeling was complemented and extended by2-D gravity modeling (Figs. 5, 6) based on shipboard grav-ity data, which were processed and modeled using the soft-ware GM-SYS. For the density–depth model, structural con-straints are given by the seafloor, basement and the Mohofrom the seismic reflection experiment. These boundarieswere fixed throughout modeling. The densities of modelblocks represent mean values following the velocity–densityconversion law by Ludwig et al. (1970). In general, twolayers were used to represent the Cenozoic and Cretaceouspostrift sediments in the Argentine Basin, with densities be-tween 2150 and 2400 kg m−3. In the area of the shallow con-tinental shelf, the thin postrift sediments are modeled jointlyas one layer. The crust is represented by three layers: uppercontinental, lower continental and oceanic crust. Wedges ofSDRs were included in the gravity model as a single body. Toset the boundaries for the HVLC we followed the 7 km s−1
isoline in the 2-DP -wave velocity models. From the devia-tion of the observed and calculated gravity for models with
and without a high-density lower crustal body (see red andgreen lines in Figs. 5 and 6), we conclude that a high-densitylower crustal body within the velocity range above 7 km s−1
determined by the tomography is necessary to fit the ob-served gravity values. The dimension of the HVLC bodies isverified by refraction seismics. We can observe a strong lat-eral gradient in the velocities to values below 7 km s−1 east-wards of the HVLC, where there is a lack of data in line 1 and3 due to low quality. Gravity modeling confirms the extentof the HVLC within the distance range given by the tomog-raphy. A refraction seismic line across the Colorado Basinalso shows that the HVLC is limited to an area close to thecontinent–ocean transition and gives evidence that there is nocontinuation of the HVLC to the west (Franke et al., 2006).
4 Distribution and geometric analysis of the HVLC
HVLC bodies (with Vp> 7.0 km s−1) are identified in alldeep seismic lines on the conjugate margins of the SouthAtlantic (Figs. 7 and 8). However, the HVLC bodies differgreatly in thickness and velocity, and the emphasis of thissection is to document and interpret these differences. Use-ful points of reference are the Rio Grande Rise-Walvis Ridgein the north and the FAFZ in the south (Fig. 1), as well as theseafloor-spreading anomalies M4 and M0, which are mappedon both conjugate margins (Fig. 1). To define the size andseismic properties of the HVLC bodies along the traverses,we divided the velocity profiles into vertical sections with20 km width and compiled for each section the thickness andthe average Vp of HVLC. Due to the use of different model-ing approaches for the eastern and western margin we haveto differentiate between the respective uncertainties. For thewestern margin, the estimated uncertainty in average Vp es-timates is probably better than 0.1 km/s, and the uncertaintyin thickness is on the order of 1 km. All relevant lines on theAfrican margin were modeled with a forward modeling rou-tine. Thus the uncertainties relating the eastern margin arehigher.
The South American margin at the latitude of line 3 isclassified as magma-poor because there are no SDRs and norecords of Cretaceous igneous rocks onshore. However, theseismic velocity and gravity models do indicate small bod-ies of HVLC with a total estimated cross-sectional area ofabout 120 km2, a maximum thickness of 4.4 km and maxi-mum average Vp of nearly 7.3 km s−1 (one segment has alocal maximum of 7.6 km s−1). The lack of SDRs above theHVLC body calls into question whether it can be interpretedas a magmatic feature related to breakup. Farther north alongthe margin, on lines 2 and 1, the area of HVLC increasesto 334 and 586 km2, respectively. The corresponding valuesfor maximum thickness are 4 and 6 km, and the average Vpvalues reach 7.4 and 7.3 km s−1, respectively.
The seismic profiles in South Africa and Namibia showmuch greater amounts of HVLC (Fig. 9). The southernmost
Solid Earth, 5, 1011–1026, 2014 www.solid-earth.net/5/1011/2014/
K. Becker et al.: Asymmetry of high-velocity lower crust on the South Atlantic 1017
Figure 5. Two-dimensional gravity model along northernmost line 1 from the western margin as adopted from velocity modeling.(a) Ob-served shipborne gravimetric (red) and magnetic (green) data with tentative interpretation of magnetic anomalies M3 and M2.(b) Observed(blue) and calculated (red) gravity curves shown for the gravity model. The green line displays the curve for a gravity model without anHVLC body. (c) Result of 2-D gravity modeling showing a deep crustal transect with a gradually thinning crust–mantle boundary towardsthe oceanic domain. The HVLC results in thick mafic crust close to the continent–ocean transition before a typical thickness of the oceaniccrust is reached at the eastern end of the line. The density values are given in g cm−3. SDRs: seaward-dipping reflectors; HVLC: high-velocitylower crust.
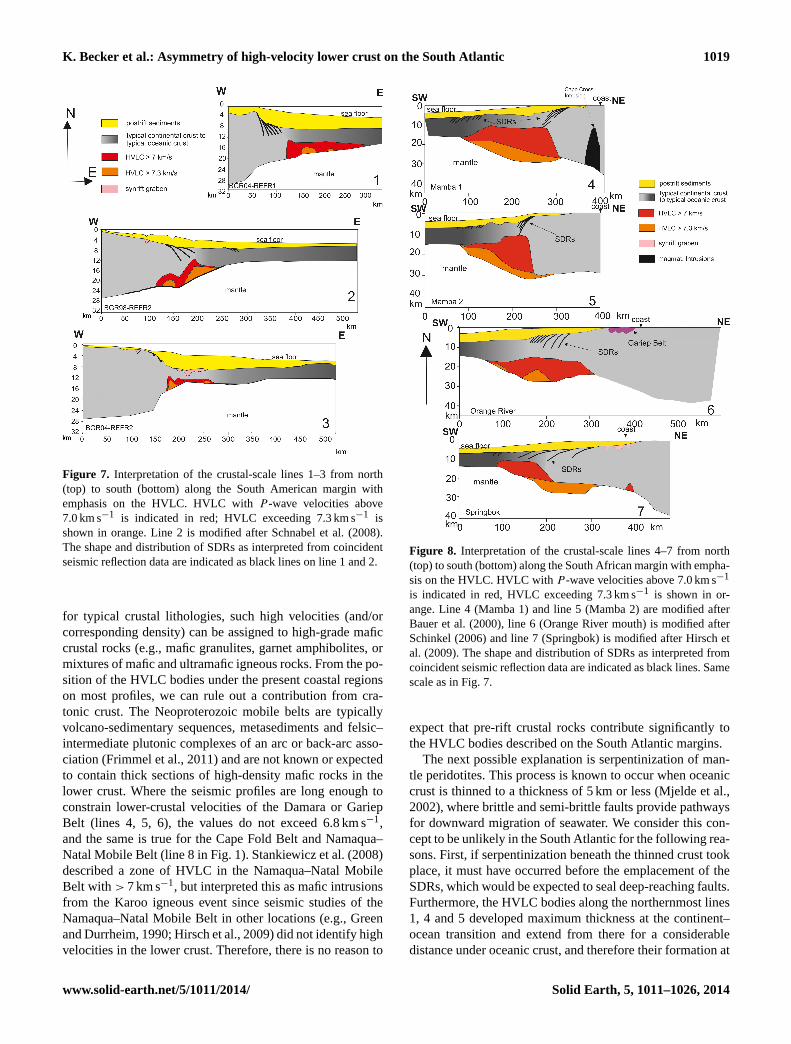
traverse, line 7 at about 30◦ S, has a cross-sectional area ofHVLC of 1340 km2, a maximum thickness of about 10 kmand highest average Vp of 7.4 km s−1. The next traverse tothe north, at Orange River (line 6), has a well-developedHVLC with a cross-section area of about 1900 km2, max-imum thickness of 12 km and maximum average Vp of7.3 km s−1. Finally, the two northern refraction lines inNamibia (4 and 5), about 100 km apart and 500 km northof Orange River, show thick and broad bodies of HVLC.
The HVLC in line 5 (Mamba 2) has a cross-section area of2530 km2, average Vp of 7.2 km s−1 and maximum thicknessof 20.5 km. The HVLC on line 4 (Mamba 1) has an evenlarger cross-section area of 3240 km2, maximum thicknessof 18 km and average Vp reaching 7.3 km s−1. We point outthat the estimated volumes of the HVLC based on 2-D sec-tions for lines 4 and 5 are likely to be overestimated becausethese lines do not run perpendicular to the continental mar-gin. We have not corrected for this effect because to do so
www.solid-earth.net/5/1011/2014/ Solid Earth, 5, 1011–1026, 2014

1018 K. Becker et al.: Asymmetry of high-velocity lower crust on the South Atlantic
Figure 6. Two-dimensional gravity model of the southernmost line 3 from the western margin as adopted from velocity modeling.(a)Observed gravimetric (red) and magnetic (green) data with interpreted magnetic anomalies M2 and M0.(b) Observed (blue) and calculated(red) gravity curves shown for the gravity model. The green line displays the curve for a gravity model without an HVLC body.(c) Resultof 2-D gravity modeling showing an abrupt thinning of the continental crust when approaching the oceanic domain. The density values aregiven in g cm−3.
requires information about the 3-D shape of the HVLC bod-ies and that is not constrained.
In summary, the HVLC bodies are 2–3 times thicker andabout 4 times larger in cross-sectional area on the Africanmargin compared to the South American margin, and thiscontrast is maintained along the entire N–S extent of the mar-gins. A striking feature of the African margin profiles is asystematic increase in the size of the HVLC from south tonorth (Fig. 9).
5 Discussion
5.1 Origin of the HVLC bodies
HVLC bodies on volcanic rifted margins are commonly in-terpreted as mafic igneous crust related to rift-induced mantlemelting, but many researchers have pointed out that there areother possibly explanations. These fall into two categories:(1) high-density metamorphic rocks at the base of the pre-rift continental crust or (2) serpentinized upper mantle.
Holbrook et al. (1992) pointed out thatP -wave velocitiesgreater than 7.0 km s−1 are found in seismic refraction stud-ies of the lower continental crust. Based on extensive data
Solid Earth, 5, 1011–1026, 2014 www.solid-earth.net/5/1011/2014/
K. Becker et al.: Asymmetry of high-velocity lower crust on the South Atlantic 1019
Figure 7. Interpretation of the crustal-scale lines 1–3 from north(top) to south (bottom) along the South American margin withemphasis on the HVLC. HVLC withP -wave velocities above7.0 km s−1 is indicated in red; HVLC exceeding 7.3 km s−1 isshown in orange. Line 2 is modified after Schnabel et al. (2008).The shape and distribution of SDRs as interpreted from coincidentseismic reflection data are indicated as black lines on line 1 and 2.
for typical crustal lithologies, such high velocities (and/orcorresponding density) can be assigned to high-grade maficcrustal rocks (e.g., mafic granulites, garnet amphibolites, ormixtures of mafic and ultramafic igneous rocks. From the po-sition of the HVLC bodies under the present coastal regionson most profiles, we can rule out a contribution from cra-tonic crust. The Neoproterozoic mobile belts are typicallyvolcano-sedimentary sequences, metasediments and felsic–intermediate plutonic complexes of an arc or back-arc asso-ciation (Frimmel et al., 2011) and are not known or expectedto contain thick sections of high-density mafic rocks in thelower crust. Where the seismic profiles are long enough toconstrain lower-crustal velocities of the Damara or GariepBelt (lines 4, 5, 6), the values do not exceed 6.8 km s−1,and the same is true for the Cape Fold Belt and Namaqua–Natal Mobile Belt (line 8 in Fig. 1). Stankiewicz et al. (2008)described a zone of HVLC in the Namaqua–Natal MobileBelt with > 7 km s−1, but interpreted this as mafic intrusionsfrom the Karoo igneous event since seismic studies of theNamaqua–Natal Mobile Belt in other locations (e.g., Greenand Durrheim, 1990; Hirsch et al., 2009) did not identify highvelocities in the lower crust. Therefore, there is no reason to
Figure 8. Interpretation of the crustal-scale lines 4–7 from north(top) to south (bottom) along the South African margin with empha-sis on the HVLC. HVLC withP -wave velocities above 7.0 km s−1
is indicated in red, HVLC exceeding 7.3 km s−1 is shown in or-ange. Line 4 (Mamba 1) and line 5 (Mamba 2) are modified afterBauer et al. (2000), line 6 (Orange River mouth) is modified afterSchinkel (2006) and line 7 (Springbok) is modified after Hirsch etal. (2009). The shape and distribution of SDRs as interpreted fromcoincident seismic reflection data are indicated as black lines. Samescale as in Fig. 7.
expect that pre-rift crustal rocks contribute significantly tothe HVLC bodies described on the South Atlantic margins.
The next possible explanation is serpentinization of man-tle peridotites. This process is known to occur when oceaniccrust is thinned to a thickness of 5 km or less (Mjelde et al.,2002), where brittle and semi-brittle faults provide pathwaysfor downward migration of seawater. We consider this con-cept to be unlikely in the South Atlantic for the following rea-sons. First, if serpentinization beneath the thinned crust tookplace, it must have occurred before the emplacement of theSDRs, which would be expected to seal deep-reaching faults.Furthermore, the HVLC bodies along the northernmost lines1, 4 and 5 developed maximum thickness at the continent–ocean transition and extend from there for a considerabledistance under oceanic crust, and therefore their formation at
www.solid-earth.net/5/1011/2014/ Solid Earth, 5, 1011–1026, 2014
1020 K. Becker et al.: Asymmetry of high-velocity lower crust on the South Atlantic
least partly postdates the emplacement of the SDRs. Third,the vertical extent of the HVLC bodies, especially on theAfrican margin, is greater than 10 km, far exceeding valuessuggested for serpentinized mantle in other studies. We find itdifficult to envision a process that could produce such thickserpentinized zones. Finally, the serpentinization model of-fers no explanation for the systematic north–south variationsin HVLC distribution that is observed and (see below) is con-sistent with an origin from mantle-derived melts.
The conjugate margins on the South Atlantic were classi-fied as volcanic because of the emplacement of the SDRs.Due to the close spatial correlation of SDRs and HVLC,a magmatic origin for the latter seems likely, with under-plating or mafic intrusions as the most probable reasons forthe anomalous velocity layer. In its original meaning, under-plating described the accumulation of magmatic material atthe base of the crust. Nowadays the term “underplating”combines both processes, i.e., mafic intrusions and under-plating (Thybo and Artemieva, 2013; Mjelde et al., 2002).Bauer et al. (2000) favor sensu stricto accreted igneous ma-terial over intrusions as an explanation for the HVLC in line 4and 5. Intrusions related to the Cretaceous Cape Cross com-plex with velocities of 6.9–7.2 km s−1 fail to explain the partof the HVLC with velocities above 7.2 km s−1 (displayed inorange in Fig. 8) and differ in shape from the HVLC bodies.It is important to note that theP -wave velocities in HVLCbodies on the northern margin segments are considerablyhigher than the value of 7.2 km s−1 which is typical for oceanlayer 3, i.e., gabbro of MORB (mid ocean ridge basalt) com-position. It has long been recognized (e.g., Keleman and Hol-brook, 1995) that the higher Vp velocities of HVLC can beexplained by magmas richer in Mg than MORB, which arethe consequence of melting at anomalously high potentialtemperature. Trumbull et al. (2002) suggested from petro-physical models that the HVLC intrusions on profiles 4 and5 have 14 to 18 wt. % MgO, consistent with melting at 150 to200◦C excess temperature compared with average MORBs.Further, a sharp vertical velocity gradient above the HVLC inline 1 may argue for underplated material against small-scaleintruded crust.
The HVLC along central lines 2, 6 and 7 extends over thetotal width of the SDRs. Previously, the HVLC was inter-preted as a combination of magmatic underplating and heav-ily intruded crust (Schnabel et al., 2008; Hirsch et al., 2009).A low-velocity gradient above the HVLC on line 2 suggestsintruded continental crust above the HVLC. Densities ex-ceeding normal crustal values argue for intruded continen-tal crust above the HVLC in the central lines 2, 6 and 7(Schinkel, 2006; Hirsch et al., 2009; Schnabel et al., 2008),which implies the HVLC being intruded crust.
If the HVLC of line 3 is magmatic material, it may be in-terpreted as an intrusion, which has not reached the surface toform SDRs. The small thickness of the HVLC makes mag-matic underplating unlikely for this section. This does notnecessarily mean the HVLC is composed of serpentinized
mantle. The HVLC occurs together with an extremely thincontinental crust and with a synrift basin above the HVLC,which may have eased water entry to serpentinize mantleperidotites. Since serpentinization is a gradual process withno clear interface (Mjelde et al., 2002), the presence of Mohoreflections at the base of the HVLC argues against the modelof serpentinized peridotites and supports, together with asharp vertical and lateral velocity gradient surrounding theHVLC, the hypothesis of an intrusive body. Based solely onseismic observations we cannot clearly decide on one hy-pothesis – magmatic intrusions or serpentinization.
5.2 Relationship of HVLC andSDR sequences
All margin profiles except line 3 from southern Argentinashow well-developed SDR wedges close to the HVLC. Pre-vious studies have demonstrated a common pattern of SDRsequences with distinctive “facies” consisting of an inner(landward) SDR wedge interpreted as subaerial lava flows,which is followed by a zone of flat SDRs and commonly anouter wedge that presumably formed in a submarine setting(Planke and Eldholm, 1994). The generation of the SDRsis assumed to be restricted to the breakup process and liesclose to the continent–ocean boundary (Mutter, 1985; Hinz,1981). Astonishingly, there is a distinct seaward shift of theHVLC relative to the SDRs. While in the south the HVLCis situated below the SDRs, towards the north the HVLCformed seaward of the SDRs. The contrast in their distribu-tion across the conjugate Atlantic margins, nearly symmetri-cally SDRs (Koopmann et al., 2014b) against asymmetricallyHVLC, questions a simple intrusive vs. extrusive relationshipbetween them. The formation of the HVLC bodies seems tobe more complex than merely a breakup-related feature. Thisis indicated by the 2-fold HVLC as found along line 2, whichcould be explained by a formation during different stages ofthe rifting and breakup. From the position of HVLC bodiesrelative to the SDRs, we try to infer the approximate timingof the HVLC emplacement.
The HVLC of the southernmost line 3 was found in con-tinental crust in an SDR-free, magma-limited environment.This challenges the intrinsic relationship between SDRs andHVLC. On the central lines where SDRs and HVLC are welldeveloped (2, 6 and 7), the vertical coincidence of SDRs andHVLC (Hinz et al., 1999; Blaich et al., 2009, 2011) suggeststhat the HVLC bodies are of synrift character. This resem-bles the classical architecture of volcanic rifted margins. Theheavily intruded crust under the SDRs of the central lines 2, 6and 7 (Schnabel et al., 2008) may have acted as conduits pro-viding magma for the thick volcanic flows imaged as SDRs(line 2 and line 7). The HVLC of the northernmost lines 1,4 and 5 is located mainly seaward of the inner SDRs. TheHVLC bodies show maximum thickness beneath the innerSDR wedges and thin slowly with increasing plate separa-tion. This implies that the formation of the HVLC initiated at
Solid Earth, 5, 1011–1026, 2014 www.solid-earth.net/5/1011/2014/
K. Becker et al.: Asymmetry of high-velocity lower crust on the South Atlantic 1021
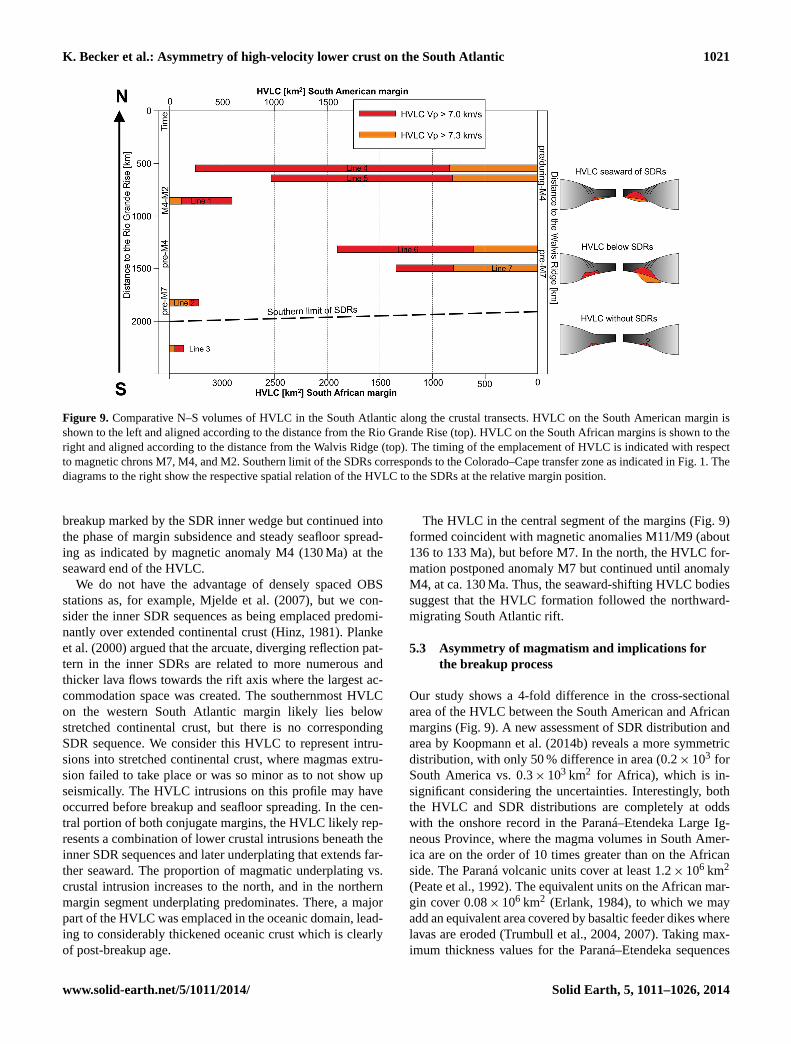
Figure 9. Comparative N–S volumes of HVLC in the South Atlantic along the crustal transects. HVLC on the South American margin isshown to the left and aligned according to the distance from the Rio Grande Rise (top). HVLC on the South African margins is shown to theright and aligned according to the distance from the Walvis Ridge (top). The timing of the emplacement of HVLC is indicated with respectto magnetic chrons M7, M4, and M2. Southern limit of the SDRs corresponds to the Colorado–Cape transfer zone as indicated in Fig. 1. Thediagrams to the right show the respective spatial relation of the HVLC to the SDRs at the relative margin position.
breakup marked by the SDR inner wedge but continued intothe phase of margin subsidence and steady seafloor spread-ing as indicated by magnetic anomaly M4 (130 Ma) at theseaward end of the HVLC.
We do not have the advantage of densely spaced OBSstations as, for example, Mjelde et al. (2007), but we con-sider the inner SDR sequences as being emplaced predomi-nantly over extended continental crust (Hinz, 1981). Plankeet al. (2000) argued that the arcuate, diverging reflection pat-tern in the inner SDRs are related to more numerous andthicker lava flows towards the rift axis where the largest ac-commodation space was created. The southernmost HVLCon the western South Atlantic margin likely lies belowstretched continental crust, but there is no correspondingSDR sequence. We consider this HVLC to represent intru-sions into stretched continental crust, where magmas extru-sion failed to take place or was so minor as to not show upseismically. The HVLC intrusions on this profile may haveoccurred before breakup and seafloor spreading. In the cen-tral portion of both conjugate margins, the HVLC likely rep-resents a combination of lower crustal intrusions beneath theinner SDR sequences and later underplating that extends far-ther seaward. The proportion of magmatic underplating vs.crustal intrusion increases to the north, and in the northernmargin segment underplating predominates. There, a majorpart of the HVLC was emplaced in the oceanic domain, lead-ing to considerably thickened oceanic crust which is clearlyof post-breakup age.
The HVLC in the central segment of the margins (Fig. 9)formed coincident with magnetic anomalies M11/M9 (about136 to 133 Ma), but before M7. In the north, the HVLC for-mation postponed anomaly M7 but continued until anomalyM4, at ca. 130 Ma. Thus, the seaward-shifting HVLC bodiessuggest that the HVLC formation followed the northward-migrating South Atlantic rift.
5.3 Asymmetry of magmatism and implications forthe breakup process
Our study shows a 4-fold difference in the cross-sectionalarea of the HVLC between the South American and Africanmargins (Fig. 9). A new assessment of SDR distribution andarea by Koopmann et al. (2014b) reveals a more symmetricdistribution, with only 50 % difference in area (0.2× 10³ forSouth America vs. 0.3× 10³ km2 for Africa), which is in-significant considering the uncertainties. Interestingly, boththe HVLC and SDR distributions are completely at oddswith the onshore record in the Paraná–Etendeka Large Ig-neous Province, where the magma volumes in South Amer-ica are on the order of 10 times greater than on the Africanside. The Paraná volcanic units cover at least 1.2× 10⁶ km2
(Peate et al., 1992). The equivalent units on the African mar-gin cover 0.08× 10⁶ km2 (Erlank, 1984), to which we mayadd an equivalent area covered by basaltic feeder dikes wherelavas are eroded (Trumbull et al., 2004, 2007). Taking max-imum thickness values for the Paraná–Etendeka sequences
www.solid-earth.net/5/1011/2014/ Solid Earth, 5, 1011–1026, 2014
1022 K. Becker et al.: Asymmetry of high-velocity lower crust on the South Atlantic
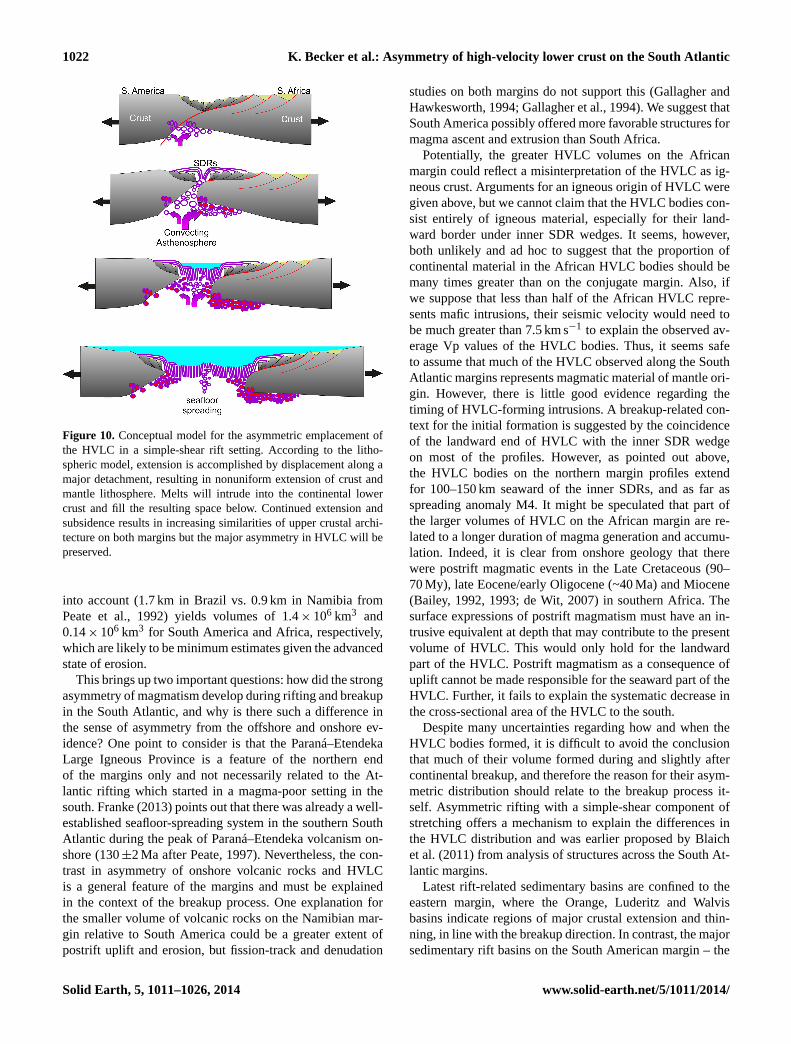
Figure 10. Conceptual model for the asymmetric emplacement ofthe HVLC in a simple-shear rift setting. According to the litho-spheric model, extension is accomplished by displacement along amajor detachment, resulting in nonuniform extension of crust andmantle lithosphere. Melts will intrude into the continental lowercrust and fill the resulting space below. Continued extension andsubsidence results in increasing similarities of upper crustal archi-tecture on both margins but the major asymmetry in HVLC will bepreserved.
into account (1.7 km in Brazil vs. 0.9 km in Namibia fromPeate et al., 1992) yields volumes of 1.4× 10⁶ km3 and0.14× 106 km3 for South America and Africa, respectively,which are likely to be minimum estimates given the advancedstate of erosion.
This brings up two important questions: how did the strongasymmetry of magmatism develop during rifting and breakupin the South Atlantic, and why is there such a difference inthe sense of asymmetry from the offshore and onshore ev-idence? One point to consider is that the Paraná–EtendekaLarge Igneous Province is a feature of the northern endof the margins only and not necessarily related to the At-lantic rifting which started in a magma-poor setting in thesouth. Franke (2013) points out that there was already a well-established seafloor-spreading system in the southern SouthAtlantic during the peak of Paraná–Etendeka volcanism on-shore (130±2 Ma after Peate, 1997). Nevertheless, the con-trast in asymmetry of onshore volcanic rocks and HVLCis a general feature of the margins and must be explainedin the context of the breakup process. One explanation forthe smaller volume of volcanic rocks on the Namibian mar-gin relative to South America could be a greater extent ofpostrift uplift and erosion, but fission-track and denudation
studies on both margins do not support this (Gallagher andHawkesworth, 1994; Gallagher et al., 1994). We suggest thatSouth America possibly offered more favorable structures formagma ascent and extrusion than South Africa.
Potentially, the greater HVLC volumes on the Africanmargin could reflect a misinterpretation of the HVLC as ig-neous crust. Arguments for an igneous origin of HVLC weregiven above, but we cannot claim that the HVLC bodies con-sist entirely of igneous material, especially for their land-ward border under inner SDR wedges. It seems, however,both unlikely and ad hoc to suggest that the proportion ofcontinental material in the African HVLC bodies should bemany times greater than on the conjugate margin. Also, ifwe suppose that less than half of the African HVLC repre-sents mafic intrusions, their seismic velocity would need tobe much greater than 7.5 km s−1 to explain the observed av-erage Vp values of the HVLC bodies. Thus, it seems safeto assume that much of the HVLC observed along the SouthAtlantic margins represents magmatic material of mantle ori-gin. However, there is little good evidence regarding thetiming of HVLC-forming intrusions. A breakup-related con-text for the initial formation is suggested by the coincidenceof the landward end of HVLC with the inner SDR wedgeon most of the profiles. However, as pointed out above,the HVLC bodies on the northern margin profiles extendfor 100–150 km seaward of the inner SDRs, and as far asspreading anomaly M4. It might be speculated that part ofthe larger volumes of HVLC on the African margin are re-lated to a longer duration of magma generation and accumu-lation. Indeed, it is clear from onshore geology that therewere postrift magmatic events in the Late Cretaceous (90–70 My), late Eocene/early Oligocene (~40 Ma) and Miocene(Bailey, 1992, 1993; de Wit, 2007) in southern Africa. Thesurface expressions of postrift magmatism must have an in-trusive equivalent at depth that may contribute to the presentvolume of HVLC. This would only hold for the landwardpart of the HVLC. Postrift magmatism as a consequence ofuplift cannot be made responsible for the seaward part of theHVLC. Further, it fails to explain the systematic decrease inthe cross-sectional area of the HVLC to the south.
Despite many uncertainties regarding how and when theHVLC bodies formed, it is difficult to avoid the conclusionthat much of their volume formed during and slightly aftercontinental breakup, and therefore the reason for their asym-metric distribution should relate to the breakup process it-self. Asymmetric rifting with a simple-shear component ofstretching offers a mechanism to explain the differences inthe HVLC distribution and was earlier proposed by Blaichet al. (2011) from analysis of structures across the South At-lantic margins.
Latest rift-related sedimentary basins are confined to theeastern margin, where the Orange, Luderitz and Walvisbasins indicate regions of major crustal extension and thin-ning, in line with the breakup direction. In contrast, the majorsedimentary rift basins on the South American margin – the
Solid Earth, 5, 1011–1026, 2014 www.solid-earth.net/5/1011/2014/
K. Becker et al.: Asymmetry of high-velocity lower crust on the South Atlantic 1023
Colorado, the Salado and the San Jorge basins – are orientedperpendicular to the rift axis, which negates a symmetric ex-tension and support the simple-shear mode of extension asalready suggested by Blaich et al. (2011) and Koopmann etal. (2014b).
According to the simple-shear model, rifting is accom-plished by displacement along a major detachment, result-ing in nonuniform extension of the lithosphere (Fig. 10). Theinitial stretching process effects an asymmetrically stretchedcrust. The lower crust and the space below is filled by the ris-ing melt, producing asymmetrically distributed HVLC. Fig-ure 10 illustrates the different stages of the breakup process.
6 Conclusions
Two new refraction seismic models complemented by grav-ity models fill a gap in the data coverage on the Argen-tine margin and prove the existence of high-velocity lowercrust (HVLC; Vp> 7.0). Combined with the models fromseveral publications, a compilation of seven transects allowsfor a comparative analysis of the deep crustal structures andphysical properties along the conjugate margins of the SouthAtlantic. All but one of them (off southernmost Argentina)show a close spatial correlation of the HVLC with the SDRsequences in the upper crust, suggesting they are magmaticfeatures. We cannot totally rule out the possibility that thelandwards parts represent metamorphic rocks like eclogites,especially for line 3, but we think that serpentinization is un-likely, since it fails to explain the systematic HVLC varia-tions. A close spatial relationship of the HVLC to the SDRsand to flood basalts and dike swarms onshore, which wereused to classify this margin as volcanic, suggests a mag-matic origin for the central and northern lines. This meansthat underplating and intrusions of mantle-derived magmasin different combinations are the most probable origins forthe HVLC bodies.
Three seismic lines on the South American margin coverthe change from a magma-poor margin (lacking SDRs andmagmatism) in the south to a well-developed volcanic riftedmargin off Uruguay in the north and were compared withfour transects across the South African margin.
In addition to the volume and the shape, the relative posi-tion of the HVLC with regard to the SDR sequences variesin a systematic way from south to north. The southernmostsmall HVLC formed without associated SDRs. In the centralsections, the HVLC underlies the inner SDR wedges. How-ever, the northernmost HVLC are located seaward of the in-ner SDRs. The northern profiles off Uruguay and Namibiashow HVLC extending seaward as far as spreading anomalyM4 (130 Ma).
From the seaward-migrating position of the HVLC withregard to the inner SDR wedges, we infer the formation of theHVLC during different stages of the rifting and breakup pro-cess. If of magmatic origin, the HVLC in the magma-starved
segment was likely formed before breakup. The HVLC incentral part of the margins was emplaced contemporaneouslywith the SDRs, i.e., synrift. However, in the northernmostmargin segment, the formation of the HVLC started after theemplacement of the SDRs. Thus, a causal relationship be-tween SDRs and HVLC is questioned. The northern HVLCmay have formed at the end of the breakup process and con-tinued until the earliest seafloor spreading.
Concerning the distribution of the HVLC, we observe anincrease in cross-sectional area on the conjugate marginsfrom south to north. Evident is an asymmetry in the cross-sectional area across the margins. The South African marginreveals HVLC about 4 times larger and 2–3 times thickerthan the South American margin, which stands in contrast tothe onshore Paraná–Etendeka flood basalt province, whichshows the opposite sense of asymmetry. We attribute thisasymmetry of HVLC to rifting in the simple-shear mode.There may be some analogies to the volcanic margin in theNorth Atlantic, where asymmetric HVLC structures were ob-served in the conjugate East Greenland/Hatton Bank data.
Acknowledgements.We wish to thank the reviewers for commentsand suggestions which improved the manuscript. Funding by theDeutsche Forschungsgemeinschaft (German Research Foundation)within the priority program SPP1375 SAMPLE (South AtlanticMargin Processes and Links with onshore Evolution) for projectsFR 2119-2-2 (K. Becker) and NE 1193-1-1 (H. Koopmann) isgreatly acknowledged.
Edited by: J. C. Afonso
References
Austin, J. A. and Uchupi, E.: Continental-oceanic crustal transitionoff Southwest Africa, AAPG Bulletin, 66, 1328–1347, 1982.
Bailey, D. K.: Episodic alkaline igneous activity across Africa: im-plications for the causes of continental break-up, Geological So-ciety, London, Special Publications, 68, 91–98, 1992.
Bailey, D. K.: Petrogenetic implications of the timing of alkaline,carbonatite, and kimberlite igneous activity in Africa, S. Afr. J.Geol., 96, 67–74, 1993.
Bauer, K., Neben, S., Schreckenberger, B., Emmermann, R., Hinz,K., Fechner, N., Gohl, K., Schulze, A., Trumbull, R. B., and We-ber, K.: Deep structure of the Namibia continental margin as de-rived from integrated geophysical studies, J. Geophys. Res., 105,25829–25853, 2000.
Becker, K., Franke, D., Schnabel, M., Schreckenberger, B., Heyde,I., and Krawczyk, C. M.: The crustal structure of the southernArgentine margin, Geophys. J. Int., 189, 1483–1504, 2012.
Blaich, O., A., Faleide, J. I., Tsikalas, F., Franke, D., and León,E.: Crustal-scale architecture and segmentation of the Argentinemargin and its conjugate off South Africa, Geophys. J. Int., 178,85–105, 2009.
Blaich, O. A., Faleide, J. I., and Tsikalas, F.: Crustal breakup andcontinent-ocean transition at South Atlantic conjugate margins, J.Geophys. Res., 116, B01402, doi:10.1029/2010jb007686, 2011.
www.solid-earth.net/5/1011/2014/ Solid Earth, 5, 1011–1026, 2014
1024 K. Becker et al.: Asymmetry of high-velocity lower crust on the South Atlantic
Comin-Chiaramonti, P., De Min, A., Girardi, V. A. V., and Ruberti,E.: Post-Paleozoic magmatism in Angola and Namibia: a review,Geol. Soc. Am. Spec. Papers, 478, 223–247, 2011.
Contrucci, I., Matias, L., Moulin, M., Geli, L., Klingelhofer, F.,Nouze, H., Aslanian, D., Olivet, J.-L., Rehault, J.-P., and Sibuet,J.-C.: Deep structure of the West African continental margin(Congo, Zaïre, Angola), between 5◦ S and 8◦ S, from reflec-tion/refraction seismics and gravity data, Geophys. J. Int., 158,529–553, 2004.
de Wit, M.: The Kalahari Epeirogeny and climate change: differen-tiating cause and effect from core to space, S. Afr. J. Geol., 110,367–392, 2007.
Dragoi-Stavar, D. and Hall, S.: Gravity modeling of the ocean-continent transition along the South Atlantic margins, J. Geo-phys. Res., 114, B09401, doi:10.1029/2008jb006014, 2009.
Erlank, A. J.: Petrogenesis of the Volcanic Rocks of the KarooProvince: Presenting Results of the South African Geodynam-ics Project on the Karoo Volcanics, Geol. Soc. South Africa, 13,1984.
Ewart, A., Milner, S. C., Armstrong, R. A., and Duncan, A. R.:Etendeka Volcanism of the Goboboseb Mountains and MessumIgneous Complex, Namibia. Part II: Voluminous Quartz LatiteVolcanism of the Awahab Magma System, J. Petrol., 39, 227–253, 1998.
Farnetani, C. G., Richards, M. A., and Ghiorso, M. S.: Petrologicalmodels of magma evolution and deep crustal structure beneathhotspots and flood basalt provinces, Earth Planet. Sci. Lett., 143,81–94, 1996.
Fernàndez, M., Afonso, J. C., and Ranalli, G.: The deep lithosphericstructure of the Namibian volcanic margin, Tectonophysics, 481,68–81, 2010.
Franke, D.: Rifting, lithosphere breakup and volcanism: Compar-ison of magma-poor and volcanic rifted margins, Mar. Petrol.Geol., 43, 63–87, 2013.
Franke, D., Neben, S., Schreckenberger, B., Schulze, A., Stiller,M., and Krawczyk, C. M.: Crustal structure across the ColoradoBasin, offshore Argentina, Geophys. J. Int., 165, 850–864, 2006.
Franke, D., Neben, S., Ladage, S., Schreckenberger, B., and Hinz,K.: Margin segmentation and volcano-tectonic architecture alongthe volcanic margin off Argentina/Uruguay, South Atlantic, Mar.Geol., 244, 46–67, 2007.
Franke, D., Ladage, S., Schnabel, M., Schreckenberger, B.,Reichert, C., Hinz, K., Paterlini, M., de Abelleyra, J.,and Siciliano, M.: Birth of a volcanic margin off Ar-gentina, South Atlantic, Geochem. Geophys. Geosyst., 11, 2,doi:10.1029/2009GC002715, 2010.
Frimmel, H. E., Basei, M. S., and Gaucher, C.: Neoproterozoic geo-dynamic evolution of SW-Gondwana: a southern African per-spective, Int. J. Earth Sci., 100, 323–354, 2011.
Furlong, K. P. and Fountain, D. M.: Continental Crustal Under-plating: Thermal Considerations And Seismic-Petrologic Conse-quences, J. Geophys. Res., 91, 8285–8294, 1986.
Gallagher, K. and Hawkesworth, C.: Mantle plumes, continentalmagmatism and asymmetry in the South Atlantic, Earth Planet.Sci. Lett., 123, 105–117, 1994.
Gallagher, K., Hawkesworth, C. J., and Mantovani, M. S. M.: Thedenudation history of the onshore continental margin of SEBrazil inferred from apatite fission track data, J. Geophys. Res.,99, 18117–18145, 1 1994.
Gernigon, L., Ringenbach, J.-C., Planke, S., and Le Gall, B.: Deepstructures and breakup along volcanic rifted margins: insightsfrom integrated studies along the outer Vøring Basin (Norway),Mar. Petrol. Geol., 21, 363–372, 2004.
Gernigon, L., Lucazeau, F., Brigaud, F., Ringenbach, J.-C., Planke,S., and Le Gall, B.: A moderate melting model for the Voringmargin (Norway) based on structural observations and a thermo-kinematical modelling: Implication for the meaning of the lowercrustal bodies, Tectonophysics, 412, 255–278, 2006.
Gibson, S. A., Thompson, R. N., Leonardos, O. H., Dickin, A. P.,and Mitchell, J. G.: The Late Cretaceous Impact of the TrindadeMantle Plume: Evidence from Large-volume, Mafic, PotassicMagmatism in SE Brazil, J. Petrol., 36, 189–229, 1995.
Gladczenko, T. P., Hinz, K., Eldholm, O., Meyer, H., Neben, S.,and Skogseid, J.: South Atlantic volcanic margins, J. Geol. Soc.London, 154, 465–470, 1997.
Gladczenko, T. P., Skogseid, J., and Eldhom, O.: Namibia volcanicmargin, Mar. Geophys. Res., 20, 313–341, 1998.
Gradstein, F., Ogg, J., Schmitz, M., and Ogg, G. 2012.: The Geo-logic Time Scale 2012, 1. Elsevier, 1176.
Green, R. W. E. and Durrheim, R. J.: A seismic refraction investiga-tion of the Namaqualand Metamorphic Complex, South Africa,J. Geophys. Res. (1978–2012), 95, 19927–19932, 1990.
Hawkesworth, C., Kelley, S., Turner, S., Le Roex, A., and Storey,B.: Mantle processes during Gondwana break-up and dispersal,Journal of African Earth Sciences, 28, 239–261, 1999.
Hinz, K.: A hypothesis on terrestrial catastrophes: wedges ofvery thick oceanward dipping layers beneath passive continen-tal margins; their origin and paleoenvironmental significance,Schweizerbart, 1981.
Hinz, K., Neben, S., Schreckenberger, B., Roeser, H. A., Block,M., Souza, K. G. d., and Meyer, H.: The Argentine continentalmargin north of 48◦ S: sedimentary successions, volcanic activ-ity during breakup, Mar. Petrol. Geol., 16, 1–25, 1999.
Hirsch, K. K., Bauer, K., and Scheck-Wenderoth, M.: Deep struc-ture of the western South African passive margin – Results ofa combined approach of seismic, gravity and isostatic investiga-tions, Tectonophysics, 470, 57–70, 2009.
Holbrook, W. S., Mooney, W. D., and Christensen, N. I.: The seis-mic velocity structure of the deep continental crust, Continent.Lower Crust, 23, 1–43, 1992
Jackson, M. P. A., Cramez, C., and Fonck, J.-M.: Role of subaerialvolcanic rocks and mantle plumes in creation of South Atlanticmargins: implications for salt tectonics and source rocks, Mar.Petrol. Geol., 17, 477–498, 2000.
Kelemen, P. B. and Holbrook, W. S.: Origin of thick, high-velocityigneous crust along the US East Coast Margin, J. Geophys. Res.,100, 10077–10094, 1995.
Koopmann, H., Franke, D., Schreckenberger, B., Schulz, H.,Hartwig, A., Stollhofen, H., and di Primio, R.: Segmentation andvolcano-tectonic characteristics along the SW African continen-tal margin, South Atlantic, as derived from multichannel seismicand potential field data, Mar. Petrol. Geol., 50, 22–39, 2014.
Koopmann, H., Schreckenberger, B., Franke, D., Becker, K., andSchnabel, M.: The late rifting phase and continental break-up ofsouthern South Atlantic: The mode and timing of volcanic rift-ing and formation of earliest oceanic crust, Geological Society,London, Special Publications, accepted, 2014.
Solid Earth, 5, 1011–1026, 2014 www.solid-earth.net/5/1011/2014/

K. Becker et al.: Asymmetry of high-velocity lower crust on the South Atlantic 1025
Korenaga, J., Holbrook, W. S., Kent, G. M., Kelemen, P. B., De-trick, R. S., Larsen, H.-C., Hopper, J. R., and Dahl-Jensen, T.:Crustal structure of the southeast Greenland margin from jointrefraction and reflection seismic tomography, J. Geophys. Res.,105, 21591–21614, 2000.
Korenaga, J., Kelemen, P. B., and Holbrook, W. S.: Methods forresolving the origin of large igneous provinces from crustal seis-mology, J. Geoph. Res., 107, ECV–1, 2002.
Ludwig, W. J., Nafe, J. E., and Drake, C. L.: Seismic refraction, Thesea, 4, 53–84, 1970.
Maystrenko, Y. P., Scheck-Wenderoth, M., Hartwig, A., Anka, Z.,Watts, A. B., Hirsch, K. K., and Fishwick, S.: Structural featuresof the Southwest African continental margin according to resultsof lithosphere-scale 3D gravity and thermal modelling, Tectono-physics, 604, 104–121, 2013.
Menzies, M. A., Klemperer, S. L., Ebinger, C. J., and Baker, J.:Characteristics of volcanic rifted margins, in: Volcanic RiftedMargins, edited by: Menzies, M. A., Klemperer, S. L., Ebinger,C. J., and Baker, J., Geol. Soc. Am. Spec. Paper, 362, 1–14, 2002.
Mjelde, R., Kasahara, J., Shimamura, H., Kamimura, A., Kanazawa,T., Kodaira, S., Raum, T., and Shiobara, H.: Lower crustal seis-mic velocity-anomalies; magmatic underplating or serpentinizedperidotite? Evidence from the Vøring Margin, NE Atlantic, Mar.Geophys. Res., 23, 169–183, 2002.
Mjelde, R., Shimamura, H., Kanazawa, S., Kodaira, S., Raum,T., and Shiobara, H.: Crustal lineaments, distribution of lowercrustal intrusives and structural evolution of the Vøring Mar-gin, NE Atlantic; new insight from wide-angle seismic models,Tectonophysics, 369, 199–218, 2003.
Mjelde, R., Raum, T., Murai, Y., and Takanami, T.: Continent–ocean-transitions: review, and a new tectono-magmatic model ofthe Vøring Plateau, NE Atlantic, J. Geodynam., 43, 374–392,2007.
Mjelde, R., Goncharov, A., and Müller, R. D.: The Moho: Bound-ary above upper mantle peridotites or lower crustal eclogites?A global review and new interpretations for passive margins,Tectonophysics, 609, 636–650, 2013.
Mohriak, W. U. and Leroy, S.: Architecture of rifted continen-tal margins and break-up evolution: insights from the SouthAtlantic, North Atlantic and Red Sea–Gulf of Aden conjugatemargins, Geological Society, London, Special Publications, 369,497–535, 2012.
Mooney, W. D., Laske, G., and Masters, T. G.: CRUST 5.1: A globalcrustal model at 5◦ × 5◦, J. Geophys. Res., 103, 727–747, 1998.
Mutter, J. C.: Seaward dipping reflectors and the continent-oceanboundary at passive continental margins, Tectonophysics, 114,117–131, 1985.
O’Reilly, B. M., Hauser, F., Jacob, A. W. B., and Shannon, P. M.:The lithosphere below the Rockall Trough: wide-angle seismicevidence for extensive serpentinisation, Tectonophysics, 255, 1–23, 1996.
Peate, D., W.: The Parana-Etendeka Province, Large igneousprovinces: Continental oceanic and planetary flood volcanism,edited by: Mahoney, J. and Coffin, M. F., American GeophysicalUnion, Washington, DC, ETATS-UNIS, 443 pp., 1997.
Peate, D. W., Hawkesworth, C. J., and Mantovani, M. S.: Chemicalstratigraphy of the Paraná lavas (South America): classificationof magma types and their spatial distribution, Bull. Volcanol., 55,119–139, 1992.
Peate, D. W., Hawkesworth, C. J., Mantovani, M. M. S., Rogers, N.W., and Turner, S. P.: Petrogenesis and stratigraphy of the high-Ti/Y Urubici magma type in the Parana flood basalt province andimplications for the nature of Dupal-type mantle in the SouthAtlantic region, J. Petrol., 40, 451–473, 1999.
Planke, S. and Eldholm, O.: Seismic response and construction ofseaward dipping wedges of flood basalts: Vøring volcanic mar-gin, J. Geophys. Res., 99, 9263–9278, 1994.
Planke, S., Symonds, P. A., Alvestad, E., and Skogseid, J.: Seis-mic volcanostratigraphy of large-volume basaltic extrusive com-plexes on rifted margins. Journal of Geophysical Research: SolidEarth (1978–2012), 105, 19335–19351, 2000.
Rabinowitz, P. D. and LaBrecque, J.: The Mesozoic South AtlanticOcean and Evolution of Its Continental Margins, J. Geophys.Res., 84, 5973–6002, 1979.
Ridley, V. A. and Richards, M. A.: Deep crustal structure beneathlarge igneous provinces and the petrologic evolution of floodbasalts, Geochemistry, Geophysics, Geosystems, 11, Q09006,doi:10.1029/2009gc002935, 2010.
Rudnick, R. L. and Fountain, D. M.: Nature and composition of thecontinental crust: A lower crustal perspective, Rev. Geophys., 33,267–310, 1995.
Schinkel, J.: Tiefenstruktur der Kontinent-Ozean-Grenze vor demOrange Fluss, Namibia, Master Thesis, Institut für Geowis-senschaften der Friedrich-Schiller Universität, Jena, Jena, 2006.
Schnabel, M., Franke, D., Engels, M., Hinz, K., Neben, S., Damm,V., Grassmann, S., Pelliza, H., and Dos Santos, P. R.: The struc-ture of the lower crust at the Argentine continental margin, SouthAtlantic at 44◦ S, Tectonophysics, 454, 14–22, 2008.
Sibuet, J.-C., Hay, W. W., Prunier, A., Montadert, L., Hinz, K., andFritsch, J.: Early evolution of the South Atlantic Ocean: role ofthe rifting episode, Initial Rep. Deep Sea Drill. Proj., 75, 469–481, 1984.
Stankiewicz, J., Parsiegla, N., Ryberg, T., Gohl, K., Weckmann, U.,Trumbull, R., and Weber, M.: Crustal structure of the southernmargin of the African continent: Results from geophysical exper-iments, J. Geophys. Res., 113, B10, doi:10.1029/2008JB005612,2008.
Talwani, M. and Abreu, V.: Inferences regarding initiation ofoceanic crust formation from the US East Coast margin and con-jugate South Atlantic margins, in: Atlantic Rifts and ContinentalMargins edited by: Mohriak, W. U. and Talwani, M., Geophys-ical Monograph Series, Am. Geophys. Union, Washington, DC,211–234, 2000.
Thybo, H. and Artemieva, I. M.: Moho and magmatic underplatingin continental lithosphere, Tectonophysics, 609, 605–619, 2013.
Trumbull, R., Harris, C., Frindt, S., and Wigand, M.: Oxygen andneodymium isotope evidence for source diversity in Cretaceousanorogenic granites from Namibia and implications for A-typegranite genesis, Lithos, 73, 21–40, 2004.
Trumbull, R. B., Sobolev, S. V., and Bauer, K.: Petrophysical mod-eling of high seismic velocity crust at the Namibian volcanicmargin, in: Volcanic Rifted Margins, edited by: Menzies, M. A.,Klemperer, S. L., Ebinger, C. J., and Baker, J., Boulder, Col-orado, Geol. Soc. Am. Spec. Paper 362, 225–234, 2002.
Trumbull, R. B., Bühn, B., Romer, R. L., and Volker, F.: The Petrol-ogy of Basanite-Tephrite Intrusions in the Erongo Complex andImplications for a Plume Origin of Cretaceous Alkaline Com-plexes in Namibia, J. Petrol., 44, 93–112, 2003.
www.solid-earth.net/5/1011/2014/ Solid Earth, 5, 1011–1026, 2014
1026 K. Becker et al.: Asymmetry of high-velocity lower crust on the South Atlantic
Trumbull, R. B., Reid, D. L., de Beer, C., van Acken, D., and Romer,R. L.: Magmatism and continental breakup at the west marginof southern Africa: A geochemical comparison of dolerite dikesfrom northwestern Namibia and the Western Cape, S. Afr. J.Geol., 110, 477–502, 2007.
Voss, M. and Jokat W.: Continent-ocean transition and voluminousmagmatic underplating derived fromP wave velocity modellingof the East Greenland continental margin, Geophys. J. Int., 170,580–604, 2007.
Voss, M., Schmidt-Aursch, M. C., and Jokat, W.: Variations in mag-matic processes along the East Greenland volcanic margin, Geo-phys. J. Int., 177, 755–782, 2009.
White, R. and McKenzie, D.: Magmatism at Rift Zones: The Gen-eration of Volcanic Continental Margins and Flood Basalts, J.Geophys. Res., 94, 7685–7729, 1989.
White, R. S. and Smith, L. K.: Crustal structure of the Hat-ton and the conjugate east Greenland rifted volcanic con-tinental margins, NE Atlantic, J. Geophys. Res., 114, B5,doi:10.1029/2008JB005856, 2009.
White, R. S., Spence, G. D., Fowler, S. R., McKenzie, D. P., West-brook, G. K., and Bowen, A. N.: Magmatism at rifted continentalmargins, Nature, 330, 439–444, 1987.
White, R. S., Smith, L. K., Roberts, A. W., Christie, P. A. F., andKusznir, N. J.: Lower-crustal intrusion on the North Atlantic con-tinental margin, Nature, 452, 460–464, 2008.
Solid Earth, 5, 1011–1026, 2014 www.solid-earth.net/5/1011/2014/
Related Documents