www.sciencemag.org/cgi/content/full/science.1190772/DC1 Supporting Online Material for Asymmetric Density Dependence Shapes Species Abundances in a Tropical Tree Community Liza S. Comita,* Helene C. Muller-Landau, Salomon Aguilar, Stephen P. Hubbell *To whom correspondence should be addressed. E-mail: [email protected] Published 24 June 2010 on Science Express DOI: 10.1126/science.1190772 This PDF file includes: Materials and Methods Fig. S1 Tables S1 to S3 References

Welcome message from author
This document is posted to help you gain knowledge. Please leave a comment to let me know what you think about it! Share it to your friends and learn new things together.
Transcript

www.sciencemag.org/cgi/content/full/science.1190772/DC1
Supporting Online Material for
Asymmetric Density Dependence Shapes Species Abundances in a Tropical Tree Community
Liza S. Comita,* Helene C. Muller-Landau, Salomon Aguilar, Stephen P. Hubbell
*To whom correspondence should be addressed. E-mail: [email protected]
Published 24 June 2010 on Science Express
DOI: 10.1126/science.1190772
This PDF file includes:
Materials and Methods Fig. S1 Tables S1 to S3 References

Materials and Methods
Data collection - The study was conducted in the predominantly old-growth, lowland, moist tropical
forest of the Barro Colorado Island 50-ha Forest Dynamics Plot, Panama (BCI FDP) (S1). The BCI FDP is part of
the Center for Tropical Forest Science, a global network of large-scale demographic tree plots (S2). Within the
BCI FDP, all saplings and adult trees ≥1 cm DBH (diameter at 1.3 m above ground) have been mapped, measured
and identified to species at ~ 5 yr intervals (S3). In 2001, we initiated an annual census of free-standing woody
seedlings (≥20 cm tall and <1 cm DBH) in 20,000 1x1 m2 quadrats spaced at 5-m intervals within the BCI FDP (S4-
6). Using data on 30,975 seedlings of all 180 tree species encountered in the initial seedling census (see Table
S1), we examined the probability of a seedling surviving from 2001 to 2006 as a function of the density and
identity of neighboring seedlings and trees.
Neighbor densities - Seedling neighbor density was calculated as number of conspecific and
heterospecific seedlings within the same 1x1 m seedlings plot as the focal individual. Shrub and liana seedlings,
which are monitored in the censuses, were included in calculations of heterospecific neighbor densities, but only
tree seedlings were included as focal individuals in the analysis. We used data from the BCI FDP 2000 tree
census (S7) to calculate basal area of trees ≥1cm DBH within 30 m of each focal seedling. The cut-off of 30 m
was selected because previous studies from this forest have shown that conspecific neighbor effects drop off
quickly with distance and are typically not significant beyond 30 m (S8). Seedling plots within 30 m of the edge
of the 50-ha FDP were excluded from the analysis.
Since the effect of neighboring trees on seedling survival is expected to decline with distance, we
performed preliminary analyses to quantify the decay with distance. We first calculated the sum of the basal
area of trees ≥1 cm DBH in 1-m bands around each focal seedling out to a distance of 30 m. We then used a
generalized linear model (GLM) with binomial errors to model seedling survival from 2001 to 2006 as a function
of conspecific and heterospecific seedling neighbors and the basal area of conspecific and heterospecific trees in
each of the thirty 1-m bands. The values for neighbor effects in each 1-m band are shown in Fig. S1. Visual
inspection of the results suggested an exponential decay in adult neighbor effect with distance, of the form:
α*∑ *BA*exp(-β*distance)+
Because of parameter trade-offs between the total effect of neighbors (α) and the decay with distance
(β), it was difficult to simultaneously estimate both values. Thus, we determined the optimal value for the
exponential decay by comparing models with differing values for β. We compared models using the values of β
listed in Table S3. AIC values indicated that β=0.2 gave the best fit (Table S3, Fig. S1).
Species abundance - The abundance of each species in the community was calculated as the sum of the
basal area (cross-sectional area of the trunk) of individuals ≥1 cm DBH within the entire BCI 50-ha Forest

Dynamics Plot, based on diameter measurements taken in the 2000 census (see Supplementary Table 1). We
chose to use basal area as a measure of abundance since it correlates significantly with numerical abundance
(r=0.60, P<0.001; log-log scale), but is a better descriptor of the amount of space and resources a species is
using. Further, it is not as influenced by differences in size class distributions (S9), which tend to be skewed and
vary with life history strategy in tropical tree communities (S10). Values of size-weighted species abundance
(basal area) were log-transformed before entering the model.
Shade tolerance - Shade tolerance is mediated by a trade-off between growth and survival (S10-S12),
with light demanding species having higher mortality and growth rates than shade tolerant species. Therefore,
we used the first axis of a principle components analysis (PCA) of growth and mortality rates for species in the
BCI plot as an index of species’ shade tolerance (see Supplementary Table 1). We used the mean mortality and
growth rates from 2000 to 2005 for saplings 1-5 cm DBH reported in Condit et al. (S13). Shade tolerance was
significantly correlated with numerical abundance (r=0.30, P<0.001), largely due to variation in size class
distributions with life history strategy, as mentioned above (i.e., shade-tolerant species have more saplings in
the understory than light-demanding species) . However, using size-weighted species abundance removed the
correlation between shade tolerance and abundance (r=-0.02, P=0.80).
Survival model - We used a hierarchical Bayesian approach (S14) that allowed for variation among
species in the effects of conspecific and heterospecific neighbors on survival. Our hierarchical model included
both individual-level and species-level regressions. In the individual-level regression, survival (s) of an individual
seedling i, of species j, in plot k, over the 5-yr study period was modeled as a function of the neighborhood
densities of conspecific (CONS) and heterospecific (HETS) seedlings and conspecific (CONBA) and heterospecific
(HETBA) adult trees:
sijk = Bernoulli (pjk), (1)
logit(pjk) = β0j + β1j•CONSjk + β2j•HETSjk + β3j •CONBAjk + β4j •HETBAjk + фk , (2)
which includes a random effect for seedling plot, where фk ~ Normal(0, σф). The random plot effect was
incorporated to control for spatial autocorrelation (i.e. non-independence) in survival of seedlings within 1-m2
quadrats.
In the species-level regression, the vector of coefficients (β0-4, from eq. 2) of each species j was modeled
as a function of species’ log abundance in the community (ABUND) and shade-tolerance (SHADE):
βmj = γm0 + γm1 •ABUNDj + γm2 •SHADEj + ∑β (3)
where values of βj are modeled using a multivariate normal distribution with the covariance matrix, ∑β, modeled
using a scaled inverse-Wishart distribution (S14). All individual- and species-level coefficients were assigned
non-informative priors, and were recentered prior to entering the model in order to reduce correlations and

speed convergence of the Gibbs sampling algorithm (S14). Model simulations were run in WinBUGS 1.4.3 (S15).
We assessed convergence by running two independent chains with differing initial values and using the Gelman-
Rubin statistic, as modified by Brooks and Gelman (S16). The model was run for 50,000 iterations and
convergence was confirmed. We then ran the model for an additional 100,000 iterations, which were used to
calculate the mean, standard deviation and 95% credible intervals of parameter estimates from the posterior
distribution.

FIGURES
Fig. S1 Distance decay of conspecific (A) and heterospecific (B) neighbor effects on seedling survival from 2001
to 2006 in the Barro Colorado Island 50 ha Forest Dynamics Plot, Panama. Points represent estimated effects for
1-m bands from a generalized linear model and red lines show an exponential decay with distance equal to exp(-
0.2•distance).
0 5 10 15 20 25 30-1e
-03
-6e
-04
-2e
-04
Distance (m)
Co
nsp
ecific
BA
eff
ect
0 5 10 15 20 25 30
0.0
00
00
0.0
00
10
0.0
00
20
Distance (m)
He
tero
sp
ecific
BA
eff
ect
A. B.

TABLES
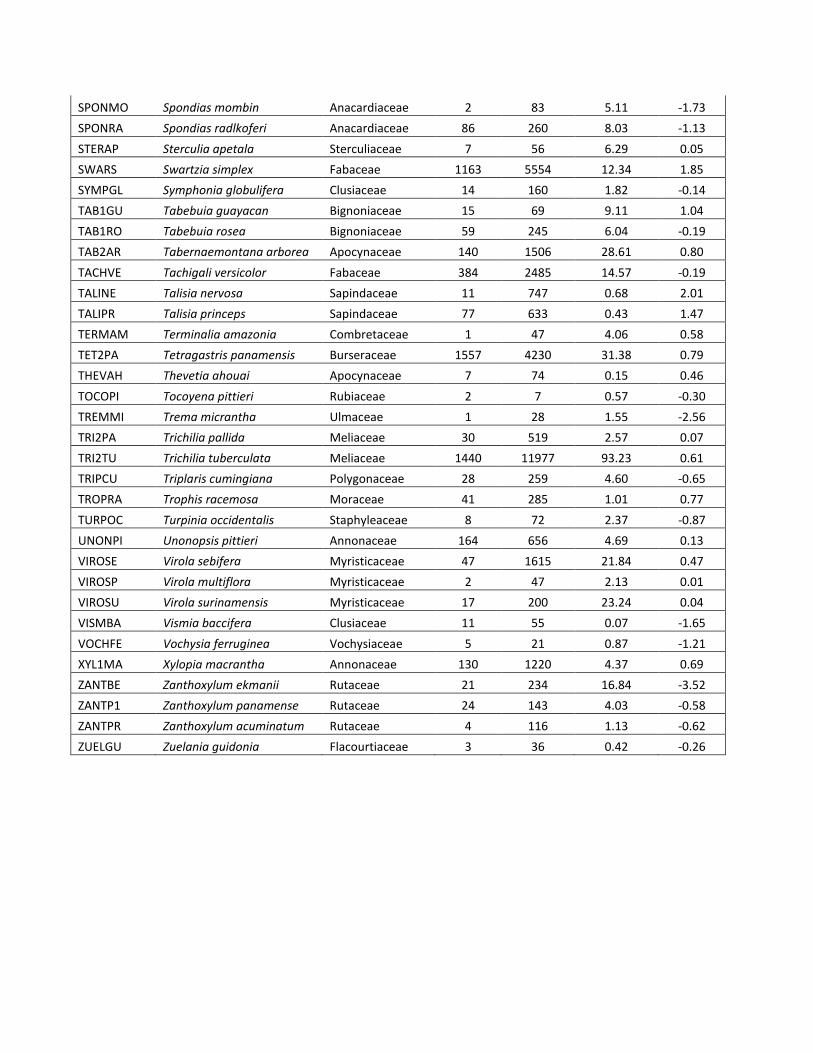
Table S1. Tree species included in the analysis of density dependent seedling survival. Species code refers to the
Center for Tropical Forest Science (CTFS) 6-letter unique code assigned to each species. Number of seedlings is
based on the 2001 seedling census, and number of trees and basal area are based on the 2000 census of trees
≥1 cm DBH in the Barro Colorado Island 50-ha Forest Dynamics Plot, Panama. Shade tolerance index was
calculated based on sapling growth and mortality rates, with more positive values indicating higher shade-
tolerance (see Methods for details). More information about each species can be found at:
https://ctfs.arnarb.harvard.edu/webatlas/.
Species code Species Family No.
seedlings
No. trees ≥1 cm DBH
Basal area trees ≥1 cm
DBH (m2)
Shade tolerance
index
ACALMA Acalypha macrostachya Euphorbiaceae 7 43 0.08 -1.70
ADE1TR Adelia triloba Euphorbiaceae 23 161 2.54 -0.67
AEGIPA Aegiphila panamensis Verbenaceae 6 62 0.47 -0.47
ALCHCO Alchornea costaricensis Euphorbiaceae 43 228 10.84 -2.58
ALCHLA Alchornea latifolia Euphorbiaceae 2 2 0.03 -0.48
ALIBED Alibertia edulis Rubiaceae 68 356 0.27 0.62
ALLOPS Allophylus psilospermus Sapindaceae 43 111 0.70 -0.52
ALSEBL Alseis blackiana Rubiaceae 1250 7867 70.16 1.11
AMAICO Amaioua corymbosa Rubiaceae 5 26 0.06 0.70
ANACEX Anacardium excelsum Anacardiaceae 25 24 31.24 -0.18
ANDIIN Andira inermis Fabaceae 1 284 0.99 1.84
ANNOSP Annona spraguei Annonaceae 21 134 0.94 -3.40
APEIME Apeiba membranacea Tiliaceae 39 269 32.58 -1.00
APEITI Apeiba tibourbou Tiliaceae 6 30 0.96 -2.34
ARDIFE Ardisia standleyana Myrsinaceae 7 99 0.10 1.19
ASPICR Aspidosperma spruceanum Apocynaceae 187 478 9.65 1.28
AST2GR Astronium graveolens Anacardiaceae 20 76 3.94 0.53
BEILPE Beilschmiedia pendula Lauraceae 5693 2318 31.46 0.63
BROSAL Brosimum alicastrum Moraceae 365 900 27.80 1.15
CALOLO Calophyllum longifolium Clusiaceae 235 1130 7.29 -0.03
CASEAC Casearia aculeata Flacourtiaceae 62 420 0.70 1.12
CASEAR Casearia arborea Flacourtiaceae 12 139 7.32 -0.32
CASESY Casearia sylvestris Flacourtiaceae 5 150 1.39 -0.07
CASSEL Cassipourea elliptica Rhizophoraceae 102 1007 3.26 1.09
CAVAPL Cavanillesia platanifolia Bombacaceae 3 21 25.51 -0.24

CECRIN Cecropia insignis Cecropiaceae 67 716 20.24 -4.77
CECROB Cecropia obtusifolia Cecropiaceae 18 101 1.14 -4.27
CEDROD Cedrela odorata Meliaceae 5 8 0.15 -0.87
CEIBPE Ceiba pentandra Bombacaceae 2 54 56.60 -1.67
CELTSC Celtis schippii Ulmaceae 3 122 1.06 0.81
CHA2SC Chamguava schippii Myrtaceae 32 381 0.33 0.61
CHR2AR Chrysophyllum argenteum Sapotaceae 179 671 4.49 1.05
CHR2CA Chrysophyllum cainito Sapotaceae 286 134 5.24 0.36
COCCCO Coccoloba coronata Polygonaceae 40 114 0.64 1.42
COCCMA Coccoloba manzinellensis Polygonaceae 14 401 0.56 2.07
CORDAL Cordia alliodora Boraginaceae 75 94 4.50 -2.14
CORDBI Cordia bicolor Boraginaceae 107 765 15.73 -0.79
CORDLA Cordia lasiocalyx Boraginaceae 257 1282 6.14 -0.26
COU2CU Coussarea curvigemmia Rubiaceae 134 2079 2.94 0.69
CROTBI Croton billbergianus Euphorbiaceae 382 358 1.73 -3.79
CUPALA Cupania latifolia Sapindaceae 8 43 0.74 -0.77
CUPARU Cupania rufescens Sapindaceae 19 94 0.13 0.90
CUPASY Cupania seemannii Sapindaceae 50 1212 1.66 1.69
DENDAR Dendropanax arboreus Araliaceae 6 103 6.21 0.00
DES2PA Desmopsis panamensis Annonaceae 1103 11291 7.81 0.65
DIO2AR Diospyros artanthifolia Ebenaceae 36 87 0.44 0.67
DIPTPA Dipteryx oleifera Fabaceae 48 45 18.71 0.73
DRYPST Drypetes standleyi Euphorbiaceae 618 2193 12.46 1.17
ERY2MA Erythroxylum macrophyllum Erythroxylaceae 79 245 0.42 0.06
ERY2PA Erythroxylum panamense Erythroxylaceae 15 102 0.05 1.11
EUGECO Eugenia coloradoensis Myrtaceae 184 655 2.91 0.53
EUGEGA Eugenia galalonensis Myrtaceae 397 1581 1.05 1.16
EUGENE Eugenia nesiotica Myrtaceae 452 515 2.38 1.52
EUGEOE Eugenia oerstediana Myrtaceae 1909 1926 6.22 0.15
FARAOC Faramea occidentalis Rubiaceae 3394 26754 60.87 0.66
GAR2IN Garcinia intermedia Clusiaceae 485 4409 5.37 1.13
GAR2MA Garcinia madruno Clusiaceae 71 374 0.50 1.06
GENIAM Genipa americana Rubiaceae 2 70 1.38 1.60
GUAPST Guapira standleyana Nyctaginaceae 28 165 12.14 0.82
GUARGR Guarea grandifolia Meliaceae 9 66 1.87 0.36
GUARGU Guarea guidonia Meliaceae 286 1838 16.05 0.56
GUARSP Guarea fuzzy Meliaceae 62 1037 2.15 0.21
GUATDU Guatteria dumetorum Annonaceae 32 1038 17.27 -0.13
GUAZUL Guazuma ulmifolia Sterculiaceae 7 61 5.41 -2.17
GUETFO Guettarda foliacea Rubiaceae 22 303 1.97 0.65
GUSTSU Gustavia superba Lecythidaceae 407 753 21.31 0.99

HAMPAP Hampea appendiculata Malvaceae 52 27 0.52 -2.72
HASSFL Hasseltia floribunda Flacourtiaceae 14 543 5.09 0.00
HEISAC Heisteria acuminata Olacaceae 14 106 0.31 0.73
HEISCO Heisteria concinna Olacaceae 59 953 9.80 0.70
HERRPU Herrania purpurea Sterculiaceae 25 511 0.41 1.58
HIRTAM Hirtella americana Chrysobalanaceae 3 30 0.09 0.39
HIRTTR Hirtella triandra Chrysobalanaceae 339 4760 23.21 0.82
HURACR Hura crepitans Euphorbiaceae 9 105 65.69 0.72
HYERAL Hieronyma alchorneoides Euphorbiaceae 11 78 11.58 -0.40
INGACO Inga thibaudiana Fabaceae 17 55 0.34 -0.17
INGAFA Inga laurina Fabaceae 18 75 0.84 0.14
INGAGO Inga goldmanii Fabaceae 10 341 1.78 0.40
INGAM2 Inga multijuga Fabaceae 59 154 1.32 -0.17
INGAMA Inga marginata Fabaceae 953 398 6.54 -1.70
INGAMI Inga oerstediana Fabaceae 2 3 0.09 0.10
INGAPE Inga pezizifera Fabaceae 3 120 0.64 0.30
INGAQU Inga nobilis Fabaceae 23 663 1.99 0.83
INGAS1 Inga acuminata Fabaceae 259 368 1.08 -0.23
INGASA Inga sapindoides Fabaceae 39 250 1.79 0.20
INGASP Inga spectabilis Fabaceae 4 17 0.76 -0.86
INGAUM Inga umbellifera Fabaceae 46 830 1.25 0.69
INGAVE Inga vera Fabaceae 8 0 0.00 -0.17
JAC1CO Jacaranda copaia Bignoniaceae 17 264 41.91 -1.94
LACIAG Lacistema aggregatum Flacourtiaceae 245 1404 1.34 0.45
LACMPA Lacmellea panamensis Apocynaceae 32 98 1.60 0.59
LAETTH Laetia thamnia Flacourtiaceae 25 451 0.88 0.04
LICAHY Licania hypoleuca Chrysobalanaceae 11 127 0.50 1.08
LICAPL Licania platypus Chrysobalanaceae 13 282 0.87 0.52
LINDLA Lindackeria laurina Flacourtiaceae 2 70 2.12 -0.34
LONCLA Lonchocarpus heptaphyllus Fabaceae 63 734 6.48 0.58
LUEHSE Luehea seemannii Tiliaceae 51 217 18.88 -1.14
MACRGL Macrocnemum roseum Rubiaceae 1 91 1.80 1.35
MALMSP Mosannona garwoodii Annonaceae 32 436 0.64 1.50
MAQUCO Maquira guianensis Moraceae 9 1460 4.10 0.88
MAYTSC Maytenus schippii Celastraceae 5 81 0.69 1.13
MICOAF Miconia affinis Melastomataceae 31 375 0.51 -1.29
MICOAR Miconia argentea Melastomataceae 102 600 2.46 -3.30
MICOEL Miconia elata Melastomataceae 1 17 0.04 -1.10
MICOHO Miconia hondurensis Melastomataceae 5 55 0.19 -0.39
MYRCGA Myrcia gatunensis Myrtaceae 14 48 0.17 0.24
MYROFR Myrospermum frutescens Fabaceae 5 13 0.66 0.26

NECTCI Nectandra cissiflora Lauraceae 22 197 0.99 0.46
NECTGL Nectandra lineata Lauraceae 136 98 0.80 -0.68
NECTPU Nectandra purpurea Lauraceae 2 75 0.14 0.09
OCHRPY Ochroma pyramidale Bombacaceae 1 9 0.56 -1.07
OCOTCE Ocotea cernua Lauraceae 67 222 0.84 0.57
OCOTOB Ocotea oblonga Lauraceae 95 148 2.30 -1.61
OCOTPU Ocotea puberula Lauraceae 33 138 1.53 -0.58
OCOTWH Ocotea whitei Lauraceae 2407 429 19.96 -0.78
OLMEAS Trophis caucana Moraceae 81 175 0.85 -0.67
ORMOCR Ormosia coccinea Fabaceae 6 88 0.89 1.40
ORMOMA Ormosia macrocalyx Fabaceae 11 107 0.75 1.53
PENTMA Pentagonia macrophylla Rubiaceae 3 308 0.24 0.87
PEREXA Perebea xanthochyma Moraceae 5 242 0.63 0.72
PHOECI Cinnamomum triplinerve Lauraceae 82 61 1.50 -0.07
PICRLA Picramnia latifolia Picramniaceae 245 1047 1.50 0.42
PIPEA1 Piper arboreum Piperaceae 2 22 0.02 0.05
PIPERE Piper reticulatum Piperaceae 10 123 0.34 0.23
PLA1PI Platymiscium pinnatum Fabaceae 230 147 8.81 -0.60
PLA2EL Platypodium elegans Fabaceae 28 124 12.18 -0.36
POSOLA Posoqueria latifolia Rubiaceae 4 72 0.75 1.40
POULAR Poulsenia armata Moraceae 7 1404 26.08 -0.66
POURBI Pourouma bicolor Cecropiaceae 22 59 0.96 -1.58
POUTRE Pouteria reticulata Sapotaceae 1616 1401 18.05 0.56
POUTST Pouteria stipitata Sapotaceae 9 71 1.62 0.66
PRI2CO Prioria copaifera Fabaceae 94 1382 64.31 1.33
PROTCO Protium costaricense Burseraceae 28 758 2.66 0.13
PROTPA Protium panamense Burseraceae 122 2899 3.57 0.95
PROTSP Protium confusum Burseraceae 1 4 0.01 0.10
PROTTE Protium tenuifolium Burseraceae 449 2853 18.48 0.63
PSE1SE Pseudobombax septenatum Bombacaceae 1 16 4.27 -0.02
PSIDFR Psidium friedrichsthalianum Myrtaceae 3 53 0.15 0.94
PSYCG3 Psychotria grandis Rubiaceae 3 46 0.06 -0.95
PTERRO Pterocarpus rohrii Fabaceae 62 1464 3.57 0.77
QUARAS Quararibea asterolepis Bombacaceae 3187 2200 99.24 1.05
QUASAM Quassia amara Simaroubaceae 2 131 0.33 1.12
RANDAR Randia armata Rubiaceae 771 1003 5.03 0.84
SAPIAU Sapium glandulosum Euphorbiaceae 3 40 2.55 -2.27
SIMAAM Simarouba amara Simaroubaceae 255 1230 17.58 -1.25
SIPAPA Siparuna pauciflora Monimiaceae 35 315 0.53 0.29
SLOATE Sloanea terniflora Elaeocarpaceae 7 493 6.51 1.60
SOLAHA Solanum hayesii Solanaceae 8 50 0.33 -3.18
SPONMO Spondias mombin Anacardiaceae 2 83 5.11 -1.73
SPONRA Spondias radlkoferi Anacardiaceae 86 260 8.03 -1.13
STERAP Sterculia apetala Sterculiaceae 7 56 6.29 0.05
SWARS Swartzia simplex Fabaceae 1163 5554 12.34 1.85
SYMPGL Symphonia globulifera Clusiaceae 14 160 1.82 -0.14
TAB1GU Tabebuia guayacan Bignoniaceae 15 69 9.11 1.04
TAB1RO Tabebuia rosea Bignoniaceae 59 245 6.04 -0.19
TAB2AR Tabernaemontana arborea Apocynaceae 140 1506 28.61 0.80
TACHVE Tachigali versicolor Fabaceae 384 2485 14.57 -0.19
TALINE Talisia nervosa Sapindaceae 11 747 0.68 2.01
TALIPR Talisia princeps Sapindaceae 77 633 0.43 1.47
TERMAM Terminalia amazonia Combretaceae 1 47 4.06 0.58
TET2PA Tetragastris panamensis Burseraceae 1557 4230 31.38 0.79
THEVAH Thevetia ahouai Apocynaceae 7 74 0.15 0.46
TOCOPI Tocoyena pittieri Rubiaceae 2 7 0.57 -0.30
TREMMI Trema micrantha Ulmaceae 1 28 1.55 -2.56
TRI2PA Trichilia pallida Meliaceae 30 519 2.57 0.07
TRI2TU Trichilia tuberculata Meliaceae 1440 11977 93.23 0.61
TRIPCU Triplaris cumingiana Polygonaceae 28 259 4.60 -0.65
TROPRA Trophis racemosa Moraceae 41 285 1.01 0.77
TURPOC Turpinia occidentalis Staphyleaceae 8 72 2.37 -0.87
UNONPI Unonopsis pittieri Annonaceae 164 656 4.69 0.13
VIROSE Virola sebifera Myristicaceae 47 1615 21.84 0.47
VIROSP Virola multiflora Myristicaceae 2 47 2.13 0.01
VIROSU Virola surinamensis Myristicaceae 17 200 23.24 0.04
VISMBA Vismia baccifera Clusiaceae 11 55 0.07 -1.65
VOCHFE Vochysia ferruginea Vochysiaceae 5 21 0.87 -1.21
XYL1MA Xylopia macrantha Annonaceae 130 1220 4.37 0.69
ZANTBE Zanthoxylum ekmanii Rutaceae 21 234 16.84 -3.52
ZANTP1 Zanthoxylum panamense Rutaceae 24 143 4.03 -0.58
ZANTPR Zanthoxylum acuminatum Rutaceae 4 116 1.13 -0.62
ZUELGU Zuelania guidonia Flacourtiaceae 3 36 0.42 -0.26

Table S2. Estimates of species parameters from the hierarchical Bayesian model of seedling survival. Posterior
parameter means (1 s.d.) are presented for the effects of conspecific and heterospecific seedling density and
adult basal area on seedling survival in the forest on Barro Colorado Island, Panama. See Table S1 for full
species names.
Species code Intercept
Conspecific seedling
Heterospecific seedling
Conspecific adult
Heterospecific adult
ACALMA -2.651 (0.862) -0.142 (0.078) -0.011 (0.019) -0.209 (0.106) 0.005 (0.003)
ADE1TR -1.599 (0.636) -0.123 (0.064) -0.004 (0.017) -0.17 (0.085) 0.006 (0.002)
AEGIPA -1.59 (0.77) -0.18 (0.074) 0.005 (0.017) -0.207 (0.093) 0.007 (0.002)
ALCHCO -3.445 (0.762) 0.012 (0.071) -0.037 (0.023) -0.099 (0.107) 0.002 (0.003)
ALCHLA -2.322 (0.872) -0.162 (0.083) 0.001 (0.018) -0.166 (0.098) 0.006 (0.002)
ALIBED -0.945 (0.672) -0.211 (0.081) 0.015 (0.017) -0.189 (0.088) 0.008 (0.002)
ALLOPS -1.833 (0.638) -0.165 (0.07) 0.004 (0.017) -0.196 (0.086) 0.006 (0.002)
ALSEBL 1.947 (0.361) -0.082 (0.054) -0.011 (0.016) -0.046 (0.048) 0.005 (0.002)
AMAICO -1.044 (0.917) -0.221 (0.087) 0.02 (0.019) -0.194 (0.102) 0.008 (0.002)
ANACEX -2.192 (0.699) -0.003 (0.063) -0.008 (0.018) -0.054 (0.08) 0.004 (0.002)
ANDIIN -0.829 (0.917) -0.204 (0.093) 0.031 (0.021) -0.138 (0.101) 0.008 (0.003)
ANNOSP -3.692 (0.877) -0.058 (0.076) -0.039 (0.025) -0.182 (0.119) 0.003 (0.004)
APEIME -1.955 (0.583) 0.024 (0.062) -0.028 (0.019) 0.001 (0.069) 0.003 (0.002)
APEITI -3.271 (0.865) -0.081 (0.078) -0.025 (0.021) -0.167 (0.105) 0.004 (0.003)
ARDIFE -1.415 (0.832) -0.206 (0.091) 0.024 (0.02) -0.15 (0.098) 0.008 (0.003)
ASPICR -0.479 (0.391) -0.135 (0.058) 0.02 (0.014) -0.094 (0.029) 0.006 (0.002)
AST2GR -0.329 (0.658) -0.173 (0.067) 0.015 (0.017) -0.188 (0.083) 0.007 (0.002)
BEILPE -1.686 (0.072) -0.015 (0.004) 0.007 (0.01) -0.031 (0.009) 0.004 (0.001)
BROSAL -1.351 (0.4) -0.058 (0.053) 0.013 (0.012) -0.06 (0.037) 0.005 (0.002)
CALOLO -0.821 (0.492) -0.131 (0.057) 0.011 (0.015) -0.162 (0.065) 0.005 (0.002)
CASEAC -1.042 (0.677) -0.198 (0.081) 0.022 (0.018) -0.161 (0.088) 0.008 (0.002)
CASEAR -1.915 (0.675) -0.079 (0.062) -0.004 (0.017) -0.114 (0.081) 0.005 (0.002)
CASESY -2.048 (0.791) -0.132 (0.076) 0.004 (0.018) -0.133 (0.089) 0.006 (0.002)
CASSEL -0.456 (0.587) -0.199 (0.071) 0.023 (0.017) -0.199 (0.079) 0.008 (0.002)
CAVAPL -1.793 (0.777) -0.025 (0.062) -0.008 (0.017) -0.07 (0.084) 0.004 (0.002)
CECRIN -3.776 (0.907) 0.058 (0.095) -0.064 (0.032) -0.153 (0.141) 0 (0.005)
CECROB -3.523 (0.914) -0.067 (0.086) -0.046 (0.027) -0.237 (0.132) 0.003 (0.005)
CEDROD -2.177 (0.813) -0.164 (0.079) -0.002 (0.018) -0.191 (0.096) 0.006 (0.002)
CEIBPE -1.793 (0.843) 0.015 (0.074) -0.025 (0.02) -0.111 (0.099) 0.003 (0.003)
CELTSC -1.884 (0.848) -0.144 (0.084) 0.011 (0.018) -0.098 (0.093) 0.007 (0.002)
CHA2SC -0.641 (0.716) -0.227 (0.081) 0.021 (0.018) -0.221 (0.095) 0.008 (0.002)
CHR2AR -0.75 (0.578) -0.136 (0.068) 0.008 (0.014) -0.084 (0.074) 0.006 (0.002)
CHR2CA -1.032 (0.51) -0.123 (0.063) -0.003 (0.012) -0.077 (0.056) 0.006 (0.002)

COCCCO -0.335 (0.746) -0.227 (0.084) 0.025 (0.018) -0.181 (0.096) 0.008 (0.002)
COCCMA -0.077 (0.839) -0.249 (0.092) 0.038 (0.022) -0.185 (0.104) 0.009 (0.003)
CORDAL -2.189 (0.606) -0.087 (0.065) -0.024 (0.018) -0.184 (0.09) 0.004 (0.003)
CORDBI -1.767 (0.522) -0.062 (0.057) -0.006 (0.015) -0.145 (0.073) 0.004 (0.002)
CORDLA -1.479 (0.558) -0.132 (0.061) 0.006 (0.014) -0.186 (0.074) 0.006 (0.002)
COU2CU -0.699 (0.589) -0.177 (0.066) 0.018 (0.016) -0.194 (0.08) 0.007 (0.002)
CROTBI -3.786 (0.556) -0.038 (0.042) -0.035 (0.023) -0.22 (0.118) 0.003 (0.004)
CUPALA -2.022 (0.78) -0.152 (0.073) -0.001 (0.017) -0.195 (0.091) 0.006 (0.002)
CUPARU -1.432 (0.769) -0.202 (0.086) 0.021 (0.019) -0.166 (0.092) 0.008 (0.002)
CUPASY -0.368 (0.666) -0.213 (0.079) 0.029 (0.019) -0.16 (0.091) 0.008 (0.002)
DENDAR -2.26 (0.751) -0.068 (0.068) -0.003 (0.018) -0.074 (0.084) 0.005 (0.002)
DES2PA -0.301 (0.476) -0.152 (0.055) 0.02 (0.013) -0.202 (0.07) 0.007 (0.002)
DIO2AR -1.545 (0.701) -0.186 (0.081) 0.018 (0.018) -0.162 (0.091) 0.007 (0.002)
DIPTPA -1.903 (0.56) -0.049 (0.06) 0.007 (0.014) -0.083 (0.055) 0.005 (0.002)
DRYPST -0.586 (0.363) -0.064 (0.059) -0.005 (0.011) 0.007 (0.03) 0.006 (0.002)
ERY2MA -1.071 (0.626) -0.181 (0.069) 0.013 (0.017) -0.206 (0.088) 0.007 (0.002)
ERY2PA -1.611 (0.811) -0.199 (0.092) 0.023 (0.02) -0.147 (0.1) 0.008 (0.003)
EUGECO -1.093 (0.552) -0.154 (0.064) 0.018 (0.016) -0.155 (0.075) 0.006 (0.002)
EUGEGA -0.453 (0.558) -0.226 (0.07) 0.028 (0.017) -0.207 (0.08) 0.008 (0.002)
EUGENE -0.014 (0.576) -0.196 (0.073) 0.017 (0.014) -0.134 (0.081) 0.008 (0.002)
EUGEOE -0.515 (0.384) -0.101 (0.04) 0.004 (0.009) -0.203 (0.067) 0.006 (0.001)
FARAOC -0.749 (0.246) -0.076 (0.036) 0.014 (0.008) -0.189 (0.038) 0.005 (0.001)
GAR2IN 0.565 (0.644) -0.21 (0.072) 0.029 (0.019) -0.231 (0.089) 0.008 (0.002)
GAR2MA -0.319 (0.744) -0.24 (0.083) 0.027 (0.019) -0.22 (0.095) 0.008 (0.002)
GENIAM -1.255 (0.872) -0.173 (0.088) 0.024 (0.019) -0.111 (0.097) 0.008 (0.002)
GUAPST -1.544 (0.629) -0.071 (0.064) 0.006 (0.016) -0.057 (0.074) 0.005 (0.002)
GUARGR -0.747 (0.753) -0.185 (0.073) 0.014 (0.017) -0.195 (0.089) 0.007 (0.002)
GUARGU -0.508 (0.448) -0.1 (0.053) 0.004 (0.013) -0.104 (0.057) 0.006 (0.001)
GUARSP -0.787 (0.634) -0.179 (0.069) 0.012 (0.015) -0.199 (0.079) 0.007 (0.002)
GUATDU -0.908 (0.556) -0.063 (0.057) -0.009 (0.016) -0.059 (0.065) 0.004 (0.002)
GUAZUL -2.718 (0.781) -0.05 (0.067) -0.024 (0.02) -0.16 (0.1) 0.003 (0.003)
GUETFO -2.348 (0.707) -0.117 (0.08) 0.009 (0.019) -0.082 (0.088) 0.006 (0.002)
GUSTSU -1.118 (0.329) -0.138 (0.045) 0.025 (0.015) -0.171 (0.034) 0.006 (0.002)
HAMPAP -2.652 (0.741) -0.116 (0.073) -0.027 (0.021) -0.231 (0.108) 0.004 (0.004)
HASSFL -1.868 (0.695) -0.089 (0.064) -0.001 (0.016) -0.102 (0.079) 0.005 (0.002)
HEISAC -0.747 (0.793) -0.222 (0.082) 0.021 (0.018) -0.207 (0.095) 0.008 (0.002)
HEISCO -0.813 (0.553) -0.12 (0.058) 0.013 (0.015) -0.132 (0.07) 0.006 (0.002)
HERRPU -1.014 (0.761) -0.212 (0.091) 0.028 (0.02) -0.149 (0.096) 0.008 (0.003)
HIRTAM -1.52 (0.875) -0.195 (0.086) 0.015 (0.018) -0.178 (0.098) 0.007 (0.002)
HIRTTR -0.717 (0.443) -0.069 (0.054) 0 (0.011) -0.087 (0.055) 0.005 (0.001)
HURACR -1.209 (0.691) -0.014 (0.063) 0.002 (0.017) -0.05 (0.082) 0.004 (0.002)

HYERAL -2.509 (0.726) -0.028 (0.064) -0.011 (0.018) -0.053 (0.085) 0.004 (0.002)
INGACO -1.863 (0.733) -0.169 (0.076) 0.005 (0.017) -0.171 (0.09) 0.007 (0.002)
INGAFA -0.953 (0.737) -0.199 (0.074) 0.013 (0.017) -0.213 (0.09) 0.007 (0.002)
INGAGO -0.818 (0.719) -0.185 (0.072) 0.015 (0.017) -0.201 (0.085) 0.007 (0.002)
INGAM2 -1.56 (0.637) -0.165 (0.069) 0.008 (0.016) -0.182 (0.085) 0.007 (0.002)
INGAMA -1.475 (0.431) -0.086 (0.05) -0.01 (0.01) -0.23 (0.067) 0.005 (0.002)
INGAMI -1.904 (0.916) -0.182 (0.086) 0.011 (0.019) -0.17 (0.101) 0.007 (0.002)
INGAPE -1.112 (0.861) -0.199 (0.08) 0.016 (0.018) -0.203 (0.097) 0.007 (0.002)
INGAQU -1.492 (0.675) -0.153 (0.073) 0.016 (0.017) -0.127 (0.084) 0.007 (0.002)
INGAS1 -1.328 (0.605) -0.174 (0.068) 0.003 (0.012) -0.196 (0.079) 0.007 (0.002)
INGASA -1.314 (0.626) -0.161 (0.068) 0.012 (0.016) -0.175 (0.079) 0.007 (0.002)
INGASP -2.539 (0.849) -0.125 (0.077) -0.006 (0.018) -0.148 (0.098) 0.006 (0.002)
INGAUM -0.124 (0.73) -0.222 (0.077) 0.02 (0.018) -0.228 (0.091) 0.008 (0.002)
INGAVE -1.472 (0.819) -0.203 (0.08) 0.011 (0.018) -0.218 (0.097) 0.007 (0.002)
JAC1CO -2.37 (0.752) 0.029 (0.07) -0.031 (0.021) -0.09 (0.099) 0.002 (0.003)
LACIAG -1.203 (0.67) -0.224 (0.078) 0.025 (0.018) -0.229 (0.089) 0.007 (0.002)
LACMPA -1.693 (0.67) -0.148 (0.073) 0.016 (0.017) -0.14 (0.082) 0.007 (0.002)
LAETTH -1.098 (0.702) -0.192 (0.072) 0.013 (0.018) -0.216 (0.087) 0.007 (0.002)
LICAHY -0.734 (0.779) -0.218 (0.084) 0.024 (0.019) -0.184 (0.094) 0.008 (0.002)
LICAPL -1.444 (0.74) -0.17 (0.078) 0.013 (0.018) -0.155 (0.088) 0.007 (0.002)
LINDLA -2.272 (0.81) -0.108 (0.071) -0.002 (0.018) -0.125 (0.089) 0.006 (0.002)
LONCLA -1.107 (0.567) -0.134 (0.062) 0.022 (0.018) -0.188 (0.077) 0.006 (0.002)
LUEHSE -2.985 (0.703) 0.018 (0.066) -0.024 (0.02) -0.034 (0.086) 0.003 (0.003)
MACRGL -1.028 (0.881) -0.176 (0.083) 0.023 (0.019) -0.135 (0.095) 0.007 (0.002)
MALMSP -0.74 (0.746) -0.213 (0.086) 0.026 (0.019) -0.161 (0.092) 0.008 (0.002)
MAQUCO -0.069 (0.741) -0.184 (0.072) 0.018 (0.018) -0.186 (0.086) 0.007 (0.002)
MAYTSC -1.155 (0.825) -0.193 (0.086) 0.022 (0.018) -0.152 (0.094) 0.008 (0.002)
MICOAF -1.683 (0.688) -0.169 (0.071) -0.006 (0.018) -0.229 (0.093) 0.006 (0.003)
MICOAR -3.077 (0.713) -0.069 (0.072) -0.035 (0.021) -0.212 (0.11) 0.003 (0.004)
MICOEL -2.053 (0.883) -0.173 (0.08) -0.002 (0.018) -0.221 (0.102) 0.006 (0.003)
MICOHO -2.118 (0.843) -0.153 (0.083) -0.006 (0.018) -0.144 (0.093) 0.006 (0.002)
MYRCGA -0.922 (0.76) -0.215 (0.082) 0.016 (0.018) -0.211 (0.093) 0.008 (0.002)
MYROFR -1.866 (0.812) -0.163 (0.08) 0.01 (0.018) -0.148 (0.093) 0.007 (0.002)
NECTCI -0.932 (0.713) -0.191 (0.075) 0.01 (0.016) -0.174 (0.086) 0.007 (0.002)
NECTGL -2.524 (0.654) -0.117 (0.072) -0.009 (0.016) -0.127 (0.085) 0.006 (0.002)
NECTPU -1.839 (0.892) -0.179 (0.086) 0.011 (0.018) -0.173 (0.1) 0.007 (0.002)
OCHRPY -2.414 (0.887) -0.136 (0.077) -0.006 (0.018) -0.176 (0.098) 0.006 (0.002)
OCOTCE -1.314 (0.648) -0.182 (0.074) 0.015 (0.017) -0.166 (0.085) 0.007 (0.002)
OCOTOB -2.04 (0.634) -0.128 (0.065) -0.004 (0.017) -0.23 (0.088) 0.005 (0.003)
OCOTPU -2.08 (0.665) -0.128 (0.067) -0.001 (0.017) -0.158 (0.083) 0.006 (0.002)
OCOTWH -2.508 (0.154) -0.028 (0.011) -0.015 (0.014) -0.032 (0.016) 0.003 (0.002)

OLMEAS -2.059 (0.624) -0.131 (0.07) -0.006 (0.018) -0.155 (0.087) 0.006 (0.002)
ORMOCR -0.298 (0.861) -0.232 (0.086) 0.029 (0.019) -0.196 (0.099) 0.008 (0.002)
ORMOMA -1.043 (0.785) -0.197 (0.087) 0.026 (0.019) -0.138 (0.096) 0.008 (0.002)
PENTMA -0.671 (0.866) -0.231 (0.086) 0.024 (0.019) -0.211 (0.099) 0.008 (0.002)
PEREXA -1.656 (0.81) -0.172 (0.085) 0.014 (0.018) -0.14 (0.097) 0.007 (0.002)
PHOECI -1.769 (0.616) -0.145 (0.069) 0.004 (0.016) -0.153 (0.08) 0.006 (0.002)
PICRLA -1 (0.57) -0.168 (0.065) 0.019 (0.016) -0.195 (0.08) 0.007 (0.002)
PIPEA1 -2.088 (0.891) -0.173 (0.087) 0.008 (0.018) -0.159 (0.1) 0.007 (0.002)
PIPERE -2.336 (0.803) -0.149 (0.085) 0.007 (0.018) -0.122 (0.095) 0.007 (0.002)
PLA1PI -1.624 (0.487) -0.1 (0.054) -0.008 (0.013) -0.164 (0.067) 0.005 (0.002)
PLA2EL -1.956 (0.593) -0.051 (0.059) -0.008 (0.017) -0.094 (0.073) 0.004 (0.002)
POSOLA -0.424 (0.881) -0.228 (0.086) 0.029 (0.02) -0.19 (0.099) 0.008 (0.002)
POULAR -1.82 (0.724) -0.021 (0.062) -0.014 (0.018) -0.082 (0.086) 0.004 (0.002)
POURBI -2.893 (0.795) -0.099 (0.072) -0.016 (0.019) -0.152 (0.095) 0.005 (0.003)
POUTRE -0.214 (0.091) -0.005 (0.007) 0.011 (0.011) -0.142 (0.023) 0.006 (0.001)
POUTST -1.745 (0.761) -0.142 (0.078) 0.011 (0.017) -0.113 (0.088) 0.007 (0.002)
PRI2CO -1.103 (0.449) -0.023 (0.055) 0.004 (0.014) 0 (0.011) 0.005 (0.002)
PROTCO -1.152 (0.65) -0.149 (0.065) 0.005 (0.016) -0.16 (0.081) 0.006 (0.002)
PROTPA -0.591 (0.606) -0.179 (0.069) 0.021 (0.017) -0.175 (0.08) 0.007 (0.002)
PROTSP -1.361 (0.896) -0.207 (0.085) 0.012 (0.018) -0.205 (0.098) 0.007 (0.002)
PROTTE -0.226 (0.362) -0.093 (0.048) 0.011 (0.012) -0.129 (0.048) 0.006 (0.001)
PSE1SE -1.708 (0.82) -0.108 (0.068) 0.002 (0.017) -0.123 (0.088) 0.006 (0.002)
PSIDFR -1.387 (0.848) -0.204 (0.088) 0.022 (0.019) -0.168 (0.1) 0.008 (0.002)
PSYCG3 -2.191 (0.867) -0.167 (0.081) -0.002 (0.018) -0.199 (0.1) 0.006 (0.002)
PTERRO -1.001 (0.612) -0.147 (0.067) 0.013 (0.015) -0.134 (0.078) 0.007 (0.002)
QUARAS -0.294 (0.062) 0.004 (0.005) -0.012 (0.01) 0.005 (0.005) 0.004 (0.002)
QUASAM -0.644 (0.894) -0.227 (0.087) 0.025 (0.019) -0.197 (0.101) 0.008 (0.002)
RANDAR -0.459 (0.482) -0.153 (0.055) 0.015 (0.01) -0.16 (0.068) 0.007 (0.002)
SAPIAU -2.571 (0.854) -0.084 (0.071) -0.024 (0.021) -0.186 (0.1) 0.004 (0.003)
SIMAAM -1.503 (0.534) -0.09 (0.065) -0.003 (0.015) -0.192 (0.068) 0.004 (0.002)
SIPAPA -0.923 (0.715) -0.209 (0.078) 0.014 (0.017) -0.21 (0.089) 0.007 (0.002)
SLOATE -0.65 (0.758) -0.144 (0.072) 0.023 (0.018) -0.107 (0.086) 0.007 (0.002)
SOLAHA -3.822 (0.945) -0.077 (0.082) -0.034 (0.024) -0.187 (0.121) 0.003 (0.004)
SPONMO -2.269 (0.82) -0.071 (0.068) -0.02 (0.02) -0.156 (0.096) 0.004 (0.003)
SPONRA -2.005 (0.577) -0.071 (0.058) -0.011 (0.016) -0.148 (0.079) 0.004 (0.002)
STERAP -2.097 (0.732) -0.07 (0.067) -0.006 (0.016) -0.077 (0.075) 0.005 (0.002)
SWARS 0.156 (0.604) -0.222 (0.073) 0.04 (0.02) -0.206 (0.082) 0.008 (0.002)
SYMPGL -1.831 (0.721) -0.107 (0.077) -0.008 (0.019) -0.056 (0.086) 0.005 (0.002)
TAB1GU -1.41 (0.674) -0.105 (0.068) 0.014 (0.018) -0.094 (0.083) 0.006 (0.002)
TAB1RO -1.51 (0.585) -0.103 (0.06) -0.002 (0.016) -0.136 (0.075) 0.005 (0.002)
TAB2AR -0.619 (0.496) -0.099 (0.057) 0.016 (0.016) -0.14 (0.067) 0.006 (0.002)

TACHVE -0.591 (0.347) -0.09 (0.033) -0.007 (0.011) -0.135 (0.059) 0.005 (0.002)
TALINE -0.325 (0.874) -0.235 (0.092) 0.036 (0.021) -0.17 (0.101) 0.009 (0.003)
TALIPR -0.322 (0.746) -0.239 (0.087) 0.031 (0.02) -0.198 (0.095) 0.008 (0.003)
TERMAM -1.404 (0.827) -0.128 (0.071) 0.01 (0.017) -0.119 (0.086) 0.006 (0.002)
TET2PA -0.094 (0.239) -0.082 (0.037) 0.006 (0.009) -0.074 (0.017) 0.005 (0.001)
THEVAH -1.271 (0.794) -0.21 (0.083) 0.018 (0.018) -0.196 (0.097) 0.008 (0.002)
TOCOPI -2.239 (0.863) -0.147 (0.081) 0.002 (0.018) -0.15 (0.095) 0.006 (0.002)
TREMMI -3.18 (0.916) -0.073 (0.074) -0.027 (0.022) -0.175 (0.109) 0.004 (0.003)
TRI2PA -1.184 (0.661) -0.157 (0.067) 0.009 (0.016) -0.181 (0.083) 0.006 (0.002)
TRI2TU 0.135 (0.282) -0.041 (0.043) -0.002 (0.008) -0.03 (0.022) 0.004 (0.001)
TRIPCU -1.278 (0.623) -0.12 (0.06) -0.005 (0.016) -0.166 (0.079) 0.005 (0.002)
TROPRA -1.12 (0.68) -0.184 (0.076) 0.015 (0.017) -0.155 (0.086) 0.007 (0.002)
TURPOC -2.678 (0.765) -0.091 (0.07) -0.008 (0.018) -0.124 (0.092) 0.005 (0.002)
UNONPI -1.702 (0.539) -0.1 (0.061) -0.002 (0.015) -0.072 (0.073) 0.005 (0.002)
VIROSE -2.493 (0.658) 0 (0.068) -0.004 (0.019) 0.002 (0.082) 0.004 (0.002)
VIROSP -1.801 (0.841) -0.132 (0.074) 0.005 (0.017) -0.139 (0.091) 0.006 (0.002)
VIROSU -2.093 (0.716) -0.019 (0.064) -0.005 (0.017) -0.052 (0.073) 0.004 (0.002)
VISMBA -2.887 (0.789) -0.13 (0.078) -0.014 (0.02) -0.18 (0.102) 0.005 (0.003)
VOCHFE -2.196 (0.811) -0.127 (0.075) -0.01 (0.018) -0.166 (0.097) 0.005 (0.002)
XYL1MA 0.019 (0.578) -0.184 (0.066) 0.015 (0.017) -0.183 (0.08) 0.007 (0.002)
ZANTBE -3.413 (0.873) 0.036 (0.08) -0.045 (0.026) -0.136 (0.123) 0.001 (0.004)
ZANTP1 -2.462 (0.67) -0.075 (0.066) -0.008 (0.018) -0.1 (0.083) 0.005 (0.002)
ZANTPR -1.46 (0.832) -0.167 (0.073) 0.003 (0.018) -0.211 (0.094) 0.006 (0.002)
ZUELGU -2.046 (0.821) -0.159 (0.08) 0.004 (0.018) -0.166 (0.093) 0.006 (0.002)

Table S3. AIC values for generalized linear models of seedling survival as a function of adult neighbor basal area,
with the effects of adult neighbors declining exponentially with distance as exp(-β •distance). The value of β that
produced the lowest AIC value (i.e. the best fit to the data) is in bold. ∆ AIC is the difference in AIC between the
given model and the best fit model.
Distance decay (β) AIC ∆ AIC
0 40015 410
0.1 39650 45
0.2 39605 0
0.3 39721 116
0.4 39853 248
0.5 39958 353
0.6 40036 431
0.7 40093 488
0.8 40136 531
0.9 40169 564
1 40195 590
1.5 40272 667
2 40313 708
3 40359 754

References
S1. S. P. Hubbell et al., Science 283, 554 ( 1999).
S2. E. Losos, E. G. J. Leigh, Eds., Tropical Forest Diversity and Dynamism: Findings from a Large-Scale Plot
Network (University of Chicago Press, Chicago, 2004), pp.
S3. R. Condit, Tropical Forest Census Plots. (Springer-Verlag, Berlin, 1998), pp.
S4. L. S. Comita, S. Aguilar, R. Perez, S. Lao, S. P. Hubbell, Journal of Vegetation Science 18, 163 (2007).
S5. L. S. Comita, S. P. Hubbell, Ecology 90, 328 (2009).
S6. L. S. Comita, R. Condit, S. P. Hubbell, Journal of Ecology 95, 482 (2007).
S7. S. P. Hubbell, R. Condit, R. B. Foster. (2005). Barro Colorado Forest Census Plot Data. URL:
https://ctfs.arnarb.harvard.edu/webatlas/datasets/bci.
S8. S. P. Hubbell, J. A. Ahumada, R. Condit, R. B. Foster, Ecological Research 16, 859 (2001).
S9. H. Morlon et al., Ecology Letters 12, 488 ( 2009).
S10. S. J. Wright, H. C. Muller-Landau, R. Condit, S. P. Hubbell, Ecology 84, 3174 ( 2003).
S11. R. K. Kobe, S. W. Pacala, J. A. Silander, C. D. Canham, Ecological Applications 5, 517 ( 1995).
S12. S. P. Hubbell, in Forest Biodiversity Research, Monitoring and Modeling: Conceptual Background and Old
World Case Studies, D. F., J. A. Comiskey, Eds. (Parthenon Publishing, Pearl River, NY, 1998), vol. 20, pp.
17-44.
S13. R. Condit et al., Science 313, 98 (2006).
S14. A. Gelman, J. Hill, Data Analysis Using Regression and Multilevel/Hierarchical Models (Cambridge
University Press, Cambridge, UK, 2006), pp.
S15. D. J. Lunn, A. Thomas, N. Best, D. Spiegelhalter, Statistics and Computing 10, 325 (2000).
S16. S. P. Brooks, A. Gelman, Journal of Computational and Graphical Statistics 7, 434 ( 1998).
Related Documents