C H A P T E R Astrophysics and Cosmology CHAPTER-OPENING QUESTIONS—Guess now! 1. Until recently, astronomers expected the expansion rate of the universe would be decreasing. Why? (a) Friction. (b) The second law of thermodynamics. (c) Gravity. (d) The electromagnetic force. 2. The universe began expanding right at the beginning. How long will it continue to expand? (a) Until it runs out of room. (b) Until friction slows it down and brings it to a stop. (c) Until all galaxies are moving at the speed of light relative to the center. (d) Possibly forever. I n the previous Chapter, we studied the tiniest objects in the universe—the elementary particles. Now we leap to the grandest objects in the universe— stars, galaxies, and clusters of galaxies—plus the history and structure of the universe itself. These two extreme realms, elementary particles and the cosmos, are among the most intriguing and exciting subjects in science. And, surprisingly, these two extreme realms are related in a fundamental way, as was already hinted in Chapter 32. 947 CONTENTS 33–1 Stars and Galaxies 33–2 Stellar Evolution: Birth and Death of Stars, Nucleosynthesis 33–3 Distance Measurements 33–4 General Relativity: Gravity and the Curvature of Space 33–5 The Expanding Universe: Redshift and Hubble’s Law 33–6 The Big Bang and the Cosmic Microwave Background 33–7 The Standard Cosmological Model: Early History of the Universe 33–8 Inflation: Explaining Flatness, Uniformity, and Structure 33–9 Dark Matter and Dark Energy 33–10 Large-Scale Structure of the Universe 33–11 Finally p 33 This Hubble eXtreme Deep Field (XDF) photograph is of a very small part of the sky. It includes what may be the most distant galaxies observable by us (small red and green squares, and shown enlarged in the corners), with and 11.9, that already existed when the universe was about 0.4 billion years old. We see these galaxies as they appeared then, 13.4 billion years ago, which is when they emitted this light. The most distant galaxies were young and small and grew to become large galaxies by colliding and merging with other small galaxies. We examine the latest theories on how stars and galaxies form and evolve, including the role of nucleosynthesis, as well as Einstein’s general theory of relativity which deals with gravity and curvature of space. We take a thorough look at the evidence for the expansion of the universe, and the Standard Model of the universe evolving from an initial Big Bang. We point out some unsolved problems, including the nature of dark matter and dark energy that make up most of our universe. z L 8.8 z = 11.9 z = 8.8

Welcome message from author
This document is posted to help you gain knowledge. Please leave a comment to let me know what you think about it! Share it to your friends and learn new things together.
Transcript
C
HA P T E
R
Astrophysics andCosmologyCHAPTER-OPENING QUESTIONS—Guess now!1. Until recently, astronomers expected the expansion rate of the universe wouldbe decreasing. Why?
(a) Friction.(b) The second law of thermodynamics.(c) Gravity.(d) The electromagnetic force.
2. The universe began expanding right at the beginning. How long will it continueto expand?
(a) Until it runs out of room.(b) Until friction slows it down and brings it to a stop.(c) Until all galaxies are moving at the speed of light relative to the center.(d) Possibly forever.
I n the previous Chapter, we studied the tiniest objects in the universe—theelementary particles. Now we leap to the grandest objects in the universe—stars, galaxies, and clusters of galaxies—plus the history and structure of the
universe itself. These two extreme realms, elementary particles and the cosmos,are among the most intriguing and exciting subjects in science. And, surprisingly,these two extreme realms are related in a fundamental way, as was already hintedin Chapter 32.
947
CONTENTS
33–1 Stars and Galaxies
33–2 Stellar Evolution: Birth andDeath of Stars,Nucleosynthesis
33–3 Distance Measurements
33–4 General Relativity: Gravityand the Curvature of Space
33–5 The Expanding Universe:Redshift and Hubble’s Law
33–6 The Big Bang and the CosmicMicrowave Background
33–7 The Standard CosmologicalModel: Early History of theUniverse
33–8 Inflation: Explaining Flatness,Uniformity, and Structure
33–9 Dark Matter and Dark Energy
33–10 Large-Scale Structure of theUniverse
33–11 Finally p
33
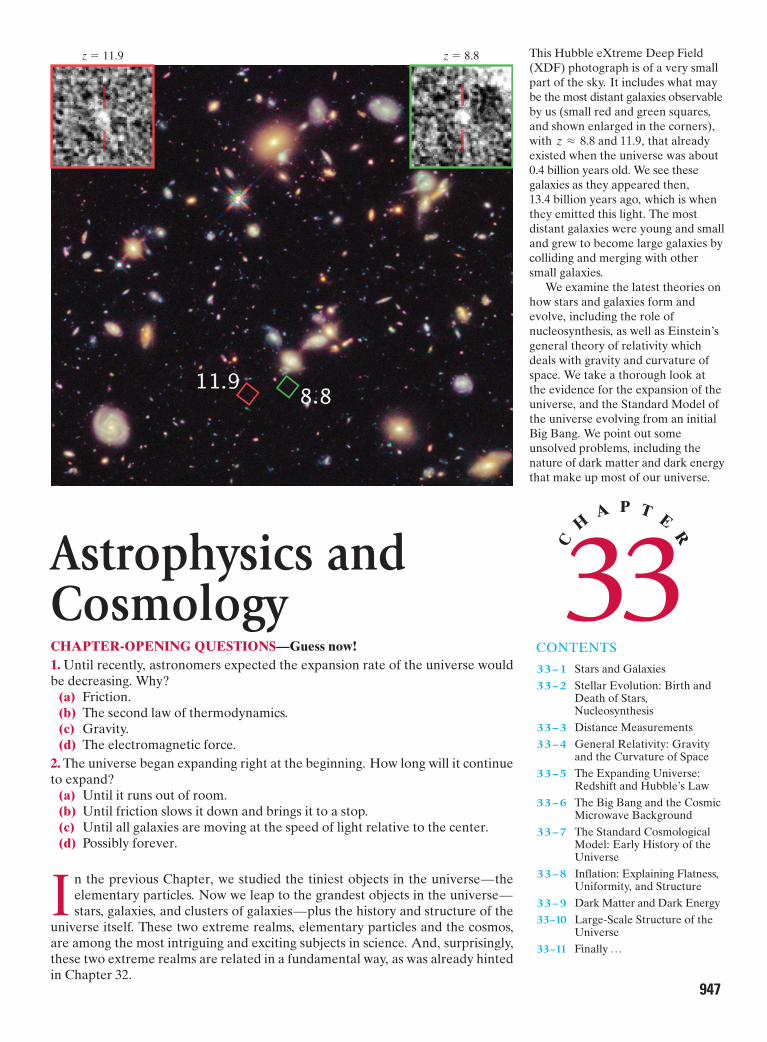
This Hubble eXtreme Deep Field(XDF) photograph is of a very smallpart of the sky. It includes what maybe the most distant galaxies observableby us (small red and green squares,and shown enlarged in the corners),with and 11.9, that alreadyexisted when the universe was about 0.4 billion years old. We see thesegalaxies as they appeared then,13.4 billion years ago, which is whenthey emitted this light. The mostdistant galaxies were young and smalland grew to become large galaxies bycolliding and merging with othersmall galaxies.
We examine the latest theories onhow stars and galaxies form andevolve, including the role ofnucleosynthesis, as well as Einstein’sgeneral theory of relativity whichdeals with gravity and curvature ofspace. We take a thorough look atthe evidence for the expansion of theuniverse, and the Standard Model ofthe universe evolving from an initialBig Bang. We point out someunsolved problems, including thenature of dark matter and dark energythat make up most of our universe.
z L 8.8
z = 11.9 z = 8.8
Use of the techniques and ideas of physics to study the night sky is oftenreferred to as astrophysics. Central to our present theoretical understanding ofthe universe (or cosmos) is Einstein’s general theory of relativity which representsour most complete understanding of gravitation. Many other aspects of physicsare involved, from electromagnetism and thermodynamics to atomic and nuclearphysics as well as elementary particles. General Relativity serves also as thefoundation for modern cosmology, which is the study of the universe as a whole.Cosmology deals especially with the search for a theoretical framework to under-stand the observed universe, its origin, and its future. The questions posed bycosmology are profound and difficult; the possible answers stretch the imagina-tion. They are questions like “Has the universe always existed, or did it havea beginning in time?” Either alternative is difficult to imagine: time going backindefinitely into the past, or an actual moment when the universe began (but,then, what was there before?). And what about the size of the universe? Is itinfinite in size? It is hard to imagine infinity. Or is it finite in size? This is alsohard to imagine, for if the universe is finite, it does not make sense to ask what isbeyond it, because the universe is all there is.
In the last 10 to 20 years, so much progress has occurred in astrophysics andcosmology that many scientists are calling recent work a “Golden Age” forcosmology. Our survey will be qualitative, but we will nonetheless touch on themajor ideas. We begin with a look at what can be seen beyond the Earth.
33–1 Stars and GalaxiesAccording to the ancients, the stars, except for the few that seemed to moverelative to the others (the planets), were fixed on a sphere beyond the last planet.The universe was neatly self-contained, and we on Earth were at or near itscenter. But in the centuries following Galileo’s first telescopic observations of thenight sky in 1609, our view of the universe has changed dramatically. We nolonger place ourselves at the center, and we view the universe as vastly larger.The distances involved are so great that we specify them in terms of the time it takes light to travel the given distance: for example,
The most common unit is the light-year (ly):
For specifying distances to the Sun and Moon, we usually use meters or kilo-meters, but we could specify them in terms of light seconds or minutes. TheEarth–Moon distance is 384,000 km, which is 1.28 light-seconds. The Earth–Sundistance is or 150,000,000 km; this is equal to 8.3 light-minutes (ittakes 8.3 min for light emitted by the Sun to reach us). Far out in our solar system,Pluto is about from the Sun, or † The nearest star to us,other than the Sun, is Proxima Centauri, about 4.2 ly away.
On a clear moonless night, thousands of stars of varying degrees of brightnesscan be seen, as well as the long cloudy stripe known as the Milky Way (Fig. 33–1).Galileo first observed, with his telescope, that the Milky Way is comprised ofcountless individual stars. A century and a half later (about 1750), ThomasWright suggested that the Milky Way was a flat disk of stars extending to greatdistances in a plane, which we call the Galaxy (Greek for “milky way”).
6 * 10–4 ly.6 * 109 km
1.50 * 1011 m,
= 9.46 * 1015 m L 1013 km L 1016 m.
1 ly = A2.998 * 108 m�sB A3.156 * 107 s�yrB
1 light-minute = A3.0 * 108 m�sB(60 s) = 18 * 106 km.
1 light-second = A3.0 * 108 m�sB(1.0 s) = 3.0 * 108 m = 300,000 km;
948 CHAPTER 33 Astrophysics and Cosmology
(a)
(b)†We can also say this is about 5 light-hours.
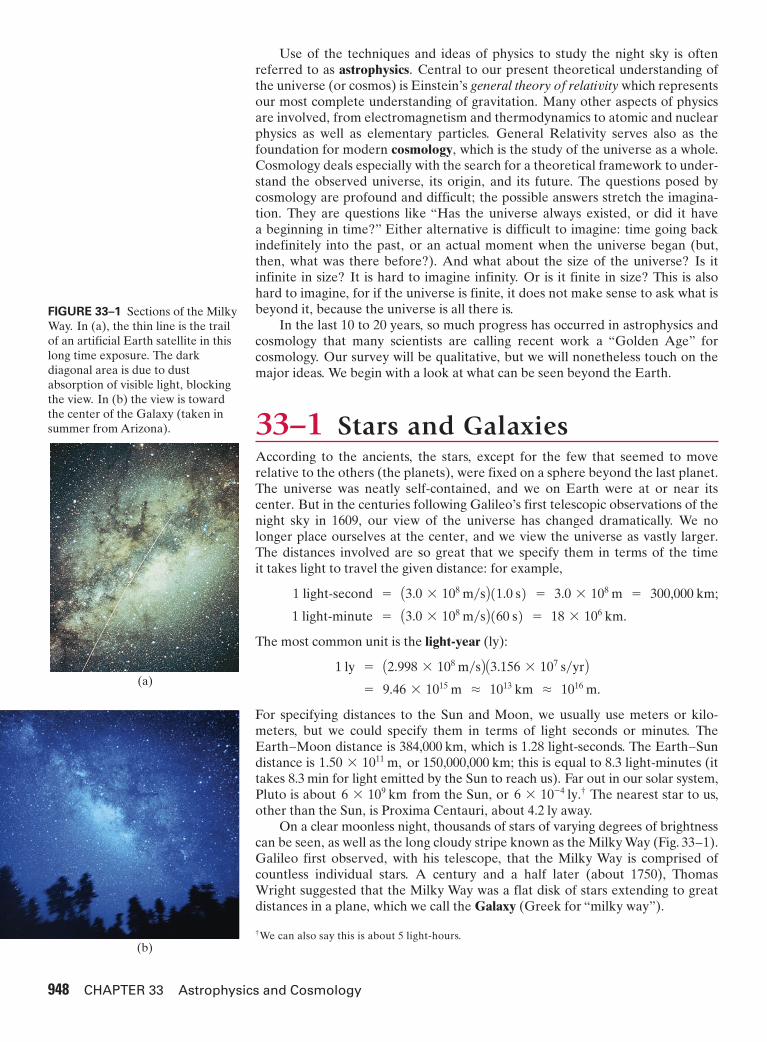
FIGURE 33–1 Sections of the MilkyWay. In (a), the thin line is the trailof an artificial Earth satellite in thislong time exposure. The darkdiagonal area is due to dustabsorption of visible light, blockingthe view. In (b) the view is towardthe center of the Galaxy (taken insummer from Arizona).
SECTION 33–1 949
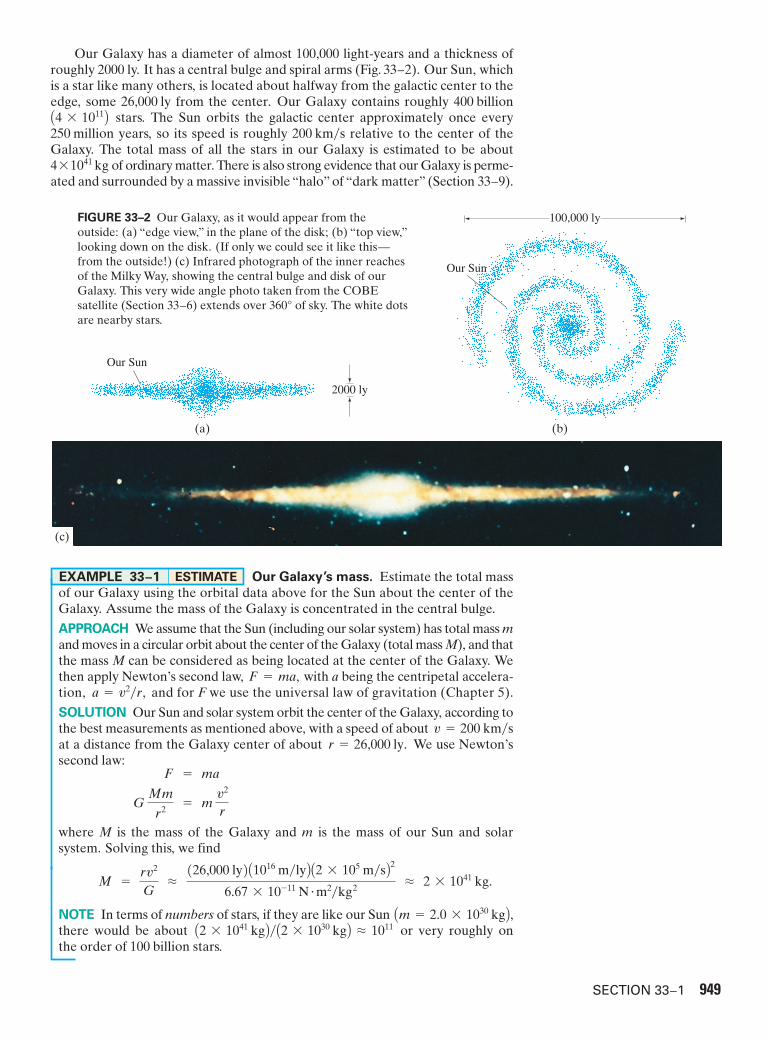
Our Galaxy has a diameter of almost 100,000 light-years and a thickness ofroughly 2000 ly. It has a central bulge and spiral arms (Fig. 33–2). Our Sun, whichis a star like many others, is located about halfway from the galactic center to theedge, some 26,000 ly from the center. Our Galaxy contains roughly 400 billion
stars. The Sun orbits the galactic center approximately once every 250 million years, so its speed is roughly relative to the center of theGalaxy. The total mass of all the stars in our Galaxy is estimated to be about
of ordinary matter. There is also strong evidence that our Galaxy is perme-ated and surrounded by a massive invisible “halo” of “dark matter” (Section 33–9).4 * 1041 kg
200 km�sA4 * 1011B
100,000 ly
(b)(a)
(c)
2000 ly
Our Sun
Our Sun
FIGURE 33–2 Our Galaxy, as it would appear from theoutside: (a) “edge view,” in the plane of the disk; (b) “top view,”looking down on the disk. (If only we could see it like this—from the outside!) (c) Infrared photograph of the inner reachesof the Milky Way, showing the central bulge and disk of ourGalaxy. This very wide angle photo taken from the COBEsatellite (Section 33–6) extends over 360° of sky. The white dotsare nearby stars.
Our Galaxy’s mass. Estimate the total massof our Galaxy using the orbital data above for the Sun about the center of theGalaxy. Assume the mass of the Galaxy is concentrated in the central bulge.
APPROACH We assume that the Sun (including our solar system) has total mass mand moves in a circular orbit about the center of the Galaxy (total mass M), and thatthe mass M can be considered as being located at the center of the Galaxy. Wethen apply Newton’s second law, with a being the centripetal accelera-tion, and for F we use the universal law of gravitation (Chapter 5).
SOLUTION Our Sun and solar system orbit the center of the Galaxy, according tothe best measurements as mentioned above, with a speed of about at a distance from the Galaxy center of about We use Newton’ssecond law:
where M is the mass of the Galaxy and m is the mass of our Sun and solarsystem. Solving this, we find
NOTE In terms of numbers of stars, if they are like our Sun there would be about or very roughly onthe order of 100 billion stars.
A2 * 1041 kgB�A2 * 1030 kgB L 1011Am = 2.0 * 1030 kgB,
M =rv2
GL
(26,000 ly)A1016 m�lyB A2 * 105 m�sB26.67 * 10–11 N�m2�kg2
L 2 * 1041 kg.
GMm
r2= m
v2
r
F = ma
r = 26,000 ly.v = 200 km�s
a = v2�r,F = ma,
EXAMPLE 33;1 ESTIMATE
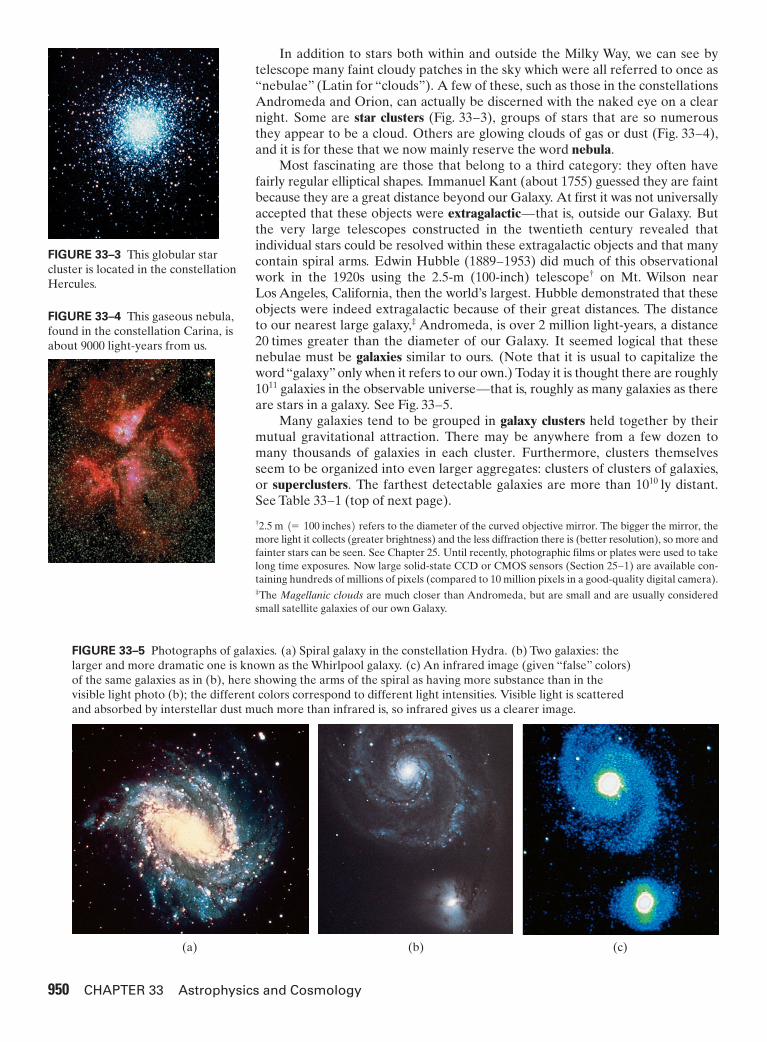
In addition to stars both within and outside the Milky Way, we can see bytelescope many faint cloudy patches in the sky which were all referred to once as“nebulae” (Latin for “clouds”). A few of these, such as those in the constellationsAndromeda and Orion, can actually be discerned with the naked eye on a clearnight. Some are star clusters (Fig. 33–3), groups of stars that are so numerousthey appear to be a cloud. Others are glowing clouds of gas or dust (Fig. 33–4),and it is for these that we now mainly reserve the word nebula.
Most fascinating are those that belong to a third category: they often havefairly regular elliptical shapes. Immanuel Kant (about 1755) guessed they are faintbecause they are a great distance beyond our Galaxy. At first it was not universallyaccepted that these objects were extragalactic—that is, outside our Galaxy. Butthe very large telescopes constructed in the twentieth century revealed thatindividual stars could be resolved within these extragalactic objects and that manycontain spiral arms. Edwin Hubble (1889–1953) did much of this observationalwork in the 1920s using the 2.5-m (100-inch) telescope† on Mt. Wilson near Los Angeles, California, then the world’s largest. Hubble demonstrated that theseobjects were indeed extragalactic because of their great distances. The distanceto our nearest large galaxy,‡ Andromeda, is over 2 million light-years, a distance20 times greater than the diameter of our Galaxy. It seemed logical that thesenebulae must be galaxies similar to ours. (Note that it is usual to capitalize theword “galaxy” only when it refers to our own.) Today it is thought there are roughly
galaxies in the observable universe—that is, roughly as many galaxies as thereare stars in a galaxy. See Fig. 33–5.
Many galaxies tend to be grouped in galaxy clusters held together by theirmutual gravitational attraction. There may be anywhere from a few dozen tomany thousands of galaxies in each cluster. Furthermore, clusters themselvesseem to be organized into even larger aggregates: clusters of clusters of galaxies,or superclusters. The farthest detectable galaxies are more than distant.See Table 33–1 (top of next page).
1010 ly
1011
950 CHAPTER 33 Astrophysics and Cosmology
† refers to the diameter of the curved objective mirror. The bigger the mirror, themore light it collects (greater brightness) and the less diffraction there is (better resolution), so more andfainter stars can be seen. See Chapter 25. Until recently, photographic films or plates were used to takelong time exposures. Now large solid-state CCD or CMOS sensors (Section 25–1) are available con-taining hundreds of millions of pixels (compared to 10 million pixels in a good-quality digital camera).‡The Magellanic clouds are much closer than Andromeda, but are small and are usually consideredsmall satellite galaxies of our own Galaxy.
2.5 m (= 100 inches)
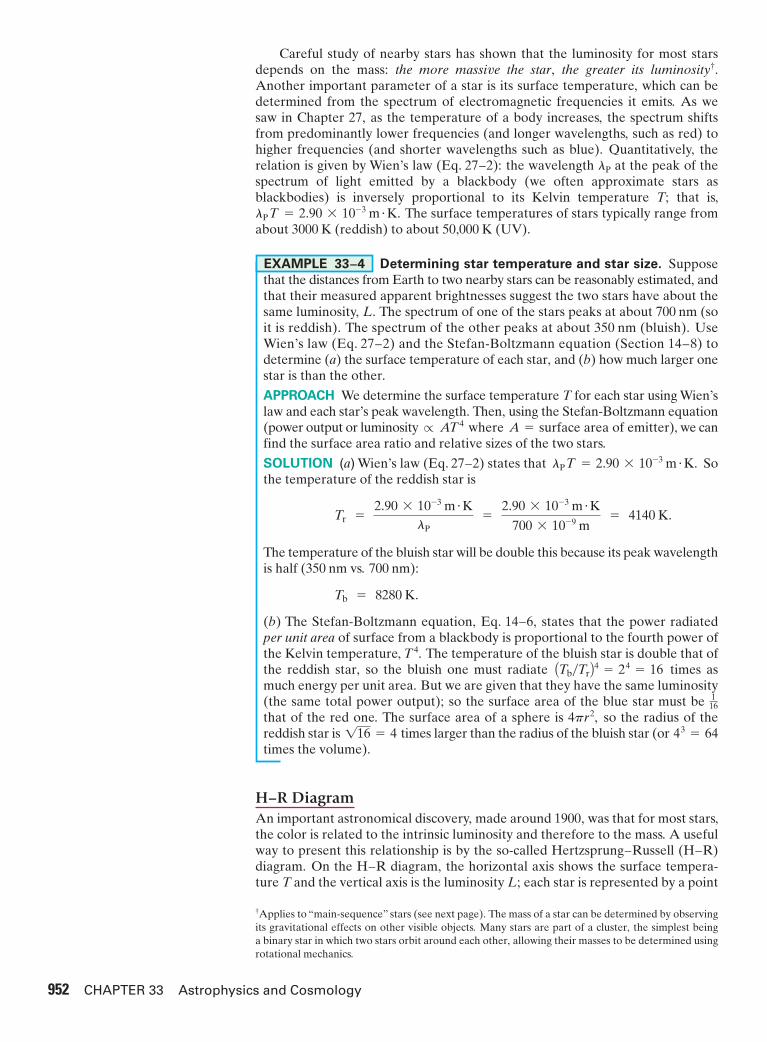
FIGURE 33–5 Photographs of galaxies. (a) Spiral galaxy in the constellation Hydra. (b) Two galaxies: thelarger and more dramatic one is known as the Whirlpool galaxy. (c) An infrared image (given “false” colors)of the same galaxies as in (b), here showing the arms of the spiral as having more substance than in thevisible light photo (b); the different colors correspond to different light intensities. Visible light is scatteredand absorbed by interstellar dust much more than infrared is, so infrared gives us a clearer image.
FIGURE 33–3 This globular starcluster is located in the constellationHercules.
FIGURE 33–4 This gaseous nebula,found in the constellation Carina, isabout 9000 light-years from us.
(a) (b) (c)

Looking back in time. Astronomers oftenthink of their telescopes as time machines, looking back toward the origin of theuniverse. How far back do they look?
RESPONSE The distance in light-years measures how long in years the lighthas been traveling to reach us, so Table 33–1 tells us also how far back in timewe are looking. For example, if we saw Proxima Centauri explode into a super-nova today, then the event would have really occurred about 4.2 years ago. Themost distant galaxies emitted the light we see now roughly ago.What we see was how they were then, ago.
EXERCISE A Suppose we could place a huge mirror 1 light-year away from us. Whatwould we see in this mirror if it is facing us on Earth? When did what we see in themirror take place? (This might be called a “time machine.”)
Besides the usual stars, clusters of stars, galaxies, and clusters and super-clusters of galaxies, the universe contains many other interesting objects. Amongthese are stars known as red giants, white dwarfs, neutron stars, exploding starscalled novae and supernovae, and black holes whose gravity is so strong that evenlight cannot escape them. In addition, there is electromagnetic radiation thatreaches the Earth but does not come from the bright pointlike objects we call stars:particularly important is the microwave background radiation that arrives nearlyuniformly from all directions in the universe.
Finally, there are active galactic nuclei (AGN), which are very luminous point-like sources of light in the centers of distant galaxies. The most dramatic examplesof AGN are quasars (“quasistellar objects” or QSOs), which are so luminous thatthe surrounding starlight of the galaxy is drowned out. Their luminosity isthought to come from matter falling into a giant black hole at a galaxy’s center.
33–2 Stellar Evolution: Birth andDeath of Stars, Nucleosynthesis
The stars appear unchanging. Night after night the night sky reveals no significantvariations. Indeed, on a human time scale, the vast majority of stars change verylittle (except for novae, supernovae, and certain variable stars). Although starsseem fixed in relation to each other, many move sufficiently for the motion to bedetected. Speeds of stars relative to neighboring stars can be hundreds of but at their great distance from us, this motion is detectable only by carefulmeasurement. There is also a great range of brightness among stars, due todifferences in the rate stars emit energy and to their different distances from us.
Luminosity and Brightness of StarsAny star or galaxy has an intrinsic luminosity, L (or simply luminosity), which is its total power radiated in watts. Also important is the apparent brightness, b, definedas the power crossing unit area at the Earth perpendicular to the path of the light.Given that energy is conserved, and ignoring any absorption in space, the totalemitted power L when it reaches a distance d from the star will be spread over asphere of surface area If d is the distance from the star to the Earth, then L must be equal to times b (power per unit area at Earth). That is,
(33;1)
Apparent brightness. Suppose a star has luminosity equalto that of our Sun. If it is 10 ly away from Earth, how much dimmer will it appear?
APPROACH We use the inverse square law in Eq. 33–1 to determine the relativebrightness since the luminosity L is the same for both stars.
SOLUTION Using the inverse square law, the star appears dimmer by a factorbstar
bSun=
dSun2
dstar2
=A1.5 * 108 kmB2
(10 ly)2A1013 km�lyB2 L 2 * 10–12.
Ab r 1�d2B
EXAMPLE 33;3
b =L
4pd2.
4pd24pd2.
km�s,
13 * 109 yr13 * 109 years
CONCEPTUAL EXAMPLE 33;2
SECTION 33–2 951
Table 33–1 AstronomicalDistances
Approx. DistanceObject from Earth (ly)
MoonSunSize of solar system (distance to Pluto)
Nearest star (Proxima Centauri) 4.2
Center of our GalaxyNearest large galaxyFarthest galaxies 13.4 * 109
2.4 * 1062.6 * 104
6 * 10–4
1.6 * 10–54 * 10–8
952 CHAPTER 33 Astrophysics and Cosmology
†Applies to “main-sequence” stars (see next page). The mass of a star can be determined by observingits gravitational effects on other visible objects. Many stars are part of a cluster, the simplest beinga binary star in which two stars orbit around each other, allowing their masses to be determined usingrotational mechanics.
Careful study of nearby stars has shown that the luminosity for most starsdepends on the mass: the more massive the star, the greater its luminosity†.Another important parameter of a star is its surface temperature, which can bedetermined from the spectrum of electromagnetic frequencies it emits. As wesaw in Chapter 27, as the temperature of a body increases, the spectrum shiftsfrom predominantly lower frequencies (and longer wavelengths, such as red) tohigher frequencies (and shorter wavelengths such as blue). Quantitatively, therelation is given by Wien’s law (Eq. 27–2): the wavelength at the peak of thespectrum of light emitted by a blackbody (we often approximate stars asblackbodies) is inversely proportional to its Kelvin temperature T; that is,
The surface temperatures of stars typically range fromabout 3000 K (reddish) to about 50,000 K (UV).
Determining star temperature and star size. Supposethat the distances from Earth to two nearby stars can be reasonably estimated, andthat their measured apparent brightnesses suggest the two stars have about thesame luminosity, L. The spectrum of one of the stars peaks at about 700 nm (soit is reddish). The spectrum of the other peaks at about 350 nm (bluish). UseWien’s law (Eq. 27–2) and the Stefan-Boltzmann equation (Section 14–8) todetermine (a) the surface temperature of each star, and (b) how much larger onestar is than the other.
APPROACH We determine the surface temperature T for each star using Wien’slaw and each star’s peak wavelength. Then, using the Stefan-Boltzmann equation(power output or luminosity ), we canfind the surface area ratio and relative sizes of the two stars.
SOLUTION (a) Wien’s law (Eq. 27–2) states that Sothe temperature of the reddish star is
The temperature of the bluish star will be double this because its peak wavelengthis half (350 nm vs. 700 nm):
(b) The Stefan-Boltzmann equation, Eq. 14–6, states that the power radiatedper unit area of surface from a blackbody is proportional to the fourth power ofthe Kelvin temperature, The temperature of the bluish star is double that ofthe reddish star, so the bluish one must radiate times asmuch energy per unit area. But we are given that they have the same luminosity(the same total power output); so the surface area of the blue star must be that of the red one. The surface area of a sphere is so the radius of thereddish star is times larger than the radius of the bluish star (or times the volume).
H–R DiagramAn important astronomical discovery, made around 1900, was that for most stars,the color is related to the intrinsic luminosity and therefore to the mass. A usefulway to present this relationship is by the so-called Hertzsprung–Russell (H–R)diagram. On the H–R diagram, the horizontal axis shows the surface tempera-ture T and the vertical axis is the luminosity L; each star is represented by a point
43 = 64116 = 44pr2,
116
ATb�TrB4 = 24 = 16T4.
Tb = 8280 K.
Tr =2.90 * 10–3 m�K
lP=
2.90 * 10–3 m�K
700 * 10–9 m= 4140 K.
lP T = 2.90 * 10–3 m�K.
r AT4 where A = surface area of emitter
EXAMPLE 33;4
lP T = 2.90 * 10–3 m�K.
lP

on the diagram, Fig. 33–6. Most stars fall along the diagonal band termed themain sequence. Starting at the lower right we find the coolest stars: by Wien’slaw, constant, their light output peaks at long wavelengths, so they are red-dish in color. They are also the least luminous and therefore of low mass. Fartherup toward the left we find hotter and more luminous stars that are whitish, like ourSun. Still farther up we find even more luminous and more massive stars, bluish incolor. Stars that fall on this diagonal band are called main-sequence stars. Thereare also stars that fall outside the main sequence. Above and to the right we findextremely large stars, with high luminosities but with low (reddish) colortemperature: these are called red giants. At the lower left, there are a few stars oflow luminosity but with high temperature: these are the white dwarfs.
Distance to a star using the H–R diagram
and color. Suppose that detailed study of a certain star suggests that it mostlikely fits on the main sequence of an H–R diagram. Its measured apparentbrightness is and the peak wavelength of its spectrum is
Estimate its distance from us.
APPROACH We find the temperature using Wien’s law, Eq. 27–2. The luminosityis estimated for a main-sequence star on the H–R diagram of Fig. 33–6, andthen the distance is found using the relation between brightness and luminosity,Eq. 33–1.
SOLUTION The star’s temperature, from Wien’s law (Eq. 27–2), is
A star on the main sequence of an H–R diagram at this temperature has lumi-nosity of about read off of Fig. 33–6. Then, from Eq. 33–1,
Its distance from us in light-years is
EXERCISE B Estimate the distance to a 6000-K main-sequence star with an apparentbrightness of 2.0 * 10–12 W�m2.
d =3 * 1018 m
1016 m�lyL 300 ly.
d = B L
4pbL B 1 * 1026 W
4(3.14)A1.0 * 10–12 W�m2B L 3 * 1018 m.
L L 1 * 1026 W,
T L2.90 * 10–3 m�K
600 * 10–9 mL 4800 K.
lP L 600 nm.b = 1.0 * 10–12 W�m2,
EXAMPLE 33;5 ESTIMATE
lP T =
SECTION 33–2 Stellar Evolution: Birth and Death of Stars, Nucleosynthesis 953
FIGURE 33–6 Hertzsprung–Russell(H–R) diagram is a logarithmicgraph of luminosity vs. surfacetemperature T of stars (note that Tincreases to the left).
10,000Surface temperature T (K)
Intr
insi
c lu
min
osity
L (w
atts
)
1029
1023
1024
1025
1026
1027
1028
5000 35007000
White dwarfs
Main sequence
Redgiants
Our Sun
Stellar Evolution; NucleosynthesisWhy are there different types of stars, such as red giants and white dwarfs, as wellas main-sequence stars? Were they all born this way, in the beginning? Or mighteach different type represent a different age in the life cycle of a star? Astronomersand astrophysicists today believe the latter is the case. Note, however, that wecannot actually follow any but the tiniest part of the life cycle of any given starbecause they live for ages vastly greater than ours, on the order of millions orbillions of years. Nonetheless, let us follow the process of stellar evolution fromthe birth to the death of a star, as astrophysicists have theoretically reconstructedit today.
Stars are born, it is believed, when gaseous clouds (mostly hydrogen) contractdue to the pull of gravity. A huge gas cloud might fragment into numerous con-tracting masses, each mass centered in an area where the density is only slightlygreater than that at nearby points. Once such “globules” form, gravity causeseach to contract in toward its center of mass. As the particles of such a protostaraccelerate inward, their kinetic energy increases. Eventually, when the kineticenergy is sufficiently high, the Coulomb repulsion between the positive charges is not strong enough to keep all the hydrogen nuclei apart, and nuclear fusion cantake place.
In a star like our Sun, the fusion of hydrogen (sometimes referred to as“burning”)† occurs via the proton–proton chain (Section 31–3, Eqs. 31–6), in whichfour protons fuse to form a nucleus with the release of rays, positrons,and neutrinos: These reactions require a tem-perature of about corresponding to an average kinetic energy ofabout 1 keV (Eq. 13–8). In more massive stars, the carbon cycle produces thesame net effect: four produce a —see Section 31–3. The fusion reactionstake place primarily in the core of a star, where T may be on the order of to
(The surface temperature is much lower—on the order of a few thousandkelvins.) The tremendous release of energy in these fusion reactions produces an outward pressure sufficient to halt the inward gravitational contraction. Ourprotostar, now really a young star, stabilizes on the main sequence. Exactly wherethe star falls along the main sequence depends on its mass. The more massive thestar, the farther up (and to the left) it falls on the H–R diagram of Fig. 33–6.Our Sun required perhaps 30 million years to reach the main sequence, and isexpected to remain there about 10 billion years Although most stars arebillions of years old, evidence is strong that stars are actually being born at thismoment. More massive stars have shorter lives, because they are hotter and theCoulomb repulsion is more easily overcome, so they use up their fuel faster.Our Sun may remain on the main sequence for but a star ten timesmore massive may reside there for only
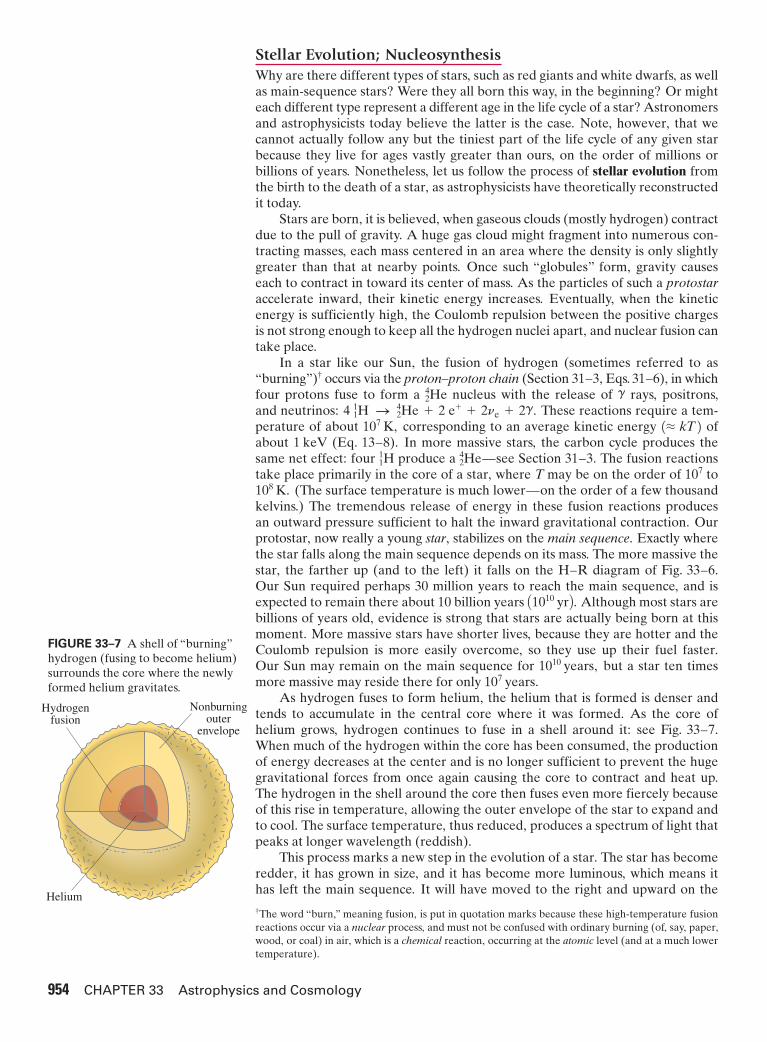
As hydrogen fuses to form helium, the helium that is formed is denser andtends to accumulate in the central core where it was formed. As the core ofhelium grows, hydrogen continues to fuse in a shell around it: see Fig. 33–7.When much of the hydrogen within the core has been consumed, the productionof energy decreases at the center and is no longer sufficient to prevent the hugegravitational forces from once again causing the core to contract and heat up.The hydrogen in the shell around the core then fuses even more fiercely becauseof this rise in temperature, allowing the outer envelope of the star to expand andto cool. The surface temperature, thus reduced, produces a spectrum of light thatpeaks at longer wavelength (reddish).
This process marks a new step in the evolution of a star. The star has becomeredder, it has grown in size, and it has become more luminous, which means it has left the main sequence. It will have moved to the right and upward on the
107 years.1010 years,
A1010 yrB.
108 K.107
24He1
1H
(L kT)107 K,4 1
1H S 24He + 2 e± + 2ne + 2g.
g24He
954 CHAPTER 33 Astrophysics and Cosmology
†The word “burn,” meaning fusion, is put in quotation marks because these high-temperature fusionreactions occur via a nuclear process, and must not be confused with ordinary burning (of, say, paper,wood, or coal) in air, which is a chemical reaction, occurring at the atomic level (and at a much lowertemperature).
FIGURE 33–7 A shell of “burning”hydrogen (fusing to become helium)surrounds the core where the newlyformed helium gravitates.
Nonburningouter
envelope
Hydrogenfusion
Helium
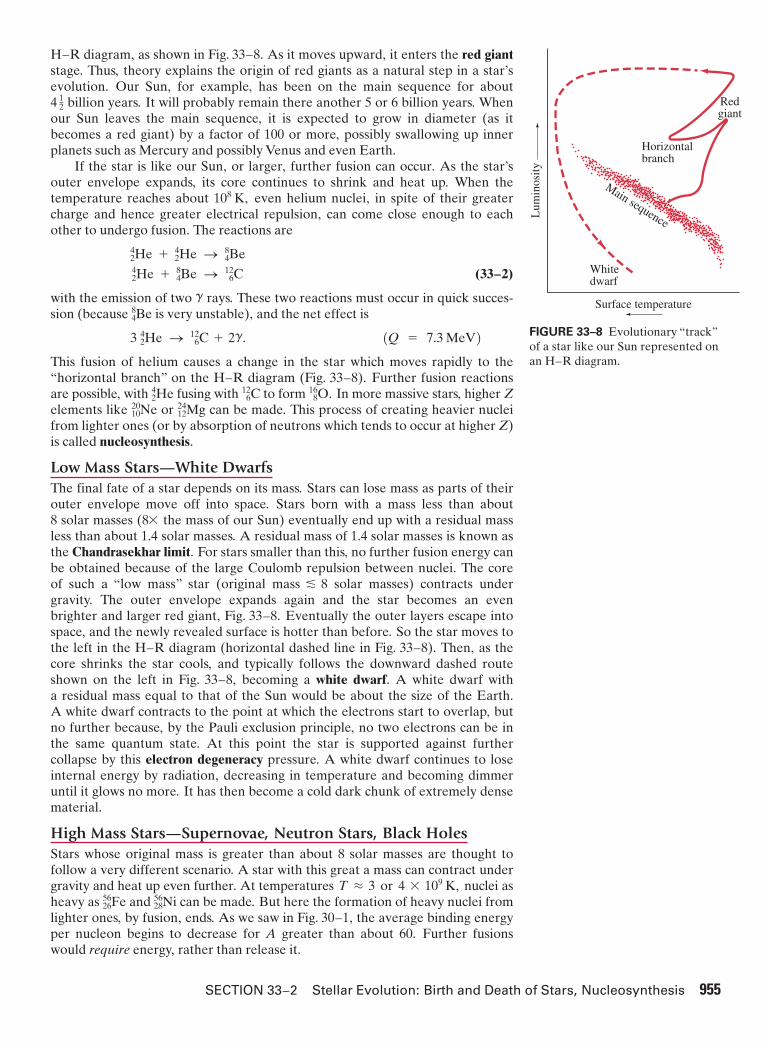
H–R diagram, as shown in Fig. 33–8. As it moves upward, it enters the red giantstage. Thus, theory explains the origin of red giants as a natural step in a star’sevolution. Our Sun, for example, has been on the main sequence for about
billion years. It will probably remain there another 5 or 6 billion years. Whenour Sun leaves the main sequence, it is expected to grow in diameter (as itbecomes a red giant) by a factor of 100 or more, possibly swallowing up innerplanets such as Mercury and possibly Venus and even Earth.
If the star is like our Sun, or larger, further fusion can occur. As the star’souter envelope expands, its core continues to shrink and heat up. When thetemperature reaches about even helium nuclei, in spite of their greatercharge and hence greater electrical repulsion, can come close enough to eachother to undergo fusion. The reactions are
(33;2)
with the emission of two rays. These two reactions must occur in quick succes-sion (because is very unstable), and the net effect is
This fusion of helium causes a change in the star which moves rapidly to the“horizontal branch” on the H–R diagram (Fig. 33–8). Further fusion reactionsare possible, with fusing with to form In more massive stars, higher Zelements like or can be made. This process of creating heavier nucleifrom lighter ones (or by absorption of neutrons which tends to occur at higher Z)is called nucleosynthesis.
Low Mass Stars—White DwarfsThe final fate of a star depends on its mass. Stars can lose mass as parts of theirouter envelope move off into space. Stars born with a mass less than about8 solar masses ( the mass of our Sun) eventually end up with a residual massless than about 1.4 solar masses. A residual mass of 1.4 solar masses is known asthe Chandrasekhar limit. For stars smaller than this, no further fusion energy canbe obtained because of the large Coulomb repulsion between nuclei. The core of such a “low mass” star (original solar masses) contracts under gravity. The outer envelope expands again and the star becomes an even brighter and larger red giant, Fig. 33–8. Eventually the outer layers escape intospace, and the newly revealed surface is hotter than before. So the star moves tothe left in the H–R diagram (horizontal dashed line in Fig. 33–8). Then, as thecore shrinks the star cools, and typically follows the downward dashed routeshown on the left in Fig. 33–8, becoming a white dwarf. A white dwarf witha residual mass equal to that of the Sun would be about the size of the Earth.A white dwarf contracts to the point at which the electrons start to overlap, butno further because, by the Pauli exclusion principle, no two electrons can be inthe same quantum state. At this point the star is supported against furthercollapse by this electron degeneracy pressure. A white dwarf continues to loseinternal energy by radiation, decreasing in temperature and becoming dimmeruntil it glows no more. It has then become a cold dark chunk of extremely densematerial.
High Mass Stars—Supernovae, Neutron Stars, Black HolesStars whose original mass is greater than about 8 solar masses are thought tofollow a very different scenario. A star with this great a mass can contract undergravity and heat up even further. At temperatures nuclei asheavy as and can be made. But here the formation of heavy nuclei fromlighter ones, by fusion, ends. As we saw in Fig. 30–1, the average binding energyper nucleon begins to decrease for A greater than about 60. Further fusionswould require energy, rather than release it.
2856Ni26
56FeT L 3 or 4 * 109 K,
mass f 8
8*
1224Mg10
20Ne 816O. 6
12C24He
(Q = 7.3 MeV)3 24He S 6
12C + 2g.
48Be
g
24He + 4
8Be S 612C
24He + 2
4He S 48Be
108 K,
4 12
SECTION 33–2 Stellar Evolution: Birth and Death of Stars, Nucleosynthesis 955
FIGURE 33–8 Evolutionary “track”of a star like our Sun represented onan H–R diagram.
Surface temperature
Lum
inos
ity
Whitedwarf
Main sequence
Redgiant
Horizontalbranch

At these extremely high temperatures, well above high-energycollisions can cause the breaking apart of iron and nickel nuclei into He nuclei,and eventually into protons and neutrons:
These are energy-requiring (endothermic) reactions, which rob energy from thecore, allowing gravitational contraction to begin. This then can force electronsand protons together to form neutrons in inverse decay:
As a result of these reactions, the pressure in the core drops precipitously. As thecore collapses under the huge gravitational forces, the tremendous mass becomesessentially an enormous nucleus made up almost exclusively of neutrons. Thesize of the star is no longer limited by the exclusion principle applied to electrons,but rather by neutron degeneracy pressure, and the star contracts rapidly to forman enormously dense neutron star. The core of a neutron star contracts to thepoint at which all neutrons are as close together as they are in an atomic nucleus.That is, the density of a neutron star is on the order of times greater thannormal solids and liquids on Earth. A cupful of such dense matter would weighbillions of tons. A neutron star that has a mass 1.5 times that of our Sun wouldhave a diameter of only about 20 km. (Compare this to a white dwarf with 1 solarmass whose diameter would be , as mentioned on the previous page.)
The contraction of the core of a massive star would mean a great reduction ingravitational potential energy. Somehow this energy would have to be released.Indeed, it was suggested in the 1930s that the final core collapse to a neutron starcould be accompanied by a catastrophic explosion known as a supernova (pluralsupernovae). The tremendous energy release (Fig. 33–9) could form virtually allelements of the Periodic Table (see below) and blow away the entire outerenvelope of the star, spreading its contents into interstellar space. The presenceof heavy elements on Earth and in our solar system suggests that our solar systemformed from the debris of many such supernova explosions.
The elements heavier than Ni are thought to form mainly by neutron capturein these exploding supernovae (rather than by fusion, as for elements up to Ni).Large numbers of free neutrons, resulting from nuclear reactions, are presentinside those highly evolved stars and they can readily combine with, say, a nucleus to form (if three are captured) which decays to The cancapture neutrons, also becoming neutron rich and decaying by to the nexthigher Z element, and so on to the highest Z elements.
The final state of a neutron star depends on its mass. If the final mass is lessthan about three solar masses, the subsequent evolution of the neutron star isthought to resemble that of a white dwarf. If the mass is greater than this(original mass solar masses), the neutron star collapses under gravity,overcoming even neutron degeneracy. Gravity would then be so strong thatemitted light could not escape—it would be pulled back in by the force of gravity. Since no radiation could escape from such a “star,” we could not see it—it would be black. An object may pass by it and be deflected by its gravitationalfield, but if the object came too close it would be swallowed up, never to escape.This is a black hole.
Novae and SupernovaeNovae (singular is nova, meaning “new” in Latin) are faint stars that have sud-denly increased in brightness by as much as a factor of and last for a month ortwo before fading. Novae are thought to be faint white dwarfs that have pulledmass from a nearby companion (they make up a binary system), as illustrated inFig. 33–10. The captured mass of hydrogen suddenly fuses into helium at a highrate for a few weeks. Many novae (maybe all) are recurrent—they repeat theirbright glow years later.
106
g40
b–2759Co27
59Co.2659Fe,
2656Fe
=
L 104 km
1014
e– + p S n + n.B
24He S 2p + 2n.2656Fe S 13 2
4He + 4n
109 K,
956 CHAPTER 33 Astrophysics and Cosmology
FIGURE 33–9 The star indicated bythe arrow in (a) exploded in 1987 asa supernova (SN1987A), as shown in (b). The bright spot in (b) indicatesa huge release of energy but doesnot represent the physical size.
(a)
(b)
FIGURE 33–10 Hypothetical modelfor novae and Type Ia supernovae,showing how a white dwarf couldpull mass from its normalcompanion.
Whitedwarf
Main-sequencecompanion
Masstransfer

Earth(January)
Earth’s orbit
Earth(July)
Nearbystar
Distant stars
D
d dSun
Sky asseenfromEarth inJanuary
(a) (b)
July viewing angle
Janu
ary
view
ing
angl
e
As seenfromEarth inJuly
f f
Supernovae are also brief explosive events, but release millions of times moreenergy than novae, up to times more luminous than our Sun. The peak ofbrightness may exceed that of the entire galaxy in which they are located, but lastsonly a few days or weeks. They slowly fade over a few months. Many supernovaeform by core collapse to a neutron star as described above. See Fig. 33–9.
Type Ia supernovae are different. They all seem to have very nearly the sameluminosity. They are believed to be binary stars, one of which is a white dwarfthat pulls mass from its companion, much like for a nova, Fig. 33–10. The mass ishigher, and as mass is captured and the total mass approaches the Chandrasekharlimit of 1.4 solar masses, it explodes as a “white-dwarf” supernova by undergoinga “thermonuclear runaway”—an uncontrolled chain of nuclear reactions thatentirely destroys the white dwarf. Type Ia supernovae are useful to us as“standard candles” in the night sky to help us determine distance—see next Section.
33–3 Distance MeasurementsParallaxWe have talked about the vast distances of objects in the universe. But how dowe measure these distances? One basic technique employs simple geometry tomeasure the parallax of a star. By parallax we mean the apparent motion ofa star, against the background of much more distant stars, due to the Earth’smotion around the Sun. As shown in Fig. 33–11, we can measure the angle that the star appears to shift, relative to very distant stars, when viewed 6 monthsapart. If we know the distance d from Earth to Sun, we can reconstruct the righttriangles shown in Fig. 33–11 and can then determine the distance D to the star. This is essentially the way the heights of mountains are determined, by “triangulation”: see Example 1–8.
2f
1010
SECTION 33–3 Distance Measurements 957
FIGURE 33–11 (a) Determining the distance D toa relatively nearby star using parallax. Horizontaldistances are greatly exaggerated: in reality is a very small angle (less than of arc).(b) Diagram of the sky showing the apparent positionof the “nearby” star relative to more distant stars, attwo different times (January and July). The viewingangle in January puts the star more to the right relativeto distant stars, whereas in July it is more to the left(dashed circle shows January location).
13600° = 1– = 1 second
f
958 CHAPTER 33 Astrophysics and Cosmology
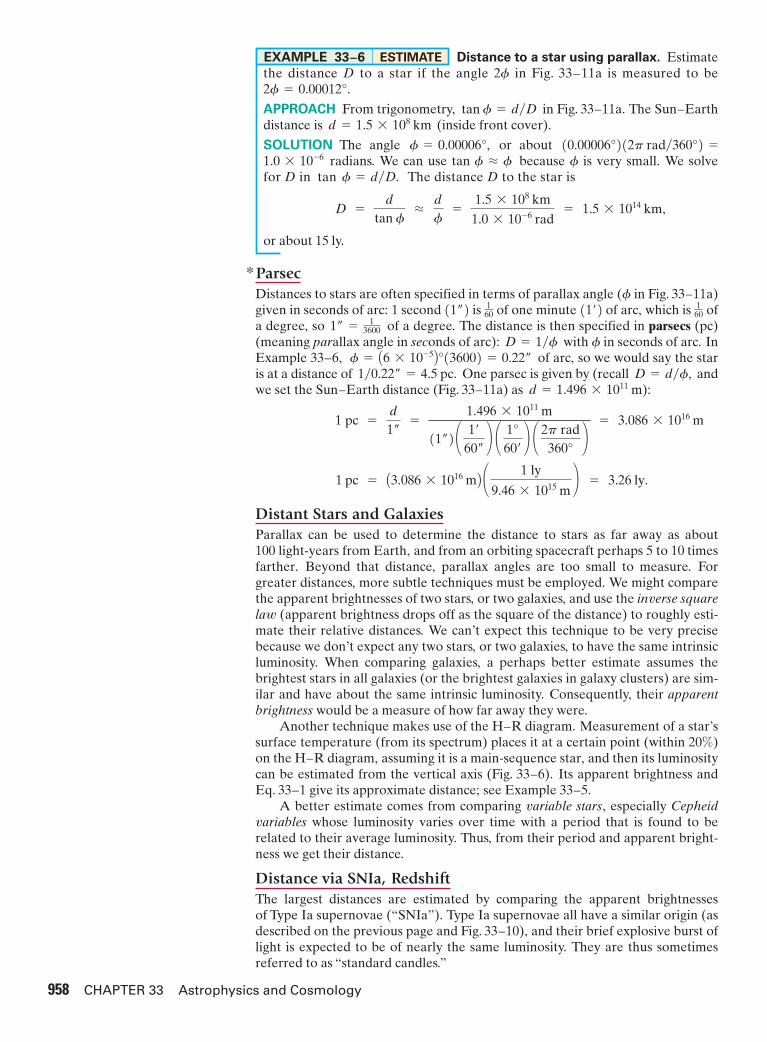
Distance to a star using parallax. Estimatethe distance D to a star if the angle in Fig. 33–11a is measured to be
APPROACH From trigonometry, in Fig. 33–11a. The Sun–Earthdistance is (inside front cover).
SOLUTION The angle or about radians. We can use tan because is very small. We solve
for D in tan The distance D to the star is
or about 15 ly.
ParsecDistances to stars are often specified in terms of parallax angle ( in Fig. 33–11a)given in seconds of arc: 1 second is of one minute of arc, which is ofa degree, so of a degree. The distance is then specified in parsecs (pc)(meaning parallax angle in seconds of arc): with in seconds of arc. InExample 33–6, of arc, so we would say the staris at a distance of One parsec is given by (recall andwe set the Sun–Earth distance (Fig. 33–11a) as ):
Distant Stars and GalaxiesParallax can be used to determine the distance to stars as far away as about100 light-years from Earth, and from an orbiting spacecraft perhaps 5 to 10 timesfarther. Beyond that distance, parallax angles are too small to measure. Forgreater distances, more subtle techniques must be employed. We might comparethe apparent brightnesses of two stars, or two galaxies, and use the inverse squarelaw (apparent brightness drops off as the square of the distance) to roughly esti-mate their relative distances. We can’t expect this technique to be very precisebecause we don’t expect any two stars, or two galaxies, to have the same intrinsicluminosity. When comparing galaxies, a perhaps better estimate assumes thebrightest stars in all galaxies (or the brightest galaxies in galaxy clusters) are sim-ilar and have about the same intrinsic luminosity. Consequently, their apparentbrightness would be a measure of how far away they were.
Another technique makes use of the H–R diagram. Measurement of a star’ssurface temperature (from its spectrum) places it at a certain point (within 20%)on the H–R diagram, assuming it is a main-sequence star, and then its luminositycan be estimated from the vertical axis (Fig. 33–6). Its apparent brightness andEq. 33–1 give its approximate distance; see Example 33–5.
A better estimate comes from comparing variable stars, especially Cepheidvariables whose luminosity varies over time with a period that is found to berelated to their average luminosity. Thus, from their period and apparent bright-ness we get their distance.
Distance via SNIa, RedshiftThe largest distances are estimated by comparing the apparent brightnesses of Type Ia supernovae (“SNIa”). Type Ia supernovae all have a similar origin (asdescribed on the previous page and Fig. 33–10), and their brief explosive burst oflight is expected to be of nearly the same luminosity. They are thus sometimesreferred to as “standard candles.”
1 pc = A3.086 * 1016 mB ¢ 1 ly
9.46 * 1015 m≤ = 3.26 ly.
1 pc =d
1–=
1.496 * 1011 m
(1–) ¢ 1¿60–
≤ ¢ 1°60¿≤ ¢ 2p rad
360°≤
= 3.086 * 1016 m
d = 1.496 * 1011 mD = d�f,1�0.22– = 4.5 pc.
f = A6 * 10–5B°(3600) = 0.22–fD = 1�f
1– = 13600
160(1¿)1
60(1–)f
*
D =d
tan fL
d
f=
1.5 * 108 km
1.0 * 10–6 rad= 1.5 * 1014 km,
f = d�D.ff L f1.0 * 10–6
(0.00006°)(2p rad�360°) =f = 0.00006°,
d = 1.5 * 108 kmtan f = d�D
2f = 0.00012°.2f
EXAMPLE 33;6 ESTIMATE
Another important technique for estimating the distance of very distantgalaxies is from the “redshift” in the line spectra of elements and compounds.The redshift is related to the expansion of the universe, as we shall discuss inSection 33–5. It is useful for objects farther than to ly away.
As we look farther and farther away, measurement techniques are less andless reliable, so there is more uncertainty in the measurements of large distances.
33–4 General Relativity: Gravityand the Curvature of Space
We have seen that the force of gravity plays an important role in the processesthat occur in stars. Gravity too is important for the evolution of the universe asa whole. The reasons gravity plays a dominant role in the universe, and not oneof the other of the four forces in nature, are (1) it is long-range and (2) it is alwaysattractive. The strong and weak nuclear forces act over very short distances only,on the order of the size of a nucleus; hence they do not act over astronomicaldistances (they do act between nuclei and nucleons in stars to produce nuclearreactions). The electromagnetic force, like gravity, acts over great distances. Butit can be either attractive or repulsive. And since the universe does not seem tocontain large areas of net electric charge, a large net force does not occur. Butgravity acts only as an attractive force between all masses, and there are largeaccumulations of mass in the universe. The force of gravity as Newton describedit in his law of universal gravitation was modified by Einstein. In his generaltheory of relativity, Einstein developed a theory of gravity that now forms thebasis of cosmological dynamics.
In the special theory of relativity (Chapter 26), Einstein concluded that thereis no way for an observer to determine whether a given frame of reference is atrest or is moving at constant velocity in a straight line. Thus the laws of physicsmust be the same in different inertial reference frames. But what about the moregeneral case of motion where reference frames can be accelerating?
Einstein tackled the problem of accelerating reference frames in his generaltheory of relativity and in it also developed a theory of gravity. The mathematicsof General Relativity is complex, so our discussion will be mainly qualitative.
We begin with Einstein’s principle of equivalence, which states that
no experiment can be performed that could distinguish between a uniformgravitational field and an equivalent uniform acceleration.
If observers sensed that they were accelerating (as in a vehicle speeding arounda sharp curve), they could not prove by any experiment that in fact they weren’tsimply experiencing the pull of a gravitational field. Conversely, we might thinkwe are being pulled by gravity when in fact we are undergoing an accelerationhaving nothing to do with gravity.
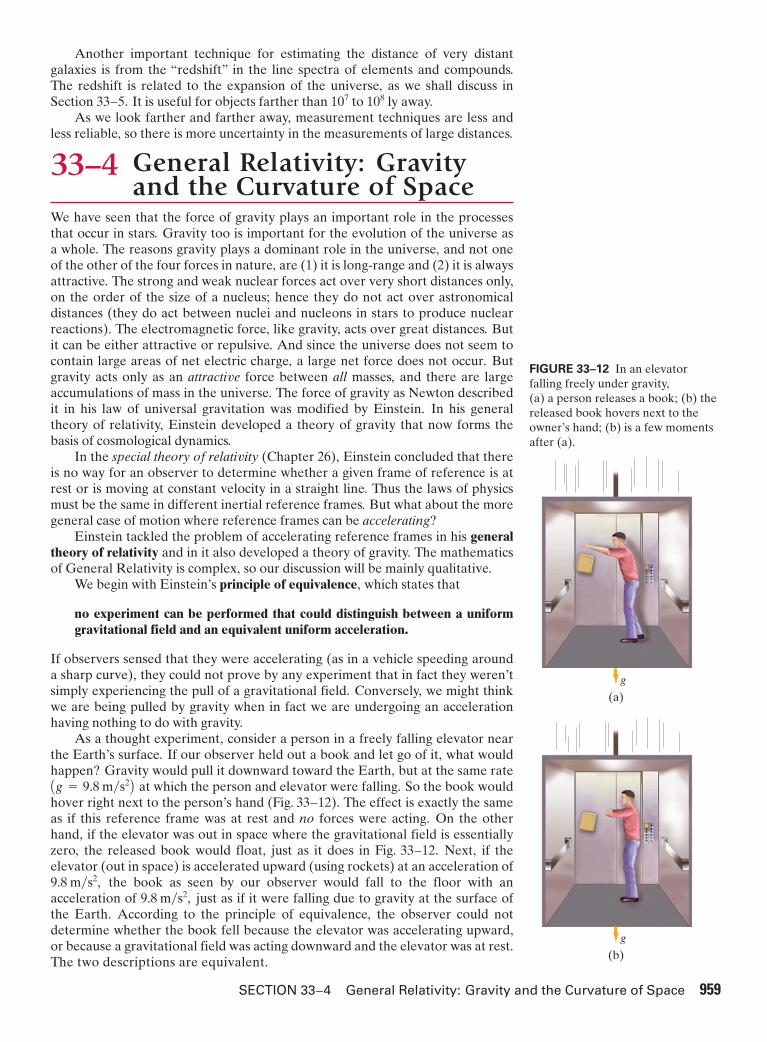
As a thought experiment, consider a person in a freely falling elevator nearthe Earth’s surface. If our observer held out a book and let go of it, what wouldhappen? Gravity would pull it downward toward the Earth, but at the same rate
at which the person and elevator were falling. So the book wouldhover right next to the person’s hand (Fig. 33–12). The effect is exactly the sameas if this reference frame was at rest and no forces were acting. On the otherhand, if the elevator was out in space where the gravitational field is essentiallyzero, the released book would float, just as it does in Fig. 33–12. Next, if theelevator (out in space) is accelerated upward (using rockets) at an acceleration of
the book as seen by our observer would fall to the floor with anacceleration of just as if it were falling due to gravity at the surface ofthe Earth. According to the principle of equivalence, the observer could notdetermine whether the book fell because the elevator was accelerating upward,or because a gravitational field was acting downward and the elevator was at rest.The two descriptions are equivalent.
9.8 m�s2,9.8 m�s2,
Ag = 9.8 m�s2B
108107
SECTION 33–4 General Relativity: Gravity and the Curvature of Space 959
FIGURE 33–12 In an elevatorfalling freely under gravity,(a) a person releases a book; (b) thereleased book hovers next to theowner’s hand; (b) is a few momentsafter (a).
g
(a)
g
(b)

Beam of lightFlash-light
Flash-light
Beam of light
(a) (b)
The principle of equivalence is related to the concept that there are two typesof mass. Newton’s second law, uses inertial mass. We might say thatinertial mass represents “resistance” to any type of force. The second type ofmass is gravitational mass. When one object attracts another by the gravitationalforce (Newton’s law of universal gravitation, Chapter 5), thestrength of the force is proportional to the product of the gravitational masses ofthe two objects. This is much like Coulomb’s law for the electric force betweentwo objects which is proportional to the product of their electric charges. Theelectric charge on an object is not related to its inertial mass; so why should weexpect that an object’s gravitational mass (call it gravitational charge if you like)be related to its inertial mass? All along we have assumed they were the same.Why? Because no experiment—not even of high precision—has been able to dis-cern any measurable difference between inertial mass and gravitational mass. (Forexample, in the absence of air resistance, all objects fall at the same acceleration, g,on Earth.) This is another way to state the equivalence principle: gravitational massis equivalent to inertial mass.
F = Gm1 m2�r2,
F = ma,
960 CHAPTER 33
FIGURE 33–13 (a) Light beam goes straightacross an elevator which is not accelerating.(b) The light beam bends (exaggerated) accordingto an observer in an accelerating elevator whosespeed increases in the upward direction.
Observeron Earth
2
1Stars
(a)
Observeron Earth (b)
SunMoon
Apparentpositionof starθ
The principle of equivalence can be used to show that light ought to bedeflected by the gravitational force due to a massive object. Consider anotherthought experiment, in which an elevator is in free space where virtually nogravity acts. If a light beam is emitted by a flashlight attached to the side of theelevator, the beam travels straight across the elevator and makes a spot on theopposite side if the elevator is at rest or moving at constant velocity (Fig. 33–13a).If instead the elevator is accelerating upward, as in Fig. 33–13b, the light beamstill travels straight across in a reference frame at rest. In the upwardly acceleratingelevator, however, the beam is observed to curve downward. Why? Becauseduring the time the light travels from one side of the elevator to the other, theelevator is moving upward at a vertical speed that is increasing relative to thelight. Next we note that according to the equivalence principle, an upwardly accel-erating reference frame is equivalent to a downward gravitational field. Hence,we can picture the curved light path in Fig. 33–13b as being due to the effect of agravitational field. Thus, from the principle of equivalence, we expect gravity toexert a force on a beam of light and to bend it out of a straight-line path!
That light is affected by gravity is an important prediction of Einstein’sgeneral theory of relativity. And it can be tested. The amount a light beam wouldbe deflected from a straight-line path must be small even when passing a massiveobject. (For example, light near the Earth’s surface after traveling 1 km is pre-dicted to drop only about which is equal to the diameter of a small atom and not detectable.) The most massive object near us is the Sun, and it wascalculated that light from a distant star would be deflected by of arc (tinybut detectable) as it passed by the edge of the Sun (Fig. 33–14). However, sucha measurement could be made only during a total eclipse of the Sun, so that theSun’s tremendous brightness would not obscure the starlight passing near its edge.
1.75–
10–10 m,
FIGURE 33–14 (a) Two stars in thesky observed from Earth. (b) If thelight from one of these stars passesvery near the Sun, whose gravity bendsthe rays, the star will appear higherthan it actually is (follow the raybackwards). [Not to scale.]

SECTION 33–4 961
FIGURE 33–15 (a) Hubble Space Telescope photograph of the so-called “Einstein cross,” thought to represent“gravitational lensing”: the central spot is a relatively nearby galaxy, whereas the four other spots are thought to beimages of a single quasar behind the galaxy. (b) Diagram showing how the galaxy could bend the light coming from thequasar behind it to produce the four images. See also Fig. 33–14. [If the shape of the nearby galaxy and distant quasarwere perfect spheres and perfectly aligned, we would expect the “image” of the distant quasar to be a circular ring orhalo instead of the four separate images seen here. Such a ring is called an “Einstein ring.”]
Light from Quasar
GalaxyQuasar Observer
Falseimage
Falseimage
(a) (b)
An opportune eclipse occurred in 1919, and scientists journeyed to the SouthAtlantic to observe it. Their photos of stars just behind the Sun revealed shifts inaccordance with Einstein’s prediction. Another example of gravitational deflectionof light is gravitational lensing, as described in Fig. 33–15. The very distant galaxiesshown in the XDF photo at the start of this Chapter, page 947, are thought to bevisible only because of gravitational lensing (and magnification of their emittedlight) by nearer galaxies—as if the nearby galaxies acted as a magnifying glass.
The mathematician Fermat showed in the 1600s that optical phenomena,including reflection, refraction, and effects of lenses, can be derived from asimple principle: that light traveling between two points follows the shortest path in space. Thus if gravity curves the path of light, then gravity must be able tocurve space itself. That is, space itself can be curved, and it is gravitational massthat causes the curvature. Indeed, the curvature of space—or rather, of four-dimensional space-time—is a basic aspect of Einstein’s General Relativity.
What is meant by curved space? To understand, recall that our normalmethod of viewing the world is via Euclidean plane geometry. In Euclideangeometry, there are many axioms and theorems we take for granted, such as thatthe sum of the angles of any triangle is 180°. Non-Euclidean geometries, whichinvolve curved space, have also been imagined by mathematicians. It is hardenough to imagine three-dimensional curved space, much less curved four-dimensional space-time. So let us try to understand the idea of curved space byusing two-dimensional surfaces.
Consider, for example, the two-dimensional surface of a sphere. It is clearlycurved, Fig. 33–16, at least to us who view it from the outside—from our three-dimensional world. But how would hypothetical two-dimensional creaturesdetermine whether their two-dimensional space was flat (a plane) or curved?One way would be to measure the sum of the angles of a triangle. If the surface isa plane, the sum of the angles is 180°, as we learn in plane geometry. But if thespace is curved, and a sufficiently large triangle is constructed, the sum of theangles will not be 180°. To construct a triangle on a curved surface, say the sphereof Fig. 33–16, we must use the equivalent of a straight line: that is, the shortestdistance between two points, which is called a geodesic. On a sphere, a geodesicis an arc of a great circle (an arc in a plane passing through the center of thesphere) such as the Earth’s equator and the Earth’s longitude lines. Consider, forexample, the large triangle of Fig. 33–16: its sides are two longitude lines passingfrom the north pole to the equator, and the third side is a section of the equatoras shown. The two longitude lines make 90° angles with the equator (look ata world globe to see this more clearly). They make an angle with each other atthe north pole, which could be, say, 90° as shown; the sum of these angles is
This is clearly not a Euclidean space. Note, however,that if the triangle is small in comparison to the radius of the sphere, the angleswill add up to nearly 180°, and the triangle (and space) will seem flat.
90° + 90° + 90° = 270°.
FIGURE 33–16 On atwo-dimensional curved surface,the sum of the angles of a trianglemay not be 180°.
“North pole”
Earth
90°
90°
90°
Equator

Another way to test the curvature of space is to measure the radius r andcircumference C of a large circle. On a plane surface, But on a two-dimensional spherical surface, C is less than as can be seen in Fig. 33–17.The proportionality between C and r is less than Such a surface is said to havepositive curvature. On the saddlelike surface of Fig. 33–18, the circumference of acircle is greater than and the sum of the angles of a triangle is less than 180°.Such a surface is said to have a negative curvature.
Curvature of the UniverseWhat about our universe? On a large scale (not just near a large mass), what isthe overall curvature of the universe? Does it have positive curvature, negativecurvature, or is it flat (zero curvature)? We perceive our world as Euclidean(flat), but we can not exclude the possibility that space could have a curvature soslight that we don’t normally notice it. This is a crucial question in cosmology,and it can be answered only by precise experimentation.
If the universe had a positive curvature, the universe would be closed, orfinite in volume. This would not mean that the stars and galaxies extended out toa certain boundary, beyond which there is empty space. There is no boundary oredge in such a universe. The universe is all there is. If a particle were to move ina straight line in a particular direction, it would eventually return to the startingpoint—perhaps eons of time later.
On the other hand, if the curvature of space was zero or negative, theuniverse would be open. It could just go on forever. An open universe could beinfinite; but according to recent research, even that may not necessarily be so.
Today the evidence is very strong that the universe on a large scale is veryclose to being flat. Indeed, it is so close to being flat that we can’t tell if it mighthave very slightly positive or very slightly negative curvature.
Black HolesAccording to Einstein’s theory of general relativity (sometimes abbreviated GR),space-time is curved near massive objects. We might think of space as being like a thin rubber sheet: if a heavy weight is placed on the sheet, it sags as shown in Fig. 33–19a (top of next page). The weight corresponds to a huge mass that causes space (space itself!) to curve. Thus, in the context of
2pr,
2p.2pr,
C = 2pr.
962 CHAPTER 33 Astrophysics and Cosmology
FIGURE 33–17 On a spherical surface (a two-dimensional world) a circle ofcircumference C is drawn (red) about point Oas the center. The radius of the circle (not thesphere) is the distance r along the surface.(Note that in our three-dimensional view, we can tell that Since then
)C 6 2pr.r 7 a,C = 2pa.
FIGURE 33–18 Example of a two-dimensional surface withnegative curvature.
O
a
C
r
C
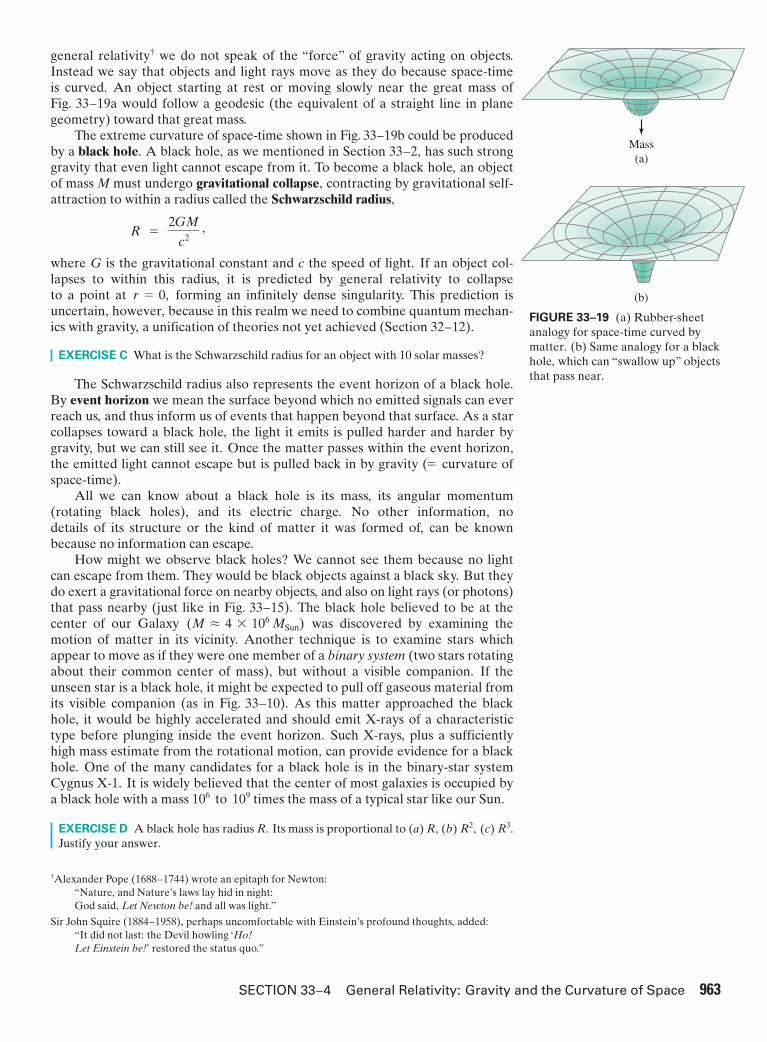
general relativity† we do not speak of the “force” of gravity acting on objects.Instead we say that objects and light rays move as they do because space-time is curved. An object starting at rest or moving slowly near the great mass of Fig. 33–19a would follow a geodesic (the equivalent of a straight line in planegeometry) toward that great mass.
The extreme curvature of space-time shown in Fig. 33–19b could be producedby a black hole. A black hole, as we mentioned in Section 33–2, has such stronggravity that even light cannot escape from it. To become a black hole, an objectof mass M must undergo gravitational collapse, contracting by gravitational self-attraction to within a radius called the Schwarzschild radius,
where G is the gravitational constant and c the speed of light. If an object col-lapses to within this radius, it is predicted by general relativity to collapse to a point at forming an infinitely dense singularity. This prediction isuncertain, however, because in this realm we need to combine quantum mechan-ics with gravity, a unification of theories not yet achieved (Section 32–12).
EXERCISE C What is the Schwarzschild radius for an object with 10 solar masses?
The Schwarzschild radius also represents the event horizon of a black hole.By event horizon we mean the surface beyond which no emitted signals can everreach us, and thus inform us of events that happen beyond that surface. As a starcollapses toward a black hole, the light it emits is pulled harder and harder bygravity, but we can still see it. Once the matter passes within the event horizon,the emitted light cannot escape but is pulled back in by gravity ( ofspace-time).
All we can know about a black hole is its mass, its angular momentum(rotating black holes), and its electric charge. No other information, no details of its structure or the kind of matter it was formed of, can be knownbecause no information can escape.
How might we observe black holes? We cannot see them because no lightcan escape from them. They would be black objects against a black sky. But theydo exert a gravitational force on nearby objects, and also on light rays (or photons)that pass nearby (just like in Fig. 33–15). The black hole believed to be at thecenter of our Galaxy ( ) was discovered by examining themotion of matter in its vicinity. Another technique is to examine stars whichappear to move as if they were one member of a binary system (two stars rotatingabout their common center of mass), but without a visible companion. If theunseen star is a black hole, it might be expected to pull off gaseous material fromits visible companion (as in Fig. 33–10). As this matter approached the blackhole, it would be highly accelerated and should emit X-rays of a characteristictype before plunging inside the event horizon. Such X-rays, plus a sufficientlyhigh mass estimate from the rotational motion, can provide evidence for a blackhole. One of the many candidates for a black hole is in the binary-star systemCygnus X-1. It is widely believed that the center of most galaxies is occupied bya black hole with a mass times the mass of a typical star like our Sun.
EXERCISE D A black hole has radius R. Its mass is proportional to (a) R, (b) (c)Justify your answer.
R3.R2,
106 to 109
M L 4 * 106 MSun
= curvature
r = 0,
R =2GM
c2,
SECTION 33–4 General Relativity: Gravity and the Curvature of Space 963
†Alexander Pope (1688–1744) wrote an epitaph for Newton:“Nature, and Nature’s laws lay hid in night:God said, Let Newton be! and all was light.”
Sir John Squire (1884–1958), perhaps uncomfortable with Einstein’s profound thoughts, added:“It did not last: the Devil howling ‘Ho!Let Einstein be!’ restored the status quo.”
FIGURE 33–19 (a) Rubber-sheetanalogy for space-time curved bymatter. (b) Same analogy for a blackhole, which can “swallow up” objectsthat pass near.
Mass(a)
(b)

33–5 The Expanding Universe:Redshift and Hubble’s Law
We discussed in Section 33–2 how individual stars evolve from their birth to theirdeath as white dwarfs, neutron stars, or black holes. But what about the universeas a whole: is it static, or does it change? One of the most important scientificdiscoveries of the twentieth century was that distant galaxies are racing awayfrom us, and that the farther they are from us at a given time, the faster they aremoving away. How astronomers arrived at this astonishing idea, and what itmeans for the past history of the universe as well as its future, will occupy us forthe remainder of the book.
Observational evidence that the universe is expanding was first put forth byEdwin Hubble in 1929. This idea was based on distance measurements of galaxies(Section 33–3), and determination of their velocities by the Doppler shift ofspectral lines in the light received from them (Fig. 33–20). In Chapter 12 we sawhow the frequency of sound is higher and the wavelength shorter if the sourceand observer move toward each other. If the source moves away from theobserver, the frequency is lower and the wavelength longer. The Doppler effectoccurs also for light, but the formula for light is slightly different than for soundand is given by†
(33;3)
where is the emitted wavelength as seen in a reference frame at rest withrespect to the source, and is the wavelength observed in a frame moving withvelocity away from the source along the line of sight. (For relative motiontoward each other, in this formula.) When a distant source emits light ofa particular wavelength, and the source is moving away from us, the wavelengthappears longer to us: the color of the light (if it is visible) is shifted toward the redend of the visible spectrum, an effect known as a redshift. (If the source movestoward us, the color shifts toward the blue or shorter wavelength.)
In the spectra of stars in other galaxies, lines are observed that correspond tolines in the known spectra of particular atoms (see Section 27–11 and Figs. 24–28and 27–23). What Hubble found was that the lines seen in the spectra fromdistant galaxies were generally redshifted, and that the amount of shift seemed tobe approximately proportional to the distance of the galaxy from us. That is, thevelocity of a galaxy moving away from us is proportional to its distance d from us:
(33;4)
This is Hubble’s law, one of the most fundamental astronomical ideas. It was firstsuggested, in 1927, by Georges Lemaître, a Belgian physics professor and priest,who also first proposed what later came to be called the Big Bang. The con-stant is called the Hubble parameter.
The value of until recently was uncertain by over 20%, and thought to bebetween 15 and But recent measurements now put its value moreprecisely at
(that is, per million light-years of distance). The current uncertainty isabout 2%, or [ can be written in terms of parsecs (Section 33–3)as (that is, per megaparsec of distance) with anuncertainty of about ]&1.2 km�s�Mpc.
67 km�sH0 = 67 km�s�MpcH0&0.5 km�s�Mly.
21 km�s
H0 = 21 km�s�Mly
25 km�s�Mly.H0
H0
v = H0d.
v
v 6 0v
lobs
lrest
B source and observer movingaway from each other Rlobs = lrestB 1 + v�c
1 - v�c,
964 CHAPTER 33 Astrophysics and Cosmology
†For light there is no medium and we can make no distinction between motion of the source andmotion of the observer (special relativity), as we did for sound which travels in a medium.
HUBBLE’S LAW
500Wavelength (nm)
Inte
nsity
600 700
500Wavelength (nm)
Inte
nsity
600 700
Low redshift galaxy spectrumz � 0.004
Higher redshift galaxy spectrumz � 0.104
(a)
(b)
FIGURE 33–20 Atoms and moleculesemit and absorb light of particularfrequencies depending on the spacing of their energy levels, as we saw inChapters 27 to 29. (a) The spectrumof light received from a relativelyslow-moving galaxy. (b) Spectrum of agalaxy moving away from us at a muchhigher speed. Note how the peaks (orlines) in the spectrum have moved tolonger wavelengths. The redshift isz = Alobs - lrestB�lrest .
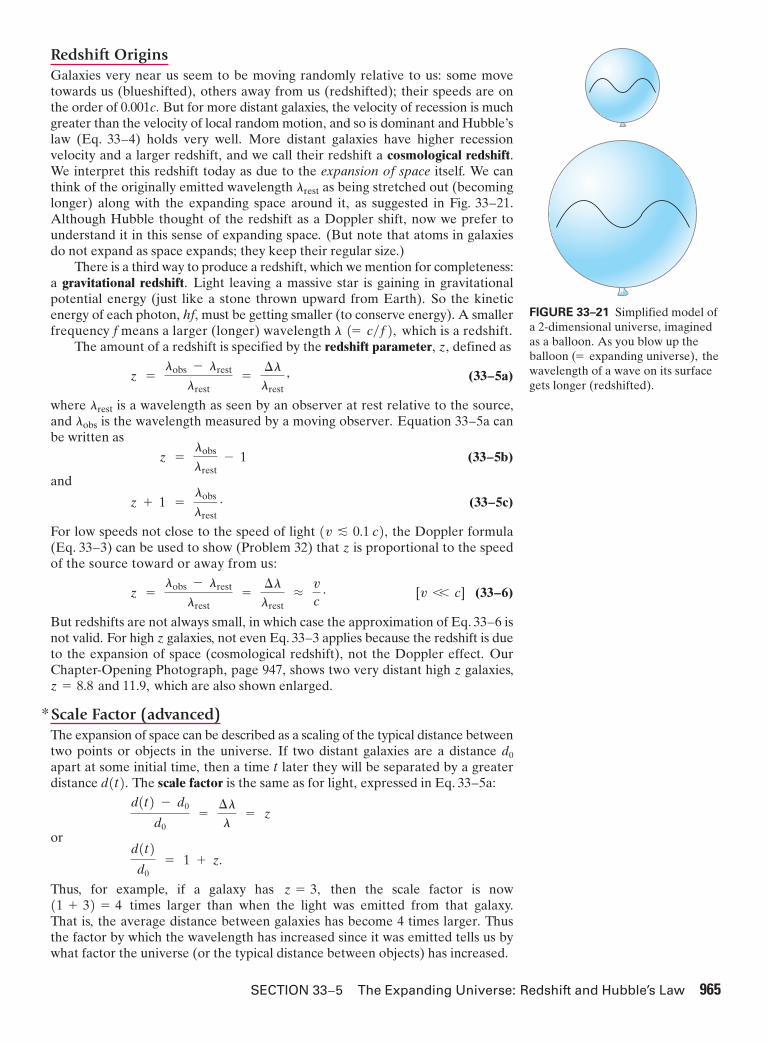
Redshift OriginsGalaxies very near us seem to be moving randomly relative to us: some movetowards us (blueshifted), others away from us (redshifted); their speeds are onthe order of 0.001c. But for more distant galaxies, the velocity of recession is muchgreater than the velocity of local random motion, and so is dominant and Hubble’slaw (Eq. 33–4) holds very well. More distant galaxies have higher recessionvelocity and a larger redshift, and we call their redshift a cosmological redshift.We interpret this redshift today as due to the expansion of space itself. We canthink of the originally emitted wavelength as being stretched out (becominglonger) along with the expanding space around it, as suggested in Fig. 33–21.Although Hubble thought of the redshift as a Doppler shift, now we prefer tounderstand it in this sense of expanding space. (But note that atoms in galaxiesdo not expand as space expands; they keep their regular size.)
There is a third way to produce a redshift, which we mention for completeness:a gravitational redshift. Light leaving a massive star is gaining in gravitationalpotential energy (just like a stone thrown upward from Earth). So the kineticenergy of each photon, hf, must be getting smaller (to conserve energy). A smallerfrequency f means a larger (longer) wavelength which is a redshift.
The amount of a redshift is specified by the redshift parameter, z, defined as
(33;5a)
where is a wavelength as seen by an observer at rest relative to the source,and is the wavelength measured by a moving observer. Equation 33–5a canbe written as
(33;5b)
and
(33;5c)
For low speeds not close to the speed of light , the Doppler formula(Eq. 33–3) can be used to show (Problem 32) that z is proportional to the speedof the source toward or away from us:
(33;6)
But redshifts are not always small, in which case the approximation of Eq. 33–6 isnot valid. For high z galaxies, not even Eq. 33–3 applies because the redshift is dueto the expansion of space (cosmological redshift), not the Doppler effect. OurChapter-Opening Photograph, page 947, shows two very distant high z galaxies,
, which are also shown enlarged.
Scale Factor (advanced)The expansion of space can be described as a scaling of the typical distance betweentwo points or objects in the universe. If two distant galaxies are a distance apart at some initial time, then a time later they will be separated by a greaterdistance The scale factor is the same as for light, expressed in Eq. 33–5a:
or
Thus, for example, if a galaxy has then the scale factor is nowtimes larger than when the light was emitted from that galaxy.
That is, the average distance between galaxies has become 4 times larger. Thusthe factor by which the wavelength has increased since it was emitted tells us bywhat factor the universe (or the typical distance between objects) has increased.
(1 + 3) = 4z = 3,
d(t)
d0= 1 + z.
d(t) - d0
d0=¢ll
= z
d(t).t
d0
*
z = 8.8 and 11.9
[v V c]z =lobs - lrest
lrest=¢llrest
Lvc
.
(v f 0.1 c)
z + 1 =lobs
lrest
.
z =lobs
lrest- 1
lobs
lrest
z =lobs - lrest
lrest=¢llrest
,
l (= c�f),
lrest
SECTION 33–5 The Expanding Universe: Redshift and Hubble’s Law 965
FIGURE 33–21 Simplified model ofa 2-dimensional universe, imaginedas a balloon. As you blow up theballoon thewavelength of a wave on its surfacegets longer (redshifted).
(= expanding universe),
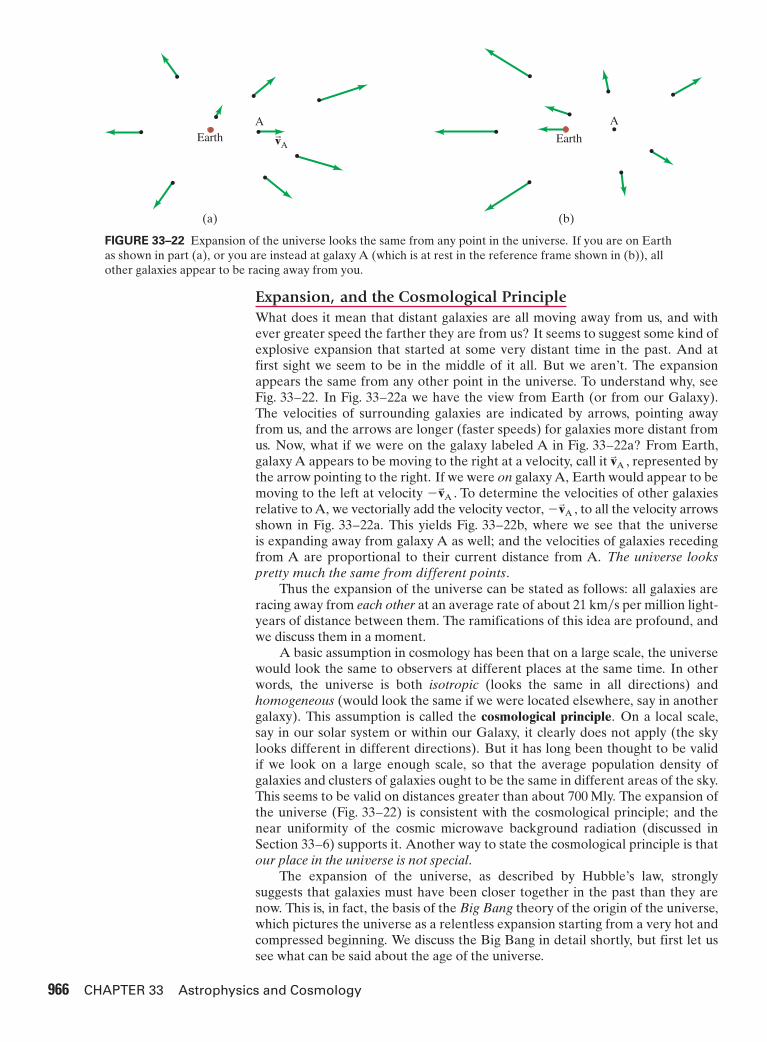
Expansion, and the Cosmological PrincipleWhat does it mean that distant galaxies are all moving away from us, and withever greater speed the farther they are from us? It seems to suggest some kind ofexplosive expansion that started at some very distant time in the past. And atfirst sight we seem to be in the middle of it all. But we aren’t. The expansionappears the same from any other point in the universe. To understand why, seeFig. 33–22. In Fig. 33–22a we have the view from Earth (or from our Galaxy).The velocities of surrounding galaxies are indicated by arrows, pointing awayfrom us, and the arrows are longer (faster speeds) for galaxies more distant fromus. Now, what if we were on the galaxy labeled A in Fig. 33–22a? From Earth,galaxy A appears to be moving to the right at a velocity, call it represented bythe arrow pointing to the right. If we were on galaxy A, Earth would appear to bemoving to the left at velocity To determine the velocities of other galaxiesrelative to A, we vectorially add the velocity vector, to all the velocity arrowsshown in Fig. 33–22a. This yields Fig. 33–22b, where we see that the universe is expanding away from galaxy A as well; and the velocities of galaxies recedingfrom A are proportional to their current distance from A. The universe lookspretty much the same from different points.
Thus the expansion of the universe can be stated as follows: all galaxies areracing away from each other at an average rate of about per million light-years of distance between them. The ramifications of this idea are profound, andwe discuss them in a moment.
A basic assumption in cosmology has been that on a large scale, the universewould look the same to observers at different places at the same time. In otherwords, the universe is both isotropic (looks the same in all directions) andhomogeneous (would look the same if we were located elsewhere, say in anothergalaxy). This assumption is called the cosmological principle. On a local scale,say in our solar system or within our Galaxy, it clearly does not apply (the skylooks different in different directions). But it has long been thought to be valid if we look on a large enough scale, so that the average population density ofgalaxies and clusters of galaxies ought to be the same in different areas of the sky.This seems to be valid on distances greater than about 700 Mly. The expansion ofthe universe (Fig. 33–22) is consistent with the cosmological principle; and thenear uniformity of the cosmic microwave background radiation (discussed inSection 33–6) supports it. Another way to state the cosmological principle is thatour place in the universe is not special.
The expansion of the universe, as described by Hubble’s law, stronglysuggests that galaxies must have been closer together in the past than they arenow. This is, in fact, the basis of the Big Bang theory of the origin of the universe,which pictures the universe as a relentless expansion starting from a very hot andcompressed beginning. We discuss the Big Bang in detail shortly, but first let ussee what can be said about the age of the universe.
21 km�s
–vBA ,–vBA .
vBA ,
966 CHAPTER 33 Astrophysics and Cosmology
FIGURE 33–22 Expansion of the universe looks the same from any point in the universe. If you are on Earthas shown in part (a), or you are instead at galaxy A (which is at rest in the reference frame shown in (b)), allother galaxies appear to be racing away from you.
AvBEarth
(a)
A
Earth
A
(b)
One way to estimate the age of the universe uses the Hubble parameter.With light-years, the time required for the galaxies toarrive at their present separations would be approximately (starting withand using Hubble’s law, Eq. 33–4),
or 14 billion years. The age of the universe calculated in this way is called thecharacteristic expansion time or “Hubble age.” It is a very rough estimate andassumes the rate of expansion of the universe was constant (which today we arequite sure is not true). Today’s best measurements give the age of the universe asabout in remarkable agreement with the rough Hubble age estimate.
Steady-State ModelBefore discussing the Big Bang in detail, we mention one alternative to the BigBang—the steady-state model—which assumed that the universe is infinitely oldand on average looks the same now as it always has. (This assumed uniformity intime as well as space was called the perfect cosmological principle.) According tothe steady-state model, no large-scale changes have taken place in the universeas a whole, particularly no Big Bang. To maintain this view in the face of therecession of galaxies away from each other, matter would need to be createdcontinuously to maintain the assumption of uniformity. The rate of mass creationrequired is very small—about one nucleon per cubic meter every
The steady-state model provided the Big Bang model with healthy competi-tion in the mid-twentieth century. But the discovery of the cosmic microwavebackground radiation (next Section), as well as other observations of the universe,has made the Big Bang model universally accepted.
33–6 The Big Bang and the CosmicMicrowave Background
The expansion of the universe suggests that typical objects in the universe wereonce much closer together than they are now. This is the basis for the idea thatthe universe began about 14 billion years ago as an expansion from a state of veryhigh density and temperature known affectionately as the Big Bang.
The birth of the universe was not an explosion, because an explosion blowspieces out into the surrounding space. Instead, the Big Bang was the start of anexpansion of space itself. The observable universe was relatively very small at thestart and has been expanding, getting ever larger, ever since. The initial tiny uni-verse of extremely dense matter is not to be thought of as a concentrated mass inthe midst of a much larger space around it. The initial tiny but dense universe wasthe entire universe. There wouldn’t have been anything else. When we say thatthe universe was once smaller than it is now, we mean that the average separationbetween objects (such as electrons or galaxies) was less. The universe may havebeen infinite in extent even then, and it may still be now (only bigger). Theobservable universe (that which we have the possibility of observing becauselight has had time to reach us) is, however, finite.
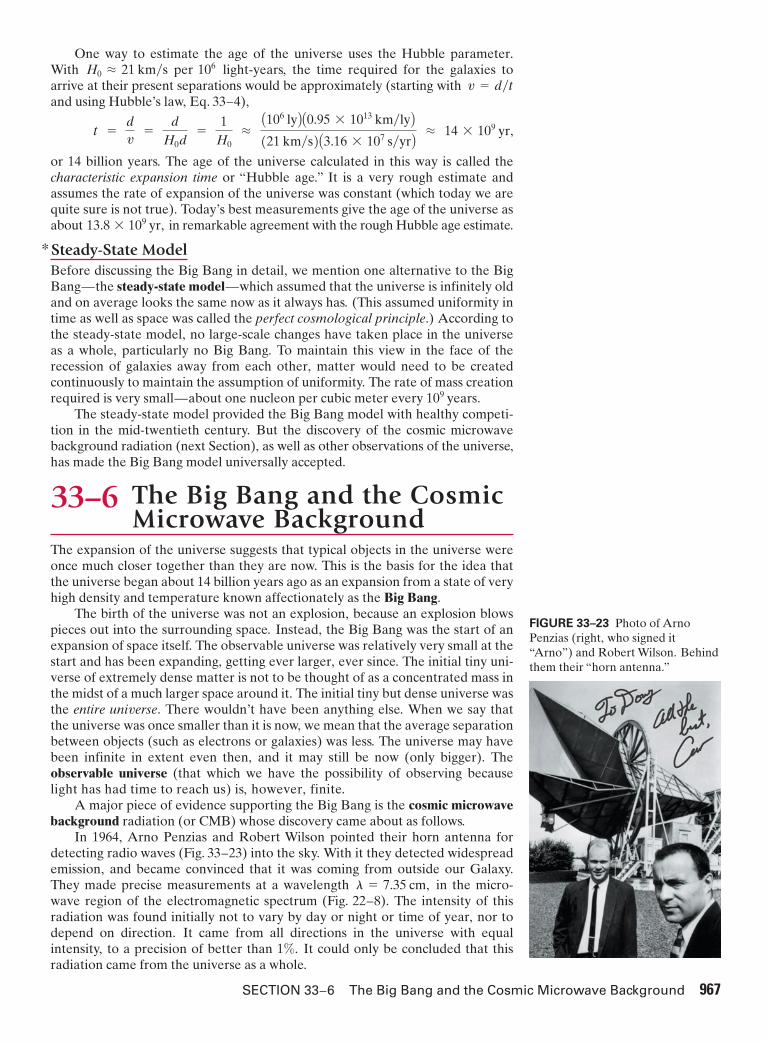
A major piece of evidence supporting the Big Bang is the cosmic microwavebackground radiation (or CMB) whose discovery came about as follows.
In 1964, Arno Penzias and Robert Wilson pointed their horn antenna fordetecting radio waves (Fig. 33–23) into the sky. With it they detected widespreademission, and became convinced that it was coming from outside our Galaxy.They made precise measurements at a wavelength in the micro-wave region of the electromagnetic spectrum (Fig. 22–8). The intensity of thisradiation was found initially not to vary by day or night or time of year, nor todepend on direction. It came from all directions in the universe with equalintensity, to a precision of better than 1%. It could only be concluded that thisradiation came from the universe as a whole.
l = 7.35 cm,
109 years.
*
13.8 * 109 yr,
t =dv
=d
H0d=
1H0LA106 lyB A0.95 * 1013 km�lyB(21 km�s)A3.16 * 107 s�yrB L 14 * 109 yr,
v = d�tH0 L 21 km�s per 106
SECTION 33–6 The Big Bang and the Cosmic Microwave Background 967
FIGURE 33–23 Photo of ArnoPenzias (right, who signed it“Arno”) and Robert Wilson. Behindthem their “horn antenna.”

FIGURE 33–26 Measurements of the cosmicmicrowave background radiation over the entire sky, color-coded to represent differences in temperaturefrom the average 2.725 K: the color scale ranges from (red) to (dark blue),representing slightly hotter and colder spots(associated with variations in density). Results arefrom the WMAP satellite in 2012: the angularresolution is 0.2°.
–200 mK±200 mK
968 CHAPTER 33 Astrophysics and Cosmology
FIGURE 33–24 Spectrum of cosmic microwavebackground radiation, showing blackbody curveand experimental measurements including at thefrequency detected by Penzias and Wilson.(Thanks to G. F. Smoot and D. Scott. The verticalbars represent the most recent experimentaluncertainty in a measurement.)
FIGURE 33–25 COBE scientistsJohn Mather (chief scientist andresponsible for measuring theblackbody form of the spectrum)and George Smoot (chiefinvestigator for anisotropyexperiment) shown here duringcelebrations for their Dec. 2006Nobel Prize, given for theirdiscovery of the spectrum andanisotropy of the CMB using theCOBE instrument.
101 100 1000
10 1.0 0.1Wavelength (cm)
Blackbody spectrum(T=2.725 K)
Inte
nsity
Frequency (GHz)
Penzias and Wilson
The intensity of this CMB measured at corresponds to black-body radiation (see Section 27–2) at a temperature of about 3 K. When radiationat other wavelengths was measured by the COBE satellite (COsmic BackgroundExplorer), the intensities were found to fall on a nearly perfect blackbody curveas shown in Fig. 33–24, corresponding to a temperature of 2.725 K .
The remarkable uniformity of the CMB was in accordance with thecosmological principle. But theorists felt that there needed to be some smallinhomogeneities, or “anisotropies,” in the CMB that would have provided“seeds” at which galaxy formation could have started. Small areas of slightlyhigher density, which could have contracted under gravity to form clusters ofgalaxies, were indeed found. These tiny inhomogeneities in density and tempera-ture were detected first by the COBE satellite experiment in 1992, led by GeorgeSmoot and John Mather (Fig. 33–25).
This discovery of the anisotropy of the CMB ranks with the discovery of the CMBitself in the history of cosmology. The blackbody fit and the anisotropy were the cul-mination of decades of research by pioneers such as Richard Muller, Paul Richards,and David Wilkinson. Subsequent experiments gave us greater detail in 2003, 2006,and 2012 with the WMAP (Wilkinson Microwave Anisotropy Probe) results,Fig.33–26, and even more recently with the European Planck satellite results in 2013.
The CMB provides strong evidence in support of the Big Bang, and gives usinformation about conditions in the very early universe. In fact, in the late 1940s,George Gamow and his collaborators calculated that a Big Bang origin of theuniverse should have generated just such a microwave background radiation.
To understand why, let us look at what a Big Bang might have been like.(Today we usually use the term “Big Bang” to refer to the process, starting froma moment after the birth of the universe through the subsequent expansion.) Thetemperature must have been extremely high at the start, so high that there couldnot have been any atoms in the very early stages of the universe (high energycollisions would have broken atoms apart into nuclei and free electrons). Instead,the universe would have consisted solely of radiation (photons) and a plasma ofcharged electrons and other elementary particles. The universe would have been
(&0.002 K)
l = 7.35 cm
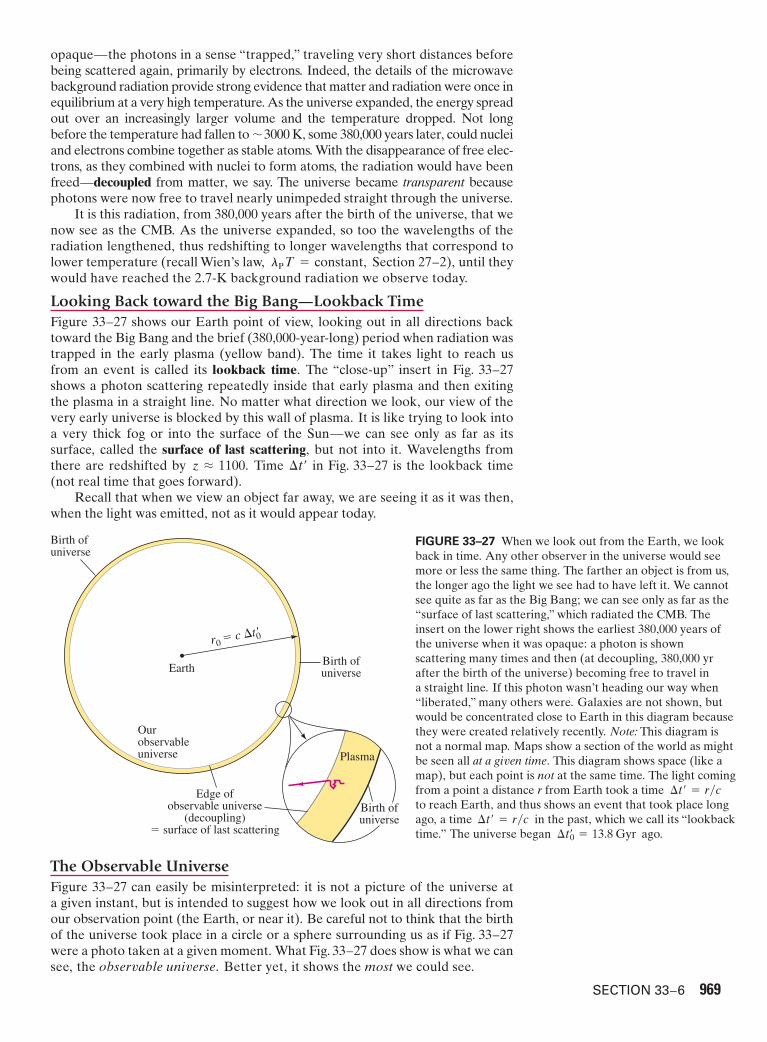
opaque—the photons in a sense “trapped,” traveling very short distances beforebeing scattered again, primarily by electrons. Indeed, the details of the microwavebackground radiation provide strong evidence that matter and radiation were once inequilibrium at a very high temperature. As the universe expanded, the energy spreadout over an increasingly larger volume and the temperature dropped. Not longbefore the temperature had fallen to 3000 K, some 380,000 years later, could nucleiand electrons combine together as stable atoms. With the disappearance of free elec-trons, as they combined with nuclei to form atoms, the radiation would have beenfreed—decoupled from matter, we say. The universe became transparent becausephotons were now free to travel nearly unimpeded straight through the universe.
It is this radiation, from 380,000 years after the birth of the universe, that wenow see as the CMB. As the universe expanded, so too the wavelengths of theradiation lengthened, thus redshifting to longer wavelengths that correspond tolower temperature (recall Wien’s law, Section 27–2), until theywould have reached the 2.7-K background radiation we observe today.
Looking Back toward the Big Bang—Lookback TimeFigure 33–27 shows our Earth point of view, looking out in all directions backtoward the Big Bang and the brief (380,000-year-long) period when radiation wastrapped in the early plasma (yellow band). The time it takes light to reach usfrom an event is called its lookback time. The “close-up” insert in Fig. 33–27shows a photon scattering repeatedly inside that early plasma and then exitingthe plasma in a straight line. No matter what direction we look, our view of thevery early universe is blocked by this wall of plasma. It is like trying to look intoa very thick fog or into the surface of the Sun—we can see only as far as itssurface, called the surface of last scattering, but not into it. Wavelengths fromthere are redshifted by Time in Fig. 33–27 is the lookback time(not real time that goes forward).
Recall that when we view an object far away, we are seeing it as it was then,when the light was emitted, not as it would appear today.
¢t¿z L 1100.
lP T = constant,
�
SECTION 33–6 969
FIGURE 33–27 When we look out from the Earth, we lookback in time. Any other observer in the universe would seemore or less the same thing. The farther an object is from us,the longer ago the light we see had to have left it. We cannotsee quite as far as the Big Bang; we can see only as far as the“surface of last scattering,” which radiated the CMB. Theinsert on the lower right shows the earliest 380,000 years ofthe universe when it was opaque: a photon is shownscattering many times and then (at decoupling, 380,000 yrafter the birth of the universe) becoming free to travel ina straight line. If this photon wasn’t heading our way when“liberated,” many others were. Galaxies are not shown, butwould be concentrated close to Earth in this diagram becausethey were created relatively recently. Note: This diagram isnot a normal map. Maps show a section of the world as mightbe seen all at a given time. This diagram shows space (like amap), but each point is not at the same time. The light comingfrom a point a distance r from Earth took a timeto reach Earth, and thus shows an event that took place longago, a time in the past, which we call its “lookbacktime.” The universe began ago.¢tœ0 = 13.8 Gyr
¢t¿ = r�c
¢t¿ = r�c
Ourobservableuniverse
Edge ofobservable universe
(decoupling)� surface of last scattering
Earth
Plasma
Birth ofuniverse
Birth ofuniverse
r0 � c �t0�
Birth ofuniverse
The Observable UniverseFigure 33–27 can easily be misinterpreted: it is not a picture of the universe ata given instant, but is intended to suggest how we look out in all directions fromour observation point (the Earth, or near it). Be careful not to think that the birthof the universe took place in a circle or a sphere surrounding us as if Fig. 33–27were a photo taken at a given moment. What Fig. 33–27 does show is what we cansee, the observable universe. Better yet, it shows the most we could see.
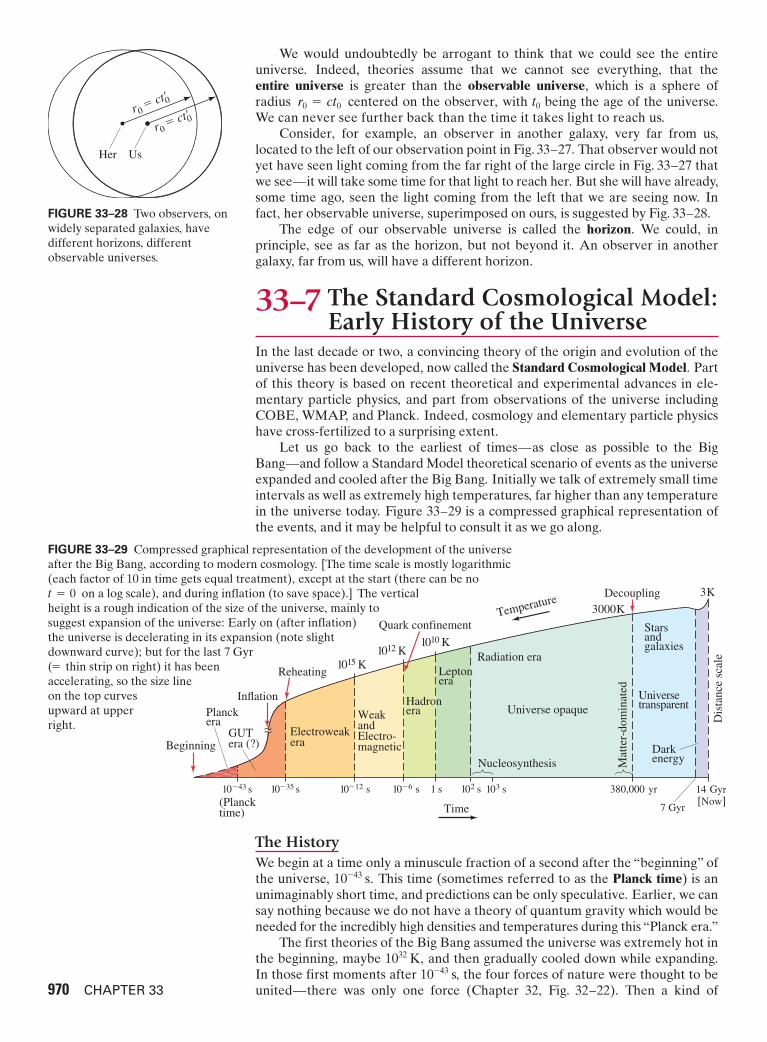
10�43 s 10�35 s 10�12 s 10�6 s 1 s 102 s 103 s 380,000 yr 14 Gyr[Now]
7 Gyr
Beginning
1015 K1012 K
1010 K
3K
HadroneraWeak
andElectro-magnetic
Electroweakera
Leptonera
Planckera
(Plancktime)
Radiation era
Darkenergy
GUTera (?)
Starsandgalaxies
Universetransparent
Nucleosynthesis
Dis
tanc
e sc
ale
Mat
ter-
dom
inat
ed
Universe opaque
Decoupling
Inflation
Quark confinement
Reheating
Time
Temperature3000K
We would undoubtedly be arrogant to think that we could see the entireuniverse. Indeed, theories assume that we cannot see everything, that the entire universe is greater than the observable universe, which is a sphere ofradius centered on the observer, with being the age of the universe.We can never see further back than the time it takes light to reach us.
Consider, for example, an observer in another galaxy, very far from us,located to the left of our observation point in Fig. 33–27. That observer would notyet have seen light coming from the far right of the large circle in Fig. 33–27 thatwe see—it will take some time for that light to reach her. But she will have already,some time ago, seen the light coming from the left that we are seeing now. In fact, her observable universe, superimposed on ours, is suggested by Fig. 33–28.
The edge of our observable universe is called the horizon. We could, inprinciple, see as far as the horizon, but not beyond it. An observer in anothergalaxy, far from us, will have a different horizon.
33–7 The Standard Cosmological Model:Early History of the Universe
In the last decade or two, a convincing theory of the origin and evolution of theuniverse has been developed, now called the Standard Cosmological Model. Partof this theory is based on recent theoretical and experimental advances in ele-mentary particle physics, and part from observations of the universe includingCOBE, WMAP, and Planck. Indeed, cosmology and elementary particle physicshave cross-fertilized to a surprising extent.
Let us go back to the earliest of times—as close as possible to the BigBang—and follow a Standard Model theoretical scenario of events as the universeexpanded and cooled after the Big Bang. Initially we talk of extremely small timeintervals as well as extremely high temperatures, far higher than any temperaturein the universe today. Figure 33–29 is a compressed graphical representation ofthe events, and it may be helpful to consult it as we go along.
t0r0 = ct0
970 CHAPTER 33
FIGURE 33–28 Two observers, onwidely separated galaxies, havedifferent horizons, differentobservable universes.
UsHer
r0� ct0�
r0� ct0�
FIGURE 33–29 Compressed graphical representation of the development of the universeafter the Big Bang, according to modern cosmology. [The time scale is mostly logarithmic(each factor of 10 in time gets equal treatment), except at the start (there can be no
on a log scale), and during inflation (to save space).] The vertical height is a rough indication of the size of the universe, mainly to suggest expansion of the universe: Early on (after inflation) the universe is decelerating in its expansion (note slight downward curve); but for the last 7 Gyr ( strip on right) it has been accelerating, so the size line on the top curves upward at upper right.
= thin
t = 0
The HistoryWe begin at a time only a minuscule fraction of a second after the “beginning” ofthe universe, This time (sometimes referred to as the Planck time) is anunimaginably short time, and predictions can be only speculative. Earlier, we cansay nothing because we do not have a theory of quantum gravity which would beneeded for the incredibly high densities and temperatures during this “Planck era.”
The first theories of the Big Bang assumed the universe was extremely hot inthe beginning, maybe 1032 K, and then gradually cooled down while expanding.In those first moments after s, the four forces of nature were thought to beunited—there was only one force (Chapter 32, Fig. 32–22). Then a kind of
10–43
10–43 s.
“phase transition” would have occurred during which the gravitational forcewould have “condensed out” as a separate force. This and subsequent phasetransitions, as shown in Fig. 32–22, are analogous to phase transitions waterundergoes as it cools from a gas condensing into a liquid, and with further coolingfreezes into ice.† The symmetry of the four forces would have been brokenleaving the strong, weak, and electromagnetic forces still unified, and the universewould have entered the grand unified era (GUT—see Section 32–11).
This scenario of a hot Big Bang is now doubted by some important theorists,such as Andreí Linde, whose theories suggest the universe was much cooler atthe Planck time. But what happened next to the universe, though very strange, isaccepted by most cosmologists: a brilliant idea, suggested by Linde and AlanGuth in the early 1980s, proposed that the universe underwent an incredibleexponential expansion, increasing in size by a factor of 1030 or maybe much more,in a tiny fraction of a second, perhaps s or s. The usefulness of thisinflationary scenario is that it solved major problems with earlier Big Bang models,such as explaining why the universe is flat, as well as the thermal equilibrium toprovide the nearly uniform CMB, as discussed below.
When inflation ended, whatever energy caused it then ended up beingtransformed into elementary particles with very high kinetic energy, correspondingto very high temperature (Eq. 13–8, ). That process is referred to asreheating, and the universe was now a “soup” of leptons, quarks, and otherparticles. We can think of this “soup” as a plasma of particles and antiparticles,as well as photons—all in roughly equal numbers—colliding with one anotherfrequently and exchanging energy.
The temperature of the universe at the end of inflation was much lower thanthat expected by the hot Big Bang theory. But it would have been high enough sothat the weak and electromagnetic forces were unified into a single force, andthis stage of the universe is sometimes called the electroweak era. Approximately
s after the Big Bang, the temperature dropped to about K correspondingto randomly moving particles with an average kinetic energy KE of about 100 GeV(see Eq. 13–8):
(As an estimate, we usually ignore the factor in Eq. 13–8.) At that time,symmetry between weak and electromagnetic forces would have broken down,and the weak force separated from the electromagnetic.
As the universe cooled down to about K (KE 100 MeV), approxi-mately s after the Big Bang, quarks stop moving freely and begin to“condense” into more normal particles: nucleons and the other hadrons and theirantiparticles. With this confinement of quarks, the universe entered the hadronera. But it did not last long. Very soon the vast majority of hadrons disappeared.To see why, let us focus on the most familiar hadrons: nucleons and their anti-particles. When the average kinetic energy of particles was somewhat higher than1 GeV, protons, neutrons, and their antiparticles were continually being createdout of the energies of collisions involving photons and other particles, such as
But just as quickly, particles and antiparticles would annihilate: for example
So the processes of creation and annihilation of nucleons were in equilibrium.The numbers of nucleons and antinucleons were high—roughly as many as therewere electrons, positrons, or photons. But as the universe expanded and cooled,and the average kinetic energy of particles dropped below about 1 GeV, which isthe minimum energy needed in a typical collision to create nucleons and anti-nucleons (about 940 MeV each), the process of nucleon creation could not continue.
p + o S photons or leptons.
S n + n. photons S p + o
10–6L1012
32
ke L kT LA1.4 * 10–23 J�KB A1015 KB
1.6 * 10–19 J�eVL 1011 eV = 100 GeV.
101510–12
ke = 32 kT
10–3210–35
SECTION 33–7 971
†It may be interesting to point out that this story of origins here bears some resemblance to ancientaccounts (nonscientific) that mention the “void,”“formless wasteland” (or “darkness over the deep”),“abyss,” “divide the waters” ( phase transition?), not to mention the sudden appearance of light.= a
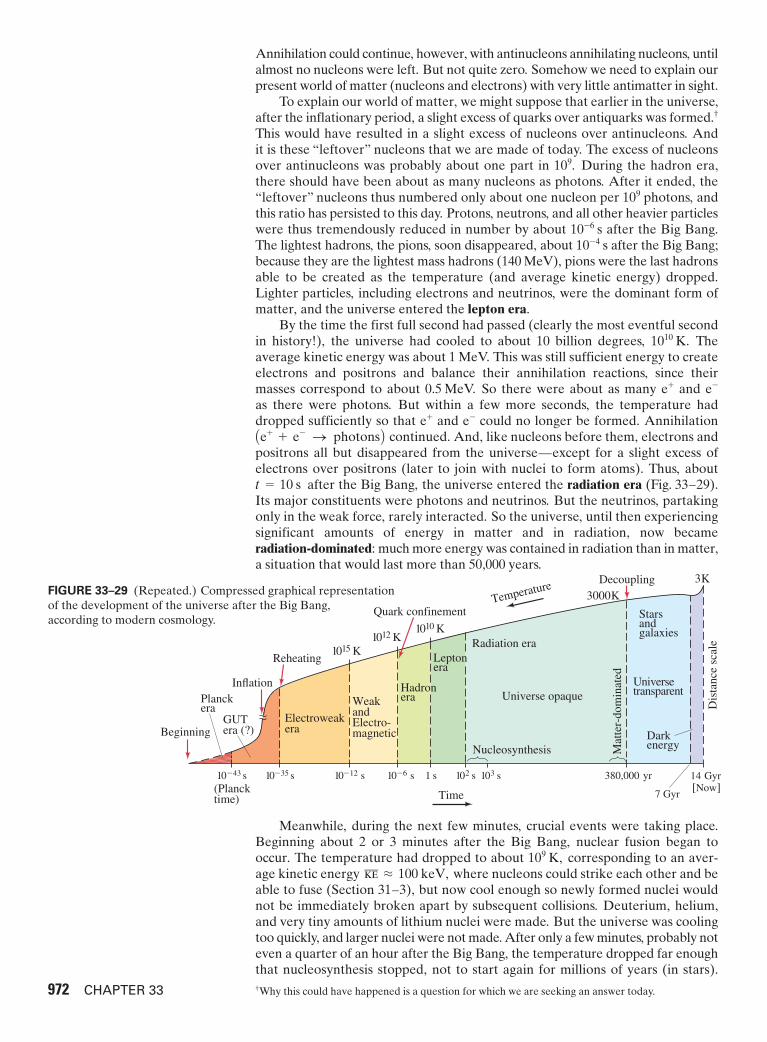
Annihilation could continue, however, with antinucleons annihilating nucleons, untilalmost no nucleons were left. But not quite zero. Somehow we need to explain ourpresent world of matter (nucleons and electrons) with very little antimatter in sight.
To explain our world of matter, we might suppose that earlier in the universe,after the inflationary period, a slight excess of quarks over antiquarks was formed.†
This would have resulted in a slight excess of nucleons over antinucleons. And it is these “leftover” nucleons that we are made of today. The excess of nucleonsover antinucleons was probably about one part in During the hadron era,there should have been about as many nucleons as photons. After it ended, the“leftover” nucleons thus numbered only about one nucleon per photons, andthis ratio has persisted to this day. Protons, neutrons, and all other heavier particleswere thus tremendously reduced in number by about after the Big Bang.The lightest hadrons, the pions, soon disappeared, about after the Big Bang;because they are the lightest mass hadrons (140 MeV), pions were the last hadronsable to be created as the temperature (and average kinetic energy) dropped.Lighter particles, including electrons and neutrinos, were the dominant form ofmatter, and the universe entered the lepton era.
By the time the first full second had passed (clearly the most eventful secondin history!), the universe had cooled to about 10 billion degrees, Theaverage kinetic energy was about 1 MeV. This was still sufficient energy to createelectrons and positrons and balance their annihilation reactions, since theirmasses correspond to about 0.5 MeV. So there were about as many and as there were photons. But within a few more seconds, the temperature haddropped sufficiently so that and could no longer be formed. Annihilation
continued. And, like nucleons before them, electrons andpositrons all but disappeared from the universe—except for a slight excess ofelectrons over positrons (later to join with nuclei to form atoms). Thus, about
after the Big Bang, the universe entered the radiation era (Fig. 33–29).Its major constituents were photons and neutrinos. But the neutrinos, partakingonly in the weak force, rarely interacted. So the universe, until then experiencingsignificant amounts of energy in matter and in radiation, now became radiation-dominated: much more energy was contained in radiation than in matter,a situation that would last more than 50,000 years.
t = 10 s
Ae± + e– S photonsB e–e±
e–e±
1010 K.
10–4 s10–6 s
109
109.
972 CHAPTER 33 †Why this could have happened is a question for which we are seeking an answer today.
10�43 s 10�35 s 10�12 s 10�6 s 1 s 102 s 103 s 380,000 yr 14 Gyr[Now]
7 Gyr
Beginning
1015 K1012 K
1010 K
3K
HadroneraWeak
andElectro-magnetic
Electroweakera
Leptonera
Planckera
(Plancktime)
Radiation era
Darkenergy
GUTera (?)
Starsandgalaxies
Universetransparent
Nucleosynthesis
Dis
tanc
e sc
ale
Mat
ter-
dom
inat
ed
Universe opaque
Decoupling
Inflation
Quark confinement
Reheating
Time
Temperature3000KFIGURE 33–29 (Repeated.) Compressed graphical representation
of the development of the universe after the Big Bang,according to modern cosmology.
Meanwhile, during the next few minutes, crucial events were taking place.Beginning about 2 or 3 minutes after the Big Bang, nuclear fusion began tooccur. The temperature had dropped to about corresponding to an aver-age kinetic energy where nucleons could strike each other and beable to fuse (Section 31–3), but now cool enough so newly formed nuclei wouldnot be immediately broken apart by subsequent collisions. Deuterium, helium,and very tiny amounts of lithium nuclei were made. But the universe was coolingtoo quickly, and larger nuclei were not made. After only a few minutes, probably noteven a quarter of an hour after the Big Bang, the temperature dropped far enoughthat nucleosynthesis stopped, not to start again for millions of years (in stars).
G L 100 keV,109 K,

Thus, after the first quarter hour or so of the universe, matter consisted mainly ofbare nuclei of hydrogen (about 75%) and helium (about 25%)† as well as electrons.But radiation (photons) continued to dominate.
Our story is almost complete. The next important event is thought to haveoccurred 380,000 years later. The universe had expanded to about of its pres-ent scale, and the temperature had cooled to about 3000 K. The average kineticenergy of nuclei, electrons, and photons was less than an electron volt. Sinceionization energies of atoms are on the order of eV, then as the temperaturedropped below this point, electrons could orbit the bare nuclei and remain there(without being ejected by collisions), thus forming atoms. This period is oftencalled the recombination epoch (a misnomer since electrons had never beforebeen combined with nuclei to form atoms). With the disappearance of freeelectrons and the birth of atoms, the photons—which had been continuallyscattering from the free electrons—now became free to spread throughout theuniverse. As mentioned in the previous Section, we say that the photons becamedecoupled from matter. Thus decoupling occurred at recombination. The energycontained in radiation had been decreasing (lengthening in wavelength as theuniverse expanded); and at about (even before decoupling) theenergy contained in matter became dominant over radiation. The universe wassaid to have become matter-dominated (marked on Fig. 33–29). As the universecontinued to expand, the electromagnetic radiation cooled further, to 2.7 K today,forming the cosmic microwave background radiation we detect from everywherein the universe.
After the birth of atoms, then stars and galaxies could begin to form: by self-gravitation around mass concentrations (inhomogeneities). Stars began to formabout 200 million years after the Big Bang, galaxies after almost years. Theuniverse continued to evolve until today, some 14 billion years after it started.
* * *This scenario, like other scientific models, cannot be said to be “proven.” Yet
this model is remarkably effective in explaining the evolution of the universe welive in, and makes predictions which can be tested against the next generation ofobservations.
A major event, and something only discovered recently, is that when theuniverse was about half as old as it is now (about 7 Gyr ago), its expansion beganto accelerate. This was a big surprise because it was assumed the expansion of theuniverse would slow down due to gravitational attraction of all objects towardeach other. This acceleration in the expansion of the universe is said to be due to“dark energy,” as we discuss in Section 33–9. On the right in Fig. 33–29 isa narrow vertical strip that represents the most recent years of theuniverse, during which dark energy seems to have dominated.
33–8 Inflation: Explaining Flatness,Uniformity, and Structure
The idea that the universe underwent a period of exponential inflation early in itslife, expanding by a factor of or more (previous Section), was first put forthby Alan Guth and Andreí Linde. Many sophisticated models based on this generalidea have since been proposed. The energy required for this wild expansion mayhave been due to fields somewhat like the Higgs field (Section 32–10). So far, theevidence for inflation is indirect; yet it is a feature of most viable cosmologicalmodels because it alone is able to provide natural explanations for severalremarkable features of our universe.
1030
7 billion
109
t = 56,000 yr
11000
SECTION 33–8 973
†This Standard Model prediction of a 25% primordial production of helium agrees with what weobserve today—the universe does contain about 25%He—and it is strong evidence in support of theStandard Big Bang Model. Furthermore, the theory says that 25% He abundance is fully consistentwith there being three neutrino types, which is the number we observe. And it sets an upper limit offour to the maximum number of possible neutrino types. This is a striking example of the powerfulconnection between particle physics and cosmology.

FlatnessFirst of all, our best measurements suggest that the universe is flat, that it has zerocurvature. As scientists, we would like some reason for this remarkable result. Tosee how inflation explains flatness, consider a simple 2-dimensional model of theuniverse as we did earlier in Figs. 33–16 and 33–21. A circle in this 2-dimensionaluniverse ( surface of a sphere, Fig. 33–30a) represents the observable universe asseen by an observer at the blue dot. A possible hypothesis is that inflation occurredover a time interval that very roughly doubled the age of the universe from, let ussay, to The size of the observable universe
would have increased by a factor of two during inflation, while the radiusof curvature of the entire universe increased by an enormous factor of ormore. Thus the edge of our 2-D sphere representing the entire universe wouldhave seemed flat to a high degree of precision, as shown in Fig. 33–30b. Even if the time of inflation was a factor of 10 or 100 (instead of 2), the expansion factor of or more would have blotted out any possibility of observing any-thing but a flat universe.
CMB UniformityInflation also explains why the CMB is so uniform. Without inflation, the tinyuniverse at would not have been small enough for all parts of it to have been in contact and so reach the same temperature (information cannot travel faster than c). To see this, suppose that the currently observableuniverse came from a region of space about 1 cm in diameter at as per original Big Bang theory. In that light could have traveled
way too small for the opposite sidesof a 1-cm-wide “universe” to have been in communication. But if that region hadbeen times smaller as proposed by the inflation model, therecould have been contact and thermal equilibrium to produce the observed nearlyuniform CMB. Inflation, by making the very early universe extremely small,assures that all parts of that region which is today’s observable universe couldhave been in thermal equilibrium. And after inflation the universe could be largeenough to give us today’s observable universe.
Galaxy Seeds, Fluctuations, Magnetic MonopolesInflation also gives us a clue as to how the present structure of the universe(galaxies and clusters of galaxies) came about. We saw earlier that, according tothe uncertainty principle, energy might be not conserved by an amount for atime Forces, whether electromagnetic or other types, can undergo suchtiny quantum fluctuations according to quantum theory, but they are so tiny theyare not detectable unless magnified in some way. That is what inflation might have done: it could have magnified those fluctuations perhaps times in size, whichwould give us the density irregularities seen in the cosmic microwave background(WMAP, Fig. 33–26). That would be very nice, because the density variations wesee in the CMB are what we believe were the seeds that later coalesced undergravity into galaxies and galaxy clusters, and our models fit the data extremely well.
Sometimes it is said that the quantum fluctuations occurred in the vacuumstate or vacuum energy. This could be possible because the vacuum is no longerconsidered to be empty, as we discussed in Section 32–3 relative to positrons as holesin a negative energy sea of electrons. Indeed, the vacuum is thought to be filledwith fields and particles occupying all the possible negative energy states.
1030
¢t L U�¢E.¢E
A= 10–32 mB,1030
d = ct = A3 * 108 m�sB A10–36 sB = 10–27 m,10–36 s,
t = 10–36 s,
10–35 s
1030
1030(r = ct)
t = 2 * 10–35 s.t = 1 * 10–35 s
=
974 CHAPTER 33
beforeinflation
afterinflation
Edge ofobservableuniverse
(a) Before inflation (b) After inflation
Entireuniverse
FIGURE 33–30 (a) Simple 2-Dmodel of the entire universe; theobservable universe is suggested bythe small circle centered on us (bluedot). (b) Edge of entire universe isessentially flat after the expansion during inflation.
1030-fold
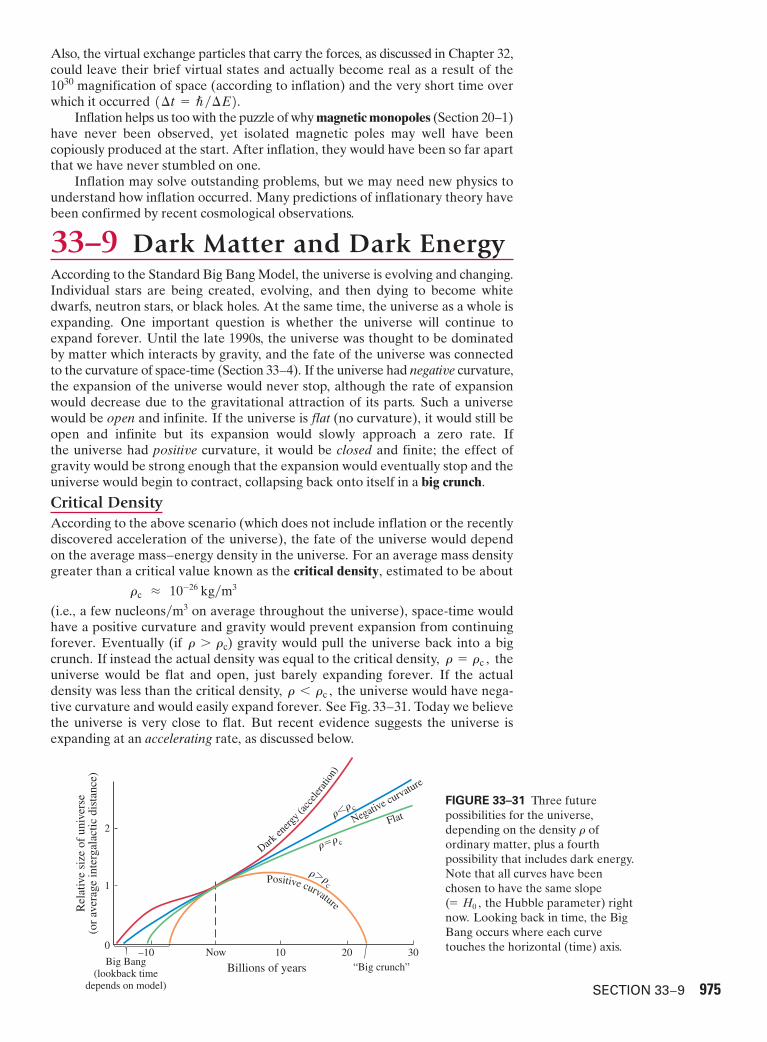
FIGURE 33–31 Three futurepossibilities for the universe,depending on the density ofordinary matter, plus a fourthpossibility that includes dark energy.Note that all curves have beenchosen to have the same slope( the Hubble parameter) rightnow. Looking back in time, the BigBang occurs where each curvetouches the horizontal (time) axis.
= H0 ,
r
Rel
ativ
e si
ze o
f un
iver
se(o
r av
erag
e in
terg
alac
tic d
ista
nce)
Big Bang(lookback time
depends on model)
“Big crunch”Billions of years
Darken
ergy (a
ccele
ratio
n)
Positive curvature
Negative curvature
Flat
r�rc
r�r c
r�r c
0
1
2
302010–10 Now
Also, the virtual exchange particles that carry the forces, as discussed in Chapter 32,could leave their brief virtual states and actually become real as a result of the
magnification of space (according to inflation) and the very short time overwhich it occurred
Inflation helps us too with the puzzle of why magnetic monopoles (Section 20–1)have never been observed, yet isolated magnetic poles may well have been copiously produced at the start. After inflation, they would have been so far apartthat we have never stumbled on one.
Inflation may solve outstanding problems, but we may need new physics tounderstand how inflation occurred. Many predictions of inflationary theory havebeen confirmed by recent cosmological observations.
33–9 Dark Matter and Dark EnergyAccording to the Standard Big Bang Model, the universe is evolving and changing.Individual stars are being created, evolving, and then dying to become whitedwarfs, neutron stars, or black holes. At the same time, the universe as a whole isexpanding. One important question is whether the universe will continue toexpand forever. Until the late 1990s, the universe was thought to be dominatedby matter which interacts by gravity, and the fate of the universe was connectedto the curvature of space-time (Section 33–4). If the universe had negative curvature,the expansion of the universe would never stop, although the rate of expansionwould decrease due to the gravitational attraction of its parts. Such a universewould be open and infinite. If the universe is flat (no curvature), it would still beopen and infinite but its expansion would slowly approach a zero rate. If the universe had positive curvature, it would be closed and finite; the effect ofgravity would be strong enough that the expansion would eventually stop and theuniverse would begin to contract, collapsing back onto itself in a big crunch.
Critical DensityAccording to the above scenario (which does not include inflation or the recentlydiscovered acceleration of the universe), the fate of the universe would dependon the average mass–energy density in the universe. For an average mass densitygreater than a critical value known as the critical density, estimated to be about
(i.e., a few on average throughout the universe), space-time wouldhave a positive curvature and gravity would prevent expansion from continuingforever. Eventually (if ) gravity would pull the universe back into a bigcrunch. If instead the actual density was equal to the critical density, theuniverse would be flat and open, just barely expanding forever. If the actualdensity was less than the critical density, the universe would have nega-tive curvature and would easily expand forever. See Fig. 33–31. Today we believethe universe is very close to flat. But recent evidence suggests the universe isexpanding at an accelerating rate, as discussed below.
r 6 rc ,
r = rc ,r 7 rc
nucleons�m3
rc L 10–26 kg�m3
(¢t = U�¢E).1030
SECTION 33–9 975
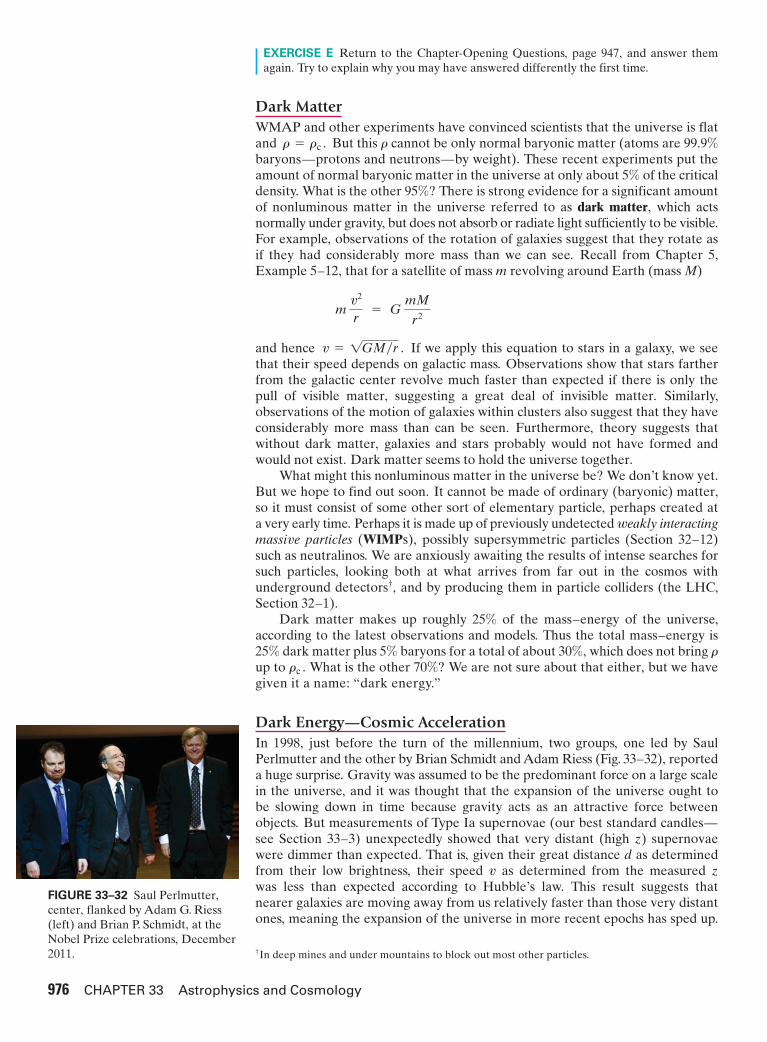
EXERCISE E Return to the Chapter-Opening Questions, page 947, and answer themagain. Try to explain why you may have answered differently the first time.
Dark MatterWMAP and other experiments have convinced scientists that the universe is flatand But this cannot be only normal baryonic matter (atoms are 99.9%baryons—protons and neutrons—by weight). These recent experiments put theamount of normal baryonic matter in the universe at only about 5% of the criticaldensity. What is the other 95%? There is strong evidence for a significant amountof nonluminous matter in the universe referred to as dark matter, which actsnormally under gravity, but does not absorb or radiate light sufficiently to be visible.For example, observations of the rotation of galaxies suggest that they rotate as if they had considerably more mass than we can see. Recall from Chapter 5,Example 5–12, that for a satellite of mass m revolving around Earth (mass M)
and hence If we apply this equation to stars in a galaxy, we seethat their speed depends on galactic mass. Observations show that stars fartherfrom the galactic center revolve much faster than expected if there is only thepull of visible matter, suggesting a great deal of invisible matter. Similarly,observations of the motion of galaxies within clusters also suggest that they haveconsiderably more mass than can be seen. Furthermore, theory suggests thatwithout dark matter, galaxies and stars probably would not have formed andwould not exist. Dark matter seems to hold the universe together.
What might this nonluminous matter in the universe be? We don’t know yet.But we hope to find out soon. It cannot be made of ordinary (baryonic) matter,so it must consist of some other sort of elementary particle, perhaps created ata very early time. Perhaps it is made up of previously undetected weakly interactingmassive particles (WIMPs), possibly supersymmetric particles (Section 32–12)such as neutralinos. We are anxiously awaiting the results of intense searches forsuch particles, looking both at what arrives from far out in the cosmos withunderground detectors†, and by producing them in particle colliders (the LHC,Section 32–1).
Dark matter makes up roughly 25% of the mass–energy of the universe,according to the latest observations and models. Thus the total mass–energy is25% dark matter plus 5% baryons for a total of about 30%, which does not bring up to What is the other 70%? We are not sure about that either, but we havegiven it a name: “dark energy.”
Dark Energy—Cosmic AccelerationIn 1998, just before the turn of the millennium, two groups, one led by SaulPerlmutter and the other by Brian Schmidt and Adam Riess (Fig. 33–32), reporteda huge surprise. Gravity was assumed to be the predominant force on a large scalein the universe, and it was thought that the expansion of the universe ought to be slowing down in time because gravity acts as an attractive force betweenobjects. But measurements of Type Ia supernovae (our best standard candles—see Section 33–3) unexpectedly showed that very distant (high z) supernovaewere dimmer than expected. That is, given their great distance d as determinedfrom their low brightness, their speed as determined from the measured zwas less than expected according to Hubble’s law. This result suggests that nearer galaxies are moving away from us relatively faster than those very distantones, meaning the expansion of the universe in more recent epochs has sped up.
v
rc .r
v = 1GM�r .
mv2
r= G
mM
r2
rr = rc .
976 CHAPTER 33 Astrophysics and Cosmology
FIGURE 33–32 Saul Perlmutter,center, flanked by Adam G. Riess(left) and Brian P. Schmidt, at theNobel Prize celebrations, December2011. †In deep mines and under mountains to block out most other particles.

This acceleration in the expansion of the universe (in place of the expecteddeceleration due to gravitational attraction between masses) seems to have begunroughly 7 billion years ago (7 Gyr, which would be about halfway back to whatwe call the Big Bang).
What could be causing the universe to accelerate in its expansion, against theattractive force of gravity? Does our understanding of gravity need to be revised?We don’t know the answers to these questions. Many scientists say dark energy isthe biggest mystery facing physical science today. There are several speculations.But somehow it seems to have a long-range repulsive effect on space, like a nega-tive gravity, causing objects to speed away from each other ever faster. Whateverit is, it has been given the name dark energy.
One idea is a sort of quantum field given the name quintessence. Anotherpossibility suggests an energy latent in space itself (vacuum energy) and relates toan aspect of General Relativity known as the cosmological constantWhen Einstein developed his equations, he found that they offered no solutionsfor a static universe. In those days (1917) it was thought the universe was static—unchanging and everlasting. Einstein added an arbitrary constant ( ) to hisequations to provide solutions for a static universe. A decade later, when Hubbleshowed us an expanding universe, Einstein discarded his cosmological constant as nolonger needed But today, measurements are consistent with dark energybeing due to a nonzero cosmological constant, although further measurements areneeded to see subtle differences among theories.
There is increasing evidence that the effects of some form of dark energy are very real. Observations of the CMB, supernovae, and large-scale structure(Section 33–10) agree well with theories and computer models when they inputdark energy as providing about 70% of the mass–energy in the universe, and whenthe total mass–energy density equals the critical density
Today’s best estimate of how the mass–energy in the universe is distributedis approximately (see also Fig. 33–33):
70% dark energy
30%matter, subject to the known gravitational force.
Of this 30%, about
25% is dark matter
5% is baryons (what atoms are made of); of this 5% only is readilyvisible matter—stars and galaxies (that is, 0.5% of the total); the other
of ordinary matter, which is not visible, is mainly gaseous plasma.
It is remarkable that only 0.5% of all the mass–energy in the universe is visible asstars and galaxies.
The idea that the universe is dominated by completely unknown forms ofmatter and energy seems bizarre. Nonetheless, the ability of our present modelto precisely explain observations of the CMB anisotropy, cosmic expansion, andlarge-scale structure (next Section) presents a compelling case.
33–10 Large-Scale Structure of theUniverse
The beautiful WMAP pictures of the sky (Fig. 33–26) show small but significantinhomogeneities in the temperature of the cosmic microwave background (CMB).These anisotropies reflect compressions and expansions in the primordial plasmajust before decoupling (Fig. 33–29), from which galaxies and clusters of galaxiesformed. Analyses of the irregularities in the CMB using mammoth computer
910
110
rc .
(¶ = 0).
¶
(symbol ¶).
SECTION 33–10 Large-Scale Structure of the Universe 977
Darkenergy70%
Darkmatter25%
Normal matter = 5% Stars and galaxies
FIGURE 33–33 Portions of totalmass–energy in the universe(approximate).
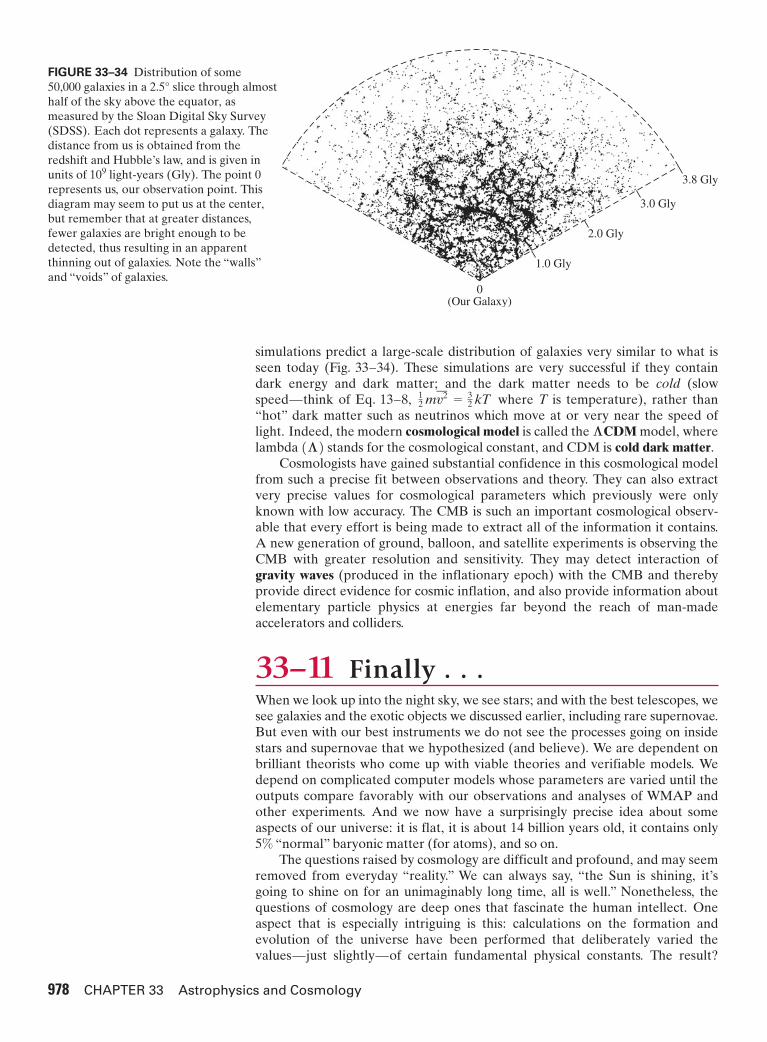
0(Our Galaxy)
1.0 Gly
2.0 Gly
3.0 Gly
3.8 Gly
simulations predict a large-scale distribution of galaxies very similar to what isseen today (Fig. 33–34). These simulations are very successful if they containdark energy and dark matter; and the dark matter needs to be cold (slowspeed—think of Eq. 13–8, where T is temperature), rather than“hot” dark matter such as neutrinos which move at or very near the speed oflight. Indeed, the modern cosmological model is called the model, wherelambda stands for the cosmological constant, and CDM is cold dark matter.
Cosmologists have gained substantial confidence in this cosmological modelfrom such a precise fit between observations and theory. They can also extractvery precise values for cosmological parameters which previously were onlyknown with low accuracy. The CMB is such an important cosmological observ-able that every effort is being made to extract all of the information it contains.A new generation of ground, balloon, and satellite experiments is observing theCMB with greater resolution and sensitivity. They may detect interaction ofgravity waves (produced in the inflationary epoch) with the CMB and therebyprovide direct evidence for cosmic inflation, and also provide information aboutelementary particle physics at energies far beyond the reach of man-madeaccelerators and colliders.
33–11 Finally . . .When we look up into the night sky, we see stars; and with the best telescopes, wesee galaxies and the exotic objects we discussed earlier, including rare supernovae.But even with our best instruments we do not see the processes going on insidestars and supernovae that we hypothesized (and believe). We are dependent onbrilliant theorists who come up with viable theories and verifiable models. Wedepend on complicated computer models whose parameters are varied until theoutputs compare favorably with our observations and analyses of WMAP andother experiments. And we now have a surprisingly precise idea about someaspects of our universe: it is flat, it is about 14 billion years old, it contains only5% “normal” baryonic matter (for atoms), and so on.
The questions raised by cosmology are difficult and profound, and may seemremoved from everyday “reality.” We can always say, “the Sun is shining, it’sgoing to shine on for an unimaginably long time, all is well.” Nonetheless, thequestions of cosmology are deep ones that fascinate the human intellect. Oneaspect that is especially intriguing is this: calculations on the formation andevolution of the universe have been performed that deliberately varied thevalues—just slightly—of certain fundamental physical constants. The result?
(∂)∂CDM
12 mO = 3
2 kT
978 CHAPTER 33 Astrophysics and Cosmology
FIGURE 33–34 Distribution of some 50,000 galaxies in a 2.5° slice through almosthalf of the sky above the equator, asmeasured by the Sloan Digital Sky Survey(SDSS). Each dot represents a galaxy. Thedistance from us is obtained from theredshift and Hubble’s law, and is given inunits of light-years (Gly). The point 0represents us, our observation point. Thisdiagram may seem to put us at the center,but remember that at greater distances,fewer galaxies are bright enough to bedetected, thus resulting in an apparentthinning out of galaxies. Note the “walls”and “voids” of galaxies.
109

Summary 979
The night sky contains myriads of stars including those in theMilky Way, which is a “side view” of our Galaxy looking alongthe plane of the disk. Our Galaxy includes over stars.Beyond our Galaxy are billions of other galaxies.
Astronomical distances are measured in light-yearsThe nearest star is about 4 ly away and the
nearest large galaxy is 2 million ly away. Our Galactic disk hasa diameter of about 100,000 ly. [Distances are sometimes speci-fied in parsecs, where ]
Stars are believed to begin life as collapsing masses of gas(protostars), largely hydrogen. As they contract, they heat up(potential energy is transformed to kinetic energy). When thetemperature reaches about 10 million degrees, nuclear fusionbegins and forms heavier elements (nucleosynthesis), mainlyhelium at first. The energy released during these reactionsheats the gas so its outward pressure balances the inward grav-itational force, and the young star stabilizes as a main-sequencestar. The tremendous luminosity of stars comes from the energyreleased during these thermonuclear reactions. After billionsof years, as helium is collected in the core and hydrogen is usedup, the core contracts and heats further. The outer envelopeexpands and cools, and the star becomes a red giant (largerdiameter, redder color).
The next stage of stellar evolution depends on the mass ofthe star, which may have lost much of its original mass as itsouter envelope escaped into space. Stars of residual mass lessthan about 1.4 solar masses cool further and become whitedwarfs, eventually fading and going out altogether. Heavierstars contract further due to their greater gravity: the densityapproaches nuclear density, the huge pressure forces electronsto combine with protons to form neutrons, and the star becomesessentially a huge nucleus of neutrons. This is a neutron star,and the energy released during its final core collapse is believedto produce supernova explosions. If the star is very massive, itmay contract even further and form a black hole, which is sodense that no matter or light can escape from it.
In the general theory of relativity, the equivalence principlestates that an observer cannot distinguish acceleration from agravitational field. Said another way, gravitational and inertialmasses are the same. The theory predicts gravitational bendingof light rays to a degree consistent with experiment. Gravity is treated as a curvature in space and time, the curvature beinggreater near massive objects. The universe as a whole may becurved. With sufficient mass, the curvature of the universewould be positive, and the universe is closed and finite; other-wise, it would be open and infinite. Today we believe theuniverse is flat.
Distant galaxies display a redshift in their spectral lines,originally interpreted as a Doppler shift. The universe is
1 parsec = 3.26 ly.
A1 ly L 1013 kmB.
1011
observed to be expanding, its galaxies racing away from eachother at speeds proportional to the distance (d) betweenthem:
(33;4)
which is known as Hubble’s law ( is the Hubble parameter).This expansion of the universe suggests an explosive origin,the Big Bang, which occurred about 13.8 billion years ago. It isnot like an ordinary explosion, but rather an expansion ofspace itself.
The cosmological principle assumes that the universe, ona large scale, is homogeneous and isotropic.
Important evidence for the Big Bang model of the universewas the discovery of the cosmic microwave background radia-tion (CMB), which conforms to a blackbody radiation curve ata temperature of 2.725 K.
The Standard Model of the Big Bang provides a possiblescenario as to how the universe developed as it expanded andcooled after the Big Bang. Starting at seconds after theBig Bang, according to this model, the universe underwent abrief but rapid exponential expansion, referred to as inflation.Shortly thereafter, quarks were confined into hadrons (the hadron era). About after the Big Bang, the majorityof hadrons disappeared, having combined with anti-hadrons,producing photons, leptons, and energy, leaving mainly photonsand leptons to freely move, thus introducing the lepton era.By the time the universe was about 10 s old, the electrons toohad mostly disappeared, having combined with their antiparticles;the universe was radiation-dominated. A couple of minuteslater, nucleosynthesis began, but lasted only a few minutes. Itthen took almost four hundred thousand years before the uni-verse was cool enough for electrons to combine with nuclei toform atoms (recombination). Photons, up to then continuallybeing scattered off of free electrons, could now move freely—they were decoupled from matter and the universe becametransparent. The background radiation had expanded andcooled so much that its total energy became less than theenergy in matter, and matter dominated increasingly overradiation. Then stars and galaxies formed, producing a universenot much different than it is today—some 14 billion years later.
Recent observations indicate that the universe is essentiallyflat, that it contains an as-yet unknown type of dark matter,and that it is dominated by a mysterious dark energy whichexerts a sort of negative gravity causing the expansion of theuniverse to accelerate. The total contributions of baryonic(normal) matter, dark matter, and dark energy sum up to thecritical density.
10–4 s
10–43
H0
v = H0d,
(v)
Summary
A universe in which life as we know it could not exist. [For example, if the differencein mass between a proton and a neutron were zero, or less than the mass of the electron, , there would be no atoms: electrons would becaptured by protons to make neutrons.] Such results have contributed to aphilosophical idea called the anthropic principle, which says that if the universewere even a little different than it is, we could not be here. We physicists aretrying to find out if there are some undiscovered fundamental laws thatdetermined those conditions that allowed us to exist. A poet might say that theuniverse is exquisitely tuned, almost as if to accommodate us.
0.511 MeV�c2
980 CHAPTER 33 Astrophysics and Cosmology
1. The Milky Way was once thought to be “murky” or “milky”but is now considered to be made up of point sources.Explain.
2. A star is in equilibrium when it radiates at its surface allthe energy generated in its core. What happens when itbegins to generate more energy than it radiates? Lessenergy? Explain.
3. Describe a red giant star. List some of its properties.4. Does the H–R diagram directly reveal anything about the
core of a star?5. Why do some stars end up as white dwarfs, and others as
neutron stars or black holes?6. If you were measuring star parallaxes from the Moon
instead of Earth, what corrections would you have tomake? What changes would occur if you were measuringparallaxes from Mars?
7. Cepheid variable stars change in luminosity with a typicalperiod of several days. The period has been found to havea definite relationship with the average intrinsic luminosityof the star. How could these stars be used to measure thedistance to galaxies?
8. What is a geodesic? What is its role in General Relativity?9. If it were discovered that the redshift of spectral lines of
galaxies was due to something other than expansion, howmight our view of the universe change? Would there beconflicting evidence? Discuss.
10. Almost all galaxies appear to be moving away from us.Are we therefore at the center of the universe? Explain.
11. If you were located in a galaxy near the boundary of ourobservable universe, would galaxies in the direction of theMilky Way appear to be approaching you or receding fromyou? Explain.
12. Compare an explosion on Earth to the Big Bang. Considersuch questions as: Would the debris spread at a higherspeed for more distant particles, as in the Big Bang?Would the debris come to rest? What type of universewould this correspond to, open or closed?
13. If nothing, not even light, escapes from a black hole, thenhow can we tell if one is there?
14. The Earth’s age is often given as about 4.6 billion years.Find that time on Fig. 33–29. Modern humans have livedon Earth on the order of 200,000 years. Where is that onFig. 33–29?
15. Why were atoms, as opposed to bare nuclei, unable to existuntil hundreds of thousands of years after the Big Bang?
16. (a) Why are Type Ia supernovae so useful for determining thedistances of galaxies? (b) How are their distances actuallymeasured?
17. Under what circumstances would the universe eventuallycollapse in on itself?
18. (a) Why did astronomers expect that the expansion rate ofthe universe would be decreasing (decelerating) with time?(b) How, in principle, could astronomers hope to deter-mine whether the universe used to expand faster than it doesnow?
Questions
1. Which one of the following is not expected to occur on anH–R diagram during the lifetime of a single star?(a) The star will move off the main sequence toward the
upper right of the diagram.(b) Low-mass stars will become white dwarfs and end up
toward the lower left of the diagram.(c) The star will move along the main sequence from one
place to another.(d) All of the above.
2. When can parallax be used to determine the approximatedistance from the Earth to a star?(a) Only during January and July.(b) Only when the star’s distance is relatively small.(c) Only when the star’s distance is relatively large.(d) Only when the star appears to move directly toward
or away from the Earth.(e) Only when the star is the Sun.(f) Always.(g) Never.
3. Observations show that all galaxies tend to move away fromEarth, and that more distant galaxies move away from Earthat faster velocities than do galaxies closer to the Earth.These observations imply that(a) the Earth is the center of the universe.(b) the universe is expanding.(c) the expansion of the universe will eventually stop.(d) All of the above.
4. Which process results in a tremendous amount of energybeing emitted by the Sun?(a) Hydrogen atoms burn in the presence of oxygen—
that is, hydrogen atoms oxidize.(b) The Sun contracts, decreasing its gravitational
potential energy.(c) Protons in hydrogen atoms fuse, forming helium nuclei.(d) Radioactive atoms such as uranium, plutonium, and
cesium emit gamma rays with high energy.(e) None of the above.
5. Which of the following methods can be used to find thedistance from us to a star outside our galaxy? Choose allthat apply.(a) Parallax.(b) Using luminosity and temperature from the H–R
diagram and measuring the apparent brightness.(c) Using supernova explosions as a “standard candle.”(d) Redshift in the line spectra of elements and compounds.
6. The history of the universe can be determined by observingastronomical objects at various (large) distances from theEarth. This method of discovery works because(a) time proceeds at different rates in different regions of
the universe.(b) light travels at a finite speed.(c) matter warps space.(d) older galaxies are farther from the Earth than are
younger galaxies.
MisConceptual Questions

Problems 981
33–1 to 33–3 Stars, Galaxies, Stellar Evolution,Distances
1. (I) The parallax angle of a star is 0.00029°. How far away isthe star?
2. (I) A star exhibits a parallax of 0.27 seconds of arc. Howfar away is it?
3. (I) If one star is twice as far away from us as a second star,will the parallax angle of the farther star be greater or lessthan that of the nearer star? By what factor?
4. (II) What is the relative brightness of the Sun as seen fromJupiter, as compared to its brightness from Earth? (Jupiteris 5.2 times farther from the Sun than the Earth is.)
5. (II) When our Sun becomes a red giant, what will be itsaverage density if it expands out to the orbit of Mercury ( from the Sun)?
6. (II) We saw earlier (Chapter 14) that the rate energyreaches the Earth from the Sun (the “solar constant”) isabout What is (a) the apparent bright-ness b of the Sun, and (b) the intrinsic luminosity L of theSun?
7. (II) Estimate the angular width that our Galaxy wouldsubtend if observed from the nearest galaxy to us(Table 33–1). Compare to the angular width of the Moonfrom Earth.
8. (II) Assuming our Galaxy represents a good average forall other galaxies, how many stars are in the observableuniverse?
9. (II) Calculate the density of a white dwarf whose mass isequal to the Sun’s and whose radius is equal to the Earth’s.How many times larger than Earth’s density is this?
10. (II) A neutron star whose mass is 1.5 solar masses has aradius of about 11 km. Calculate its average density andcompare to that for a white dwarf (Problem 9) and to thatof nuclear matter.
*11. (II) A star is 56 pc away. What is its parallax angle? State(a) in seconds of arc, and (b) in degrees.
*12. (II) What is the parallax angle for a star that is 65 ly away?How many parsecs is this?
*13. (II) A star is 85 pc away. How long does it take for its lightto reach us?
1.3 * 103 W�m2.
6 * 1010 m
14. (III) Suppose two stars of the same apparent brightness bare also believed to be the same size. The spectrum of onestar peaks at 750 nm whereas that of the other peaks at450 nm. Use Wien’s law and the Stefan-Boltzmann equation(Eq. 14–6) to estimate their relative distances from us.[Hint: See Examples 33–4 and 33–5.]
15. (III) Stars located in a certain cluster are assumed to beabout the same distance from us. Two such stars have spec-tra that peak at and and theratio of their apparent brightness is Estimate their relative sizes (give ratio of their diameters)using Wien’s law and the Stefan-Boltzmann equation,Eq. 14–6.
33–4 General Relativity, Gravity and Curved Space
16. (I) Show that the Schwarzschild radius for Earth is 8.9 mm.17. (II) What is the Schwarzschild radius for a typical galaxy
(like ours)?18. (II) What mass will give a Schwarzschild radius equal to
that of the hydrogen atom in its ground state?19. (II) What is the maximum sum-of-the-angles for a triangle
on a sphere?20. (II) Describe a triangle, drawn on the surface of a sphere,
for which the sum of the angles is (a) and (b)21. (III) What is the apparent deflection of a light beam in an
elevator (Fig. 33–13) which is 2.4 m wide if the elevator isaccelerating downward at
33–5 Redshift, Hubble’s Law
22. (I) The redshift of a galaxy indicates a recession velocity ofHow far away is it?
23. (I) If a galaxy is traveling away from us at 1.5% of thespeed of light, roughly how far away is it?
24. (II) A galaxy is moving away from Earth. The “blue” hydro-gen line at 434 nm emitted from the galaxy is measured onEarth to be 455 nm. (a) How fast is the galaxy moving?(b) How far is it from Earth based on Hubble’s law?
25. (II) Estimate the wavelength shift for the 656.3-nm line inthe Balmer series of hydrogen emitted from a galaxy whosedistance from us is (a) (b) 7.0 * 107 ly.7.0 * 106 ly,
1850 km�s.
9.8 m�s2?
179°.359°,
b1�b2 = 0.091.l2 = 720 nm,l1 = 470 nm
ProblemsFor assigned homework and other learning materials, go to the MasteringPhysics website.
7. Where did the Big Bang occur?(a) Near the Earth.(b) Near the center of the Milky Way Galaxy.(c) Several billion light-years away.(d) Throughout all space.(e) Near the Andromeda Galaxy.
8. When and how were virtually all of the elements of thePeriodic Table formed?(a) In the very early universe a few seconds after the Big
Bang.(b) At the centers of stars during their main-sequence phases.(c) At the centers of stars during novae.(d) At the centers of stars during supernovae.(e) On the surfaces of planets as they cooled and hardened.
9. We know that there must be dark matter in the universebecause(a) we see dark dust clouds.(b) we see that the universe is expanding.(c) we see that stars far from the galactic center are
moving faster than can be explained by visible matter.(d) we see that the expansion of the universe is accelerating.
10. Acceleration of the universe’s expansion rate is due to(a) the repulsive effect of dark energy.(b) the attractive effect of dark matter.(c) the attractive effect of gravity.(d) the thermal expansion of stellar cores.

982 CHAPTER 33 Astrophysics and Cosmology
26. (II) If an absorption line of calcium is normally found at awavelength of 393.4 nm in a laboratory gas, and you measureit to be at 423.4 nm in the spectrum of a galaxy, what is theapproximate distance to the galaxy?
27. (II) What is the speed of a galaxy with 28. (II) What would be the redshift parameter z for a galaxy
traveling away from us at 29. (II) Estimate the distance d from the Earth to a galaxy
whose redshift parameter 30. (II) Estimate the speed of a galaxy, and its distance from us,
if the wavelength for the hydrogen line at 434 nm is meas-ured on Earth as being 610 nm.
31. (II) Radiotelescopes are designed to observe 21-cm wavesemitted by atomic hydrogen gas. A signal from a distantradio-emitting galaxy is found to have a wavelength that is0.10 cm longer than the normal 21-cm wavelength. Esti-mate the distance to this galaxy.
32. (III) Starting from Eq. 33–3, show that the Doppler shift inwavelength is (Eq. 33–6) for [Hint: Use the binomial expansion.]
33–6 to 33–8 The Big Bang, CMB, Universe Expansion
33. (I) Calculate the wavelength at the peak of the blackbodyradiation distribution at 2.7 K using Wien’s law.
34. (II) Calculate the peak wavelength of the CMB at 1.0 safter the birth of the universe. In what part of the EMspectrum is this radiation?
v V c.¢l�lrest L v�c
z = 1.
v = 0.075c?
z = 0.060?
35. (II) The critical density for closure of the universe isState in terms of the average number
of nucleons per cubic meter.
36. (II) The scale factor of the universe (average distancebetween galaxies) at any given time is believed to havebeen inversely proportional to the absolute temperature.Estimate the size of the universe, compared to today,at (a) (b) (c) and (d)
37. (II) At approximately what time had the universe cooledbelow the threshold temperature for producing (a) kaons
(b) and(c) muons
33–9 Dark Matter, Dark Energy
38. (II) Only about 5% of the energy in the universe iscomposed of baryonic matter. (a) Estimate the averagedensity of baryonic matter in the observable universe witha radius of 14 billion light-years that contains galaxies,each with about stars like our Sun. (b) Estimate thedensity of dark matter in the universe.
10111011
AM L 100 MeV�c2B?� AM L 9500 MeV�c2B,AM L 500 MeV�c2B,
t = 10–35 s.t = 10–6 s,t = 1 s,t = 106 yr,
rcrc L 10–26 kg�m3.
39. Use conservation of angular momentum to estimate theangular velocity of a neutron star which has collapsed to adiameter of 16 km, from a star whose core radius was equalto that of Earth Assume its mass is 1.5 timesthat of the Sun, and that it rotated (like our Sun) about oncea month.
40. By what factor does the rotational kinetic energy changewhen the star in Problem 39 collapses to a neutron star?
41. Suppose that three main-sequence stars could undergo thethree changes represented by the three arrows, A, B, and C,in the H–R diagram of Fig. 33–35. For each case, describethe changes in temperature, intrinsic luminosity, and size.
A6 * 106 mB.
42. Assume that the nearest stars to us have an intrinsicluminosity about the same as the Sun’s. Their apparentbrightness, however, is about times fainter than theSun. From this, estimate the distance to the nearest stars.
43. A certain pulsar, believed to be a neutron star of mass1.5 times that of the Sun, with diameter 16 km, is observedto have a rotation speed of If it loses rotationalkinetic energy at the rate of 1 part in per day, which isall transformed into radiation, what is the power output ofthe star?
44. The nearest large galaxy to our Galaxy is about away. If both galaxies have a mass of withwhat gravitational force does each galaxy attract the other?Ignore dark matter.
45. How large would the Sun be if its density equaled the criti-cal density of the universe, Express youranswer in light-years and compare with the Earth–Sundistance and the diameter of our Galaxy.
46. Two stars, whose spectra peak at 660 nm and 480 nm,respectively, both lie on the main sequence. Use Wien’slaw, the Stefan-Boltzmann equation, and the H–R diagram(Fig. 33–6) to estimate the ratio of their diameters.
47. (a) In order to measure distances with parallax at 100 ly,what minimum angular resolution (in degrees) is needed?(b) What diameter mirror or lens would be needed?
rc L 10–26 kg�m3?
4 * 1041 kg,2 * 106 ly
1091.0 rev�s.
1011
General Problems
FIGURE 33–35 Problem 41.
Surface temperature
Intr
insi
c lu
min
osity
A
B
C

Search and Learn 983
48. (a) What temperature would correspond to 14-TeV colli-sions at the LHC? (b) To what era in cosmological historydoes this correspond? [Hint: See Fig. 33–29.]
49. In the later stages of stellar evolution, a star (if massiveenough) will begin fusing carbon nuclei to form, forexample, magnesium:
(a) How much energy is released in this reaction (seeAppendix B)? (b) How much kinetic energy must eachcarbon nucleus have (assume equal) in a head-on collisionif they are just to “touch” (use Eq. 30–1) so that the strongforce can come into play? (c) What temperature does thiskinetic energy correspond to?
50. Consider the reaction
and answer the same questions as in Problem 49. 816O + 8
16O S 1428Si + 2
4He,
612C + 6
12C S 1224Mg + g.
51. Use dimensional analysis with the fundamental constantsc, G, and to estimate the value of the so-called Planck time.It is thought that physics as we know it can say nothingabout the universe before this time.
52. Estimate the mass of our observable universe using thefollowing assumptions: Our universe is spherical in shape,it has been expanding at the speed of light since the BigBang, and its density is the critical density.
U
A: Our Earth and ourselves, 2 years ago.B: 600 ly (estimating L from Fig. 33–6 as
note that on a log scale, 6000 K is closer to 7000 K than itis to 5000 K).
L L 8 * 1026 W;C: 30 km.D: (a); not the usual but R: see formula for the
Schwarzschild radius.E: (c); (d).
R3,
A N S W E R S TO E X E R C I S E S
1. Estimate what neutrino mass (in ) would provide thecritical density to close the universe. Assume the neutrinodensity is, like photons, about times that of nucleons,and that nucleons make up only (a) 2% of the massneeded, or (b) 5% of the mass needed.
2. Describe how we can estimate the distance from us to otherstars. Which methods can we use for nearby stars, and whichcan we use for very distant stars? Which method gives themost accurate distance measurements for the most distantstars?
3. The evolution of stars, as discussed in Section 33–2, canlead to a white dwarf, a neutron star, or even a black hole,depending on the mass. (a) Referring to Sections 33–2 and33–4, give the radius of (i) a white dwarf of 1 solar mass,(ii) a neutron star of 1.5 solar masses, and (iii) a black holeof 3 solar masses. (b) Express these three radii as ratios
.4. (a) Describe some of the evidence that the universe began
with a “Big Bang.” (b) How does the curvature of the uni-verse affect its future destiny? (c) How does dark energyaffect the possible future of the universe?
(ri : rii : riii)
109
eV�c2 5. When stable nuclei first formed, about 3 minutes after theBig Bang, there were about 7 times more protons thanneutrons. Explain how this leads to a ratio of the mass ofhydrogen to the mass of helium of 3 :1. This is about theactual ratio observed in the universe.
6. Explain what the 2.7-K cosmic microwave backgroundradiation is. Where does it come from? Why is its tempera-ture now so low?
7. We cannot use Hubble’s law to measure the distances tonearby galaxies, because their random motions are largerthan the overall expansion. Indeed, the closest galaxy tous, the Andromeda Galaxy, 2.5 million light-years away, isapproaching us at a speed of about (a) What isthe shift in wavelength of the 656-nm line of hydrogenemitted from the Andromeda Galaxy, as seen by us? (b) Isthis a redshift or a blueshift? (c) Ignoring the expansion,how soon will it and the Milky Way Galaxy collide?
130 km�s.
Search and Learn
Related Documents