A Story of Units Grade 2 Module 7 CommonCore.org Excerpt from Lesson 1: Lesson Objective: Sort and record data into a table using up to four categories; use category counts to solve word problems. Chart 2: Sentence frames to support language production. Chart 3: Animal Classification with a blank table labeled bird, mammal, reptile, and fish. Chart 4: Animal Habitats with a blank table labeled arctic, woodland, and ocean. Have students sit on the carpet in a circle. T: Let’s play a guessing game! T: I have two legs, wings, feathers, and I can fly. What am I? Whisper to your partner. S: A bird! T: Of course! I just described the characteristics of a bird. (Post Chart 1.) Where do you see the characteristics of a bird listed on this chart? S: On the left! Under the word bird. T: (Show a picture of a fish. Point to Chart 2.) Use these sentence frames to tell your partner about this animal. S: It is a fish. A fish has scales and gills. It can swim. It can lay eggs. T: What is this animal? S: A fish! T: So what are the characteristics of a fish? S: It has scales. It has fins and gills. It swims. T: Yes! Let’s sort animals into categories, or groups, based on their characteristics. Pass out one picture card to each pair of students. Have partners take turns using the sentence frames and the animal characteristics chart to describe their animal to each other. Then have students sort the pictures into piles by category in the middle of the circle. Chart 2 Chart 1 Chart 3 NOTES ON MULTIPLE MEANS OF REPRESENTATION: Support English language learners by introducing essential terms like characteristics, categories, data, and table to them using visuals and multiple examples. Ask them to practice using the terms, pick out examples, and label pictures as examples of the different terms. Concept Development (35 minutes) Materials: (T) 4 pieces of chart paper (see chart list below) (S) Personal white boards, one animal picture from the picture sheet per pair of students Note: Prior to this lesson, consider laminating the picture sheet to make reusable cards. Cut the sheet into individual pictures. Also, prepare the four charts listed below. Save these charts for work in G2–M7–Lessons 1, 2, and 3. Chart 1: Animal Characteristics with a blank tree map labeled bird, mammal, reptile, and fish.

Welcome message from author
This document is posted to help you gain knowledge. Please leave a comment to let me know what you think about it! Share it to your friends and learn new things together.
Transcript

A Story of Units Grade 2 Module 7 CommonCore.org
Excerpt from Lesson 1: Lesson Objective: Sort and record data into a table using up to four categories; use category counts to solve word problems.
Lesson 1: Sort and record data into a table using up to four categories; use category counts to solve word problems.
Date: 12/27/13 7.A.5
© 2013 Common Core, Inc. Some rights reserved. commoncore.org
This work is licensed under a Creative Commons Attribution-NonCommercial-ShareAlike 3.0 Unported License.
Lesson 1 NYS COMMON CORE MATHEMATICS CURRICULUM 2 7
Chart 2: Sentence frames to support language production.
Chart 3: Animal Classification with a blank table labeled bird, mammal, reptile, and fish.
Chart 4: Animal Habitats with a blank table labeled arctic, woodland, and ocean.
Have students sit on the carpet in a circle.
T: Let’s play a guessing game! T: I have two legs, wings, feathers, and I can fly.
What am I? Whisper to your partner. S: A bird! T: Of course! I just described the characteristics
of a bird. (Post Chart 1.) Where do you see the characteristics of a bird listed on this chart?
S: On the left! Under the word bird. T: (Show a picture of a fish. Point to Chart 2.)
Use these sentence frames to tell your partner about this animal.
S: It is a fish. A fish has scales and gills. It can swim. It can lay eggs.
T: What is this animal? S: A fish! T: So what are the characteristics of a fish? S: It has scales. It has fins and gills. It
swims. T: Yes! Let’s sort animals into categories, or
groups, based on their characteristics.
Pass out one picture card to each pair of students. Have partners take turns using the sentence frames and the animal characteristics chart to describe their animal to each other. Then have students sort the pictures into piles by category in the middle of the circle.
T: (Display Chart 3.) Here is a table. How can we organize our information, or data, so it’s easier to know how many animals are in each category?
S: We could tape the pictures down in the row where they belong. We could count how many are in each group and write the number in that row. We could use tally marks.
T: Those are all excellent ideas! Let’s record our category counts on this table using tally marks. T: Count with me and make tally marks in the air as I record each amount. T: How many birds do we have?
Call on volunteers to count each pile of pictures one by one. Make tally marks for each amount in the appropriate category, as students make tally marks in the air as they count aloud with you.
Chart 2
Chart 1
Chart 3
Lesson 1: Sort and record data into a table using up to four categories; use category counts to solve word problems.
Date: 12/27/13 7.A.4
© 2013 Common Core, Inc. Some rights reserved. commoncore.org
This work is licensed under a Creative Commons Attribution-NonCommercial-ShareAlike 3.0 Unported License.
Lesson 1 NYS COMMON CORE MATHEMATICS CURRICULUM 2 7
NOTES ON
MULTIPLE MEANS OF
ACTION AND
EXPRESSION:
Scaffold the Application Problem for your students with disabilities by talking through it step by step and by asking questions such as, “How many penguins? How many whales? Are there more penguins or whales?” Watch students as they draw their tape diagrams to solve the problem and insist that they represent the problem accurately.
NOTES ON
MULTIPLE MEANS OF
REPRESENTATION:
Support English language learners by introducing essential terms like characteristics, categories, data, and table to them using visuals and multiple examples. Ask them to practice using the terms, pick out examples, and label pictures as examples of the different terms.
A being the most simple to Sheet E being the most complex. Start all students on Sheet A.
Students complete as many problems as they can in 120 seconds. The recommended goal is 100% accuracy and completion before moving to the next level. Collect any Practice Sets that have been completed within the 120 seconds and check the answers. The next time Core Fluency Practice Sets are used, students who have successfully completed their set can be provided with the next level. Keep a record of student progress.
Consider assigning early finishers a counting pattern and start number (e.g., count by fives from 195). Celebrate improvement as well as advancement. Students should be encouraged to compete with themselves rather than their peers. Discuss with students possible strategies to solve. Notify caring adults of each student’s progress.
Application Problem (5 minutes)
There are 24 penguins sliding on the ice. There are 18 whales splashing in the ocean. How many more penguins than whales are there?
Note: This problem’s context leads into today’s Concept Development, as students will be sorting animals by habitat. Also, it is a comparative problem type that lends itself to a tape diagram drawing. This sets the stage for students to notice the similarity between the bars of a tape diagram and the bars of a bar graph in G2–M7–Lesson 3.
Concept Development (35 minutes)
Materials: (T) 4 pieces of chart paper (see chart list below) (S) Personal white boards, one animal picture from the picture sheet per pair of students
Note: Prior to this lesson, consider laminating the picture sheet to make reusable cards. Cut the sheet into individual pictures. Also, prepare the four charts listed below. Save these charts for work in G2–M7–Lessons 1, 2, and 3.
Chart 1: Animal Characteristics with a blank tree map labeled bird, mammal, reptile, and fish.

A Story of Units Grade 2 Module 7 CommonCore.org
Lesson 1, Continued
Lesson 1: Sort and record data into a table using up to four categories; use category counts to solve word problems.
Date: 12/27/13 7.A.5
© 2013 Common Core, Inc. Some rights reserved. commoncore.org
This work is licensed under a Creative Commons Attribution-NonCommercial-ShareAlike 3.0 Unported License.
Lesson 1 NYS COMMON CORE MATHEMATICS CURRICULUM 2 7
Chart 2: Sentence frames to support language production.
Chart 3: Animal Classification with a blank table labeled bird, mammal, reptile, and fish.
Chart 4: Animal Habitats with a blank table labeled arctic, woodland, and ocean.
Have students sit on the carpet in a circle.
T: Let’s play a guessing game! T: I have two legs, wings, feathers, and I can fly.
What am I? Whisper to your partner. S: A bird! T: Of course! I just described the characteristics
of a bird. (Post Chart 1.) Where do you see the characteristics of a bird listed on this chart?
S: On the left! Under the word bird. T: (Show a picture of a fish. Point to Chart 2.)
Use these sentence frames to tell your partner about this animal.
S: It is a fish. A fish has scales and gills. It can swim. It can lay eggs.
T: What is this animal? S: A fish! T: So what are the characteristics of a fish? S: It has scales. It has fins and gills. It
swims. T: Yes! Let’s sort animals into categories, or
groups, based on their characteristics.
Pass out one picture card to each pair of students. Have partners take turns using the sentence frames and the animal characteristics chart to describe their animal to each other. Then have students sort the pictures into piles by category in the middle of the circle.
T: (Display Chart 3.) Here is a table. How can we organize our information, or data, so it’s easier to know how many animals are in each category?
S: We could tape the pictures down in the row where they belong. We could count how many are in each group and write the number in that row. We could use tally marks.
T: Those are all excellent ideas! Let’s record our category counts on this table using tally marks. T: Count with me and make tally marks in the air as I record each amount. T: How many birds do we have?
Call on volunteers to count each pile of pictures one by one. Make tally marks for each amount in the appropriate category, as students make tally marks in the air as they count aloud with you.
Chart 2
Chart 1
Chart 3
Lesson 1: Sort and record data into a table using up to four categories; use category counts to solve word problems.
Date: 12/27/13 7.A.6
© 2013 Common Core, Inc. Some rights reserved. commoncore.org
This work is licensed under a Creative Commons Attribution-NonCommercial-ShareAlike 3.0 Unported License.
Lesson 1 NYS COMMON CORE MATHEMATICS CURRICULUM 2 7
T: Now that the data is organized in this table, is it easy to see and count how many animals belong to each category?
S: Yes! T: Let’s count the tally marks in each category, while I record the totals as numbers directly on the
table. (Record the numbers to the right of the tally marks.) T: Now we can use the data to answer some questions.
Pose questions such as those below, and have students write their answers on their personal boards. Then invite students to pose questions to the class based on the data.
How many categories does this table have? How many animals did we sort all together? How many more birds and mammals are there than reptiles and fish? How many fewer birds and fish are there than mammals and reptiles? How would the table change if we counted four more birds? T: What are some other ways we could organize these
animals? S: We could sort them by what they eat. Or, by where
they live. We could sort them by whether they are predators or prey!
T: I like your thinking! Let’s sort them by their habitat, or where they live. (Display Chart 4.)
Repeat the process with animal habitats, but this time record numbers instead of tally marks.
Prompt students to discuss which recording is easier to read, tally marks or numbers. Some students may say numbers, because the total is given so they don’t have to count the tally marks. However, some students may reference the visual length of the tally marks as helpful, particularly with questions of most and least. This touches on the tally’s resemblance to bars in a tape diagram, a relationship that will be more pronounced when students create and use bar graphs in G2–M7–Lesson 3.
Make a quick drawing to show Chart 4 drawn vertically. Ask students whether the orientation of the table affects the data in any way.
After creating the table on Chart 4, have students write their answers as you ask questions such as those below. Then invite partners to ask and answer questions that they create.
How many categories does this table have? Which category has the fewest animals? Which has the most? How many animals altogether live in the woodland and the ocean? How many fewer animals live in the arctic than in the ocean? How many more animals would need to be in the arctic category to have the same number as
animals in the woodland category? How many more arctic and ocean animals are there than woodland animals? (Note that some
students will believe the wording how many more means there must be a difference. Have students who answer correctly explain their answer.)
Chart 4
MP.1

A Story of Units Grade 2 Module 7 CommonCore.org
Excerpt from Lesson 2: Lesson Objective: Draw and label a picture graph to represent data with up to four categories.
Lesson 2 NYS COMMON CORE MATHEMATICS CURRICULUM 2•7
Lesson 2: Draw and label a picture graph to represent data with up to four
categories.
Date: 12/27/13
7.A.24
© 2013 Common Core, Inc. Some rights reserved. commoncore.org
This work is licensed under a
Creative Commons Attribution-NonCommercial-ShareAlike 3.0 Unported License.
NOTES ON MULTIPLE MEANS OF ENGAGEMENT:
Use Google Images to show visuals of
unusual animals such as the Komodo
dragon or the chameleon, and share
interesting facts. Invite students from
other countries to share any animals
that may be specific to that geographic
area.
NOTES ON MULTIPLE MEANS OF ACTION AND EXPRESSION:
Support English language learners with
sentence frames to guide them in
posing and answering questions based
on the data. For example, “We counted _____ birds, mammals, and
reptiles,” and, “The category with the fewest animals is _____.”
T: Let’s write these labels in the same order as they appear on the table. (Model as students do the
same.)
T: Why do you think it matters that we write the
categories in the same order as they appear on the
table?
S: So we don’t get confused. So the information looks
the same.
T: Yes, we want to be sure our data matches up.
T: Now, we’re going to draw a picture in each box to represent each animal recorded by a tally mark on our
table.
T: As always, it’s math not art, so we want to be quick and efficient. We don’t have the time or enough space
to draw a whale or a polar bear over and over in these
little boxes, do we?
S: No!
T: What do we use in our math drawings that’s quick and efficient?
S: Circles!
T: Absolutely! A circle is a fast way to draw something, and it can stand for whatever we want it to
stand for!
T: Today, our circles will be our picture, or symbol, for
animals. Each circle will represent one animal, and
we’ll draw one circle in each box. T: How many circles should we draw in the bird column?
S: Four circles!
T: Draw with me. (Model as students do the same.
Continue this way to complete the picture graph.)
T: We need to add one more piece of information to our
graph. We have to tell people what those circles stand
for, so we need a legend, or key.
T: Does a circle stand for a box of crayons?
S: No!
T: What does each circle represent?
S: Each circle stands for one animal.
T: Excellent! Add the legend on your graph. (Model as students do the same.)
T: It’s also helpful to write the total for each category count right on the graph. Let’s do that. (Model as students do the same.)
T: Now we’re ready to use our graph to ask and answer questions about the data.
Pose questions such as those below, and have students write their answers on their personal boards.
How many birds, mammals, and reptiles did we count?
Lesson 2 NYS COMMON CORE MATHEMATICS CURRICULUM 2•7
Lesson 2: Draw and label a picture graph to represent data with up to four categories.
Date: 12/27/13 7.A.23
© 2013 Common Core, Inc. Some rights reserved. commoncore.org
This work is licensed under a Creative Commons Attribution-NonCommercial-ShareAlike 3.0 Unported License.
Application Problem (5 minutes)
Gemma is counting animals in the park. She counts 16 robins, 19 ducks, and 17 squirrels. How many more robins and ducks did Gemma count than squirrels?
Note: This comparative problem type invites the use of a tape diagram. It leads into today’s lesson in which students will use data involving animals to solve simple compare word problems. It also prepares students to notice the relationship between the tape diagram and the bars on a bar graph in G2–M7–Lesson 3.
Concept Development (35 minutes)
Materials: (T) Animal Classification and Animal Habitats tables (Charts 3 and 4 from G2–M7–Lesson 1), 1 piece of chart paper (see below) (S) Template 1 graph, Template 2 graph, crayons or colored pencils, personal white board, paper or math journal
Note: Prior to this lesson, prepare a chart for a new table: Favorite Class of Animal. At the end of the lesson, save this new table and Template 1 and Template 2 graphs for work in G2–M7–Lesson 3.
Part 1: Use the picture graph template.
T: (Display Animal Classification table.) Yesterday, we organized information, or data, about animals into tables using tally marks and numbers.
T: A picture graph is another way we can show data. What do you think we use to show data on a picture graph?
S: Pictures! T: Yes! Let’s create a picture graph of the data in the Animal Classification table.
Pass out the picture graph template and have students slide the sheet into their personal boards. This way, the template can be used until students demonstrate proficiency in recording data.
Project or draw the first graph (vertical orientation on Template 1) on the board next to the Animal Classification table.
T: Since graphs help us understand information, we need to know what the graph is about. What is the title of our table?
S: Animal Classification. T: Yes. Our picture graph is going to show the same
information, so write this same title on the line above the first graph. (Model as students do the same.)
T: What are the four categories of animals we classified? S: Bird. Mammal. Reptile. Fish. Template 1

A Story of Units Grade 2 Module 7 CommonCore.org
Lesson 2, Continued
Lesson 2 NYS COMMON CORE MATHEMATICS CURRICULUM 2•7
Lesson 2: Draw and label a picture graph to represent data with up to four
categories.
Date: 12/27/13
7.A.24
© 2013 Common Core, Inc. Some rights reserved. commoncore.org
This work is licensed under a
Creative Commons Attribution-NonCommercial-ShareAlike 3.0 Unported License.
NOTES ON MULTIPLE MEANS OF ENGAGEMENT:
Use Google Images to show visuals of
unusual animals such as the Komodo
dragon or the chameleon, and share
interesting facts. Invite students from
other countries to share any animals
that may be specific to that geographic
area.
NOTES ON MULTIPLE MEANS OF ACTION AND EXPRESSION:
Support English language learners with
sentence frames to guide them in
posing and answering questions based
on the data. For example, “We counted _____ birds, mammals, and
reptiles,” and, “The category with the fewest animals is _____.”
T: Let’s write these labels in the same order as they appear on the table. (Model as students do the
same.)
T: Why do you think it matters that we write the
categories in the same order as they appear on the
table?
S: So we don’t get confused. So the information looks
the same.
T: Yes, we want to be sure our data matches up.
T: Now, we’re going to draw a picture in each box to represent each animal recorded by a tally mark on our
table.
T: As always, it’s math not art, so we want to be quick and efficient. We don’t have the time or enough space
to draw a whale or a polar bear over and over in these
little boxes, do we?
S: No!
T: What do we use in our math drawings that’s quick and efficient?
S: Circles!
T: Absolutely! A circle is a fast way to draw something, and it can stand for whatever we want it to
stand for!
T: Today, our circles will be our picture, or symbol, for
animals. Each circle will represent one animal, and
we’ll draw one circle in each box. T: How many circles should we draw in the bird column?
S: Four circles!
T: Draw with me. (Model as students do the same.
Continue this way to complete the picture graph.)
T: We need to add one more piece of information to our
graph. We have to tell people what those circles stand
for, so we need a legend, or key.
T: Does a circle stand for a box of crayons?
S: No!
T: What does each circle represent?
S: Each circle stands for one animal.
T: Excellent! Add the legend on your graph. (Model as students do the same.)
T: It’s also helpful to write the total for each category count right on the graph. Let’s do that. (Model as students do the same.)
T: Now we’re ready to use our graph to ask and answer questions about the data.
Pose questions such as those below, and have students write their answers on their personal boards.
How many birds, mammals, and reptiles did we count?

A Story of Units Grade 2 Module 7 CommonCore.org
Excerpt from Lesson 7: Lesson Objective: Solve word problems involving the total value of a group of coins.
Lesson 7 NYS COMMON CORE MATHEMATICS CURRICULUM 2•7
Lesson 7: Solve word problems involving the total value of a group of coins. Date: 12/27/13 7.B.19
© 2013 Common Core, Inc. Some rights reserved. commoncore.org
This work is licensed under a Creative Commons Attribution-NonCommercial-ShareAlike 3.0 Unported License.
Circulate and support students as they use the RDW process to complete the problem independently. Encourage flexible thinking. Check student drawings and problem-solving strategies.
The following questions may be used to check for student understanding:
What did you draw to show the story? What number sentence did you write to match your drawing?
Part 2: Solve a two-step word put together with total unknown and take from with result unknown word problem.
On Monday, Reese gives 2 dimes and 3 nickels to her sister. On Tuesday, she gives her sister 1 quarter, 1 dime, and 4 pennies. If Reese started with 94 cents, how much money does she have now?
T: Let’s read the problem together. T/S: (Read aloud.) T: What can you draw first? S: Two groups of coins, one for Monday and one for
Tuesday. T: Great! Get to work. I’ll give you a minute to draw
quietly. When I give the signal, talk to your partner about how your drawing matches the story. (Allow students time to draw. See examples to the right.)
T: Turn and talk: Look at your drawing. What are you trying to find? S: We need to find the total value of all the coins Reese gave to her sister. Then, we need to subtract
the total from 94 cents. We need to add the two groups of coins first, but then we need to subtract to see how much she has left.
T: Go ahead and do that. Write a number sentence and statement to match your work. (Pause to allow students time to work.) Explain to your partner how you solved.
S: First, I added the money from Monday and Tuesday. Then, I subtracted 74¢ from 94¢ to get 20¢. I used the make a ten strategy to make it easy. 35 + 39 = 34 + 1 + 39 = 34 + 40 = 74.
T: (Circulate to provide support and check for understanding.)
T: What were your number sentences? S: First, I added, so 20 + 15 + 25 + 10 + 4 = 74. My
second one was 94 – 74 = 20. T: And statement of your solution? S: Reese has 74 cents now. T: Watch how we can also represent this situation with a number bond. T: Turn and talk. Use part–whole language to describe how your drawing matches mine. S: Since Reese started with 94 cents, that’s the whole. We know that she gave her sister a total of
74 cents; that’s one part. We know the whole and the part she gave her sister, and we found the part Reese has left.
T: You’re on a roll! Now it’s your turn to solve.
Lesson 7 NYS COMMON CORE MATHEMATICS CURRICULUM 2•7
Lesson 7: Solve word problems involving the total value of a group of coins. Date: 12/27/13 7.B.17
© 2013 Common Core, Inc. Some rights reserved. commoncore.org
This work is licensed under a Creative Commons Attribution-NonCommercial-ShareAlike 3.0 Unported License.
NOTES ON
MULTIPLE MEANS OF
ACTION AND
EXPRESSION:
Challenge above grade level students by asking them to find other ways to show the same value (65 cents) as presented in the Application Problem. Students can use manipulatives to show their results or use paper and pencil to show how many different combinations of coins can make 65 cents.
NOTES ON
MULTIPLE MEANS OF
REPRESENTATION:
At the beginning of the lesson, support English language learners by pointing to visuals of the coins while reading Problem 1 out loud to the class. Pictures of quarters, dimes, nickels, and pennies should have the name of coin printed clearly so that students can learn them more quickly. Post the visuals on the word wall so that students needing extra support can refer to them.
struggling.
Sprint: Subtraction Across a Ten (9 minutes)
Materials: (S) Subtraction Across a Ten Sprint
Note: This Sprint gives practice with the grade level fluency of subtracting within 20.
Application Problem (5 minutes)
Danny has 2 dimes, 1 quarter, 3 nickels, and 5 pennies.
a. What is the total value of Danny’s coins?
b. Show two different ways that Danny might add to find the total.
Note: The following problem is designed to encourage students to think flexibly when adding coins. While some may order coins from greatest to least and count on, others may skip-count, and still others may look to make a ten. These strategies will be used to problem solve during today’s lesson.
Concept Development (33 minutes)
Materials: (T) Play money coins, personal white board (S) Personal white boards
Remind students to use the RDW process when solving word problems with money. Emphasize the importance of re-reading and adjusting.
Read the problem. Draw and label. Write number sentences. Write a statement.
Part 1: Solve a put together with total unknown problem.
Ignacio has 3 dimes and 2 nickels in one pocket and 1 quarter and 7 pennies in another pocket. How much money is in Ignacio’s pockets?

A Story of Units Grade 2 Module 7 CommonCore.org
Excerpt from Lesson 9: Lesson Objective: Solve word problems involving different combinations of coins with the same total value.
Lesson 9 NYS COMMON CORE MATHEMATICS CURRICULUM 2•7
Lesson 9: Solve word problems involving different combinations of coins with the same total value.
Date: 12/27/13 7.B.45
© 2013 Common Core, Inc. Some rights reserved. commoncore.org
This work is licensed under a Creative Commons Attribution-NonCommercial-ShareAlike 3.0 Unported License.
NOTES ON
MULTIPLE MEANS OF
ENGAGEMENT:
Challenge above grade level students to show you 83¢ two ways: using the least number of coins and using the greatest number of coins. Ask your students to explain how they came up with their solutions and how it is possible for both solutions to have the same value.
T: How can that be? The coins are different! S: That one is 10 cents and 5 more. The other is 5 + 5 + 5, so they are both 15 cents. Three nickels is
15 cents. A dime and 5 pennies is also 15 cents. T: Aha! So we used different coins to make the same value? S: Yes! T: Let’s try that! I will say an amount and you work with your partner to show the amount in two
different ways. T: With your partner, show 28 cents two different ways. S: (Arrange coins on their mats while discussing with their partners.) T: How did you make 28 cents? S: I used a quarter and 3 pennies. My partner used 2 dimes and 8 pennies. I also used a quarter and
3 pennies, but my partner used 2 dimes, 1 nickel, and 3 pennies.
Repeat the above sequence with the following amounts: 56 cents, 75 cents, and 1 dollar.
Part 2: Manipulate different combinations of coins in the context of word problems.
Problem 1: Tony gets 83¢ change back from the cashier at the corner store. What coins might Tony have received?
T: Read the problem to me, everyone. S: (Read chorally.) T: Can you draw something? S: Yes! T: Do that. (Allow students time to work.) T: How did you show Tony’s change? S: I drew 8 dimes and 3 pennies. I made 50¢ using 2
quarters, then added 3 dimes to make 80¢, and then added 3 pennies to make 83¢. I used 3 quarters, 1 nickel, and 3 pennies.
T: Write your coin combinations and the total value below your drawing. If you used 8 dimes and 3 pennies, write that underneath like this. (Model writing the coin combination with the total value on the board, e.g., 8 dimes, 3 pennies = 83 cents.)
T: Now pretend that the cashier has run out of quarters. Draw Tony’s change in another way without using quarters. Write your coin combination and total value below.
S: Mine still works! I traded each of my quarters for 2 dimes and a nickel. Now I have 7 dimes, 2 nickels, and 3 pennies. I didn’t use a quarter before, but this time I used 6 dimes and 4 nickels instead of 7 dimes and 2 nickels to show 80 cents.
Problem 2: Carla has 4 dimes, 1 quarter, and 2 nickels to spend at the snack stand. Peyton has 3 coins, but he has the same amount of money to spend. What coins must Peyton have? How do you know?
T: Read the problem to me, everyone.
MP.6
Lesson 9 NYS COMMON CORE MATHEMATICS CURRICULUM 2•7
Lesson 9: Solve word problems involving different combinations of coins with the same total value.
Date: 12/27/13 7.B.44
© 2013 Common Core, Inc. Some rights reserved. commoncore.org
This work is licensed under a Creative Commons Attribution-NonCommercial-ShareAlike 3.0 Unported License.
NOTES ON
MULTIPLE MEANS OF
REPRESENTATION:
Comparison problems present a comprehension challenge to some students, including English Language Learners. These students will benefit from acting out the Application Problem first. They can then make connections through drawing and, finally, with a number sentence.
T: (Allow students 30–45 seconds check.) Return each other’s papers. Did you see another way to make 75¢ on your partner’s paper?
S: (Share for 30 seconds.) T: Turn your paper over. Let’s break apart 75¢ for another minute.
Application Problem (7 minutes)
Clark has 3 ten dollar bills and 6 five dollar bills. He has 2 more ten dollar bills and 2 more five dollar bills than Shannon. How much money does Shannon have?
Note: Allow students who are able to work independently and offer guidance to students who need support.
Concept Development (33 minutes)
Materials: (T) 1 dime, 3 nickels, 5 pennies, 2 personal white boards (S) Personal white board, bag with the following coins: 4 quarters, 10 nickels, 10 dimes, 10 pennies
Assign partners before beginning instruction.
Part 1: Manipulate different combinations of coins to make the same total value.
T: (Show 1 dime and 5 pennies on one mat and 3 nickels on another mat.) T: What is the value of the coins on this mat? (Point to the dime and pennies.) S: 15 cents! T: What is the value of the coins on this mat? (Point to the nickels.) S: 15 cents! T: So, the values are equal? S: Yes!

A Story of Units Grade 2 Module 7 CommonCore.org
Excerpt from Lesson 11: Lesson Objective: Use different strategies to make $1 or make change from $1.
Lesson 11 NYS COMMON CORE MATHEMATICS CURRICULUM 2•7
Lesson 11: Use different strategies to make $1 or make change from $1. Date: 12/27/13 7.B.64
© 2013 Common Core, Inc. Some rights reserved. commoncore.org
This work is licensed under a Creative Commons Attribution-NonCommercial-ShareAlike 3.0 Unported License.
NOTES ON MULTIPLE MEANS OF ENGAGEMENT:
Scaffold the Application Problem for English language learners by giving them coins. They can use the manipulatives to solve and share their solution.
make the same amount. T: Which way uses the fewest coins? S: 2 quarters.
Continue with the following possible sequence: 7 nickels, 6 dimes, 7 nickels, and 2 dimes.
Application Problem (6 minutes)
Tracy has 85 cents in her change purse. She has 4 coins. Which coins are they?
How much more money will Tracy need if she wants to buy a bouncy ball for $1?
Note: The purpose of this Application Problem is twofold. First, it reviews the concept of representing a quantity using the fewest number of coins. Second, it serves as a bridge to today’s lesson about making change from $1.
Concept Development (32 minutes)
Materials: (T) Various coins, dollar bill, sealed envelope with a quarter, nickel, and 4 pennies (S) Personal white boards
Part 1: Make a dollar from a given amount.
T: I have 35 cents in my hand. (Show 1 quarter and 1 dime.) T: How much more do I need to have 100 cents or a dollar? Talk to your partner. S: You can add a nickel, which will be 40 cents. Then, add another dime, to make 50, and then add 2
quarters, because that’s another 50. You can add 5 to make a ten, then add on 60. So, you need 65 cents more. You can subtract 35 from a hundred. 100 – 30 is 70, 70 – 5 is 65.
T: I can write a number sentence like this: 35¢ + ____ = 100¢. Then, I can solve by counting up by coins (as shown at right).
T: So, 35 cents plus what equals 100 cents? S: 65 cents! T: Can I also write a number sentence like this? (Write 35
+ ____ = 100 on the board.) S: Yes, 100 cents is just shown as the number 100. We know that we are talking about cents.
One dollar can be the whole, too. We’re counting up to a dollar. That is the same as 100 cents or just a hundred.
MP.1
Lesson 11 NYS COMMON CORE MATHEMATICS CURRICULUM 2•7
Lesson 11: Use different strategies to make $1 or make change from $1. Date: 12/27/13 7.B.65
© 2013 Common Core, Inc. Some rights reserved. commoncore.org
This work is licensed under a Creative Commons Attribution-NonCommercial-ShareAlike 3.0 Unported License.
T: (Hold up a dollar bill.) I have a dollar in my hand in change. What do you know about change? S: It’s the money you get back at the store. If you buy something and it costs less than what you
give the cashier, you get change. If you buy a something for 50 cents, but you only have a dollar, you’ll get change.
T: Yes. The cashier takes your money and keeps the part to pay for your things. She gives you back the part that is left over. The left over money is your change.
T: Now that you know about change, let’s solve a problem where we make change from a dollar. T: I’ll give Student A 28 cents (count out a quarter and 3 pennies). On your personal boards, write a
number sentence to represent how much I have left. For now, let’s represent $1 as either 100 or 100 cents so that all our units are the same. (Pause.)
T: Show me. S: (Show 100¢ – 28¢ = ____. 28¢ + _____ = 100¢. 100 – 28 = ____. 100 cents – 28 cents =
____.) T: Which of your suggestions uses addition to find the missing part? S: 28¢ + _____ = 100¢. T: Solve using the arrow way to add on or count up (as
shown on right). Then, share your work with a partner. T: How much will I have left? S: 72 cents! T: Yes! Let’s check this by counting up. Start with 28 cents. Let’s add the dimes, then the pennies: 38,
48, 58, 68, 78, 88, 98, 99, 100. What do we have now? S: A dollar! T: Let’s try some more problems with making change from a dollar.
Part 2: Make change from a dollar.
T: I’m holding some coins in my hand. (Hide 83 cents in hand.) T: Student B has 1 dime, 1 nickel, and 2 pennies in her hand. What is the value of her coins? S: 17 cents. T: Together, we have $1. Talk to your partner. How much money is hiding in my hand? Use part–
whole language as you talk. S: I know that one part is hiding and the other part is 17¢. I know that $1 is the whole. I know
that if 17¢ is one part, I can add another part to make $1. T: On your personal boards, draw a number bond to show what
you know. (See figure to the right.) T: We agree that the whole is $1, and one part is 17¢. Now, write
an equation from the number bond. (Provide work time.) Show me.
S: (17 + ____ = 100. 100¢ – 17¢ = ___.) T: Let’s see if you were right! (Open hand for students to count coins.)
I’m holding 3 dimes, 2 quarters, 3 pennies. Draw it on your boards,
Lesson 11 NYS COMMON CORE MATHEMATICS CURRICULUM 2•7
Lesson 11: Use different strategies to make $1 or make change from $1. Date: 12/27/13 7.B.66
© 2013 Common Core, Inc. Some rights reserved. commoncore.org
This work is licensed under a Creative Commons Attribution-NonCommercial-ShareAlike 3.0 Unported License.
NOTES ON MULTIPLE MEANS OF ACTION AND EXPRESSION:
Challenge students who are performing above grade level to write their own word problems to contextualize the numbers and operations in the lesson. Encourage students to swap and share their word problems with other students or with the class.
find the total, and circle your answer. (Provide work time.) Show me. S: (Show 83 cents.) T: If I had a dollar, and I wanted to buy something that cost 83 cents, how much change should I
receive? S: 17 cents! T: Turn and talk. What coins would I probably get? S: A dime, a nickel, and 2 pennies. Three nickels and 2 pennies. T: Let’s try another situation. Yesterday, I had $1 in coins, and then I spent some on some candy. The
cashier gave me 66¢ in change. (Count on with 2 quarters, 1 dime, 1 nickel, 1 penny.) How much did I spend?
T: Can you draw something? S: Yes! T: Do that. T: (Provide work time.) Turn and talk: Look at your drawing. What are you trying to find? S: We need to find out how much the candy cost. We have the whole and a part. We need to find
the missing part. T: Write a number sentence and statement to match your work. (Pause while students work.) Explain
to your partner how you solved. S: I drew 66¢. Then I added 4 pennies to make 70. Then I
added a quarter and a nickel to make $1. I drew a tape diagram. Then I subtracted 66¢ from 100¢. I drew a number bond with 66¢ in one part and a question mark in the other part. I put $1 in the whole.
T: I see a couple of different number sentences. Let’s share them.
S: 100 – ____ = 66. 66¢ + ____ = 100¢. 100 cents – 66 cents = ____ cents. ____ + 66 cents = 1 dollar.
T: So, the answer is…? S: 34 cents! T: These are the coins the cashier kept. (Show a quarter,
a nickel, and 4 pennies.) Turn and talk. Count up from 66 to see if together they make a dollar.
S: Sixty-six plus 4 makes 70, and then a nickel makes 75, and then another quarter makes a dollar. Sixty-six and 4 make 70, plus 25 is 95, and then another nickel makes a dollar.
T: Does 34¢ + 66¢ = 100¢? S: Yes! T: And, is 100 cents equal to a dollar? S: Yes!

A Story of Units Grade 2 Module 7 CommonCore.org
Lesson 11, Continued
Lesson 11 NYS COMMON CORE MATHEMATICS CURRICULUM 2•7
Lesson 11: Use different strategies to make $1 or make change from $1. Date: 12/27/13 7.B.67
© 2013 Common Core, Inc. Some rights reserved. commoncore.org
This work is licensed under a Creative Commons Attribution-NonCommercial-ShareAlike 3.0 Unported License.
T: I think you’re ready to work through a few problems with a partner.
Part 3: Choose your own strategy to solve.
Instruct partners to solve the following problems on their personal boards:
100 – 45 = ____ 100¢ – 29¢ = ____ ____ + 72 cents = 100 cents
Then, instruct students to explain their solution strategies to a partner. Circulate and listen in on student conversations to check for understanding. Then, invite students to complete the Problem Set independently.
Problem Set (10 minutes)
Students should do their personal best to complete the Problem Set within the allotted 10 minutes. For some classes, it may be appropriate to modify the assignment by specifying which problems they work on first. Some problems do not specify a method for solving. Students solve these problems using the RDW approach used for Application Problems.
Student Debrief (10 minutes)
Lesson Objective: Use different strategies to make $1 or make change from $1.
The Student Debrief is intended to invite reflection and active processing of the total lesson experience.
Invite students to review their solutions for the Problem Set. They should check work by comparing answers with a partner before going over answers as a class. Look for misconceptions or misunderstandings that can be addressed in the Debrief. Guide students in a conversation to debrief the Problem Set and process the lesson.
You may choose to use any combination of the questions below to lead the discussion.
Look at your Problem Set and compare your coin choices with your partner’s when you solved each problem the arrow way. Did you make the same coin choices as your partner? Is one of your ways easier to get to $1?
When we are using the arrow way, are friendly numbers important? Show your partner one problem on your Problem Set where you used a friendly number.
Lesson 11 NYS COMMON CORE MATHEMATICS CURRICULUM 2•7
Lesson 11: Use different strategies to make $1 or make change from $1. Date: 12/27/13 7.B.66
© 2013 Common Core, Inc. Some rights reserved. commoncore.org
This work is licensed under a Creative Commons Attribution-NonCommercial-ShareAlike 3.0 Unported License.
NOTES ON MULTIPLE MEANS OF ACTION AND EXPRESSION:
Challenge students who are performing above grade level to write their own word problems to contextualize the numbers and operations in the lesson. Encourage students to swap and share their word problems with other students or with the class.
find the total, and circle your answer. (Provide work time.) Show me. S: (Show 83 cents.) T: If I had a dollar, and I wanted to buy something that cost 83 cents, how much change should I
receive? S: 17 cents! T: Turn and talk. What coins would I probably get? S: A dime, a nickel, and 2 pennies. Three nickels and 2 pennies. T: Let’s try another situation. Yesterday, I had $1 in coins, and then I spent some on some candy. The
cashier gave me 66¢ in change. (Count on with 2 quarters, 1 dime, 1 nickel, 1 penny.) How much did I spend?
T: Can you draw something? S: Yes! T: Do that. T: (Provide work time.) Turn and talk: Look at your drawing. What are you trying to find? S: We need to find out how much the candy cost. We have the whole and a part. We need to find
the missing part. T: Write a number sentence and statement to match your work. (Pause while students work.) Explain
to your partner how you solved. S: I drew 66¢. Then I added 4 pennies to make 70. Then I
added a quarter and a nickel to make $1. I drew a tape diagram. Then I subtracted 66¢ from 100¢. I drew a number bond with 66¢ in one part and a question mark in the other part. I put $1 in the whole.
T: I see a couple of different number sentences. Let’s share them.
S: 100 – ____ = 66. 66¢ + ____ = 100¢. 100 cents – 66 cents = ____ cents. ____ + 66 cents = 1 dollar.
T: So, the answer is…? S: 34 cents! T: These are the coins the cashier kept. (Show a quarter,
a nickel, and 4 pennies.) Turn and talk. Count up from 66 to see if together they make a dollar.
S: Sixty-six plus 4 makes 70, and then a nickel makes 75, and then another quarter makes a dollar. Sixty-six and 4 make 70, plus 25 is 95, and then another nickel makes a dollar.
T: Does 34¢ + 66¢ = 100¢? S: Yes! T: And, is 100 cents equal to a dollar? S: Yes!

A Story of Units Grade 2 Module 7 CommonCore.org
Excerpt from Lesson 18: Lesson Objective: Measure an object twice using different length units and compare; relate measurement to unit size.
Lesson 18: Measure an item twice using different length units and compare;
relate measurement to unit size.
Date: 12/27/13
7.D.26
© 2013 Common Core, Inc. Some rights reserved. commoncore.org
This work is licensed under a
Creative Commons Attribution-NonCommercial-ShareAlike 3.0 Unported License.
Lesson 18 NYS COMMON CORE MATHEMATICS CURRICULUM 2 7
NOTES ON
MULTIPLE MEANS OF
ENGAGEMENT:
Support students performing below
grade level by repeating the activity
with different lengths. Ask them to
draw lines that are 6 centimeters long
and 6 inches long. Repeat until
students are sure that the inch line is
longer than the centimeter line and
can explain that:
The same number of units will
make a longer line when using
inches than centimeters.
It takes more centimeters than
inches to measure different
objects.
T: Which is longer, a unit of one centimeter or one inch?
S: An inch!
T: That means 7 inches is about the same length as 18 centimeters. Did we use more centimeters or
more inches to measure the pencil?
S: More centimeters.
T: Why did we need more centimeters to measure the pencil?
S: Centimeters are smaller, so it takes more of them to cover the length of the pencil.
T: Talk to your partner about why the measurements are different for the same object.
S: Centimeters are smaller than inches. It takes fewer inches to measure because inches are bigger.
The smaller the unit, the more units it takes to measure the same thing.
Part 2: Measure using centimeters and inches.
Give students time to measure both the objects in their bags and the sides of the white paper using both
inches and centimeters. They should stop to record the measurements on the plain paper as they go.
Encourage students to replicate your chart to organize their work.
T: What pattern do you see in your measurements using the different rulers?
S: The number of inches is always smaller. The number of centimeters is always bigger, because a
centimeter unit is smaller than an inch unit and it takes more of them when we are measuring.
T: Does this remind you of the time we measured straws with two different size paper clips?
S: Yes!
T: Turn and talk: What do you know about measurement
and unit size?
S: The smaller the unit means it takes more of those units
when measuring something. The bigger the unit
means you use less of them.
T: Using your rulers, draw two lines on your white paper.
Make one line 5 inches and the other 5 centimeters.
T: Before you begin, tell your partner which line will be
longer.
S: The 5 inch line!
T: Tell your partner how you know!
S: One inch is longer than 1 centimeter, so 5 inches will
be longer than 5 centimeters. Inches are longer, so
the line will be longer too.
T: (Allow students time to draw the two lines.)
T: Were we right? Is the 5-inch line longer than the 5-
centimeter line?
S: Yes!
T: Look at your lines. How many centimeters do you think it would take to equal 5 inches? Use your
centimeter ruler to check your estimate.
Lesson 18: Measure an item twice using different length units and compare;
relate measurement to unit size. Date: 12/27/13
7.D.25
© 2013 Common Core, Inc. Some rights reserved. commoncore.org
This work is licensed under a
Creative Commons Attribution-NonCommercial-ShareAlike 3.0 Unported License.
Lesson 18 NYS COMMON CORE MATHEMATICS CURRICULUM 2 7
NOTES ON MULTIPLE MEANS OF ACTION AND EXPRESSION:
Scaffold the lesson for English language
learners by pointing to the inch ruler
and the centimeter ruler while giving
directions. Point out the different
units on the rulers while asking
students which unit is bigger: the inch
or the centimeters.
for review and mastery of the sums and differences with totals through 20 by means of the Core Fluency
Practice Sets or Sprints. The process is detailed and Practice Sets provided in G2–M7–Lesson 1.
Application Problem (5 minutes)
Ezra is measuring things in his bedroom. He thinks his
bed is about 2 yards. Is this a reasonable estimate?
Explain your answer using pictures, words or numbers.
Note: This Application Problem provides practice using
benchmarks to estimate measurement. When students
finish invite them to share their reasoning either whole
group or with partners.
Concept Development (35 minutes)
Materials: (T) Chart for recording measurements as pictured below (S) Centimeter ruler, inch ruler; 1 plain
sheet of white paper; bag with an unsharpened pencil, a new crayon, a new eraser
Part 1: Compare centimeters and inches.
Assign Partners A and B.
T: Partner A, measure the pencil using the inch ruler.
Partner B, measure the pencil using the centimeter
ruler.
T: Partner A, how long is the pencil?
S: About 7 inches!
T: (Record answer.) Partner B, how long is the pencil?
S: About 18 centimeters!
T: (Record answer.) Hmm, why do you think the
measurements are so different? Turn and talk.
S: We used different units to measure. He measured
with an inch ruler, and I used a centimeter ruler.
T: Are both measurements correct?
S: Yes!
T: Let’s check and see. Partner A, this time measure the pencil with the centimeter ruler. Partner B, measure
the pencil with the inch ruler.
S: (Measure.)
T: Are your measurements the same as your partner’s
when using the different rulers?
S: Yes!
MP.2

A Story of Units Grade 2 Module 7 CommonCore.org
Excerpt from Lesson 21: Lesson Objective: Identify unknown numbers on a number line diagram by using the distance between numbers and reference points.
!!
!
2
!
22
Lesson&21&NYS&COMMON&CORE&MATHEMATICS&CURRICULUM& 2 7&
Lesson&21:& Identify!unknown!numbers!on!a!number!line!diagram!by!using!the!distance!between!numbers!and!reference!points.!
Date:& 1/4/14!7.E.17&
©!2013!Common!Core,!Inc.!Some!rights!reserved.!commoncore.org!!
This!work!is!licensed!under!a!!Creative!Commons!AttributionFNonCommercialFShareAlike!3.0!Unported!License.!!
&
!
NOTES&ON&&
MULTIPLE&MEANS&OF&
ENGAGEMENT:&
Students!who!are!struggling!can!continue!to!use!measuring!tape!for!support,!marking!the!intervals!with!additional!paper!clips,!or!sliding!their!finger!along!the!tape!while!skip!counting.!!The!continued!use!of!the!measuring!tape!will!help!students!to!focus!more!on!the!conceptual!understanding!of!the!activity.!!
Application&Problem&&(7&minutes) &
In!order!to!ride!the!Mega!Mountain!rollercoaster,!riders!must!be!at!least!44!inches!tall.!!Caroline!is!57!inches!tall.!!She!is!18!inches!taller!than!Addison.!!How!tall!is!Addison?!!How!many!more!inches!must!Addison!grow!to!ride!the!rollercoaster?!!
Note:!!This!twoFstep!word!problem!involving!length!bridges!the!work!done!in!the!previous!lesson!with!the!number!line!work!to!follow.!!Encourage!students!to!use!the!RDW!process!to!solve!and!to!write!equations!to!represent!the!problem.!!!
Concept&Development&&(33&minutes) &
Materials:! (T)!Standard!measuring!tape!!(S)!1Fmeter!strip!and!straightedge!(ruler),!personal!white!board!!!
Distribute!meter!strip!and!ruler!(straightedge)!to!students.!!!!
Problem&1:&&Identify&missing&points&on&a&number&line&with&
endpoints&30&and&50&and&units&of&5.&&&
T:! What!are!the!endpoints!of!your!meter!strip?!S:! Zero!and!1!meter!!T:! 1!meter!is!how!many!centimeters?!S:! 100!centimeters!!T:! Let’s!change!the!endpoints.!!Partner!A,!put!your!finger!
on!30!centimeters.!!Partner!B,!put!your!finger!on!50!centimeters.!!!!!
T:! Let’s!draw!a!number!line!to!represent!this!part!of!the!meter!strip.!!!
T:! Use!your!meter!strip!as!a!ruler!to!make!hash!marks!at!30!and!50!centimeters!on!your!personal!boards.!!
S:! (Draw!hash!marks.)!!!T:! Now,!take!away!your!meter!strip!and!use!your!
straightedge!to!connect!your!hash!marks!with!a!line.!!!
S:! (Draw.)!!!T:! Label!the!hash!mark!on!the!left!30!and!the!
hash!mark!on!the!right!50.!!T:! We!have!used!our!meter!strip!to!draw!part!of!a!number!line.!!What!are!the!endpoints!of!our!number!
line?!!Let’s!just!work!with!the!numbers!rather!than!continue!to!call!the!numbers!centimeters.!
!!
!
2
!
22
Lesson&21&NYS&COMMON&CORE&MATHEMATICS&CURRICULUM& 2 7&
Lesson&21:& Identify!unknown!numbers!on!a!number!line!diagram!by!using!the!distance!between!numbers!and!reference!points.!
Date:& 1/4/14!7.E.18&
©!2013!Common!Core,!Inc.!Some!rights!reserved.!commoncore.org!!
This!work!is!licensed!under!a!!Creative!Commons!AttributionFNonCommercialFShareAlike!3.0!Unported!License.!!
&
!
NOTES&ON&&MULTIPLE&MEANS&OF&REPRESENTATION:&
Support!English!language!learners!by!having!the!words!thirty,'forty,'and'fifty'with!their!corresponding!numerals!posted.!ELLs!can!easily!confuse!thirty,'forty,'and'fifty!with!the!pronunciation!of!thirteen,'fourteen,'and'fifteen.!!Posting!and!referring!to!the!visual!will!clarify!any!confusion!that!might!arise.!
S:!! 30!and!50.!T:!! Our!left!endpoint!is!often!0.!!Turn!and!talk:!!Where!has!0!gone?!!!S:! It!didn’t!disappear;!we!just!aren’t!using!that!part!of!the!number!line.!!!If!I!put!my!meter!strip!back,!
it’s!about!over!here.!T:! It’s!like!zooming!in!on!a!piece!of!the!number!line;!the!numbers!to!the!left!and!right!are!not!written!
down,!but!we!could!extend!this!out!and!see!them!if!we!needed!or!wanted!to.!!T:! Watch!as!I!draw!a!hash!mark!in!the!middle,!equal!distances!from!both!endpoints.!!The!length!
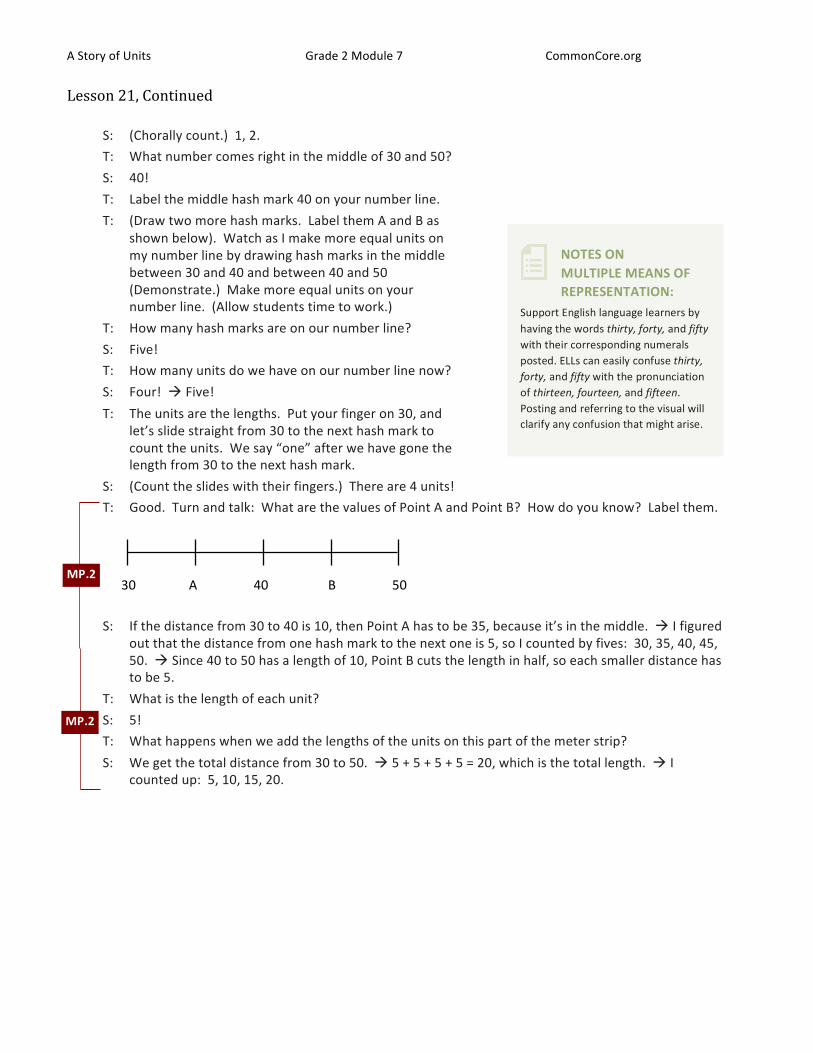
between!hash!marks!is!a!unit.!!Let’s!count!the!units!together.!!(Use!your!finger!to!slide!on!the!number!line!to!show!two!equal!units)!
!!!!
S:! (Chorally!count.)!!1,!2.!T:! What!number!comes!right!in!the!middle!of!30!and!50?!!!S:! 40!!T:! Label!the!middle!hash!mark!40!on!your!number!line.!T:! (Draw!two!more!hash!marks.!!Label!them!A!and!B!as!
shown!below).!!Watch!as!I!make!more!equal!units!on!my!number!line!by!drawing!hash!marks!in!the!middle!between!30!and!40!and!between!40!and!50!(Demonstrate.)!!Make!more!equal!units!on!your!number!line.!!(Allow!students!time!to!work.)!
T:! How!many!hash!marks!are!on!our!number!line?!S:! Five!!T:! How!many!units!do!we!have!on!our!number!line!now?!S:! Four!!!!Five!!T:! The!units!are!the!lengths.!!Put!your!finger!on!30,!and!
let’s!slide!straight!from!30!to!the!next!hash!mark!to!count!the!units.!!We!say!“one”!after!we!have!gone!the!length!from!30!to!the!next!hash!mark.!
S:! (Count!the!slides!with!their!fingers.)!!There!are!4!units!!!T:! Good.!!Turn!and!talk:!!What!are!the!values!of!Point!A!and!Point!B?!!How!do!you!know?!!Label!them.!
!
!
!!
S:! If!the!distance!from!30!to!40!is!10,!then!Point!A!has!to!be!35,!because!it’s!in!the!middle.!!!I!figured!out!that!the!distance!from!one!hash!mark!to!the!next!one!is!5,!so!I!counted!by!fives:!!30,!35,!40,!45,!
!!30!!!!!!!!!!!!!!!!A!!!!!!!!!!!!!!!!!40!!!!!!!!!!!!!!!!!!B!!!!!!!!!!!!!!!!!50!!!!!!
!!30!!! ! ! ! ! !!!!!!!!!!50!!!
MP.2&
A Story of Units Grade 2 Module 7 CommonCore.org
Lesson 21, Continued
!!
!
2
!
22
Lesson&21&NYS&COMMON&CORE&MATHEMATICS&CURRICULUM& 2 7&
Lesson&21:& Identify!unknown!numbers!on!a!number!line!diagram!by!using!the!distance!between!numbers!and!reference!points.!
Date:& 1/4/14!7.E.19&
©!2013!Common!Core,!Inc.!Some!rights!reserved.!commoncore.org!!
This!work!is!licensed!under!a!!Creative!Commons!AttributionFNonCommercialFShareAlike!3.0!Unported!License.!!
50.!!!Since!40!to!50!has!a!length!of!10,!Point!B!cuts!the!length!in!half,!so!each!smaller!distance!has!to!be!5.!!!
T:! What!is!the!length!of!each!unit?!S:! 5!!T:! What!happens!when!we!add!the!lengths!of!the!units!on!this!part!of!the!meter!strip?!S:! We!get!the!total!distance!from!30!to!50.!!!5!+!5!+!5!+!5!=!20,!which!is!the!total!length.!!!I!
counted!up:!!5,!10,!15,!20.!
Problem&2:&&Use&the&unit&length&to&count&up&or&down&to&figure&out&endpoints.&&&
&
!!
!T:! (Draw!the!number!line!above!on!the!board.)!!Look!at!this!number!line.!!How!many!units!are!there?!S:! Four!!T:! If!you!know!each!equal!unit!length!is!10,!can!you!figure!out!the!other!endpoint,!E?!!S:! Yes.!!Since!we!know!the!beginning!endpoint!is!100,!we!can!count!by!tens!until!I!get!to!E.!T:! Good!!!What!is!the!value!of!E?!!!S:! 140!!!!T:! Yes,!let!me!label!that!on!my!number!line.!!What!is!the!difference!in!length!between!endpoints?!!Tell!
your!partner!how!you!can!figure!this!out.!S:! The!difference!is!40.!!I!counted!up!by!tens!for!4!units.!!!The!difference!is!40.!!I!subtracted!the!
shorter!endpoint!from!the!longer!endpoint,!140!–!100!=!40.!T:! Good.!!I’m!going!to!write!the!difference!between!endpoints!on!the!side!of!my!number!line.!!(Don’t!
erase!from!the!board!because!it!will!be!needed!to!compare!with!the!next!number!line.)!
Problem&3:&&Vary&the&position&of&the&unknown&on&the&number&line.&
T:! Now,!draw!a!number!line!that!is!just!the!same!as!your!other!one!on!your!personal!board!with!4!units!(5!hash!marks)!with!a!right!endpoint!of!95.!!Label!the!left!endpoint!with!an!A.!!Look!at!the!number!line!on!the!board!if!you!need!help.!
!!!!
S:! (Draw.!!Assist!as!necessary.)!T:! If!each!equal!unit!length!is!10,!figure!out!the!starting!point,!A.!S:! (Count!backwards!from!95!by!tens!to!determine!the!value!of!A.)!T:! What!did!you!label!Point!A?!S:! 55!!!!
100!!!!!!!!!!!!!!!!!!!!!!!!!!!!!!!!!!!!!!!!!!!!!!!!!!!!!!!!!!!!!!!!!!!!!!!!!!!E!
A!!!!!!!!!!!!!!!!!!!!!!!!!!!!!!!!!!!!!!!!!!!!!!!!!!!!!!!!!!!!!!!!!!!!!!!!!!95!
MP.2&
!!
!
2
!
22
Lesson&21&NYS&COMMON&CORE&MATHEMATICS&CURRICULUM& 2 7&
Lesson&21:& Identify!unknown!numbers!on!a!number!line!diagram!by!using!the!distance!between!numbers!and!reference!points.!
Date:& 1/4/14!7.E.18&
©!2013!Common!Core,!Inc.!Some!rights!reserved.!commoncore.org!!
This!work!is!licensed!under!a!!Creative!Commons!AttributionFNonCommercialFShareAlike!3.0!Unported!License.!!
&
!
NOTES&ON&&MULTIPLE&MEANS&OF&REPRESENTATION:&
Support!English!language!learners!by!having!the!words!thirty,'forty,'and'fifty'with!their!corresponding!numerals!posted.!ELLs!can!easily!confuse!thirty,'forty,'and'fifty!with!the!pronunciation!of!thirteen,'fourteen,'and'fifteen.!!Posting!and!referring!to!the!visual!will!clarify!any!confusion!that!might!arise.!
S:!! 30!and!50.!T:!! Our!left!endpoint!is!often!0.!!Turn!and!talk:!!Where!has!0!gone?!!!S:! It!didn’t!disappear;!we!just!aren’t!using!that!part!of!the!number!line.!!!If!I!put!my!meter!strip!back,!
it’s!about!over!here.!T:! It’s!like!zooming!in!on!a!piece!of!the!number!line;!the!numbers!to!the!left!and!right!are!not!written!
down,!but!we!could!extend!this!out!and!see!them!if!we!needed!or!wanted!to.!!T:! Watch!as!I!draw!a!hash!mark!in!the!middle,!equal!distances!from!both!endpoints.!!The!length!
between!hash!marks!is!a!unit.!!Let’s!count!the!units!together.!!(Use!your!finger!to!slide!on!the!number!line!to!show!two!equal!units)!
!!!!
S:! (Chorally!count.)!!1,!2.!T:! What!number!comes!right!in!the!middle!of!30!and!50?!!!S:! 40!!T:! Label!the!middle!hash!mark!40!on!your!number!line.!T:! (Draw!two!more!hash!marks.!!Label!them!A!and!B!as!
shown!below).!!Watch!as!I!make!more!equal!units!on!my!number!line!by!drawing!hash!marks!in!the!middle!between!30!and!40!and!between!40!and!50!(Demonstrate.)!!Make!more!equal!units!on!your!number!line.!!(Allow!students!time!to!work.)!
T:! How!many!hash!marks!are!on!our!number!line?!S:! Five!!T:! How!many!units!do!we!have!on!our!number!line!now?!S:! Four!!!!Five!!T:! The!units!are!the!lengths.!!Put!your!finger!on!30,!and!
let’s!slide!straight!from!30!to!the!next!hash!mark!to!count!the!units.!!We!say!“one”!after!we!have!gone!the!length!from!30!to!the!next!hash!mark.!
S:! (Count!the!slides!with!their!fingers.)!!There!are!4!units!!!T:! Good.!!Turn!and!talk:!!What!are!the!values!of!Point!A!and!Point!B?!!How!do!you!know?!!Label!them.!
!
!
!!
S:! If!the!distance!from!30!to!40!is!10,!then!Point!A!has!to!be!35,!because!it’s!in!the!middle.!!!I!figured!out!that!the!distance!from!one!hash!mark!to!the!next!one!is!5,!so!I!counted!by!fives:!!30,!35,!40,!45,!
!!30!!!!!!!!!!!!!!!!A!!!!!!!!!!!!!!!!!40!!!!!!!!!!!!!!!!!!B!!!!!!!!!!!!!!!!!50!!!!!!
!!30!!! ! ! ! ! !!!!!!!!!!50!!!
MP.2&

A Story of Units Grade 2 Module 7 CommonCore.org
Excerpt from Lesson 23: Lesson Objective: Collect and record measurement data in a table; answer questions and summarize the data set.
Lesson 23 NYS COMMON CORE MATHEMATICS CURRICULUM 2•7
Lesson 23: Collect and record measurement data in a table; answer questions and summarize the data set.
Date: 12/27/13 7.F.4
© 2013 Common Core, Inc. Some rights reserved. commoncore.org
This work is licensed under a Creative Commons Attribution-NonCommercial-ShareAlike 3.0 Unported License.
NOTES ON MULTIPLE MEANS OF REPRESENTATION:
Scaffold the lesson for your English language learners by posting key vocabulary after you have introduced it in the lesson. Post terms such as handspan, table, data, and tally marks with a visual for each that captures its meaning. Having such a reference will help your English language learners to talk with a partner and complete the activities in the lesson.
Materials: (T) Ruler, document projector (if available) (S) Ruler, Problem Set
Part 1: Collect and record data.
T: Everyone hold up your right hand. S: (Hold up right hands.) T: How do you know if it’s your right or left hand? Turn and talk. S: Because my left hand makes an L. I write with my right hand. I
write with my other hand. I just do. T: Now, stretch your fingers all the way out. (Demonstrate.) T: Talk to a partner. How many inches do you think it is from the tip of
your pinky to the tip of your thumb? S: (Various guesses.) T: This measurement from the tip of our pinky to the tip of our thumb is
called our handspan. We will be measuring that today. T: (Hold ruler with right hand and show ruler against handspan, as in picture at right, mirroring what
the students will do.) Look at how I measure my handspan. What are some important things I need to remember when I measure this?
S: Start measuring at zero on the ruler. Remember what unit you are using. Notice where your handspan starts and ends.
T: Very good! I just measured my handspan, and it is ___ inches. Even though it was not exactly that many inches, I rounded up to the next whole inch. I would have rounded down if it had been closer to the other inch mark. (Write the measurement on the board.)
Put students in groups of four or five. Hand out Problem Sets and rulers. Project Problem Set or have a copy of the table on the board to fill in.
T: Look at your Problem Set. Notice that the top of the first page has a chart where we can record our measurements in inches. Let’s start with my hand measure. (Tally it on your table for students to copy.)
T: Now, work with a partner. Measure your handspan, and have your partner help you make sure your measurement is correct. Then, record your measurement on the line. (Give students time to complete this.)
T: Now switch. When you have finished with your partner, record the handspans of the other people in your group.
Circulate among the students as they complete this activity.
T: Now, take the data in your chart and fill in the table. Use a tally mark to record each person’s measurement in the appropriate box. (Provide work time.)
MP.5
Lesson 23 NYS COMMON CORE MATHEMATICS CURRICULUM 2•7
Lesson 23: Collect and record measurement data in a table; answer questions and summarize the data set.
Date: 12/27/13 7.F.3
© 2013 Common Core, Inc. Some rights reserved. commoncore.org
This work is licensed under a Creative Commons Attribution-NonCommercial-ShareAlike 3.0 Unported License.
Lesson 23 Objective: Collect and record measurement data in a table; answer questions and summarize the data set.
Suggested Lesson Structure
Fluency Practice (11 minutes)
Concept Development (39 minutes)
Student Debrief (10 minutes)
Total Time (60 minutes)
Fluency Practice (11 minutes)
How Many More Hundreds? 2.NBT.7 (2 minutes) Sprint: Adding Across a Ten 2.OA.2 (9 minutes)
How Many More Hundreds? (2 minutes)
Note: Practicing subtracting multiples of a hundred prepares students for the lesson.
T: If I say 300 – 200, you say 100. To say it in a sentence, you say, “100 more than 200 is 300.” Ready? T: 300 – 200. S: 100. T: Say it in a sentence. S: 100 more than 200 is 300.
Continue with the following possible sequence: 405 – 305, 801 – 601, 650 – 350, 825 – 125, and 999 – 299.
Sprint: Adding Across a Ten (9 minutes)
Materials: (S) Adding Across a Ten Sprint
Note: This Sprint gives practice with the grade level fluency of adding within 20.
Concept Development (39 minutes)
Note: The Concept Development today might be time consuming because it involves data collection from the entire class. For this reason and because the lesson itself is within real world context, the Application Problem has been omitted for today.

A Story of Units Grade 2 Module 7 CommonCore.org
Excerpt from Lesson 24: Lesson Objective: Draw a line plot to represent the measurement data; relate the measurement scale to the number line.
Lesson 24 NYS COMMON CORE MATHEMATICS CURRICULUM 2•7
Lesson 24: Draw a line plot to represent the measurement data; relate the measurement scale to the number line.
Date: 12/27/13 7.F.17
© 2013 Common Core, Inc. Some rights reserved. commoncore.org
This work is licensed under a Creative Commons Attribution-NonCommercial-ShareAlike 3.0 Unported License.
pennies into one cup and the other coins in another. Which cup had more coins? How many more?
Note: This two-step problem involves data comparisons, which is a skill that will be used by the students in their data work. Encourage students to use the RDW process and make a tape diagram to visualize their work.
Concept Development (32 minutes)
Materials: (T) Data table with student data from G2–M7–Lesson 23 (S) Problem Set from G2–M7–Lesson 23, recording sheet, rulers, centimeter grid paper
Part 1: Plot yesterday’s data on a line plot.
Project or show the data from G2–M7–Lesson 23 as shown at right.
T: This is our data table from yesterday, with all the measurements from our class.
T: (Project or show a number line.) What is this? S: A number line! T: Yes. We used the number line to help us with
addition and subtraction problems the other day by sliding up and down the number line. We can also use a number line in a different way to show data. (Draw a number line with a range of 3 to 8.)
T: Turn and talk: What do you notice about this number line?
S: It goes from 3 to 8. It doesn’t start at 1. There is a zero and then some slashes and then a 3. It says inches.
T: That’s right! Our data doesn’t start at 0, so we make two slashes to show that we are skipping some numbers.
T: To show our data, we put an X for each of our tally marks above the number of inches our handspans were and write the unit of measure. (Demonstrate as shown in the graph at right.)
T: Now it’s your turn. (Distribute number line templates.) Transfer the class data from yesterday’s tally table onto your number line template. (Circulate among the students as they complete this activity.)
T: You have just made a graph called a line plot! Compare your line plots with a partner. What information can you see in your line plot?
S: I see that most people have a 5-inch handspan. There are a lot more people with a 5- or 6-inch
Inches
Inches
Lesson 24 NYS COMMON CORE MATHEMATICS CURRICULUM 2•7
Lesson 24: Draw a line plot to represent the measurement data; relate the measurement scale to the number line.
Date: 12/27/13
7.F.18
© 2013 Common Core, Inc. Some rights reserved. commoncore.org
This work is licensed under a Creative Commons Attribution-NonCommercial-ShareAlike 3.0 Unported License.
NOTES ON
MULTIPLE MEANS OF
REPRESENTATIONS:
Support English language learners by
pointing to the number line, the range
of 3–8 on the number line, line plot,
tally marks, etc., when referring to
them during the lesson. Label
everything and post on the word wall
so that English language learners can
refer to them as they do their math
work.
handspan than 7- or 8-inch handspans. The starting point of the labels is the shortest measurement, and the endpoint is the longest measurement.
Part 2: Collect, organize, and plot shoe measurements in a table.
T: Let’s measure how long our shoes are. This time we’re going to use centimeters instead of inches. (Distribute rulers and grid paper.)
T: Measure your shoe length by placing your ruler flat on the bottom of your shoe. Write the centimeter measurement down on the top of your page. (Model how to do this. Allow time for students to measure.)
T: Now we’re going to make a collection table for our data. First, make your chart with the labels shoe measure and tally marks. (Model as shown at right.)
T: Next, record your shoe measurement with make a tally mark next to it. I’m going to write 26 cm (use your own measure) and make the tally mark.
T: Next, collect 9 more shoe measurements from your friends. Just be sure to add a tally mark if you get the same measurement more than once. (Circulate among the students, and facilitate the data collection.)
T: We now have a table with 10 measurements tallied on it. How many of you have 10 different measurements on your collection table? (Acknowledge student responses.)
T: How many of you found at least 5 people with the same shoe measure? (Acknowledge responses.)
Part 3: Reorganize shoe measurement data on a line plot.
T: Let’s turn our data into a line plot.
T: This time, instead of a number line that I give you, I’m going to have you create your own line plot using grid paper.
T: Take your ruler and measure the width of one of the boxes on your grid paper. (Pause for students to do this.)
T: What is the measure?
S: 1 centimeter!
T: Turn and talk. How might this help make the number line for our line plots?
S: I can use the grids to make it easier to draw my lines. The centimeter grids are just like the centimeters on my ruler. We can make our line plots match our rulers. A ruler is just like a number line!
T: I heard someone say that a ruler is just like a number line! That’s true. In this case, though, we don’t have to make our number line start at zero.
MP.4
Related Documents