Pre-print version Published version: Andre Renzaho, Mark Wooden and Brendan Houng, ‘Associations between Body Mass Index and Health-related Quality of Life among Australian Adults’, Quality of Life Research 19(4), May 2010, pp. 515-520. [http://dx.doi.org/10.1007/s11136-010-9610-z] Associations between body mass index and health-related quality of life among Australian adults Abstract Objectives To assess the relationship between body mass index (BMI) and health-related quality of life (HQoL), as measured by the Short Form Health Survey (SF-36) within a sample with broad population coverage. Subjects and Methods Survey data incorporating the SF-36 questionnaire, height and weight were obtained from a nationally representative sample of 9771 Australians aged 21 years or older (4649 males and 5122 females). Linear multiple regression methods were employed to estimate the magnitude of association between BMI classes and HQoL variables, adjusting for disability and other covariates. Results Less than 1% of men and just 3.5% of women were classified as underweight while 52.2% of women and 65.9% of men were classified as overweight or obese. For all SF-36 health dimensions, people with BMI scores in the healthy range reported, on average, higher health-related HQoL scores than underweight and obese people, and HQoL scores decreased with the degree of obesity. Although overweight and obesity were associated with decreasing levels of both physical and emotional wellbeing, the deterioration in health status was significantly more evident in the physical than in the mental, social or emotional dimensions. Conclusions Low and high BMIs were associated with decreasing levels of both physical and emotional wellbeing, but the deterioration in health status was more consistent in the physical than in other dimensions. Key words BMI, obesity, underweight, health-related quality of life, Australia 1

Welcome message from author
This document is posted to help you gain knowledge. Please leave a comment to let me know what you think about it! Share it to your friends and learn new things together.
Transcript
Pre-print version Published version: Andre Renzaho, Mark Wooden and Brendan Houng, ‘Associations between Body Mass Index and Health-related Quality of Life among Australian Adults’, Quality of Life Research 19(4), May 2010, pp. 515-520. [http://dx.doi.org/10.1007/s11136-010-9610-z]
Associations between body mass index and health-related quality of life among Australian adults
Abstract
Objectives
To assess the relationship between body mass index (BMI) and health-related quality of life (HQoL), as measured by the Short Form Health Survey (SF-36) within a sample with broad population coverage.
Subjects and Methods
Survey data incorporating the SF-36 questionnaire, height and weight were obtained from a nationally representative sample of 9771 Australians aged 21 years or older (4649 males and 5122 females). Linear multiple regression methods were employed to estimate the magnitude of association between BMI classes and HQoL variables, adjusting for disability and other covariates.
Results
Less than 1% of men and just 3.5% of women were classified as underweight while 52.2% of women and 65.9% of men were classified as overweight or obese. For all SF-36 health dimensions, people with BMI scores in the healthy range reported, on average, higher health-related HQoL scores than underweight and obese people, and HQoL scores decreased with the degree of obesity. Although overweight and obesity were associated with decreasing levels of both physical and emotional wellbeing, the deterioration in health status was significantly more evident in the physical than in the mental, social or emotional dimensions.
Conclusions
Low and high BMIs were associated with decreasing levels of both physical and emotional wellbeing, but the deterioration in health status was more consistent in the physical than in other dimensions.
Key words
BMI, obesity, underweight, health-related quality of life, Australia
1
Background
Increasing obesity rates are becoming a major public health concern in many developed countries [1], including Australia where the proportion classified as overweight or obese increased from 52% in 1995 to 62% in 2005 among men, and from 37% to 45% among women [2]. Obesity affects the quality of life in many ways. It has been suggested that obesity reduces individuals’ wellbeing by increasing morbidity risk and decreasing life expectancy [3]. Using the Short Form Health Survey (SF-36), various studies have found poorer physical health-related quality of life (HQoL) scores among obese individuals when compared to non-obese individuals but reported insignificant or no differences on psychological functioning or mental HQoL [4-11]. However, the German Health Interview and Examination Survey used the using the SF-36 and found elevated mental health scores in obese subjects when compared to their non-obese counterparts [12]. There are other studies that have reported a relationship between obesity and impairments in psychological functioning or mental HQoL, but these studies used an abbreviated version of the SF-36 [13].
Using data from the Household, Income and Labour Dynamics in Australia (HILDA) Survey, this study assessed the relationship between obesity and HQoL dimensions as measured by the SF-36, adjusting for disability and other covariates. We hypothesised that obese people would report poorer physical and mental HQoL than those with a BMI within the healthy range.
Methods
Data description and sample
We used data from the HILDA Survey, a panel survey that commenced in 2001 with a national probability sample of Australian households. Questions on height and body weight were trialed for the first time in wave 6 and repeated in wave 7, and it was this latter wave (i.e., 2007) on which the analyses reported in this paper were based. Details of the different waves and sampling methods are explained in detail elsewhere [14]. Briefly, the reference population for the initial sample was, with only minor exceptions, all persons residing in private dwellings in Australia, with interviews completed at 7682 households in wave 1. The proportions of respondents from one wave who were successfully interviewed in the next are reasonably high, rising from 87% in wave 2 to almost 95% in wave 7. Data included in this paper comprised 12,789 individuals from 7063 households. Given our focus on adult obesity, we restricted the sample to persons aged 21 years or older. We omitted a further 11% of cases due to non-response on the key measures examined in this study. The usable sample thus comprised 10,069 persons (4649
2
males and 5420 females). Finally, we removed a further 298 females who reported a pregnancy during the 12 months preceding survey.
Study variables
Obesity: Height and weight data in the HILDA Survey are self-reported and have been categorised using the World Health Organisation’s protocol [15]. The distribution of BMI scores has been found to compare reasonably well to other self-reported survey data collected by the Australian Bureau of Statistics in its 2004-05 National Health Survey [2].
HQoL: HQoL is measured using the SF-36, which comprises 36 items measuring eight distinct health concepts: Physical functioning; Role-physical; Bodily pain; General health; Vitality; Social functioning; Role-emotional; and Mental health. All scales are transformed to range from 0 to 100, with a higher score indicating a better health state. The two component summary measures of the physical (PCS) and mental (MCS) dimensions were also derived [16].
Potential confounding factors: Considered confounding factors included age, gender, geographic location (urban versus rural/remoteness), smoking status, ethnicity or more strictly, having an aboriginal background, the presence of a severe disability and educational attainment. These explanatory variables are known to be directly associated with HQoL [17-22]. The disability variable we used is a measure of the presence of both disability and chronic disease. It is based on the interaction of two variables. First, one measuring the presence of a long-term health condition or disability that has lasted or is expected to last 6 months or more. Respondents were referred to a showcard listing the types of conditions. The second variable asked about the severity of the condition. “Does your condition / Do your conditions] limit
the type of work or the amount of work you can do? IF YES: Using the scale on SHOWCARD K3
(available on the HILDA website), could you pick a number between 0 and 10 to indicate how much your
condition[s] limit[s] the amount of work you can do? An answer of 0 means “not at all” and an answer of
10 means you “can do nothing”. The inclusion of such a measure was necessary to control for the reverse causation in the relationship between BMI and health outcome measures that was likely to have been evident among persons suffering conditions associated with significant weight loss. This is an approach most studies have not taken into account, hence adding a new dimension to our paper. Household income and employment status were excluded because the capacity to earn income is well known to be affected by health status [23, 24], thus rendering the inclusion of income and employment status variables in single equation models of health status problematic for satisfying the exogeneity assumption.
3
Statistical analysis
Data were summarised using univariate analyses, with the difference between means of two and three groups assessed using a t-test and a one-way ANOVA respectively. Conventional multiple regression was used to examine the relationship between the SF-36 domains and obesity, with each SF-36 domain used as a dependent variable in separate regression models controlling for age, gender, geographic location, smoking status, aboriginality, severe disability, and educational attainment. All regression estimates and their associated robust standard errors or confidence intervals have been weighted using a responding person sample weight to ensure that estimates generated from the data match known population estimates from other sources.
Results
Descriptive statistics for the sample are presented in Table 1. Less than 1% of men and just 3.5% of women were classified as underweight while 52.2% of women and 65.9% of men were classified as overweight or obese. Mean values on each of the eight SF-36 sub-scales by BMI categories are reported in Table 2. For all SF-36 health dimensions, people with BMI scores in the healthy range reported, on average, higher scores than both underweight and obese people. Further, it can also be seen that among the overweight and obese population physical and mental HQoL scores generally decline with BMI. The component summary measures, however, tell a slightly different story. While the PCS scores decline with the degree of obesity, the relationship with MCS, while still statistically significant, was much weaker. Indeed, for most categories of obese people the MCS scores were not noticeably lower than that for persons with normal BMI.
The results remained broadly consistent after adjusting for confounding factors, with both underweight and obese faring relatively poorly on most HQoL indicators (see Table 3). The notable exception was again the MCS score. On this measure none of the obese fared significantly worse than persons with BMI scores in the healthy range. While not shown in Table 3, we can also report that, other things held constant: females reported lower physical and mental HQoL scores than males; HQoL declined with age for all indicators except mental health and vitality; there was an inverse relationship between all HQoL outcomes and smoking status, HQoL scores mostly rose with educational level; residence in locations outside of the major cities was associated with markedly more positive HQoL scores; and the presence of a severe disability exerted a very large and highly significant negative impact on all HQoL outcomes (and the exclusion of this variable did not greatly affect the estimated coefficients on the BMI variables).
4
Discussion
This study found that more than half of Australian adults are overweight or obese, and obese together with underweight people reported poorer HQoL outcomes on all dimensions than people with normal BMI ranges. We hypothesised that obese people would report poorer physical and mental HQoL than those with a BMI that lies in the healthy range. This hypothesis was partially confirmed; overweight and obesity were associated with decreasing levels of both physical and emotional wellbeing, but the deterioration in health status was more consistent in the physical than in other dimensions. Our findings are broadly consistent with those reported in other studies [4-11]. That is, obese individuals tend to report poorer physical HQoL scores than non-obese individuals, but that the two groups do not differ in terms of psychological functioning or mental HQoL. Our results suggest that in the domains Mental Health and Role Emotional it is only the morbidly obese who score significantly lower than the healthy BMI group, while on the MCS measure, none of the obese groups score significantly worse, and indeed, even if we ignore significance, the point estimates are trivial.
Finally, in line with previous research, our findings confirm that being very or morbidly obese and underweight is detrimental to the physical and psychosocial aspects of quality of life. In the case of obesity, a study of 4 double-blind, randomized controlled trials found that moderate weight loss is associated with noticeably improved HQoL [25]. It is therefore possible that targeted weight loss interventions for the obese and programs to prevent weight gain among healthy individuals would ameliorate many HQoL dimensions and result in cost-savings and extended life-expectancies. For the underweight, recent evidence suggests that dietary supplements may improve HQoL among healthy individuals who restrict their food intake to lose weight [26]. Whether this is the case for those suffering from eating disorders is unknown. Further studies are required in this area.
5
References
[1] Organisation for Economic Co-operation and Development (2009). Health at glance. 2009 OECD indicators (5th Edition). Paris: OECD Publishing. <Available at: http://www.scribd.com/doc/24630287/Health-at-a-Glance-2009-OECD-Indicators}
[2] Australian Bureau of Statistics (2006). National Health Survey: Summary of Results, 2004-05 . Cat No. 4364.0. Canberra: Commonwealth of Australia.
[3] Olshansky S, Passaro D, Hershow R, Layden J, Carnes B, Brody j, Hayflick L, Butler RN, Allison D, Ludwig D. (2005) A potential decline in life expectancy in the United States in the 21st Century. New England Journal of Medicine; 352, 1138-45.
[4] Wiczinski E, Döring A, John J, Lengerke TV, Group FT. (2009) Obesity and health-related quality of life: Does social support moderate existing associations? British Journal of Health Psychology, 14, 717-34.
[5] Le Pen C, Levy E, Loos F, Banzet M, Basdevant A. (1998) "Specific" scale compared with "generic" scale: a double measurement of the quality of life in a French community sample of obese subjects. Journal of Epidemiology and Community Health, 52, 445-50.
[6] Doll H, Petersen S, Stewart-Brown S. (2000) Obesity and physical and emotional well-being: associations between body mass index, chronic illness, and the physical and mental components of the SF-36 questionnaire. Obesity Research, 8, 160-70.
[7] Mond JM, Baune BT. (2009) Overweight, medical comorbidity and health-related quality of life in a community sample of women and men. Obesity, 17, 1627-34.
[8] Sullivan M, Karlsson J, Sjostrom L, Backman L, Bengtsson C, Bouchard C, Dahlgren S, Jonsson E, Larsson B, Lindstedt S, Naslund I, Olbe L, Wedel H. (1993) Swedish obese subjects (SOS) - an intervention study of obesity. Baseline evaluation of health and psychosocial functioning in the first 1743 subjects examined. International Journal of Obesity and Related Metabolic Disorders, 17, 503-12.
[9] Katz DA, McHorney CA, Atkinson RL. (2000) Impact of obesity on health-related quality of life in patients with chronic illness. Journal of General Internal Medicine, 15, 789-96.
[10] Han TS, Tijhuis M, Lean M, Seidell J. (1998) Quality of life in relation to overweight and body fat distribution. American Journal of Public Health, 88, 1814-20.
[11] Huang IC, Frangakis C, Wu AW. (2006) The relationship of excess body weight and health-related quality of life: evidence from a population study in Taiwan. International Journal of Obesity, 30, 1250-9.
[12] Hach I, Ruhl U, Klose M, Klotsche J, Kirch W, Jacobi F. (2007) Obesity and the risk for mental disorders in a representative German adult sample. The European Journal of Public Health, 17, 297-305.
[13] Ford ES, Moriarty DG, Zack MM, Mokdad AH, Chapman DP. (2001) Self reported body mass index and health related quality of life. Findings from the behavioral risk factor surveillance system. Obesity Research, 9, 21-31.
[14] Wooden M, Watson N. (2007) The HILDA Survey and its Contribution to Economic and Social Research (So Far). The Economic Record 83, 208-31.
[15] World Health Organization. (2000) Obesity: Preventing and managing the global epidemic: Report of a WHO consultation. Technical Report Series 894. Geneva: WHO
[16] Australian Bureau of Statistics. (1997) 1995 National Health Survey - SF-36 Population Norms, Australia. ABS Catalogue No. 4399.0. Canberra: ABS.
[17] Liu H, Feurer I, Dwyer K, Speroff T, Shaffer D, Wright Pinson C. (2007) The effects of gender and age on health-related quality of life following kidney transplantation. Journal of Clinical Nursing. 17, 82-9.
6
[18] Weeks W, Kazis L, Shen Y, Cong Z, Ren X, Miller D, Lee A, PhD, Perlin J. (2004) Differences in Health-Related Quality of Life in Rural and Urban Veterans. American Journal of Public Health, 94, 1762-7.
[19] Australian Bureau of Statistics. (2008) Overweight and Obesity in Adults, Australia, 2004-05 Canberra: ABS.
[20] U.S. Department of Health and Human Services. (2004) The Health Consequences of Smoking: What it Means to You. Washington: Centers for Disease Control and Prevention, National Center for Chronic Disease Prevention and Health Promotion, Office on Smoking and Health.
[21] Edwards TC, Patrick DL, Topolski TD. (2003) Quality of life of adolescents with perceived disabilities. Journal of Pediatric Psychology, 28, 233-41.
[22] Nicholl BI, Macfarlane GJ, Davies KA, Morriss R, Dickens C, McBetha J. (2009) Premorbid psychosocial factors are associated with poor health-related quality of life in subjects with new onset of chronic widespread pain-Results from the EPIFUND study. Pain, 141, 119-26.
[23] Smith JP. (1999) Healthy bodies and thick wallets: the dual relation between health and economic status. Journal of Economic Perspectives, 13, 145-66.
[24] Adams P, Hurd MD, McFadden D, Merrill A, Ribeiro T. (2003) Healthy, wealthy, and wise? Tests for direct causal paths between health and socioeconomic status. Journal of Econometrics, 112, 3-56.
[25] Samsa GP, Kolotkin R, Williams R, Nguyen M, Mendel C. (2001) Effect of moderate weight loss on health-related quality of life: an analysis of combined data from 4 randomized trials of sibutramine vs placebo. The American Journal of Managed Care, 7, 875-83.
[26] Ussher JM, Swann C. (2000) A double blind placebo controlled trial examining the relationship between Health-Related Quality of Life and dietary supplements. British Journal of Health Psychology, 5, 173-87.
7
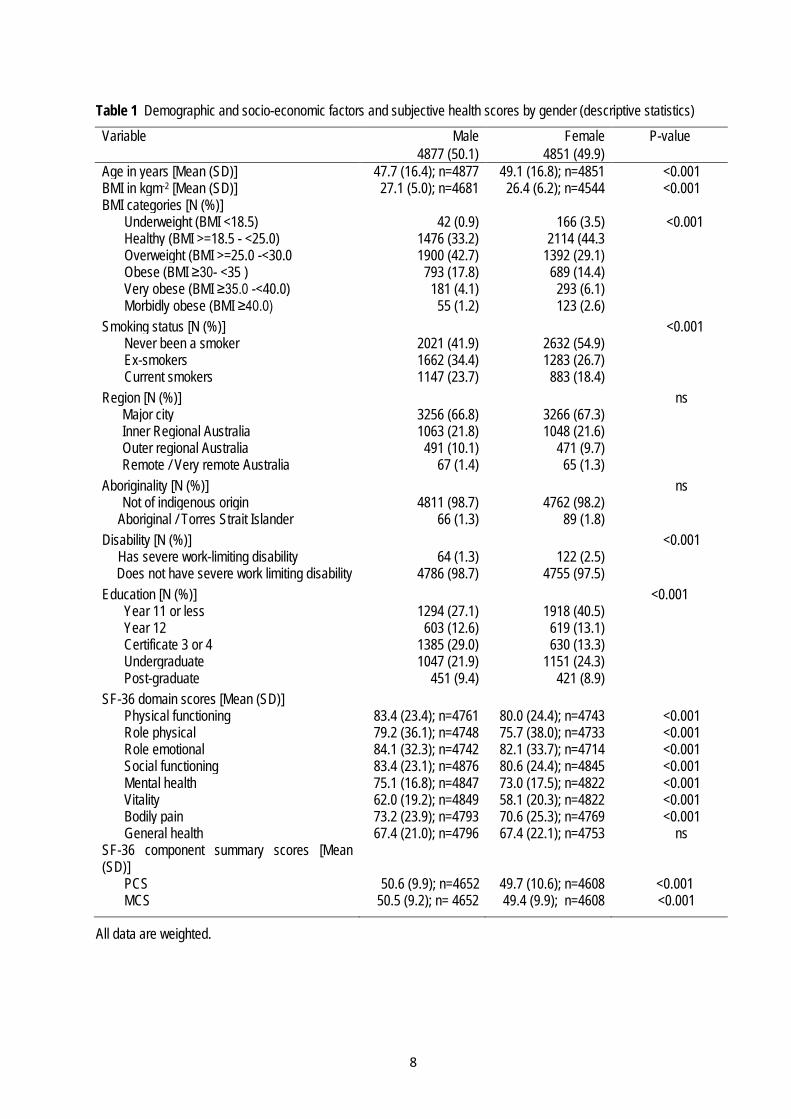
Table 1 Demographic and socio-economic factors and subjective health scores by gender (descriptive statistics) Variable Male Female P-value
4877 (50.1) 4851 (49.9) Age in years [Mean (SD)] 47.7 (16.4); n=4877 49.1 (16.8); n=4851 <0.001 BMI in kgm-2 [Mean (SD)] 27.1 (5.0); n=4681 26.4 (6.2); n=4544 <0.001 BMI categories [N (%)]
Underweight (BMI <18.5) 42 (0.9) 166 (3.5) <0.001 Healthy (BMI >=18.5 - <25.0) 1476 (33.2) 2114 (44.3 Overweight (BMI >=25.0 -<30.0 1900 (42.7) 1392 (29.1) Obese (BMI ≥30- <35 ) 793 (17.8) 689 (14.4) Very obese (BMI ≥35.0 -<40.0) 181 (4.1) 293 (6.1) Morbidly obese (BMI ≥40.0) 55 (1.2) 123 (2.6)
Smoking status [N (%)] <0.001 Never been a smoker 2021 (41.9) 2632 (54.9) Ex-smokers 1662 (34.4) 1283 (26.7) Current smokers 1147 (23.7) 883 (18.4)
Region [N (%)] ns Major city 3256 (66.8) 3266 (67.3) Inner Regional Australia 1063 (21.8) 1048 (21.6) Outer regional Australia 491 (10.1) 471 (9.7) Remote / Very remote Australia 67 (1.4) 65 (1.3)
Aboriginality [N (%)] ns Not of indigenous origin 4811 (98.7) 4762 (98.2)
Aboriginal / Torres Strait Islander 66 (1.3) 89 (1.8) Disability [N (%)] <0.001
Has severe work-limiting disability 64 (1.3) 122 (2.5) Does not have severe work limiting disability 4786 (98.7) 4755 (97.5)
Education [N (%)] <0.001 Year 11 or less 1294 (27.1) 1918 (40.5) Year 12 603 (12.6) 619 (13.1) Certificate 3 or 4 1385 (29.0) 630 (13.3) Undergraduate 1047 (21.9) 1151 (24.3) Post-graduate 451 (9.4) 421 (8.9)
SF-36 domain scores [Mean (SD)] Physical functioning 83.4 (23.4); n=4761 80.0 (24.4); n=4743 <0.001 Role physical 79.2 (36.1); n=4748 75.7 (38.0); n=4733 <0.001 Role emotional 84.1 (32.3); n=4742 82.1 (33.7); n=4714 <0.001 Social functioning 83.4 (23.1); n=4876 80.6 (24.4); n=4845 <0.001 Mental health 75.1 (16.8); n=4847 73.0 (17.5); n=4822 <0.001 Vitality 62.0 (19.2); n=4849 58.1 (20.3); n=4822 <0.001 Bodily pain 73.2 (23.9); n=4793 70.6 (25.3); n=4769 <0.001 General health 67.4 (21.0); n=4796 67.4 (22.1); n=4753 ns
SF-36 component summary scores [Mean (SD)]
PCS 50.6 (9.9); n=4652 49.7 (10.6); n=4608 <0.001 MCS 50.5 (9.2); n= 4652 49.4 (9.9); n=4608 <0.001
All data are weighted.
8
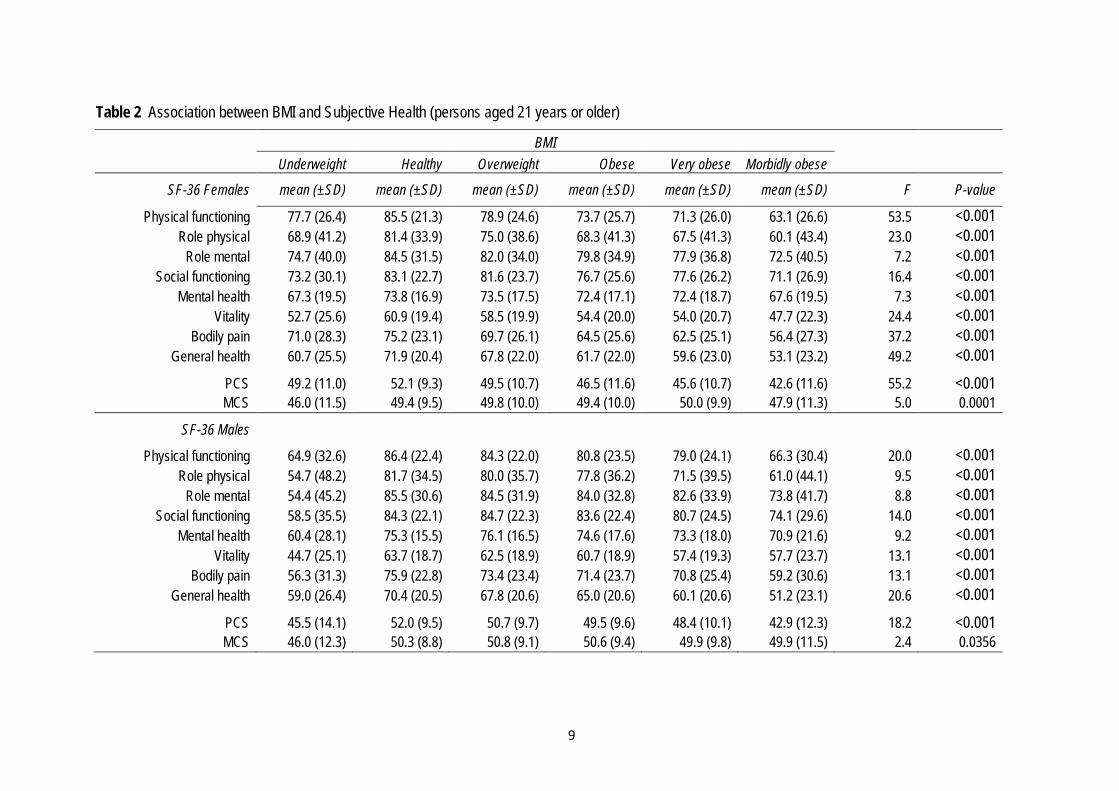
Table 2 Association between BMI and Subjective Health (persons aged 21 years or older)
BMI
Underweight Healthy Overweight Obese Very obese Morbidly obese
SF-36 Females mean (±SD) mean (±SD) mean (±SD) mean (±SD) mean (±SD) mean (±SD) F P-value
Physical functioning 77.7 (26.4) 85.5 (21.3) 78.9 (24.6) 73.7 (25.7) 71.3 (26.0) 63.1 (26.6) 53.5 <0.001 Role physical 68.9 (41.2) 81.4 (33.9) 75.0 (38.6) 68.3 (41.3) 67.5 (41.3) 60.1 (43.4) 23.0 <0.001
Role mental 74.7 (40.0) 84.5 (31.5) 82.0 (34.0) 79.8 (34.9) 77.9 (36.8) 72.5 (40.5) 7.2 <0.001 Social functioning 73.2 (30.1) 83.1 (22.7) 81.6 (23.7) 76.7 (25.6) 77.6 (26.2) 71.1 (26.9) 16.4 <0.001
Mental health 67.3 (19.5) 73.8 (16.9) 73.5 (17.5) 72.4 (17.1) 72.4 (18.7) 67.6 (19.5) 7.3 <0.001 Vitality 52.7 (25.6) 60.9 (19.4) 58.5 (19.9) 54.4 (20.0) 54.0 (20.7) 47.7 (22.3) 24.4 <0.001
Bodily pain 71.0 (28.3) 75.2 (23.1) 69.7 (26.1) 64.5 (25.6) 62.5 (25.1) 56.4 (27.3) 37.2 <0.001 General health 60.7 (25.5) 71.9 (20.4) 67.8 (22.0) 61.7 (22.0) 59.6 (23.0) 53.1 (23.2) 49.2 <0.001
PCS 49.2 (11.0) 52.1 (9.3) 49.5 (10.7) 46.5 (11.6) 45.6 (10.7) 42.6 (11.6) 55.2 <0.001 MCS 46.0 (11.5) 49.4 (9.5) 49.8 (10.0) 49.4 (10.0) 50.0 (9.9) 47.9 (11.3) 5.0 0.0001
SF-36 Males
Physical functioning 64.9 (32.6) 86.4 (22.4) 84.3 (22.0) 80.8 (23.5) 79.0 (24.1) 66.3 (30.4) 20.0 <0.001 Role physical 54.7 (48.2) 81.7 (34.5) 80.0 (35.7) 77.8 (36.2) 71.5 (39.5) 61.0 (44.1) 9.5 <0.001
Role mental 54.4 (45.2) 85.5 (30.6) 84.5 (31.9) 84.0 (32.8) 82.6 (33.9) 73.8 (41.7) 8.8 <0.001 Social functioning 58.5 (35.5) 84.3 (22.1) 84.7 (22.3) 83.6 (22.4) 80.7 (24.5) 74.1 (29.6) 14.0 <0.001
Mental health 60.4 (28.1) 75.3 (15.5) 76.1 (16.5) 74.6 (17.6) 73.3 (18.0) 70.9 (21.6) 9.2 <0.001 Vitality 44.7 (25.1) 63.7 (18.7) 62.5 (18.9) 60.7 (18.9) 57.4 (19.3) 57.7 (23.7) 13.1 <0.001
Bodily pain 56.3 (31.3) 75.9 (22.8) 73.4 (23.4) 71.4 (23.7) 70.8 (25.4) 59.2 (30.6) 13.1 <0.001 General health 59.0 (26.4) 70.4 (20.5) 67.8 (20.6) 65.0 (20.6) 60.1 (20.6) 51.2 (23.1) 20.6 <0.001
PCS 45.5 (14.1) 52.0 (9.5) 50.7 (9.7) 49.5 (9.6) 48.4 (10.1) 42.9 (12.3) 18.2 <0.001 MCS 46.0 (12.3) 50.3 (8.8) 50.8 (9.1) 50.6 (9.4) 49.9 (9.8) 49.9 (11.5) 2.4 0.0356
9
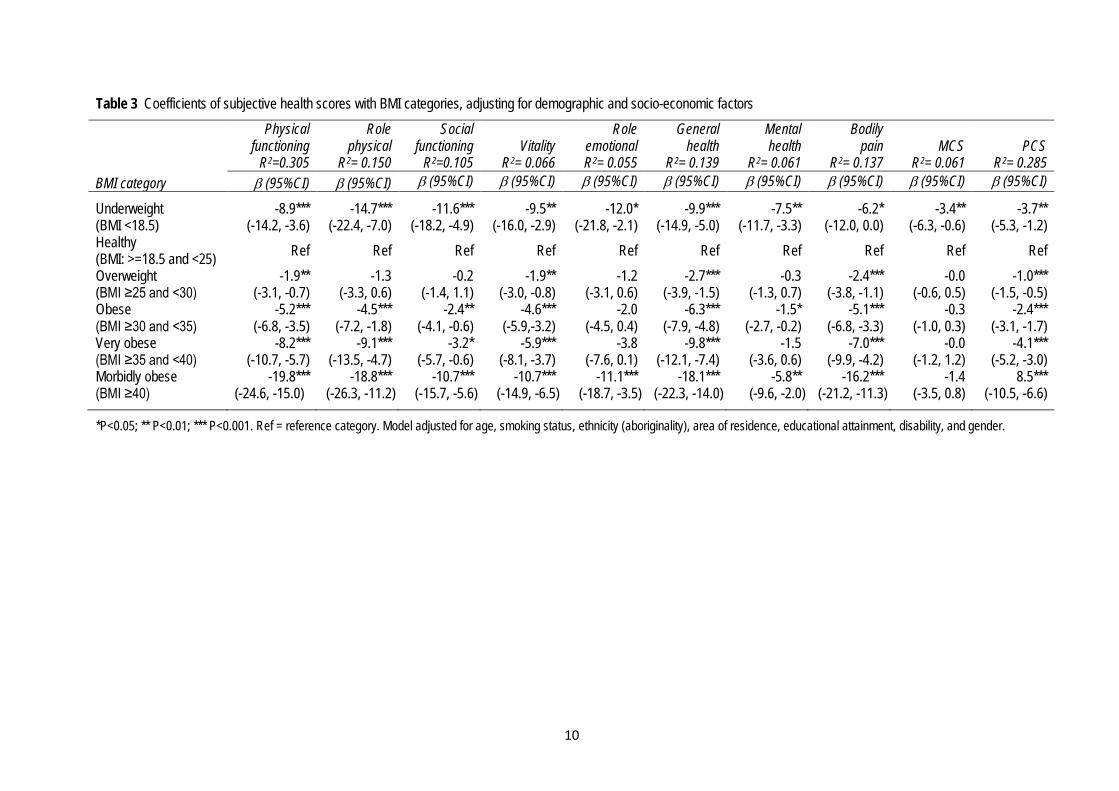
Table 3 Coefficients of subjective health scores with BMI categories, adjusting for demographic and socio-economic factors
BMI category
Physical functioning
R2=0.305
Role physical
R2= 0.150
Social functioning
R2=0.105 Vitality
R2= 0.066
Role emotional R2= 0.055
General health
R2= 0.139
Mental health
R2= 0.061
Bodily pain
R2= 0.137
MCS
R2= 0.061
PCS
R2= 0.285 β (95%CI) β (95%CI) β (95%CI) β (95%CI) β (95%CI) β (95%CI) β (95%CI) β (95%CI) β (95%CI) β (95%CI)
Underweight (BMI <18.5)
-8.9*** (-14.2, -3.6)
-14.7*** (-22.4, -7.0)
-11.6*** (-18.2, -4.9)
-9.5** (-16.0, -2.9)
-12.0* (-21.8, -2.1)
-9.9*** (-14.9, -5.0)
-7.5** (-11.7, -3.3)
-6.2* (-12.0, 0.0)
-3.4** (-6.3, -0.6)
-3.7** (-5.3, -1.2)
Healthy (BMI: >=18.5 and <25) Ref Ref Ref Ref Ref Ref Ref Ref Ref Ref Overweight (BMI ≥25 and <30)
-1.9** (-3.1, -0.7)
-1.3 (-3.3, 0.6)
-0.2 (-1.4, 1.1)
-1.9** (-3.0, -0.8)
-1.2 (-3.1, 0.6)
-2.7*** (-3.9, -1.5)
-0.3 (-1.3, 0.7)
-2.4*** (-3.8, -1.1)
-0.0 (-0.6, 0.5)
-1.0*** (-1.5, -0.5)
Obese (BMI ≥30 and <35)
-5.2*** (-6.8, -3.5)
-4.5*** (-7.2, -1.8)
-2.4** (-4.1, -0.6)
-4.6*** (-5.9,-3.2)
-2.0 (-4.5, 0.4)
-6.3*** (-7.9, -4.8)
-1.5* (-2.7, -0.2)
-5.1*** (-6.8, -3.3)
-0.3 (-1.0, 0.3)
-2.4*** (-3.1, -1.7)
Very obese (BMI ≥35 and <40)
-8.2*** (-10.7, -5.7)
-9.1*** (-13.5, -4.7)
-3.2* (-5.7, -0.6)
-5.9*** (-8.1, -3.7)
-3.8 (-7.6, 0.1)
-9.8*** (-12.1, -7.4)
-1.5 (-3.6, 0.6)
-7.0*** (-9.9, -4.2)
-0.0 (-1.2, 1.2)
-4.1*** (-5.2, -3.0)
Morbidly obese (BMI ≥40)
-19.8*** (-24.6, -15.0)
-18.8*** (-26.3, -11.2)
-10.7*** (-15.7, -5.6)
-10.7*** (-14.9, -6.5)
-11.1*** (-18.7, -3.5)
-18.1*** (-22.3, -14.0)
-5.8** (-9.6, -2.0)
-16.2*** (-21.2, -11.3)
-1.4 (-3.5, 0.8)
8.5*** (-10.5, -6.6)
*P<0.05; ** P<0.01; *** P<0.001. Ref = reference category. Model adjusted for age, smoking status, ethnicity (aboriginality), area of residence, educational attainment, disability, and gender.
10
Related Documents