Letter to the Editor Association of physical activity, asthma, and allergies: A cohort of farming and nonfarming children To the Editor: The lower prevalence of asthma and hay fever among farm children has been attributed to microbial exposures, 1 but it might also be related to differential physical activity (PA) behavior. One might speculate that farmers’ children spend more time outdoors and thus accumulate higher levels of PA, but until now no data are available to confirm this hypothesis. Studies testing associations between PA and asthma and hay fever, respectively, are contradic- tory. 2-4 In part, the conflicting evidence might be due to methodo- logic constraints because several studies based the assessment of childhood PA on questionnaires that have been shown to be of poor validity 5 ; in addition, most of them were cross-sectional in design. The present analysis aimed at addressing this open question. The analysis was based on a follow-up of 352 children (7-10 years) from the Swiss sample of the large European GABRIEL study that was originally designed to systematically study farming and rural environments and their impact on childhood asthma and atopic disease. 6 The Swiss families were contacted again in 2009, and parents were asked to fill in a short questionnaire, which focused on children’s respiratory and allergic symptoms including the val- idated International Study of Asthma and Allergies in Childhood questions 7 and children’s PA, height, and weight. Personal factors and children’s farming status were ascertained in the main survey conducted in 2007. In 2009, children were also asked to participate in a measurement study by wearing an accelerometer for 1 week. Accelerometers continuously measure the acceleration of the body as ‘‘counts’’ that are aggregated over a predefined time inter- val (10 seconds for the present analysis). Minutes spent in differ- ent intensities of PA (sedentary behavior, light physical activity [LPA], moderate physical activity, vigorous physical activity, or combined moderate to vigorous physical activity [MVPA]) were estimated by using the cutoffs published by Treuth et al. 8 A schematic of the study design (Fig E1) and a more detailed description of the methods are presented in the Online Repository available at www.jacionline.org. In accordance with previous GABRIEL analyses, asthma was defined as wheeze in the past 12 months, or asthma inhaler use ever, or a physician’s diagnosis of asthma at least once, or a history of wheezing bronchitis more than once in the past. Hay fever was defined as either nasal symptom with itchy or watery eyes in the past 12 months or a physician’s diagnosis of hay fever ever. As in 2007, no accelerometers were used. A PA score has been developed that divided the children into those with a ‘‘high physical activity’’ and thosewith a ‘‘low physical activity.’’ The score was based on indications about active transport, participa- tion in a sport club, and active play outdoors. The same score has been validated in 2009 by comparing it with accelerometer-based MVPA. Associations between respiratory problems, farming, and PA measures were analyzed by using multivariable regression. To address potential reversed causality, models were restricted to children with accelerometer measurements in autumn/winter (outside the outdoor pollen season). We found that being a farm child was not related to any of the objectively measured indicators of PA (mean counts per minute 6 SD, 548 6 187 and 553 6 155; mean MVPA 6 SD, 41.6 6 19.7 and 43.1 6 16.3 for farming and nonfarming children, respectively) or sedentary behavior (513.2 6 63.6 and 513.0 6 69.1) (see Table E1 in this article’s Online Repository at www.jacionline.org). On the basis of the PA score of 2009, farm children were found to be less active than nonfarm children (P 5 .006). Children with asthma were less likely to be physically active, but also less likely to be sedentary than children without reported asthma (Table I). They tended, however, to spend more time with LPA. Similar associations were observed with children reporting wheeze during the past 12 months. Children with hay fever accumulated less counts/minute and less minutes of MVPA than did those without hay fever. A restriction of the anal- ysis to children with accelerometer measurements outside the out- door pollen season showed no substantial change nor did atopy modify the association. TABLE I. Association between respiratory problems and PA measures (n 5 352) OR (95% CI) for IQR* increase of Counts/min Light activity MVPA Sedentary time Asthma n 5 42 (11.9%) Unadjusted 0.95 (0.64-1.40) 1.20 (0.87-1.64) 0.79 (0.51-1.25) 0.78 (0.55-1.10) Covariate adjusted 0.87 (0.53-1.41) 1.35 (0.91-1.99) 0.64 (0.38-1.09) 0.65 (0.42-1.00)à Restricted to autumn/winter (n 5 250) 0.68 (0.36-1.31) 1.46 (0.94-2.26) 0.38 (0.17-0.84)à 0.60 (0.36-0.97)à Wheeze past 12 mo n 5 37 (10.5%) Unadjusted 0.96 (0.64-1.45) 1.15 (0.82-1.61) 0.88 (0.55-1.39) 0.81 (0.56-1.17) Covariate adjusted 0.83 (0.50-1.40) 1.24 (0.81-1.91) 0.68 (0.40-1.17) 0.69 (0.44-1.10) Restricted to autumn/winter (n 5 250) 0.68 (0.34-1.36) 1.30 (0.80-2.11) 0.45 (0.21-1.00)à 0.65 (0.38-1.11) Hay fever n 5 66 (18.8%) Unadjusted 0.75 (0.53-1.01)à 0.94 (0.70-1.25) 0.71 (0.48-1.04) 1.04 (0.77-1.40) Covariate adjusted 0.55 (0.35-0.85)§ 0.88 (0.61-1.27) 0.54 (0.35-0.84)§ 1.09 (0.75-1.59) Restricted to autumn/winter (n 5 250) 0.62 (0.36-1.06) 0.85 (0.55-1.31) 0.55 (0.31-1.00) 0.86 (0.56-1.33) BMI, Body mass index; CI, confidence interval; cpm, counts/min; IQR, interquartile range; OR, odds ratio. *IQR, increase in the OR when going from the 25th to 75th centile of cpm (IQR 5 202.3), MVPA (IQR 5 23.3), and sedentary behavior (IQR 5 78.4), respectively. Adjusted for age, sex, highest parental education, smoking status of the parents, family atopy, and BMI z score. àP < .05. §P < .01. 1

Welcome message from author
This document is posted to help you gain knowledge. Please leave a comment to let me know what you think about it! Share it to your friends and learn new things together.
Transcript
Letter to the Editor
Association of physical activity, asthma, andallergies: A cohort of farming and nonfarmingchildren
To the Editor:The lower prevalence of asthma and hay fever among farm
children has been attributed to microbial exposures,1 but it mightalso be related to differential physical activity (PA) behavior. Onemight speculate that farmers’ children spend more time outdoorsand thus accumulate higher levels of PA, but until now no dataare available to confirm this hypothesis. Studies testing associationsbetween PA and asthma and hay fever, respectively, are contradic-tory.2-4 In part, the conflicting evidence might be due to methodo-logic constraints because several studies based the assessment ofchildhood PA on questionnaires that have been shown to be of poorvalidity5; in addition, most of them were cross-sectional in design.
The present analysis aimed at addressing this open question.The analysiswas based on a follow-upof 352 children (7-10 years)from the Swiss sample of the large EuropeanGABRIEL study thatwas originally designed to systematically study farming and ruralenvironments and their impact on childhood asthma and atopicdisease.6 The Swiss families were contacted again in 2009, andparents were asked to fill in a short questionnaire, which focusedon children’s respiratory and allergic symptoms including the val-idated International Study of Asthma and Allergies in Childhoodquestions7 and children’s PA, height, and weight. Personal factorsand children’s farming status were ascertained in the main surveyconducted in 2007. In 2009, childrenwere also asked to participatein a measurement study by wearing an accelerometer for 1 week.Accelerometers continuously measure the acceleration of thebody as ‘‘counts’’ that are aggregated over a predefined time inter-val (10 seconds for the present analysis). Minutes spent in differ-ent intensities of PA (sedentary behavior, light physical activity[LPA], moderate physical activity, vigorous physical activity, orcombined moderate to vigorous physical activity [MVPA]) wereestimated by using the cutoffs published by Treuth et al.8
A schematic of the study design (Fig E1) and a more detailed
TABLE I. Association between respiratory problems and PA measure
Counts/min
Asthma n 5 42 (11.9%)
Unadjusted 0.95 (0.64-1.40)
Covariate adjusted� 0.87 (0.53-1.41)
Restricted to autumn/winter (n 5 250) 0.68 (0.36-1.31)
Wheeze past 12 mo n 5 37 (10.5%)
Unadjusted 0.96 (0.64-1.45)
Covariate adjusted� 0.83 (0.50-1.40)
Restricted to autumn/winter (n 5 250) 0.68 (0.34-1.36)
Hay fever n 5 66 (18.8%)
Unadjusted 0.75 (0.53-1.01)�Covariate adjusted� 0.55 (0.35-0.85)§
Restricted to autumn/winter (n 5 250) 0.62 (0.36-1.06)
BMI, Body mass index; CI, confidence interval; cpm, counts/min; IQR, interquartile range
*IQR, increase in the OR when going from the 25th to 75th centile of cpm (IQR 5 202.3
�Adjusted for age, sex, highest parental education, smoking status of the parents, family a
�P < .05.
§P < .01.
description of the methods are presented in the Online Repositoryavailable at www.jacionline.org.
In accordance with previous GABRIEL analyses, asthma wasdefined as wheeze in the past 12 months, or asthma inhaler useever, or a physician’s diagnosis of asthma at least once, or ahistory of wheezing bronchitis more than once in the past. Hayfever was defined as either nasal symptom with itchy or wateryeyes in the past 12 months or a physician’s diagnosis of hay feverever. As in 2007, no accelerometers were used. A PA score hasbeen developed that divided the children into those with a ‘‘highphysical activity’’ and those with a ‘‘low physical activity.’’ Thescore was based on indications about active transport, participa-tion in a sport club, and active play outdoors. The same score hasbeen validated in 2009 by comparing it with accelerometer-basedMVPA. Associations between respiratory problems, farming, andPAmeasures were analyzed by using multivariable regression. Toaddress potential reversed causality, models were restricted tochildren with accelerometer measurements in autumn/winter(outside the outdoor pollen season).
We found that being a farm child was not related to any of theobjectively measured indicators of PA (mean counts perminute 6 SD, 548 6 187 and 553 6 155; mean MVPA 6 SD,41.6 6 19.7 and 43.1 6 16.3 for farming and nonfarmingchildren, respectively) or sedentary behavior (513.2 6 63.6 and513.06 69.1) (see Table E1 in this article’s Online Repository atwww.jacionline.org). On the basis of the PA score of 2009, farmchildren were found to be less active than nonfarm children(P5 .006). Children with asthma were less likely to be physicallyactive, but also less likely to be sedentary than children withoutreported asthma (Table I). They tended, however, to spend moretime with LPA. Similar associations were observed with childrenreporting wheeze during the past 12 months. Children with hayfever accumulated less counts/minute and less minutes ofMVPA than did those without hay fever. A restriction of the anal-ysis to childrenwith accelerometer measurements outside the out-door pollen season showed no substantial change nor did atopymodify the association.
s (n 5 352)
OR (95% CI) for IQR* increase of
Light activity MVPA Sedentary time
1.20 (0.87-1.64) 0.79 (0.51-1.25) 0.78 (0.55-1.10)
1.35 (0.91-1.99) 0.64 (0.38-1.09) 0.65 (0.42-1.00)�1.46 (0.94-2.26) 0.38 (0.17-0.84)� 0.60 (0.36-0.97)�
1.15 (0.82-1.61) 0.88 (0.55-1.39) 0.81 (0.56-1.17)
1.24 (0.81-1.91) 0.68 (0.40-1.17) 0.69 (0.44-1.10)
1.30 (0.80-2.11) 0.45 (0.21-1.00)� 0.65 (0.38-1.11)
0.94 (0.70-1.25) 0.71 (0.48-1.04) 1.04 (0.77-1.40)
0.88 (0.61-1.27) 0.54 (0.35-0.84)§ 1.09 (0.75-1.59)
0.85 (0.55-1.31) 0.55 (0.31-1.00) 0.86 (0.56-1.33)
; OR, odds ratio.
), MVPA (IQR 5 23.3), and sedentary behavior (IQR 5 78.4), respectively.
topy, and BMI z score.
1
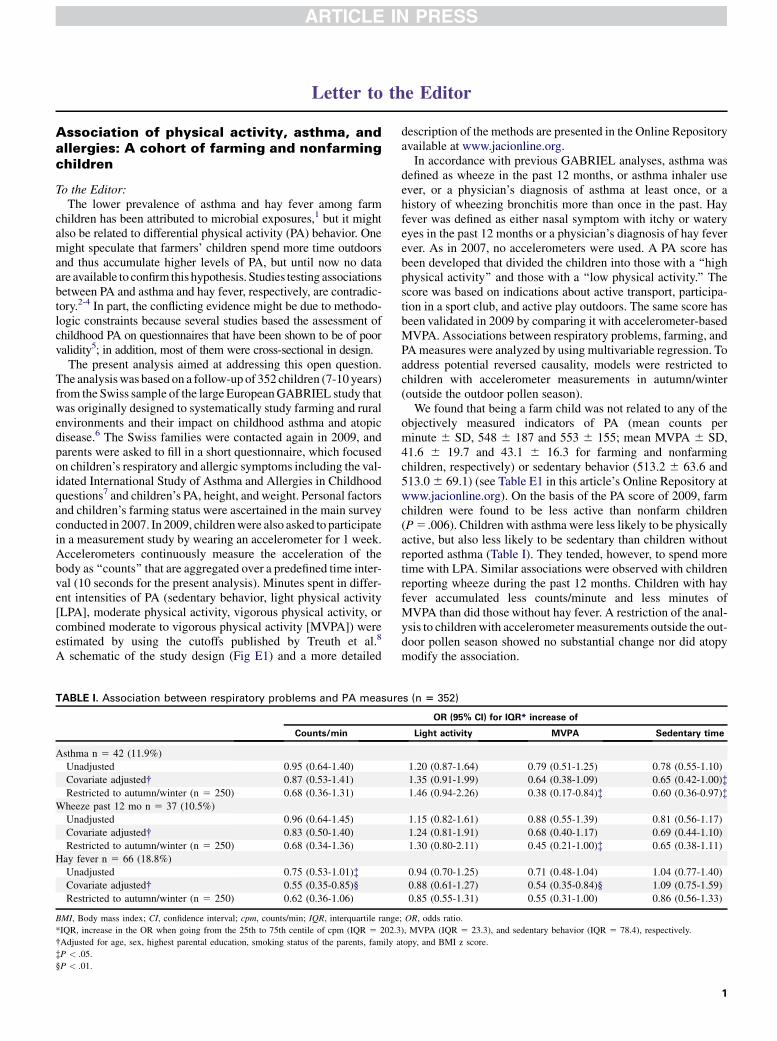
FIG 1. High versus low PA in 2007 and the development of respiratory problems between 2007 and 2009.
Logistic regression analyses adjusting for sex, age, highest parental education, farming, number of siblings,
smoking status of the parents, family atopy, and body mass index. Reference category 5 children without
respiratory problems. Odds ratio (OR) calculated for a high versus low PA score in 2007.
J ALLERGY CLIN IMMUNOL
nnn 2013
2 LETTER TO THE EDITOR
Children with persistent asthma or wheeze were more likelyto have a low PA score in 2007 (Fig 1). New-onset asthma orwheeze was not associated with PA in 2007. Children withnew-onset or persistent hay fever tended to have a lower PAscore in 2007.
The inverse association between farming and respiratoryoutcomes was not attenuated when PA and sedentary behaviormeasures were included into regression models (see Table E2 inthis article’s Online Repository at www.jacionline.org).
These results show that differences in PA levels did not explainthe protective ‘‘farming-effect.’’ Neither could it be confirmedthat sedentary behaviors such as watching TV or playing com-puter games might be associated with the development ofasthma.9 Our results rather suggest that children with asthmaspend more time with LPA but are less sedentary and less vigor-ously active. Whether such a shift to LPA represents compensa-tory behavior remains open. In the present study, lower levelsof MVPAwere measured in children with persistent asthma andwheeze who experienced symptoms already during baseline as-sessment. The direction of causality can thus not be determinedwith certainty.
Much less research has been devoted to the relationshipbetween PA, sedentary time, and hay fever or atopy. A cohortof school-aged children in Germany was found to have
significantly higher rates of hay fever when inactive at baseline.4
In line with these findings, children of the present study who re-ported new-onset hay fever had lower levels of reported PA atbaseline. Yet, the present study was not sufficiently powered todetect a statistically significant association. An inverse associa-tion between hay fever and PA may be the result of reversed cau-sation if children suffering from hay fever avoid PA during theoutdoor pollen season. Yet, when our analyses were restrictedto measurements taken during the autumn/winter period, the esti-mates did not change notably.
The present study demonstrates the importance of objectivemeans of assessing PA in children to examine the impact onasthma and allergy development. Subtle shifts in activity levels asobserved among asthmatic children can then be evaluated. Inaddition, the study could demonstrate that the protective ‘‘farm-ing-effect’’ for asthma and allergies was not due to differences inPA levels.
We thank Marianne Rutschi for the excellent organization of the fieldwork
in Switzerland and all members of the GABRIEL study group (in alphabetic
order): Silvia Apprich, Andrzej Boznanski, Gisela Buchele, William Cook-
son, Paul Cullinan, Hanna Danielewicz, Anna Debinska Martin Depner,
Markus Ege, Urs Frey, Oliver Fuchs, Dick Heederik, Elisabeth Horak, Anne
Hyvarinen, Sabina Illi, Michael Kabesch, Wolfgang Kneifel, Aleksandra
J ALLERGY CLIN IMMUNOL
VOLUME nnn, NUMBER nn
LETTER TO THE EDITOR 3
Kosmeda, Katalin Kovacs, Philipp Latzin, Roger Lauener, Georg Loss,
Stephanie MacNeill, Bernhard Morass, Anne-Cecile Normand, Ilka Noss,
Renaud Piarroux, Helena Rintala, Mascha K. Rochat, Nikolaos Sitaridis,
Barbara Sozanska, David Strachan, Christine Strunz-Lehner, Bertrand Sudre,
Juliane Weber, and Inge Wouters.
Bettina Bringolf-Isler, MD, PhDa,b
Eva Graf, MDa,b
Marco Waser, PhDa,b
Jon Genuneit, MDc
Erika von Mutius, MDd
Georg Loss, PhDa,b
Susi Kriemler, MDa,b
Charlotte Braun-Fahrl€ander, MDa,b
From athe Department of Epidemiology and Public Health, Swiss Tropical and Public
Health Institute, bthe University of Basel, Basel, Switzerland; cthe Institute of Epide-
miology and Medical Biometry, University of Ulm, Ulm, Germany; and dDr. von
Hauner Children’s Hospital, Ludwig Maximilian University, Munich, Germany. E-
mail: [email protected].
The GABRIEL study was supported by a European Union Research grant under the
FP6-LifeSCIHEALTH Integrated Program LSH-2004-1.2.5-1 (contract no.
018996). The follow-up study in Switzerland was supported by a grant of the Federal
Office of Sports (2008) and the Federal Office of Public Health (2009).
Disclosure of potential conflict of interest: E. von Mutius has been supported by one or
more grants from the European Commission (GABRIEL project); is an associate
editor of the Journal of Allergy and Clinical Immunology; is a consultant for
GlaxoSmithKline, Protectimmun, Novartis, Astellas Pharma Europe Limited, and
ALK-Abell�o; has provided expert testimony for the UK Research Excellence Frame-
work; and has received one or more payments for lecturing from or is on the speakers’
bureau for InfectoPharm and Nestl�e Research. The rest of the authors declare that they
have no relevant conflicts of interest.
REFERENCES
1. Ege MJ, Mayer M, Normand AC, Genuneit J, Cookson WO, Braun-Fahrlander C,
et al. Exposure to environmental microorganisms and childhood asthma. N Engl J
Med 2011;364:701-9.
2. Eijkemans M, Mommers M, de Vries SI, van Buuren S, Stafleu A, Bakker I, et al.
Asthmatic symptoms, physical activity, and overweight in young children: a cohort
study. Pediatrics 2008;121:e666-72.
3. van Gent R, van der Ent CK, van Essen-Zandvliet LE, Rovers MM, Kimpen JL, de
Meer G, et al. No differences in physical activity in (un)diagnosed asthma and
healthy controls. Pediatr Pulmonol 2007;42:1018-23.
4. Kohlhammer Y, Zutavern A, Rzehak P, Woelke G, Heinrich J. Influence of physical
inactivity on the prevalence of hay fever. Allergy 2006;61:1310-5.
5. Chinapaw MJ, Mokkink LB, van Poppel MN, van Mechelen W, Terwee CB.
Physical activity questionnaires for youth: a systematic review of measurement
properties. Sports Med 2010;40:539-63.
6. Genuneit J, Buchele G, Waser M, Kovacs K, Debinska A, Boznanski A, et al. The
GABRIEL Advanced Surveys: study design, participation and evaluation of bias.
Paediatr Perinat Epidemiol 2011;25:436-47.
7. Asher MI, Keil U, Anderson HR, Beasley R, Crane J, Martinez F, et al. International
Study of Asthma and Allergies in Childhood (ISAAC): rationale and methods. Eur
Respir J 1995;8:483-91.
8. Treuth MS, Schmitz K, Catellier DJ, McMurray RG, Murray DM, Almeida MJ, et al.
Defining accelerometer thresholds for activity intensities in adolescent girls. Med
Sci Sports Exerc 2004;36:1259-66.
9. Platts-Mills TA, Erwin E, Heymann P, Woodfolk J. Is the hygiene hypothesis still a
viable explanation for the increased prevalence of asthma? Allergy 2005;60:25-31.
http://dx.doi.org/10.1016/j.jaci.2013.03.042
J ALLERGY CLIN IMMUNOL
nnn 2013
3.e1 LETTER TO THE EDITOR
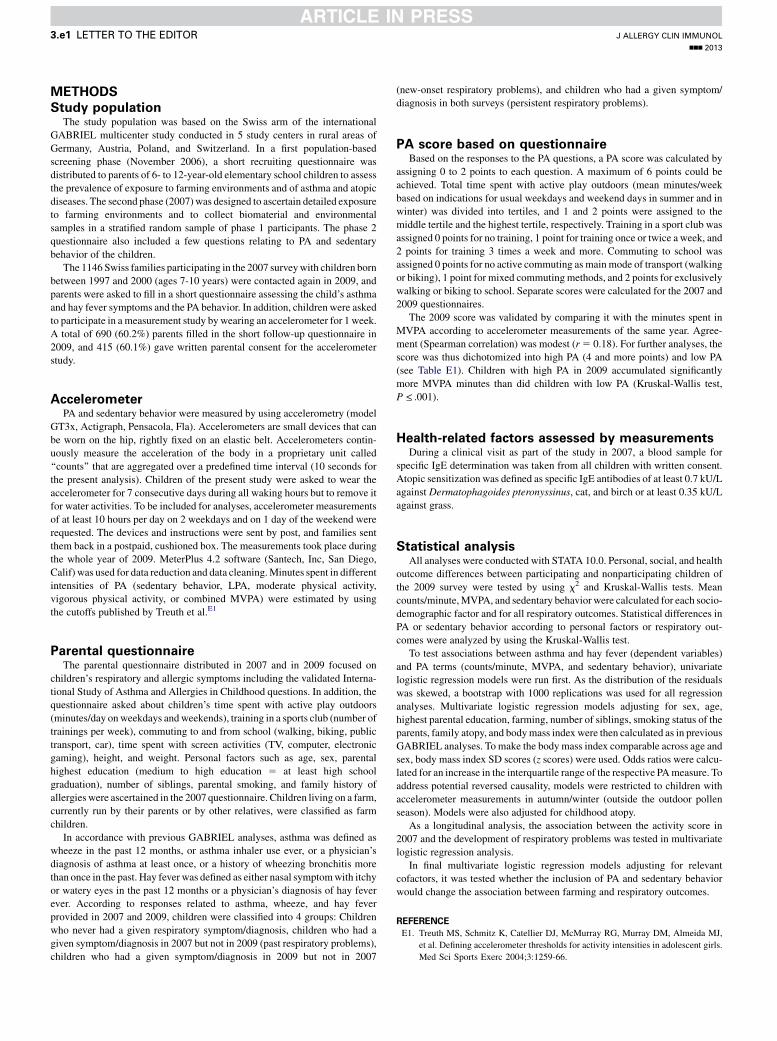
METHODS
Study populationThe study population was based on the Swiss arm of the international
GABRIEL multicenter study conducted in 5 study centers in rural areas of
Germany, Austria, Poland, and Switzerland. In a first population-based
screening phase (November 2006), a short recruiting questionnaire was
distributed to parents of 6- to 12-year-old elementary school children to assess
the prevalence of exposure to farming environments and of asthma and atopic
diseases. The second phase (2007)was designed to ascertain detailed exposure
to farming environments and to collect biomaterial and environmental
samples in a stratified random sample of phase 1 participants. The phase 2
questionnaire also included a few questions relating to PA and sedentary
behavior of the children.
The 1146 Swiss families participating in the 2007 surveywith children born
between 1997 and 2000 (ages 7-10 years) were contacted again in 2009, and
parents were asked to fill in a short questionnaire assessing the child’s asthma
and hay fever symptoms and the PA behavior. In addition, children were asked
to participate in a measurement study bywearing an accelerometer for 1 week.
A total of 690 (60.2%) parents filled in the short follow-up questionnaire in
2009, and 415 (60.1%) gave written parental consent for the accelerometer
study.
AccelerometerPA and sedentary behavior were measured by using accelerometry (model
GT3x, Actigraph, Pensacola, Fla). Accelerometers are small devices that can
be worn on the hip, rightly fixed on an elastic belt. Accelerometers contin-
uously measure the acceleration of the body in a proprietary unit called
‘‘counts’’ that are aggregated over a predefined time interval (10 seconds for
the present analysis). Children of the present study were asked to wear the
accelerometer for 7 consecutive days during all waking hours but to remove it
for water activities. To be included for analyses, accelerometer measurements
of at least 10 hours per day on 2 weekdays and on 1 day of the weekend were
requested. The devices and instructions were sent by post, and families sent
them back in a postpaid, cushioned box. The measurements took place during
the whole year of 2009. MeterPlus 4.2 software (Santech, Inc, San Diego,
Calif) was used for data reduction and data cleaning.Minutes spent in different
intensities of PA (sedentary behavior, LPA, moderate physical activity,
vigorous physical activity, or combined MVPA) were estimated by using
the cutoffs published by Treuth et al.E1
REFERENCE
E1. Treuth MS, Schmitz K, Catellier DJ, McMurray RG, Murray DM, Almeida MJ,
et al. Defining accelerometer thresholds for activity intensities in adolescent girls.
Med Sci Sports Exerc 2004;3:1259-66.
Parental questionnaireThe parental questionnaire distributed in 2007 and in 2009 focused on
children’s respiratory and allergic symptoms including the validated Interna-
tional Study of Asthma and Allergies in Childhood questions. In addition, the
questionnaire asked about children’s time spent with active play outdoors
(minutes/day onweekdays andweekends), training in a sports club (number of
trainings per week), commuting to and from school (walking, biking, public
transport, car), time spent with screen activities (TV, computer, electronic
gaming), height, and weight. Personal factors such as age, sex, parental
highest education (medium to high education 5 at least high school
graduation), number of siblings, parental smoking, and family history of
allergies were ascertained in the 2007 questionnaire. Children living on a farm,
currently run by their parents or by other relatives, were classified as farm
children.
In accordance with previous GABRIEL analyses, asthma was defined as
wheeze in the past 12 months, or asthma inhaler use ever, or a physician’s
diagnosis of asthma at least once, or a history of wheezing bronchitis more
than once in the past. Hay fever was defined as either nasal symptomwith itchy
or watery eyes in the past 12 months or a physician’s diagnosis of hay fever
ever. According to responses related to asthma, wheeze, and hay fever
provided in 2007 and 2009, children were classified into 4 groups: Children
who never had a given respiratory symptom/diagnosis, children who had a
given symptom/diagnosis in 2007 but not in 2009 (past respiratory problems),
children who had a given symptom/diagnosis in 2009 but not in 2007
(new-onset respiratory problems), and children who had a given symptom/
diagnosis in both surveys (persistent respiratory problems).
PA score based on questionnaireBased on the responses to the PA questions, a PA score was calculated by
assigning 0 to 2 points to each question. A maximum of 6 points could be
achieved. Total time spent with active play outdoors (mean minutes/week
based on indications for usual weekdays and weekend days in summer and in
winter) was divided into tertiles, and 1 and 2 points were assigned to the
middle tertile and the highest tertile, respectively. Training in a sport club was
assigned 0 points for no training, 1 point for training once or twice a week, and
2 points for training 3 times a week and more. Commuting to school was
assigned 0 points for no active commuting as mainmode of transport (walking
or biking), 1 point for mixed commuting methods, and 2 points for exclusively
walking or biking to school. Separate scores were calculated for the 2007 and
2009 questionnaires.
The 2009 score was validated by comparing it with the minutes spent in
MVPA according to accelerometer measurements of the same year. Agree-
ment (Spearman correlation) was modest (r5 0.18). For further analyses, the
score was thus dichotomized into high PA (4 and more points) and low PA
(see Table E1). Children with high PA in 2009 accumulated significantly
more MVPA minutes than did children with low PA (Kruskal-Wallis test,
P <_ .001).
Health-related factors assessed by measurementsDuring a clinical visit as part of the study in 2007, a blood sample for
specific IgE determination was taken from all children with written consent.
Atopic sensitization was defined as specific IgE antibodies of at least 0.7 kU/L
against Dermatophagoides pteronyssinus, cat, and birch or at least 0.35 kU/L
against grass.
Statistical analysisAll analyses were conducted with STATA 10.0. Personal, social, and health
outcome differences between participating and nonparticipating children of
the 2009 survey were tested by using x2 and Kruskal-Wallis tests. Mean
counts/minute,MVPA, and sedentary behavior were calculated for each socio-
demographic factor and for all respiratory outcomes. Statistical differences in
PA or sedentary behavior according to personal factors or respiratory out-
comes were analyzed by using the Kruskal-Wallis test.
To test associations between asthma and hay fever (dependent variables)
and PA terms (counts/minute, MVPA, and sedentary behavior), univariate
logistic regression models were run first. As the distribution of the residuals
was skewed, a bootstrap with 1000 replications was used for all regression
analyses. Multivariate logistic regression models adjusting for sex, age,
highest parental education, farming, number of siblings, smoking status of the
parents, family atopy, and bodymass index were then calculated as in previous
GABRIEL analyses. Tomake the bodymass index comparable across age and
sex, body mass index SD scores (z scores) were used. Odds ratios were calcu-
lated for an increase in the interquartile range of the respective PAmeasure. To
address potential reversed causality, models were restricted to children with
accelerometer measurements in autumn/winter (outside the outdoor pollen
season). Models were also adjusted for childhood atopy.
As a longitudinal analysis, the association between the activity score in
2007 and the development of respiratory problems was tested in multivariate
logistic regression analysis.
In final multivariate logistic regression models adjusting for relevant
cofactors, it was tested whether the inclusion of PA and sedentary behavior
would change the association between farming and respiratory outcomes.
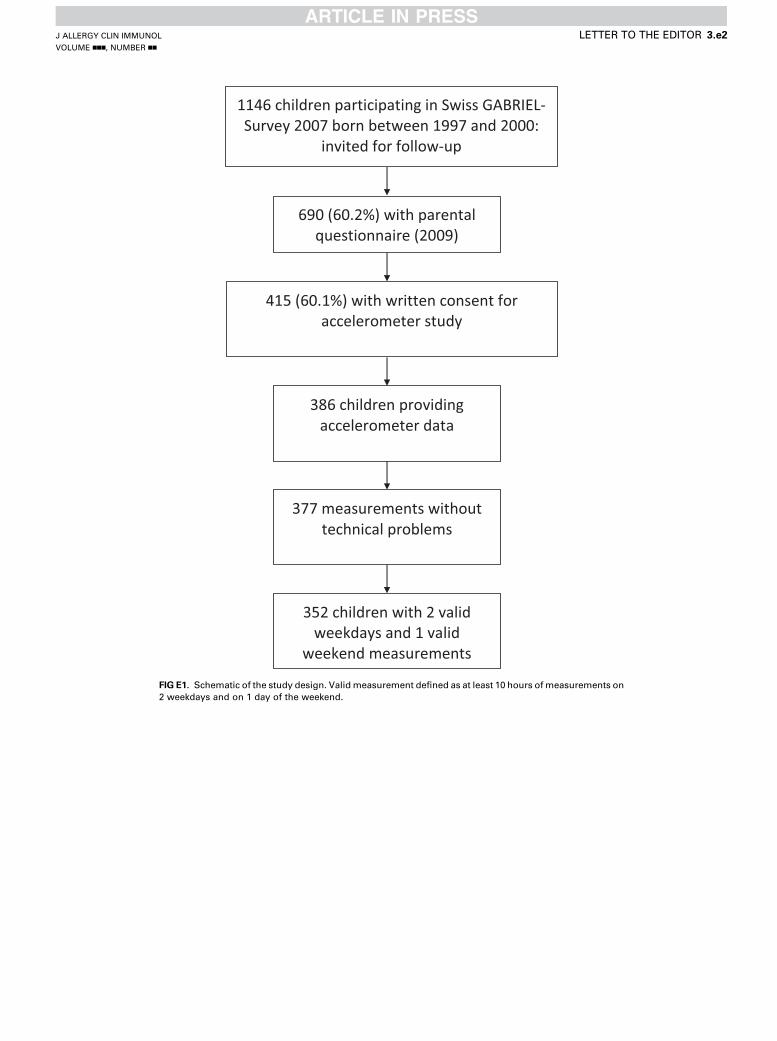
FIG E1. Schematic of the study design. Validmeasurement defined as at least 10 hours ofmeasurements on
2 weekdays and on 1 day of the weekend.
J ALLERGY CLIN IMMUNOL
VOLUME nnn, NUMBER nn
LETTER TO THE EDITOR 3.e2
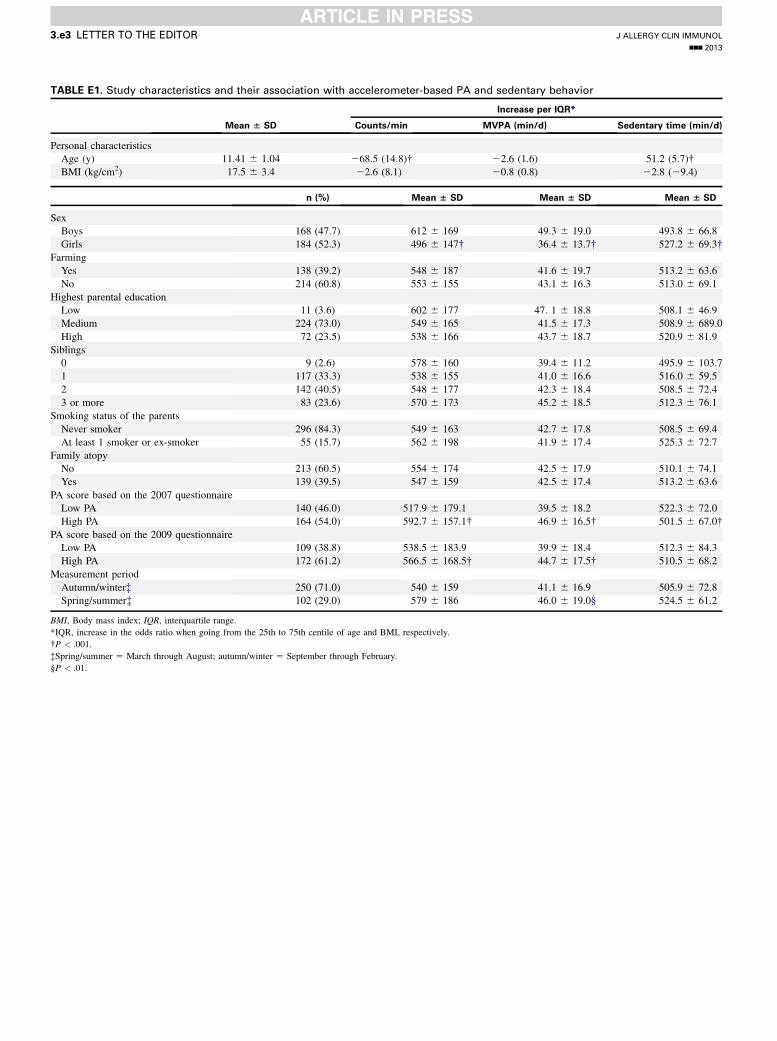
TABLE E1. Study characteristics and their association with accelerometer-based PA and sedentary behavior
Mean 6 SD
Increase per IQR*
Counts/min MVPA (min/d) Sedentary time (min/d)
Personal characteristics
Age (y) 11.41 6 1.04 268.5 (14.8)� 22.6 (1.6) 51.2 (5.7)�BMI (kg/cm2) 17.5 6 3.4 22.6 (8.1) 20.8 (0.8) 22.8 (29.4)
n (%) Mean 6 SD Mean 6 SD Mean 6 SD
Sex
Boys 168 (47.7) 612 6 169 49.3 6 19.0 493.8 6 66.8
Girls 184 (52.3) 496 6 147� 36.4 6 13.7� 527.2 6 69.3�Farming
Yes 138 (39.2) 548 6 187 41.6 6 19.7 513.2 6 63.6
No 214 (60.8) 553 6 155 43.1 6 16.3 513.0 6 69.1
Highest parental education
Low 11 (3.6) 602 6 177 47. 1 6 18.8 508.1 6 46.9
Medium 224 (73.0) 549 6 165 41.5 6 17.3 508.9 6 689.0
High 72 (23.5) 538 6 166 43.7 6 18.7 520.9 6 81.9
Siblings
0 9 (2.6) 578 6 160 39.4 6 11.2 495.9 6 103.7
1 117 (33.3) 538 6 155 41.0 6 16.6 516.0 6 59.5
2 142 (40.5) 548 6 177 42.3 6 18.4 508.5 6 72.4
3 or more 83 (23.6) 570 6 173 45.2 6 18.5 512.3 6 76.1
Smoking status of the parents
Never smoker 296 (84.3) 549 6 163 42.7 6 17.8 508.5 6 69.4
At least 1 smoker or ex-smoker 55 (15.7) 562 6 198 41.9 6 17.4 525.3 6 72.7
Family atopy
No 213 (60.5) 554 6 174 42.5 6 17.9 510.1 6 74.1
Yes 139 (39.5) 547 6 159 42.5 6 17.4 513.2 6 63.6
PA score based on the 2007 questionnaire
Low PA 140 (46.0) 517.9 6 179.1 39.5 6 18.2 522.3 6 72.0
High PA 164 (54.0) 592.7 6 157.1� 46.9 6 16.5� 501.5 6 67.0�PA score based on the 2009 questionnaire
Low PA 109 (38.8) 538.5 6 183.9 39.9 6 18.4 512.3 6 84.3
High PA 172 (61.2) 566.5 6 168.5� 44.7 6 17.5� 510.5 6 68.2
Measurement period
Autumn/winter� 250 (71.0) 540 6 159 41.1 6 16.9 505.9 6 72.8
Spring/summer� 102 (29.0) 579 6 186 46.0 6 19.0§ 524.5 6 61.2
BMI, Body mass index; IQR, interquartile range.
*IQR, increase in the odds ratio when going from the 25th to 75th centile of age and BMI, respectively.
�P < .001.
�Spring/summer 5 March through August; autumn/winter 5 September through February.
§P < .01.
J ALLERGY CLIN IMMUNOL
nnn 2013
3.e3 LETTER TO THE EDITOR

TABLE E2. Adjusted* association between farming and respiratory symptoms with and without the inclusion of PA and sedentary
behavior measurements (adjusted OR and 95% CI)
Adjusted OR (95% CI)
Asthma Wheeze Hay fever
Farming 0.87 (0.40-1.89) 0.90 (0.40-2.03) 0.47 (0.25-0.90)
Farming and counts/min 0.85 (0.39-1.85) 0.88 (0.38-1.98) 0.44 (0.22-0.85)
Farming and MVPA 0.78 (0.36-1.72)� 0.82 (0.36-1.88) 0.42 (0.22-0.81)�Farming and sedentary time 0.86 (0.40-0.99) 0.93 (0.41-2.11) 0.47 (0.25-0.90)
BMI, Body mass index; CI, confidence interval; OR, odds ratio.
*Adjusted for age, sex, highest parental education, smoking status of the parents, family atopy, and BMI z score.
�>10% change in OR.
J ALLERGY CLIN IMMUNOL
VOLUME nnn, NUMBER nn
LETTER TO THE EDITOR 3.e4
Related Documents