ASSOCIATION BETWEEN PSYCHOLOGICAL SYMPTOMS, PARTICIPATION IN CORE ACTIVITIES AND HEALTH-RELATED QUALITY OF LIFE AMONG SPINAL CORD INJURY SURVIVORS IN SELECTED COUNTIES, IN KENYA MINAH KINANU GUANTAI MASTER OF SCIENCE (Physiotherapy (Neuro-Rehabilitation)) JOMO KENYATTA UNIVERSITY OF AGRICULTURE AND TECHNOLOGY 2021

Welcome message from author
This document is posted to help you gain knowledge. Please leave a comment to let me know what you think about it! Share it to your friends and learn new things together.
Transcript
ASSOCIATION BETWEEN PSYCHOLOGICAL
SYMPTOMS, PARTICIPATION IN CORE ACTIVITIES
AND HEALTH-RELATED QUALITY OF LIFE AMONG
SPINAL CORD INJURY SURVIVORS IN SELECTED
COUNTIES, IN KENYA
MINAH KINANU GUANTAI
MASTER OF SCIENCE
(Physiotherapy (Neuro-Rehabilitation))
JOMO KENYATTA UNIVERSITY OF
AGRICULTURE AND TECHNOLOGY
2021
Association between Psychological Symptoms, Participation in Core
Activities and Health-Related Quality of Life among Spinal Cord
Injury Survivors in Selected Counties, in Kenya
Minah Kinanu Guantai
A thesis Submitted in Partial Fulfillment of the Requirements for
the Degree of Master of Science in Physiotherapy (Neuro-
Rehabilitation) of the Jomo Kenyatta University of Agriculture and
Technology
2021
ii
DECLARATION
This thesis is my original work and has not been presented for a degree in any other
University.
Signature…………………………………………………Date…………..……………
Minah Kinanu Guantai
This thesis has been submitted for examination with my/our approval as University
Supervisors.
Signature…………………………………………………Date…………..……………
Dr. Joseph Mwangi Matheri, (PhD)
JKUAT, Kenya
Signature…………………………………………………Date…………..……………
Dr. Wallace Karuguti, PhD
JKUAT, Kenya
Signature…………………………………………………Date…………..……………
Dr. James Kamau Kanyoro (PhD)
Mathare Mental Teaching and Referral Hospital, Kenya
iii
DEDICATION
I dedicate this work and give special thanks to my husband, Mr. Daniel Mutegi and
my wonderful daughters for being there for me throughout the entire master’s
program. All of you have been my best supporters. And most of all, thank you, Lord,
for always being there for me.
iv
ACKNOWLEDGEMENT
I would like to thank my supervisor’s Dr Joseph Mwangi Matheri, Dr Wallace
Karuguti and James Kamau Kanyoro for their guidance, support, encouragement and
commitment during my years of study.
I extend my sincere thanks to all spinal cord injury survivors who participated in this
study, without your consent, there would have been no study.
v
TABLE OF CONTENTS
DECLARATION ................................................................................................................ ii
DEDICATION ................................................................................................................... iii
ACKNOWLEDGEMENT ................................................................................................ iv
TABLE OF CONTENTS ................................................................................................... v
LIST OF TABLES ............................................................................................................ ix
LIST OF APPENDICES .................................................................................................... x
ABBREVIATION AND ACRONYMN .......................................................................... xii
DEFINITION OF TERMS ............................................................................................. xiii
ABSTRACT ..................................................................................................................... xiv
INTRODUCTION .............................................................................................................. 1
1.1 Background Information ............................................................................................. 1
1.2 Statement of the Problem............................................................................................ 3
1.3 Justification of the study ............................................................................................. 4
1.4 Aim of the Study ......................................................................................................... 4
1.4.1 Specific objectives ............................................................................................... 4
1.5 Research questions...................................................................................................... 5
CHAPTER TWO ................................................................................................................ 6
LITERATURE REVIEW .................................................................................................. 6
vi
2.1 Epidemiology Spinal Cord Injury ............................................................................... 6
2.2 Effects of SCI on individuals’ well-being .................................................................. 7
2.3 Life expectancy since SCI .......................................................................................... 8
2.4 Participation in Community, social and civic life ...................................................... 8
2.5 Participation in Major Life Areas ............................................................................. 10
2.6 Effect of SCI on Participation Core Activities ......................................................... 12
2.7 Factors Influencing Persons with SCI Participation in Core Activities ................... 12
2.8 Psychological symptoms .......................................................................................... 13
2.9 Factors Influencing Psychological symptoms .......................................................... 14
2.10 Impact of Depression .............................................................................................. 15
2.11 Health-related Quality of life .................................................................................. 16
CHAPTER THREE ......................................................................................................... 17
MATERIALS AND METHODS ..................................................................................... 17
3.1 Area of Study ............................................................................................................ 17
3.2 Research Design ....................................................................................................... 18
3.3 Study Population ....................................................................................................... 18
3.4 Sampling method ...................................................................................................... 19
3.4.1 Sample Size Determination ................................................................................ 19
3.4.2 Inclusion Criteria ............................................................................................... 20
vii
3.4.3 Exclusion Criteria .............................................................................................. 20
3.5 Research Instruments ................................................................................................ 20
3.5.1 Reliability and Validity of the Measurement Instruments ................................. 21
3.6 Sampling Adequacy .................................................................................................. 23
3.7 Pilot Study ................................................................................................................ 24
3.8 Data collection Procedure ......................................................................................... 25
3.9 Data Management and Analysis ............................................................................... 25
3.10 Ethical Consideration.............................................................................................. 26
CHAPTER FOUR ........................................................................................................... 27
RESULTS .......................................................................................................................... 27
4.1 Participants Social-Demographic Characteristics.................................................... 27
4.2 Prevalence of Psychological Symptoms ................................................................... 29
4.2.1 Distribution of participants by reported psychological symptoms. ................... 29
4.3 The level of participation restriction in core-activities domain amongst rehabilitated
spinal cord injury survivors .................................................................................... 30
4.3.1 The overall level of participation restriction ...................................................... 31
The HRQoL amongst rehabilitated spinal cord injury survivors.................................... 31
4.5 Association between Psychological Symptoms Status (as an independent variable)
and Participation and HRQoL (as dependent variables) ........................................ 32
CHAPTER FIVE .............................................................................................................. 34
viii
DISCUSSION ................................................................................................................... 34
5.1 Prevalence of Psychological Symptoms amongst SCI Survivors............................. 34
5.2 Level of participation in core-activities amongst rehabilitated SCI survivors ......... 36
5.3 Health-related quality of life amongst rehabilitated SCI survivors .......................... 38
5.4 Association between psychological symptoms status and participation and HRQoL
................................................................................................................................ 39
CHAPTER SIX ................................................................................................................. 40
SUMMARY, CONCLUSIONS RECOMMENDATIONS AND LIMITATIONS ..... 40
6.1 Summary ................................................................................................................... 40
6.2 Conclusion ................................................................................................................ 40
6.3 Recommendations..................................................................................................... 41
6.4 Limitation ................................................................................................................. 42
REFERENCES ................................................................................................................. 43
APPENDICES .................................................................................................................. 65
ix
LIST OF TABLES
Table 3.1: Summary of Counties by Clusters ........................................................... 17
Table 3.2: Selected hospitals according to the counties ............................................ 19
Table 3.3: Reliability Tests ....................................................................................... 22
Table 3.4: Kaiser-Meyer-Olkin (KMO) and Bartlett's Test ...................................... 23
Table 3.5: Interpretation of KMO value.................................................................... 24
Table 4.1: Social-demographic characteristics amongst rehabilitated SCI survivors
by county of residence.................................................................................. 28
Table 4.2: Prevalence of Psychological Symptoms .................................................. 29
Table 4.3: Analysis of Participants Psychological Symptoms Status by Severity of
Symptoms ..................................................................................................... 30
Table 4.4: Participants’ level of participation restriction in core-activities .............. 30
Table 4.5: Overall participants’ level of participation restriction in core-activities . 31
Table 4.6: The HRQoL amongst rehabilitated spinal cord injury survivors ............. 31
Table 4.7: Analysis of association between psychological symptoms status, and
participation and HRQoL ............................................................................. 33
x
LIST OF APPENDICES
Appendix I: Questionnare ......................................................................................... 65
Appendix II: Hojaji ................................................................................................... 76
Appendix III: Information Sheet .............................................................................. 83
Appendix IV: Consent Form .................................................................................... 85
Appendix V: Taarifa ................................................................................................. 87
Appendix VI: Fomu ya Idhini ................................................................................... 89
Appendix VII: Board of Post Graduate Approval .................................................... 91
Appendix VIII: Ethical Clearance JKUAT-ERC .................................................... 92
Appendix IX: Authority from NACOSTI ................................................................. 93
Appendix X: NACOSTI PERMIT ............................................................................ 94
Appendix XI: Authority from County Commissioner Nairobi ................................. 95
Appendix XII: Authority from Ministry of Health Nairobi County ......................... 96
Appendix XIII: Authority from Ministry of Education Nairobi County.................. 97
Appendix XIV: Permission from National Spinal Cord Injury Hospital.................. 98
Appendix XVI: Authority from Ministry of Education Machakos County............ 100
Appendix XVII: Authority from Ministry of Health Machakos County ............... 101
Appendix XVIII: Permission from Machakos Level 5 Hospital ............................ 102
Appendix XIX: Authority from Commissioner Nakuru County ............................ 103
xi
Appendix XX: Authority from Ministry of Education Nakuru County ................. 104
Appendix XXI: Authority from Ministry of Health Nakuru County...................... 105
Appendix XXII: Permission from Nakuru Level 5 Hospital .................................. 106
Appendix XXIII: Permission from Naivasha County Referal Hospital ................. 107
xii
ABBREVIATION AND ACRONYMN
DASS Depression Anxiety Stress Scale
GDP Gross Domestic Product
HRQol Health Related Quality of Life
KMO Kaiser-Meyer-Olkin
NACOSTI National Commission for Science technology and Innovation
SCI Spinal Cord Injury
WHO World Health Organization
WHOQOL World Health Organization Quality of Life
xiii
DEFINITION OF TERMS
Spinal cord injury: Is the injury of the spinal cord from the foramen magnum to the
cauda equina occurs as a result of pressure, incision or
contusion (Mcdonald & Sadowsky, 2002).
Tetraplegia: is the result of an injury above the first thoracic vertebra and is
characterized by paralysis of the trunk, lower limbs, and the upper
limbs (Kirshblum et al., 2014).
Participation: actions and involvement in life situations such as taking part, being
engaged in an area of life, being accepted, or having access to needed
resource (WHO, 2007).
Health-related Quality of Life: A person’s perception of their position in life in the
context of the culture and worth systems in which they live relative
to their goals, expectations, value and concerns (Post, 2014).
Psychological symptom: Is a divergence from what is well thought-out as usual and
it indicates the mental disorder to the person (Hirsch & Wallace,
1996).
Core activities: These are defined as skills required managing one’s physical and
social needs (Gurcay et al., 2010).
Domains; sets of related physiological functions, anatomical structures, activities,
tasks, areas of life and external influences (Van Brakel et al.,
2006).
xiv
ABSTRACT
Globally, rehabilitated spinal cord injury survivors in the communities continue to
experience psycho-social challenges that impede their return to pre-injury lifestyle
and/or achieve optimal functional independence. Therefore, the main purpose of the
study was to determine the association between psychological symptoms and
participation in core-activities as well as in health-related quality of life amongst
spinal cord injury survivors in Nairobi, Machakos and Nakuru Counties in Kenya.A
cross-sectional study utilizing quantitative methods was conducted on a sample of
186 spinal cord injured survivors in Nairobi, Nakuru and Machakos counties.
Potential participants were identified from the databases of National Spinal Injury
Hospital in Nairobi, Nakuru level 5 Hospital, Naivasha county referral Hospital and
Machakos level 5 hospital. In addition, purposive sampling technique was employed
to recruit participants identified in the databases. Data was collected using a
combination of the Participation Scale (P-scale), Depression, Anxiety, Stress Scale
version 21 (DASS21) and World Health Organization Quality of Life questionnaire
(WHOQOL-BREF). Data was entered into two separate MS Excel sheets and later
imported into Statistical Package for Social Sciences version 25 (SPSS 25). Data was
re-entered from the questionnaires where discrepancy was noted and corrected.
Thereafter, descriptive statistics were calculated and presented in frequency tables.
Further one-way analysis of variance (ANOVA) was done to test the influence of the
participation in core activities variables and health-related quality of life HRQol
variables by psychological symptoms. The level of significance was set at < 0.05.
Ethical clearance was sought from JKUAT- Ethical Review Committee while
authority to conduct the study was secured from the NACOSTI (Ref no.
NACOSTI/P/19/63727/30278; Date. 21st May, 2019). In addition, permission to
conduct the study was sought from the County commissioners, Ministry of
education, Ministry of health and participating hospitals ERCs. A 72% (n=134)
prevalence of psychological symptoms was recorded amongst the 186 participants.
Noteworthy, lowly educated males aged <45 years, and earning less than USA $500
(Kshs. 50,000) annually were the most affected by SCI. At least 53.8% of the sample
(n=100) had depression although anxiety was the most prevalent symptom, that is,
65.6% (n=122) among the three psychological symptoms measured. Concerning
xv
HRQoL, the environmental domain had the lowest mean (44.71% SD 15.07%)
percentage reported. This implies that most SCI survivors felt that the environmental
domain affected their HRQoL compared to other domains. Regarding participants’
involvement in core activities, majority, 119 (64%) reported to experience severe
participation restriction in all domains. There was a significant association between
County of residence and having or not having psychological symptoms (P=.003).
Further, there was a statistically significant association between self-care (domain of
participation) and psychological symptoms (P=.000). In addition, there was a
statistically significant association between psychological symptoms and HRQoL
physical health domain (P=.008). In conclusion, 3 out of 4 SCI patients in the study
sample suffer from psychological symptoms and 1 out of 2 have depression. These
are lowly educated poor young male adults. Although integrated and living in the
community after rehabilitation, SCI patients do experience poor HRQoL in their
environments and self-care problems mostly. The study further shows that
psychological symptoms status may influence SCI survivors’ physical, HRQoL and
self-care activity. The results of this study form baseline data for future research and
policy pertaining to SCI patients’ wellbeing.
1
CHAPTER ONE
INTRODUCTION
1.1 Background Information
Spinal cord injury is a highly destructive condition that leads to intense life changes
and the fact that renders the person incapacitated (World Health Organization &
International Spinal Cord Society, 2013; Singh et al., 2011). Previous studies have
reported that the global estimate incidence of SCI 15–40 per million (Lee et al.,
2014) while in developing countries 25.5 in a million (Rahimi-Movaghar et al.,
2013) per annum. In been reported (Lee et al., 2014). Whereas, there is no health-
related quality of life documented data on SCI addition, sub-Saharan African
countries, annual incidences of 21–29 per million populations have in Kenya. The
level of participation of people with spinal cord injury post-rehabilitation is declining
globally (World Health Organization, 2015). This is despite the long-term goal of
spinal cord injury (SCI) rehabilitation being to achieve community reintegration of
survivors with the maximum possible level of functional independence and a return
to pre-injury lifestyle (Swinnen et al., 2010). Participation is defined as an
individual’s unique response to the reality of living with a disability relative to
environmental, personal, and cultural factors influences (Carpenter et al., 2007).
Disparate factors have been associated with community participation of rehabilitated
persons with SCI. For example, previous studies have linked employment and
lifestyle satisfaction to community participation amongst individuals post SCI
(Carpenter et al., 2007; Blauwet et al., 2013). In a Thailand cross-sectional study
conducted amongst 139 community-living persons with SCI Suttiwong et al. (2015)
found that the availability of social support and the individual’s functional
performance predicted community participation. Additionally, a study amongst 128
individuals with SCI, aged at least 65 years conducted in China, Post and Reinhardt
(2015) found that lower age at onset of SCI was associated with better participation
and life satisfaction. Further previous research has shown that individuals with SCI
level independence and social protection predict their health-related quality of life
(HRQoL) (Hicken et al., 2002).
2
Changes in the quality of life of both the persons with SCI and their close persons are
paramount (Lude et al., 2014; Chang et al., 2012). Devaki and Maheswari (2011)
and Wilson et al. (2011) posit that HRQoL as a broad multidimensional concept
includes one’s subjective assessment of the congruence between his/her life
expectations and achievements, that is, satisfaction in everything including physical
health, family, education, employment, wealth, safety, security, freedom, religious
beliefs, finance, and the environment. Nonetheless Post and van Leeuwen (2012)
argue that despite the myriad of challenges faced by people with SCI, most of them
adapt to a favourable HRQoL after rehabilitation. For instance, in an Indian, study
involving 364 paraplegic participants, Ganesh and Mishra (2016) found that
interventions promoting physical activity and employment help to improve HRQoL
among spinal cord injured survivors. In contrast, some previous research has shown
that on average, SCI is associated with lower life satisfaction (Hicken et al., 2002),
reduced HRQoL (Craig et al., 2009; Martz et al., 2005), deepening of depression,
anxiety and other psychological symptoms (Khazaeipour et al., 2015). Although the
absence of anxiety and depression post SCI rehabilitation is a positive indicator of
good quality of life, participation and community integration (Martz et al., 2005) a
lower HRQoL in SCI survivors is associated with the increase of depressed mood
(Mousavi, 2017; Coura et al., 2013). Tran, Dorstyn and Burke (2016) argue that
psychological symptoms at acute stages of SCI without appropriate attention may
advance to a chronic state.
This notwithstanding, psychological symptoms including depressive disorders are
more frequent in persons with SCI compared to the able-bodied (Saunders, Krause &
Focht, 2011; Kago, 2005). One example, is the Australian research involving forty
participants both paraplegic and tetraplegic SCI survivors, in which Mitchell, Burns
and Dorsty (2008) found that 45% of them experienced elevated levels of anxiety.
Further, in a related study among 443 adults both non-traumatic and traumatic SCI
survivors, in Australia, Migliorini, New and Tonge (2009) found a prevalence of
37%,30%,25% for depression, anxiety and stress respectively. Moreover, in the
general population the estimated prevalence of anxiety disorders ranges between
4.8% and 10.9% (Baxter et al., 2013) and 4.7% (4.4–5.0%) for major depressive
disorder worldwide (Ferrari et al., 2013). Researchers have linked psychological
3
morbidity in patients with SCI to the increased hospital stay, reduced functional
improvement, and difficulties in adjustment after rehabilitation (Tran, Dorstyn &
Burke, 2016 ; Kraft & Dorstyn, 2015and Increase human and economic cost and
family instability (Merritt et al., 2019).
Most of these studies have been conducted in developed countries such as Australia
(Mitchell et al., 2008), Canada (Carpenter et al., 2007), Thailand (Suttiwong et al.,
2015) and Switzerland (Lude et al., 2014). Very few studies have been documented
on persons with SCI HRQoL and level of participation in core-activities in low-
middle income countries including in Africa. In Sub-Saharan Africa, literature
regarding the burden of psychological symptoms, HRQoL and level of participation
in core-activities of daily life amongst SCI survivors is limited, with no reported
studies conducted in Kenya. This study was to fill this gap. Therefore, the purpose of
this study was to determine the burden of psychological symptoms amongst spinal
cord injury survivors, their participation in core-activities and health-related quality
of life in selected counties, in Kenya.
1.2 Statement of the Problem
Research evidence has shown that people with SCI encounter difficulties coping with
normal life following discharge from institutionalized rehabilitation centers
worldwide (Øderud, 2014). In Sub-Saharan Africa, more specifically IN KENYA,
there is paucity of information concerning the burden of psychological symptoms,
HRQoL and level of participation in core-activities amongst SCI survivors.
Additionally the link between psychological symptoms, and participation in core
activities of daily living including health-related quality of life amongst rehabilitated
spinal cord injury survivors, is not documented. Whereas the level of participation of
SCI survivors is not explained by the modalities used in rehabilitation (Swinnen et
al., 2010), the need to establish the association between psychological symptoms
status and the level of participation and health-related quality of life amongst SCI
survivors is worthwhile.
4
1.3 Justification of the study
It is envisaged that the findings of this study shall provide key information that will
increase the knowledge of physiotherapists and other healthcare professionals
regarding SCI survivors. In turn these professionals will design suitable evidence-
based rehabilitation programs that have a higher likelihood to improve SCI
survivors’ level of participation in activities of daily living, HRQoL and to alleviate
suffering from psychological symptoms. Further, this new knowledge will contribute
to health-related policies, the wellbeing of people with SCI and that of the caregivers
thus, improving their health and social outcomes after rehabilitation. This has
potential to reduce morbidity and cost of care, increase productivity, and socio-
economic stability not only to families of SCI survivors but also nationally. The
study findings are envisaged to also provide a baseline for future interventional
research studies towards mitigation of impact of psychological symptoms on people
with SCI.
1.4 Aim of the Study
To determine the association between psychological symptoms, and participation in
core-activities as well as health-related quality of life amongst spinal cord injury
survivors in selected counties, in Kenya.
1.4.1 Specific objectives
1. To determine the prevalence of selected psychological symptoms
(depression, anxiety and stress) amongst rehabilitated spinal cord injury
survivors in Nairobi, Nakuru and Machakos counties in Kenya.
2. To determine the level of participation in core-activities of daily living
amongst rehabilitated spinal cord injury survivors in Nairobi, Nakuru and
Machakos counties in Kenya.
3. To determine the health-related quality of life amongst rehabilitated spinal
cord injury survivors in Nairobi, Nakuru and Machakos counties in Kenya.
5
4. To determine the relationship between psychological symptoms status,
participation and HRQoL of rehabilitated spinal cord injury survivors in
Nairobi, Nakuru and Machakos counties in Kenya.
1.5 Research questions
1. What is the prevalence of the selected psychological symptoms (depression,
anxiety and stress) amongst rehabilitated spinal cord injury survivors in
Nairobi, Nakuru and Machakos counties in Kenya?
2. What is the level of participation in core-activities of daily living amongst
rehabilitated spinal cord injury survivors in Nairobi, Nakuru and Machakos
counties in Kenya?
3. What is the health-related quality of life amongst rehabilitated spinal cord
injury survivors in Nairobi, Nakuru and Machakos counties in Kenya?
4. Is there a relationship between psychological symptoms status, participation
and HRQoL of the rehabilitated spinal cord injury survivors in Nairobi,
Nakuru and Machakos counties in Kenya?
6
CHAPTER TWO
LITERATURE REVIEW
2.1 Epidemiology Spinal Cord Injury
Disparate global epidemiologic data is available on Spinal Cord injury. A case in
point Wyndaele and Wyndaele (2006) posited that globally SCI affect between 10.4
and 83 per million inhabitants per year with one-third of SCI survivors being
tetraplegic and 50% having a complete lesion. In contrast, Lee et al. (2014) reported
that the global estimate of SCI is 15–40 per million with a mean of 23 per year. In
developing countries, the incidence of SCI is reported to be 25.5 in a million per
annum (Rahimi-Movaghar et al., 2013). Whereas there is inadequate data on the
incidence of SCI in low-middle-income countries; in sub-Saharan African countries,
annual incidences of 21–29 per million populations have been reported (Lee et al.,
2014). In a study conducted in Botswana, using data from Princess Marina Hospital
to explore the local epidemiology and outcomes of SCI, Löfvenmark et al. (2015)
found that the annual incidence of SCI was 13 per million of the population.
However, what is more important is its distribution between age groups and sexes.
Wyndaele and Wyndaele (2006) estimated 33 years as the mean age of SCI survivors
and the sex distribution as 3.8 to 1 for men and women respectively. In concurrence,
Rahimi-Movaghar et al. (2013) reported a mean age of 32.4 years and more males
compared to females are affected by SCI. In a Kenyan study conducted at Kenyatta
National Hospital on patients diagnosed with SCI, Kinyanjui and Mulimba (2016)
reported a mean age of 37.6 years with males more than females being affected. In
many Sub-Saharan African countries, road traffic crashes (Draulans et al., 2011;
Löfvenmark et al., 2015) and falls (Rahimi-Movaghar et al., 2013) are the leading
causes of traumatic SCI.
7
2.2 Effects of SCI on individuals’ well-being
After SCI, survivors experience low self-esteem, poor self-image and negative mood
that impede interpersonal interactions and relationships (Amsters et al., 2016).
People with SCI also experience, on average, higher levels of distress and lower
levels of life satisfaction compared with the general population (Post & van
Leeuwen, 2012). More importantly, female SCI survivors experience lower mental
health scores and in particular those with tetraplegia lower physical health scores
(Andresen et al., 2016). In contrast, previous research has shown that male SCI
survivors preserve interests in maintaining fertility although they have high rates of
severe erectile and ejaculatory dysfunctions (Morrison et al., 2017). Anderson et al.
(2007) observed that sexual dysfunction is a major issue to an overwhelming
majority of people living with SCI that negatively impact their HRQol.
Research evidence has shown that various factors such as sexuality and fertility
issues, high rates of divorce in both pre and post existing marriages negatively affect
SCI survivors’ need for life-long care (DeVivo et al., 1995 ; DeVivo and Fine,
1985). According to Schwartz et al. (2018) the relationship between individuals with
SCI and their family and peers is likely to be altered physically, socially as well as
psychologically. Previous research has also shown that people with a higher level of
SCI present with autonomic dysfunction which lead to incontinence and palpitations
(Inskip et al., 2018) spasticity and pain syndromes (Andresen et al., 2016; Finnerup
et al., 2016; Sezer, Akkuş and Uğurlu, 2015). Further, people with SCI are
susceptible to respiratory, cardiovascular, urinary and bowel complications, pressure
ulcers, osteoporosis and bone fractures (Sezer et al., 2015). Gagnon et al. (2005)
also observed that during functional transfer activities people with SCI encounter
difficulties in movement strategies and muscular demand. These complications and
difficulties not only hinder people with SCI from accomplishing their activities of
daily living but also negatively impact on their functional independence and HRQoL
(Andresen et al., 2016; Finnerup et al., 2016; Sezer, Akkuş and Uğurlu, 2015;
Gagnon et al., 2005).
8
2.3 Life expectancy since SCI
Previous research has shown people with SCI have reduced life expectancy (Noe et
al., 2017; Middleton et al., 2012; Frankel et al., 1998). In a study that examined the
overall survival and mortality over time in terms of age at the time of injury at Spinal
Cord Injury Centre of Western Denmark medical archives, Noe et al. (2017)
reported a higher mortality among SCI survivors above 60 years of age at injury.
Additionally, in the USA, statistical data shows reduced life expectancy among SCI
survivors attributable to pneumonia and septicaemia (White & Black, 2017). Further,
in a 50-year Australian study to analyse acute and long-term mortality, estimate life
expectancy and identify survival patterns of individuals experiencing traumatic SCI,
Middleton et al. (2014) found that their survival rate was predicted by the
neurological impairment.
However, research evidence has shown that there is an improvement in life
expectancy (both immediate and long-term survival) following traumatic SCI, since
the Second World War, though shorter compared to that of the general population
(Middleton et al., 2012; Frankel et al., 1998). McColl et al. (1999) reported an
increase in life expectancy of about 5 years in the study on life expectancy and health
among (n=286) spinal cord injured adults in Canada. A UK retrospective study
(covering 70 years) that investigated long-term survival of traumatic SCI cases
(n=5483) with a mean age at injury of 35.1 years that survived 1-year post-injury,
Savic et al. (2017) found that life expectancy not only depended on the level and
completeness of injury but also ventilator dependency, age and gender. Further,
research evidence has also shown that several factors play part in the length of
survival of SCI clients including medical services, level of care sought (Middleton et
al., 2012; Frankel et al., 1998), completeness of injury, age and gender (Savic et al.,
2017). However, the global average life expectancy is above 70 years though there is
inequality across and within countries (Roser et al., 2013).
2.4 Participation in Community, social and civic life
Spinal cord injured survivors may often experience difficulties when attempting to
participate in various community activities (Conroy & McKenna, 1999). Previous
9
studies indicate that participation in community, social or civic life activities is a
function of the interaction of various factors including social support, employment,
time since injury, neurologic status, health status, income and functional
independence (Braaf et al., 2017; Carr et al., 2017; Suttiwong et al., 2015; Paul et
al., 2013; Anderson, Krajci & Vogel, 2003; Whiteneck et al., 1999). In a study
conducted amongst SCI survivors who received initial rehabilitation in a Regional
Model Spinal Cord Injury System, in Washington DC, in their 1st and 20th
anniversary post-injury to assess factors that influence community reintegration of
people with SCI, Whiteneck et al. (1999) found that age, gender and ethnicity
significantly influence community participation. While in a study to assess
socioeconomic and work outcomes between recipients’ and those not receiving
compensation, over two and a half years following SCI, Paul et al. (2013) found that
financial support complement re-integration into community and upgrade the
HRQoL. In a systematic review of literature to examine the current knowledge of
how social support and social skills are associated with aspects of health, functioning
and quality of life of persons living with SCI, Müller et al. (2012) found that social
support was linked to physical functioning, mental health, and adjustment.
This notwithstanding, the many factors that hinder SCI survivors from participating
in the community, social or civic life, their behaviours, lifestyle changes, and access
to resources in the environment need to be put into consideration (Richards et al.,
1999). Furthermore, participation in community, social or civic life has been
attributed to factors such as environmental adaptation, accessibility, and cleanliness
of bathrooms (Braaf et al., 2017), public spaces (such as roads, missing or
inadequate ramps, inaccessible restrooms) and negative attitudes (Aldersey et al.,
2018). Aldersey et al. (2018) further noted that women in wheelchair compared to
men face greater barriers of access in a range of community spaces and activities. In
a cross-sectional community study conducted in Sweden to examine the effect of
environment (housing accessibility) on participation of people with SCI, Norin et al.
(2017) concluded that housing design features were associated with fewer self-care
activities. In a study amongst 160 people with SCI survivors in Sweden to describe
how they perceive their participation in life situations and to determine the
relationship between their participation and perceived problems, Lund et al. (2005)
10
found that individuals perceived severe participation restriction in mobility-outdoors,
work, education and social interactions. In concordance, Noreau et al. (2005) in a
study to determine participation after SCI in Canada found that individuals reporting
mobility, education participation restriction most often present with limitations in
social integration, and financial independence. This may lead to limited opportunities
to vocational training, employment and social interactions.
2.5 Participation in Major Life Areas
Researchers have reported that early vocational rehabilitation amongst people with
SCI increases their likelihood to participate in major life areas including
employment, paid work or education (Trenaman, Miller & Escorpizo, 2014; Meade
et al., 2008; Schönherr et al., 2004). In a systematic review to evaluate employment
outcomes for individuals with SCI, Trenaman, Miller and Escorpizo (2014) found
that acquiring or returning to durable employment confirmed a significant
achievement and measure of successful rehabilitation. Also, a survey conducted at
the Centre for Rehabilitation Beatrixoord from 1990 until 1998 in the Netherlands
involving 69 clients with SCI to explore the process of reintegration in paid work
following traumatic SCI established that positive expectations in paid work in SCI
clients was associated with vocational re-training of the patient (Schönherr et al.,
2004). Further, an observational longitudinal cohort study to describe a novel early
vocational rehabilitation program conducted amongst 100 adults with SCI admitted
to spinal units within 2 years, in Sydney, Australia, Middleton et al. (2015) found
34.5% were in paid employment, 36% unemployed and 13% were students or in-
training workers and 17% were in vocational rehabilitation. Ottomanelli and Lind
(2009) in a review of literature on employment rates and predictors of employment
after SCI, the benefits and barriers involved found an average employment rate of
approximately 35%. In a survey of 445 individuals with SCI’s need of services that
they had or were interested in receiving in the Commonwealth of Virginia, Meade et
al. (2008) found that only 32% had met the need for vocational services, 24.2%
expressed interest in new job skill and 21.3% acquiring a job but were hindered by
affordability and accessibility of the services.
11
Previous studies have shown that several factors influence people with SCI
participation in major life areas including affordability and accessibility of
rehabilitation services (Solheim & Leiulfsrud, 2018; Meade et al., 2008). Injury-
related factors, employment history, psychosocial issues, and disability benefits
status (Ottomanelli & Lind, 2009), education, community mobility (Anderson &
Vogel, 2002), have also been linked to people with SCI participation. For example,
in a retrospective study using data of 195 paediatric-onset SCI clients from archives
of Shriners Hospital for Children in USA, Anderson and Vogel (2002) found that
education, community mobility, functional independence, and decreased medical
complications, community integration, independent driving, independent living,
higher income, and life satisfaction were associated with employment. Similarly, in
Norwegian cross-sectional study conducted amongst 320 persons with SCI to assess
how the employed compare with the non-employed in their job motivation, labour
discrimination, quality of life, everyday coping, health and pain suffering, Solheim
and Leiulfsrud (2018) found that the ability to continue working in the same
organization and education was associated with pre-injury employment status in both
sexes. In an Australia Longitudinal study to explore the outcomes of people with SCI
(early vocational rehabilitation, contextual factors and employment outcomes),
Hilton et al. (2017) found that education status, relationship and subjective wellbeing
significantly increased the odds of being employed while tertiary education prior to
injury was associated with eight times increased odds of being in employment.
On the other hand, in one cross-sectional study of 149 adults with chronic SCI to
determine the association between participation in organized sports programs and
employment, Blauwet et al. (2013) found that participation in organized sports was
positively associated with employment. Similarly, another cross-sectional survey
amongst 781 adults with SCI (aged 18-64 years) to identify barriers and facilitators
to employment after SCI and labor force participation, in the USA, showed that
facilitators were more highly related to labor force participation than barriers (Krause
& Reed, 2010). This notwithstanding, researchers have shown that barriers such as
discrimination by employers against people using wheelchairs (Solheim &
Leiulfsrud, 2018) and lack of vocational rehabilitation (Solheim & Leiulfsrud, 2018;
12
Hanson, Nabavi & Yuen, 2001; Tasiemski et al., 2000) affect participation in
employment, sports and leisure activities of SCI survivors in both gender.
2.6 Effect of SCI on Participation Core Activities
Results of studies on the effect of SCI on individuals’ participation in core activities
of daily living vary. In a study conducted amongst 57 people with SCI in
Beatrixoord, Netherlands, Centre for Rehabilitation, to determine the changes in
participation in vocational and leisure activities after their reintegration in society,
Schönherr et al. (2004) found that 60% successfully reintegrated in work with a
reduction in hours spent on paid work and sporting activities. Tasiemski et al. (2000)
established that levels of sporting/recreational activities and employment decreased
significantly after SCI. Additionally, at National Spinal Injuries Centre in the UK to
examine the levels of sporting/recreational activities, education and employment in
45 people with SCI, Tasiemski et al. (2005) found that involvement in sport and
recreation was associated with higher levels of education and employment.
Moreover, a cross-sectional retrospective study in Switzerland to describe the
frequency of participation in sport and its correlates amongst persons with SCI,
Rauch et al. (2014) observed that persons with SCI (with tetraplegia) especially
women participated significantly less often.
2.7 Factors Influencing Persons with SCI Participation in Core Activities
Researchers have established that a host of factors influence persons with SCI
participation in vocational, sports and leisure activities including employment
(Blauwet et al., 2013; Kehn & Kroll, 2009 ; Schönherr et al., 2004 ; Tasiemski et
al., 2000). Blauwet et al. (2013) posit that factors such as personal motivation,
independence, affordability, availability and accessibility of facilities, equipment and
personal assistants, including fear of injury not only influence persons with SCI work
participation but also in sports and leisure activities. A qualitative study conducted
among 48 individuals with SCI, in Florida USA, to determine whether persons with
spinal cord injury participation in sports affected their level of community
integration, Hanson, Nabavi and Yuen (2001) found that athletes with SCI had
significantly higher scores on physical independence, mobility, occupation and social
13
integration than non-athletes. Blauwet et al. (2013) in a cross-sectional study of 149
adults with chronic SCI to determine the association between participation in
organized sports programs and employment in adults with chronic SCI found that
participation in organized sports was positively associated with current employment
status. This notwithstanding, injury level, active membership in a club, frequency of
participation in sports before the onset of SCI correlate with social activities
participation in community settings (Rauch et al., 2014) including wheelchair skills
performance (Fliess-douer et al., 2013). Further previous researches have also shown
that the geographic and architectural (presence of storey buildings) accessibility and
transportation issues act as barriers to SCI survivors’ full reintegration and
participation in society (Vissers et al., 2008; Levins, Redenbach & Dyck, 2004).
Moreover, the risk of psychological symptoms presents a major concern towards SCI
survivors’ full reintegration and functioning in community settings.
2.8 Psychological symptoms
Individuals with SCI have been reported in several studies to be at a higher risk of
negative psychological symptoms compared to the general population (Le &
Dorstyn, 2016; Williams & Murray, 2015; Khazaeipour et al., 2014; Craig, Tran &
Middleton, 2009; Migliorini, New & Tonge, 2009; Mitchell, Burns & Dorsty, 2008;
Krause, Kemp & Coker, 2000; Elliott &Frank, 1996). In a systematic review to
examine the prevalence of negative psychological states in people with SCI,
mediating and contextual factors, Craig, Tran and Middleton (2009) found a 27%
prevalence rate of abnormal levels of psychological morbidity. Lidal et al. (2008) in
a Norwegian mortality study on the cause of death and risk indicators for death in
patients with spinal cord injury conducted among 387 individuals found that risk
indicators for death were psychiatric diagnosis and alcohol or substance abuse. In a
similar study in India conducted among 50 people, to assess psycho-social problems
amongst patients with SCI, Singh et al. (2011) found that they suffered from
psychological, sexual function and social adjustments problems including difficulties
maintaining family and partner relationships, as well as sleep disturbances.
14
According to Craig et al. (2013) and Elliott and Frank (1996), depressive disorders
are the most common form of psychological symptoms affecting people with SCI. In
a cross-sectional study conducted in Iran amongst 134 SCI survivors to determine the
prevalence of depression and associated factors, Khazaeipour, Taheri-Otaghsara and
Naghdi (2015) found a prevalence rate of 49.3% who had mild to severe depression.
Similarly, Krause, Kemp and Coker (2000) in a USA survey among 1391 SCI
survivors, found a prevalence rate of 48% of depressive symptoms which were
attributed to their socioeconomic status (education and income), age, gender and
ethnicity. Additionally, in a meta-analysis, Williams and Murray (2015) found an
estimated mean prevalence of 22.2% for depression following SCI with a lower-
bound and an upper-bound of 18.7% and 26.3% respectively. In addition, Migliorini,
New and Tonge (2009) in an Australian community cross-sectional study amongst
SCI survivors (n=443) to examine the likelihood of depression, anxiety and stress in
adults with non-traumatic SCI compared with adults with traumatic SCI found that
the prevalence was 37%, 30%, 25% for depression, anxiety and stress respectively.
In the general population, Ferrari et al. (2013) following a systematic review to
evaluate depressive disorder reports that the global point prevalence of depression is
4.7% (4.4–5.0%). Additionally, Baxter et al. (2013) in a systematic review and meta-
regression to estimate the prevalence of anxiety disorders globally, found a 7.3%
(4.8–10.9%) prevalence of anxiety ranging from 5.3% (3.5–8.1%) in African cultures
to 10.4% (7.0–15.5%) in Euro/Anglo cultures. Recently WHO (2017) estimated the
global prevalence of depression and anxiety to be 4.4% and 3.6% respectively.
2.9 Factors Influencing Psychological symptoms
Previous research reports indicate that the rate of psychological symptoms in SCI
survivors is related to aging (Jokela, Batty & Kivimäki 2013), gender, ethnicity,
divorce and socioeconomic statuses (Saunders et al., 2011) as well as increased time
since injury (Hoffman et al., 2011; Fann et al., 2011; Krause, Kemp & Coker, 2000).
Further, researchers have also demonstrated that depressive symptoms are associated
with longer hospitalization periods, increased medical complications, lower
functional independence and increased morbidity (Riggins et al., 2011; Schönherr et
al., 2000). A USA study conducted amongst 2,256 individuals with SCI to identify
15
demographic, injury, and discharge factors associated with the major depressive
disorder at 1 and 5 years post-injury, Arango-Lasprilla et al. (2011) found that being
unemployed, having no bladder management at discharge and high school education
predict depression among persons aged 35–55 years old at the time of injury. A
nationwide population-based cohort study in Taiwan assessing anxiety and
depression in survivors with traumatic SCI, Lim et al. (2017) indicated that males
with SCI under 35 years old who had low income, had a higher risk of anxiety or
depression. Previous research evidence also link anxiety in adults with SCI to
excessive worry, fear or panic (Mitchell et al., 2008) and feelings of helplessness (A.
Craig et al., 2009). This notwithstanding, Claudia, Vignola and Marcassa (2014)
posits that stress can lead to the onset of depression or anxiety which negatively
impact on functional performance and HRQoL. More importantly, depression has
been linked to substance abuse, suicidal tendencies (Fann et al., 2011) and is among
the leading causes of disability worldwide (Riolo et al., 2005; Üstün et al., 2004).
2.10 Impact of Depression
Although depression is treated and a marked decrease in symptoms achieved,
depressive illnesses remain a cause of disability on the patient (WHO, 2017) and a
substantial burden on family and society (Ishak et al., 2011). In particular, relapse
affects performance and HRQoL (Ishak et al., 2011). Previous research also indicates
that depression not only leads to family conflict, school dropout, absenteeism,
substance abuse and suicide but also negatively impact work participation especially
in young adults (WHO, 2017; Sobieraj et al., 1998). In a prospective cohort study
conducted in North-Western China amongst people with depression and chronic
illness to examine the impact of physical and mental health status on job loss and job
turnover rates, Wang et al. (2014) found that those with depression had a higher risk
of unemployment and poor work outcomes compared to those with other forms of
chronic illnesses. Thus, psychological symptoms and states particularly depression
may negatively impact SCI survivor’s HRQoL.
16
2.11 Health-related Quality of life
A qualitative study to assess HRQoL in people with SCI following the earthquake in
China among 14 SCI survivors by Tasiemski, Nielsen and Wilski (2010) found that
the individuals had low HRQoL. A retrospective study of archival records kept by
the Queensland Spinal Cord Injuries Service in Australia, of 270 SCI survivors, to
investigate the relationship between quality of life and disability across the lifespan
for people with SCI, Barker et al. (2009) found that HRQoL was significantly poorer
for people with SCI compared to the Australian norm. Barker et al. (2009) argue that
the decrease in HRQoL among SCI survivors is linked to secondary impairments,
participation restrictions and activity limitations but not with neurological level, age
or time since injury. According to Gurcay et al. (2010) in a cross-sectional study
conducted in a hospital in Turkey to assess the quality of life in SCI survivors, the
physical health domain was found to be the lowest under HRQoL domains.
However, Kennedy and Rogers (2000) argue that the quality of life of people who
have a spinal cord injury remains stable during the first year following discharge. In
contrast, a previous study on changes in HRQoL in persons with SCI and their close
persons during the first 2 years post-injury conducted among 347 individuals with
SCI, established that HRQoL increases for persons with SCI from onset (Lude et al.,
2014).
According to Augutis and Anderson (2012) individual SCI survivors fighting spirit,
downward comparison and helping others is linked to positive perceived emotion
and acceptance. In a cross-sectional descriptive study in Iran by Mousavi (2017) to
determine the role of depressed mood in HRQoL in patients with spinal cord injury
found that there was a significant and direct relationship between depression and
HRQoL. Moreover, in a US retrospective study to examine the Health-related quality
of life factors and change in mobility in individuals with SCI one-year post-injury,
Riggins et al. (2011) found that increase in pain and depressed mood was associated
with low HRQoL.
17
CHAPTER THREE
MATERIALS AND METHODS
3.1 Area of Study
The areas of study namely Nairobi, Nakuru and Machakos were selected using
simple random sampling from three clusters of the 47 Counties stratified based on
the Human Poverty Index (HPI) (GOK & UNDP, 2009). The 47 counties were
classified as low, medium and high according to the HPI respectively. Sampling
involved two basic steps, that is, obtaining the list of names of all the 47 Counties,
writing the names on small pieces of paper that are folded, mixed and random
sampling is performed. Table 3.1 summaries the clusters.
Table 3.1: Summary of Counties by Clusters
S/No. Level of HPI Counties
Low (HPI≤30.0) Kiambu, Kirinyaga, Murang’a, Nairobi, Nyandarua,
Nyeri
Medium(HPI
>30.1<33.0)
Mombasa, Kwale, Kilifi, Tana River, Lamu, Taita,
Taveta, Uasin-Gishu, Trans-Nzoia, Elgeyo-
Marakwet, Nandi, Baringo, Laikipia, Nakuru,
Narok, Kajiado, Kericho, Bomet, West-Pokot,
Samburu, Turkana
High (HPI>33.1) Marsabit, Isiolo, Meru, Tharaka-Nithi, Embu, Kitui,
Machakos, Makueni, Siaya, Kisumu, HomaBay,
Migori, Kisii, Nyamira, Garissa, Wajir, Mandera
Nairobi County consists of 17 sub-counties all covering 684 square kilometres with
an estimated population of 3,1 38,369 (Kenya National Bureau of Statistics, 2009).
The Nairobi County borders Kiambu County to the North and West, Kajiado to the
South and Machakos to the East. Nakuru County is administratively divided into 11
sub-counties covering 7, 509.5 square kilometres with an estimated population of
18
1,603,325 as per the 2009 National Population and Housing Census, with a greater
number living in the rural. It borders Baringo to the north, Laikipia to the northeast,
Nyandarua to the east, Kajiado to the south, Narok to the southwest with Bomet and
Kericho to the west. Machakos County consists of 8 sub-counties covering 5,952.9
square kilometres. According to the 2009 Kenya Population and Housing census, the
Machakos County estimated population of 1,098,584 with the majority living in rural
areas. The county borders Nairobi and Kiambu counties to the west, Embu to the
north, Kitui to the east, Makueni to the south, Kajiado to the southwest, and Muranga
and Kirinyaga to the northwest.
3.2 Research Design
This study used a cross-sectional study design utilizing quantitative methods. A
cross-sectional study is commonly used to determine the prevalence of an outcome
of interest, at a point in time, from a given population where the participants
included, are selected from a sampling frame (Levin, 2006; Mann, 2003). In
addition, cross-sectional study designs may be used for population-based surveys
(Setia, 2016). Therefore, the cross-sectional study design is the most appropriate
design for this study whose focus was to determine the association between
psychological symptoms and participation in core-activities as well as health-related
quality of life amongst spinal cord injury survivors. This was a multi-center study (in
the selected counties).
3.3 Study Population
In the 2009 census there were 3,138,369; 1,603,325 and 1,098,584 people in Nairobi,
Nakuru and Machakos counties of Kenya respectively (Kenya National Bureau of
Statistics, 2009). World Health Organization estimates that the global incidence of
SCI, both traumatic and non-traumatic, is between 40 - 80 cases per million
population but does not provide the global estimated prevalence (World Health
Organization & International Spinal Cord Society, 2013). Therefore, the study
population was spinal cord injury survivors living in Nairobi, Nakuru and Machakos
Counties estimated to be 188, 96 and 65 people on average respectively; that is 349
SCI survivors.
19
3.4 Sampling method
In this study, purposive sampling was used. A purposive strategy was preferred for
use because there was limited number of SCI survivors who could contribute to the
study by virtue of knowledge or experience as recommended by Tongco (2007). A
sample SCI survivor was recruited voluntarily into the study from Nairobi, Nakuru
and Machakos counties respectively. The county referral hospitals located in Nairobi,
Nakuru and Machakos counties where the SCI survivors' records were kept were
visited (see table 3.2). Scooping of the Past medical records was undertaken to
identify the potential participants who then were recruited into the study
Table 3.2: Selected hospitals according to the counties
Nairobi National spinal cord injury hospital
Nakuru Nakuru Level 5 Hospital
Naivasha level 4 Hospital
Machakos Machakos level 5 Hospital
3.4.1 Sample Size Determination
According to Israel (1992) calculation of a sample size considers the size of the
population of interest, margin of error, confidence interval and amount of variance
the researcher was expecting from the responses he or she received. In this study
sample size was determined using the Yamane formula;
n =____N______
1+N(e)2
Where, n is the sample size, N is the population size, and e is the level of precision
In this study population N=349, Margin of error is 0.05
20
n = ____N____ = 349_______ = 186
1+N (e) 2 1+349(.05)2
Therefore, the researcher recruited 101, 51, and 34 SCI survivors in Nairobi, Nakuru
and Machakos respectively.
3.4.2 Inclusion Criteria
The study participants were all SCI survivors aged 18 years and above. Only those
who had a medical diagnosis of SCI from a recognized medical doctor irrespective of
the cause and lived in the community in the selected counties were included in the
study.
3.4.3 Exclusion Criteria
Potential participants who did not meet the inclusion criteria were excluded from the
study. Re-hospitalized SCI survivors at the time of this study were excluded.
3.5 Research Instruments
Three data collection tools were used (appendix 1,2). These included The
Participation Scale to measure the level of participation, the Depression, Anxiety and
Stress Scale (DASS) version 21.0 for measuring psychological symptoms and the
World Health Organization Quality of Life questionnaire (WHOQOL-BREF). The
first tool, the Participation scale is designed for use in rehabilitation, stigma
reduction and social integration programs (Van Brakel et al., 2006). The
Participation Scale has 18 items measuring Learning and applying knowledge (one
item), Communication (one item), Mobility (three items), Self-care (three-item),
Domestic life (three items), Interpersonal interactions and relationships (three items),
Major life areas (three items), and Community, social and civic life (three items)
domains. The second tool, that is, the Depression, Anxiety, Stress Scale (DASS)
version 21 is designed to measure the dimensions of depression, anxiety, and stress
(Henry & Crawford, 2005). The Depression Anxiety Stress Scales 21 (DASS-21) is a
21
short form of Lovibond and Lovibond (1995) 42-item self-report measure of
depression, anxiety, and stress (DASS). The DASS21 has 21 items measuring
Depression (seven items), Anxiety (seven items) and Stress (seven items). The third
tool is the WHOQOL-BREF which arose from a need for a genuinely international
measure of the quality of life and a commitment to the continued promotion of a
holistic approach to health and health care (World Health Organization, 1996). It has
26 items physical health has (seven items), psychological (six items), social
relationship (three items), environment (eight items); and two items, one measuring
overall QOL and another measuring general health. The tools were translated into
Kiswahili and back-translated into English by a qualified linguist. Permission was
sought from the authors of the tools used and authority was granted.
3.5.1 Reliability and Validity of the Measurement Instruments
The Participation Scale has been found to provide valid, reliable, practical and
sensitive data. According to Thammaiah et al. (2018) the scale has a Cronbach's
alpha score of 0.90, which is regarded as excellent and has acceptable inter-item
correlation (ICC <0.60). Van Brakel et al. (2006) who developed the instrument
reported that the P-Scale had Cronbach's alpha coefficient of 0.92, a stable intra-
interviewer reliability of 0.83 and inter-interviewer reliability of 0.80 with good
discrimination (between controls and clients). The P-scale also showed good validity
and reliability in a previous study in Nepal (Cronbach's alpha coefficient 0.93 for the
whole scale and 0.78 and 0.93 for the subscales) (Stevelink et al., 2013). According
to Henry and Crawford (2005), the DASS-21 subscales can validly be used to
measure the dimensions of depression, anxiety, and stress. A psychometric study by
Tran, Tran and Fisher (2013) found a high internal consistency of the DASS-21 sub-
scales, ranging from 0.70 for the Stress subscale to 0.88 for the overall scale.
According to Tran, Tran and Fisher (2013) the scale can detect the common mental
disorders of depression and anxiety with a 79.1% sensitivity of and a specificity of
77.0%. Previous test performance in DASS 21 depression on SCI survivors found a
sensitivity of 0.57 and a specificity of 0.76 (Mitchell et al., 2008). Mitchell, Burns
and Dorsty (2008) posit that DASS-21 has clinical utility as a screening measure for
assessing Depression, Anxiety and Stress in patients with SCI. The depression
22
subscale of the DASS-21 is reported to have a sensitivity of 57.0% and a specificity
of 67.0% while the anxiety subscale is reported to have a sensitivity of 86.0% and a
specificity of 64.0% (Mitchell et al., 2008).
Jang et al. (2004) reported that the WHOQOL-BREF is a valid tool for assessing
persons with traumatic spinal cord injury. Statistical tests of psychometric properties
of the WHOQOL-BREF in evaluating the HRQoL of adults in the U.S showed it had
satisfactory internal consistency (ICC 0.82–0.95) across all domains (Bonomi et al.,
2000). In its use among persons with traumatic brain injury WHOQOL-BREF
showed it had good to very good internal consistency (ICC 0.75 ∼ 0.89) and a test-
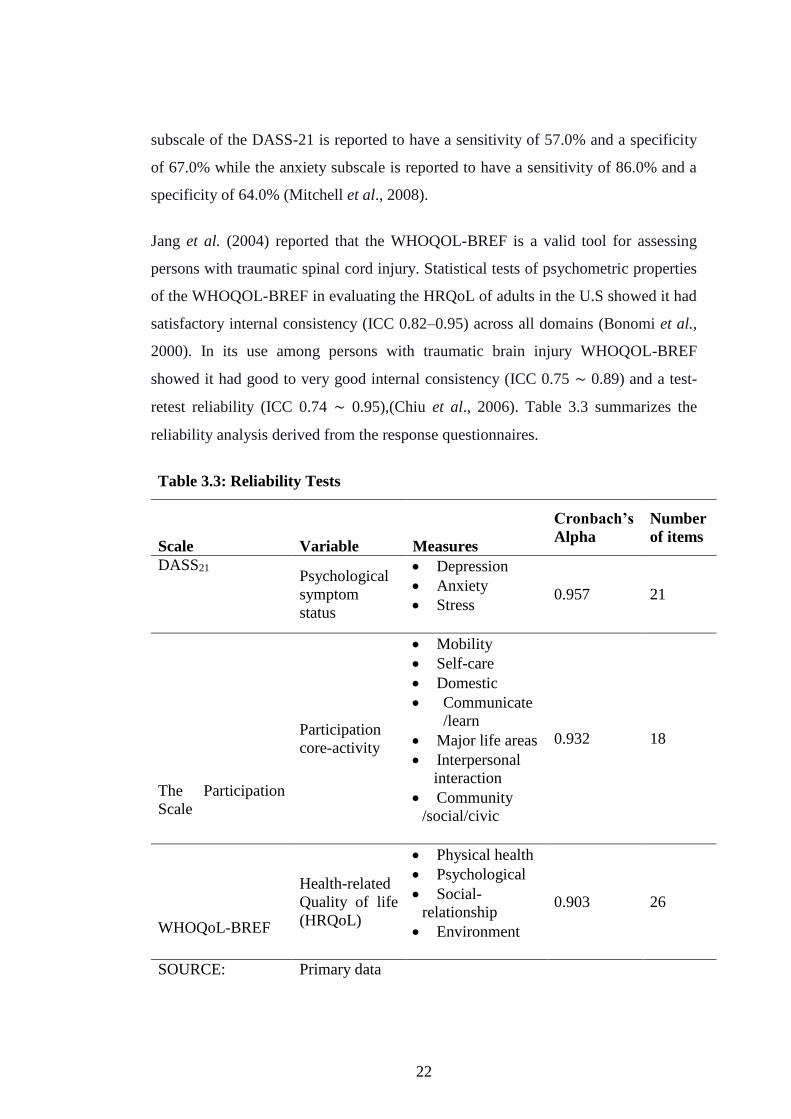
retest reliability (ICC 0.74 ∼ 0.95),(Chiu et al., 2006). Table 3.3 summarizes the
reliability analysis derived from the response questionnaires.
Table 3.3: Reliability Tests
Scale Variable Measures
Cronbach’s
Alpha
Number
of items
DASS21 Psychological
symptom
status
Depression
Anxiety
Stress 0.957 21
The Participation
Scale
Participation
core-activity
Mobility
Self-care
Domestic
Communicate
/learn
Major life areas
Interpersonal
interaction
Community
/social/civic
0.932 18
WHOQoL-BREF
Health-related
Quality of life
(HRQoL)
Physical health
Psychological
Social-
relationship
Environment
0.903 26
SOURCE: Primary data
23
The Cronbach’s Alpha coefficient ranged between 0.903 for WHOQoL BREF
measure for (HRQoL) to 0.957 for DASS21 measure psychological symptom status.
The results indicate that the measurement scales used in this study were reliable and
adequately measured the variables of the study. The reliability coefficient for all the
constructs used in this study exceeded the 0.6 lower level of acceptability
recommended by Gliem and Gliem (2003) and was within the 0.70 ICC and above as
advocated by Nunnally (1994) and are therefore reliable and acceptable for further
analysis.
3.6 Sampling Adequacy
In the current study the variables and tests of sampling adequacy were used to test
the validity. The Kaiser-Meyer-Olkin (KMO) test of sampling adequacy and the
Bartlett’s Test of Sphericity were employed. Bartlett’s Test of Sphericity was used
to examine redundancy between the variables that could be summarized with a small
number of factors (Williams, Onsman & Brown, 2010). The test should be
significant (p<.05), for factor analysis to be considered suitable (Williams et al.,
2010). The following is Bartlett’s Test of Sphericity formula:
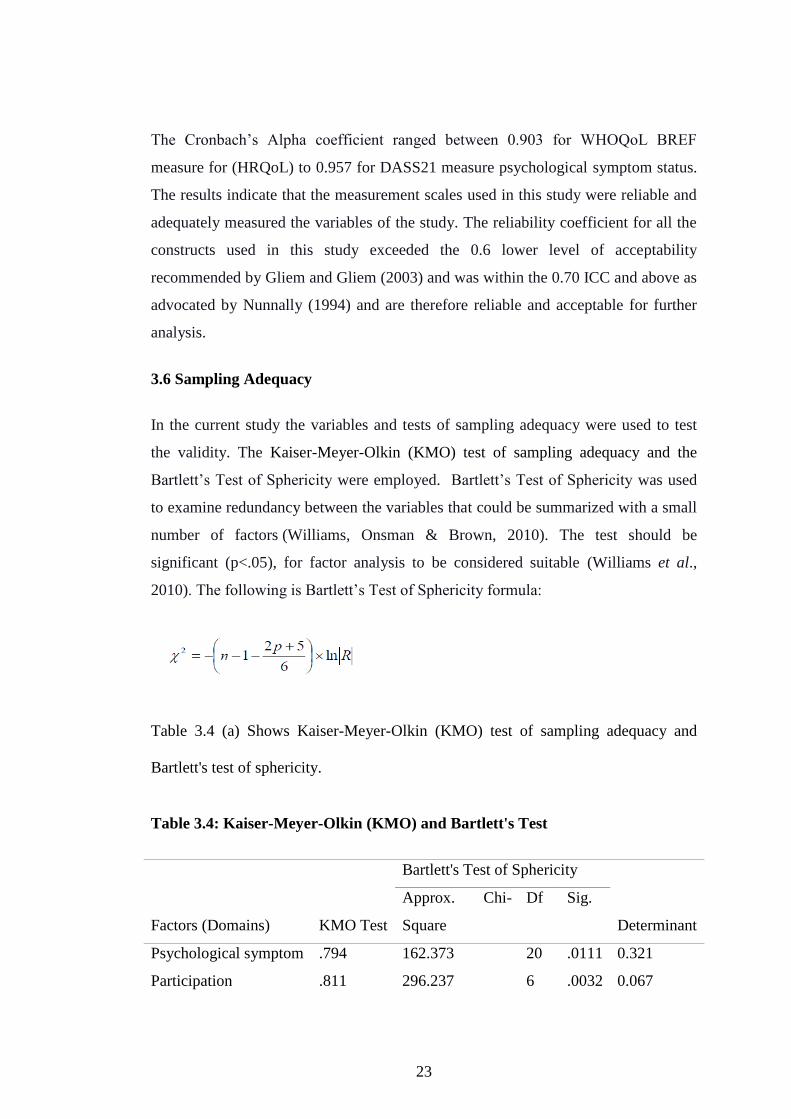
Table 3.4 (a) Shows Kaiser-Meyer-Olkin (KMO) test of sampling adequacy and
Bartlett's test of sphericity.
Table 3.4: Kaiser-Meyer-Olkin (KMO) and Bartlett's Test
Factors (Domains) KMO Test
Bartlett's Test of Sphericity
Determinant
Approx. Chi-
Square
Df Sig.
Psychological symptom .794 162.373 20 .0111 0.321
Participation .811 296.237 6 .0032 0.067
24
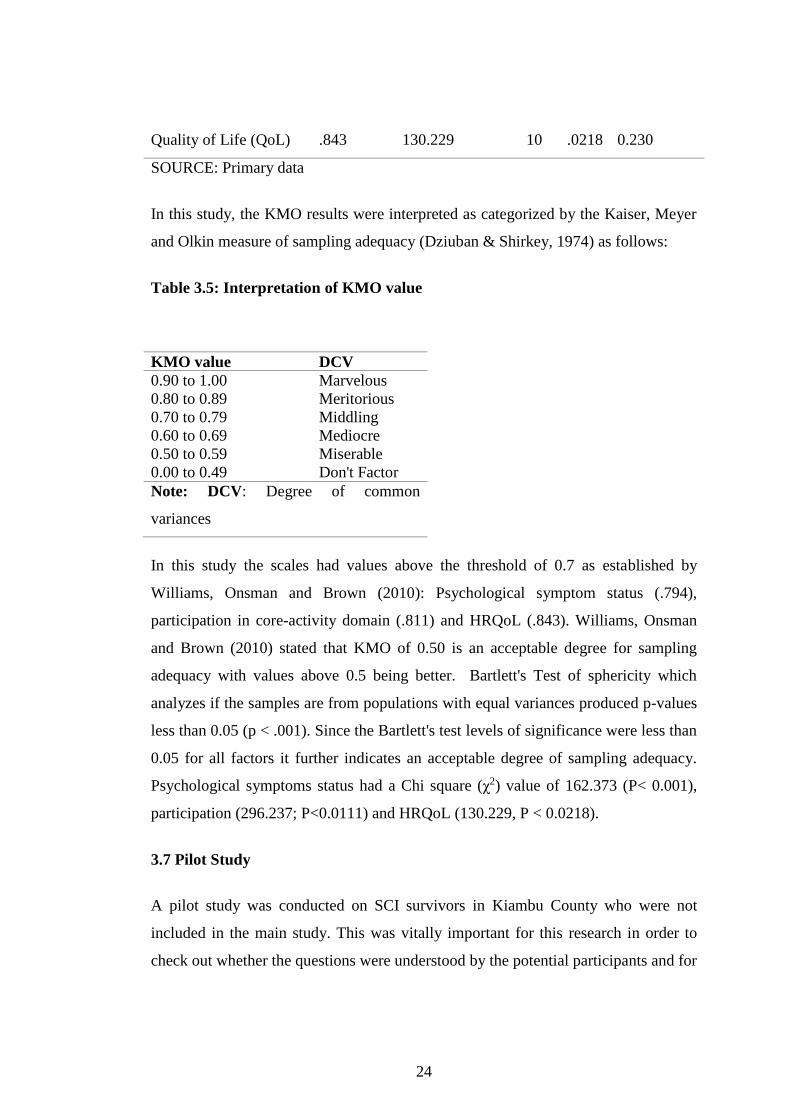
Quality of Life (QoL) .843 130.229 10 .0218 0.230
SOURCE: Primary data
In this study, the KMO results were interpreted as categorized by the Kaiser, Meyer
and Olkin measure of sampling adequacy (Dziuban & Shirkey, 1974) as follows:
Table 3.5: Interpretation of KMO value
KMO value DCV
0.90 to 1.00 Marvelous
0.80 to 0.89 Meritorious
0.70 to 0.79 Middling
0.60 to 0.69 Mediocre
0.50 to 0.59 Miserable
0.00 to 0.49 Don't Factor
Note: DCV: Degree of common
variances
In this study the scales had values above the threshold of 0.7 as established by
Williams, Onsman and Brown (2010): Psychological symptom status (.794),
participation in core-activity domain (.811) and HRQoL (.843). Williams, Onsman
and Brown (2010) stated that KMO of 0.50 is an acceptable degree for sampling
adequacy with values above 0.5 being better. Bartlett's Test of sphericity which
analyzes if the samples are from populations with equal variances produced p-values
less than 0.05 (p < .001). Since the Bartlett's test levels of significance were less than
0.05 for all factors it further indicates an acceptable degree of sampling adequacy.
Psychological symptoms status had a Chi square (χ2) value of 162.373 (P< 0.001),
participation (296.237; P<0.0111) and HRQoL (130.229, P < 0.0218).
3.7 Pilot Study
A pilot study was conducted on SCI survivors in Kiambu County who were not
included in the main study. This was vitally important for this research in order to
check out whether the questions were understood by the potential participants and for
25
errors of translated version. Only errors of translated version were found and were
corrected.
3.8 Data collection Procedure
Audience was sought from department’s in-charges in the respective hospitals, for
the potential participants records. All potential participants were contacted on phone
and after making arrangements visited their households. All the participants were
provided with a written explanation and orally briefed about the study. All the SCI
survivors meeting the inclusion criteria signed written consents before being allowed
to participate in the study. Guardians of those who were unable to signed on their
behalf. Each participant completed the research instrument and was assisted by the
principal researcher and research assistants where necessary. The completed
questionnaires were then collected and kept in a safe for further computation away
from the study area.
3.9 Data Management and Analysis
The completed tools were coded and stored by the principal researcher in a safe.
Collected data was keyed in 2 separate Microsoft Excel Software sheets and
compared for discrepancy. The principal researcher re-entered data from the
questionnaires where discrepancy was noted. Once correct data entry was completed,
it was imported into SPSS software version 25.0 and analysis done. Descriptive
statistics were calculated and presented in summary tables. Later, one-way analysis
of variance (ANOVA) was performed to explore the relationship between the
variables. In this study SCI survivor’s HRQoL was described as either poor,
moderate or good based on the percentage scores. A poor HRQoL was ascribed to
those who scored equal or less than 33.3% of the responses while a moderate
HRQoL and a good HRQoL was assigned to those scoring more than 33.3% to
66.6% and more than 66.6% respectively.
26
3.10 Ethical Consideration
Approval to carry out the study was sought from Jomo Kenyatta University of
Agriculture and Technology Ethical Review Committee (appendix 8). While
authority to conduct the study was sought from National Commission for Science,
Technology and Innovation (appendix 9) and further sought from the County
Commissioners, Ministry of education and Ministry of health (appendix
11,12,13,15,16,17,19,20,21). Permission to collect data was sought from the
participating Hospitals Medical superintendents (appendix 14, 18, 22, 23).
Participation was voluntary and all participants in this study gave written consents
(appendix 4, 6). The researcher gave a written explanation of the nature and purpose
of the research to potential participants (appendix 3, 5) before they were recruited
into the study. The participants were free to withdraw from the study if they so
wished at any time during the course of the data collection.
27
CHAPTER FOUR
RESULTS
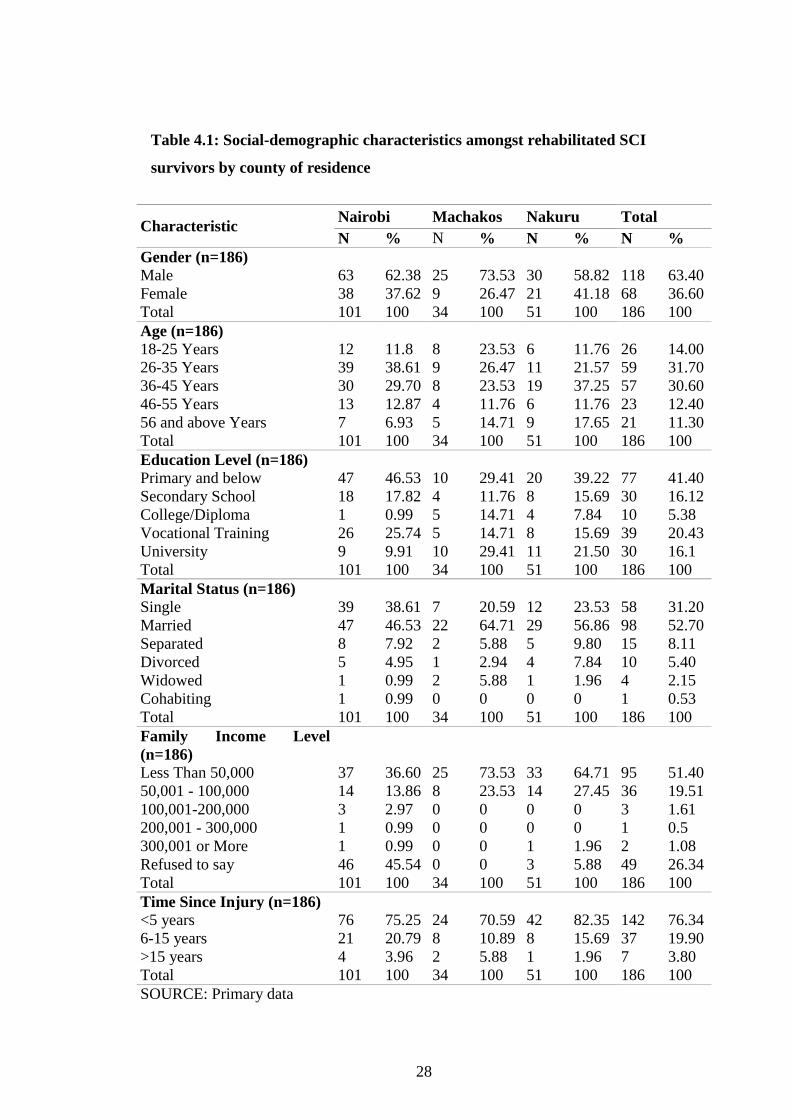
4.1 Participants Social-Demographic Characteristics
In this study, a total of 186 SCI survivors were approached; 100% responded; 101,
51 and 34 from Nairobi, Nakuru and Machakos counties respectively. Regarding
gender distribution from the three counties, 118 of the 186 rehabilitated SCI
survivors were male (63.4%) and 68 were females (36.6%). Regarding age
distribution majority, 59 of rehabilitated SCI survivors (31.7%) were between the
age of 26-35 years; 57 (30.6%) were aged between 36-45 years while 26 (14%) were
between 18-25 years old. Regarding their education level, majority, 77 (41.4%) of
the participants had primary school level and below, while 39 (20.43%) had had
vocational training. With regard to participants’ marital status, majority, 98 (52.7%)
were married while 58 (31.2%) were single. According to participants’ family
monthly income, majority of them, 95 (51.4%) earned below $500 (KES 50,000).
The results further revealed that majority, 142 (76.34%) of the participants’ injury
was less than 5 years old. Table 4.1 summarizes the participants’ social-demographic
characteristics.
28
Table 4.1: Social-demographic characteristics amongst rehabilitated SCI
survivors by county of residence
Characteristic Nairobi Machakos Nakuru Total
N % N % N % N %
Gender (n=186)
Male 63 62.38 25 73.53 30 58.82 118 63.40
Female 38 37.62 9 26.47 21 41.18 68 36.60
Total 101 100 34 100 51 100 186 100
Age (n=186)
18-25 Years 12 11.8 8 23.53 6 11.76 26 14.00
26-35 Years 39 38.61 9 26.47 11 21.57 59 31.70
36-45 Years 30 29.70 8 23.53 19 37.25 57 30.60
46-55 Years 13 12.87 4 11.76 6 11.76 23 12.40
56 and above Years 7 6.93 5 14.71 9 17.65 21 11.30
Total 101 100 34 100 51 100 186 100
Education Level (n=186)
Primary and below 47 46.53 10 29.41 20 39.22 77 41.40
Secondary School 18 17.82 4 11.76 8 15.69 30 16.12
College/Diploma 1 0.99 5 14.71 4 7.84 10 5.38
Vocational Training 26 25.74 5 14.71 8 15.69 39 20.43
University 9 9.91 10 29.41 11 21.50 30 16.1
Total 101 100 34 100 51 100 186 100
Marital Status (n=186)
Single 39 38.61 7 20.59 12 23.53 58 31.20
Married 47 46.53 22 64.71 29 56.86 98 52.70
Separated 8 7.92 2 5.88 5 9.80 15 8.11
Divorced 5 4.95 1 2.94 4 7.84 10 5.40
Widowed 1 0.99 2 5.88 1 1.96 4 2.15
Cohabiting 1 0.99 0 0 0 0 1 0.53
Total 101 100 34 100 51 100 186 100
Family Income Level
(n=186)
Less Than 50,000 37 36.60 25 73.53 33 64.71 95 51.40
50,001 - 100,000 14 13.86 8 23.53 14 27.45 36 19.51
100,001-200,000 3 2.97 0 0 0 0 3 1.61
200,001 - 300,000 1 0.99 0 0 0 0 1 0.5
300,001 or More 1 0.99 0 0 1 1.96 2 1.08
Refused to say 46 45.54 0 0 3 5.88 49 26.34
Total 101 100 34 100 51 100 186 100
Time Since Injury (n=186)
<5 years 76 75.25 24 70.59 42 82.35 142 76.34
6-15 years 21 20.79 8 10.89 8 15.69 37 19.90
>15 years 4 3.96 2 5.88 1 1.96 7 3.80
Total 101 100 34 100 51 100 186 100
SOURCE: Primary data
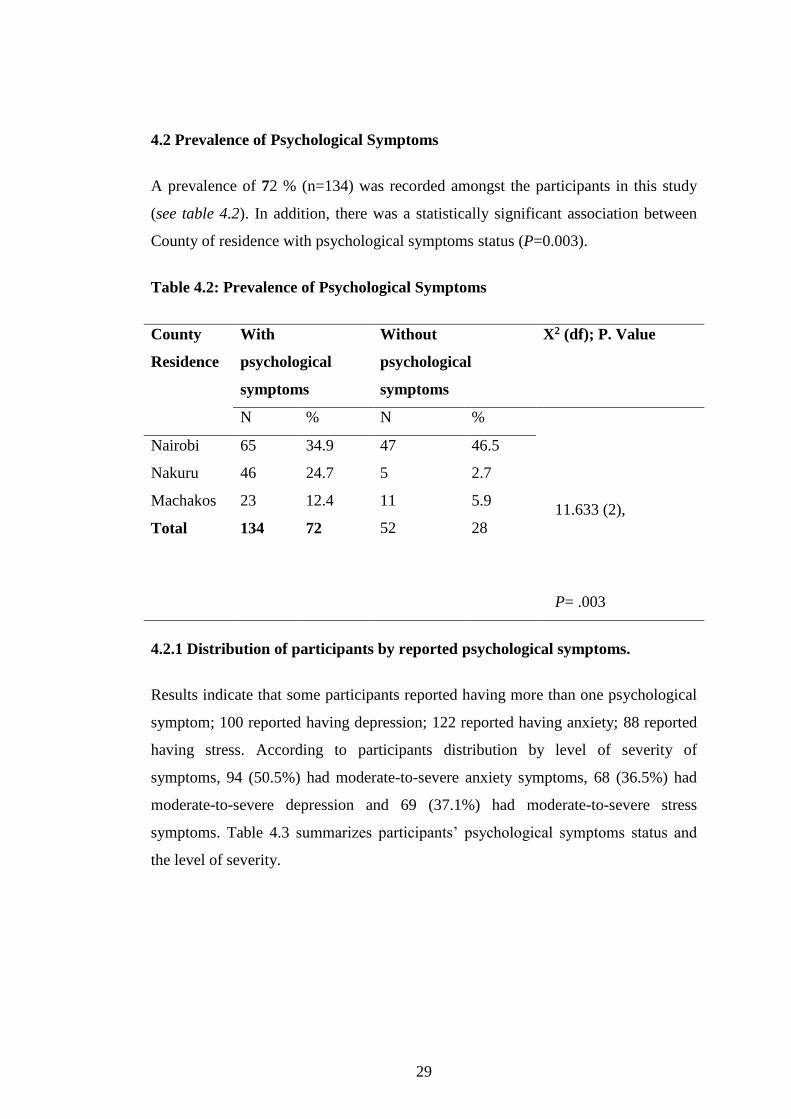
29
4.2 Prevalence of Psychological Symptoms
A prevalence of 72 % (n=134) was recorded amongst the participants in this study
(see table 4.2). In addition, there was a statistically significant association between
County of residence with psychological symptoms status (P=0.003).
Table 4.2: Prevalence of Psychological Symptoms
County
Residence
With
psychological
symptoms
Without
psychological
symptoms
X2 (df); P. Value
N % N %
11.633 (2),
P= .003
Nairobi 65 34.9 47 46.5
Nakuru 46 24.7 5 2.7
Machakos 23 12.4 11 5.9
Total 134 72 52 28
4.2.1 Distribution of participants by reported psychological symptoms.
Results indicate that some participants reported having more than one psychological
symptom; 100 reported having depression; 122 reported having anxiety; 88 reported
having stress. According to participants distribution by level of severity of
symptoms, 94 (50.5%) had moderate-to-severe anxiety symptoms, 68 (36.5%) had
moderate-to-severe depression and 69 (37.1%) had moderate-to-severe stress
symptoms. Table 4.3 summarizes participants’ psychological symptoms status and
the level of severity.
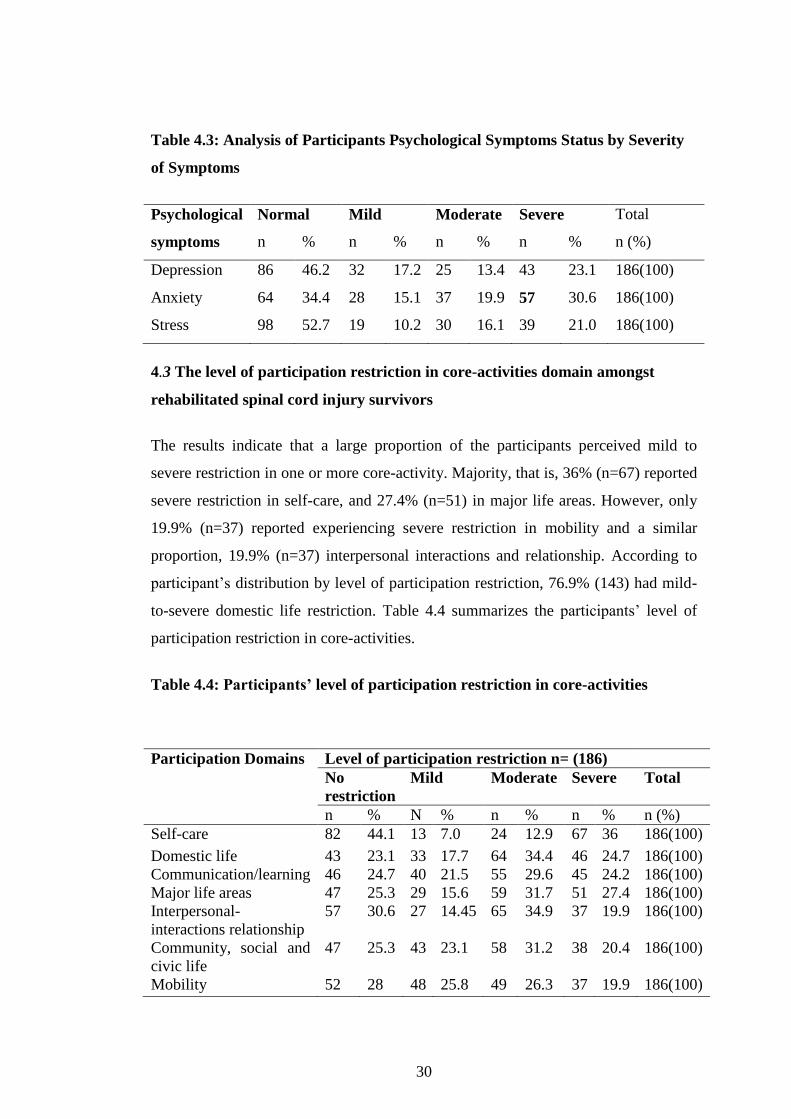
30
Table 4.3: Analysis of Participants Psychological Symptoms Status by Severity
of Symptoms
Psychological
symptoms
Normal Mild Moderate Severe Total
n % n % n % n % n (%)
Depression 86 46.2 32 17.2 25 13.4 43 23.1 186(100)
Anxiety 64 34.4 28 15.1 37 19.9 57 30.6 186(100)
Stress 98 52.7 19 10.2 30 16.1 39 21.0 186(100)
4.3 The level of participation restriction in core-activities domain amongst
rehabilitated spinal cord injury survivors
The results indicate that a large proportion of the participants perceived mild to
severe restriction in one or more core-activity. Majority, that is, 36% (n=67) reported
severe restriction in self-care, and 27.4% (n=51) in major life areas. However, only
19.9% (n=37) reported experiencing severe restriction in mobility and a similar
proportion, 19.9% (n=37) interpersonal interactions and relationship. According to
participant’s distribution by level of participation restriction, 76.9% (143) had mild-
to-severe domestic life restriction. Table 4.4 summarizes the participants’ level of
participation restriction in core-activities.
Table 4.4: Participants’ level of participation restriction in core-activities
Participation Domains
Level of participation restriction n= (186)
No
restriction
Mild Moderate Severe Total
n % N % n % n % n (%)
Self-care 82 44.1 13 7.0 24 12.9 67 36 186(100)
Domestic life 43 23.1 33 17.7 64 34.4 46 24.7 186(100)
Communication/learning 46 24.7 40 21.5 55 29.6 45 24.2 186(100)
Major life areas 47 25.3 29 15.6 59 31.7 51 27.4 186(100)
Interpersonal-
interactions relationship
57 30.6 27 14.45 65 34.9 37 19.9 186(100)
Community, social and
civic life
47 25.3 43 23.1 58 31.2 38 20.4 186(100)
Mobility 52 28 48 25.8 49 26.3 37 19.9 186(100)
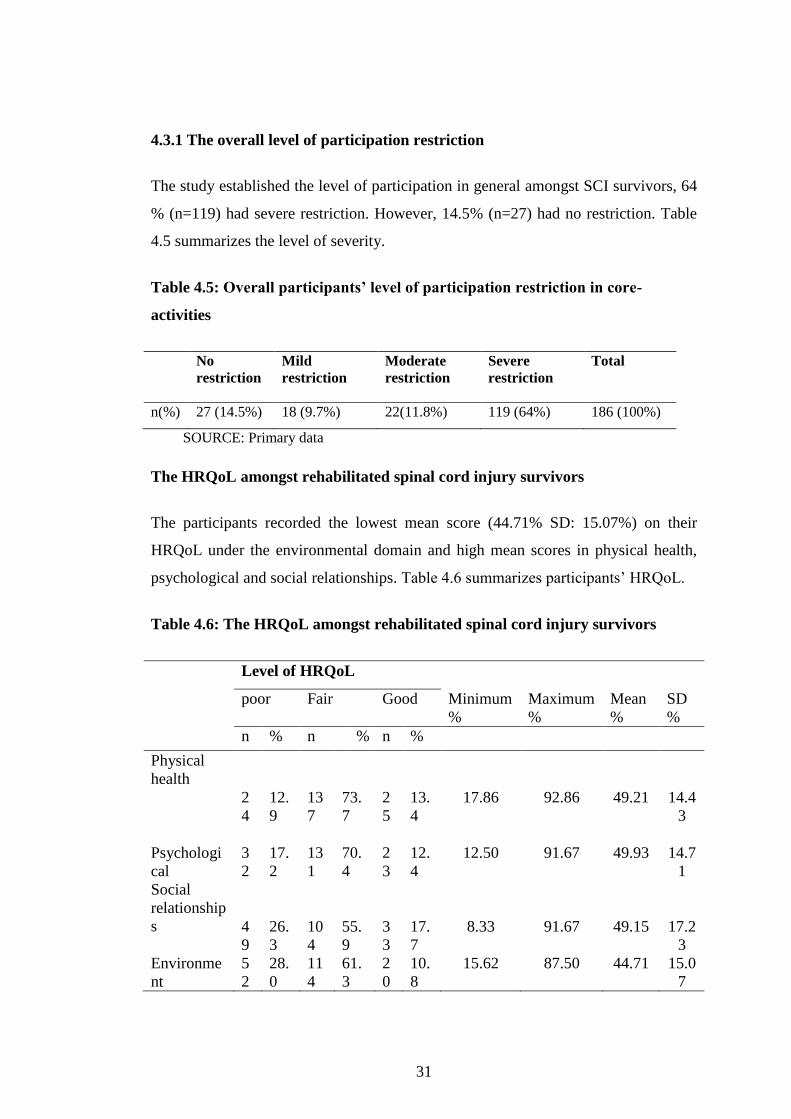
31
4.3.1 The overall level of participation restriction
The study established the level of participation in general amongst SCI survivors, 64
% (n=119) had severe restriction. However, 14.5% (n=27) had no restriction. Table
4.5 summarizes the level of severity.
Table 4.5: Overall participants’ level of participation restriction in core-
activities
No
restriction
Mild
restriction
Moderate
restriction
Severe
restriction
Total
n(%) 27 (14.5%) 18 (9.7%) 22(11.8%) 119 (64%) 186 (100%)
SOURCE: Primary data
The HRQoL amongst rehabilitated spinal cord injury survivors
The participants recorded the lowest mean score (44.71% SD: 15.07%) on their
HRQoL under the environmental domain and high mean scores in physical health,
psychological and social relationships. Table 4.6 summarizes participants’ HRQoL.
Table 4.6: The HRQoL amongst rehabilitated spinal cord injury survivors
Level of HRQoL
poor Fair Good Minimum
%
Maximum
%
Mean
%
SD
%
n % n % n %
Physical
health
2
4
12.
9
13
7
73.
7
2
5
13.
4
17.86
92.86
49.21
14.4
3
Psychologi
cal
3
2
17.
2
13
1
70.
4
2
3
12.
4
12.50 91.67 49.93 14.7
1
Social
relationship
s
4
9
26.
3
10
4
55.
9
3
3
17.
7
8.33
91.67
49.15
17.2
3
Environme
nt
5
2
28.
0
11
4
61.
3
2
0
10.
8
15.62 87.50 44.71 15.0
7
32
4.5 Association between Psychological Symptoms Status (as an independent
variable) and Participation and HRQoL (as dependent variables)
Results show there was a statistically significant difference between groups as
determined by one-way ANOVA of Psychological symptoms status and physical
health (F (2,183) =5.017, P<.008) and, self-care (F(2,183)=8.708, P<.000 ) (See
Table 4.7)).
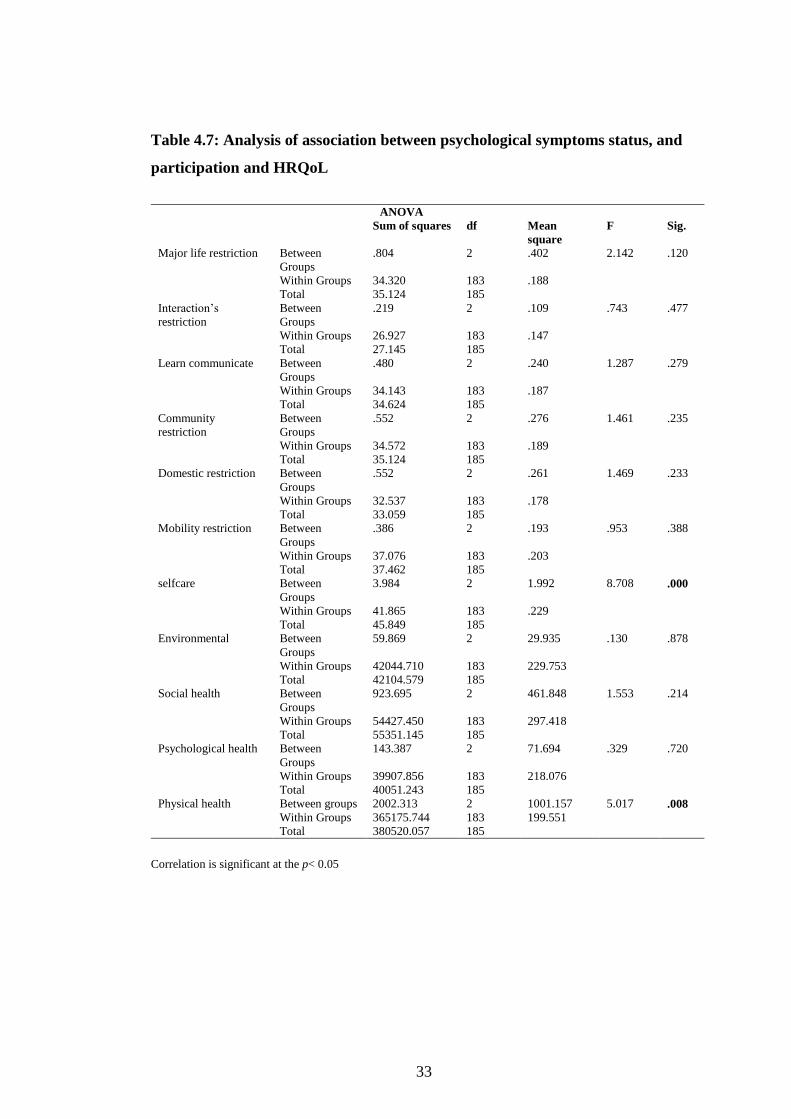
33
Table 4.7: Analysis of association between psychological symptoms status, and
participation and HRQoL
ANOVA
Sum of squares df Mean
square
F Sig.
Major life restriction Between
Groups
.804 2 .402 2.142 .120
Within Groups 34.320 183 .188
Total 35.124 185
Interaction’s
restriction
Between
Groups
.219 2 .109 .743 .477
Within Groups 26.927 183 .147
Total 27.145 185
Learn communicate Between
Groups
.480 2 .240 1.287 .279
Within Groups 34.143 183 .187
Total 34.624 185
Community
restriction
Between
Groups
.552 2 .276 1.461 .235
Within Groups 34.572 183 .189
Total 35.124 185
Domestic restriction Between
Groups
.552 2 .261 1.469 .233
Within Groups 32.537 183 .178
Total 33.059 185
Mobility restriction Between
Groups
.386 2 .193 .953 .388
Within Groups 37.076 183 .203
Total 37.462 185
selfcare Between
Groups
3.984 2 1.992 8.708 .000
Within Groups 41.865 183 .229
Total 45.849 185
Environmental Between
Groups
59.869 2 29.935 .130 .878
Within Groups 42044.710 183 229.753
Total 42104.579 185
Social health Between
Groups
923.695 2 461.848 1.553 .214
Within Groups 54427.450 183 297.418
Total 55351.145 185
Psychological health Between
Groups
143.387 2 71.694 .329 .720
Within Groups 39907.856 183 218.076
Total 40051.243 185
Physical health Between groups 2002.313 2 1001.157 5.017 .008
Within Groups 365175.744 183 199.551
Total 380520.057 185
Correlation is significant at the p< 0.05
34
CHAPTER FIVE
DISCUSSION
5.1 Prevalence of Psychological Symptoms amongst SCI Survivors
Psychological symptoms are a common problem amongst SCI survivors living in the
community. Our study results are consistent with recent findings by WHO (2017),
that some people with SCI experience psychological symptoms simultaneously
(comorbidity). Overall, the current study established that up to 72% of SCI
participants reported having psychological symptoms. The present study finding is
lower than the 92% prevalence (anxiety, depression and stress combined) reported in
an Australian study (Migliorini et al., 2009). The difference in the prevalence
between the two studies could be explained by the differences between the average
ages of the samples who participated in the two studies. In the present study the
mean age range was 26-35 years whilst that of the Australia was 50.4 years which is
higher. According to WHO (2017); Jokela, Batty and Kivimäki (2013), the
prevalence of psychological symptoms increases with age. In the general population
studies the majority of mental health conditions affect older individuals (WHO
2017). Therefore, older SCI survivors may be at a higher risk for poor mental health.
In addition, the difference between the two studies could be explained by the
differences between the two countries population literacy profiles, that is, Australia
being a developed country the literacy level may be higher than in Kenya as a
developing country therefore the Australian could have not let anything to chance.
This also implies there may have been socio-economic differences between people
with SCI in both countries.
In the current study, a 53.3% prevalence of depression symptoms was reported
amongst the 186 SCI survivors who participated. Similar to these findings, was in the
Krause, Kemp and Coker (2000) study in the USA and Khazaeipour, Taheri-
Otaghsara and Naghdi (2015)in Iran who reported 48% and 49.3% prevalence of
depression respectively. However, the current study finding is lower than the 63.9%
and 74.1% prevalence of depression reported in studies conducted in Korea (Shin et
al., 2012) and Iraq (Al-Abbudi et al., 2017) respectively. Several dimensions may
35
help explain differences in the prevalence rates of psychological symptoms between
the current study and those conducted in Korea and Iraq. To begin with, the fact that
the Kenyan study participants were in community settings while the Korea and Iraq
samples were in-patients. Hospitalization impacts on individuals’ normal social and
economic activities and also their ability to fulfill family roles. Besides, differences
in the duration since SCI between the present study and those conducted in other
countries (Korea and Iraq) may also explain the differences in the prevalence of
psychological symptoms. The observed decrease in prevalence for psychological
symptoms seen between people with SCI dwelling in community settings and in-
patient is in line with Saunders, Krause and Focht (2012) reported 20.6% prevalence
of depression among in-patients that dropped to 18% five (5) years after reintegration
into the community setting.
Further, the current study shows that 65.6% of SCI survivors suffer from anxiety,
while half (53.3%) suffer depression and nearly an equal proportion (47.3%) suffer
from stress. In contrast, Migliorini, New and Tonge (2009) found a lower prevalence
of depression (37%), anxiety (30%), and stress (25%) in a cross-sectional Australian
community study. Perhaps the present study results could be a function of contextual
differences between Kenya and Australia; Kenya is a developing country with higher
poverty and low access to social security and supportive/ assistive technologies while
Australia is a developed country with higher per capita GDP and increased access to
social security, welfare compensation and supportive/ assistive technologies.
However, a previous study estimate of psychological symptoms; specifically,
depression diagnosis after SCI ranged between 18.7% and 26.3% with a mean of
22.2% (Williams & Murray, 2015). Coincidentally, Williams and Murray (2015)
values are higher than those of the general population’s estimate of 7.3% for anxiety
(Baxter et al., 2013) and 4.7% for major depression globally (Baxter et al., 2013).
Depression is a major psychiatric condition of public health concern worldwide that
not only affects patients but the society at large (Riolo et al., 2005; Üstün et al.,
2004; Elliott & Frank, 1996). According to WHO (2017) depression is ranked as the
single largest contributor of disability among young adults, with an estimated 7.5%
of the years lost to disability (YLDs). Additionally, depression is the leading
36
contributor of the global burden of disease as per Disability-adjusted Life Years
(DALYs), (WHO, 2017). Previous studies have also identified depression as the
most common psychological symptom post SCI (Craig, Tran & Middleton, 2009;
Elliott & Frank, 1996). Depression not only affects individual’s level of functioning
and HRQoL but also increases the risk of: somatic health conditions such as
cardiovascular disease, stroke, diabetes, ability to void, erectile dysfunction and lack
of libido (Lee et al., 2016; Penninx et al., 2013). Moreover, it increases the risk for
substance abuse and suicidal tendencies (Khazaeipour, Taheri-Otaghsara & Naghdi,
2015; Khazaeipour et al., 2014; Middleton et al., 2014; Lidal et al., 2008). This
implies that SCI survivors are at high risk of poor mental health and participation
restriction in the community. Therefore, there is an implication for mental health
services for SCI patients that combine initial screening, follow-up screening,
prevention and management for psychological symptoms.
5.2 Level of participation in core-activities amongst rehabilitated SCI survivors
The current study established that most SCI survivors experience restrictions in one
or more core activity domains. Similar results were reported by Gross-Hemmi et al.
(2019) and Lund et al. (2005) that most SCI victims experience restrictions in two or
more core activities of daily living. However, while in the current study most
participants were restricted in self-care activity, Lund et al. (2005) reported SCI
survivors’ restriction in: social support, exercise (issues pertaining to outdoor
activities) and gardening while Gross-Hemmi et al. (2019) reported that their sample
was highly restricted in major life areas domain. The variance in results between the
present study finding and those of Lund et al. (2005) and (Gross-Hemmi et al., 2019)
could be attributed to differences in the study contexts and intruments used. In
Sweden, there are universal welfare homecare services that are offered both privately
or publicly for Swedish disabled and the aged (Szebehely & Trydegård, 2012). With
fewer resources for the public facility, as is the case in Kenya this may lead to
compromised care. Additionally, while participants in the current study lived largely
in a high HPI context, the Gross-Hemmi et al. (2019) and Lund et al. (2005) studies
were conducted in Switzerland and Sweden which are developed (middle income)
countries with low HPI. According to Gross-Hemmi et al. (2019) most of the
37
participants had secondary education and below. Higher education is a determinant
for a better lifestyle, stable job and better neighborhood (Solheim & Leiulfsrud 2018
; Tasiemski et al. 2005).
The WHO (2007) international classification of functioning, disability and health
(ICF), describes participation as a function of an interplay of both environment
(societal attitude, buildings, roads, transportation) and personal factors (education
and income). In this context, the current study also established that most participants
experienced participation restriction in major life areas (education, work). In
contrast, Suttiwong et al. (2015) in Thailand and Paul et al. (2013) in New Zealand
reported that most SCI people retained or progressed in their career status. This
difference could be attributed to the fact that majority of those in New Zealand were
in paid employment and some were entitled to Accident Compensation while a
higher number of Kenyan SCI participants were lowly educated, unemployed and/or
had no compensation. More importantly, 88.5% participants with SCI in the Thailand
study had secondary education level and above (Suttiwong et al., 2015) while 41.4 %
of those in the present study had primary level of education and below. The young
men with low education compared to women are more likely to engage in higher-risk
socio-economic activities that may result in SCI. Ahmed et al. (2018) recent research
findings supports the view that, in low income settings, men compared to women
were 2 times more likely to engage in high risk occupations. Consequently, their low
economic status and non-existent social-security expose them to participation
restriction compared to people with SCI in developed countries who may have
functional social security arrangements. This implies that in communities with
extreme marginalization, people with SCI are most likely to live in severe poverty
which further lowers the potential to participate in core-activities of daily living.
Poverty impairs access to appropriate insurance for work-related injuries. In addition,
poverty has implications on rehabilitation outcomes including the potential of
persons with SCI performance after re-integration. Therefore, an implication for
policy on social protection which targets at risk populations to ensure they undergo
comprehensive rehabilitation including vocational rehabilitation into productive
functioning and coping strategies post SCI to safeguard individuals’ HRQoL.
38
5.3 Health-related quality of life amongst rehabilitated SCI survivors
It is clear from the current study that SCI survivors experience a lower quality of life
after reintegration. The current study found that participants experienced a poorer
HRQoL under the environmental domain similar to SCI participants in a Brazilian
study Øderud (2014). These findings are similar for Kenya and Brazil, under the
environmental domain (leisure, housing, health services, transportation and
education were assessed), this largely depends on an individual’s financial status,
which in Kenya could be lower. Other studies present contrasting results. In
particular, Gurcay et al. (2010) using the same tool in Turkey, found that SCI
survivors had low HRQoL under the physical health domain. Further, in Greece,
Tzanos et al. (2016) reported SCI survivors experienced better HRQoL in the
environmental domain as compared to other domains (psychological wellbeing,
physical capacity and social relationship). The different results could be explained by
the differences in the contexts where the studies were conducted where Kenya and
Greece are a lower middle-income country with: low literacy, less infrastructure and
technological resources as compared to Turkey that is a developed country with
higher literacy levels, superior infrastructure and supportive technologies. Moreover,
the current study was conducted in a community setting while the study by Gurcay et
al. (2010) was in a hospital setting. In rural areas challenges pertaining to HRQoL
can be attributed to geographical and financial inaccessibility of daily needs. As used
in this present study, the ability to meet daily needs is supported by the
geographically and financially accessibility to the individuals in need. To some
extent, this has implications for a social security package to forestall decline in
HRQoL of people with SCI. Also, there is an implication for policy on infrastructure
in Kenya to integrate universal design as is internationally recognized, to increase
accessibility in built environments and transportation for people with disabilities.
Thailand is an example where the government has provided a ministerial regulation
under vehicle licensing that supports the use of advanced assistive devices for the
disabled. Locally, the adoption of universal design has a high likelihood to improve
SCI survivors HRQoL by promoting more opportunities for socio-economic
activities (Kovindha, 2017).
39
5.4 Association between psychological symptoms status and participation and
HRQoL
Psychological symptoms have an effect on participation in core activities and
HRQoL led by SCI survivors. The results of the present study showed that there was
a significant association between psychological symptoms status and SCI survivors’
participation in self-care. This is similar to previous research reports that showed that
(in)ability to self-care was strongly influenced by psychological status (Munce et al.,
2014; Claudia, Vignola & Marcassa, 2014; Coura et al., 2013). However, low
education may limit chances of employment leading to individuals experiencing
financial constraints and poor HRQoL. Financial constraints may affect access to
vital information and resources that have implications on their performance of core-
activities of daily living or overall wellbeing. According to Khazaeipour et al. (2014)
a productive lifestyle positively impacts SCI survivors' psychological wellbeing thus
improve their overall HRQoL. Therefore, this highlights the need for rehabilitation
professionals to consider individuals with SCI psychological symptom status as an
important clinical aspect during the rehabilitation process and follow up. Moreover,
there is implication for innovation of assistive devices and focused use of modern-
day technologies to improve the functional capacity of people with SCI. There is also
an implication for rehabilitation guidelines to emphasize acquisition by people with
SCI of culturally appropriate social roles acquisition by individuals living with SCI.
This has the potential to guide their behavior through understanding.
40
CHAPTER SIX
SUMMARY, CONCLUSIONS RECOMMENDATIONS AND LIMITATIONS
6.1 Summary
In summary, while 3 out of 4 SCI survivors suffer psychological symptoms, it is
apparent that poor young male adults with low education are the most at risk of
sustaining SCI. It is also clear that most people with SCI suffer psychological
symptoms with anxiety as the most common. The magnitude of psychological
symptoms is higher than that of the general population reported globally which raises
public health concern.
It is expected that after community reintegration SCI survivors engage in core
activities of daily life (major life areas, learning and applying knowledge, mobility,
self-care, communication, domestic life, interpersonal interactions and relationships,
and community, social and civic life). However, in this study, SCI survivors
experienced participation restrictions in several core activities with self-care
presenting as the most challenging. By extension, this implies that functional
performance in self-care should be a key focus of rehabilitation and should
incorporate social support, family members and environment adaptation.
Whereas, physical health, psychological, social relationship and the environment are
very important variables that affect ones’ HRQoL, in the present study people with
SCI presented with low HRQoL attributed to the environment. The results showed
that psychological symptoms status is significantly associated with both the SCI
survivors’ physical health aspect of HRQoL and participation self-care. Hence, there
is implication for mental health services to forestall decline physical health aspect of
HRQoL. In addition, there is implication for a national prospective study to screen
SCI survivors for psychological symptoms.
6.2 Conclusion
In conclusion, the current study shows that more than 3 out of 4 (72%) SCI survivors
suffered from psychological symptoms. The current study shows that poor young
41
adult males with low education are the most at risk of SCI. In addition, SCI survivors
experience a decrease in participation in all core activities of daily life with self-care
being the domain they feel most often restricted. It was also apparent that SCI
survivors live a low HRQoL mainly in their environments. The study further shows
that psychological symptoms greatly impact SCI survivors’ HRQoL and
participation in core activities of daily living, particularly the self-care and physical
health domains. These results would certainly contribute to health policies more
specifically on the kind and quality of care provided to people living with SCI to
improve their overall wellbeing. The results form a suitable baseline for
Physiotherapists and other stakeholders to design suitable programs that have
potential to improve SCI survivors’ participation in core activities, HRQoL and
lessen psychological symptoms after reintegration in community settings. A national
burden of psychological symptoms, interventional studies on the treatment of
psychological symptoms and the impact on HRQoL amongst SCI survivors is
worthwhile. A longitudinal study is recommended to explore a periodical change of
psychological symptoms, participation in core-activities and health-related quality of
life amongst SCI survivors.
6.3 Recommendations
Based on the findings of this study, the following recommendations are made.
A. Practice: In order to lower and manage psychological symptoms there need
to:
Integrate mental health services in rehabilitation for SCI survivor’s
Capacity training of rehabilitation professionals on mental health
principles for rehabilitation of SCI survivor's way of life
to minimize participation restriction and improve HRQoL
Provision of assistive devices matched to need of persons with SCI.
B. Policy: In order to facilitate SCI survivors’ participation, the researcher
recommends:
C. Environmental design and adaptationsFurther research:
42
Establish a national database of SCI survivors and their profiles with regard
to participation in core activity domains and well-being.
National prospective study to measure SCI survivor’s mental health.
6.4 Limitation
The study had some limitations; first, the purposive sampling technique was used to
reach participants whose results cannot be generalized to the general population.
Secondly, individuals with a history of psychological symptoms prior to SCI were
not excluded from the study. Thirdly, methodologically those who were not
contacted due to the sampling method used might have a different experience.
43
REFERENCES
Ahmed, N., Quadir, M. M., Rahman, M. A., & Alamgir, H. (2018). Community
integration and life satisfaction among individuals with spinal cord injury living
in the community after receiving institutional care in Bangladesh. Disability and
Rehabilitation, 40(9), 1033–1040.
Al-Abbudi, R., Joodah, S., Ezzat, I., Khalida, Abdelilah Zebala, A., Jameel Hamdy,
D., Joda Al Beedany, M. S., & Shalal Farhan, M. (2017). Prevalence and
Determinants of Depression Among Traumatic Spinal Cord Injured Patients
Attending Ibn-Al-Quff Hospital, Baghdad, Iraq. Journal of Psychiatry, 20(6).
Aldersey, H., Morshedul Quadir, M., Akter, S., Mozumder, R. H., Nazneen, N., &
Nuri, R. P. (2018). Barriers and facilitators for wheelchair users in bangladesh:
A participatory action research project. Disability, CBR and Inclusive
Development, 29(2), 24–44.
Amsters, D., Schuurs, S., Pershouse, K., Power, B., Harestad, Y., Kendall, M., &
Kuipers, P. (2016). Factors Which Facilitate or Impede Interpersonal
Interactions and Relationships after Spinal Cord Injury: A Scoping Review with
Suggestions for Rehabilitation. Rehabilitation Research and Practice, 2016, 1–
Anderson, K. D., Borisoff, J. F., Johnson, R. D., Stiens, S. A., & Elliott, S. L. (2007).
The impact of spinal cord injury on sexual function: Concerns of the general
population. Spinal Cord, 45(5), 328–337. https://doi.org/10.1038/sj.sc.3101977
Anderson, Krajci, K. A., & Vogel, L. (2003). Community integration among adults
with spinal cord injuries sustained as children or adolescents. Developmental
44
Medicine and Child Neurology, 45, 129–134.
Anderson, & Vogel, L. C. (2002). Employment outcomes of adults who sustained
spinal cord injuries as children or adolescents. Archives of Physical Medicine
and Rehabilitation, 83(6), 791–801.
Andresen, S. R., Hagen, E. M., Nielsen, J. F., Bach, F. W., & Finnerup, N. B. (2016).
Pain , spasticity and quality of life in individuals with traumatic spinal cord
injury in Denmark. Nature Publishing Group, 54(11), 973–979.
Arango-Lasprilla, J. C., Ketchumb, M Jessica Starkweather, A., Nichollsa, E., &
Wilkb, R. A. (2011). Factors predicting depression among persons with spinal
cord injury 1 to 5 years post injury. 29(1), 247–253.
Augutis, M., & Anderson, C. J. (2012). Coping strategies recalled by young adults
who sustained a spinal cord injury during adolescence. Pinal Cord, 50(3), 213,
50(3), 213–219.
Barker, R. N., Amsters, D. I., Pershouse, K. J., Haines, T. P., & Kuipers, P. (2009).
The relationship between quality of life and disability across the lifespan for
people with spinal cord injury. 149–155.
Baxter, A. J., Scott, K. M., Vos, T., & Whiteford, H. A. (2013). Global prevalence of
anxiety disorders: A systematic review and meta-regression. Psychological
Medicine, 43(5), 897–910.
Blauwet, C., Sudhakar, S., Doherty, A. L., Garshick, E., Zafonte, R., & Morse, L. R.
(2013). Participation in organized sports is positively associated with
45
employment in adults with spinal cord injury. American Journal of Physical
Medicine and Rehabilitation, 92(5), 393–401.
Bonomi, A. E., Patrick, D. L., Bushnell, D. M., & Martin, M. (2000). Validation of
the United States’ version of the World Health Organization Quality of Life
(WHOQOL) instrument. Journal of Clinical Epidemiology, 53(1), 1–12.
Braaf, S., Lennox, A., Nunn, A., & Gabbe, B. (2017). Social activity and relationship
changes experienced by people with bowel and bladder dysfunction following
spinal cord injury. Spinal Cord, 55(7), 679–686.
Carpenter, C., Forwell, S. J., Jongbloed, L. E., & Backman, C. L. (2007).
Community Participation After Spinal Cord Injury. Archives of Physical
Medicine and Rehabilitation, 88(4), 427–433.
Carr, J. J., Kendall, M. B., Amsters, D. I., Pershouse, K. J., Kuipers, P., Buettner, P.,
& Barker, R. N. (2017). Community participation for individuals with spinal
cord injury living in Queensland, Australia. Spinal Cord, 55(2), 192–197.
Chang, F. H., Wang, Y. H., Jang, Y., & Wang, C. W. (2012). Factors associated with
quality of life among people with spinal cord injury: Application of the
international classification of functioning, disability and health model. Archives
of Physical Medicine and Rehabilitation, 93(12), 2264–2270.
Chiu, W. T., Huang, S. J., Hwang, H. F., Tsauo, J. Y., Chen, C. F., Tsai, S. H., &
Lin, M. R. (2006). Use of the WHOQOL-BREF for evaluating persons with
traumatic brain injury. Journal of Neurotrauma, 23(11), 1609–1620.
46
Claudia, R., Vignola, B., & Marcassa, A. (2014). Adaptation and validation of the
depression , anxiety and stress scale ( DASS ) to Brazilian Portuguese. 155,
104–109.
Conroy, L., & McKenna, K. (1999). Vocational outcome following spinal cord
injury. Spinal Cord, 37(9), 624–633.
Coura, S., Enders, C., França, S. X. De, Kluczynik, N., Evelin, C., Dantas, A.,
Nayara, D., Menezes, C. De, Jessyca, D., & Paulo, S. (2013). Ability for self-
care and its association.
Craig, A., Tran, Y., & Middleton, J. (2009). Psychological morbidity and spinal cord
injury: A systematic review. Spinal Cord, 47(2), 108–114.
Craig, Ashley, Tran, Y., Siddall, P., Wijesuriya, N., Lovas, J., Bartrop, R., &
Middleton, J. (2013). Developing a model of associations between chronic pain,
depressive mood, chronic fatigue, and self-efficacy in people with spinal cord
injury. Journal of Pain, 14(9), 911–920.
Devaki, S., & Maheswari, K. K. (2011). Quality of life among women entrepreneurs
in Trichy. IOSR Journal Of Humanities And Social Science (IOSR-JHSS), 60–
62. Retrieved from http://www.iosrjournals.org/iosr-jhss/papers/Conf.17004
/Volume-2/12. 60-62.pdf
DeVivo, M. J., & Fine, P. R. (1985). Spinal cord injury: Its short-term impact on
marital status. Archives of Physical Medicine and Rehabilitation, 66(8), 501–
504.
47
DeVivo, M. J., Hawkins, L. V. N., Richards, J. S., & Go, B. K. (1995). Outcomes of
post-spinal cord injury marriages. Archives of Physical Medicine and
Rehabilitation, 76(2), 130–138.
Draulans, N., Kiekens, C., Roels, E., & Peers, K. (2011). Etiology of spinal cord
injuries in Sub-Saharan Africa. Spinal Cord, 49(12), 1148–1154.
Dziuban, C. D., & Shirkey, E. C. (1974). On the Psychometric Assessment of
Correlation Matrices. American Educational Research Journal, 11(2), 211–216.
Elliott, T. R., & Frank, R. G. (1996). Depression following spinal cord injury. Arch
Phys Med Rehabil, 77(0003-9993 (Print)), 816–823.
Fann, J. R., Bombardier, C. H., Richards, J. S., Tate, D. G., Wilson, C. S., & Temkin,
N. (2011). Depression after spinal cord injury: Comorbidities, mental health
service use, and adequacy of treatment. Archives of Physical Medicine and
Rehabilitation, 92(3), 352–360.
Ferrari, A. J., Charlson, F. J., Norman, R. E., Patten, S. B., Freedman, G., Murray, C.
J. L., Vos, T., & Whiteford, H. A. (2013). Burden of Depressive Disorders by
Country, Sex, Age, and Year: Findings from the Global Burden of Disease
Study 2010. PLoS Medicine, 10(11).
Finnerup, N. B., Jensen, M. P., Norrbrink, C., Trok, K., Johannesen, I. L., Jensen, T.
S., & Werhagen, L. (2016). A prospective study of pain and psychological
functioning following traumatic spinal cord injury. Spinal Cord, 54(10), 816–
821.
48
Fliess-douer, O., Vanlandewijck, Y. C., Post, M. W. M., Woude, L. H. V. Van Der,
& Groot, S. De. (2013). Wheelchair skills performance between discharge and
one year after inpatient rehabilitation in hand-rim wheelchair users with spinal
cord injury. 553–559.
Frankel, H. L., Coll, J. R., Charlifue, S. W., Whiteneck, G. G., Gardner, B. P.,
Jamous, M. A., Krishnan, K. R., Nuseibeh, I., Savic, G., & Sett, P. (1998).
Long-term survival in spinal cord injury: A fifty year investigation. Spinal
Cord, 36(4), 266–274.
Gagnon, D., Nadeau, S., Gravel, D., Noreau, L., Larivière, C., & McFadyen, B.
(2005). Movement patterns and muscular demands during posterior transfers
toward an elevated surface in individuals with spinal cord injury. Spinal Cord,
43(2), 74–84.
Ganesh, S., & Mishra, C. (2016). Physical Activity and Quality of Life among
Adults with Paraplegia in Odisha, India. Sultan Qaboos University Medical
Journal, 16(1), e54-61.
Gliem, J. a, & Gliem, R. R. (2003). Calculating, Interpreting, and Reporting
Cronbach’s Alpha Reliability Coefficient for Likert-Type Scales,. 2003 Midwest
Research to Practice Conference in Adult, Continuing, and Community
Education, 1992, 82–88.
GOK, & UNDP. (2009). Kenya National Human Development Report. 150.
Gross-Hemmi, M. H., Post, M. W. M., Bienert, S., Chamberlain, J. D., Hug, K.,
49
Jordan, X., Scheel-Sailer, A., Weiss, A., Brinkhof, M. W. G., Léger, B.,
Baumberger, M., Peter Gmünder, H., Curt, A., Schubert, M., Hund-Georgiadis,
M., Troger, T., Joggi, D., Landolt, H., Münzel, N., … Thyrian, C. (2019).
Participation in People Living With Spinal Cord Injury in Switzerland: Degree
and Associated Factors. Archives of Physical Medicine and Rehabilitation.
Gurcay, E., Bal, A., Eksioglu, E., & Cakci, A. (2010). Quality of life in patients with
spinal cord injury. International Journal of Rehabilitation Research, 33(4),
356–358.
Hanson, C. S., Nabavi, D., & Yuen, H. K. (2001). Forty-eight participants were
recruited from a camp for persons with physical disabilities as well as from SCI
support groups. Participants were divided into groups of athletes (. American
Journal of Occupational Therapy, 55(3), 332–338.
Henry, J. D., & Crawford, J. R. (2005). The short-form version of the Depression
anxiety stress scales (DASS-21): Construct validity and normative data in a
large non-clinical sample. British Journal of Clinical Psychology, 44(2), 227–
239.
Hicken, B. L., Putzke, J. D., Novack, T., Sherer, M., & Richards, J. S. (2002). Life
satisfaction following spinal cord and traumatic brain injury: a comparative
study. Journal of Rehabilitation Research and Development, 39(3), 359–365.
Retrieved from http://www.ncbi.nlm.nih.gov/pubmed/12173756
Hilton, G., Unsworth, C. A., Murphy, G. C., Browne, M., & Olver, J. (2017).
Longitudinal employment outcomes of an early intervention vocational
50
rehabilitation service for people admitted to rehabilitation with a traumatic
spinal cord injury. Nature Publishing Group, 55(8), 743–752.
Hirsch, S., & Wallace, P. (1996). A Prospective Care Setting F ______. Psychiatry:
Interpersonal and Biological Processes, August, 1050–1059.
Hoffman, J. M., Bombardier, C. H., Graves, D. E., Kalpakjian, C. Z., & Krause, J. S.
(2011). A longitudinal study of depression from 1 to 5 years after spinal cord
injury. Archives of Physical Medicine and Rehabilitation, 92(3), 411–418.
Inskip, J. A., Lucci, V. E. M., McGrath, M. S., Willms, R., & Claydon, V. E. (2018).
A Community Perspective on Bowel Management and Quality of Life after
Spinal Cord Injury: The Influence of Autonomic Dysreflexia. Journal of
Neurotrauma, 35(9), 1091–1105.
Ishak, W. W., Greenberg, J. M., Balayan, K., Kapitanski, N., Jeffrey, J., Fathy, H.,
Fakhry, H., & Rapaport, M. H. (2011). Quality of life: The ultimate outcome
measure of interventions in major depressive disorder. Harvard Review of
Psychiatry, 19(5), 229–239.
Israel, G. D. (1992). Determining Sample Size 1. November, 1–5.
Jang, Y., Hsieh, C. L., Wang, Y. H., & Wu, Y. H. (2004). A validity study of the
WHOQOL-BREF assessment in persons with traumatic spinal cord injury.
Archives of Physical Medicine and Rehabilitation, 85(11), 1890–1895.
Jokela, M., Batty, G. D., & Kivimäki, M. (2013). Ageing and the prevalence and
treatment of mental health problems. Psychological Medicine, 43(10), 2037–
51
2045.
Kago, K. S. (2005). ^ Psychiatric Morbidity and Related Factors in the
Rehabilitation Process of Paraplegics At the National Spinal Injury Hospital in
Nairobi, Kenya. a Dissertation Submitted in Part Fulfilment for the Award of
Master of Medicine (Psychiatry) in the Universi. retrieved from
http://erepository.uonbi.ac.ke/bitstream/handle/11295/25518/KAGUCHIA
SOLOMON KAGO M. MED 2005.pdf?sequence=3&isAllowed=y
Kehn, M., & Kroll, T. (2009). Staying physically active after spinal cord injury: A
qualitative exploration of barriers and facilitators to exercise participation. BMC
Public Health, 9(1), 1–11.
Kennedy, P., & Rogers, B. A. (2000). Anxiety and depression after spinal cord
injury: A longitudinal analysis. Archives of Physical Medicine and
Rehabilitation, 81(7), 932–937.
Kenya National Bureau of Statistics. (2009). The 2009 Kenya Population and
Housing Census. In The 2009 Kenya population and housing census (Vol. 1).
Kenya National Bureau of Statistics.: Vol. IC.
Khazaeipour, Z., Norouzi-Javidan, A., Kaveh, M., Mehrabani, F. K., Kazazi, E., &
Emami-Razavi, S. H. (2014). Psychosocial outcomes following spinal cord
injury in Iran. Journal of Spinal Cord Medicine, 37(3), 338–345.
Khazaeipour, Z., Taheri-Otaghsara, S.-M., & Naghdi, M. (2015). Depression
Following Spinal Cord Injury: Its Relationship to Demographic and
52
Socioeconomic Indicators. Topics in Spinal Cord Injury Rehabilitation, 21(2),
149–155.
Kinyanjui, J. W., & Mulimba, J. A. O. (2016). PATTERN AND OUTCOME OF
SPINAL INJURY AT KENYATTA NATIONAL HOSPITAL Cause of Injury.
East African Orthopaedic Journal, 10(1), 3–6.
Kirshblum, S. C., Biering-Sorensen, F., Betz, R., Burns, S., Donovan, W., Graves, D.
E., & Schmidt-Read, M. (2014). International standards for neurological
classification of spinal cord injury: cases with classification challenges. The
Journal of Spinal Cord Medicine, 37(2), 120–127.
Kovindha, A. (2017). People with spinal cord injury in Thailand. American journal
of physical medicine & rehabilitation. American Journal of Physical Medicine
and Rehabilitation, 96(2), S120–S123.
Kraft, R., & Dorstyn, D. (2015). Psychosocial correlates of depression following
spinal injury : A systematic review. 38(5), 571–583.
Krause, J. S., & Reed, K. S. (2010). Barriers and facilitators to employment after
spinal cord injury : underlying dimensions and their relationship to labor force
participation. Spinal Cord, 49(2), 285–291.
Krause, Kemp, B., & Coker, J. (2000). Depression after spinal cord injury: Relation
to gender, ethnicity, aging, and socioeconomic. Archives of Physical Medicine
and Rehabilitation, 81(8), 1099–1109.
Le, J., & Dorstyn, D. (2016). Anxiety prevalence following spinal cord injury: A
53
meta-analysis. Spinal Cord, 54(8), 570–578. https://doi.org/10.1038/sc.2016.15
Lee, B. B., Cripps, R. A., Fitzharris, M., & Wing, P. C. (2014). The global map for
traumatic spinal cord injury epidemiology : update 2011 , global incidence rate.
February 2013, 110–116.
Lee, Kim, S. W., Jee, S. H., Kim, J. C., Choi, J. B., Cho, S. Y., & Kim, J. H. (2016).
Factors affecting quality of life among spinal cord injury patients in Korea.
International Neurourology Journal, 20(4), 316–320.
Levin, K. A. (2006). Study design III: Cross-sectional studies. Evidence-Based
Dentistry, 7(1), 24–25.
Levins, S. M., Redenbach, D. M., & Dyck, I. (2004). Individual and Societal
Influences on Participation in Physical Activity Following Spinal Cord Injury :
Individual and Societal Influen Physical Therapy, 84(6), 496–509.
Lidal, I. B., Veenstra, M., Hjeltnes, N., & Biering-Sørensen, F. (2008). Health-
related quality of life in persons with long-standing spinal cord injury. Spinal
Cord, 46(11), 710–715.
Lim, S.-W., Shiue, Y.-L., Ho, C.-H., Yu, S.-C., Kao, P.-H., Wang, J.-J., & Kuo, J.-R.
(2017). Anxiety and Depression in Patients with Traumatic Spinal Cord Injury:
A Nationwide Population-Based Cohort Study. Plos One, 12(1), e0169623.
Löfvenmark, I., Norrbrink, C., Nilsson-Wikmar, L., Hultling, C., Chakandinakira, S.,
& Hasselberg, M. (2015). LOFVENMARK 2015 Traumatic spinal cord injury
in Botswana characteristics,.pdf. Spinal Cord, 2(53), 150–154.
54
Lovibond, P., & Lovibond, S. (1995). Pergamon THE STRUCTURE OF
NEGATIVE EMOTIONAL STATES : SCALES ( DASS ) WITH THE BECK
DEPRESSION AND. Behaviour Research and Therapy, 33(3), 335–343.
Lude, P., Kennedy, P., Elfström, M., & Ballert, C. (2014). Quality of Life in and
After Spinal Cord Injury Rehabilitation: A Longitudinal Multicenter Study.
Topics in Spinal Cord Injury Rehabilitation, 20(3), 197–207.
Lund, M. L., Nordlund, A., Nygård, L., Lexell, J., & Bernspång, B. (2005).
Perceptions of participation and predictors of perceived problems with
participation in persons with spinal cord injury. Journal of Rehabilitation
Medicine, 37(1), 3–8.
Mann, c J. (2003). Observational research methods . Research design II : Emergency
Medicine Journal, October 2008, 54–61.
Martz, E., Livneh, H., Priebe, M., Wuermser, L. A., & Ottomanelli, L. (2005).
Predictors of psychosocial adaptation among people with spinal cord injury or
disorder. Archives of Physical Medicine and Rehabilitation, 86(6), 1182–1192.
McColl, M. A., Stirling, P., Walker, J., Corey, P., & Wilkins, R. (1999).
Expectations of independence and life satisfaction among ageing spinal cord
injured adults. Disability and Rehabilitation, 21(5–6), 231–240.
Mcdonald, J. W., & Sadowsky, C. (2002). Spinal-cord injury. 359, 417–425.
Meade, M. A., Armstrong, A. J., Barrett, K., Ellenbogen, P. S., & Jackson, M. N.
(2008). Vocational rehabilitation services for individuals with Spinal Cord
55
Injury. Journal of Vocational Rehabilitation, 25(2006), 3–11.
Middleton, J. W., Dayton, A., Walsh, J., Rutkowski, S. B., Leong, G., & Duong, S.
(2012). Life expectancy after spinal cord injury: A 50-year study. Spinal Cord,
50(11), 803–811.
Middleton, J. W., Dayton, A., Walsh, J., Rutkowski, S. B., Leong, G., & Duong, S.
(2014). Life expectancy after spinal cord injury : a 50-year study. Spinal Cord,
May 2012, 803–811.
Middleton, Johnston, D., Murphy, G., Ramakrishnan, K., Savage, N., Harper, R.,
Compton, J., & Cameron, I. D. (2015). Early access to vocational rehabilitation
for spinal cord injury inpatients. Journal of Rehabilitation Medicine, 47(7),
626–631.
Migliorini, New, P. W., & Tonge, B. J. (2009). Comparison of depression, anxiety
and stress in persons with traumatic and non-traumatic post-acute spinal cord
injury. Spinal Cord, 47(11), 783–788.
Mitchell, M., Burns, N., & Dorsty, D. (2008). Screening for depression and anxiety
in spinal cord injury with DASS-21. Spinal Cord, 46(8), 547–551.
Morrison, B. F., White-gittens, I., Smith, S., John, S. S., Bent, R., & Dixon, R.
(2017). Evaluation of sexual and fertility dysfunction in spinal cord-injured men
in Jamaica. Nature Publishing Group, April, 2–5.
Mousavi, S. V. (2017). Quality of Life in Patients with Spinal Cord Injury : The Role
of Depressed Mood. 2(1), 9–14.
56
Müller, R., Peter, C., Cieza, A., & Geyh, S. (2012). The role of social support and
social skills in people with spinal cord injurya systematic review of the
literature. Spinal Cord, 50(2), 94–106.
Munce, S. E. P., Webster, F., Fehlings, M. G., Straus, S. E., Jang, E., & Jaglal, S. B.
(2014). Perceived facilitators and barriers to self-management in individuals
with traumatic spinal cord injury : a qualitative descriptive study. 1–12.
Noe, B. B., Stapelfeldt, C. M., Parner, E. T., & Mikkelsen, E. M. (2017). Survival
after traumatic spinal cord injury in Denmark: A hospital-based study among
patients injured in 1990-2012. Spinal Cord, 55(4), 373–377. h
Noreau, L., Fougeyrollas, P., Post, M., & Asano, M. (2005). Participation after spinal
cord injury: The evolution of conceptualization and measurement. Journal of
Neurologic Physical Therapy, 29(3), 147–156.
Norin, L., Slaug, B., Haak, M., Jörgensen, S., Lexell, J., & Iwarsson, S. (2017).
Housing accessibility and its associations with participation among older adults
living with long-standing spinal cord injury. 40(2).
Nunnally, J. C. (1994). Psychometric theory 3E. Tata McGraw-Hill Education.
Øderud, T. (2014). Surviving spinal cord injury in low income countries. African
Journal of Disability, 3(2), 1–9.
Ottomanelli, L., & Lind, L. (2009). Review of Critical Factors Related to
Employment After Spinal Cord Injury : Implications for Research and
Vocational Services. The Journal of Spinal Cord Medicine, 5, 503–531.
57
Paul, C., Derrett, S., Mcallister, S., Herbison, P., Beaver, C., & Sullivan, M. (2013).
Socioeconomic outcomes following spinal cord injury and the role of no-fault
compensation : longitudinal study. 51(12), 919–925.
Penninx, B. W. J. H., Milaneschi, Y., Lamers, F., & Vogelzangs, N. (2013).
Understanding the somatic consequences of depression: Biological mechanisms
and the role of depression symptom profile. BMC Medicine, 11(1), 1.
Post, M. W. M. (2014). Definitions of quality of life: What has happened and how to
move on. Topics in Spinal Cord Injury Rehabilitation, 20(3), 167–180.
Post, M. W. M., & Reinhardt, J. D. (2015). Participation and Life Satisfaction in
Aged People with Spinal Cord Injury: Does Age at Onset Make a Difference?
Topics in Spinal Cord Injury Rehabilitation, 21(3), 233–240.
Post, & van Leeuwen. (2012). Psychosocial issues in spinal cord injury: A review.
Spinal Cord, 50(5), 382.
Rahimi-Movaghar, V., Sayyah, M. K., Akbari, H., Khorramirouz, R., Rasouli, M. R.,
Moradi-Lakeh, M., & Vaccaro, A. (2013). Epidemiology of Traumatic Spinal
Cord Injury in Developing Countries : Neuroepidemiology, 41(2), 65–85.
Rauch, A., Fekete, C., Oberhauser, C., Marti, A., & Cieza, A. (2014). Participation
in sport in persons with spinal cord injury in Switzerland. 52(9), 706–711.
Richards, J. S., Bombardier, C. H., Tate, D., Dijkers, M., Gordon, W., Shewchuk, R.,
& DeVivo, M. J. (1999). Access to the environment and life satisfaction after
spinal cord injury. Archives of Physical Medicine and Rehabilitation, 80(11),
58
1501–1506.
Riggins, M. S., Kankipati, P., Oyster, M. L., Cooper, R. A., & Boninger, M. L.
(2011). The Relationship Between Quality of Life and Change in Mobility 1
Year Postinjury in Individuals With Spinal Cord Injury. YAPMR, 92(7), 1027–
1033.
Riolo, S. A., Nguyen, T. A., Greden, J. F., & King, C. A. (2005). Prevalence of
depression by race/ethnicity: Findings from the national health and nutrition
examination survey III. American Journal of Public Health, 95(6), 998–1000.
Roser, M., Ortiz-Ospina, E., & Ritchie, H. (2013). Life expectancy. Our World in
Data, Roser, M.,.
Saunders, L. L., Krause, J. S., & Focht, K. L. (2011). ORIGINAL ARTICLE A
longitudinal study of depression in survivors of spinal cord injury. Spinal Cord,
50(1), 72–77.
Saunders, L. L., Krause, J. S., & Focht, K. L. (2012). A longitudinal study of
depression in survivors of spinal cord injury. Spinal Cord, 50(1), 72–77.
Savic, G., Devivo, M. J., Frankel, H. L., Jamous, M. A., Soni, B. M., & Charlifue, S.
(2017). Long-term survival after traumatic spinal cord injury: A 70-year British
study. Spinal Cord, 55(7), 651–658.
Schönherr, M. C., Groothoff, J. W., Mulder, G. A., & Eisma, W. H. (2000).
Prediction of functional outcome after spinal cord injury: A task for the
rehabilitation team and the patient. Spinal Cord, 38(3), 185–191.
59
Schönherr, M. C., Groothoff, J. W., Mulder, G. A., Schoppen, T., & Eisma, W. H.
(2004). Vocational reintegration following spinal cord injury: Expectations,
participation and interventions. Spinal Cord, 42(3), 177–184.
Schwartz, C. E., Stucky, B., Rivers, C. S., Noonan, V. K., & Finkelstein, J. A.
(2018). Quality of Life and Adaptation in People With Spinal Cord Injury:
Response Shift Effects From 1 to 5 Years Postinjury. Archives of Physical
Medicine and Rehabilitation, 99(8), 1599-1608.e1.
Setia, M. S. (2016). Methodology series module 3: Cross-sectional studies. Indian
Journal of Dermatology, 61(3), 261–264.
Sezer, N., Akkuş, S., & Uğurlu, F. G. (2015). Chronic complications of spinal cord
injury. World Journal of Orthopedics, 6(1), 24.
Shin, J. C., Goo, H. R., Yu, S. J., Kim, D. H., & Yoon, S. Y. (2012). Depression and
Quality of Life in Patients within the First 6 Months after the Spinal Cord
Injury. 119–125.
Singh, R., Rohilla, R. K., Siwach, R., Dhankar, S. S., & Kaur, K. (2011).
Understanding psycho-social issues in persons with spinal cord injury and
impact of remedial measures. International Journal of Psychosocial
Rehabilitation, 16(1), 104–111.
Sobieraj, M., Williams, J., Marley, J., & Ryan, P. (1998). The impact of depression
on the physical health of family members. British Journal of General Practice,
48(435), 1653–1655.
60
Solheim, E. F., & Leiulfsrud, A. S. (2018). Employment after Spinal Cord Injury in
Norway : A Cross-Sectional Survey. 20, 197–210.
Stevelink, S. A. M., Terwee, C. B., Banstola, N., & Van Brakel, W. H. (2013).
Testing the psychometric properties of the Participation Scale in Eastern Nepal.
Quality of Life Research, 22(1), 137–144.
Suttiwong, J., Vongsirinavarat, M., Chaiyawat, P., & Vachalathiti, R. (2015).
Predicting community participation after spinal cord injury in Thailand. Journal
of Rehabilitation Medicine, 47(4), 325–329.
Swinnen, E., Duerinck, Baeyens, J. p, Meeusen, R., & Kerckhofs, E. (2010).
Effectiveness of robot-assisted gait training in persons with spinal cord injury: a
systematic review. Journal of Rehabilitation Medicine, 42(6), 520-526.
Szebehely, M., & Trydegård, G. B. (2012). Home care for older people in Sweden: A
universal model in transition. Health and Social Care in the Community, 20(3),
300–309.
Tasiemski, Kennedy, P., Patrick, B., & Taylor, N. (2005). The association of sports
and physical recreation with life satisfaction in a community sample of people
with spinal cord injuries. NeuroRehabilitation, 20(4), 253–265.
Tasiemski, Nielsen, S., & Wilski, M. (2010). Original articles quality of life in
people with spinal cord injury – earthquake survivors from sichuan province in
china. Asia pac disabil rehabil j, 21(2), 28–36.
Tasiemski, T., Bergstro, E., Savic, & Gardner. (2000). Sports , recreation and
61
employment following spinal cord injury ± a pilot study. Spinal Cord, 38(3),
173–184.
Thammaiah, S., Manchaiah, V., Easwar, V., Krishna, R., & McPherson, B. (2018).
The Participation Scale: psychometric properties of a South Indian translation
with hearing-impaired respondents. Disability and Rehabilitation, 40(22),
2650–2657.
Tongco, M. D. C. (2007). Purposive sampling as a tool for informant selection.
Ethnobotany Research and Applications, 5, 147–158.
Tran, Dorstyn, D. S., & Burke, A. L. J. (2016). Psychosocial aspects of spinal cord
injury pain: A meta-analysis. Spinal Cord, 54(9), 640–648.
Tran, T. D., Tran, T., & Fisher, J. (2013). Validation of the depression anxiety stress
scales (DASS) 21 as a screening instrument for depression and anxiety in a rural
community-based cohort of northern Vietnamese women. BMC Psychiatry,
13(1), 1.
Trenaman, L. M., Miller, W. C., & Escorpizo, R. (2014). Interventions for improving
employment outcomes among individuals with spinal cord injury: A systematic
review. Spinal Cord, 52(11), 788–794.
Tzanos, I.-A., Mitsiokapa, E., Megaloikonomos, P. D., Igoumenou, V. G.,
Panagopoulos, G. N., Papathanasiou, J., Tzanos, G., & Mavrogenis, A. F.
(2016). Social Reintegration and Quality of Life after Spinal Cord Injury: the
Greek Paradigm. Journal of Biomedicine, 1(November), 36–43.
62
Üstün, T. B., Ayuso-Mateos, J. L., Chatterji, S., Mathers, C., & Murray, C. J. L.
(2004). Global burden of depressive disorders in the year 2000. British Journal
of Psychiatry, 184(MAY), 386–392.
Van Brakel, W. H., Anderson, A. M., Mutatkar, R. K., Bakirtzief, Z., Nicholls, P. G.,
Raju, M. S., & Das-Pattanayak, R. K. (2006). The Participation Scale:
Measuring a key concept in public health. Disability and Rehabilitation, 28(4),
193–203.
Vissers, M., van den Berg-Emons, R., Sluis, T., Bergen, M., Stam, H., & Bussmann,
H. (2008). Barriers to and facilitators of everyday physical activity in persons
with a spinal cord injury after discharge from the rehabilitation centre. Journal
of Rehabilitation Medicine, 40(6), 461–467.
Wang, X., Guo, J., Zhang, X., Qu, Z., Tian, D., & Ma, S. (2014). The effects of
depression and chronic diseases on the work outcomes of employees: A
prospective study in Northwest China. Public Health, 128(8), 734–742.
White, N. H., & Black, N. H. (2017). Spinal cord injury facts and figures at a glance.
The Journal of Spinal Cord Medicine.
Whiteneck, G., Tate, D., Charlifue, S., G, A. W., Tare, D., & Predicting, C. S.
(1999). Predicting community reintegration after spinal cord injury from
demographic and injury characteristics. Archives of Physical Medicine and
Rehabilitation, 80(11), 1485–1491.
WHO. (2007). International Classification of Functioning, Disability, and Health:
63
Children & Youth Version: ICF-CY. World Health Organization.
WHO. (2017). Depression and other common mental disorders: global health
estimates (No. WHO/MSD/MER/2017.2). World Health Organization.
Williams, Onsman, A., & Brown, T. (2010). Exploratory factor analysis: A five-step
guide for novices. Australasian Journal of Paramedicine, 8(3), 1–13.
Williams, R., & Murray, A. (2015). Prevalence of Depression After Spinal Cord
Injury : A Meta-Analysis. Archives of Physical Medicine and Rehabilitation,
96(1), 133–140.
Wilson, J. R., Hashimoto, R. E., Dettori, J. R., & Fehlings, M. G. (2011). Spinal cord
injury and quality of life : a systematic review of outcome measures. Evidence-
Based Spine-Care, 2(1), 37–44.
World Health Organization. (1996). WHOQOL-BREF: introduction, administration,
scoring and generic version of the assessment: field trial version, December
1996 (No. WHOQOL-BREF). In Geneva: World Health Organization.
World Health Organization. (2015). WHO global disability action plan 2014-2021:
Better health for all people with disability disability. World Health
Organization.
World Health Organization & International Spinal Cord Society. (2013).
International perspectives on spinal cord injury. In World Health Organization.
Wyndaele, M., & Wyndaele, J. J. (2006). Incidence, prevalence and epidemiology of
64
spinal cord injury: What learns a worldwide literature survey? Spinal Cord,
44(9), 523–529.
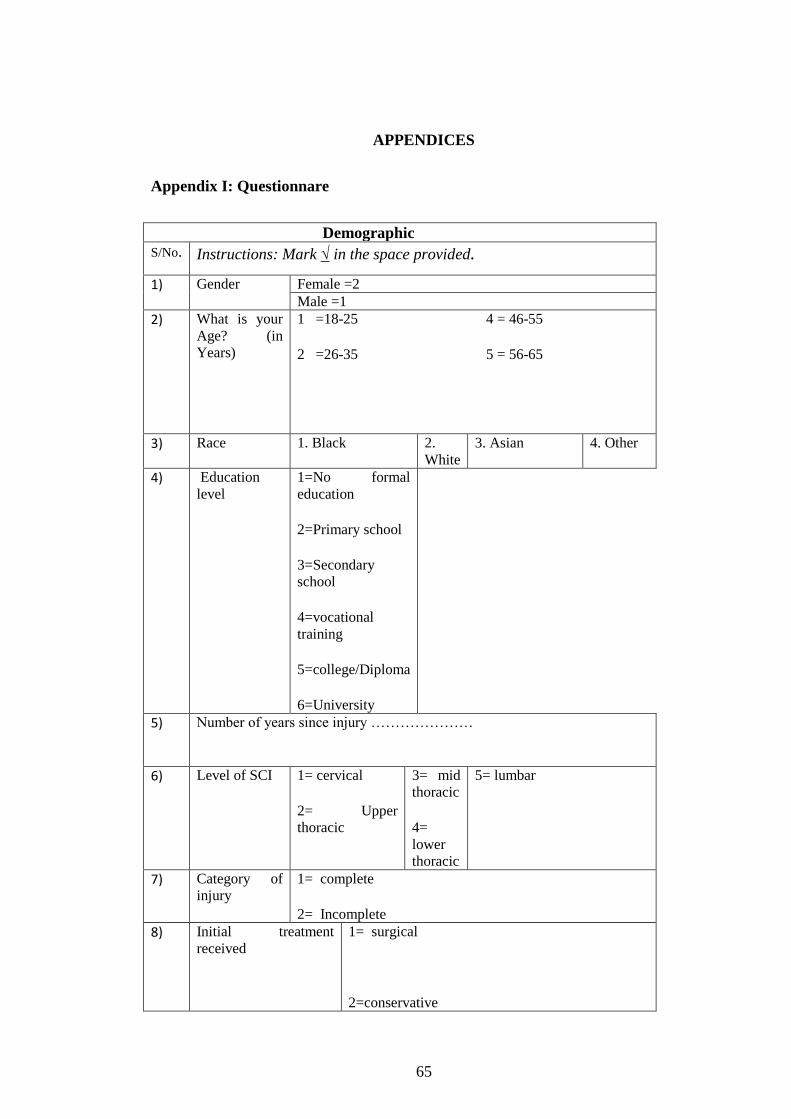
65
APPENDICES
Appendix I: Questionnare
Demographic
S/No. Instructions: Mark √ in the space provided.
1) Gender Female =2
Male =1
2) What is your
Age? (in
Years)
1 =18-25 4 = 46-55
2 =26-35 5 = 56-65
3 =36-45
3) Race 1. Black 2.
White
3. Asian 4. Other
4) Education
level
1=No formal
education
2=Primary school
3=Secondary
school
4=vocational
training
5=college/Diploma
6=University
5) Number of years since injury …………………
6) Level of SCI 1= cervical
2= Upper
thoracic
3= mid
thoracic
4=
lower
thoracic
5= lumbar
7) Category of
injury
1= complete
2= Incomplete
8) Initial treatment
received
1= surgical
2=conservative
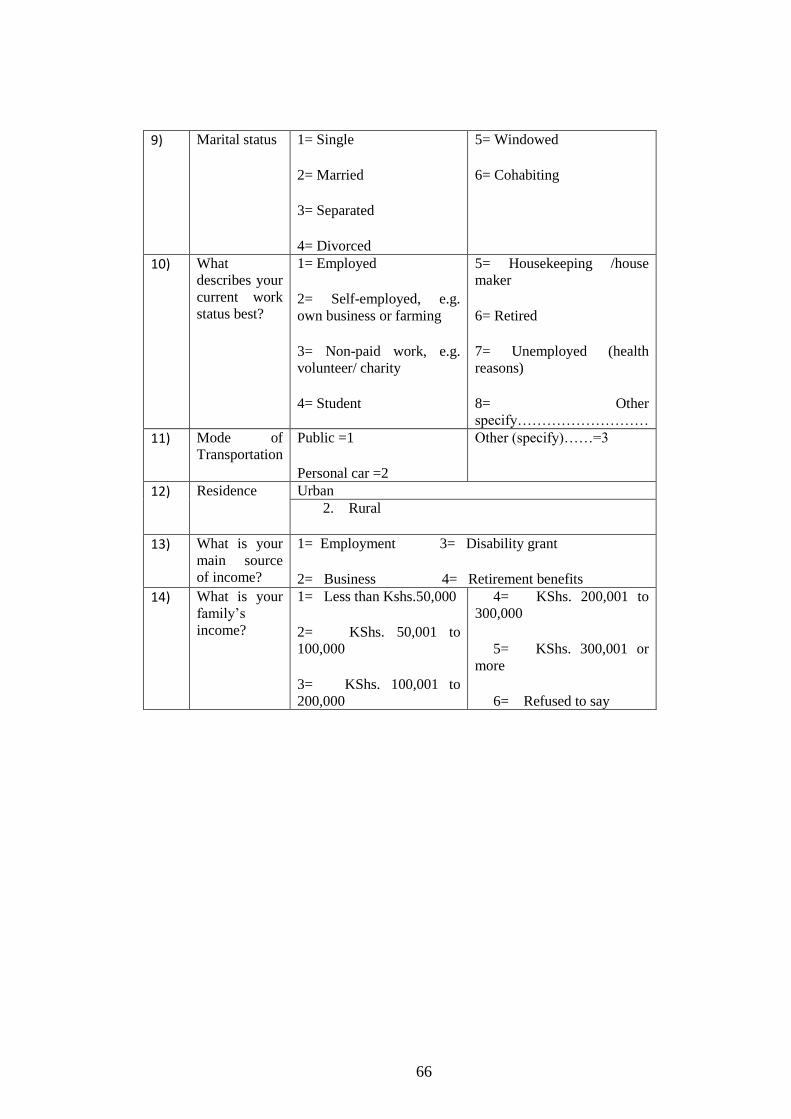
66
9) Marital status 1= Single
2= Married
3= Separated
4= Divorced
5= Windowed
6= Cohabiting
10) What
describes your
current work
status best?
1= Employed
2= Self-employed, e.g.
own business or farming
3= Non-paid work, e.g.
volunteer/ charity
4= Student
5= Housekeeping /house
maker
6= Retired
7= Unemployed (health
reasons)
8= Other
specify………………………
11) Mode of
Transportation
Public =1
Personal car =2
Other (specify)……=3
12) Residence
Urban
2. Rural
13) What is your
main source
of income?
1= Employment 3= Disability grant
2= Business 4= Retirement benefits
14) What is your
family’s
income?
1= Less than Kshs.50,000
2= KShs. 50,001 to
100,000
3= KShs. 100,001 to
200,000
4= KShs. 200,001 to
300,000
5= KShs. 300,001 or
more
6= Refused to say
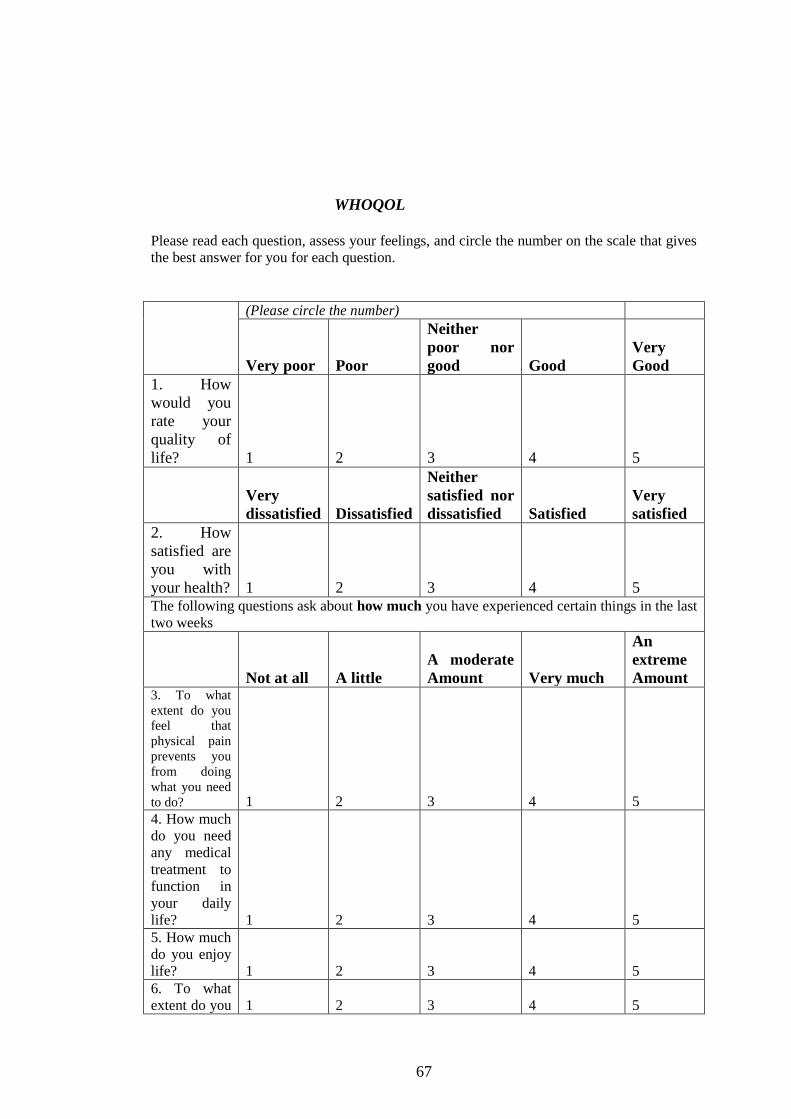
67
WHOQOL
Please read each question, assess your feelings, and circle the number on the scale that gives
the best answer for you for each question.
(Please circle the number)
Very poor Poor
Neither
poor nor
good Good
Very
Good
1. How
would you
rate your
quality of
life? 1 2 3 4 5
Very
dissatisfied Dissatisfied
Neither
satisfied nor
dissatisfied Satisfied
Very
satisfied
2. How
satisfied are
you with
your health? 1 2 3 4 5 The following questions ask about how much you have experienced certain things in the last
two weeks
Not at all A little
A moderate
Amount Very much
An
extreme
Amount 3. To what
extent do you
feel that
physical pain
prevents you
from doing
what you need
to do? 1 2 3 4 5
4. How much
do you need
any medical
treatment to
function in
your daily
life? 1 2 3 4 5
5. How much
do you enjoy
life? 1 2 3 4 5
6. To what
extent do you 1 2 3 4 5
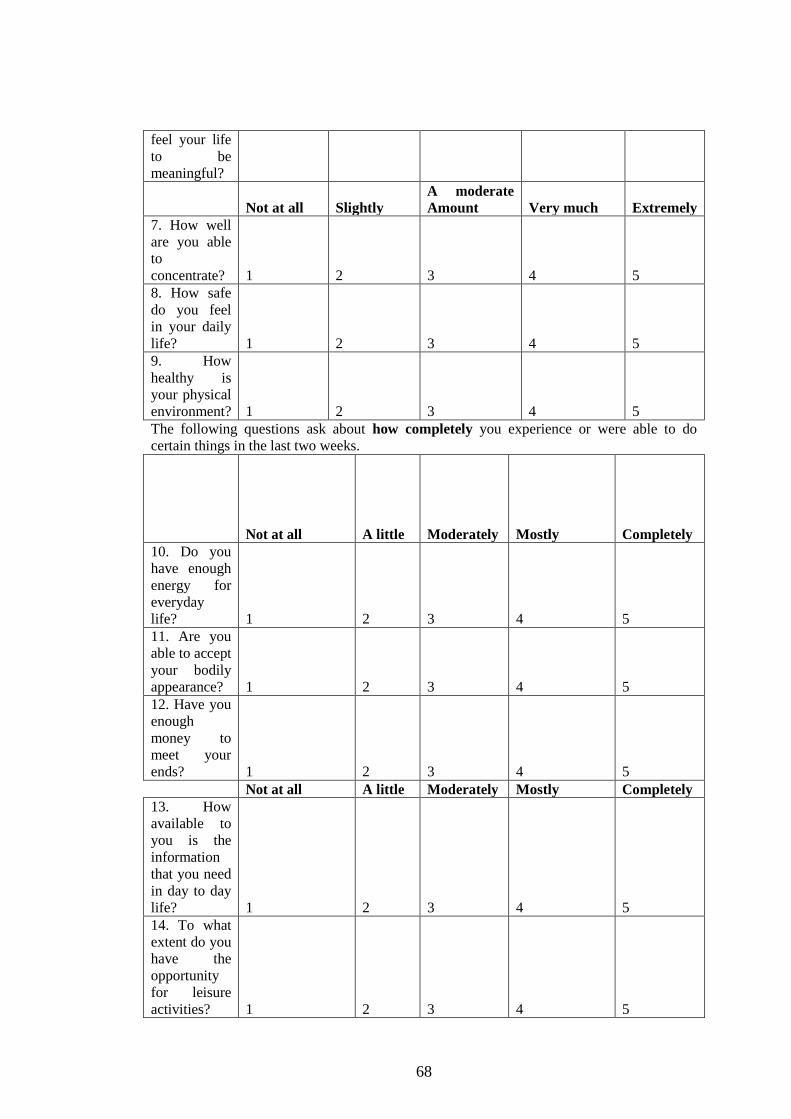
68
feel your life
to be
meaningful?
Not at all Slightly
A moderate
Amount Very much Extremely
7. How well
are you able
to
concentrate? 1 2 3 4 5
8. How safe
do you feel
in your daily
life? 1 2 3 4 5
9. How
healthy is
your physical
environment? 1 2 3 4 5
The following questions ask about how completely you experience or were able to do
certain things in the last two weeks.
Not at all A little Moderately Mostly Completely
10. Do you
have enough
energy for
everyday
life? 1 2 3 4 5
11. Are you
able to accept
your bodily
appearance? 1 2 3 4 5
12. Have you
enough
money to
meet your
ends? 1 2 3 4 5
Not at all A little Moderately Mostly Completely
13. How
available to
you is the
information
that you need
in day to day
life? 1 2 3 4 5
14. To what
extent do you
have the
opportunity
for leisure
activities? 1 2 3 4 5
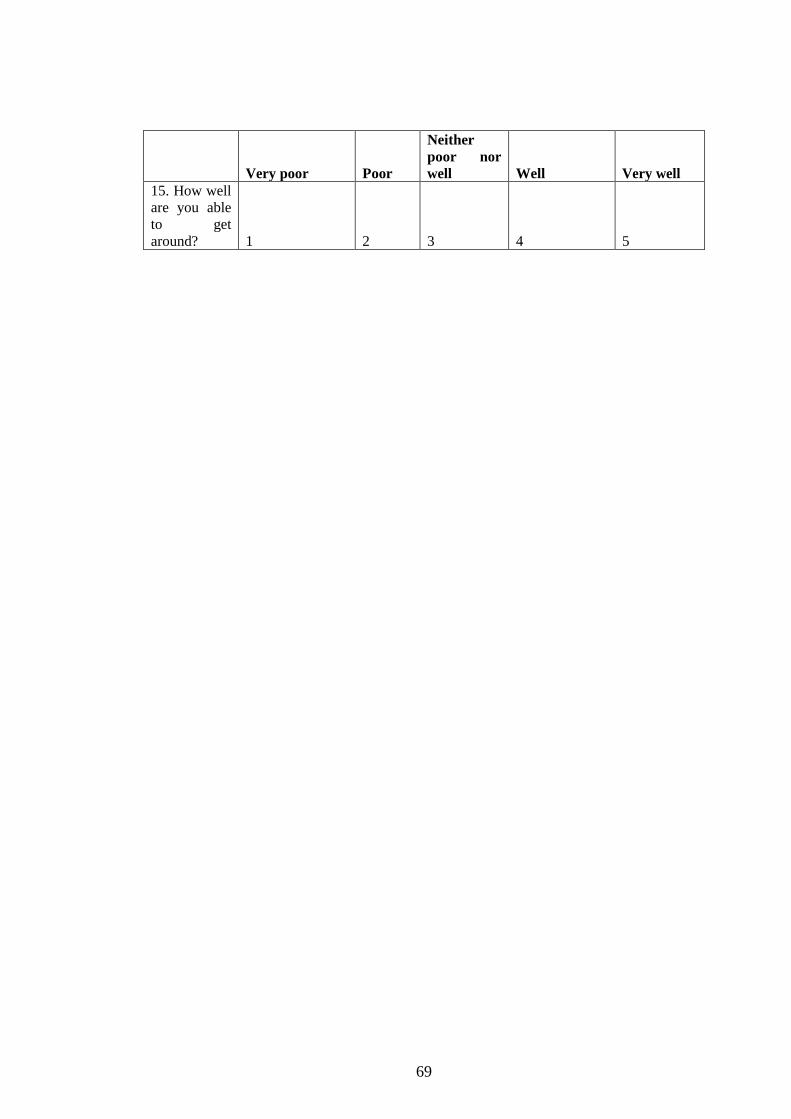
69
Very poor Poor
Neither
poor nor
well Well Very well
15. How well
are you able
to get
around? 1 2 3 4 5
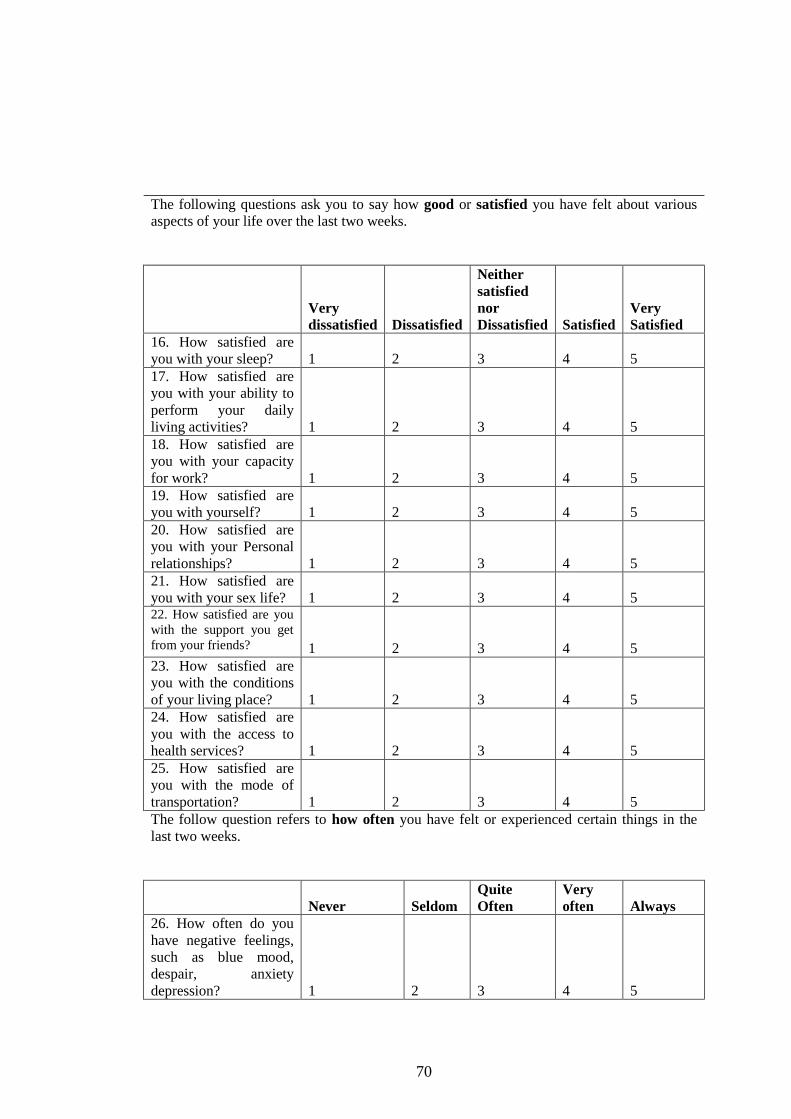
70
The following questions ask you to say how good or satisfied you have felt about various
aspects of your life over the last two weeks.
Very
dissatisfied Dissatisfied
Neither
satisfied
nor
Dissatisfied Satisfied
Very
Satisfied
16. How satisfied are
you with your sleep? 1 2 3 4 5
17. How satisfied are
you with your ability to
perform your daily
living activities? 1 2 3 4 5
18. How satisfied are
you with your capacity
for work? 1 2 3 4 5
19. How satisfied are
you with yourself? 1 2 3 4 5
20. How satisfied are
you with your Personal
relationships? 1 2 3 4 5
21. How satisfied are
you with your sex life? 1 2 3 4 5 22. How satisfied are you
with the support you get
from your friends? 1 2 3 4 5
23. How satisfied are
you with the conditions
of your living place? 1 2 3 4 5
24. How satisfied are
you with the access to
health services? 1 2 3 4 5
25. How satisfied are
you with the mode of
transportation? 1 2 3 4 5
The follow question refers to how often you have felt or experienced certain things in the
last two weeks.
Never Seldom
Quite
Often
Very
often Always
26. How often do you
have negative feelings,
such as blue mood,
despair, anxiety
depression? 1 2 3 4 5

71
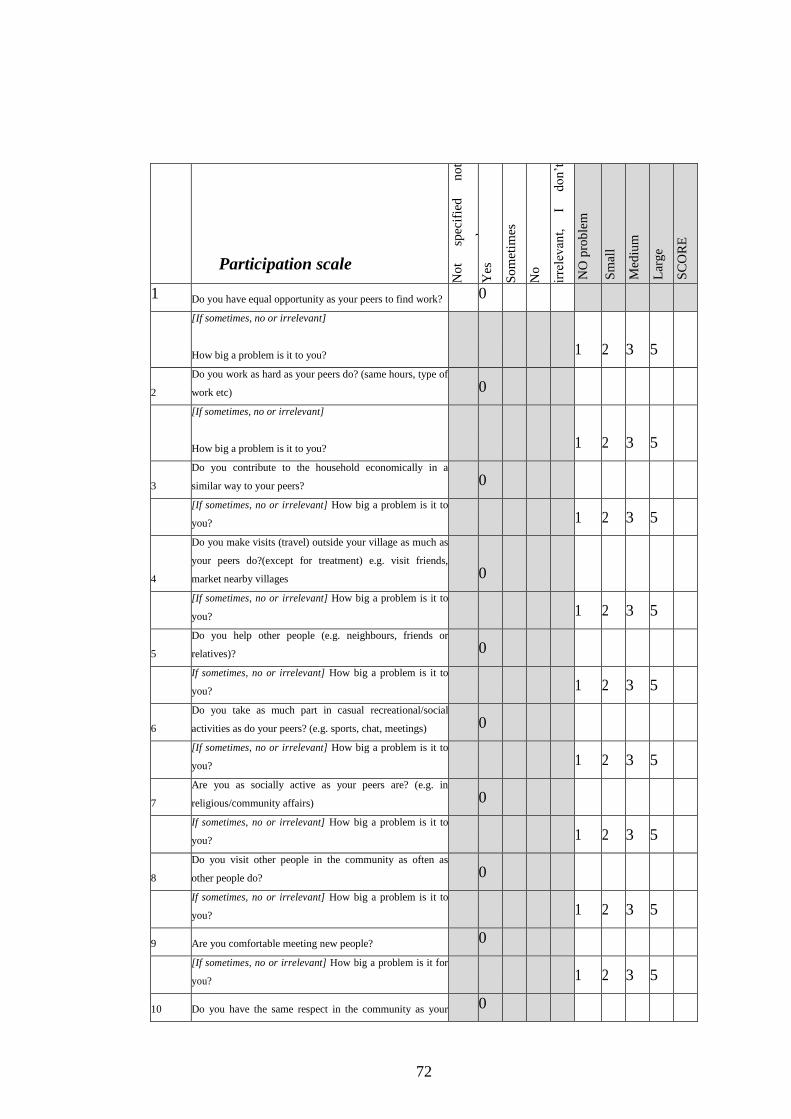
72
Participation scale
No
t sp
ecif
ied
n
ot
answ
ered
Y
es
So
met
imes
No
irre
lev
ant,
I
do
n’t
wan
t to
N
O p
rob
lem
Sm
all
Med
ium
Lar
ge
SC
OR
E
1 Do you have equal opportunity as your peers to find work? 0
[If sometimes, no or irrelevant]
How big a problem is it to you? 1 2 3 5
2
Do you work as hard as your peers do? (same hours, type of
work etc) 0
[If sometimes, no or irrelevant]
How big a problem is it to you?
1 2 3 5
3
Do you contribute to the household economically in a
similar way to your peers? 0
[If sometimes, no or irrelevant] How big a problem is it to
you?
1 2 3 5
4
Do you make visits (travel) outside your village as much as
your peers do?(except for treatment) e.g. visit friends,
market nearby villages 0
[If sometimes, no or irrelevant] How big a problem is it to
you?
1 2 3 5
5
Do you help other people (e.g. neighbours, friends or
relatives)? 0
If sometimes, no or irrelevant] How big a problem is it to
you?
1 2 3 5
6
Do you take as much part in casual recreational/social
activities as do your peers? (e.g. sports, chat, meetings) 0
[If sometimes, no or irrelevant] How big a problem is it to
you?
1 2 3 5
7
Are you as socially active as your peers are? (e.g. in
religious/community affairs) 0
If sometimes, no or irrelevant] How big a problem is it to
you? 1 2 3 5
8
Do you visit other people in the community as often as
other people do? 0
If sometimes, no or irrelevant] How big a problem is it to
you? 1 2 3 5
9 Are you comfortable meeting new people? 0
[If sometimes, no or irrelevant] How big a problem is it for
you? 1 2 3 5
10 Do you have the same respect in the community as your 0
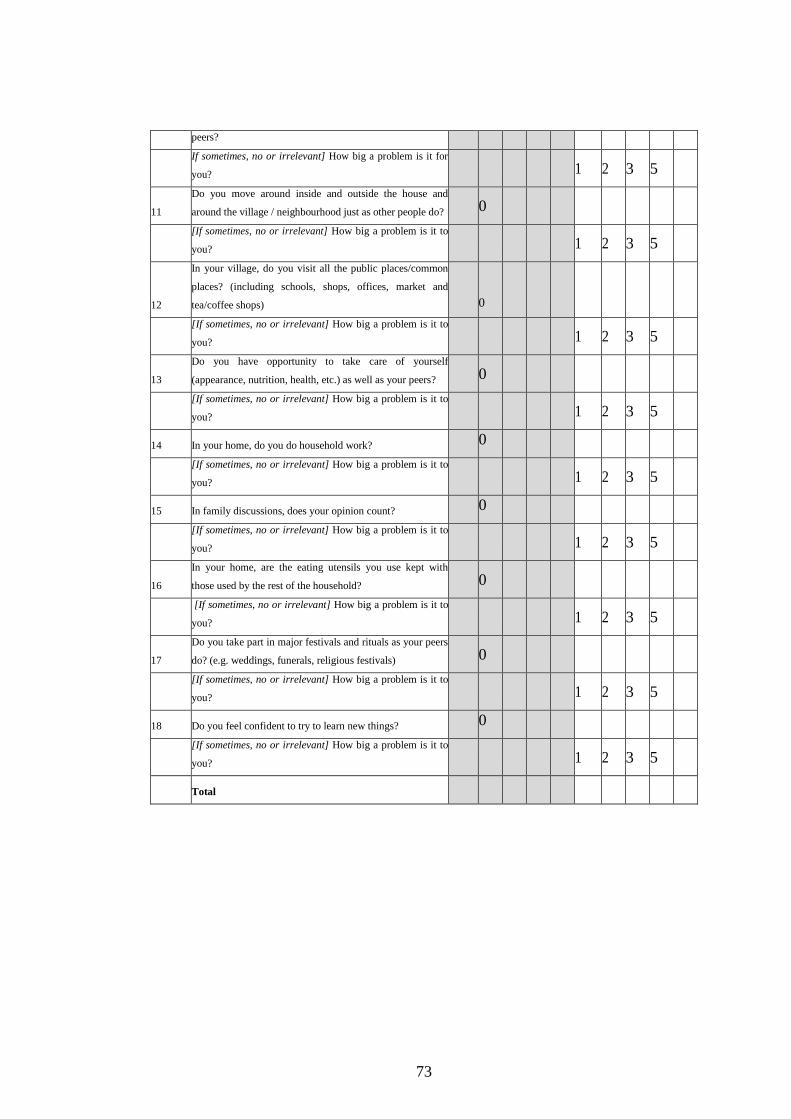
73
peers?
If sometimes, no or irrelevant] How big a problem is it for
you? 1 2 3 5
11
Do you move around inside and outside the house and
around the village / neighbourhood just as other people do? 0
[If sometimes, no or irrelevant] How big a problem is it to
you? 1 2 3 5
12
In your village, do you visit all the public places/common
places? (including schools, shops, offices, market and
tea/coffee shops) 0
[If sometimes, no or irrelevant] How big a problem is it to
you? 1 2 3 5
13
Do you have opportunity to take care of yourself
(appearance, nutrition, health, etc.) as well as your peers? 0
[If sometimes, no or irrelevant] How big a problem is it to
you? 1 2 3 5
14 In your home, do you do household work? 0
[If sometimes, no or irrelevant] How big a problem is it to
you? 1 2 3 5
15 In family discussions, does your opinion count? 0
[If sometimes, no or irrelevant] How big a problem is it to
you?
1 2 3 5
16
In your home, are the eating utensils you use kept with
those used by the rest of the household? 0
[If sometimes, no or irrelevant] How big a problem is it to
you?
1 2 3 5
17
Do you take part in major festivals and rituals as your peers
do? (e.g. weddings, funerals, religious festivals) 0
[If sometimes, no or irrelevant] How big a problem is it to
you?
1 2 3 5
18 Do you feel confident to try to learn new things? 0
[If sometimes, no or irrelevant] How big a problem is it to
you?
1 2 3 5
Total
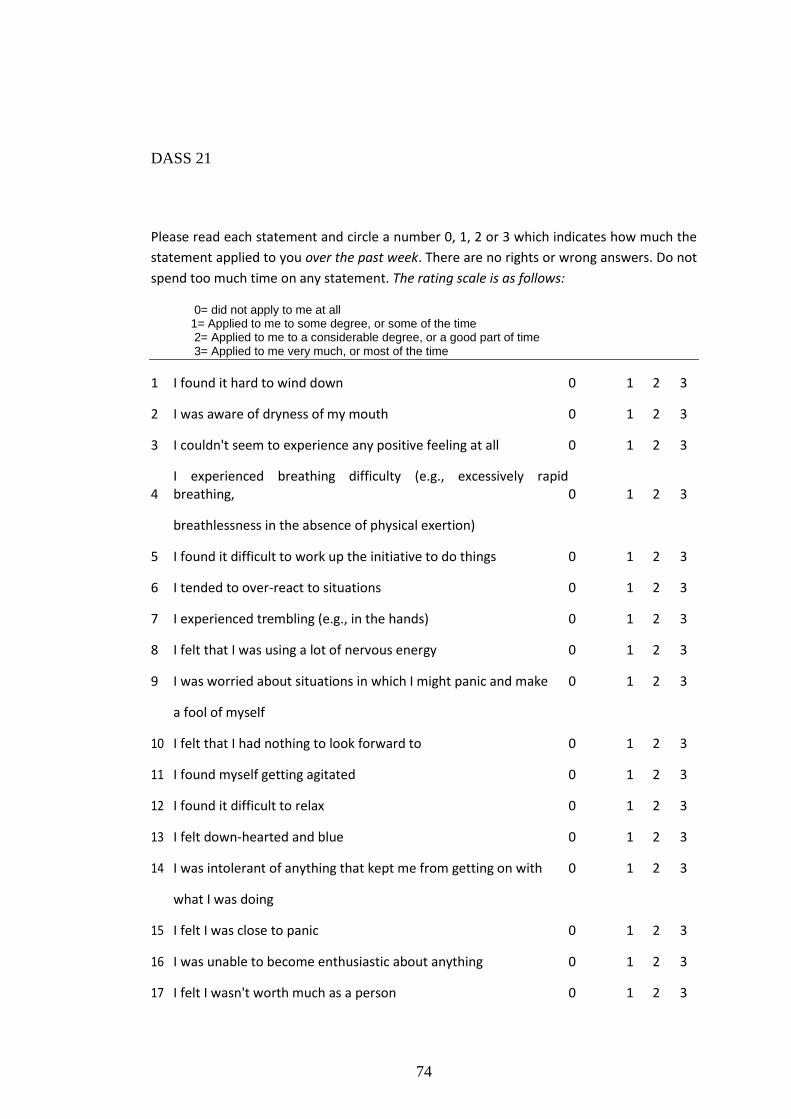
74
DASS 21
Please read each statement and circle a number 0, 1, 2 or 3 which indicates how much the
statement applied to you over the past week. There are no rights or wrong answers. Do not
spend too much time on any statement. The rating scale is as follows:
0= did not apply to me at all 1= Applied to me to some degree, or some of the time 2= Applied to me to a considerable degree, or a good part of time 3= Applied to me very much, or most of the time
1 I found it hard to wind down 0 1 2 3
2 I was aware of dryness of my mouth 0 1 2 3
3 I couldn't seem to experience any positive feeling at all 0 1 2 3
4 I experienced breathing difficulty (e.g., excessively rapid breathing, 0 1 2 3
breathlessness in the absence of physical exertion)
5 I found it difficult to work up the initiative to do things 0 1 2 3
6 I tended to over-react to situations 0 1 2 3
7 I experienced trembling (e.g., in the hands) 0 1 2 3
8 I felt that I was using a lot of nervous energy 0 1 2 3
9 I was worried about situations in which I might panic and make 0 1 2 3
a fool of myself
10 I felt that I had nothing to look forward to 0 1 2 3
11 I found myself getting agitated 0 1 2 3
12 I found it difficult to relax 0 1 2 3
13 I felt down-hearted and blue 0 1 2 3
14 I was intolerant of anything that kept me from getting on with 0 1 2 3
what I was doing
15 I felt I was close to panic 0 1 2 3
16 I was unable to become enthusiastic about anything 0 1 2 3
17 I felt I wasn't worth much as a person 0 1 2 3
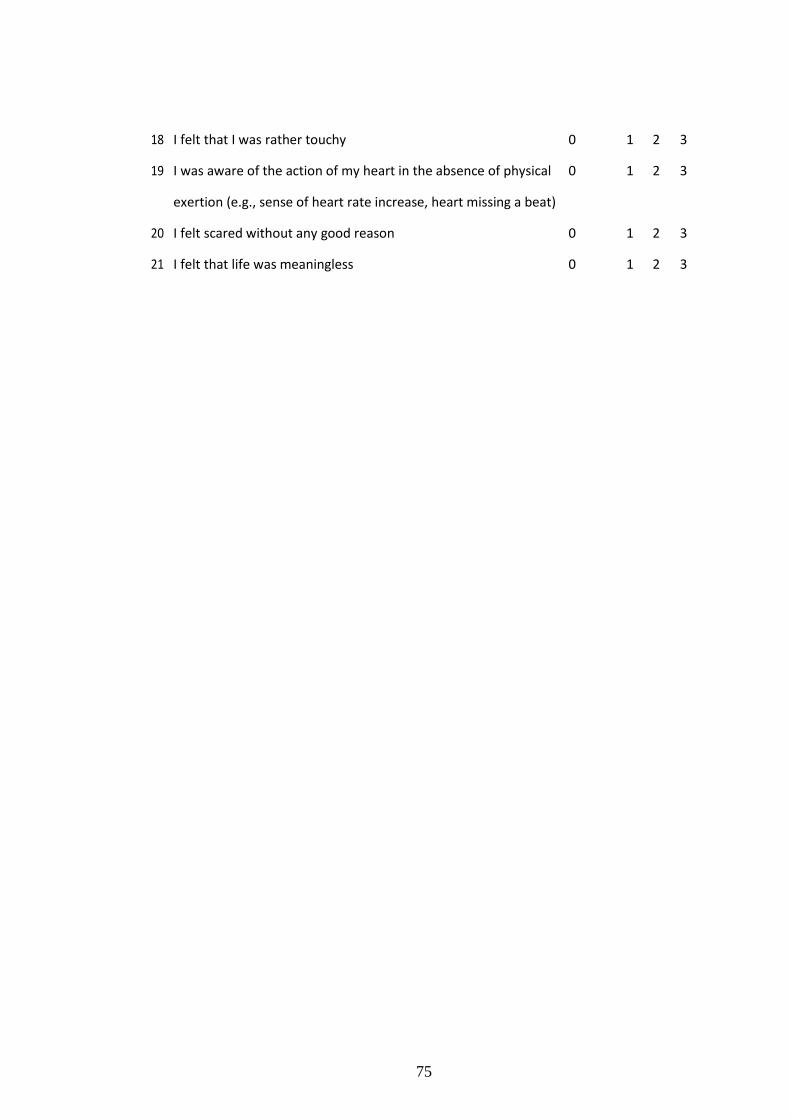
75
18 I felt that I was rather touchy 0 1 2 3
19 I was aware of the action of my heart in the absence of physical 0 1 2 3
exertion (e.g., sense of heart rate increase, heart missing a beat)
20 I felt scared without any good reason 0 1 2 3
21 I felt that life was meaningless 0 1 2 3
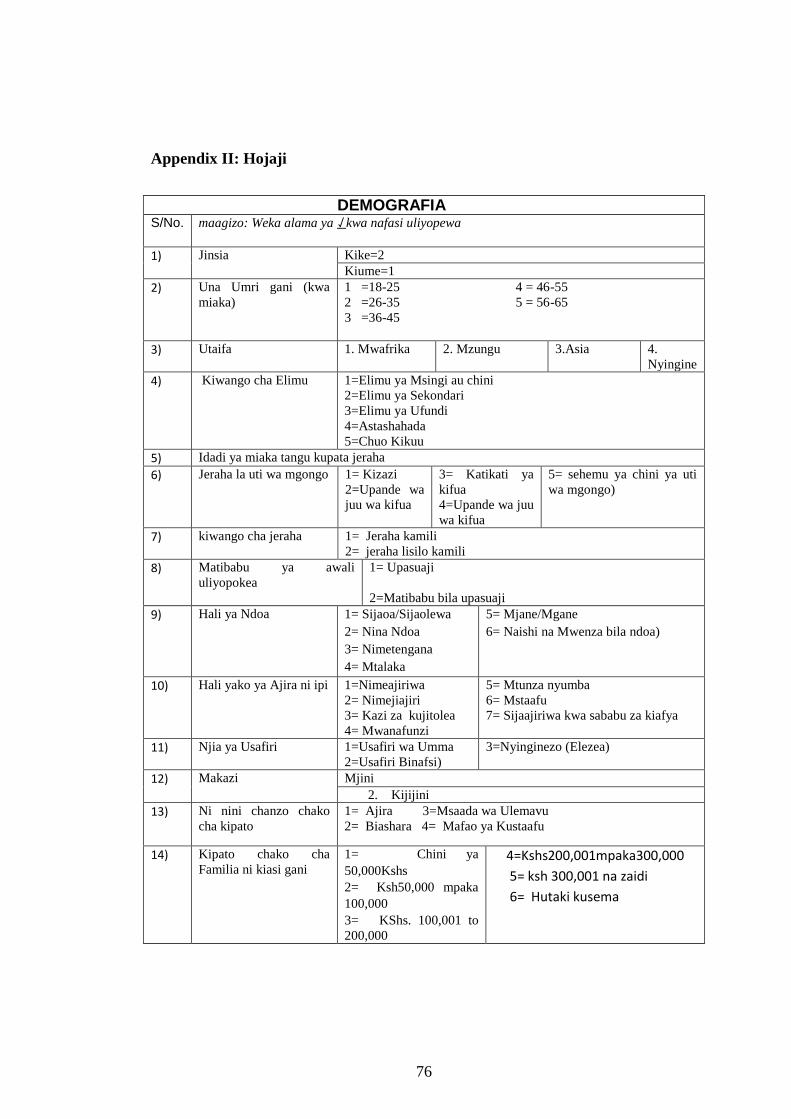
76
Appendix II: Hojaji
DEMOGRAFIA S/No. maagizo: Weka alama ya ⇃ kwa nafasi uliyopewa
1) Jinsia Kike=2
Kiume=1
2) Una Umri gani (kwa
miaka)
1 =18-25 4 = 46-55
2 =26-35 5 = 56-65
3 =36-45
3) Utaifa 1. Mwafrika 2. Mzungu 3.Asia 4.
Nyingine
4) Kiwango cha Elimu 1=Elimu ya Msingi au chini
2=Elimu ya Sekondari
3=Elimu ya Ufundi
4=Astashahada
5=Chuo Kikuu
5) Idadi ya miaka tangu kupata jeraha
6) Jeraha la uti wa mgongo 1= Kizazi
2=Upande wa
juu wa kifua
3= Katikati ya
kifua
4=Upande wa juu
wa kifua
5= sehemu ya chini ya uti
wa mgongo)
7) kiwango cha jeraha 1= Jeraha kamili
2= jeraha lisilo kamili
8) Matibabu ya awali
uliyopokea
1= Upasuaji
2=Matibabu bila upasuaji
9) Hali ya Ndoa 1= Sijaoa/Sijaolewa
2= Nina Ndoa
3= Nimetengana
4= Mtalaka
5= Mjane/Mgane
6= Naishi na Mwenza bila ndoa)
10) Hali yako ya Ajira ni ipi 1=Nimeajiriwa
2= Nimejiajiri
3= Kazi za kujitolea
4= Mwanafunzi
5= Mtunza nyumba
6= Mstaafu
7= Sijaajiriwa kwa sababu za kiafya
11) Njia ya Usafiri 1=Usafiri wa Umma
2=Usafiri Binafsi)
3=Nyinginezo (Elezea)
12) Makazi
1. Mjini
2. Kijijini
13) Ni nini chanzo chako
cha kipato
1= Ajira 3=Msaada wa Ulemavu
2= Biashara 4= Mafao ya Kustaafu
14) Kipato chako cha
Familia ni kiasi gani
1= Chini ya
50,000Kshs
2= Ksh50,000 mpaka
100,000
3= KShs. 100,001 to
200,000
4=Kshs200,001mpaka300,000
5= ksh 300,001 na zaidi
6= Hutaki kusema
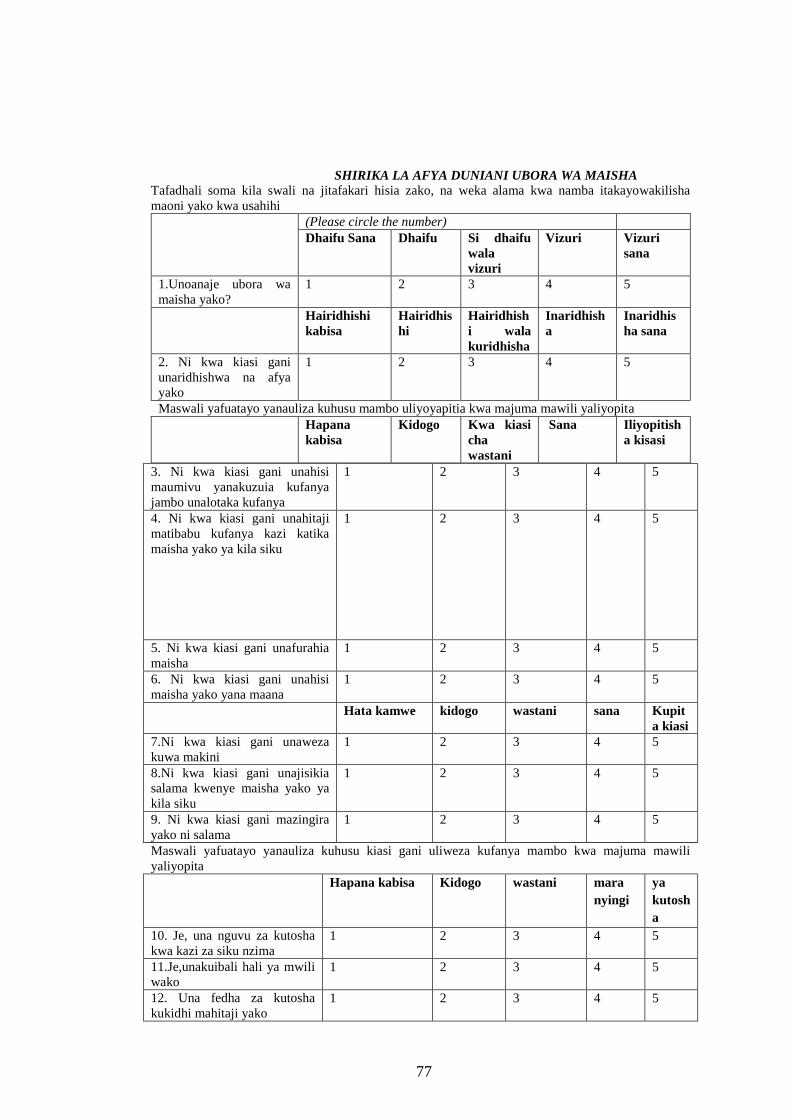
77
SHIRIKA LA AFYA DUNIANI UBORA WA MAISHA Tafadhali soma kila swali na jitafakari hisia zako, na weka alama kwa namba itakayowakilisha
maoni yako kwa usahihi
(Please circle the number)
Dhaifu Sana Dhaifu Si dhaifu
wala
vizuri
Vizuri Vizuri
sana
1.Unoanaje ubora wa
maisha yako?
1 2 3 4 5
Hairidhishi
kabisa
Hairidhis
hi
Hairidhish
i wala
kuridhisha
Inaridhish
a
Inaridhis
ha sana
2. Ni kwa kiasi gani
unaridhishwa na afya
yako
1 2 3 4 5
Maswali yafuatayo yanauliza kuhusu mambo uliyoyapitia kwa majuma mawili yaliyopita
Hapana
kabisa
Kidogo Kwa kiasi
cha
wastani
Sana Iliyopitish
a kisasi
3. Ni kwa kiasi gani unahisi
maumivu yanakuzuia kufanya
jambo unalotaka kufanya
1 2 3 4 5
4. Ni kwa kiasi gani unahitaji
matibabu kufanya kazi katika
maisha yako ya kila siku
1 2 3 4 5
5. Ni kwa kiasi gani unafurahia
maisha
1 2 3 4 5
6. Ni kwa kiasi gani unahisi
maisha yako yana maana
1 2 3 4 5
Hata kamwe kidogo wastani sana Kupit
a kiasi
7.Ni kwa kiasi gani unaweza
kuwa makini
1 2 3 4 5
8.Ni kwa kiasi gani unajisikia
salama kwenye maisha yako ya
kila siku
1 2 3 4 5
9. Ni kwa kiasi gani mazingira
yako ni salama
1 2 3 4 5
Maswali yafuatayo yanauliza kuhusu kiasi gani uliweza kufanya mambo kwa majuma mawili
yaliyopita
Hapana kabisa Kidogo wastani mara
nyingi
ya
kutosh
a
10. Je, una nguvu za kutosha
kwa kazi za siku nzima
1 2 3 4 5
11.Je,unakuibali hali ya mwili
wako 1 2 3 4 5
12. Una fedha za kutosha
kukidhi mahitaji yako
1 2 3 4 5
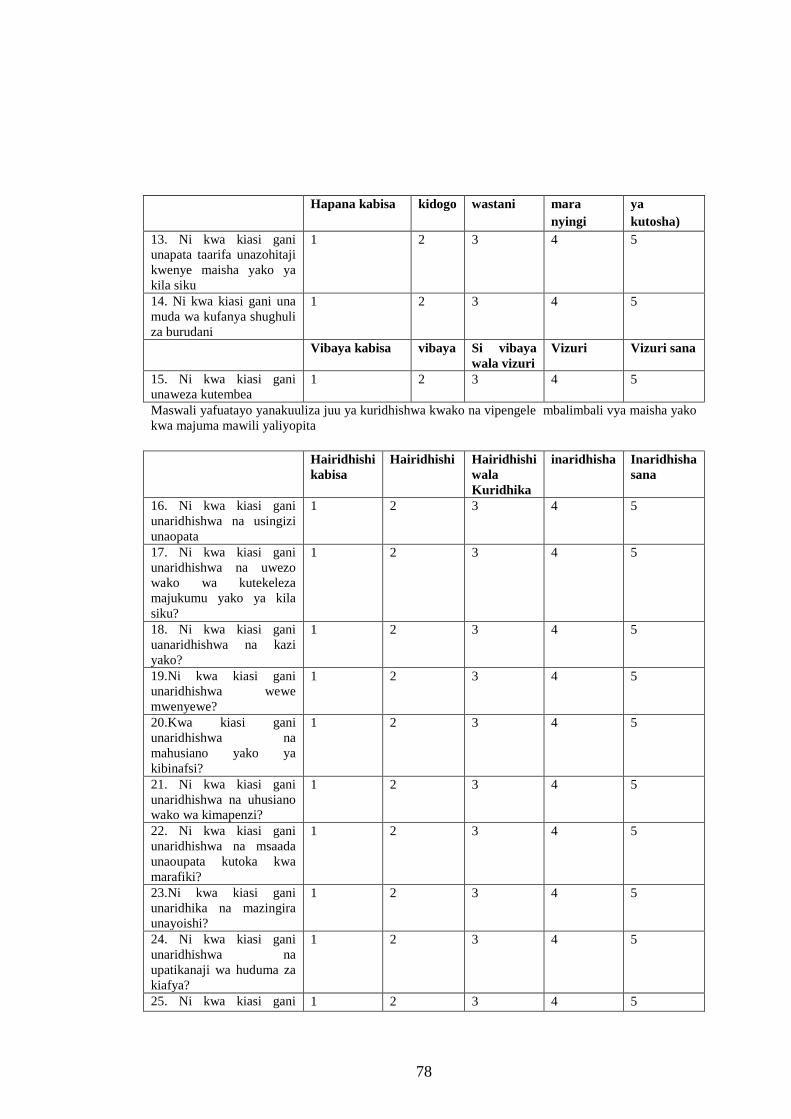
78
Hapana kabisa kidogo wastani mara
nyingi
ya
kutosha)
13. Ni kwa kiasi gani
unapata taarifa unazohitaji
kwenye maisha yako ya
kila siku
1 2 3 4 5
14. Ni kwa kiasi gani una
muda wa kufanya shughuli
za burudani
1 2 3 4 5
Vibaya kabisa vibaya Si vibaya
wala vizuri
Vizuri Vizuri sana
15. Ni kwa kiasi gani
unaweza kutembea 1 2 3 4 5
Maswali yafuatayo yanakuuliza juu ya kuridhishwa kwako na vipengele mbalimbali vya maisha yako
kwa majuma mawili yaliyopita
Hairidhishi
kabisa
Hairidhishi Hairidhishi
wala
Kuridhika
inaridhisha Inaridhisha
sana
16. Ni kwa kiasi gani
unaridhishwa na usingizi
unaopata
1 2 3 4 5
17. Ni kwa kiasi gani
unaridhishwa na uwezo
wako wa kutekeleza
majukumu yako ya kila
siku?
1 2 3 4 5
18. Ni kwa kiasi gani
uanaridhishwa na kazi
yako?
1 2 3 4 5
19.Ni kwa kiasi gani
unaridhishwa wewe
mwenyewe?
1 2 3 4 5
20.Kwa kiasi gani
unaridhishwa na
mahusiano yako ya
kibinafsi?
1 2 3 4 5
21. Ni kwa kiasi gani
unaridhishwa na uhusiano
wako wa kimapenzi?
1 2 3 4 5
22. Ni kwa kiasi gani
unaridhishwa na msaada
unaoupata kutoka kwa
marafiki?
1 2 3 4 5
23.Ni kwa kiasi gani
unaridhika na mazingira
unayoishi?
1 2 3 4 5
24. Ni kwa kiasi gani
unaridhishwa na
upatikanaji wa huduma za
kiafya?
1 2 3 4 5
25. Ni kwa kiasi gani 1 2 3 4 5
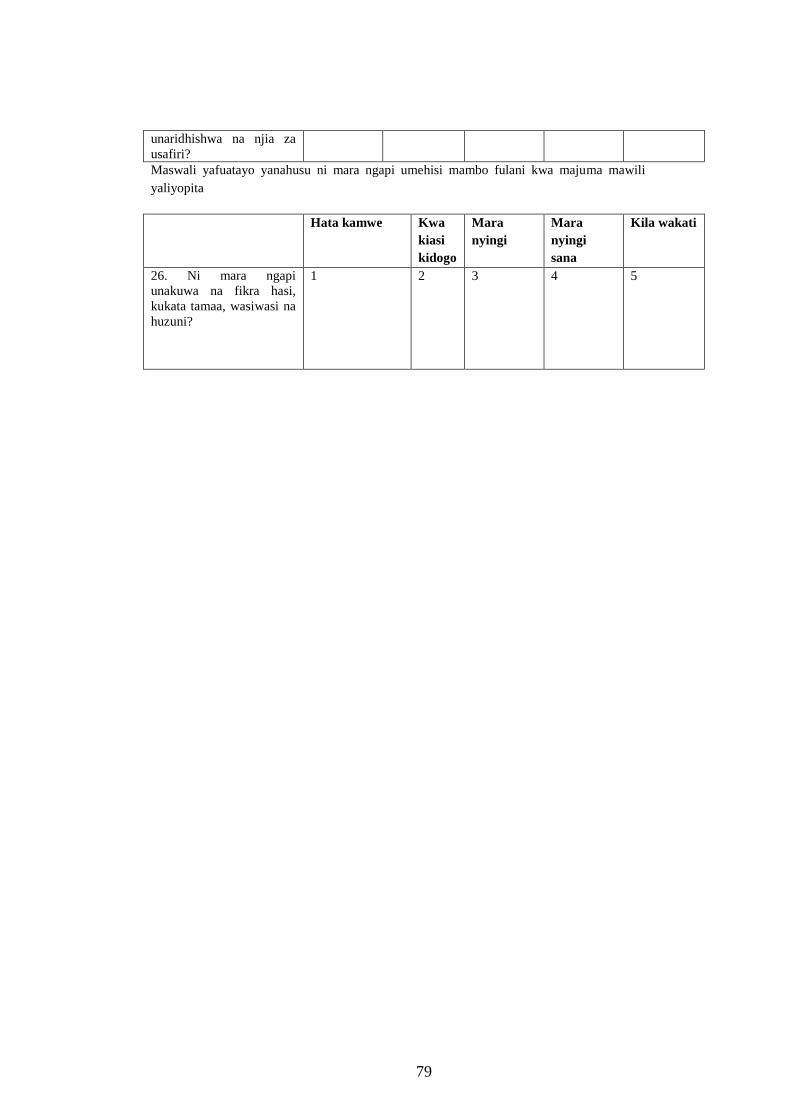
79
unaridhishwa na njia za
usafiri?
Maswali yafuatayo yanahusu ni mara ngapi umehisi mambo fulani kwa majuma mawili
yaliyopita
Hata kamwe Kwa
kiasi
kidogo
Mara
nyingi
Mara
nyingi
sana
Kila wakati
26. Ni mara ngapi
unakuwa na fikra hasi,
kukata tamaa, wasiwasi na
huzuni?
1 2 3 4 5
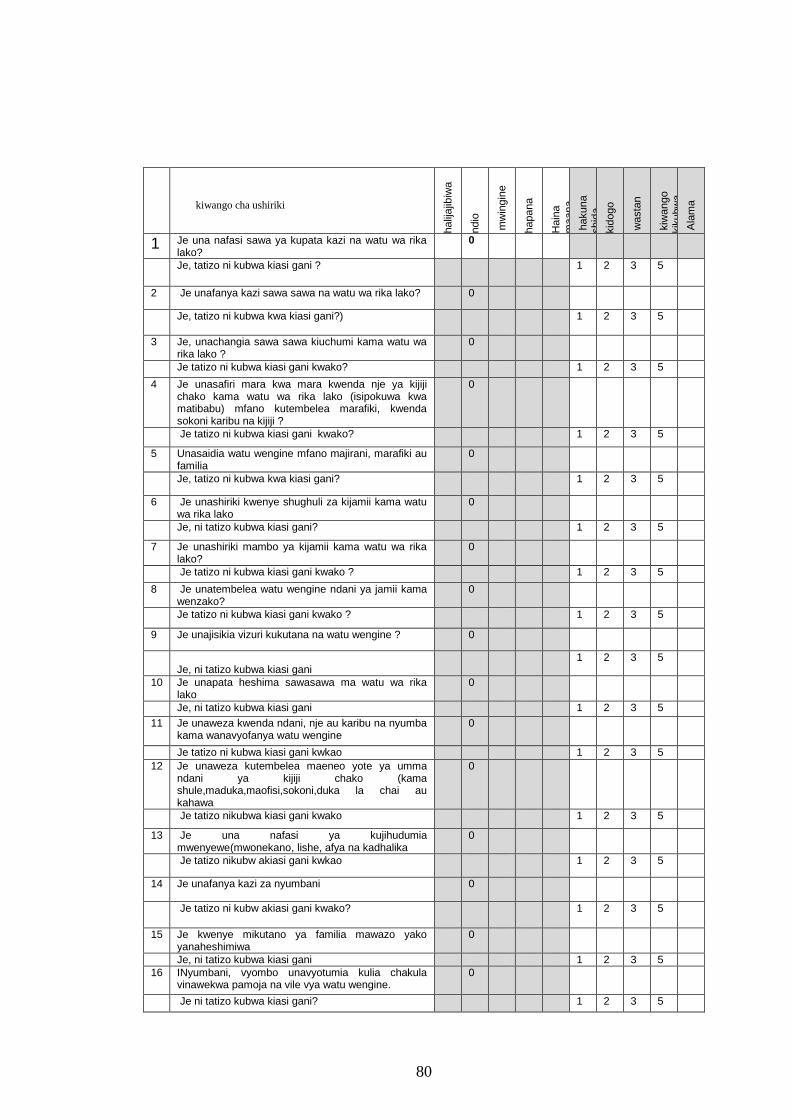
80
kiwango cha ushiriki
halij
ajib
iwa
ndio
mw
ingin
e
hapana
Hain
a
ma
ana,
sitakI
hakuna
shid
a
kid
ogo
wasta
n
kiw
ango
kik
ubw
a
Ala
ma
1 Je una nafasi sawa ya kupata kazi na watu wa rika lako?
0
Je, tatizo ni kubwa kiasi gani ? 1 2 3 5
2 Je unafanya kazi sawa sawa na watu wa rika lako? 0
Je, tatizo ni kubwa kwa kiasi gani?) 1 2 3 5
3 Je, unachangia sawa sawa kiuchumi kama watu wa rika lako ?
0
Je tatizo ni kubwa kiasi gani kwako? 1 2 3 5
4 Je unasafiri mara kwa mara kwenda nje ya kijiji chako kama watu wa rika lako (isipokuwa kwa matibabu) mfano kutembelea marafiki, kwenda sokoni karibu na kijiji ?
0
Je tatizo ni kubwa kiasi gani kwako? 1 2 3 5
5 Unasaidia watu wengine mfano majirani, marafiki au familia
0
Je, tatizo ni kubwa kwa kiasi gani? 1 2 3 5
6 Je unashiriki kwenye shughuli za kijamii kama watu wa rika lako
0
Je, ni tatizo kubwa kiasi gani? 1 2 3 5
7 Je unashiriki mambo ya kijamii kama watu wa rika lako?
0
Je tatizo ni kubwa kiasi gani kwako ? 1 2 3 5
8 Je unatembelea watu wengine ndani ya jamii kama wenzako?
0
Je tatizo ni kubwa kiasi gani kwako ? 1 2 3 5
9 Je unajisikia vizuri kukutana na watu wengine ? 0
Je, ni tatizo kubwa kiasi gani
1 2 3 5
10 Je unapata heshima sawasawa ma watu wa rika lako
0
Je, ni tatizo kubwa kiasi gani 1 2 3 5
11 Je unaweza kwenda ndani, nje au karibu na nyumba kama wanavyofanya watu wengine
0
Je tatizo ni kubwa kiasi gani kwkao 1 2 3 5
12 Je unaweza kutembelea maeneo yote ya umma ndani ya kijiji chako (kama shule,maduka,maofisi,sokoni,duka la chai au kahawa
0
Je tatizo nikubwa kiasi gani kwako 1 2 3 5
13 Je una nafasi ya kujihudumia mwenyewe(mwonekano, lishe, afya na kadhalika
0
Je tatizo nikubw akiasi gani kwkao 1 2 3 5
14 Je unafanya kazi za nyumbani 0
Je tatizo ni kubw akiasi gani kwako? 1 2 3 5
15 Je kwenye mikutano ya familia mawazo yako yanaheshimiwa
0
Je, ni tatizo kubwa kiasi gani 1 2 3 5
16 INyumbani, vyombo unavyotumia kulia chakula vinawekwa pamoja na vile vya watu wengine.
0
Je ni tatizo kubwa kiasi gani? 1 2 3 5
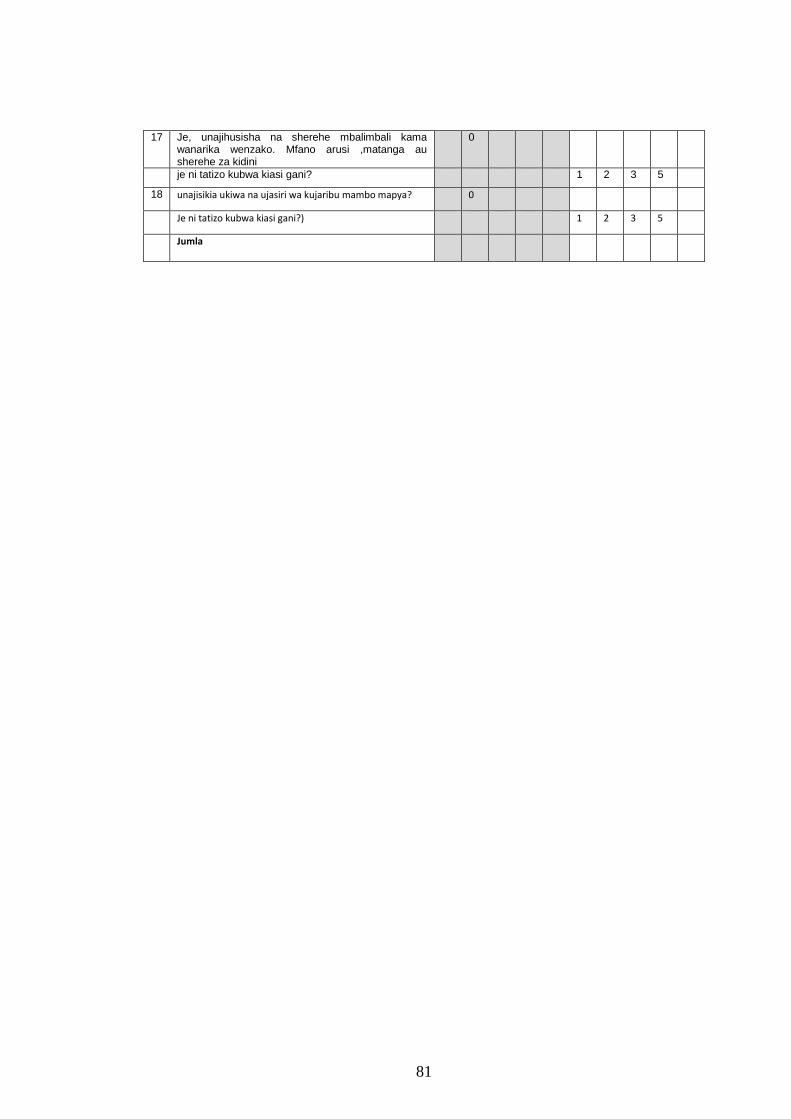
81
17 Je, unajihusisha na sherehe mbalimbali kama wanarika wenzako. Mfano arusi ,matanga au sherehe za kidini
0
je ni tatizo kubwa kiasi gani? 1 2 3 5
18 unajisikia ukiwa na ujasiri wa kujaribu mambo mapya? 0
Je ni tatizo kubwa kiasi gani?) 1 2 3 5
Jumla
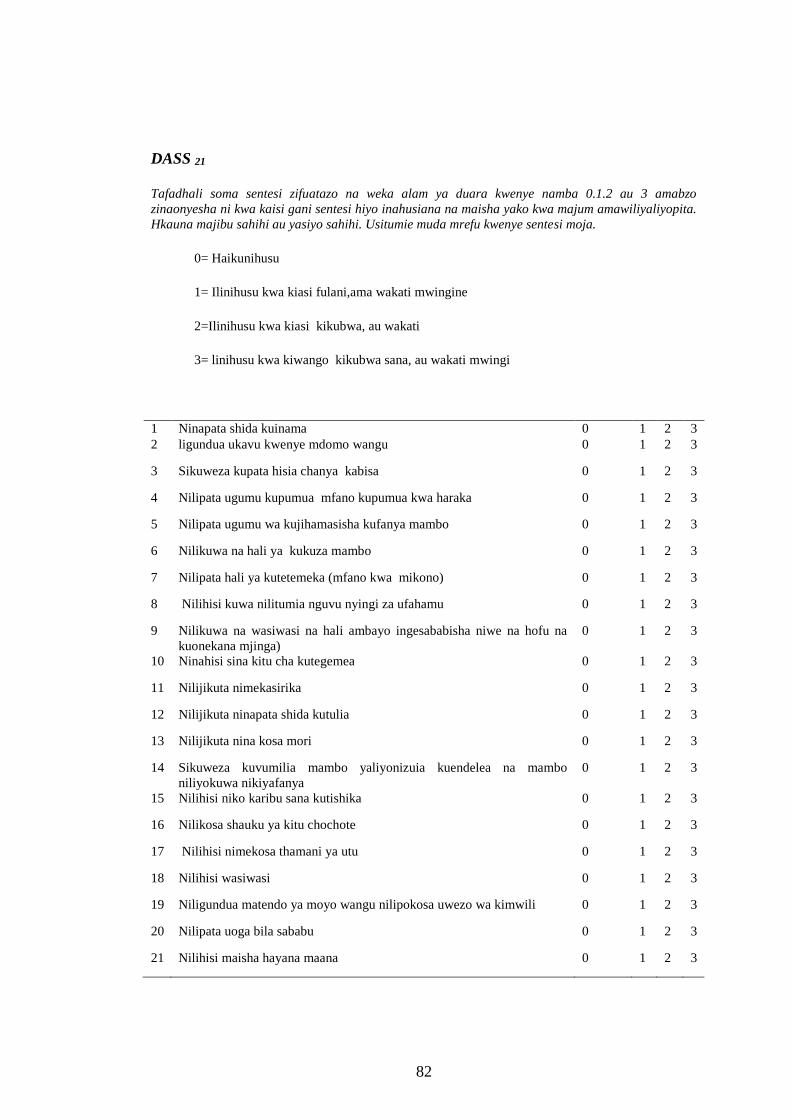
82
DASS 21
Tafadhali soma sentesi zifuatazo na weka alam ya duara kwenye namba 0.1.2 au 3 amabzo
zinaonyesha ni kwa kaisi gani sentesi hiyo inahusiana na maisha yako kwa majum amawiliyaliyopita.
Hkauna majibu sahihi au yasiyo sahihi. Usitumie muda mrefu kwenye sentesi moja.
0= Haikunihusu
1= Ilinihusu kwa kiasi fulani,ama wakati mwingine
2=Ilinihusu kwa kiasi kikubwa, au wakati
3= linihusu kwa kiwango kikubwa sana, au wakati mwingi
1 Ninapata shida kuinama 0 1 2 3
2 ligundua ukavu kwenye mdomo wangu 0 1 2 3
3 Sikuweza kupata hisia chanya kabisa 0 1 2 3
4 Nilipata ugumu kupumua mfano kupumua kwa haraka 0 1 2 3
5 Nilipata ugumu wa kujihamasisha kufanya mambo 0 1 2 3
6 Nilikuwa na hali ya kukuza mambo 0 1 2 3
7 Nilipata hali ya kutetemeka (mfano kwa mikono) 0 1 2 3
8 Nilihisi kuwa nilitumia nguvu nyingi za ufahamu 0 1 2 3
9 Nilikuwa na wasiwasi na hali ambayo ingesababisha niwe na hofu na
kuonekana mjinga)
0 1 2 3
10 Ninahisi sina kitu cha kutegemea 0 1 2 3
11 Nilijikuta nimekasirika 0 1 2 3
12 Nilijikuta ninapata shida kutulia 0 1 2 3
13 Nilijikuta nina kosa mori 0 1 2 3
14 Sikuweza kuvumilia mambo yaliyonizuia kuendelea na mambo
niliyokuwa nikiyafanya
0 1 2 3
15 Nilihisi niko karibu sana kutishika 0 1 2 3
16 Nilikosa shauku ya kitu chochote 0 1 2 3
17 Nilihisi nimekosa thamani ya utu 0 1 2 3
18 Nilihisi wasiwasi 0 1 2 3
19 Niligundua matendo ya moyo wangu nilipokosa uwezo wa kimwili 0 1 2 3
20 Nilipata uoga bila sababu 0 1 2 3
21 Nilihisi maisha hayana maana 0 1 2 3
83
Appendix III: Information Sheet
JOMO KENYATTA UNIVERSITY OF AGRICULTURE AND TECHNOLOGY
P.O. Box 62000 – 00200 NAIROBI, KENYA
+254202602270
[email protected] or [email protected]
Dear Participant,
I am a postgraduate student undertaking a master’s degree in the department of rehabilitation sciences
at the Jomo Kenyatta University of Agriculture and Technology. As part of the study I’m expected to
conduct research. The title of my research is “Correlation between psychological symptoms,
participation and quality of life amongst spinal cord injury survivors, in Kenya.” Information
gathered in this study will be important in planning a holistic approach in participation and quality of
life amongst persons with spinal cord injuries. This shall be helpful to persons with spinal cord injury
and their families in the country.If you agree to participate in this study I will consult with you to
arrange a suitable time and day for the collection of the relevant information. Participation in the study
will involve filling a questionnaire taking at least 20 minutes. The information you give will be treated
with utmost respect and confidentiality. This provides you with an opportunity to appreciate and
contribute to scientific research that may provide information about participation and quality of life
for Persons with Spinal Cord Injury that could be useful to healthcare workers and contribute to health
policies among others. There is absolutely minimal risk to you for participating in this study. It is
84
expected that you will experience minimal discomfort or stress from the questions asked in the
interview. You don’t have to respond to every question or provide information you do not want to
provide and can withdraw from participating at any time. Referral to a professional counselor in case
you suffer unexpected negative experiences will be made. Occasionally, a follow-up interview might
be necessary to clarify some information. The researcher could request your participation for the
follow-up interview before a lapse of two years. All participants will be identified using codes and the
information kept in secure filling cabinet or safe so as to safeguard their anonymity and all the
individuals directly or indirectly referred to in the questionnaire. In the future the researcher will
destroy all code lists.If you have any questions or concerns before or after the study, you may contact
me through phone or email given hereunder.
Contact numbers of researcher: Minah Kinanu Guantai
Phone: +254 729 496 639; Email: [email protected] or [email protected]
Should you have any questions regarding this study and your rights as a research participant or if you
wish to report any problems you have experienced related to the study, please contact:
Head of Rehabilitation Science Department: Supervisor – Dr Joseph Mwangi Matheri email:
[email protected] OR Dr Wallace Karuguti email [email protected] OR Dean of the
College of Health Sciences: Jomo Kenyatta University of Agriculture and Technology. P.O. Box
62000 – 00200 NAIROBI, KENYA .This research has been approved by the Jomo Kenyatta
University of Agriculture and Technology Senate Research and Ethics Committee.
85
Appendix IV: Consent Form
I...........................................................agree to participate in the study being conducted by Ms Minah
Kinanu Guantai a post-graduate student doing Master of Science degree in the department of
rehabilitation at Jomo Kenyatta University of Agriculture and Technology, Kenya. She has informed
me that this is a study for her Master of Science degree designed to gather information that will assist
in the determining the correlation between psychological symptoms, participation and quality of life
amongst spinal cord injury survivors, in Kenya.
” I understand that:
― Participation is voluntary and will involve interview taking at least 20 minutes mutually as agreed
upon by me and the researcher.
― The benefits I may expect from the study are; (a) an appreciation of scientific research and (b) an
opportunity to contribute to scientific research that may provide information about effects of
psychological symptoms on participation, and quality of life amongst spinal cord injury survivors that
could be useful to healthcare workers and contribute to health policies among others.
― The researcher does not foresee any risks to me participating in this study and it is expected that I will
experience minimal discomfort or stress from the questions asked.
― I do not have to respond to every question or provide information I do not want to provide and I can
withdraw from participating at any time.
― The researcher may contact me within two years to request for clarification of responses I will give in
the interview.
― Codes identifying participants will be kept in secure filling cabinet or safe so as to safeguard the
anonymity of myself and all the individuals directly or indirectly referred to in the questionnaire(s). I
understand that in the future the researcher will destroy all codes lists.
― Only people associated with the study will see/listen to my responses. To protect privacy pseudonyms
will be assigned for publications and presentations, unless written consent is provided. My responses
will not be associated with my name: instead my name will be converted to a code number when the
researcher stores the data.
86
― The researcher will answer any other questions about the research either before or after the research. If
I have other questions or concerns I can address them to the researcher by email or phone.
Contact numbers of researcher: Minah Kinanu Guantai
Phone: +254 729 496 639; Email: [email protected] or [email protected]
Head of Rehabilitation Science Department: Supervisor – Dr. Joseph Mwangi Matheri email:
[email protected] OR Dr. Wallace Karuguti email [email protected] OR Dean of the
College of Health Sciences: Jomo Kenyatta University of Agriculture and Technology. P.O. Box
62000 – 00200 NAIROBI, KENYA .This research has been approved by the Jomo Kenyatta
University of Agriculture and Technology Senate Research and Ethics Committee.
Signature: Witness:
I Agree/decline; during my participation in this study and I understand I may withdraw from participating at any time.
87
Appendix V: Taarifa
Ndugu mshiriki,
Mimi, ni mwanafunzi anaesomea shahada ya pili katika idara ya tiba ya mwili katika Chuo Kikuu cha
Jomo Kenyatta University of Agriculture and Technology. Kama sehemu ya masomo hayo
ninatarajiwa kufanya utafiti. Kichwa cha utafiti wangu ni 'Athari za Dalili za kisaikolojiaJuu ya
kushiriki, na maisha bora miongoni mwa waathirika wa Uti wa mgongo, Kenya.' Kwa hiyo, ili
kukamilisha lengo hili, moja ya malengo muhimu ni mipango na mfumo wa jumla katika kushiriki, na
maisha bora miongoni mwa waathirika wa Uti wa mgongo, Napia katika kusaidia waathirika wa Uti
wa mgongo na familia zao katika nchi ya Kenya kwa muda mrefu. Kama unakubali kushiriki katika
utafiti huu mimi nitashauriana na wewe kupanga muda muafaka na siku kwa minajili ya ukusanyaji
wa habari husika. Kushiriki katika utafiti huu utahusisha kushiriki kikamilifu katika majadiliano ya
kundi itakayochukua angalau dakika ishirin (20). Habari utakazotoa zitawekwa kama siri na kwa
heshima kubwa.Hii inakupa fursa kubwa kuchangia utafiti wa kisayansi ambayo inaweza kutoa taarifa
juu ya changamoto zinazowakabili walemavu za kihuduma na misaada ya kibinafsi. Hii inaweza kuwa
na manufaa kwa wafanyakazi wa idara ya afya, utetezi wa haki za binadamu na kwa makundi ya
waathirika wa Uti wa mgongo miongoni mwa wengine. Kuna hatari ndogo kabisa kuwa kushiriki
katika utafiti huu.
Inatarajiwa kuwa utakuwa na usumbufu ndogo au dhiki kutoka kuulizwa maswali wakati wa
majadiliano ya kundi. Sio lazima ujibu kila swali au kutoa taarifa usizotaka kutoa na unaweza kukosa
kushiriki wakati wowote. Utaelekezwa kwa mshauri mtaalamu katika ukipatikana unateseka
kusiyotarajiwa.
Mara kwa mara, kuwezekana watafiti kukufuata ili uweze kufafanua baadhi ya habari iliyo kuwa
muhimu wakati wa mahojiano. Mtafiti inaweza kuomba ushirika kama huo wa mahojiano kabla ya
miaka miwili kuisha. Washiriki wote watatambuliwa kwa kutumia kodi na habari zao zitawekwa
salama kwa sefu ili kuhifadhi usalama wa majina ya watu wote waliyoshiriki kwa utafiti. Katika siku
zijazo mtafiti mkuu ataharibu orodha yote ya kanuni na kanda. Kama una maswali yoyote au wasiwasi
kabla au baada ya utafiti, unaweza kuwasiliana na mimi kwa njia ya simu au barua pepe.
88
Ukiwa una maswali yoyote kuhusu utafiti huu au haki yako kama mshiriki au kama una matatizo
yoyote tafadhali unaweza kuwasiliana wasiliana, na wafuatao:
Should you have any questions regarding this study and your rights as a research participant or if you
wish to report any problems you have experienced related to the study, please contact:
Head of Rehabilitation Science Department: Supervisor – Dr Joseph Mwangi Matheri email:
[email protected] Dr Wallace Karuguti [email protected] Dean of the
College of Health Sciences: Jomo Kenyatta University of Agriculture and Technology. P.O. Box
62000 – 00200 NAIROBI, KENYA
This research has been approved by the Jomo Kenyatta University of Agriculture and Technology
Senate Research and Ethics Committee.
Contact numbers of researcher: Minah Kinanu Guantai
Phone: +254 729 496 639; Email: [email protected] or [email protected]
89
Appendix VI: Fomu ya Idhini
Jina la Utafiti wa Mradi: Athari za Dalili za kisaikolojiaJuu ya kushiriki, na maisha bora miongoni
mwa waathirika wa uti wa mgongo,KenyaKwa uhuru na kwa hiari yangu ninakukubali kushiriki
katika kundi hili la mjadala kuhusu huduma na misaada kwa watu wenye ulemavu. Nimekukubali
sauti yangu iwekwe kuwa mkanda wakati wa ushirika wangu katika utafiti huu wa dakika tisaini.
Nakubaliana sitatoa taarifa yoyote itakayojadiliwa na kundi hili. Mjadala huu unafanywa na timu ya
Bi Minah Kinanu Guantai ambaye ni mwanafunzi katika Chuo Kikuu cha Jomo Kenyatta University
of Agriculture and Technology, Kenya. Naelewa kwamba madhumuni ya utafiti ni kuwa na
majadiliano ya kundi na kutoa maoni yangu ya changamoto za huduma na misaada zinazowakabili
waathirika wa uti wa mgongo eneo langu. Majadiliano itahusu changamoto chanya na hasi za
waathirika wa uti wa mgongo, za kikazi, wanavyoishi kwa kujitegemea, na huduma zinazotolewa na
mashirika kama vile afya, ukarabati, elimu, vituo vya muhula, huduma za jamii au NGO. Naelewa
kwamba utambulisho wangu hautafunuliwa na kwamba naweza kuondoka kwa utafiti au kuondoka
chumbani wakati wowote bila ya kutoa sababu. Naelewa kwamba hata kama au sitashiriki, na maoni
yoyote nitakayotoa wakati wa majadiliano, haitaathiri faida yangu au haki ya kupokea huduma kwa
wakati huu au katika siku zijazo.Naelewa kwamba sitaweza kupokea faida yoyote moja kwa moja
kutoka kushiriki katika utafiti, lakini kushiriki kwangu kunaweza kusaidia wengine katika siku zijazo.
Ninaelewa kwamba nitapokea Shilingi mia tano (500) za Kenya ya nauli yangu. Nimejibiwa maswali
yangu yote kuhusu utafiti huu kwa lugha minayoelewa. Pia nimeelzwa chenye ninahitajika kufanya
wakati wa utafiti. Nimesoma na kuelewa maelezo haya na nimekubali kushiriki katika utafiti huu.
Jina la mshiriki ........................................ Sahihi ya mshiriki...........................
Shahidi ....................................................... Tarehe ...........................
Kama, una maswali yoyote kuhusu utafiti huu au unataka ripoti ya matatizo yoyote kuhusiana na
utafiti huu, tafadhali wasiliana na mtafiti mkuu, au msimamizi au katibu JKUAT - ERC.
Contact numbers of researcher: Minah Kinanu Guantai Phone: +254 729 496 639; Email:
[email protected] or [email protected] of Rehabilitation Science Department:
Supervisor – Dr Joseph Mwangi Matheri email: [email protected] Dr Wallace Karuguti

90
[email protected] OR Dean of the College of Health Sciences: Jomo Kenyatta
University of Agriculture and Technology. P.O. Box 62000 – 00200 NAIROBI, KENYA
This research has been approved by the Jomo Kenyatta University of Agriculture and Technology
Senate Research and Ethics Committee.
91
Appendix VII: Board of Post Graduate Approval
92
Appendix VIII: Ethical Clearance JKUAT-ERC
93
Appendix IX: Authority from NACOSTI
94
Appendix X: NACOSTI PERMIT
95
Appendix XI: Authority from County Commissioner Nairobi
96
Appendix XII: Authority from Ministry of Health Nairobi County
97
Appendix XIII: Authority from Ministry of Education Nairobi County
98
Appendix XIV: Permission from National Spinal Cord Injury Hospital
99
Appendix XV: Authority from Commissioner Machakos County
100
Appendix XVI: Authority from Ministry of Education Machakos County
101
Appendix XVII: Authority from Ministry of Health Machakos County
102
Appendix XVIII: Permission from Machakos Level 5 Hospital
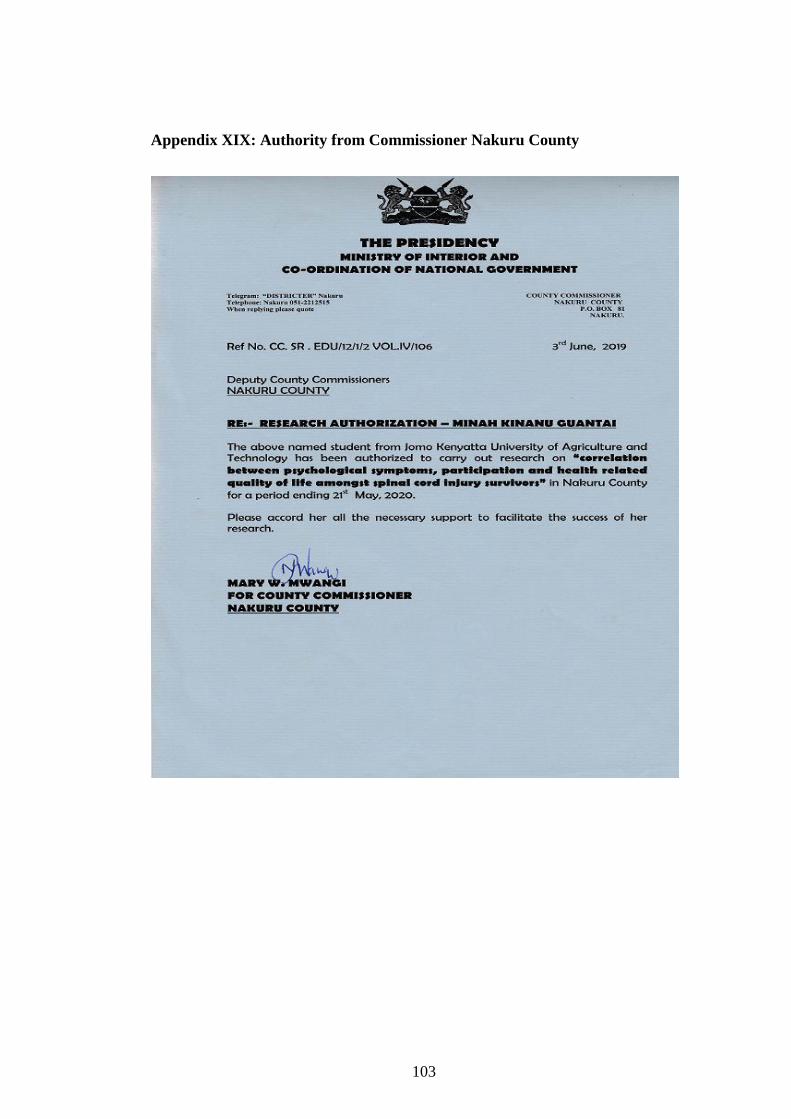
103
Appendix XIX: Authority from Commissioner Nakuru County
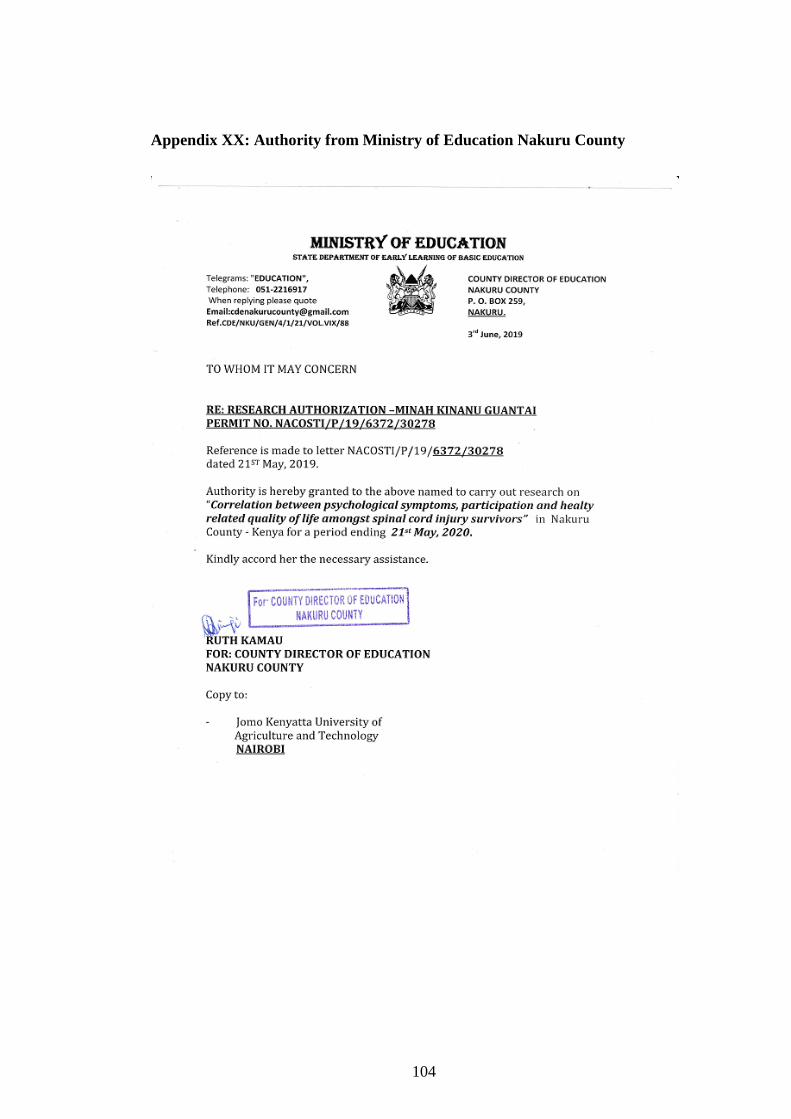
104
Appendix XX: Authority from Ministry of Education Nakuru County
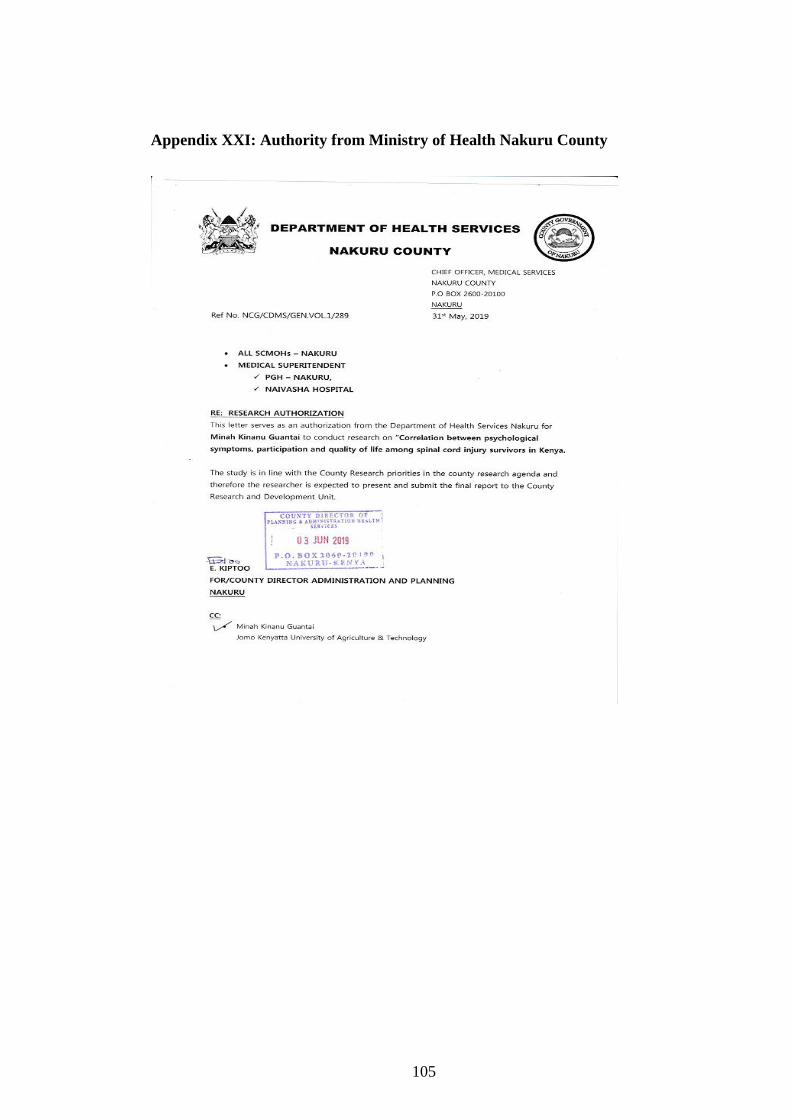
105
Appendix XXI: Authority from Ministry of Health Nakuru County
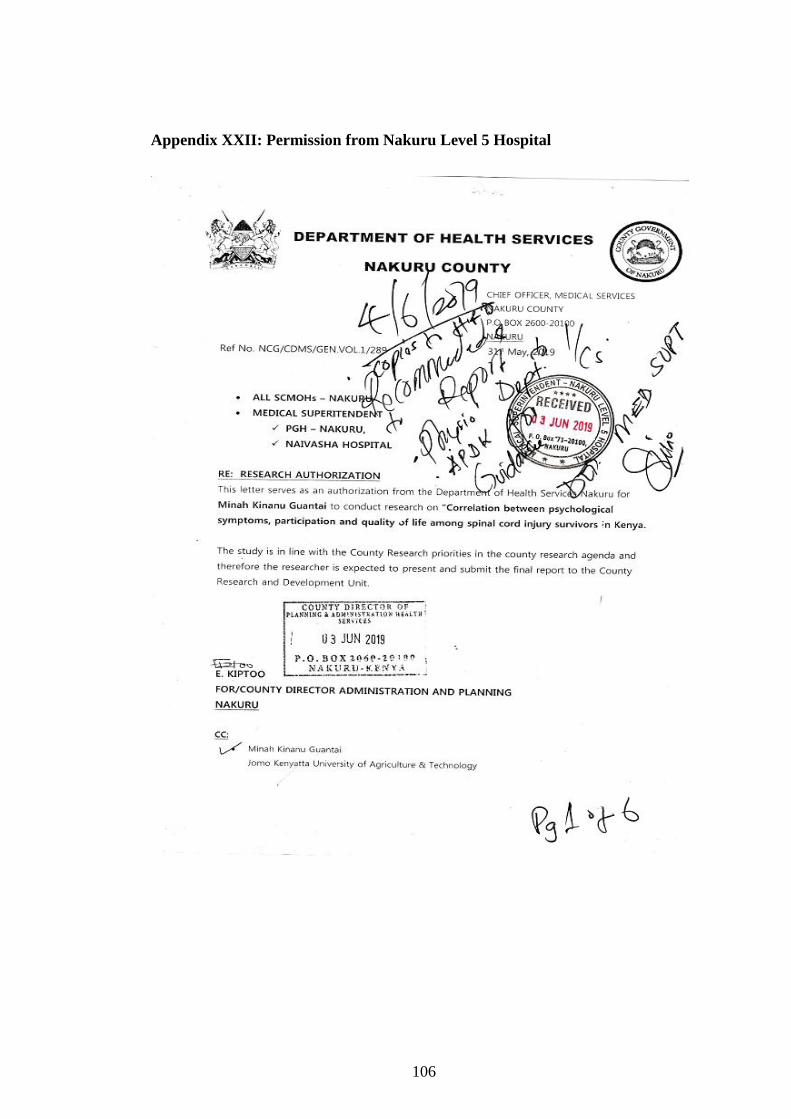
106
Appendix XXII: Permission from Nakuru Level 5 Hospital
107
Appendix XXIII: Permission from Naivasha County Referal Hospital
Related Documents


![[PPT] Managing Behavioural and Psychological Symptoms of ...](https://static.cupdf.com/doc/110x72/5590cf781a28ab11398b468d/ppt-managing-behavioural-and-psychological-symptoms-of-.jpg)


