A. Blenkmann, G. Seifer, J.P. Princich, D. Consalvo, S. Kochen, C. Muravchik. Association between equivalent current dipole source localization and focal cortical dysplasia in epilepsy patients. Epilepsy Research, 2012. 98, 223-23. http://dx.doi.org/10.1016/j.eplepsyres.2011.09.018 . Author’s version. Association between equivalent current dipole source localization and focal cortical dysplasia in epilepsy patients Alejandro Blenkmann 1,2,3,4 * , Gustavo Seifer 1,2 , Juan Pablo Princich 1,2,4 , Damian Consalvo 1,2 , Silvia Kochen 1,2,4 , Carlos Muravchik 3 1. IBCN “Dr. E. de Robertis”, School of Medicine, University of Buenos Aires, Paraguay 2155 (1121), Ciudad Autónoma de Buenos Aires, Argentina. 2. Department of Neurology, Ramos Mejía Hospital, Urquiza 609 (1221), Ciudad Autónoma de Buenos Aires, Argentina. 3. LEICI, School of Engineering, National University of La Plata, Calle 1 esquina 47 (1900), La Plata, Argentina. 4. National Scientific and Technical Research Council (CONICET), Ciudad Autónoma de Buenos Aires, Argentina. *Corresponding author: Alejandro Blenkmann, IBCN “Dr. E. de Robertis”, School of Medicine, University of Buenos Aires, Paraguay 2155 (1121), Ciudad Autónoma de Buenos Aires, Argentina. Phone/Fax: +54 (11) 5950-9626. email: [email protected] Abstract We analysed the association between focal cortical dysplasia (FCD) visible in MRI and the location of equivalent current dipole (ECD) of single interictal scalp EEG spikes (IIS) in 11 epilepsy patients. We calculated several indicators of distance of ECDs to the FCD border. The results confirm some previous studies suggesting that the epileptogenic zone associated to the location of ECDs extends beyond the FCD visible in MRI. The analysis suggests the ECDs to be in a shell parallel to part of the FCD surface.

Welcome message from author
This document is posted to help you gain knowledge. Please leave a comment to let me know what you think about it! Share it to your friends and learn new things together.
Transcript
A. Blenkmann, G. Seifer, J.P. Princich, D. Consalvo, S. Kochen, C. Muravchik. Association between equivalent current dipole source localization and focal cortical dysplasia in epilepsy patients. Epilepsy Research, 2012. 98, 223-23. http://dx.doi.org/10.1016/j.eplepsyres.2011.09.018 . Author’s version.
Association between equivalent current dipole
source localization and focal cortical dysplasia in
epilepsy patients
Alejandro Blenkmann1,2,3,4 *, Gustavo Seifer1,2, Juan Pablo Princich1,2,4, Damian
Consalvo1,2, Silvia Kochen1,2,4, Carlos Muravchik3
1. IBCN “Dr. E. de Robertis”, School of Medicine, University of Buenos Aires, Paraguay 2155 (1121),
Ciudad Autónoma de Buenos Aires, Argentina.
2. Department of Neurology, Ramos Mejía Hospital, Urquiza 609 (1221), Ciudad Autónoma de Buenos
Aires, Argentina.
3. LEICI, School of Engineering, National University of La Plata, Calle 1 esquina 47 (1900), La Plata,
Argentina.
4. National Scientific and Technical Research Council (CONICET), Ciudad Autónoma de Buenos Aires,
Argentina.
*Corresponding author: Alejandro Blenkmann, IBCN “Dr. E. de Robertis”, School of Medicine,
University of Buenos Aires, Paraguay 2155 (1121), Ciudad Autónoma de Buenos Aires, Argentina.
Phone/Fax: +54 (11) 5950-9626. email: [email protected]
Abstract
We analysed the association between focal cortical dysplasia (FCD) visible in MRI and the
location of equivalent current dipole (ECD) of single interictal scalp EEG spikes (IIS) in 11
epilepsy patients. We calculated several indicators of distance of ECDs to the FCD border.
The results confirm some previous studies suggesting that the epileptogenic zone associated
to the location of ECDs extends beyond the FCD visible in MRI. The analysis suggests the
ECDs to be in a shell parallel to part of the FCD surface.
A. Blenkmann, G. Seifer, J.P. Princich, D. Consalvo, S. Kochen, C. Muravchik. Association between equivalent current dipole source localization and focal cortical dysplasia in epilepsy patients. Epilepsy Research, 2012. 98, 223-23. http://dx.doi.org/10.1016/j.eplepsyres.2011.09.018 . Author’s version.
Keywords
Focal cortical dysplasia; equivalent current dipole; magnetic resonance imaging; inverse
problem; epileptogenic zone.
1. Introduction
We analysed the association between the localization of focal cortical dysplasia (FCD) and
epileptic neural sources modelled by equivalent current dipoles (ECD). FCD, first described
in (Taylor et al., 1971), are malformations of cortical development, associated with
phenotypic cellular abnormalities that may be the result of abnormal differentiation and/or
proliferation. Several studies reported that FCD are intrinsically epileptogenic and that most
patients often present drug resistant epilepsy (Mattia et al., 1994; Morioka et al., 1999; Bast et
al., 2004; Palmini et al., 2004; Widjaja et al., 2008; Lerner et al., 2009; Palmini, 2010).
Resective surgery is frequently a promising therapy in this population. However, the outcome
following surgical treatment of these patients has been less successful than in other
pathologies such as hippocampal sclerosis, even if the entire magnetic resonance images
(MRI) visible lesion is removed (Rosenow and Lüders, 2001; Lerner et al., 2009). The
surgical failure in these patients may be due to the presence of a more extensive, non-MRI
visible, epileptogenic FCD (Widdess-Walsh et al., 2006). The key for the success of surgical
treatment is the accurate definition of the “epileptogenic zone” (EZ), the area of cortex that is
indispensable for the generation of epileptic seizures (Chauvel et al., 1987; Rosenow and
Lüders, 2001). Today the gold-standard method to define the EZ is the intracranial recording,
an invasive procedure that increases morbidity and mortality. In addition, it demands an
important amount of materials and human resources. These facts reduce the number of
patients undergoing epilepsy surgery, which is below the number of cases for whom it is
indicated. This situation is especially notorious in developing countries. In this scenario, non-
invasive studies to define EZ are highly desirable (Radhakrishnan, 2009).
The study of the EZ involves the “irritative zone” (IZ), the area of cortex responsible for the
A. Blenkmann, G. Seifer, J.P. Princich, D. Consalvo, S. Kochen, C. Muravchik. Association between equivalent current dipole source localization and focal cortical dysplasia in epilepsy patients. Epilepsy Research, 2012. 98, 223-23. http://dx.doi.org/10.1016/j.eplepsyres.2011.09.018 . Author’s version.
scalp electroencephalography (EEG) interictal spikes (IIS). Both of these zones are also
related to the onset zone of seizures (Chauvel et al., 1987; Rosenow and Lüders, 2001). IIS
neural sources can be located solving the so-called inverse problem with an ECD model. The
ECD based on scalp EEG is the most often used model for non-invasively estimating the
source of cerebral activity, specially to localize the origin of IIS activity (Michel et al., 2004;
Ebersole and Howes-Ebersole, 2007; Plummer et al., 2008). The ECD model assumes that the
electromagnetic source in the brain is constrained to a cortical area of small size compared to
its depth, i.e. to its radial distance to the scalp. The application of this model in patients with
epilepsy and FCD was reported in (Bast et al., 2004; Gavaret et al., 2009) using EEG and
(Otsubo et al., 2001; Bast et al., 2004; RamachandranNair et al., 2007; Widjaja et al., 2008)
using magnetoencephalography (MEG).
This study aims to validate, in the pre-surgical evaluation of epilepsy patients with FCD, the
association between the diagnosed lesion visible in MRI and the relative spatial distribution of
ECDs as sources localized from single IIS, using 64 channel scalp EEG.
2. Materials and methods
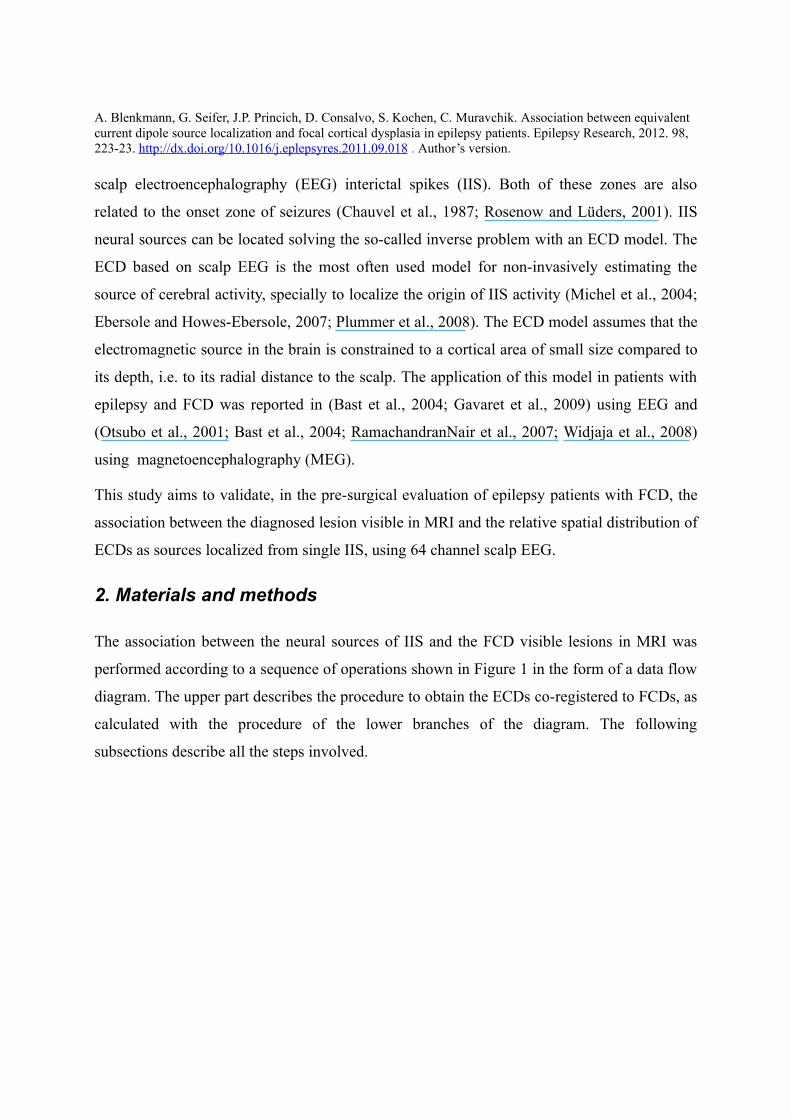
The association between the neural sources of IIS and the FCD visible lesions in MRI was
performed according to a sequence of operations shown in Figure 1 in the form of a data flow
diagram. The upper part describes the procedure to obtain the ECDs co-registered to FCDs, as
calculated with the procedure of the lower branches of the diagram. The following
subsections describe all the steps involved.
A. Blenkmann, G. Seifer, J.P. Princich, D. Consalvo, S. Kochen, C. Muravchik. Association between equivalent current dipole source localization and focal cortical dysplasia in epilepsy patients. Epilepsy Research, 2012. 98, 223-23. http://dx.doi.org/10.1016/j.eplepsyres.2011.09.018 . Author’s version.
Figure 1. Data flow diagram depicting the sequence of operations performed to obtain equivalent
current dipoles (ECD) from interictal spikes (IIS) and study its association with focal cortical
dysplasia (FCD) visible lesions in MRI. The boxes represent processing steps and the lines the
obtained data.
2.1 Patients selection
Patients were evaluated prospectively at the Epilepsy Center of the Ramos Mejía Hospital
between 2007 and 2009 using our institutional protocol for the diagnosis of epilepsy (Kochen
et al., 2002). A group of 15 patients with drug resistant epilepsy (Kwan et al., 2010) and
diagnosis of FCD was selected according to the recent clinicopathological classification of
FCD (Blümcke et al., 2010). The patients included were assumed to be FCD Type I or II and
those that evidenced an associated pathology, i.e. FCD Type III, were excluded from the
study.
Patients had a comprehensive evaluation of history and neurological examination,
neuropsychological testing, routine MRI and standard EEG recording. The collected data
A. Blenkmann, G. Seifer, J.P. Princich, D. Consalvo, S. Kochen, C. Muravchik. Association between equivalent current dipole source localization and focal cortical dysplasia in epilepsy patients. Epilepsy Research, 2012. 98, 223-23. http://dx.doi.org/10.1016/j.eplepsyres.2011.09.018 . Author’s version.
about ictal semiology was considered with regards to patient and relatives history, sex, age at
seizure onset, seizure types according to International League Against Epilepsy (ILAE)
classification 1981, response to treatment and frequency of seizures (Commission on
Classification and Terminology of the ILAE, 1981; Kwan et al., 2010).
All patients met conventional MRI criteria suggesting FCD including gyration anomalies,
focal thickenings of the cortex, blurring of the grey–white matter junction, and abnormal
cortical and subcortical signal intensity or transmantle characteristics (Barkovich et al., 1996).
The study was approved by the research ethics committee of the Ramos Mejía Hospital.
Patients (and parents) gave their informed consent accepting the procedures in this study and
the use of the information.
2.2 EEG and electrode positions acquisition
We recorded high resolution EEG (HR-EEG) data from each patient with a 64 channel
amplifier Bioscience EEG64 (Bioscience SRL, Argentina). Hardware filter frequency
bandpass was 0.5-70 Hz (-3dB) and sampling rate was set to 200 Hz. Harmonie 5.2 software
(Stellate Systems Inc., Canada) was used to acquire data. Scalp electrodes were mounted on
an Electro-cap according to the international 10-10 system of electrode placement (including
F9/10, FT9/10, T9/10, TP9/10 and P9/10) (Bio-Logic Systems Corp, USA). Recordings were
referenced to average mastoidal electrodes. During acquisition sessions, patients were relaxed
and asked to lie down with closed eyes for 2-3 hours.
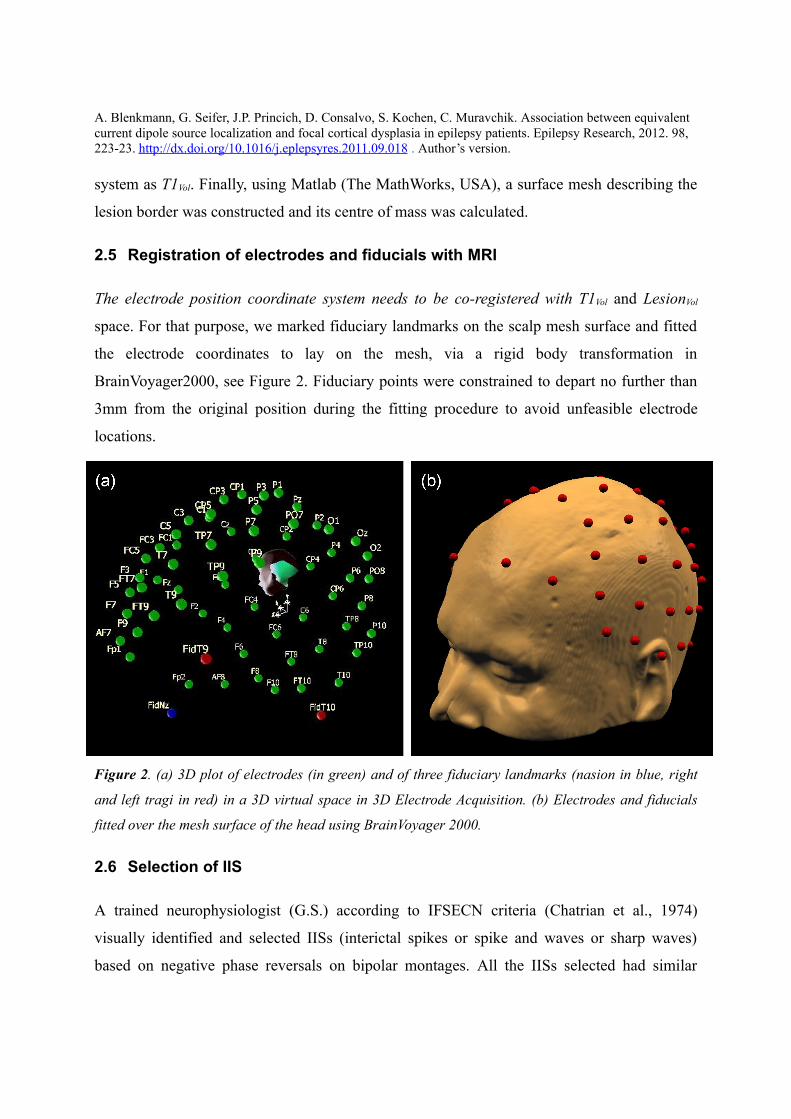
Before EEG recording started, we registered spatial coordinates of all electrodes and of three
fiduciary landmarks (nasion, right and left tragi) with a three-dimension digitizer system
PATRIOT (Polhemus, USA) and 3D Electrode Acquisition software developed by our group
(San Martín et al., 2007). Two position sensors were used, namely a primary pen type sensor
to acquire electrode and fiduciary points and a secondary sensor, fixed to the cap, as a position
reference. The secondary sensor was used to mitigate measurement errors due to unavoidable
head movements during the long acquisition procedure. After acquiring all electrode and
fiducial positions, our software showed all the points on a 3D plot (Figure 2) and a simple
A. Blenkmann, G. Seifer, J.P. Princich, D. Consalvo, S. Kochen, C. Muravchik. Association between equivalent current dipole source localization and focal cortical dysplasia in epilepsy patients. Epilepsy Research, 2012. 98, 223-23. http://dx.doi.org/10.1016/j.eplepsyres.2011.09.018 . Author’s version.
visual inspection was made to check that digitalized positions were correct. In addition, the
software provided a self validation procedure to check, among other features, for admissible
electrode position variance.
2.3 Image Acquisition and Processing
In a second instance, patients were scanned with the same 1.5T MRI unit (Intera, Philips
Medical Systems, Best, Netherlands). The acquired images were structural high-resolution
3D, T1-weighted spoiled gradient recovery volume (TR/TE/TI=9.2/4.2/450 ms, matrix
256×256, bandwidth 31.2 KHz, field of view 256×256 mm, slice thickness 1mm) with a final
isotropic resolution of 1 mm. Depending on head sizes, approximately 160 slices in the axial
plane were acquired and stored in DICOM format. Then, a 3D volume reconstruction,
designated T1Vol from now on, was made of each patient head using MRIcron software (Chris
Rorden's MRIcron, USA) in NIfTI format. A high resolution mesh of 32768 triangles of the
scalp surface was subsequently constructed from this volume using an iterative morphing
algorithm in BrainVoyager2000 software (Brain Innovation, The Netherlands).
In addition, all subjects were scanned with a 2D fluid attenuated inversion recovery (FLAIR)
sequence (TR/TE/TI=10,000/147/2,200 ms, matrix 192×256, bandwidth 15.6 KHz, field of
view 240×240 cm, slice thickness between 4 and 5 mm, no gap) in the coronal and axial
planes. The integrity of white matter tracts was also evaluated by means of diffusion tensor
imaging (DTI) MRI (Princich et al., 2010).
2.4 Lesion marking and processing
The more sensitive FLAIR sequence overlaid into the high resolution T1 were mainly used to
depict the shape and location of the lesion, see Figure 3. Using a Volume of Interest (VOI)
pen tool in MRIcron, an experienced neuroradiologist (J.P.P.) marked the voxels
corresponding to the suspected FCD on each slice (axial, sagittal and coronal) according to
previously established criteria (Barkovich et al., 1996; Barkovich et al., 2005; Colombo et al.,
2009). Thus, we obtained the set of voxels enclosing the anatomical lesion for each subject.
These VOIs denoted LesionVol, were then converted to NIfTI format in the same coordinate
A. Blenkmann, G. Seifer, J.P. Princich, D. Consalvo, S. Kochen, C. Muravchik. Association between equivalent current dipole source localization and focal cortical dysplasia in epilepsy patients. Epilepsy Research, 2012. 98, 223-23. http://dx.doi.org/10.1016/j.eplepsyres.2011.09.018 . Author’s version.
system as T1Vol. Finally, using Matlab (The MathWorks, USA), a surface mesh describing the
lesion border was constructed and its centre of mass was calculated.
2.5 Registration of electrodes and fiducials with MRI
The electrode position coordinate system needs to be co-registered with T1Vol and LesionVol
space. For that purpose, we marked fiduciary landmarks on the scalp mesh surface and fitted
the electrode coordinates to lay on the mesh, via a rigid body transformation in
BrainVoyager2000, see Figure 2. Fiduciary points were constrained to depart no further than
3mm from the original position during the fitting procedure to avoid unfeasible electrode
locations.
Figure 2. (a) 3D plot of electrodes (in green) and of three fiduciary landmarks (nasion in blue, right
and left tragi in red) in a 3D virtual space in 3D Electrode Acquisition. (b) Electrodes and fiducials
fitted over the mesh surface of the head using BrainVoyager 2000.
2.6 Selection of IIS
A trained neurophysiologist (G.S.) according to IFSECN criteria (Chatrian et al., 1974)
visually identified and selected IISs (interictal spikes or spike and waves or sharp waves)
based on negative phase reversals on bipolar montages. All the IISs selected had similar
A. Blenkmann, G. Seifer, J.P. Princich, D. Consalvo, S. Kochen, C. Muravchik. Association between equivalent current dipole source localization and focal cortical dysplasia in epilepsy patients. Epilepsy Research, 2012. 98, 223-23. http://dx.doi.org/10.1016/j.eplepsyres.2011.09.018 . Author’s version.
morphology and same scalp potential distribution. Afterwards, IISs were extracted in epochs
of 400 milliseconds (200 milliseconds before and after the highest amplitude) and loaded into
Matlab. We defined “spike interval” as the signal having more than 50% of the maximum
power in the IIS epoch. The rest of the epoch was defined as “background activity interval”.
Finally, SNR of every single IIS was calculated as the mean power of the spike interval over
the mean power of the background activity interval. IISs with SNR smaller than 1.5 were
discarded. We observe that no IIS data was averaged.
2.7 ECD localization of IIS neural sources
IIS epochs were analysed using Source Analysis module of Brain Electrical Source Analysis
v5.1 (BESA) software (MEGIS Software GmbH, Germany). A high-pass filter at 3 Hz and a
low-pass filter at 40 Hz were applied to all channels. Normally, 2 to 5 channels having
artifacts were excluded. Source localization for each single IIS was obtained solving the
inverse problem with an ECD model of fixed location, fixed orientation and time varying
amplitude. A four-shell ellipsoidal head model was used to solve the direct problem using the
co-registered electrode position information. This model is utilized to compute the electric
potential distribution on the scalp and to compare the values at the electrode locations with the
actual measurements. Each of the layers in the model was assumed to have a constant value of
homogeneous and isotropic conductivity relative to CSF. Thus, scalp, bone, and brain
conductivities were set to 0.3300, 0.0042, and 0.3300 respectively. The ellipsoid axes of the
outer shell were determined from the electrode positions over the scalp and the thickness of
the layers were taken as 6.00, 7.00, and 1.00 mm for scalp, bone, and CSF respectively.
We assumed focal epileptogenic sources in these patients therefore, the source localization
procedure was set to estimate a single focal source with one ECD. For each IIS the ECD was
calculated fitting the zone of maximum energy (approximately +- 6ms from peak). When the
first component of the principal component analysis (PCA) of the signal was larger than 90%
the dipole was declared valid; when it was less, the IIS was discarded.
The ECD stability was tested using (Gavaret et al., 2004) criteria, i.e. checking that the
location of the ECD didn't change significantly when solving the inverse problem on smaller
A. Blenkmann, G. Seifer, J.P. Princich, D. Consalvo, S. Kochen, C. Muravchik. Association between equivalent current dipole source localization and focal cortical dysplasia in epilepsy patients. Epilepsy Research, 2012. 98, 223-23. http://dx.doi.org/10.1016/j.eplepsyres.2011.09.018 . Author’s version.
parts of IIS maximum energy zone. If the ECD location remained stable in a small and limited
cortex area on a period of time of 20 to 30 milliseconds around the peak, that area was
defined as the origin of the IIS activity. If ECD location changed among distant structures,
this revealed that an inadequate source model was used (Gavaret et al., 2009).
When localizing ECD, it is customary to use a goodness of fit (GoF) as a measure of the
estimation quality (Bast et al., 2006; Gavaret et al., 2004). In this work a threshold of 60%
was used to validate or reject an ECD estimate from an IIS.
2.8 Analysis of ECDs and FCD
Using the co-registration information, we overlaid in the same space ECDs, T1Vol, and lesion
surface mesh in Matlab. We devised and calculated several different indicators with the
objective of measuring the performance of source localization when comparing source with
hypothetical epileptogenic lesion locations. First, from all ECDs of a single individual, an
Average Dipole (AD) was defined, with the average location and orientation. Then, in terms
of spatial distance to the MRI lesion, two indicators were measured: the distance from the AD
to the lesion border (AD-L, column 3 in Table 2) and the mean of the distance from each ECD
to the lesion border (ECD-L, column 5 in Table 2). To calculate the distance of each ECD to
the lesion, positive values of distance were used for ECDs located outside the FCD and
negative values otherwise. Individual ECD dispersion (Di, column 4 in Table 2) was
calculated as the mean distance of each ECD to the AD. The smaller this value is, the higher
is the concentration of dipoles about AD. Standard deviation from ECD-L (Std ECD-L,
column 6 in Table 2) and the volume of the diagnosed FCD (column 10 in Table 2) were also
measured.
It is interesting to note that ECD estimation was also performed using MUSIC procedure
(Mosher et al., 1992) and the results do not differ significantly from those obtained with
BESA (Blenkmann et al., 2009).
In order to have a measure of the ECDs location and dispersion relative to the size, location
and geometrical characteristics of the FCDs, we defined a scale factor k for each ECD. This k
A. Blenkmann, G. Seifer, J.P. Princich, D. Consalvo, S. Kochen, C. Muravchik. Association between equivalent current dipole source localization and focal cortical dysplasia in epilepsy patients. Epilepsy Research, 2012. 98, 223-23. http://dx.doi.org/10.1016/j.eplepsyres.2011.09.018 . Author’s version.
was calculated as a scale factor that radially expands or contract the FCD surface mesh until it
reaches the ECD. A scale factor k bigger than one implies the ECD is outside of the FCD,
whereas k less than one implies the ECD is inside the FCD. In addition, using the same
procedure we calculated a scale factor k for each AD (kAD, column 7 in Table 2), the mean k
for ECDs (kECD, column 8 in Table 2), and the standard deviation of k for the ECDs (Std
kECD, column 9 in Table 2). The main difference between the scale factor k and ECD-L is
that the first measures the distance Lesion-to-ECD relative to the size of the lesion, whereas
ECD-L measures this distance in absolute terms, regardless of the lesion size. In this way, a
mean value of k larger than one and a dispersion of k smaller than the mean of k minus one
suggests a thin shell containing the dipoles, parallel to a part or parts of the FCD border.
Although the idea behind the ECD-L was similar, both measures ECD-L and k differ slightly.
This is particularly so when dipoles are located close to protuberances of the FCD.
3. Results
From the 15 included patients, 4 were excluded from the study because no IIS were registered
or the inclusion criteria were not accomplished. From now on we will refer to the remaining
11 patients as the analysed population.
Mean age of our population was 26 years (9–33 years), 4⁄7 female/male, they all had a
negative family history of epilepsy. Past medical history before epilepsy onset was relevant
for 4/11 patients. All patients had normal developmental milestones, except patient number 10
that presented developmental delay. Table 1 summarizes the patients data.
A. Blenkmann, G. Seifer, J.P. Princich, D. Consalvo, S. Kochen, C. Muravchik. Association between equivalent current dipole source localization and focal cortical dysplasia in epilepsy patients. Epilepsy Research, 2012. 98, 223-23. http://dx.doi.org/10.1016/j.eplepsyres.2011.09.018 . Author’s version.
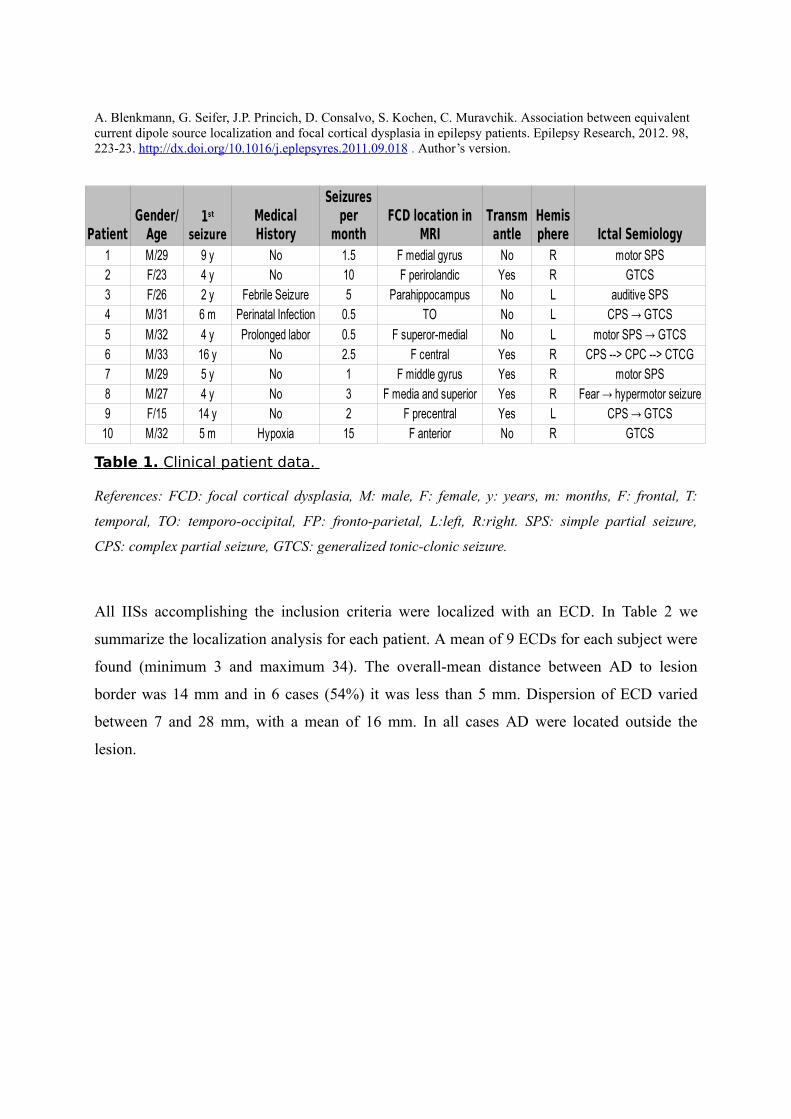
Table 1. Clinical patient data.
References: FCD: focal cortical dysplasia, M: male, F: female, y: years, m: months, F: frontal, T:
temporal, TO: temporo-occipital, FP: fronto-parietal, L:left, R:right. SPS: simple partial seizure,
CPS: complex partial seizure, GTCS: generalized tonic-clonic seizure.
All IISs accomplishing the inclusion criteria were localized with an ECD. In Table 2 we
summarize the localization analysis for each patient. A mean of 9 ECDs for each subject were
found (minimum 3 and maximum 34). The overall-mean distance between AD to lesion
border was 14 mm and in 6 cases (54%) it was less than 5 mm. Dispersion of ECD varied
between 7 and 28 mm, with a mean of 16 mm. In all cases AD were located outside the
lesion.
Patient Ictal Semiology1 M/29 9 y No 1.5 F medial gyrus No R motor SPS2 F/23 4 y No 10 F perirolandic Yes R GTCS3 F/26 2 y Febrile Seizure 5 Parahippocampus No L auditive SPS4 M/31 6 m Perinatal Infection 0.5 TO No L CPS → GTCS
5 M/32 4 y Prolonged labor 0.5 F superor-medial No L motor SPS → GTCS6 M/33 16 y No 2.5 F central Yes R CPS --> CPC --> CTCG7 M/29 5 y No 1 F middle gyrus Yes R motor SPS8 M/27 4 y No 3 F media and superior Yes R Fear → hypermotor seizure9 F/15 14 y No 2 F precentral Yes L CPS → GTCS
10 M/32 5 m Hypoxia 15 F anterior No R GTCS
Gender/Age
1st seizure
Medical History
Seizures per
monthFCD location in
MRITransmantle
Hemisphere
A. Blenkmann, G. Seifer, J.P. Princich, D. Consalvo, S. Kochen, C. Muravchik. Association between equivalent current dipole source localization and focal cortical dysplasia in epilepsy patients. Epilepsy Research, 2012. 98, 223-23. http://dx.doi.org/10.1016/j.eplepsyres.2011.09.018 . Author’s version.
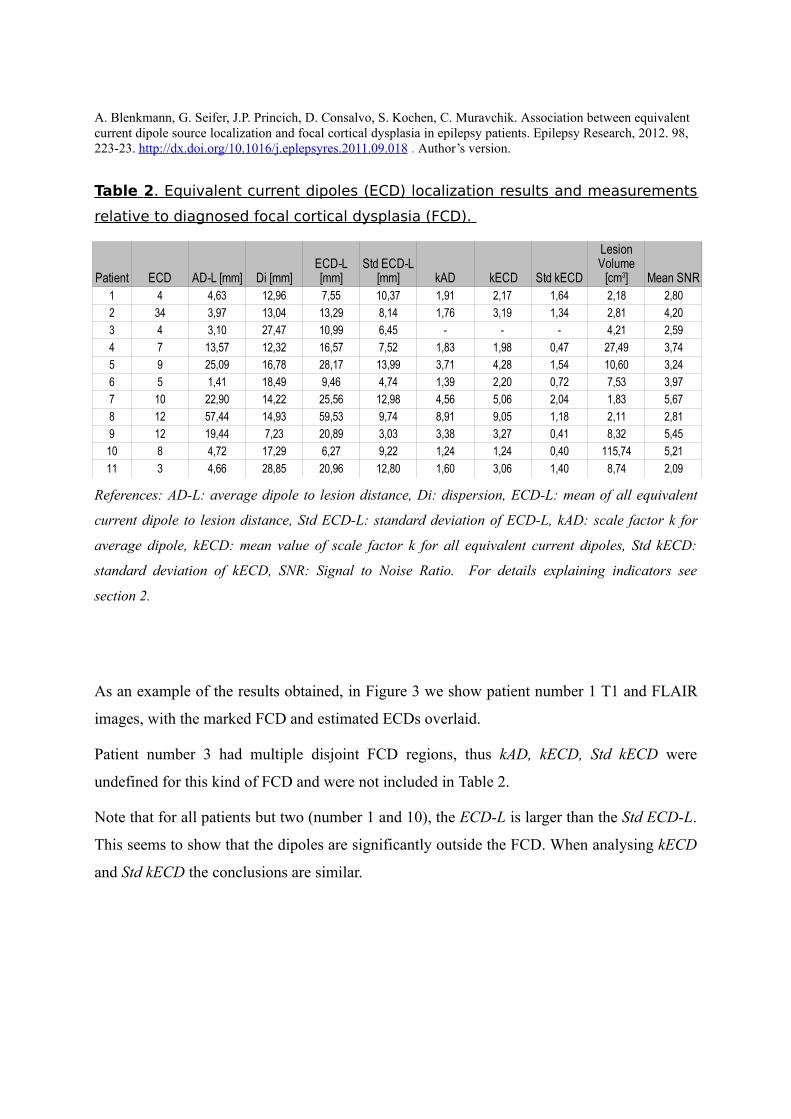
Table 2 . Equivalent current dipoles (ECD) localization results and measurements
relative to diagnosed focal cortical dysplasia (FCD).
References: AD-L: average dipole to lesion distance, Di: dispersion, ECD-L: mean of all equivalent
current dipole to lesion distance, Std ECD-L: standard deviation of ECD-L, kAD: scale factor k for
average dipole, kECD: mean value of scale factor k for all equivalent current dipoles, Std kECD:
standard deviation of kECD, SNR: Signal to Noise Ratio. For details explaining indicators see
section 2.
As an example of the results obtained, in Figure 3 we show patient number 1 T1 and FLAIR
images, with the marked FCD and estimated ECDs overlaid.
Patient number 3 had multiple disjoint FCD regions, thus kAD, kECD, Std kECD were
undefined for this kind of FCD and were not included in Table 2.
Note that for all patients but two (number 1 and 10), the ECD-L is larger than the Std ECD-L.
This seems to show that the dipoles are significantly outside the FCD. When analysing kECD
and Std kECD the conclusions are similar.
Patient ECD AD-L [mm] Di [mm] kAD kECD Std kECD Mean SNR1 4 4,63 12,96 7,55 10,37 1,91 2,17 1,64 2,18 2,80
2 34 3,97 13,04 13,29 8,14 1,76 3,19 1,34 2,81 4,20
3 4 3,10 27,47 10,99 6,45 - - - 4,21 2,59
4 7 13,57 12,32 16,57 7,52 1,83 1,98 0,47 27,49 3,74
5 9 25,09 16,78 28,17 13,99 3,71 4,28 1,54 10,60 3,24
6 5 1,41 18,49 9,46 4,74 1,39 2,20 0,72 7,53 3,97
7 10 22,90 14,22 25,56 12,98 4,56 5,06 2,04 1,83 5,67
8 12 57,44 14,93 59,53 9,74 8,91 9,05 1,18 2,11 2,81
9 12 19,44 7,23 20,89 3,03 3,38 3,27 0,41 8,32 5,45
10 8 4,72 17,29 6,27 9,22 1,24 1,24 0,40 115,74 5,21
11 3 4,66 28,85 20,96 12,80 1,60 3,06 1,40 8,74 2,09
ECD-L [mm]
Std ECD-L [mm]
Lesion Volume
[cm3]
A. Blenkmann, G. Seifer, J.P. Princich, D. Consalvo, S. Kochen, C. Muravchik. Association between equivalent current dipole source localization and focal cortical dysplasia in epilepsy patients. Epilepsy Research, 2012. 98, 223-23. http://dx.doi.org/10.1016/j.eplepsyres.2011.09.018 . Author’s version.
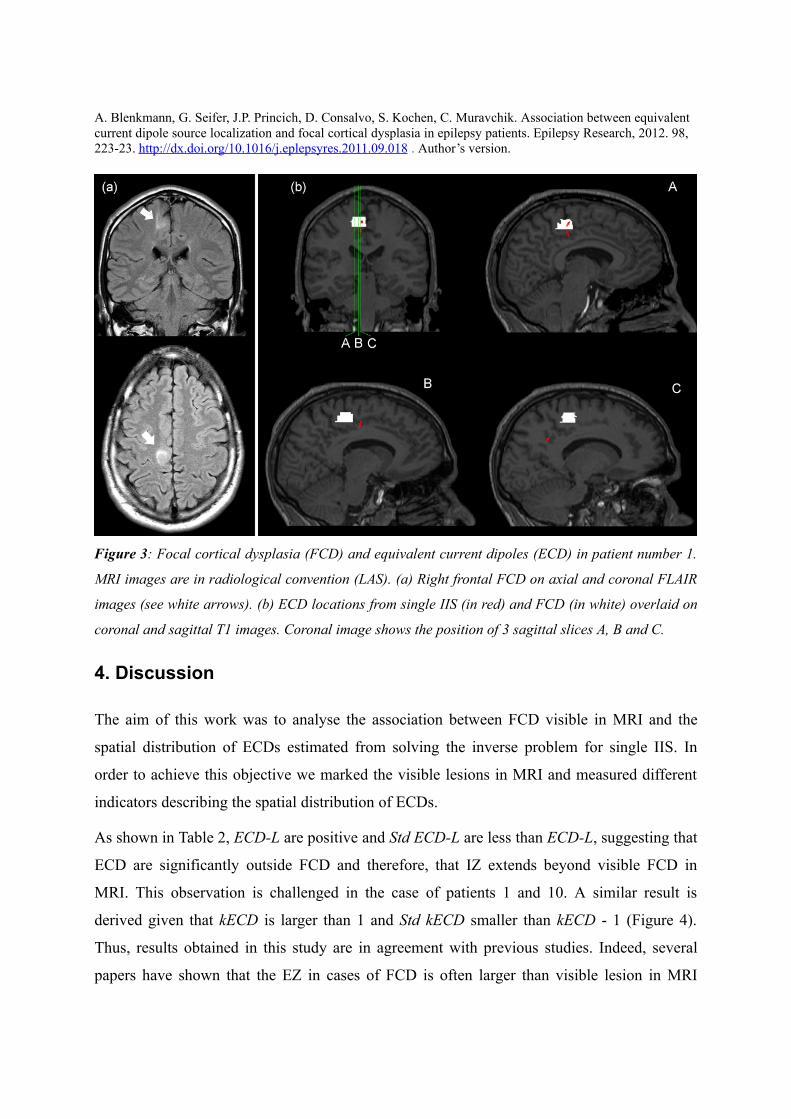
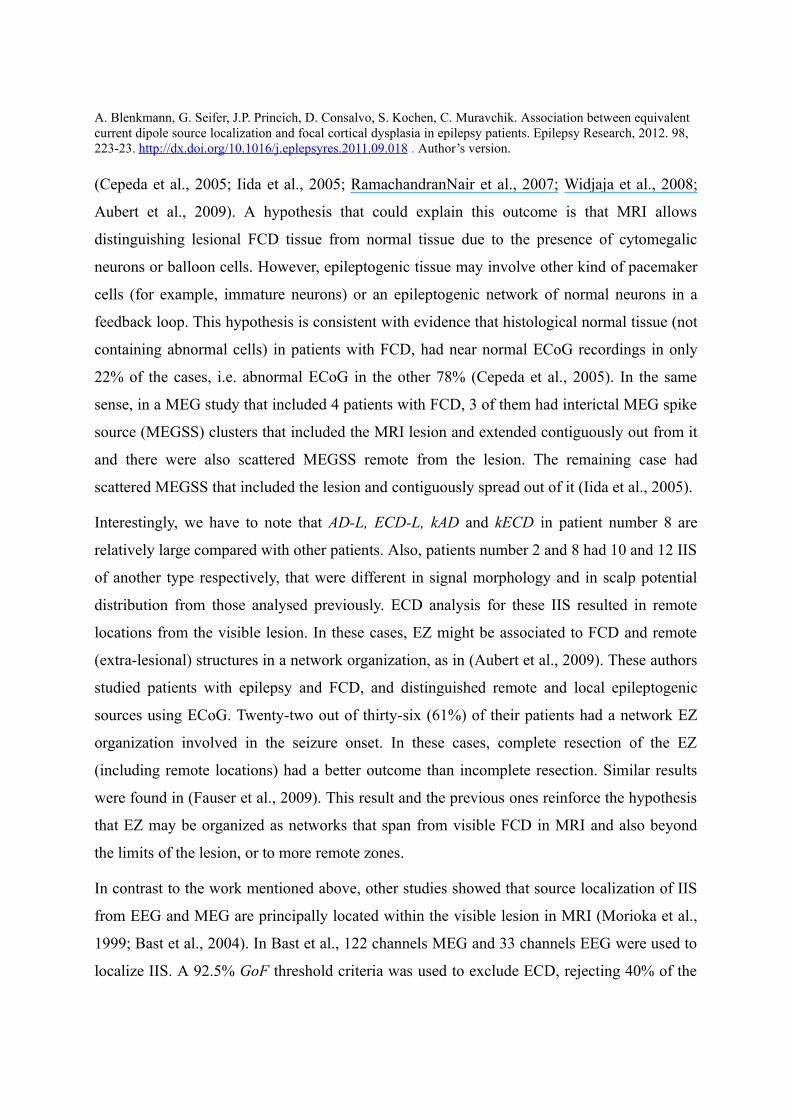
Figure 3: Focal cortical dysplasia (FCD) and equivalent current dipoles (ECD) in patient number 1.
MRI images are in radiological convention (LAS). (a) Right frontal FCD on axial and coronal FLAIR
images (see white arrows). (b) ECD locations from single IIS (in red) and FCD (in white) overlaid on
coronal and sagittal T1 images. Coronal image shows the position of 3 sagittal slices A, B and C.
4. Discussion
The aim of this work was to analyse the association between FCD visible in MRI and the
spatial distribution of ECDs estimated from solving the inverse problem for single IIS. In
order to achieve this objective we marked the visible lesions in MRI and measured different
indicators describing the spatial distribution of ECDs.
As shown in Table 2, ECD-L are positive and Std ECD-L are less than ECD-L, suggesting that
ECD are significantly outside FCD and therefore, that IZ extends beyond visible FCD in
MRI. This observation is challenged in the case of patients 1 and 10. A similar result is
derived given that kECD is larger than 1 and Std kECD smaller than kECD - 1 (Figure 4).
Thus, results obtained in this study are in agreement with previous studies. Indeed, several
papers have shown that the EZ in cases of FCD is often larger than visible lesion in MRI
A. Blenkmann, G. Seifer, J.P. Princich, D. Consalvo, S. Kochen, C. Muravchik. Association between equivalent current dipole source localization and focal cortical dysplasia in epilepsy patients. Epilepsy Research, 2012. 98, 223-23. http://dx.doi.org/10.1016/j.eplepsyres.2011.09.018 . Author’s version.
(Cepeda et al., 2005; Iida et al., 2005; RamachandranNair et al., 2007; Widjaja et al., 2008;
Aubert et al., 2009). A hypothesis that could explain this outcome is that MRI allows
distinguishing lesional FCD tissue from normal tissue due to the presence of cytomegalic
neurons or balloon cells. However, epileptogenic tissue may involve other kind of pacemaker
cells (for example, immature neurons) or an epileptogenic network of normal neurons in a
feedback loop. This hypothesis is consistent with evidence that histological normal tissue (not
containing abnormal cells) in patients with FCD, had near normal ECoG recordings in only
22% of the cases, i.e. abnormal ECoG in the other 78% (Cepeda et al., 2005). In the same
sense, in a MEG study that included 4 patients with FCD, 3 of them had interictal MEG spike
source (MEGSS) clusters that included the MRI lesion and extended contiguously out from it
and there were also scattered MEGSS remote from the lesion. The remaining case had
scattered MEGSS that included the lesion and contiguously spread out of it (Iida et al., 2005).
Interestingly, we have to note that AD-L, ECD-L, kAD and kECD in patient number 8 are
relatively large compared with other patients. Also, patients number 2 and 8 had 10 and 12 IIS
of another type respectively, that were different in signal morphology and in scalp potential
distribution from those analysed previously. ECD analysis for these IIS resulted in remote
locations from the visible lesion. In these cases, EZ might be associated to FCD and remote
(extra-lesional) structures in a network organization, as in (Aubert et al., 2009). These authors
studied patients with epilepsy and FCD, and distinguished remote and local epileptogenic
sources using ECoG. Twenty-two out of thirty-six (61%) of their patients had a network EZ
organization involved in the seizure onset. In these cases, complete resection of the EZ
(including remote locations) had a better outcome than incomplete resection. Similar results
were found in (Fauser et al., 2009). This result and the previous ones reinforce the hypothesis
that EZ may be organized as networks that span from visible FCD in MRI and also beyond
the limits of the lesion, or to more remote zones.
In contrast to the work mentioned above, other studies showed that source localization of IIS
from EEG and MEG are principally located within the visible lesion in MRI (Morioka et al.,
1999; Bast et al., 2004). In Bast et al., 122 channels MEG and 33 channels EEG were used to
localize IIS. A 92.5% GoF threshold criteria was used to exclude ECD, rejecting 40% of the
A. Blenkmann, G. Seifer, J.P. Princich, D. Consalvo, S. Kochen, C. Muravchik. Association between equivalent current dipole source localization and focal cortical dysplasia in epilepsy patients. Epilepsy Research, 2012. 98, 223-23. http://dx.doi.org/10.1016/j.eplepsyres.2011.09.018 . Author’s version.
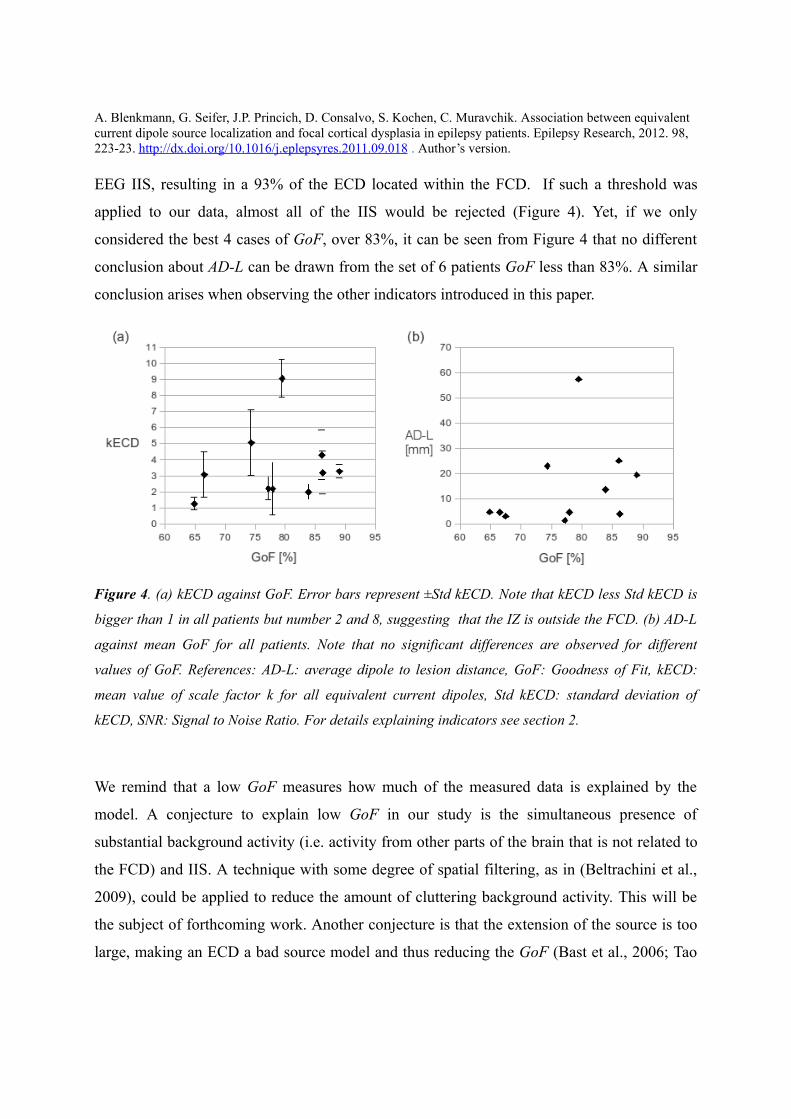
EEG IIS, resulting in a 93% of the ECD located within the FCD. If such a threshold was
applied to our data, almost all of the IIS would be rejected (Figure 4). Yet, if we only
considered the best 4 cases of GoF, over 83%, it can be seen from Figure 4 that no different
conclusion about AD-L can be drawn from the set of 6 patients GoF less than 83%. A similar
conclusion arises when observing the other indicators introduced in this paper.
Figure 4. (a) kECD against GoF. Error bars represent ±Std kECD. Note that kECD less Std kECD is
bigger than 1 in all patients but number 2 and 8, suggesting that the IZ is outside the FCD. (b) AD-L
against mean GoF for all patients. Note that no significant differences are observed for different
values of GoF. References: AD-L: average dipole to lesion distance, GoF: Goodness of Fit, kECD:
mean value of scale factor k for all equivalent current dipoles, Std kECD: standard deviation of
kECD, SNR: Signal to Noise Ratio. For details explaining indicators see section 2.
We remind that a low GoF measures how much of the measured data is explained by the
model. A conjecture to explain low GoF in our study is the simultaneous presence of
substantial background activity (i.e. activity from other parts of the brain that is not related to
the FCD) and IIS. A technique with some degree of spatial filtering, as in (Beltrachini et al.,
2009), could be applied to reduce the amount of cluttering background activity. This will be
the subject of forthcoming work. Another conjecture is that the extension of the source is too
large, making an ECD a bad source model and thus reducing the GoF (Bast et al., 2006; Tao
A. Blenkmann, G. Seifer, J.P. Princich, D. Consalvo, S. Kochen, C. Muravchik. Association between equivalent current dipole source localization and focal cortical dysplasia in epilepsy patients. Epilepsy Research, 2012. 98, 223-23. http://dx.doi.org/10.1016/j.eplepsyres.2011.09.018 . Author’s version.
et al., 2007 ). In these cases, fitting an extended source model (Yetik et al., 2006) seems
advisable. Other possible difference with (Bast et al., 2004) is due to population age, which
were mostly children and adolescent patients as opposed to mainly adults in our study.
We have to remark that the relevance of ECD locations, i.e., if they correctly estimate the EZ,
will be finally determined by invasive recordings and/or post surgical outcome. It has been
shown from intracranial recordings that complete resection of ictal onset zone and interictal
zone significantly increase post-surgical seizure freedom (Widdess-Walsh et al., 2007).
However, IZ are not always wholly contained within EZ and therefore, the resection of an IZ
outside EZ may not affect surgical outcome.
In spite of the best efforts made, the correct placement of intracranial electrodes in patients
with FCD is not always achieved. It has been reported that observing diffuse or spread-like
epileptogenic patterns from neural sources distant to the electrodes or in deep locations,
significantly decreases post-surgical success (Widdess-Walsh et al., 2007). In these situations,
non-invasive ECD localization of IIS may provide an interesting approach. Assuming that
ECD neural sources are the same that would be found from intracranial recordings, this
information may assist in planning intracranial electrode placement and/or surgical resection.
Additional attention must be paid to spread ECDs when some sources of activity extend
beyond the FCD visible in MRI. These spread-like sources may include dormant regions that
could rekindle after the resection of what appears to be the EZ, leading to future seizure
recurrence.
In summary, our findings suggest that the FCD visible in MRI and cortex areas nearby it are
epileptogenic, which agrees with previous studies. The method described here, based on scalp
EEG and MRI, is useful to define the extension of the IZ in patients having epilepsy and FCD
visible in MRI, and could be applied in the study of other focal pathologies associated with
epilepsy. Consideration of ECD localization from single IIS may be helpful to improve the
successful outcome of resective surgery.
A. Blenkmann, G. Seifer, J.P. Princich, D. Consalvo, S. Kochen, C. Muravchik. Association between equivalent current dipole source localization and focal cortical dysplasia in epilepsy patients. Epilepsy Research, 2012. 98, 223-23. http://dx.doi.org/10.1016/j.eplepsyres.2011.09.018 . Author’s version.
Acknowledgements
This work was supported by grants from ANPCyT PICT 2005-35423 and PICT 2007-00535,
UNLP 11-I-127 all from Argentina. SK, JPP and AB are also supported by CONICET and
CM by CIC-PBA.
Bibliography
Aubert, S., Wendling, F., Regis, J., McGonigal, A., Figarella-Branger, D., Peragut, J., Girard,
N., Chauvel, P., Bartolomei, F., 2009. Local and remote epileptogenicity in focal cortical
dysplasias and neurodevelopmental tumours. Brain 132, 3072-3086.
Barkovich, A.J., Kuzniecky, R.I., 1996. Neuroimaging of focal malformations of cortical
development. J Clin Neurophysiol 13, 481-494.
Barkovich, A.J., Kuzniecky, R.I., Jackson, G.D., Guerrini, R., Dobyns, W.B., 2005. A
developmental and genetic classification for malformations of cortical development.
Neurology 65, 1873-1887.
Bast, T., Oezkan, O., Rona, S., Stippich, C., Seitz, A., Rupp, A., Fauser, S., Zentner, J.,
Rating, D., Scherg, M., 2004. EEG and MEG source analysis of single and averaged
interictal spikes reveals intrinsic epileptogenicity in focal cortical dysplasia. Epilepsia 45,
621-631.
Bast, T., Boppel, T., Rupp, A., Harting, I., Hoechstetter, K., Fauser, S., Schulze-Bonhage, A.,
Rating, D., Scherg, M., 2006. Noninvasive source localization of interictal EEG spikes:
effects of signal-to-noise ratio and averaging. J Clin Neurophysiol 23, 487-497.
Beltrachini, L., Ellenrieder, N.V., Muravchik, C.H., 2009. Estimador regularizado de la matriz
de covarianza y su aplicación en el análisis del problema inverso en EEG mediante
beamforming. Proc. of XIII Reunión de Trabajo en Procesamiento de la Información y
Control, Rosario, Argentina, 16-18 Sep. pp. 351-356.
Blenkmann, A., Ellenrieder, N.V., Seifer G., Princich J.P., Kochen S., Muravchik C.H., 2009.
Algoritmo MUSIC para la localización de fuentes de actividad cerebral. Simulación y
A. Blenkmann, G. Seifer, J.P. Princich, D. Consalvo, S. Kochen, C. Muravchik. Association between equivalent current dipole source localization and focal cortical dysplasia in epilepsy patients. Epilepsy Research, 2012. 98, 223-23. http://dx.doi.org/10.1016/j.eplepsyres.2011.09.018 . Author’s version.
ejemplos. Proc. of XVI Congreso Argentino de Bioingeniería (SABI 2009), Rosario,
Argentina, Oct. 14-16, p175.
Blümcke, I., Thom, M., Aronica, E., Armstrong, D.D., Vinters, H.V., Palmini, A., Jacques,
T.S., Avanzini, G., Barkovich, A.J., Battaglia, G., Becker, A., Cepeda, C., Cendes, F.,
Colombo, N., Crino, P., Cross, J.H., Delalande, O., Dubeau, F., Duncan, J., Guerrini, R.,
Kahane, P., Mathern, G., Najm, I., Ozkara, C., Raybaud, C., Represa, A., Roper, S.N.,
Salamon, N., Schulze-Bonhage, A., Tassi, L., Vezzani, A., Spreafico, R., 2011. The
clinicopathologic spectrum of focal cortical dysplasias: a consensus classification
proposed by an ad hoc task force of the ILAE diagnostic methods commission. Epilepsia
52, 158-174.
Cepeda, C., André, V.M., Flores-Hernández, J., Nguyen, O.K., Wu N., Klapstein, G.J.,
Nguyen, S., Koh, S., Vinters, H.V., Levine, M.S., Mathern, G.W., 2005. Pediatric cortical
dysplasia: correlations between neuroimaging, electrophysiology and location of
cytomegalic neurons and balloon cells and Glutamate/GABA synaptic circuits. Dev
Neurosci 27, 59-76.
Chatrian, G., Bergamini, L., Dondey, M., Klass, D., Lennox-Buchthal, M., Petersen, I., 1974.
A glossary of terms most commonly used by clinical electroencephalographers.
Electroencephalogr Clin Neurophysiol 37, 538-548.
Chauvel, P., Buser, P., Badier, J.M., Liegeois-Chauvel, C., Marquis, P., Bancaud, J., 1987. The
“epileptogenic zone” in humans: representation of intercritical events by spatio-temporal
maps. Rev Neurol (Paris) 143, 443-450.
Commission on Classification and Terminology of the International League Against Epilepsy
[ILAE], 1981. Proposal for revised clinical and electroencephalographic classification of
epileptic seizures. from the commission on classification and terminology of the
International League Against Epilepsy. Epilepsia 22, 489-501.
Colombo, N., Salamon, N., Raybaud, C., Ozkara, C., Barkovich, A.J., 2009. Imaging of
malformations of cortical development. Epileptic Disord 11, 194-205.
A. Blenkmann, G. Seifer, J.P. Princich, D. Consalvo, S. Kochen, C. Muravchik. Association between equivalent current dipole source localization and focal cortical dysplasia in epilepsy patients. Epilepsy Research, 2012. 98, 223-23. http://dx.doi.org/10.1016/j.eplepsyres.2011.09.018 . Author’s version.
Ebersole, J.S., Hawes-Ebersole, S., 2007. Clinical application of dipole models in the
localization of epileptiform activity. J Clin Neurophysiol 24, 120-129.
Fauser, S., Sisodiya, S.M., Martinian, L., Thom, M., Gumbinger, C., Huppertz, H., Hader, C.,
Strobl, K., Steinhoff, B.J., Prinz, M., Zentner, J., Schulze-Bonhage, A., 2009. Multi-focal
occurrence of cortical dysplasia in epilepsy patients. Brain 132, 2079-2090.
Gavaret, M., Badier, J.M., Marquis, P., Bartolomei, F., Chauvel, P., 2004. Electric source
imaging in temporal lobe epilepsy. J Clin Neurophysiol 21, 267-282.
Gavaret, M., Trébuchon, A., Bartolomei, F., Marquis, P., McGonigal, A., Wendling, F., Regis,
J., Badier, J., Chauvel, P., 2009. Source localization of scalp-EEG interictal spikes in
posterior cortex epilepsies investigated by HR-EEG and SEEG. Epilepsia 50, 276-289.
Iida, K., Otsubo, H., Matsumoto, Y., Ochi, A., Oishi, M., Holowka, S., Pang, E., Elliott, I.,
Weiss, S.K., Chuang, S.H., Snead, O.C., Rutka, J.T., 2005. Characterizing magnetic spike
sources by using magnetoencephalography-guided neuronavigation in epilepsy surgery in
pediatric patients. J Neurosurg 102, 187-196.
Kochen, S., Giagante, B., Consalvo, D., Oddo, S., Silva, W., Solis, P., Centurion, E., Saidon,
P., 2002. Analisis retrospectivo (1984-2000). Experiencia en pacientes candidatos a
cirugía de la epilepsia. Rev Neurol Arg 27, 41-44.
Kwan, P., Arzimanoglou, A., Berg, A.T., Brodie, M.J., Hauser, W.A., Mathern, G., Moshé,
S.L., Perucca, E., Wiebe, S., French, J., 2010. Definition of drug resistant epilepsy:
consensus proposal by the ad hoc Task Force of the ILAE Commission on Therapeutic
Strategies. Epilepsia 51, 1069-1077.
Lerner, J.T., Salamon, N., Hauptman, J.S., Velasco, T.R., Hemb, M., Wu, J.Y., Sankar, R.,
Shields, W.D., Engel, J., Fried, I., Cepeda, C., Andre, V.M., Levine, M.S., Miyata, H.,
Yong, W.H., Vinters, H.V., Mathern, G.W., 2009. Assessment and surgical outcomes for
mild Type I and severe Type II cortical dysplasia: a critical review and the UCLA
experience. Epilepsia 50, 1310-1335.
San Martín, J., Laforcada, H., Ellenrieder, N.V., Muravchik, C., Papayannis, C., Kochen, S.,
A. Blenkmann, G. Seifer, J.P. Princich, D. Consalvo, S. Kochen, C. Muravchik. Association between equivalent current dipole source localization and focal cortical dysplasia in epilepsy patients. Epilepsy Research, 2012. 98, 223-23. http://dx.doi.org/10.1016/j.eplepsyres.2011.09.018 . Author’s version.
2007. Determinación de la posición de electrodos de electroencefalografíia. Proc. of XV
Congreso Argentino de Bioingeniería (SABI 2007), San Juan, Argentina, Sep. 26-28, pp.
137-140.
Mattia, D., Olivier, A., Avoli, M., 1995. Seizure-like discharges recorded in human dysplastic
neocortex maintained in vitro. Neurology 45, 1391-1395.
Michel, C., Murray, M., Lantz, G., Gonzalez, S., Spinelli, L., Peralta, R.G.D., 2004. EEG
source imaging. Clin Neurophysiol 115, 2195-2222.
Morioka, T., Nishio, S., Ishibashi, H., Muraishi, M., Hisada, K., Shigeto, H., Yamamoto, T.,
Fukui, M., 2009. Intrinsic epileptogenicity of focal cortical dysplasia as revealed by
magnetoencephalography and electrocorticography. Epilepsy Res 33, 177-187.
Mosher, J.C., Lewis, P.S., Leahy, R.M., 1992. Multiple dipole modeling and localization from
spatio-temporal MEG data. IEEE Trans Biomed Eng 39, 541-557.
Otsubo, H., Ochi, A., Elliott, I., Chuang, S.H., Rutka, J.T., Jay, V., Aung, M., Sobel, D.F.,
Snead, O.C., 2001. MEG predicts epileptic zone in lesional extrahippocampal epilepsy: 12
pediatric surgery cases. Epilepsia 42, 1523-1530.
Palmini, A., Najm, I., Avanzini, G., Babb, T., Guerrini, R., Foldvary-Schaefer, N., Jackson,
G., Lüders, H.O, Prayson, R., Spreafico, R., Vinters, H.V., 2004. Terminology and
classification of the cortical dysplasias. Neurology 62 Suppl 3, S2-S8.
Palmini, A., 2010. Electrophysiology of the focal cortical dysplasias. Epilepsia 51 Suppl 1,
23-26.
Plummer, C., Harvey, AS., Cook, M., 2008. EEG source localization in focal epilepsy: where
are we now? Epilepsia 49, 201-218.
Princich, J.P., Seifer, G., Blenkmann, A., Consalvo, D., Kochen, S., 2010. White matter
changes associated with focal cortical dysplasia (FCD) in refractory epilepsy patients
detected with di usionff tensor imaging (DTI) in magnetic resonance. 6to Latin-American
Congress on Epilepsy, Cartagena, Colombia, Aug. 1-4, p113.
Radhakrishnan, K., 2009. Challenges in the management of epilepsy in resource-poor
A. Blenkmann, G. Seifer, J.P. Princich, D. Consalvo, S. Kochen, C. Muravchik. Association between equivalent current dipole source localization and focal cortical dysplasia in epilepsy patients. Epilepsy Research, 2012. 98, 223-23. http://dx.doi.org/10.1016/j.eplepsyres.2011.09.018 . Author’s version.
countries. Nat Rev Neurol 5, 323-330.
RamachandranNair, R., Otsubo, H., Shroff, M.M., Ochi, A., Weiss, S.K., Rutka, J.T., Snead,
O.C., 2007. MEG predicts outcome following surgery for intractable epilepsy in children
with normal or nonfocal MRI findings. Epilepsia 48, 149-157.
Rosenow, F., Lüders, H., 2001. Presurgical evaluation of epilepsy. Brain 124, 1683-1700.
Tao, J.X., Baldwin, M., Ray, A., Hawes-Ebersole, S., Ebersole, J.S., 2007. The impact of
cerebral source area and synchrony on recording scalp electroencephalography ictal
patterns. Epilepsia 48, 2167-2176.
Taylor, D.C., Falconer, M.A., Bruton, C.J., Corsellis, J.A., 1971. Focal dysplasia of the
cerebral cortex in epilepsy. J Neurol Neurosurg Psychiatr 34, 369-387.
Widdess-Walsh, P., Diehl, B., Najm, I., 2006. Neuroimaging of focal cortical dysplasia. J
Neuroimaging 16, 185-196.
Widdess-Walsh, P., Jeha, L., Nair, D., Kotagal, P., Bingaman, W., Najm, I., 2007. Subdural
electrode analysis in focal cortical dysplasia: predictors of surgical outcome. Neurology
69, 660-667.
Widjaja, E., Otsubo, H., Raybaud, C., Ochi, A., Chan, D., Rutka, J.T., Snead, O.C., Halliday,
W., Sakuta, R., Galicia, E., Shelef, I., Chuang, S.H., 2008. Characteristics of MEG and
MRI between Taylor's focal cortical dysplasia (Type II) and other cortical dysplasia:
surgical outcome after complete resection of MEG spike source and MR lesion in
pediatric cortical dysplasia. Epilepsy Res 82, 147-155.
Yetik, I.S., Nehorai, A., Muravchik, C.H., Haueisen, J., Eiselt M., 2006. Surface-source
modeling and estimation using biomagnetic measurements. IEEE Trans Biomed Eng 53,
1872-8253.
Related Documents