Association between dietary glycemic index, glycemic load and high-sensitivity C-reactive protein Jennifer A. Griffith, MS [analysis and interpretation of data, drafting and revision of the manuscript, approval of the final manuscript] 1 , Yunsheng Ma, MD, PhD [analysis and interpretation of data, revision of the manuscript and approval of the final manuscript] 1 , Lisa Chasan-Taber, Sc.D [interpretation of data and revision of the manuscript] 2 , Barbara Olendzki, RD, MPH [interpretation of data, revision of the manuscript] 1 , David Chiriboga, MD, MPH [interpretation of data revision of the manuscript] 1 , Edward J. Stanek III, Ph.D [analysis and interpretation of data] 2 , Philip Merriam, MSPH [collection and assembly of data and revision of the manuscript] 1 , and Ira Ockene, MD [conception and design of the study] 3 1Division of Preventive and Behavioral Medicine, Department of Medicine, University of Massachusetts Medical School, Worcester, MA 2Division of Biostatistics and Epidemiology, School of Public Health and Health Sciences, University of Massachusetts, Amherst, MA 3Division of Cardiovascular Medicine, Department of Medicine, University of Massachusetts Medical School, Worcester, MA Abstract Objective—This study examined the relationship between quality of dietary carbohydrate intake, as measured by glycemic index (GI) and glycemic load (GL), and high sensitivity serum C-reactive protein (hs-CRP) levels. Method—During a one-year observational study, data were collected at baseline and at each quarter thereafter. GI and GL were calculated from multiple 24-hour dietary recalls (24HRs), three randomly selected 24HRs at every quarter, with up to fifteen 24HRs per participant. Hs-CRP was measured in blood samples collected at baseline and each of the four quarterly measurement points. Multivariable linear mixed models were used to examine both the cross-sectional and the longitudinal association of GI, GL, and hs-CRP. Results—Among 582 adult men and women with at least two measures of both diet and hs-CRP, average daily GI score (white bread=100) was 85 and average GL was 198, Average hs-CRP was 1.84 mg/l. Overall, there was no association between either GI or GL and hs-CRP. Subgroup analyses revealed an inverse association between GL and hs-CRP, among obese individuals (body mass index ≥30 kg/m 2 ). Conclusions—Quality of dietary carbohydrates does not appear to be associated with serum hs- CRP levels. Among obese individuals higher dietary GL appears to be related to lower hs-CRP levels. Due to the limited number of studies on this topic and their conflicting results, further investigation is warranted. Correspondence: Yunsheng Ma, MD, Ph.D., Division of Preventive and Behavioral Medicine, Department of Medicine, University of Massachusetts Medical School, 55 Lake Avenue North, Worcester, MA 01655, 508-856-1008 (phone), 508-856-2022 (fax), [email protected]. Publisher's Disclaimer: This is a PDF file of an unedited manuscript that has been accepted for publication. As a service to our customers we are providing this early version of the manuscript. The manuscript will undergo copyediting, typesetting, and review of the resulting proof before it is published in its final citable form. Please note that during the production process errors may be discovered which could affect the content, and all legal disclaimers that apply to the journal pertain. NIH Public Access Author Manuscript Nutrition. Author manuscript; available in PMC 2009 May 1. Published in final edited form as: Nutrition. 2008 May ; 24(5): 401–406. NIH-PA Author Manuscript NIH-PA Author Manuscript NIH-PA Author Manuscript

Welcome message from author
This document is posted to help you gain knowledge. Please leave a comment to let me know what you think about it! Share it to your friends and learn new things together.
Transcript
Association between dietary glycemic index, glycemic load andhigh-sensitivity C-reactive protein
Jennifer A. Griffith, MS [analysis and interpretation of data, drafting and revision of themanuscript, approval of the final manuscript]1, Yunsheng Ma, MD, PhD [analysis andinterpretation of data, revision of the manuscript and approval of the final manuscript]1, LisaChasan-Taber, Sc.D [interpretation of data and revision of the manuscript]2, BarbaraOlendzki, RD, MPH [interpretation of data, revision of the manuscript]1, David Chiriboga, MD,MPH [interpretation of data revision of the manuscript]1, Edward J. Stanek III, Ph.D [analysisand interpretation of data]2, Philip Merriam, MSPH [collection and assembly of data andrevision of the manuscript]1, and Ira Ockene, MD [conception and design of the study]31Division of Preventive and Behavioral Medicine, Department of Medicine, University of MassachusettsMedical School, Worcester, MA
2Division of Biostatistics and Epidemiology, School of Public Health and Health Sciences, University ofMassachusetts, Amherst, MA
3Division of Cardiovascular Medicine, Department of Medicine, University of Massachusetts Medical School,Worcester, MA
AbstractObjective—This study examined the relationship between quality of dietary carbohydrate intake,as measured by glycemic index (GI) and glycemic load (GL), and high sensitivity serum C-reactiveprotein (hs-CRP) levels.
Method—During a one-year observational study, data were collected at baseline and at each quarterthereafter. GI and GL were calculated from multiple 24-hour dietary recalls (24HRs), three randomlyselected 24HRs at every quarter, with up to fifteen 24HRs per participant. Hs-CRP was measured inblood samples collected at baseline and each of the four quarterly measurement points. Multivariablelinear mixed models were used to examine both the cross-sectional and the longitudinal associationof GI, GL, and hs-CRP.
Results—Among 582 adult men and women with at least two measures of both diet and hs-CRP,average daily GI score (white bread=100) was 85 and average GL was 198, Average hs-CRP was1.84 mg/l. Overall, there was no association between either GI or GL and hs-CRP. Subgroup analysesrevealed an inverse association between GL and hs-CRP, among obese individuals (body mass index≥30 kg/m2).
Conclusions—Quality of dietary carbohydrates does not appear to be associated with serum hs-CRP levels. Among obese individuals higher dietary GL appears to be related to lower hs-CRP levels.Due to the limited number of studies on this topic and their conflicting results, further investigationis warranted.
Correspondence: Yunsheng Ma, MD, Ph.D., Division of Preventive and Behavioral Medicine, Department of Medicine, University ofMassachusetts Medical School, 55 Lake Avenue North, Worcester, MA 01655, 508-856-1008 (phone), 508-856-2022 (fax),[email protected]'s Disclaimer: This is a PDF file of an unedited manuscript that has been accepted for publication. As a service to our customerswe are providing this early version of the manuscript. The manuscript will undergo copyediting, typesetting, and review of the resultingproof before it is published in its final citable form. Please note that during the production process errors may be discovered which couldaffect the content, and all legal disclaimers that apply to the journal pertain.
NIH Public AccessAuthor ManuscriptNutrition. Author manuscript; available in PMC 2009 May 1.
Published in final edited form as:Nutrition. 2008 May ; 24(5): 401–406.
NIH
-PA Author Manuscript
NIH
-PA Author Manuscript
NIH
-PA Author Manuscript

Keywordsglycemic index; glycemic load; high-sensitivity-CRP; diet; carbohydrate; cardiovascular diseases
IntroductionCardiovascular disease and diabetes are two leading causes of morbidity and mortality in theU.S. and worldwide. According to the CDC in 2005 it was estimated that 25.6 million non-institutionalized Americans have some form of heart disease and over 20 million have diabetes[1,2]. Among those with diabetes, 65% will die from heart disease or stroke [3].
High sensitivity C-reactive protein (hs-CRP), a marker of inflammation, has been recognizedas a risk factor for future cardiac events [4-12]. While very high hs-CRP levels are likely theresponse to acute inflammation, slightly elevated levels are indicative of chronic inflammationpresent in such diseases as cardiovascular, and diabetes. Hs-CRP values are useful indetermining disease progression or the effectiveness of treatments, and since many of thesediseases are modifiable by lifestyle, tracking hs-CRP can be quite informative. It is importantto identify which lifestyle factors have the greatest impact, since lifestyle factors may providean important intervention opportunity to beneficially influence hs-CRP levels in order to reducethe risk of cardiovascular disease and diabetes.
Diet is one of the many modifiable risk factors for both cardiovascular disease and diabetes.There is increasing evidence that both quantity and quality of carbohydrate can modify diseaserisk [13,14]. One method to evaluate the quality of carbohydrate is the glycemic index (GI); ameasure of the blood glucose response to 50 grams of carbohydrate from a particular food[15]. Glycemic load (GL) is the GI of a food multiplied by its carbohydrate content in grams(quality times quantity). The present study examined the relationship between GI and GL and,hs-CRP, a marker of inflammation, among a population of healthy adults.
Participants and MethodsData for this study was obtained from a one-year prospective observational study designed toexamine seasonal variations in blood lipid levels in a disease free population in centralMassachusetts [16]. The study began in 1996 with 641 eligible participants enrolled at baseline.Eligibility requirements include age between 20 and 70 years, literate in English, and notplanning to leave the area within the next year [16]. Exclusion criteria included: 1) using orplanning to use lipid lowering drugs; 2) following or planning to follow a weight control diet;3) a history of cancer diagnosis (excluding nonmelanoma) within the past 5 years; 4) asecondary cause of hyperlipidemia; or 6) a condition of psychiatric illness that would limitparticipation [16]. Data collection took place at baseline and quarterly (every 13 weeks)thereafter for a total of five visits. Each visit included measurements of anthropometrics, blood,diet, physical activity, and psychosocial variables.
High sensitivity CRP AssessmentParticipants were evaluated quarterly for a total of five visits over the one year follow-up. Ateach of their five clinic visits, participants provided blood samples. Hs-CRP levels weremeasured at Children's Hospital in Boston at Dr. Nader Rifai's laboratory using latex-enhancedimmunonephelometric assays on a BN II analyzer.
Griffith et al. Page 2
Nutrition. Author manuscript; available in PMC 2009 May 1.
NIH
-PA Author Manuscript
NIH
-PA Author Manuscript
NIH
-PA Author Manuscript

Dietary AssessmentTrained registered dietitians assessed diet via telephone based 24 hour recalls (24HRs), usingthe Minnesota Nutrition Data System (NDS DOS, versions 2.6, 2.7 and 2.8) developed by theNutrition Coordinating Center (NCC) at the University of Minnesota. Three telephoneinterviews occurred at baseline and at four additional data collection periods, within a windowof two weeks prior to three weeks after the participants' quarterly clinic visits. Therefore, upto 15 days of dietary information was available per participant including both weekdays andweekends, allowing for a comprehensive measure of usual carbohydrate intake [18].
Methods of GI Resolution—The quality of carbohydrate can be determined by the GI,which ranks foods according to their effect on blood glucose [15]. Although not allcarbohydrate containing foods have been tested for their GI, the GI of over 1,500 foods hasbeen determined and are available in the International Table of Glycemic Index and GlycemicLoad Values with additional foods continually added to an online database (15,19,20]. Weassigned GI and GL values to foods reported on the 24HR using methods described previously[21]. Briefly, carbohydrate-containing foods derived from 24HRs were matched to theInternational Table of Glycemic Index and Glycemic Load Values. Mixed foods weredisaggregated into individual ingredients. For specific foods not found in the table, we basedestimates on similar foods according to physical and chemical factors that determine GI.
The GL was calculated to take into account the amount of carbohydrate that was consumed.GL equals the GI of a food times the amount of carbohydrate eaten divided by 100. For example,let's consider ½ cup (37 g) of potatoes. The GI of potatoes is 102 (white bread as reference=100).Using the formula, the GL for this portion is, 102 X 37g/100= 38.
Covariate AssessmentA number of factors have consistently been associated with hs-CRP [22,23]. We collected dataon BMI, smoking, infection status, physical activity, total energy, total cholesterol, age andgender, and included these variables in analyses.
Statistical AnalysisMeans and standard deviation were used to describe characteristics of participants, their hs-CRP, GI, and GL values. Scatter plot and smoothing curves (i.e., lowess curves) were used toexplore graphically the relationship of hs-CRP with GL, and GI.
To make use of the rich dataset we used a mixed model which examines both the cross-sectional(between -subjects) association of CRP with glycemic load and the longitudinal association(within-subject). We used all data in the analyses. The dependent variable for this analysis wasCRP. Independent variables were GI or GL, with subject treated as random effect. Specifically,the cross-sectional effects for a variable (GI or GL) were assessed by including a variablerepresenting the subject mean; the longitudinal effects were assessed by including a variablerepresenting the deviation from the subject mean from each quarter. Thus, the cross sectionalanalysis examined the association between the average CRP and average GI or GL among thesubjects at each quarter. The longitudinal analysis compared individual changes in CRP andGI or GL between the quarters. Both the cross-sectional and longitudinal effects were includedin the same model. This method has been used in our previous analyses of the associationbetween dietary fiber and CRP [27]. Covariates that were significantly associated with boththe GI or GL and hs-CRP in the bivariate analysis were included in the final model. If a covariatechanged either exposure coefficient by 15% or more and was statistically significant at p= 0.15,it was included in the final model. When either calorie or fat intake was included in the model,it was not significant; the regression coefficient of hs-CRP with GI or GL was not changed, soneither calories nor fat intake were included in the final model. When we included season of
Griffith et al. Page 3
Nutrition. Author manuscript; available in PMC 2009 May 1.
NIH
-PA Author Manuscript
NIH
-PA Author Manuscript
NIH
-PA Author Manuscript

year as a covariate, results were not changed, so it was not included in the final model. Weassessed for effect modification by BMI category and gender.
ResultsA total of 641 participants with 2,795 observations were available for analysis. Because ourgoal was to examine the longitudinal effect of dietary GI or GL on hs-CRP, participants withdata available for less than 2 times point were excluded (n=49 observations). An additional617 observations were excluded because both dietary measurements and hs-CRP were notavailable at the same quarter. We excluded 65 observations where hs-CRP was greater than10 mg/L because such elevated levels are likely to be caused by an acute infection or underlyingmedical problem not related to diet [24]. We also excluded one observation with an extremeoutlier; GL= 1085. Therefore a total of 582 participants and 2063 observations remained foranalysis. Hs-CRP values were highly skewed, therefore, the data were analyzed using logtransformed values for hs-CRP.
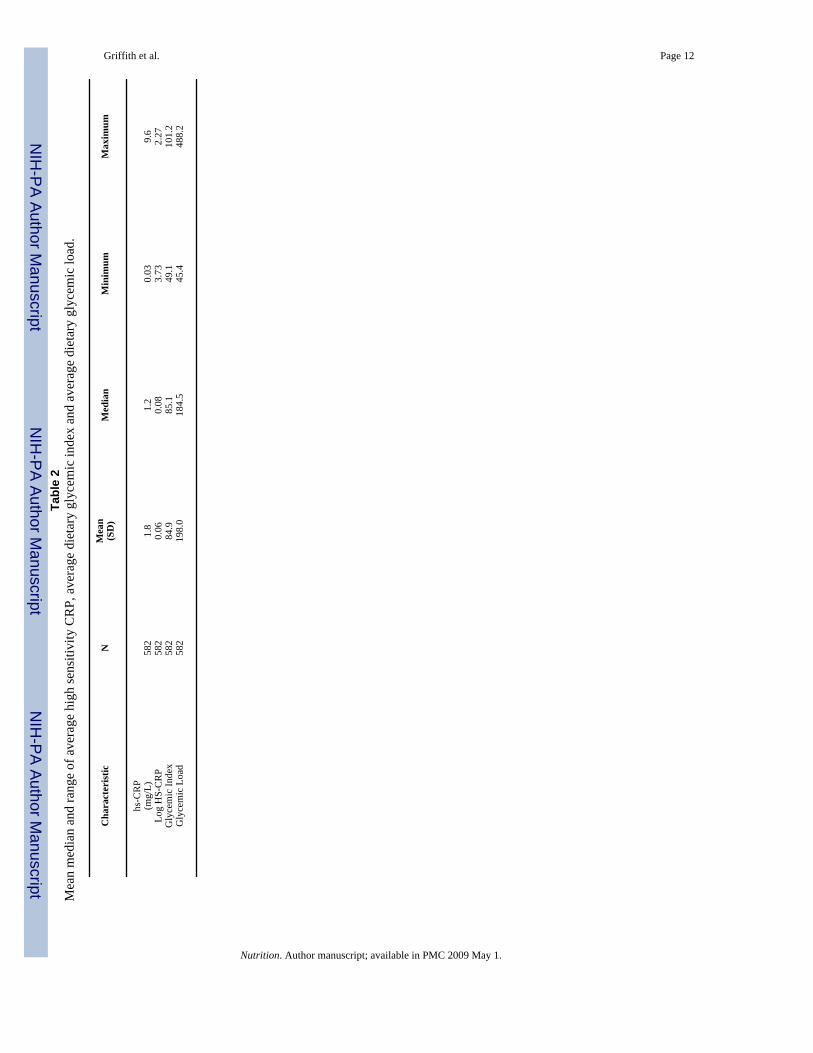
Table 1 presents participant characteristics. Participants were predominantly white (86%), withan average age of 48 years and approximately equal distributions of males and females.Average BMI was 27.4 kg/m2, and 64% of the participants were either overweight or obese.Average and median hs-CRP values were, 1.84 mg/L and 1.21 mg/L, respectively (Table 2).For this paper GI is reported using white bread as the reference, where white bread equals aGI score of 100. The average daily dietary GI score was 85, considered to be in the intermediaterange for GI, with values ranging from 49 to 101 (Table 2). The average GL value was 198,considered to be in the high range for GL, with a minimum of 45 and a maximum value of 489(Table 2). All-purpose flour, white sugar, white bread, white rice and cola beverage, were thetop contributors to GL these five foods alone account for a cumulative GL of 52. The graphsin figures one and two suggested a slightly inverse relationship between average GI or GL andhs-CRP levels (Figures 1, 2).
We used a multivariable linear mixed model to examine both the cross-sectional andlongitudinal relationship between log hs-CRP and GI or GL (Table 3). We found no associationbetween GI and log hs-CRP in either the cross-sectional (regression coefficient (β)=0.009,p=0.24) or the longitudinal analysis (β=-0.002, p= 0.39). We did however observe thesuggestion of an inverse association between GL and log hs-CRP in the cross-sectionalanalyses, but no association in the longitudinal analyses. Specifically, the coefficient for thecross-sectional effect of GL (β= -0.00194) was suggestive of an inverse relationship with loghs-CRP (p= 0.002).
After statistically adjusting for BMI, smoking status, age and infection status, the cross-sectional findings for GL and hs-CRP are attenuated and no longer statistically significant(p=0.07). The longitudinal association was attenuated to -0.00012 (p= 0.72) (Table 4). Noneof the variables produced notable changes in the strength or direction of the estimate.
We then stratified the analysis by BMI category and gender. Stratification by gender did notyield results of statistical significance (for cross-sectional results for GL; men β=-0.0055p=0.43, women β= -0.00141 p=0.18). When stratified by BMI, we found that mean GL was asignificant predictor of hs-CRP in the cross-sectional analysis only among obese individuals(β= -0.00185 p=0.04) (Table 5).
To further explore how BMI modified the relationship between dietary GL and hs-CRP, wefitted a linear model to clarify the interaction, without including any of the covariates. We thenconverted the results to the natural scale and plotted the predicted hs-CRP versus average GL(Figure 3). An inverse relationship was seen across all strata, with individuals in the highestBMI category having the greatest reduction of hs-CRP. However as GL increased, there was
Griffith et al. Page 4
Nutrition. Author manuscript; available in PMC 2009 May 1.
NIH
-PA Author Manuscript
NIH
-PA Author Manuscript
NIH
-PA Author Manuscript
no statistical difference between the slope of obese participants and the slope of the other BMIcategories (p values>0.05).
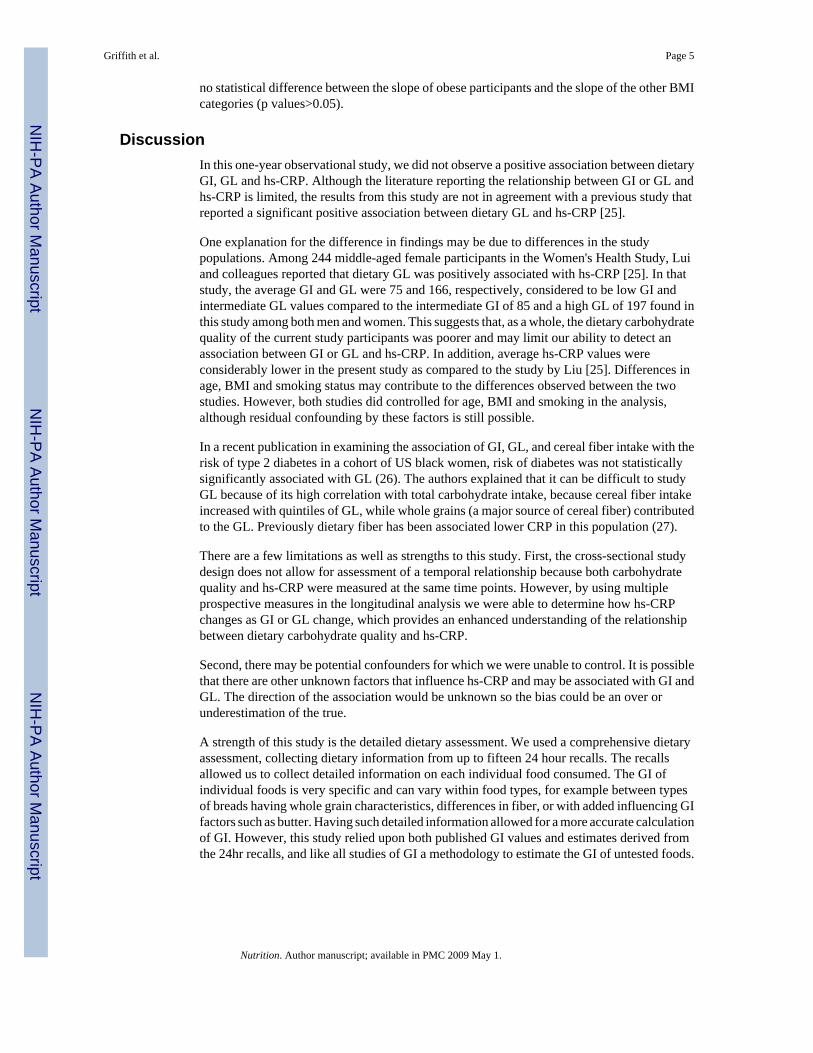
DiscussionIn this one-year observational study, we did not observe a positive association between dietaryGI, GL and hs-CRP. Although the literature reporting the relationship between GI or GL andhs-CRP is limited, the results from this study are not in agreement with a previous study thatreported a significant positive association between dietary GL and hs-CRP [25].
One explanation for the difference in findings may be due to differences in the studypopulations. Among 244 middle-aged female participants in the Women's Health Study, Luiand colleagues reported that dietary GL was positively associated with hs-CRP [25]. In thatstudy, the average GI and GL were 75 and 166, respectively, considered to be low GI andintermediate GL values compared to the intermediate GI of 85 and a high GL of 197 found inthis study among both men and women. This suggests that, as a whole, the dietary carbohydratequality of the current study participants was poorer and may limit our ability to detect anassociation between GI or GL and hs-CRP. In addition, average hs-CRP values wereconsiderably lower in the present study as compared to the study by Liu [25]. Differences inage, BMI and smoking status may contribute to the differences observed between the twostudies. However, both studies did controlled for age, BMI and smoking in the analysis,although residual confounding by these factors is still possible.
In a recent publication in examining the association of GI, GL, and cereal fiber intake with therisk of type 2 diabetes in a cohort of US black women, risk of diabetes was not statisticallysignificantly associated with GL (26). The authors explained that it can be difficult to studyGL because of its high correlation with total carbohydrate intake, because cereal fiber intakeincreased with quintiles of GL, while whole grains (a major source of cereal fiber) contributedto the GL. Previously dietary fiber has been associated lower CRP in this population (27).
There are a few limitations as well as strengths to this study. First, the cross-sectional studydesign does not allow for assessment of a temporal relationship because both carbohydratequality and hs-CRP were measured at the same time points. However, by using multipleprospective measures in the longitudinal analysis we were able to determine how hs-CRPchanges as GI or GL change, which provides an enhanced understanding of the relationshipbetween dietary carbohydrate quality and hs-CRP.
Second, there may be potential confounders for which we were unable to control. It is possiblethat there are other unknown factors that influence hs-CRP and may be associated with GI andGL. The direction of the association would be unknown so the bias could be an over orunderestimation of the true.
A strength of this study is the detailed dietary assessment. We used a comprehensive dietaryassessment, collecting dietary information from up to fifteen 24 hour recalls. The recallsallowed us to collect detailed information on each individual food consumed. The GI ofindividual foods is very specific and can vary within food types, for example between typesof breads having whole grain characteristics, differences in fiber, or with added influencing GIfactors such as butter. Having such detailed information allowed for a more accurate calculationof GI. However, this study relied upon both published GI values and estimates derived fromthe 24hr recalls, and like all studies of GI a methodology to estimate the GI of untested foods.
Griffith et al. Page 5
Nutrition. Author manuscript; available in PMC 2009 May 1.
NIH
-PA Author Manuscript
NIH
-PA Author Manuscript
NIH
-PA Author Manuscript

ConclusionIn this prospective observational study, we found no association between dietary GI or GL andhs-CRP. This is a surprising finding, given a previous study's positive findings and theobservation by our group that fiber, in agreement with other studies, was inversely associatedwith hs-CRP in our study population [27]. This is interesting because fiber is a very strongfactor in the determination of GI, and one would expect that GI would also be associated. Dueto the limited number of studies on this topic and the conflicting results further investigationis warranted.
Acknowledgements
This work was supported by grants: R01-HL52745, R21-HL074895-01, and R21-HL-076796-01 from the NationalHeart, Lung and Blood Institute (NHLBI). Its contents are solely the responsibility of the authors and do not necessarilyrepresent the official views of the NHLBI. The authors thank Laura Robidoux, and Priscilla Cirillo for their assistancewith study recruitment and data collection; Kelly Scribner for coordination of the 24-hour recalls; and SEASONSdietitians who conducted the 24-hour recalls: Susan Nelson, Christine Singelton, Pat Jeans, Karen Lafayette, DeborahLamb, Stephanie Olson, and Eileen Capstraw. Dr Nader Rifai for his assistance with hs-CRP measurements; and Dr.Eric Rawson for his contribution in the development of the SEASONS hs-CRP project. We also thank Drs. CharlesMatthews and Patty Freedson for their contribution on physical activity measurements.
References1. www.cdc.gov/nchs/faststats/heart.htm Accessed April 15, 20072. www.cdc.gov/diabetes/pubs/estimates05.htm Accessed April 15, 20073. www.diabetes.org/diabetes-heart-disease-stroke.jsp Accessed April 15, 20074. Ridker PM, Buring JE, Shih J, Matias M, Hennekens CH. Prospective study of C-reactive protein and
risk of future cardiovascular events among apparently healthy women. Circulation 1998;98:731–733.[PubMed: 9727541]
5. Koenig W, Sund M, Frohlich M, Fischer HG, Lowel H, Doring A, Hutchinson WL. C-reactive protein,a sensitive marker of inflammation, predicts future risk of coronary heart disease in initially healthymiddle-aged men. Circulation 1999;99:237–242. [PubMed: 9892589]
6. Ridker PM, Hennekens CH, Buring JE, Rifai N. C-reactive protein and other markers of inflammationin the prediction of cardiovascular disease in women. N Engl J Med 2000;342:836–843. [PubMed:10733371]
7. Rutter MK, Meigs JBL, Sullivan LM, D'Agostino RB, Wilson PWF. C-reactive protein, the metabolicsyndrome, and prediction of cardiovascular events in the Framingham Offspring Study. Circulation2004;110:380–385. [PubMed: 15262834]
8. Sattar N, Gaw A, Scherbakova O, Ford I, O'Reilly Ds, Haffner SM, Isles C, Macfarlane PW, PackardCJ, Cobbe SM, Shepherd J. Metabolic syndrome with and without C-reactive protein as a predictorof coronary heart disease and diabetes in the West Scotland Coronary Prevention Study. Circulation2003;108:414–419. [PubMed: 12860911]
9. Laaksonen DE, Niskanen L, Nyyssonen K, Punnonen K, Tuomainen TP, Valkonen VP, Salonen R,Salonen JT. C-reactive protein and the development of the metabolic syndrome and diabetes in middle-aged men. Diabetologia 2004;47:1403–1410. [PubMed: 15309290]
10. Pradhan AD, Manson JE, Rifai N, Buring JE, Ridker PM. C-reactive protein, interleukin 6, and therisk of developing type 2 diabetes mellitus. JAMA 2001;286:327–334. [PubMed: 11466099]
11. Shuhei N, Kiminor Y, Nozomu K, Masamichi O, Nobuoki K. Elevated C-reactive protein is a riskfactor for development of type 2 diabetes in Japanese Americans. Diabetes Care 2003;26:2745–2757.
12. Hu F, Meigs JB, Li TY, Rifai N, Manson JE. Inflammatory markers and risk of type 2 diabetes inwomen. Diabetes 2004;53:693–700. [PubMed: 14988254]
13. Liu S, Willett W, Stampher M, Hu F, Franz M, Sampson L, Hennekens CH. A prospective study ofdietary glycemic load, carbohydrate intake and risk of coronary heart disease in US women. Am JClin Nutr 2000;71:1455–1461. [PubMed: 10837285]
Griffith et al. Page 6
Nutrition. Author manuscript; available in PMC 2009 May 1.
NIH
-PA Author Manuscript
NIH
-PA Author Manuscript
NIH
-PA Author Manuscript
14. Schulze MB, Liu S, Rimm E, Manson JE, Willett WC, Hu FB. Glycemic index, glycemic load, anddietary fiber and incidence of type 2 diabetes in younger and middle-aged women. Am J Clin Nutr2004;80:348–356. [PubMed: 15277155]
15. Brand-Miller, J.; Wolever, TMS.; Foster-Powell, KF.; Colagiuri, S. The New Glucose Revolution.New York: Marlowe & Company; 2003.
16. Merriam PA, Ockene IS, Hebert Jr, Rosal MC, Matthews CE. Seasonal variation of blood cholesterollevels: Study Methodology. Journal of Biological Rhythms 1999;14:330–339. [PubMed: 10447314]
17. http://www.nlm.nih.gov/medlineplus/ency/article/003356.htm Accessed May 12, 200718. Willet, W. Nutritional Epidemiology. New York: Oxford University Press; 1998.19. Foster-Powell K, Holt SH, Brand-Miller JC. International table of glycemic index and glycemic load
values. Am J Clin Nutr 2002;76:5–56. [PubMed: 12081815]20. http://www.glycemicindex.com/21. Olendzki BC, Ma Y, Culver AL, Ockene IS, Griffith JA, Hafner AR, Hebert JR. Methodology for
adding glycemic index and glycemic load values to 24-hour dietary recall database. Nutrition 2006Nov-Dec;22(1112):1087–95. [PubMed: 17029903]
22. Aronson D, Bartha P, Zinder O, Kerner A, Shitman E, Markiewicz W, Brook GJ. Association betweenfasting glucose and C-reactive protein in middle-aged subjects. Diabetic Medicine 2003;21:39–44.[PubMed: 14706052]
23. Miller M, Zhan M, Havas S. High Attributable Risk of Elevated C-Reactive Protein Levels toConventional Coronary Heart Disease Risk Factors. Arch Intern Med 2005;165:2063–2068.[PubMed: 16216995]
24. Pearson TA, Mensah GA, Alexander RW, Anderson JL, Cannon RO, Criqui M, Fadl YY, FortmannSP, Hong Y, Myers GL, Rifai N, Smith SC, Taubert K, Tracy RP, Vinicor F. Markers of Inflammationand Cardiovascular Disease Applications to Clinical and Public Health Practice. A Statement forHealthcare Professionals From the Center for Disease Control and Prevention and the AmericanHeart Association. Circulation 2003;107:499–511. [PubMed: 12551878]
25. Liu S, Manson JE, Buring JE, Stampfer MJ, Willet WC, Ridker PM. Relation between a diet with ahigh dietary glycemic load and plasma concentrations of high sensitivity C-reactive protein in middle-aged women. Am J Clin Nutr 2002;75:492–498. [PubMed: 11864854]
26. Krishnan S, Rosenberg L, Singer M, Hu FB, Djousse L, Cupples LA, Palmer JR. Glycemic Index,Glycemic Load, and Cereal Fiber Intake and Risk of Type 2 Diabetes in US Black Women. ArchIntern Med 2007;167:2304–9. [PubMed: 18039988]
27. Ma Y, Griffith JA, Chasan-Taber L, Olendzki BC, Jackson E, Stanek EJ 3rd, Li W, Pagoto SL, HafnerAR, Ockene IS. Association between dietary fiber and serum C-reactive protein. Am J Clin Nutr2006 Apr;83(4):760–766. [PubMed: 16600925]
Griffith et al. Page 7
Nutrition. Author manuscript; available in PMC 2009 May 1.
NIH
-PA Author Manuscript
NIH
-PA Author Manuscript
NIH
-PA Author Manuscript

Figure 1. Scatterplot between Average CRP and Average GI
Griffith et al. Page 8
Nutrition. Author manuscript; available in PMC 2009 May 1.
NIH
-PA Author Manuscript
NIH
-PA Author Manuscript
NIH
-PA Author Manuscript

Figure 2. Scatterplot between Average CRP and Average GL
Griffith et al. Page 9
Nutrition. Author manuscript; available in PMC 2009 May 1.
NIH
-PA Author Manuscript
NIH
-PA Author Manuscript
NIH
-PA Author Manuscript

Figure 3. Predicted HS-CRP vs. Average Glycemic Load by BMI Category
Griffith et al. Page 10
Nutrition. Author manuscript; available in PMC 2009 May 1.
NIH
-PA Author Manuscript
NIH
-PA Author Manuscript
NIH
-PA Author Manuscript

NIH
-PA Author Manuscript
NIH
-PA Author Manuscript
NIH
-PA Author Manuscript
Griffith et al. Page 11
Table 1Selected characteristics of the study population.
Variable
Age (years) 48 (12)Mean (SD)BMI (kg/m2) 27.4 (5.4)Mean (SD)Race White (%) 86 Hispanic White (%) 8.1 Asian (%) 1.6 Black (%) 2.7Gender Male (%) 52 Female (%) 48
Nutrition. Author manuscript; available in PMC 2009 May 1.
NIH
-PA Author Manuscript
NIH
-PA Author Manuscript
NIH
-PA Author Manuscript
Griffith et al. Page 12Ta
ble
2M
ean
med
ian
and
rang
e of
ave
rage
hig
h se
nsiti
vity
CR
P, a
vera
ge d
ieta
ry g
lyce
mic
inde
x an
d av
erag
e di
etar
y gl
ycem
ic lo
ad.
Cha
ract
eris
ticN
Mea
n(S
D)
Med
ian
Min
imum
Max
imum
hs-C
RP
(mg/
L)58
21.
81.
20.
039.
6Lo
g H
S-C
RP
582
0.06
0.08
3.73
2.27
Gly
cem
ic In
dex
582
84.9
85.1
49.1
101.
2G
lyce
mic
Loa
d58
219
8.0
184.
545
.448
8.2
Nutrition. Author manuscript; available in PMC 2009 May 1.

NIH
-PA Author Manuscript
NIH
-PA Author Manuscript
NIH
-PA Author Manuscript
Griffith et al. Page 13Ta
ble
3R
egre
ssio
n co
effic
ient
s pre
dict
ing
log
high
sens
itivi
ty C
RP
from
line
ar m
ixed
mod
els.
Cro
ss-S
ectio
nal W
ithin
Par
ticip
ant
Lon
gitu
dina
l Bet
wee
n Pa
rtic
ipan
ts
Reg
ress
ion
coef
ficie
ntSE
P-va
lue
Reg
ress
ion
coef
ficie
ntSE
P-va
lue
Gly
cem
ic In
dex
0.00
8781
0.00
7439
0.23
80-0
.002
370.
0027
430.
3881
Gly
cem
ic L
oad
-0.0
0194
0.00
0622
0.00
19-0
.000
050.
0003
070.
8689
Nutrition. Author manuscript; available in PMC 2009 May 1.

NIH
-PA Author Manuscript
NIH
-PA Author Manuscript
NIH
-PA Author Manuscript
Griffith et al. Page 14Ta
ble
4R
egre
ssio
n co
effic
ient
s pre
dict
ing
log
high
sens
itivi
ty C
RP
from
mul
tivar
iabl
e lin
ear m
ixed
mod
els.
Cro
ss-S
ectio
nal W
ithin
Par
ticip
ant
Lon
gitu
dina
l Bet
wee
n Pa
rtic
ipan
ts
Reg
ress
ion
coef
ficie
ntSE
P-va
lue
Reg
ress
ion
coef
ficie
ntSE
P-va
lue
Gly
cem
ic In
dex*
0.00
2671
0.00
6269
0.67
02-0
.003
960.
0028
320.
1627
Gly
cem
ic L
oad**
-0.0
0096
0.00
0528
0.06
83-0
.000
120.
0003
310.
7197
* Mul
tivar
iate
mod
el in
clud
es B
MI,
smok
ing
stat
us a
nd, a
ge
**M
ultiv
aria
te m
odel
incl
udes
: BM
I, sm
okin
g st
atus
, age
, and
infe
ctio
n st
atus
Nutrition. Author manuscript; available in PMC 2009 May 1.

NIH
-PA Author Manuscript
NIH
-PA Author Manuscript
NIH
-PA Author Manuscript
Griffith et al. Page 15Ta
ble
5R
egre
ssio
n co
effic
ient
s pre
dict
ing
log
high
sens
itivi
ty C
RP
from
mul
tivar
iabl
e lin
ear m
ixed
mod
els f
or g
lyce
mic
load
stra
tifie
d by
BM
I cat
egor
ies.
Cro
ss-S
ectio
nal W
ithin
Par
ticip
ant
Lon
gitu
dina
l Bet
wee
n Pa
rtic
ipan
ts
BM
I cat
egor
y (k
g/m
2)R
egre
ssio
n co
effic
ient
SEP-
valu
eR
egre
ssio
n co
effic
ient
SEP-
valu
e
18.5
to 2
4.9
Nor
mal
-0.0
0100
0.00
0888
0.25
95-0
.000
700.
0006
580.
2907
25.0
to 2
9.9
Ove
rwei
ght
-0.0
0063
0.00
0929
0.49
66-0
.000
220.
0004
720.
6449
> 30
Obe
se-0
.001
850.
0009
150.
0440
0.00
0710
0.00
0484
0.14
33
Mul
tivar
iate
mod
el in
clud
es: B
MI,
smok
ing
stat
us, a
ge, a
nd in
fect
ion
stat
us
Nutrition. Author manuscript; available in PMC 2009 May 1.
Related Documents