Electricity generation and use February 17, 2009 ME 496ALT – Alternative Energy Electricity Generation and Use Electricity Generation and Use Larry Caretto Mechanical Engineering 496ALT Alternative Energy Alternative Energy February 17, 2009 Assignments and Exams • First Midterm Exam – Thursday, February 26 – Open book and notes – Covers up to tonight’s lecture – Like homework assignments • Reading: Chapter 17 for tonight, Chapter 8 for following two lectures • Homework tonight and next Tuesday (covered on February 26 midterm) 3 Outline • Review last class • Electricity demand • Electricity supply • Costs of electricity • Utilities versus non-utility producers • Deregulation of electricity • Alternative generation approaches 4 What kinds of energy stored? • Fuel containers store fuel energy • Batteries and supercapacitors store electrical energy • Flywheels and compressed air systems store mechanical energy • Thermal energy storage as latent or sensible heat used in heating and cooling systems 5 Energy Storage Measures • Energy per unit mass (kJ/kg; Btu/lb m ) • Energy per unit volume (kJ/m 3 ; Btu/ft 3 ) • Rate of delivery of energy to and from storage (kW/kg; Btu/hr⋅kg) • Efficiency (energy out/energy in) • Life cycles – how many times can the storage device be used 6 Fuel Energy • Volumetric energy storage in Btu/gallon – Gasoline: 109,000 to 125,000 – Diesel fuel: 128,000 to 130,000 – Biodiesel: 117,000 to 120,000 – Natural gas: 33,000 to 38,000 at 3,000 psi, 38,000 to 44,000 at 3,600 psi, and ~73,500 as liquefied natural gas (LNG) – 85% ethanol in gasoline: ~80,000 – 85% methanol in gasoline: 56,000 to 66,000 – Hydrogen: ~6,500 at 3,000 psi, ~16,000 at 10,000 psi, and ~30,500 as liquid – Liquefied petroleum gas (LPG): ~84,000 http://www.eere.energy.gov/afdc/altfuel/fuel_comp.html

Welcome message from author
This document is posted to help you gain knowledge. Please leave a comment to let me know what you think about it! Share it to your friends and learn new things together.
Transcript
Electricity generation and use February 17, 2009
ME 496ALT – Alternative Energy
Electricity Generation and UseElectricity Generation and Use
Larry CarettoMechanical Engineering 496ALT
Alternative EnergyAlternative Energy
February 17, 2009
Assignments and Exams• First Midterm Exam – Thursday,
February 26– Open book and notes– Covers up to tonight’s lecture– Like homework assignments
• Reading: Chapter 17 for tonight, Chapter 8 for following two lectures
• Homework tonight and next Tuesday (covered on February 26 midterm)
3
Outline• Review last class• Electricity demand• Electricity supply• Costs of electricity• Utilities versus non-utility producers• Deregulation of electricity• Alternative generation approaches
4
What kinds of energy stored?• Fuel containers store fuel energy• Batteries and supercapacitors store
electrical energy• Flywheels and compressed air systems
store mechanical energy• Thermal energy storage as latent or
sensible heat used in heating and cooling systems
5
Energy Storage Measures• Energy per unit mass (kJ/kg; Btu/lbm)• Energy per unit volume (kJ/m3; Btu/ft3)• Rate of delivery of energy to and from
storage (kW/kg; Btu/hr⋅kg)• Efficiency (energy out/energy in)• Life cycles – how many times can the
storage device be used
6
Fuel Energy• Volumetric energy storage in Btu/gallon
– Gasoline: 109,000 to 125,000– Diesel fuel: 128,000 to 130,000– Biodiesel: 117,000 to 120,000– Natural gas: 33,000 to 38,000 at 3,000 psi,
38,000 to 44,000 at 3,600 psi, and ~73,500 as liquefied natural gas (LNG)
– 85% ethanol in gasoline: ~80,000– 85% methanol in gasoline: 56,000 to 66,000– Hydrogen: ~6,500 at 3,000 psi, ~16,000 at
10,000 psi, and ~30,500 as liquid– Liquefied petroleum gas (LPG): ~84,000
http://www.eere.energy.gov/afdc/altfuel/fuel_comp.html

Electricity generation and use February 17, 2009
ME 496ALT – Alternative Energy
7
Battery Properties
http://www.mpoweruk.com/chemistries.htm 8
Compare• Batteries
versus other motive power
• http://www.nap.edu/books/0309092612/html/40.html
Whr/kg kJ/m3
Cost $/ kWh
Effi-ciency
Peak W/kg
Lead acid batteries 40 30000 130 80% 250Nickel-Cadiumbatteries 50 37500 300 75% 110
Nickel-metal-hydride batteries 80 60000 260 70% 250
Sodium-sulfur batteries 190 143000 330 85% 230
Lithium-ion batteries 100 75000 200 95% 250
Capacitor 11.1 40000 95%Inductor 0.556 10000 180 95%Pumped hydro 0.000278 1 90 70%
Whr/kg kJ/m3
Cost $/ kWh
Effi-ciency
Peak W/kg
Lead acid batteries 40 30000 130 80% 250Sodium-sulfur batteries 190 143000 330 85% 230
Lithium-ion batteries 100 75000 200 95% 250Lead acid batteries(2) 55.6 30000 54 75%Flywheel 55.6 200000 80%Liquid hydrocarbon fuels 13888.9 3.5x10⁷
Unreferenced data obtained in 2002 by L. S. Caretto
11
US Electric Generation
0
1
2
3
4
5
6
7
8
9
10
1945 1955 1965 1975 1985 1995 2005Year
Generation (trillion kWh)
DataPre-1973 forecast Pre-1973 forecast
growth rate is 7.8%/year
Plotted from spreadsheet data downloaded from http://www.eia.doe.gov/emeu/aer/elect.html
12
US Electricity Net Generation, 2005
Total = 4.055 billion kWhElectric Utility Plants = 63.0%Independent Power Producers and Combined Heat and Power Plants = 37.0%
http://www.eia.doe.gov/cneaf/electricity/epa/figes1.html

Electricity generation and use February 17, 2009
ME 496ALT – Alternative Energy
13
Electricity Use by Sector
Residential
Commercial
Industrial
Direct UseOther
0.0
0.5
1.0
1.5
2.0
2.5
3.0
3.5
4.0
1994 1996 1998 2000 2002 2004
Year
Use
(tril
lions
of k
ilow
att h
ou
Plotted from data in spreadsheet downloadedfrom http://www.eia.doe.gov/cneaf/electricity/ epa/epa_sum.html
14
Residential Electricity Use
15
US Electrical Generation
0.0
0.5
1.0
1.5
2.0
2.5
3.0
3.5
4.0
1990 1995 2000 2005Year
Gen
erat
ion
(tril
lions
kW
h)
TotalCoalNuclearNatural GasHydroelectricPetroleumNon-hyrdo renewable
Plotted from data in spreadsheet downloadedfrom http://www.eia.doe.gov/emeu/aer/elect.html 16
Non-hydro Renewable Electrical Generation
0.00
0.01
0.02
0.03
0.04
0.05
0.06
1990 1995 2000 2005Year
Generation (trillions kWh)
TotalWasteGeothermalWoodWindSolar
Plotted from data in spreadsheet downloadedfrom http://www.eia.doe.gov/emeu/aer/elect.html
17
Net US Summer Capacity
http://www.eia.doe.gov/cneaf/electricity/epa/figes2.html 18
Electric Industry Fuel Costshttp://www.eia.doe.gov/cneaf/electricity/epa/figes3.html
2006 data: gas and oil down; coal up slightly
Electricity generation and use February 17, 2009
ME 496ALT – Alternative Energy
19
http://www.cpuc.ca.gov/published/report/GOV_REPORT.htm
20
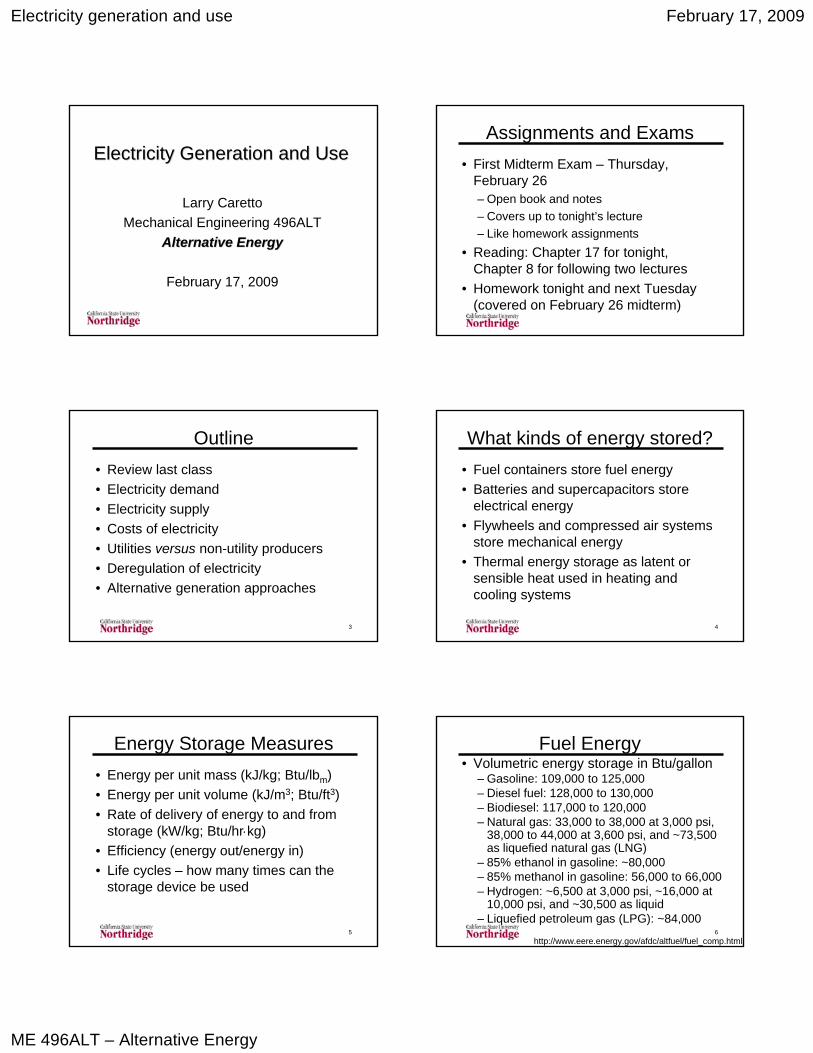
Net Electricity by State 2005
http://www.eia.doe.gov/cneaf/electricity/epa/fig1p1.html
21
Retail Electric Costs 2005
http://www.eia.doe.gov/cneaf/electricity/epa/fig7p5.html 22
Retail Electric Costs 2006
23
Residential Electric Costs 2005
http://www.eia.doe.gov/cneaf/electricity/epa/fig7p5.html 24
Commercial Electric Costs 2005
http://www.eia.doe.gov/cneaf/electricity/epa/fig7p6.html

Electricity generation and use February 17, 2009
ME 496ALT – Alternative Energy
25
Industrial Electric Costs 2005
http://www.eia.doe.gov/cneaf/electricity/epa/fig7p7.html 26
Electricity Load• Power demand varies by day and hour
– CA energy, peak MW growth: 1.25%, 1.35%• Renewable Portfolio Standards require
utilities to have renewable generation– 20% of retail sales by December 31, 2010 in
California (transmission problems?)– Papers from WCS AWMA October 2007
conference in next five slides• CA Energy Commission – Dave Ashuckian• SC Edison – James Woodruff
27 28
29 30

Electricity generation and use February 17, 2009
ME 496ALT – Alternative Energy
31 32
Electricity Sales (kWh/person)
http://www.energy.ca.gov/2007publications/CEC-100-2007-008/CEC-100-2007-008-CMF.PDF Figure ES-2
33
A Brief History• Initial development of industry
– Generation mostly by investor-owned, regulated monopolies
– Some publicly owned utilities and rural cooperatives
– Large industries generate for their own use• PURPA 1978 brings in other generators• EPAct 1992 deregulates generation at
Federal level34
Who Makes Electricity?• Traditional electric utilities
– 239 investor owned utilities supply about 75% of ultimate customers
– 2,009 publicly owned utilities– 912 consumer owned rural electric
cooperatives– 10 Federal electric utilities
• About 2,110 non-utility power producers as shown on next chart
http://www.eia.doe.gov/cneaf/electricity/page/prim2/toc2.html
35
Non-utility Electric Producers• Facilities qualifying under 1978 Public
Utility Regulatory Policies Act (PURPA)• Cogeneration facilities producing steam
and electricity, doing other business• Independent power producers who sell
electricity wholesale• Exempt wholesale generators under
1992 Energy Policy Act (EPACT)• http://www.eia.doe.gov/cneaf/electricity/page/prim2/toc2.html
36
Government Agencies• Federal Energy Regulatory Commission
(FERC) regulates interstate transmission of electricity, oil and gas
• State public utilities commissions regulate investor-owned utilities in state
• State Independent System Operators (ISO) operates transmission ines
• California Energy Commission (CEC) one-stop permits for new power plants

Electricity generation and use February 17, 2009
ME 496ALT – Alternative Energy
37
What is PURPA?• Public Utility Regulatory Policies Act 1978
– Requires utilities to change rate structures from earlier ones that encouraged use
• Costs per kWh declined with use based on model valid from 1950-1970
– Convert from oil to gas– Require utilities to purchase power from
qualified facilities (QFs) who generated it• Includes, solar, wind and biomass generation• Among requirements to be a QF is the production
of electricity and heat with stipulated efficiency
38
Effects of PURPA• Started the development of a new
industry: non-utility power producers• Merged well with development of
stationary gas turbine technology for cogeneration
• California incentives linked to PURPA made it an international leader for solar and wind electricity (about 85% of world wind and 95% of world solar in 1990)
39
1992 Energy Policy Act• Required owners of transmission lines
to accept power from other generators for ultimate customers (“wheeling”)
• Federal Energy Regulatory Commission passed enabling regulations in 1996
• California legislature passed restructuring legislation same year
• History of deregulation has been mixed
40
http://www.eia.doe.gov/cneaf/electricity/page/restructuring/restructure_elect.html
http://www.eia.doe.gov/cneaf/electricity/page/restructuring/restructure_elect.html
April 2007 data
41
http://www.cpuc.ca.gov/published/report/GOV_REPORT.htm
42
The California Experience• Law passed in 1996
– 10% decrease in rates mandated until utilities paid off existing debt
• Open market started March 31, 1998• Average wholesale price was $19.73/MWh
compared to $24/MWh before deregulation• SDG&E first to raise prices on July 1, 1999
– Wholesale price increases to $500/MWh in May 2000 (billed to SDG&E customers)

Electricity generation and use February 17, 2009
ME 496ALT – Alternative Energy
43
The California Experience II• Price caps drives electricity sales
outside of California– Aluminum smelters made more money by
shutting down and selling electricity• Wholesale price escalations not felt by
LADWP, SCE, and PG&E customers– Companies losing 20 to 30 cents on each
kWh they sold– PG&E bankrupt, SCE close to it
44
The California Experience III• January 17, 2001 governor directs DWR
to enter into long-term contracts– Contract price was $70/MWh when
wholesale spot price was about $300/MWh– Later spot prices declined to $35/MWh
• Price increases due to manipulations by companies like Enron and real cost increases because of price increases in natural gas
45
The California Experience IV• What went wrong?
– Manipulation by power suppliers– Fuel cost increases– Customers shielded from price increases
• When customers had to pay higher prices, electricity use decreased
– Lack of new power plants to meet demand• Capacity increases not provided
• Current status http://www.ferc.gov/ industries/electric/indus-act/wec.asp
46
47 48
The Pennsylvania Experience• Legislation did not require utilities to
divest generation facilities and allowed long-term contracts
• State is net exporter of electricity• Originally considered success story, just
the opposite of California• Subsequent price increases – utilities
control large fraction of generation• Prices still lower than before deregulation

Electricity generation and use February 17, 2009
ME 496ALT – Alternative Energy
49
http://www.cpuc.ca.gov/published/report/GOV_REPORT.htm
50
Reliability Councils• Set up to share power in a region• Link producers to produce system reliability
– ERCOT – Electric Reliability Council of Texas– FRCC – Florida Reliability Coordinating Council– MRO – Midwest Reliability Organization– NPCC – Northwest Power Coordinating Council– RFC – Reliability First Corporation– SERC – Southern Electric Reliability Council– SPP – Southwest Power Pool– WECC – Western Energy Coordinating Council
51
Electric Reliability Council Regions
http://www.eia.doe.gov/cneaf/electricity/epa/fig3p2.html
52
http://www.ksg.harvard.edu/hepg/Papers/Pope_CA.price.spike.update_12-9-02.pdf
53
California Climate vs. Demand
http://www.energy.ca.gov/2005publications/CEC-500-2005-201/CEC-500-2005-201-SF.PDF
54
LADWP Electricity Rates• Residential normal meter: $0.07288/kWh• Residential time-of-service meter
– Monday–Friday, 1–5 pm: $0.14377/kWh – Monday–Friday, 10 am–1 pm: $0.08793/kWh– All other times: $0.03780/kWh
• Other services have demand charge (per kW) but lower service charge– High season (June to October) extra– Also have different rates for interruptible or
non-interruptiblehttp://www.ladwp.com/ladwp/cms/ladwp001646.jsp
Electricity generation and use February 17, 2009
ME 496ALT – Alternative Energy
55
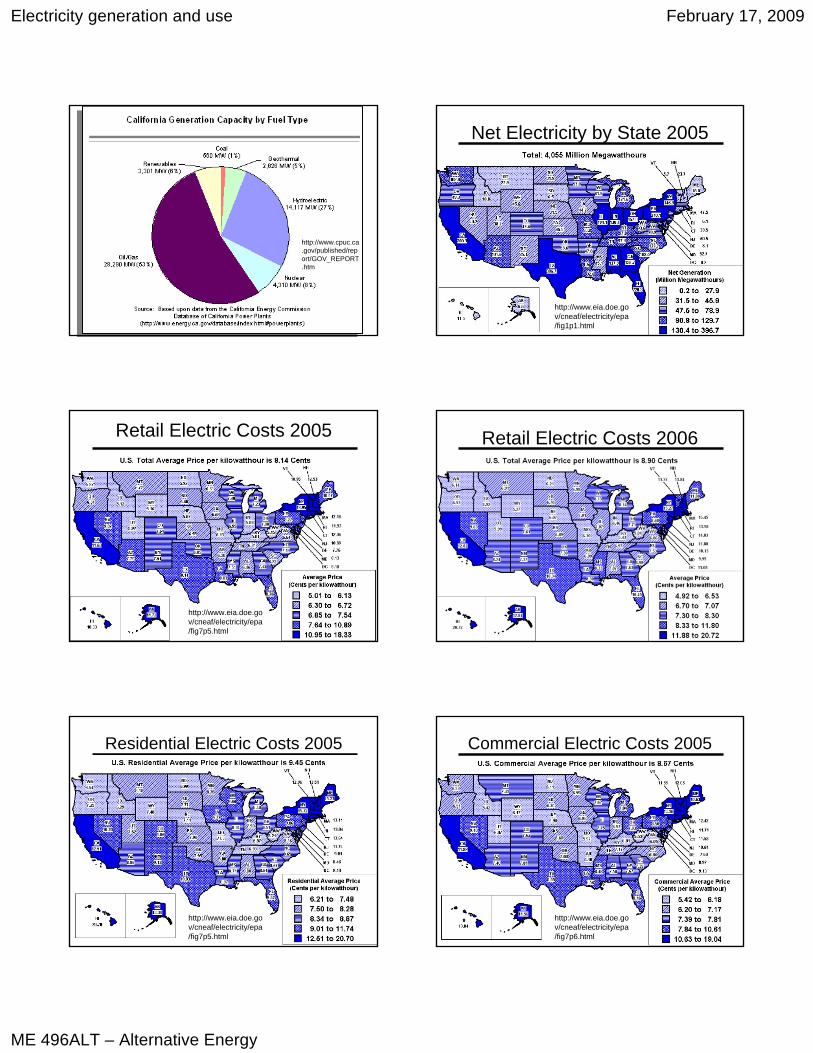
California Supply Today
Harvey, A. and Koopman, S., (1993), ‘Forecasting Hourly Electricity Demand Using Time-Varying Splines’, Journal of the American Statistical Association, 88, 1228-1253.
New South Wales
56
Electric Plants• Base load plants run continuously
– Produce load that is required 24/7– Most efficient plants
• Peak load plants– Used to satisfy demand peaks– Often gas turbines that are less efficient– Hydroelectric plants run as peak plants
because of limited resource• Distributed Generation – large users
generate their own power
57
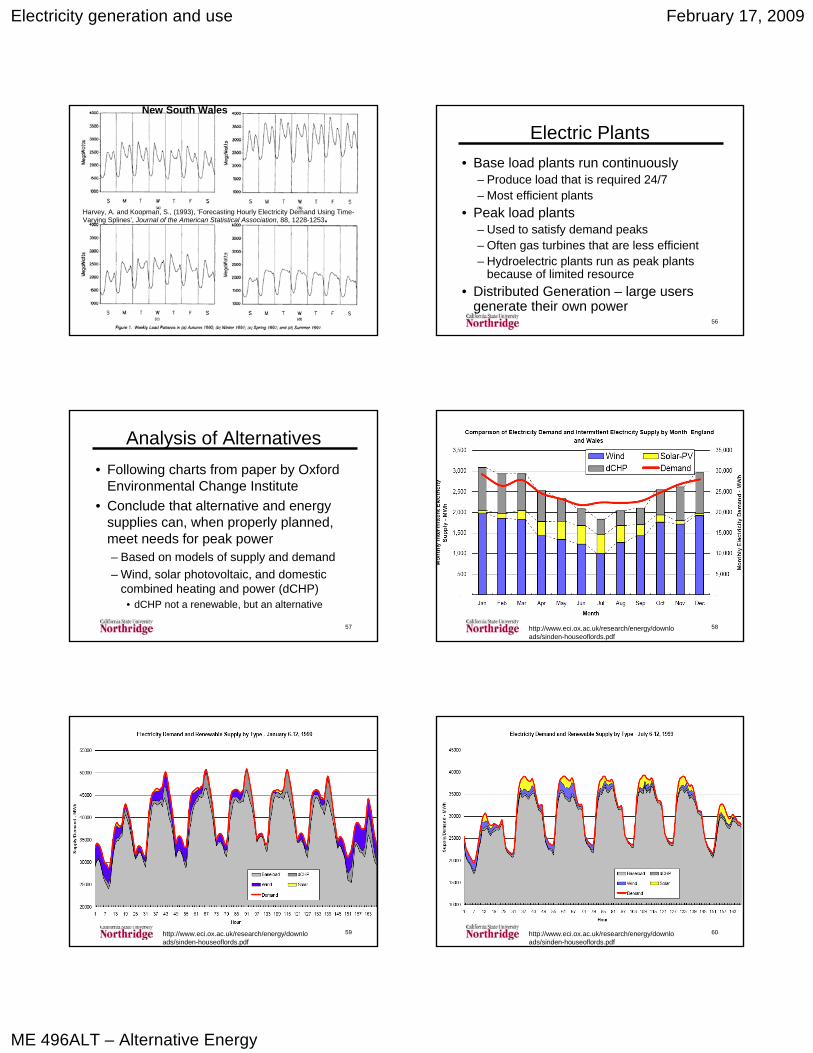
Analysis of Alternatives• Following charts from paper by Oxford
Environmental Change Institute• Conclude that alternative and energy
supplies can, when properly planned, meet needs for peak power– Based on models of supply and demand– Wind, solar photovoltaic, and domestic
combined heating and power (dCHP)• dCHP not a renewable, but an alternative
58http://www.eci.ox.ac.uk/research/energy/downloads/sinden-houseoflords.pdf
59http://www.eci.ox.ac.uk/research/energy/downloads/sinden-houseoflords.pdf
60http://www.eci.ox.ac.uk/research/energy/downloads/sinden-houseoflords.pdf
Related Documents