Asset-Liability Management and bank profitability: Statistical cost accounting analysis from an emerging market OWUSU, Freeman and ALHASSAN, AL Available from Sheffield Hallam University Research Archive (SHURA) at: http://shura.shu.ac.uk/27821/ This document is the author deposited version. You are advised to consult the publisher's version if you wish to cite from it. Published version OWUSU, Freeman and ALHASSAN, AL (2020). Asset-Liability Management and bank profitability: Statistical cost accounting analysis from an emerging market. International Journal of Finance and Economics. Copyright and re-use policy See http://shura.shu.ac.uk/information.html Sheffield Hallam University Research Archive http://shura.shu.ac.uk

Welcome message from author
This document is posted to help you gain knowledge. Please leave a comment to let me know what you think about it! Share it to your friends and learn new things together.
Transcript
Asset-Liability Management and bank profitability: Statistical cost accounting analysis from an emerging market
OWUSU, Freeman and ALHASSAN, AL
Available from Sheffield Hallam University Research Archive (SHURA) at:
http://shura.shu.ac.uk/27821/
This document is the author deposited version. You are advised to consult the publisher's version if you wish to cite from it.
Published version
OWUSU, Freeman and ALHASSAN, AL (2020). Asset-Liability Management and bank profitability: Statistical cost accounting analysis from an emerging market. International Journal of Finance and Economics.
Copyright and re-use policy
See http://shura.shu.ac.uk/information.html
Sheffield Hallam University Research Archivehttp://shura.shu.ac.uk
R E S E A R CH AR T I C L E
Asset-Liability Management and bank profitability:Statistical cost accounting analysis from an emergingmarket
Freeman Brobbey Owusu1 | Abdul Latif Alhassan2
1Department of Accounting and Finance,Sheffield Business School, SheffieldHallam University, Sheffield, UK2Development Finance Centre (DEFIC),Graduate School of Business, University ofCape Town, Cape Town, South Africa
CorrespondenceFreeman B. Owusu, Department ofAccounting and Finance, SheffieldHallam University, Sheffield, UK.Email: [email protected]
Abstract
This paper employs the Statistical Cost Accounting (SCA) model to examine
the relationship between profit and Asset-Liability Management (ALM) struc-
ture of 27 banks in Ghana over the period 2007–2015. The findings confirm
the central hypothesis of the SCA model and provide evidence that profitability
is linked to balance sheet items in Ghana. It also documents evidence that
domestic banks have higher rate of return on assets than foreign banks over
the study period. In addition, high profit banks were observed to have higher
rate of return on assets as well as higher rate of cost on liabilities than low
profit banks. These findings provide useful insights to bank management
through the identification of the assets items that generate highest return on
bank profitability.
KEYWORD S
Asset and Liability Management, banking, Profitability, Statistical Cost Accounting
1 | INTRODUCTION
The economic growth of every country is influencedgreatly by the activities of banks. Thus, a sound bankingsystem is essential for the economic development of everynation (Ayadi, Arbak, Naceur, & De Groen, 2015;Goodhart, 2004). For most African countries with thinand illiquid stock markets (see Allen, Otchere, &Senbet, 2011), the banking industry remains the mainfinancial intermediary through which funds are trans-ferred from surplus units to deficit units for productiveuse. Hence, failure of the banking system will generateserious negative externalities for the rest of the economy(Morris & Turner, 1996). Banking crises and failures indeveloping economies far outweigh those in developedeconomies (Caprio & Klingebiel, 1996). According to
Morris and Turner (1996), banking problems in thedeveloping economies have dire consequences for thedomestic economies and rippling effect on other coun-tries as a result of the integration of financial marketsglobally.
Through prudent management of assets and liabili-ties, banks are able to ensure going concern. Poor Assetand Liability Management (ALM) has been identified asone of the root causes of bank failures (Daumont, LeGall, & Leroux, 2004; Kapur, Hadjimichael, Hilber, &Szymczak, 1991). ALM involves the strategic manage-ment of the assets and liabilities of an institution (bank)to optimize profitability, improve liquidity, and to protectit against various bank risks (Brick, 2014). It is an indis-pensable part of risk management, which is at the verycore of financial management of banks. ALM goes
Received: 24 October 2018 Revised: 13 October 2019 Accepted: 18 June 2020
DOI: 10.1002/ijfe.1860
This is an open access article under the terms of the Creative Commons Attribution License, which permits use, distribution and reproduction in any medium, provided
the original work is properly cited.
© 2020 The Authors. International Journal of Finance & Economics published by John Wiley & Sons Ltd.
Int J Fin Econ. 2020;1–15. wileyonlinelibrary.com/journal/ijfe 1
beyond managing individual assets and liabilities butadopts an integrated approach of managing the two sidesof the balance sheet of a bank simultaneously (Gup &Brooks, 1993). The core function of banks is to acceptdeposits (liability) and make loans (assets) (Fama, 1980).They incur costs on their liabilities (deposits) and earnincome on their assets (loans). This implies that to maxi-mize banks' profit, efficient ALM is essential (Tektas, NurOzkan-Gunay & Gunay, 2005).
While several studies (see Asiri, 2007; Chatterjee &Dutta, 2016; Hester & Zoellner, 1966; Kosmidou,Pasiouras, & Floropoulos, 2004; Kwast & Rose, 1982;Vasiliou, 1996) have examined the ALM from differentcontext in developed economies, empirical evidence fromemerging African economies appear parsimonious. Thisstudy, therefore, seeks to provide empirical evidence fromthe Ghanaian context. In order to achieve this objective,the paper applies the Statistical Cost Accounting (SCA)model on annual data of 27 banks from 2007 to 2015 toexamine the relationship between components of banks'assets and liabilities on profitability measured as NetInterest Income (NII) and Net Income (NI). In addition,further robustness analysis is undertaken by estimatingthe model for sub-samples of foreign versus domestic andhigh-profit versus low-profit banks.
This current empirical investigation is motivated bythe recent worrying trends in the Ghanaian banking sec-tor. The sector has come under intense pressure in recenttimes following the collapse of two domestic banks (UTBank Ghana Limited and Capital Bank Limited)(PWC, 2019). These two banks were identified by theCentral bank as insolvent after Asset Quality Review(AQR) exercise which led to revocation of their licensesunder a purchase and assumption agreement whichallowed the biggest domestic bank (GCB Bank Limited)to take over the affected banks' selected assets anddeposits (BOG, 2017). A year after the revocation of theselicenses, five other domestic banks also had their licensesrevoked for insolvency, breach of cash reserve require-ment and negative capital adequacy ratio (BOG, 2018;PWC, 2019).These banks were combined into one newlycreated state-run bank called “Consolidated Bank” andthe government had to issue USD 1.2 billion in bonds toclear their debt. These happenings in the banking sectorhave largely been attributed to mismanagement of theassets and liabilities of these banks (BOG, 2018). The sus-ceptibility of the banking industry to such alleged mis-management makes it worthy to analyse the situation toassess the link between ALM and bank profitability.
This paper makes two major contributions to the lit-erature on bank performance in Ghana (Africa). First, itis the only empirical study to apply the SCA approach toexamine the linkages between Asset-Liability (AL)
composition and bank profitability in the Ghanaian con-text, as far as the authors are concerned. Secondly, thisstudy is the first to use Net Interest Income (NII) as adependent variable to examine the link between ALMcomposition and bank profitability. This paper is also aresponse to the call by Hester and Zoellner (1966) for dif-ferent dependent variables to be used to test the effi-ciency of the SCA model since the model is very sensitiveto the choice of dependent variable.
The remaining part of this paper is organized as fol-lows: Section 2 presents a brief outlook of Ghanaianbanking sector while Section 3 reviews the relevantempirical literature on ALM, Statistical Cost Accountingand Bank profitability. Section 4 describes the data andmethodology adopted for the purposes of the study whilstSection 5 delineates the concluding remarks and recom-mendation for further research.
2 | OVERVIEW OF THEGHANAIAN BANKING SECTOR
The banking industry in Ghana over the last decades hasseen tremendous reforms and transformations leading tophenomenal growth in the sector. The creation of anenabling environment and enactment of policies andlaws by the government and Bank of Ghana have hadenormous impact on the sector. The enactment of thebanking law (PNDC Law 225) in 1989 set the pace formajor reforms in the banking industry to commence inGhana. Through these reforms, the banking sectorwitnessed the emergence of a number of domestic banks(Antwi-Asare & Addison, 2000).
The Divestiture of Interests Law of 1993 throughDivestiture Program implemented in the early 1990s bythe government of Ghana, led to the privatization ofsome of the state-owned banks which led to financial lib-eralization (Adei, 2006; Isshaq, Bokpin, & Amoah, 2012).This led to the influx of more local and internationalbanks into Ghana's banking sector (Acheampong, 2013),a phenomenon which is normally associated with deep-ened competition and efficiency (Beck, Demirgüç-Kunt,& Levine, 2006; Boldrin & Levine, 2009; Demirgüç-Kunt& Levine, 2008). Additionally, to align the banking sectorwith global standards, a new Banking Act called theBanking Act 2004 Act 673 promulgated which was lateramended in 2007 by the Banking Amendment Act, 2007(Act 738).
In 2016, the Banks and Specialized Deposit-TakingInstitutions Act, 2016 (Act 930) and the Ghana DepositProtection Act 2016 (Act 931) were introduced. TheDeposit Protection Act was later amended by the GhanaDeposit Protection (Amendment) Act 2018 (Act 968). All
2 OWUSU AND ALHASSAN
these reforms were done to enhance monitory and fur-ther stabilize and strengthen the banking industry inGhana (PWC, 2018).
Following the collapse of some local banks within aspace of 1 year, the Central bank in its quest to furtherstrengthen and stabilize the banking sector, in 2017,introduced a new policy that led to a temporary freeze onthe issuance of license to new banks and other financialinstitutions. According to the central bank, this was doneto tighten supervision and ensure the existing banks areefficient in their operations.
Over the years, the minimum capital requirementshas undergone several changes with the most recentchange occurring in September 2017. It was increasedfrom GHS 120 million to GHS 400 million and bankswere required to meet this new quota by December 2018(PWC, 2019). The sharp increase in minimum capitalrequirement brought intense pressure on local banksleading to a number of mergers and acquisitions withinthe sector.
2.1 | Stylized fact about Ghanaian banks
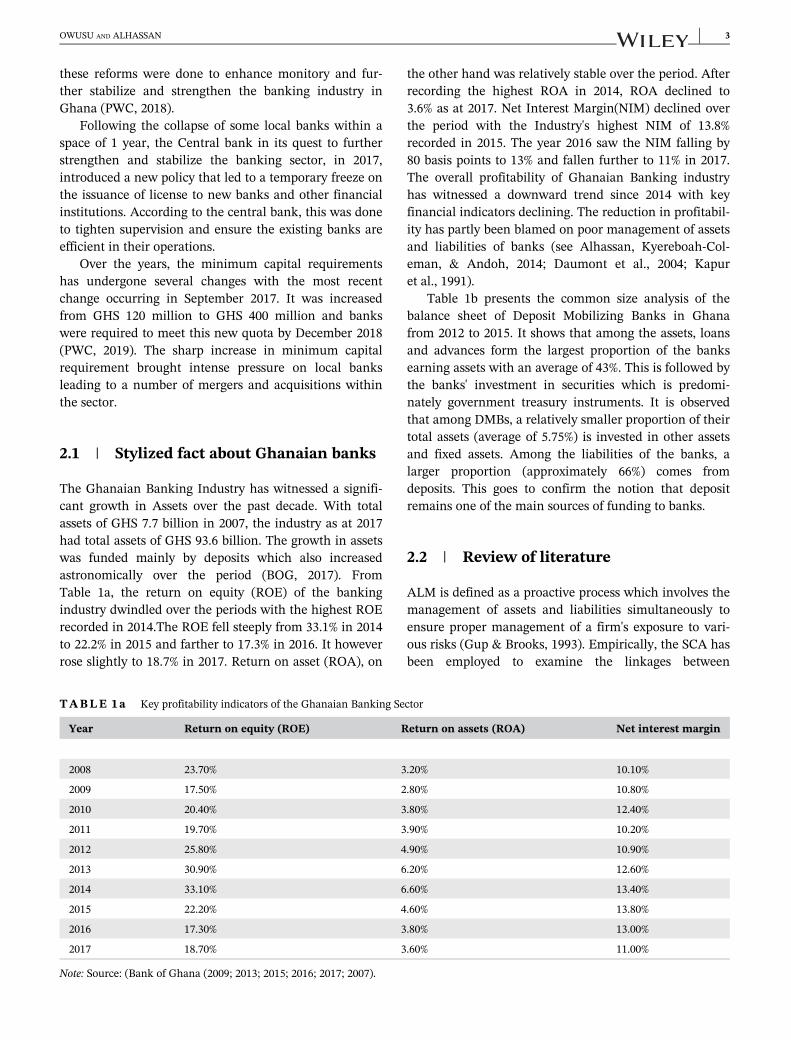
The Ghanaian Banking Industry has witnessed a signifi-cant growth in Assets over the past decade. With totalassets of GHS 7.7 billion in 2007, the industry as at 2017had total assets of GHS 93.6 billion. The growth in assetswas funded mainly by deposits which also increasedastronomically over the period (BOG, 2017). FromTable 1a, the return on equity (ROE) of the bankingindustry dwindled over the periods with the highest ROErecorded in 2014.The ROE fell steeply from 33.1% in 2014to 22.2% in 2015 and farther to 17.3% in 2016. It howeverrose slightly to 18.7% in 2017. Return on asset (ROA), on
the other hand was relatively stable over the period. Afterrecording the highest ROA in 2014, ROA declined to3.6% as at 2017. Net Interest Margin(NIM) declined overthe period with the Industry's highest NIM of 13.8%recorded in 2015. The year 2016 saw the NIM falling by80 basis points to 13% and fallen further to 11% in 2017.The overall profitability of Ghanaian Banking industryhas witnessed a downward trend since 2014 with keyfinancial indicators declining. The reduction in profitabil-ity has partly been blamed on poor management of assetsand liabilities of banks (see Alhassan, Kyereboah-Col-eman, & Andoh, 2014; Daumont et al., 2004; Kapuret al., 1991).
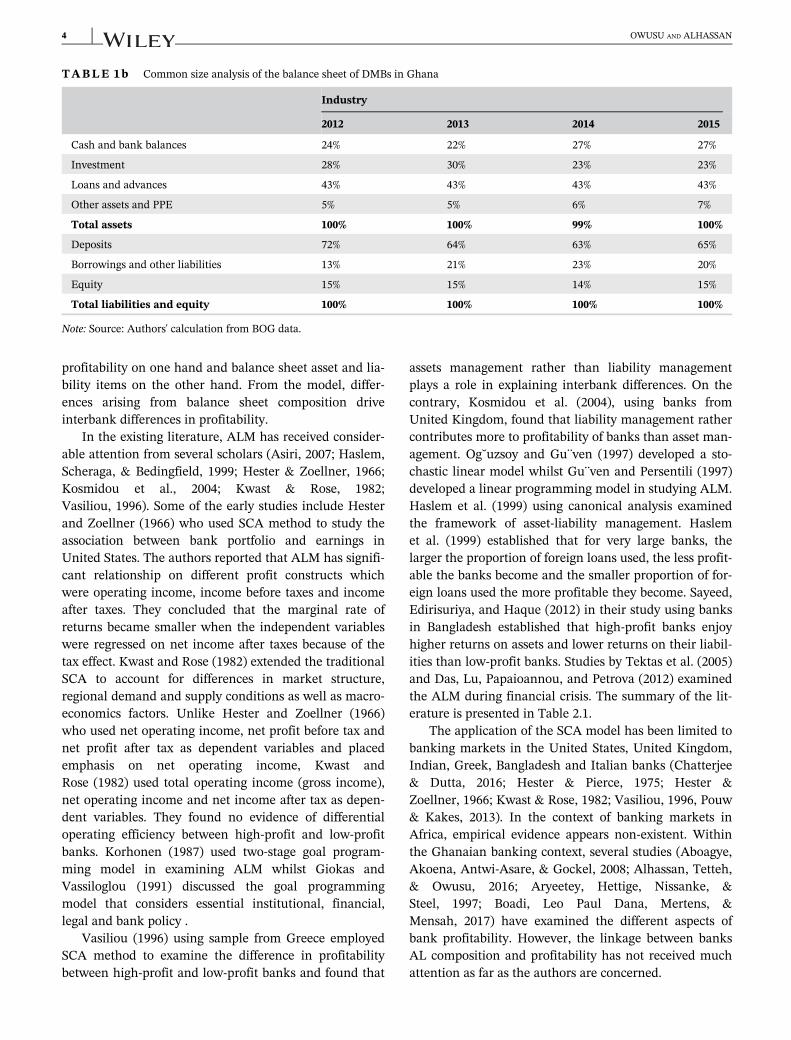
Table 1b presents the common size analysis of thebalance sheet of Deposit Mobilizing Banks in Ghanafrom 2012 to 2015. It shows that among the assets, loansand advances form the largest proportion of the banksearning assets with an average of 43%. This is followed bythe banks' investment in securities which is predomi-nately government treasury instruments. It is observedthat among DMBs, a relatively smaller proportion of theirtotal assets (average of 5.75%) is invested in other assetsand fixed assets. Among the liabilities of the banks, alarger proportion (approximately 66%) comes fromdeposits. This goes to confirm the notion that depositremains one of the main sources of funding to banks.
2.2 | Review of literature
ALM is defined as a proactive process which involves themanagement of assets and liabilities simultaneously toensure proper management of a firm's exposure to vari-ous risks (Gup & Brooks, 1993). Empirically, the SCA hasbeen employed to examine the linkages between
TABLE 1a Key profitability indicators of the Ghanaian Banking Sector
Year Return on equity (ROE) Return on assets (ROA) Net interest margin
2008 23.70% 3.20% 10.10%
2009 17.50% 2.80% 10.80%
2010 20.40% 3.80% 12.40%
2011 19.70% 3.90% 10.20%
2012 25.80% 4.90% 10.90%
2013 30.90% 6.20% 12.60%
2014 33.10% 6.60% 13.40%
2015 22.20% 4.60% 13.80%
2016 17.30% 3.80% 13.00%
2017 18.70% 3.60% 11.00%
Note: Source: (Bank of Ghana (2009; 2013; 2015; 2016; 2017; 2007).
OWUSU AND ALHASSAN 3
profitability on one hand and balance sheet asset and lia-bility items on the other hand. From the model, differ-ences arising from balance sheet composition driveinterbank differences in profitability.
In the existing literature, ALM has received consider-able attention from several scholars (Asiri, 2007; Haslem,Scheraga, & Bedingfield, 1999; Hester & Zoellner, 1966;Kosmidou et al., 2004; Kwast & Rose, 1982;Vasiliou, 1996). Some of the early studies include Hesterand Zoellner (1966) who used SCA method to study theassociation between bank portfolio and earnings inUnited States. The authors reported that ALM has signifi-cant relationship on different profit constructs whichwere operating income, income before taxes and incomeafter taxes. They concluded that the marginal rate ofreturns became smaller when the independent variableswere regressed on net income after taxes because of thetax effect. Kwast and Rose (1982) extended the traditionalSCA to account for differences in market structure,regional demand and supply conditions as well as macro-economics factors. Unlike Hester and Zoellner (1966)who used net operating income, net profit before tax andnet profit after tax as dependent variables and placedemphasis on net operating income, Kwast andRose (1982) used total operating income (gross income),net operating income and net income after tax as depen-dent variables. They found no evidence of differentialoperating efficiency between high-profit and low-profitbanks. Korhonen (1987) used two-stage goal program-ming model in examining ALM whilst Giokas andVassiloglou (1991) discussed the goal programmingmodel that considers essential institutional, financial,legal and bank policy .
Vasiliou (1996) using sample from Greece employedSCA method to examine the difference in profitabilitybetween high-profit and low-profit banks and found that
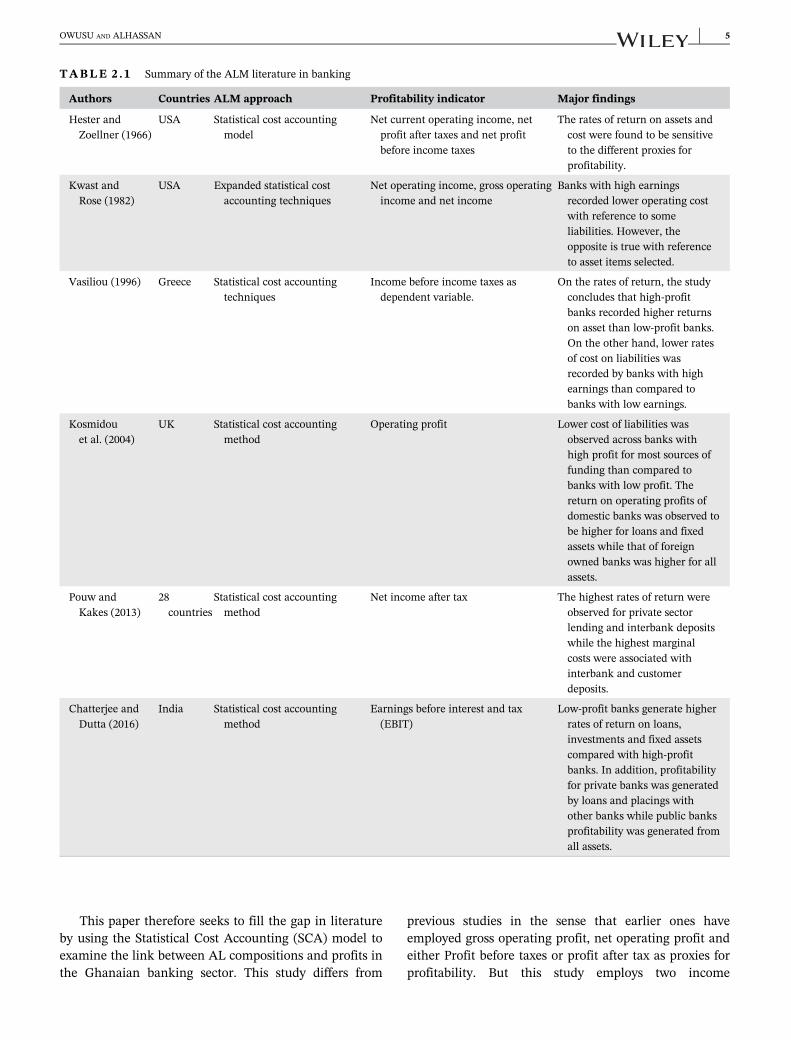
assets management rather than liability managementplays a role in explaining interbank differences. On thecontrary, Kosmidou et al. (2004), using banks fromUnited Kingdom, found that liability management rathercontributes more to profitability of banks than asset man-agement. Og˘uzsoy and Gu¨ven (1997) developed a sto-chastic linear model whilst Gu¨ven and Persentili (1997)developed a linear programming model in studying ALM.Haslem et al. (1999) using canonical analysis examinedthe framework of asset-liability management. Haslemet al. (1999) established that for very large banks, thelarger the proportion of foreign loans used, the less profit-able the banks become and the smaller proportion of for-eign loans used the more profitable they become. Sayeed,Edirisuriya, and Haque (2012) in their study using banksin Bangladesh established that high-profit banks enjoyhigher returns on assets and lower returns on their liabil-ities than low-profit banks. Studies by Tektas et al. (2005)and Das, Lu, Papaioannou, and Petrova (2012) examinedthe ALM during financial crisis. The summary of the lit-erature is presented in Table 2.1.
The application of the SCA model has been limited tobanking markets in the United States, United Kingdom,Indian, Greek, Bangladesh and Italian banks (Chatterjee& Dutta, 2016; Hester & Pierce, 1975; Hester &Zoellner, 1966; Kwast & Rose, 1982; Vasiliou, 1996, Pouw& Kakes, 2013). In the context of banking markets inAfrica, empirical evidence appears non-existent. Withinthe Ghanaian banking context, several studies (Aboagye,Akoena, Antwi-Asare, & Gockel, 2008; Alhassan, Tetteh,& Owusu, 2016; Aryeetey, Hettige, Nissanke, &Steel, 1997; Boadi, Leo Paul Dana, Mertens, &Mensah, 2017) have examined the different aspects ofbank profitability. However, the linkage between banksAL composition and profitability has not received muchattention as far as the authors are concerned.
TABLE 1b Common size analysis of the balance sheet of DMBs in Ghana
Industry
2012 2013 2014 2015
Cash and bank balances 24% 22% 27% 27%
Investment 28% 30% 23% 23%
Loans and advances 43% 43% 43% 43%
Other assets and PPE 5% 5% 6% 7%
Total assets 100% 100% 99% 100%
Deposits 72% 64% 63% 65%
Borrowings and other liabilities 13% 21% 23% 20%
Equity 15% 15% 14% 15%
Total liabilities and equity 100% 100% 100% 100%
Note: Source: Authors' calculation from BOG data.
4 OWUSU AND ALHASSAN
This paper therefore seeks to fill the gap in literatureby using the Statistical Cost Accounting (SCA) model toexamine the link between AL compositions and profits inthe Ghanaian banking sector. This study differs from
previous studies in the sense that earlier ones haveemployed gross operating profit, net operating profit andeither Profit before taxes or profit after tax as proxies forprofitability. But this study employs two income
TABLE 2 . 1 Summary of the ALM literature in banking
Authors Countries ALM approach Profitability indicator Major findings
Hester andZoellner (1966)
USA Statistical cost accountingmodel
Net current operating income, netprofit after taxes and net profitbefore income taxes
The rates of return on assets andcost were found to be sensitiveto the different proxies forprofitability.
Kwast andRose (1982)
USA Expanded statistical costaccounting techniques
Net operating income, gross operatingincome and net income
Banks with high earningsrecorded lower operating costwith reference to someliabilities. However, theopposite is true with referenceto asset items selected.
Vasiliou (1996) Greece Statistical cost accountingtechniques
Income before income taxes asdependent variable.
On the rates of return, the studyconcludes that high-profitbanks recorded higher returnson asset than low-profit banks.On the other hand, lower ratesof cost on liabilities wasrecorded by banks with highearnings than compared tobanks with low earnings.
Kosmidouet al. (2004)
UK Statistical cost accountingmethod
Operating profit Lower cost of liabilities wasobserved across banks withhigh profit for most sources offunding than compared tobanks with low profit. Thereturn on operating profits ofdomestic banks was observed tobe higher for loans and fixedassets while that of foreignowned banks was higher for allassets.
Pouw andKakes (2013)
28countries
Statistical cost accountingmethod
Net income after tax The highest rates of return wereobserved for private sectorlending and interbank depositswhile the highest marginalcosts were associated withinterbank and customerdeposits.
Chatterjee andDutta (2016)
India Statistical cost accountingmethod
Earnings before interest and tax(EBIT)
Low-profit banks generate higherrates of return on loans,investments and fixed assetscompared with high-profitbanks. In addition, profitabilityfor private banks was generatedby loans and placings withother banks while public banksprofitability was generated fromall assets.
OWUSU AND ALHASSAN 5

measures which are Net Income (NI) and Net InterestIncome (NII), a new income measure. The NI which isquite popular and widely used in the ALM literature isreferred to as “the broad definition of profit” in thisstudy. It represents a bank's bottom-line profit out ofwhich dividends are paid. It is computed as net operatingincome plus securities gains (losses) and extraordinarycredits (charges) less income taxes. Kwast and Rose (1982)indicated that changes in NI reflect the assumed profit-maximization behaviour of a bank. The second incomemeasure which is NII is referred to as the “narrow defini-tion of profit” for a bank and defined as the differencebetween interest income and interest expense. Giventhat, the core mandate of banks is to accept deposits andgrant loans and these two activities, by far distinguishbanks from other financial institutions, a profit measurewhich reflects these activities is the NII. NII helps toassess how effective banks have performed at their coremandate. This choice of NII as the second income mea-sure is supported by Saksonova (2014) who indicated thatthe NII is the most fitting proxy for measuring the effec-tiveness and stability of banks' core operation because itshows how effectively banks manage their interest bear-ing assets and liabilities.
3 | DATA AND EMPIRICALMETHODOLOGY
3.1 | Data
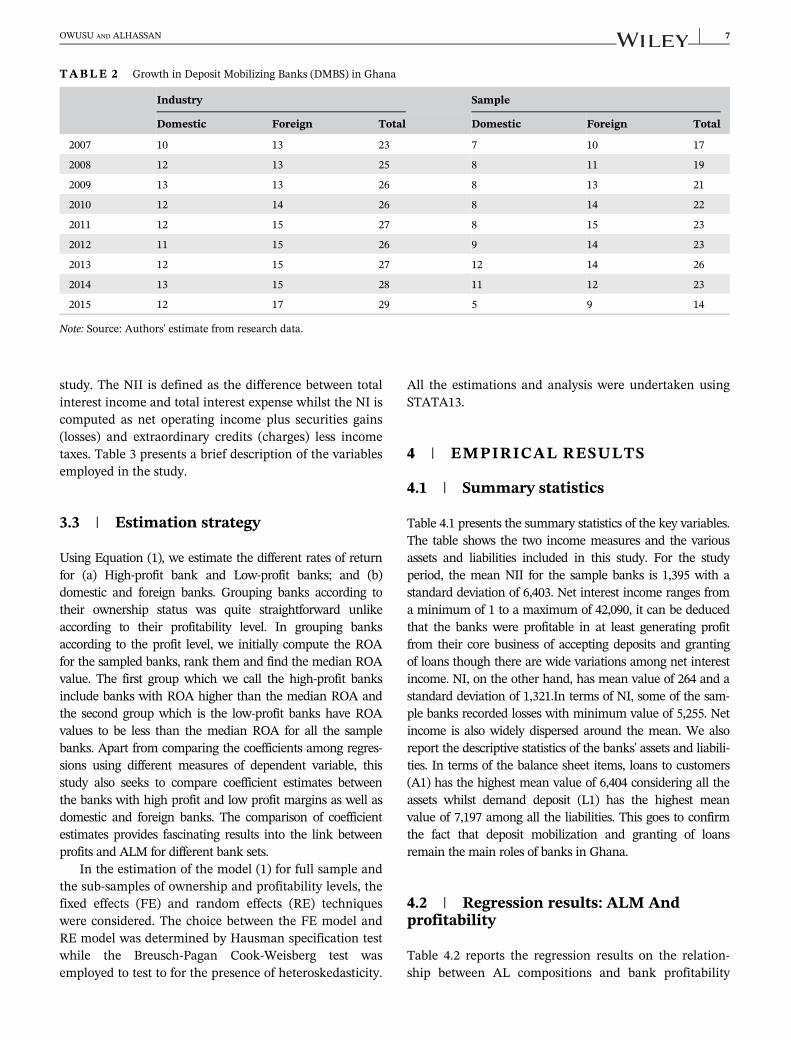
The study used a panel data of 27 banks in Ghana con-sisting of 12 domestic and 15 foreign owned banks for theperiod of 2007 to 2015. Table 2 documents the growth inthe total number of banks in the country as categorizedinto domestic and foreign banks. The Ghanaian bankingindustry has been dominated by foreign banks with anaverage of 54% of the total number of banks being foreignand 46% being domestic. This phenomenon has increasedcompetition in the industry to the advantage of cus-tomers but in terms of competition among the banks, thedomestic banks are at a disadvantage because the foreignbanks come in with advanced banking technology, hugecapital base and enjoy some intergroup benefits whichdomestic banks are not privy to.
The sample selected out of the population is illus-trated in Table 2. For most of the study periods, morethan 50% of the banks in the country were included inthe sample. Availability of data influenced the choice ofstudy periods. In selecting the study sample, banks wereincluded based on them meeting the following condi-tions. First of all, the bank should be classified as majorDeposit Mobilizing Bank (DMB) by the Central Bank of
Ghana. This study included only DMBS to avoid possiblecomparisons among the different types of depositaccepting institutions (such as rural banks, savings andloans, microfinance institutions etc.). Secondly, the banksshould have available financial statements for the studyperiods. The data on assets, liabilities and income wereobtained from the Bankscope Database whilst data onthe number of DMBs were obtained from Bank of Ghana.
3.2 | Empirical model
In order to examine the link between ALM and banks'profitability, the SCA model is used as described byHester and Zoellner (1966) and Kwast and Rose (1982).The SCA model documents the rates of return on earningassets to be positive and varied across different assetswith the rates of cost on liabilities being negative and alsovaried across liabilities (Hester & Pierce, 1975). Hencethe SCA model in year t for a bank employed in our studyis outlined below;
Ylt =α1 +X
α2i Ailt +X
α3jLjlt + elt ð1Þ
Y represents the profit of a bank (dependentvariable).
Ai is the ith asset, i=1,2,…m
Lj is the jth liability, j=1,2,…n
l represents the number of banks, l=1,2,…k
t is the time period, t = 1, 2, …, T.α 2i is the rates of return and shows the variations in
the bank's profit by replacing one unit of cash with oneunit of the ith asset and is expected to be positive (non-negative).
α 3j denotes the rate of cost of liabilities and indicatesthe changes in the bank's profit by adding one unit ofcash and one unit of jth liability and is expected to benegative (non-positive).
α 1 is a constant term indicating the existence ofincome that is unrelated to banks' portfolio structure.
e it is a stochastic (error) term accounting for sto-chastic differences among individual banks.
The explanation and definition of the above assetsand liabilities parameters are general and subject tochange when the dependent variable changes. Specifi-cally, the study uses two income measures which are NIIand NI as dependent variables for the purposes of the
6 OWUSU AND ALHASSAN
study. The NII is defined as the difference between totalinterest income and total interest expense whilst the NI iscomputed as net operating income plus securities gains(losses) and extraordinary credits (charges) less incometaxes. Table 3 presents a brief description of the variablesemployed in the study.
3.3 | Estimation strategy
Using Equation (1), we estimate the different rates of returnfor (a) High-profit bank and Low-profit banks; and (b)domestic and foreign banks. Grouping banks according totheir ownership status was quite straightforward unlikeaccording to their profitability level. In grouping banksaccording to the profit level, we initially compute the ROAfor the sampled banks, rank them and find the median ROAvalue. The first group which we call the high-profit banksinclude banks with ROA higher than the median ROA andthe second group which is the low-profit banks have ROAvalues to be less than the median ROA for all the samplebanks. Apart from comparing the coefficients among regres-sions using different measures of dependent variable, thisstudy also seeks to compare coefficient estimates betweenthe banks with high profit and low profit margins as well asdomestic and foreign banks. The comparison of coefficientestimates provides fascinating results into the link betweenprofits and ALM for different bank sets.
In the estimation of the model (1) for full sample andthe sub-samples of ownership and profitability levels, thefixed effects (FE) and random effects (RE) techniqueswere considered. The choice between the FE model andRE model was determined by Hausman specification testwhile the Breusch-Pagan Cook-Weisberg test wasemployed to test to for the presence of heteroskedasticity.
All the estimations and analysis were undertaken usingSTATA13.
4 | EMPIRICAL RESULTS
4.1 | Summary statistics
Table 4.1 presents the summary statistics of the key variables.The table shows the two income measures and the variousassets and liabilities included in this study. For the studyperiod, the mean NII for the sample banks is 1,395 with astandard deviation of 6,403. Net interest income ranges froma minimum of 1 to a maximum of 42,090, it can be deducedthat the banks were profitable in at least generating profitfrom their core business of accepting deposits and grantingof loans though there are wide variations among net interestincome. NI, on the other hand, has mean value of 264 and astandard deviation of 1,321.In terms of NI, some of the sam-ple banks recorded losses with minimum value of 5,255. Netincome is also widely dispersed around the mean. We alsoreport the descriptive statistics of the banks' assets and liabili-ties. In terms of the balance sheet items, loans to customers(A1) has the highest mean value of 6,404 considering all theassets whilst demand deposit (L1) has the highest meanvalue of 7,197 among all the liabilities. This goes to confirmthe fact that deposit mobilization and granting of loansremain the main roles of banks in Ghana.
4.2 | Regression results: ALM Andprofitability
Table 4.2 reports the regression results on the relation-ship between AL compositions and bank profitability
TABLE 2 Growth in Deposit Mobilizing Banks (DMBS) in Ghana
Industry Sample
Domestic Foreign Total Domestic Foreign Total
2007 10 13 23 7 10 17
2008 12 13 25 8 11 19
2009 13 13 26 8 13 21
2010 12 14 26 8 14 22
2011 12 15 27 8 15 23
2012 11 15 26 9 14 23
2013 12 15 27 12 14 26
2014 13 15 28 11 12 23
2015 12 17 29 5 9 14
Note: Source: Authors' estimate from research data.
OWUSU AND ALHASSAN 7

proxied by net interest income (NII) and net income (NI)for the whole sample. The diagnostics of results showthat AL composition significantly explains bank profit-ability at 1% and they account for 99.91% of variations inNII and NI. Most importantly the significance of the F-test at 5% indicates that the null hypothesis of no rela-tionship between AL variables and bank profitability (NIIand NI) is rejected to support the SCA method. Using theHausman (1978) specification test, the null hypothesis ofrandom effects was rejected at 1%, hence the fixed effectstechnique becomes the most efficient estimator of theregression model. Before proceeding with the FEM esti-mation, using the Breusch-Pagan Cook-Weisberg test, wetest for the presence of heteroscedasticity. The test resultsalso presented in Table 4.2 indicates that the null hypoth-esis of homoskedasticity cannot be rejected.
From Table 4.2, it is observed that twelve out of thethirteen coefficients in the NII model are statistically sig-nificant whilst ten out of the thirteen coefficients are sig-nificant in the NI model. The signs of estimatedcoefficients of the AL variables are generally consistentwith the expectations as outlined in Table 3. In the NImodel, all the rates of return on assets (A1 to A6) werepositive and significant whilst six rates of cost on liabili-ties negative and significant as expected. For the netincome, there seems to be a slight difference in the sensethat, five out of six rates of return on assets are positiveand significant whereas five of seven rates of cost on
liabilities are negative and significant. Notably, the coeffi-cients for assets were observed to be higher in the NIImodel compared to the NI model and this suggests thathigher returns are generated on the bank assets for theircore intermediation activities compared with the returnon the comprehensive income.
The coefficient of fixed asset (A5) has the highest rateof return on NII while cash and cash equivalents (A3)generated the highest return on NI. With respect to theliability side, saving deposit (L2) and Fixed deposits (L3)were observed to generate the lowest marginal rate ofcost among the significant variables in the NII and NImodels respectively. This confirms the notion thatdeposit remains one of the cheapest sources of funding toa bank. This result is consistent with the findings of Ber-lin and Mester (1999).
Comparing the coefficients in the NII model to the NImodel, it can be observed that the rates of return are rela-tively higher in the NII regression. This result is similarto that of Hester and Zoellner (1966) who identified thatthe coefficients in the net profit after tax regression werelower than the coefficients from the other income mea-sures. This is understandable in the sense that, unlikeNII which is arrived at by only deducting interest expenseNI is derived by deducting all expenses from total reve-nue of the banks. And as reported in Table 4.1, the meanvalue for NII is higher than that of NI. The intercepts ofboth regressions are negative and insignificant. Asexpounded earlier, the coefficients are approximate esti-mates of rates of return or costs realized by banks forholding unto various assets and liabilities including inter-est expenses for net interest income and including allexpenses for net income.
4.3 | Robustness analysis
4.3.1 | Profitability and ALM: Bankownership
Table 4.3 reports the regression results when we split thebanks' observations according to ownership status, thusdomestic banks and foreign banks. Consistent with thefull sample estimations in Table 4.2, the model diagnos-tics confirms the appropriateness of the fixed effects with-out heteroskedastic errors across both the foreign-ownedand the domestic owned-bank sample. In both sub-sam-ples, approximately 99% of the variations in profitabilityare explained by the AL composition.
In the NII model, the SCA methodology is stronglysupported by results from both domestic and foreignbanks. Twelve out of thirteen coefficients are statisticallysignificant. We find that rates of return on assets are
TABLE 3 Variables
Variables Description Expected signs
Profitability
NII Net interest income
NI Net income
Assets
A1 Loans to customers Positive (+)
A2 Loans and advances to banks Positive (+)
A3 Cash and equivalents Positive (+)
A4 Total securities Positive (+)
A5 Fixed assets Positive (+)
A6 Other assets Positive (+)
Liabilities
L1 Demand deposit/current a/c Negative (−)
L2 Savings deposits Negative (−)
L3 Fixed deposits (terms) Negative (−)
L4 Deposit from banks Negative (−)
L5 Other short-term fund Negative (−)
L6 Total long-term funding Negative (−)
L7 Other liabilities Negative (−)
8 OWUSU AND ALHASSAN

significant and positive for both domestic and foreignsamples, except for fixed assets in the domestic samplewhich is not significant. For liabilities, all the rates of costare negative and significant as expected. This finding thatprofit of foreign banks was generated by all assets is con-sistent with that of Kosmidou et al. (2004).
For all the assets with significant coefficients, the esti-mated coefficients were observed to be higher for domes-tic banks compared with foreign banks. This suggeststhat rates of return of domestic banks are higher thanthose of foreign banks. The only exception is fixed assets(A5), where foreign banks generated significantly highercoefficient compared to domestic banks (NII model). Thisfinding contradicts evidence from the UK banking systemwhere Kosmidou et al. (2004) found evidence of higherrates of return on assets for foreign banks compared todomestic banks. Among domestic banks, the coefficientsindicate that they generate higher rate of returns fromCash and equivalents (A3) and other assets (A6) in bothNII and NI Models. With respect to foreign banks, theygenerate the highest rate of return on NII from fixedassets (A5) while the highest rate of return on NI is gen-erated from other assets (A6). The lowest rate of returngenerated on NII and NI is Loans to customers (A1) fordomestic banks. For foreign banks, Cash and equivalents(A3) generate the lowest rate of return for NII whileloans and advances to banks (A2) generate the lowestreturn on NI.
These findings reveal some interesting happenings inthe Ghanaian banking sector. Domestic banks earn morereturns on their cash and equivalents, which implies hav-ing enough cash at hand, local banks are able to lendthem out on the interbank market to cash in returns atrelatively low risk. They also gain reasonable returnsfrom holding government securities such as treasury bills.But foreign banks earn high returns on fixed assets andother assets. Surprisingly, loans to customers happen toearn domestic banks the lowest returns, which explainwhy most domestic banks, in recent times, hesitate ingranting consumer loans.
On the liabilities side, the coefficients of rates of costare generally observed to be lower for foreign banks com-pared to domestic banks with few exceptions. This indi-cates that foreign banks have lower cost of fundingcompared to domestic banks. Specifically, domestic banksexperience the lowest rate of cost on savings deposit (L2)for both NII and NI models whilst demand deposit (L1)has the lowest rate of cost among foreign banks' liabilitieson NII and savings deposit (L2) on NI model. The highestcosts of funding for both domestic banks are fromdeposits from banks (L4) for NII and demand deposit(L1) for NI. The highest cost of funding for foreign bankswas other short funds (L5) for both NII and NI. The find-ings imply that, for domestic banks in Ghana, theircheapest source of funding comes from saving depositwhilst that of foreign banks is from both demand deposit
TABLE 4 . 1 Summary statistics
Variables Mean Median SD Min Max Count
NII 1,395 62 6,403 1 42,090 188
NI 264 17 1,321 −5,255 9,301 188
A1 6,404 411 34,596 0 290,993 188
A2 3,183 73 16,736 0 126,692 188
A3 1,096 91 4,897 0 42,177 188
A4 5,127 175 26,872 0 261,997 188
A5 798 19 4,728 0 55,554 188
A6 1,123 25 6,051 −11 53,729 188
L1 7,197 324 38,177 0 331,700 188
L2 443 54 1914 0 16,332 188
L3 2,383 124 15,759 0 177,876 188
L4 764 16 5,968 0 70,049 188
L5 2,403 0 19,866 0 241,773 188
L6 296 5 2,251 0 24,063 188
L7 494 32 3,059 0 38,160 188
Note: NII, net interest income; NI, net income; A1, Loans to customers; A2, Loans and advances to banks; A3, cash and equivalents; A4, totalsecurities; A5, fixed assets; A6, other assets; L1, demand deposit/current a/c; L2, savings deposits; L3, fixed deposits (terms); L4, deposit frombanks; L5, other short term fund; L6, total long term funding; L7, other liabilities. Figures are in millions of GH.
OWUSU AND ALHASSAN 9

and savings deposit. A better mobilization of funds fromthese two sources can help banks reduce drastically their
cost of funding and subsequently increase theirprofitability.
4.3.2 | Profitability and ALM: Lowversus high profitable banks
Table 4.4 shows results obtained from the regressionmodel when we divide the total of banks' observationsinto groups using profitability levels, thus banks withhigh profit margins and banks with low profit margins.Consistent with the full sample estimations in Table 4.2,the model diagnostics confirm the appropriateness of thefixed effects without heteroskedastic errors across bothHigh-profit banks and Low-profit banks. In Low-profitbanks, approximately 99% of the variations in profitabil-ity are explained by the AL composition whilst approxi-mately 96% of the variations are explained for High-profitbanks.
In the NII model, the results for High-profit banksand Low-profit banks strongly support the Statistical CostAccounting method. For both High-profit and Low-profitbanks, all the rates of return on assets are positive andstatistically significant except for fixed assets for Low-profit banks which are not significant. Comparatively,High-profit banks generate higher rates of returns on allassets compared to Low-profit banks, except loans andadvances to banks (A2), which generated significanthigher rate of return for Low-profit banks. This suggeststhat consistent with findings Vasiliou (1996), return onasset is higher for banks with high profit levels than forbanks with low profit levels. While this is inconsistentwith the findings of Kwast and Rose (1982) andKosmidou et al. (2004), the observations are consistentwith evidence by Chatterjee and Dutta (2016) in theIndian banking sector. Loans to customer (A1) are thehighest earning assets for Low-profit banks whilst otherassets (A6) earn the highest rate of returns for High-profitbanks. Cash & equivalents (A3) and loans & advances tobanks (A2) have the lowest rate of return among assetsfor Low profit and High-profit banks respectively.
With respect to the liabilities of the two classes ofbanks, negative (rates of cost) and significant coefficientsare observed except for Savings deposit (L2) and other lia-bilities (L7) for Low profit banks which were not signifi-cant. Specifically, demand deposit (L1) has the lowestrate of cost for Low-profit banks whilst long term liabili-ties (L6) have the lowest cost for High-profit banks.Highest rate of cost on liabilities are recorded on othershort-term funds (L5) for Low-profit banks and depositsfrom banks (L4) for High-profit banks. Comparing therates of cost on liabilities between the two banks, it canbe observed that, High-profit banks experienced higher
TABLE 4 . 2 Profitability and ALM
Dependent variablesNet interest income Net incomeCoef. Coef.
Constant −120.827(100.287)
−81.117(89.260)
A1 0.179***(0.031)
0.096***(0.028)
A2 0.293***(0.038)
0.143***(0.034)
A3 0.315***(0.045)
0.208***(0.040)
A4 0.261***(0.029)
0.070***(0.026)
A5 0.436***(0.093)
−0.140*(0.083)
A6 0.186***(0.048)
0.170***(0.042)
L1 −0.193***(0.040)
−0.114***(0.036)
L2 −0.092**(0.043)
0.057(0.038)
L3 −0.194***(0.038)
−0.077**(0.034)
L4 −0.145***(0.033)
−0.024(0.029)
L5 −0.316***(0.027)
−0.149***(0.024)
L6 −0.158**(0.061)
−0.124**(0.054)
L7 0.021(0.091)
0.003(0.081)
F (13,148) 12,905.58 13,238.51
Prob > F 0.000 0.000
R-squared 0.9991 0.9991
Robust Hausman χ2 2,857.996 300.196
Prob > χ2 0.000 0.000
BP-CW Hettest χ2 1.91 0.97
Prob > χ2 0.1671 0.3235
Banks 27 27
Observations 188 188
Note: A1, loans to customers; A2, loans and advances to banks; A3,cash and equivalents; A4, total securities; A5, fixed assets; A6, otherassets; L1, demand deposit/current a/c; L2, savings deposits; L3,fixed deposits (terms); L4, deposit from banks; L5, other short termfund; L6, total long term funding; L7, other liabilities: BP-C,Breusch-Pagan Cook-Weisberg test of heteroskedasticity. SEs inparentheses; ***, ** and * denotes significance at 1, 5 and 10%respectively.
10 OWUSU AND ALHASSAN

cost on demand deposit (L1), Savings deposit (L2),deposits from banks (L4) and other liabilities (L7) com-pared to Low-profit banks. On the contrary, Lower-profit
banks are observed to experience higher cost on fixeddeposits (L3), other short-term funds (L5) and long-termliabilities (L6). While similar results were reported by
TABLE 4 . 3 Profitability and ALM: bank ownership
Net interest incomeNet income
Domestic Foreign Domestic ForeignCoef. Coef. Coef. Coef.
Constant 378.721(271.677)
−494.688***(77.014)
−244.656(231.687)
−212.648***(78.035)
A1 0.387***(0.067)
0.275***(0.051)
0.267***(0.057)
0.256***(0.052)
A2 0.400***(0.071)
0.290***(0.045)
0.276***(0.060)
0.207***(0.045)
A3 0.633***(0.109)
0.246***(0.045)
0.404***(0.093)
0.211***(0.045)
A4 0.404***(0.071)
0.304***(0.047)
0.269***(0.061)
0.215***(0.048)
A5 0.238(0.171)
0.709***(0.152)
−0.189(0.145)
−0.066(0.154)
A6 0.491***(0.121)
0.354***(0.069)
0.670***(0.103)
0.337***(0.069)
L1 −0.442***(0.093)
−0.235***(0.053)
−0.416***(0.079)
−0.236***(0.054)
L2 −0.247***(0.089)
−0.258***(0.064)
−0.142*(0.076)
−0.114*(0.064)
L3 −0.332***(0.072)
−0.254***(0.057)
−0.189***(0.061)
−0.235***(0.058)
L4 −0.535***(0.110)
−0.254***(0.055)
−0.275***(0.093)
−0.201***(0.055)
L5 −0.394***(0.069)
−0.309***(0.063)
−0.189***(0.059)
−0.279***(0.064)
L6 −0.432***(0.111)
−0.261***(0.061)
−0.315***(0.094)
−0.211***(0.062)
L7 −0.387**(0.148)
−0.064(0.131)
−0.404***(0.126)
−0.210(0.132)
F (13,51) 9,868.59 6,831.75 13,590.2 750.72
Prob > F 0.0000 0.000 0.000 0.000
R-squared 0.9996 0.9991 0.9997 0.9915
Robust Hausman χ2 50.94 34.80 24.71 61.46
Prob > χ2 0.0000 0.0009 0.0252 0.0000
BP-CW Hettest χ2 2.78 0.48 1.31 0.68
Prob > χ2 0.0957 0.4896 0.2529 0.4108
Banks 12 15 12 15
Observations 76 112 76 112
Note: A1, loans to customers; A2, loans and advances to banks; A3, cash and equivalents; A4, total securities; A5, fixed assets; A6, otherassets; L1, demand deposit/current a/c; L2, savings deposits; L3, fixed deposits (terms); L4, deposit from banks; L5, other short term fund;L6, total long term funding; L7, other liabilities: BP-C, Breusch-Pagan Cook-Weisberg test of heteroskedasticity; SEs in parentheses. D-F, dif-ferences between coeffects of domestic and foreign banks; ***, ** and * denotes significance at 1, 5 and 10% respectively.
OWUSU AND ALHASSAN 11

Chatterjee and Dutta (2016), this finding contradictsVasiliou (1996) and Kosmidou et al. (2004) who reportedlower cost of funding for high-profit banks.
Table 4.4 also presents the results of the regressionwith net income (NI) as the dependent variable underLow-profit banks and High-profit banks. Contrary to the
TABLE 4 . 4 Profitability and ALM: low versus high profitable banks
Net interest income Net income
Low profit High profit Low profit High profitCoef. Coef. Coef. Coef.
Constant −220.968(507.036)
−241.803**(117.942)
588.638(388.998)
−268.283***(60.639)
A1 0.372***(0.105)
0.407***(0.062)
0.061(0.081)
0.218***(0.032)
A2 0.497***(0.130)
0.313***(0.064)
0.039(0.100)
0.218***(0.033)
A3 0.337**(0.166)
0.365***(0.068)
−0.085(0.128)
0.281***(0.035)
A4 0.375***(0.113)
0.448***(0.062)
0.048(0.087)
0.222***(0.032)
A5 0.019(0.203)
0.520**(0.223)
−0.596***(0.156)
−0.112(0.114)
A6 0.369*(0.206)
0.566***(0.091)
0.047(0.158)
0.334***(0.047)
L1 −0.324**(0.141)
−0.361***(0.069)
−0.029(0.108)
−0.221***(0.036)
L2 −0.198(0.126)
−0.381***(0.086)
0.001(0.097)
−0.208***(0.044)
L3 −0.368***(0.115)
−0.363***(0.076)
0.024(0.088)
−0.229***(0.039)
L4 −0.371***(0.131)
−0.452***(0.071)
−0.075(0.100)
−0.212***(0.036)
L5 −0.510***(0.106)
−0.442***(0.072)
−0.131(0.082)
−0.165***(0.037)
L6 −0.416***(0.117)
−0.182**(0.086)
−0.106(0.090)
−0.196***(0.044)
L7 −0.043(0.220)
−0.309*(0.161)
0.268(0.169)
−0.060(0.083)
F (13,56) 7,317.67 126.81 2028.21 121.93
Prob > F 0.000 0.000 0.0000 0.000
R-squared 0.9994 0.9666 0.9979 0.9653
Robust Hausman χ2 25.58 11.01 - 46.793
Prob > χ2 0.0194 0.6096 - 0.000
BP-CW Hettest χ2 2.36 1.01 1.27 0.90
Prob > χ2 0.1246 0.3144 0.2599 0.3439
Banks 25 24 25 24
Observations 94 94 94 94
Note: A1, loans to customers; A2, loans and advances to banks; A3, cash and equivalents; A4, total securities; A5, fixed assets; A6, otherassets; L1, demand deposit /current a/c; L2, savings deposits; L3, fixed deposits (Terms); L4, deposit from banks; L5, other short term fund;L6, total long term funding; L7, other liabilities: BP-C, Breusch-Pagan Cook-Weisberg test of heteroskedasticity; SEs in parentheses. H-L, dif-ferences between coeffects of High profit and Low profit banks. ***, ** and * denotes significance at 1, 5 and 10% respectively.
12 OWUSU AND ALHASSAN
NII model results, all the coefficients of the asset compo-sitions for Low-profit banks are insignificant except forfixed assets (A5) which has a negative sign and is signifi-cant at 1%. All the assets of High-profit banks have posi-tive coefficients and are significant except for fixed asset(A5) which is negative and insignificant. Among theassets of the high profit banks, other assets (A6) have thehighest rate of return whilst loans to customers and loansand advance to banks have the lowest rates of return.None of the coefficients of the liabilities for Low-profitbanks is significant but for the High-profit banks, all thecoefficients are negative and significant with the excep-tion of other liabilities (L7). In terms of cost of funding,other liabilities (L5) had the lowest cost and fixeddeposits (L3) have the highest cost for high profit banks.
5 | CONCLUSION
In this study, we employed Statistical Cost Accountingmodel to investigate the link between asset-liability com-positions and profitability of banks in Ghana from 2007to 2015. Using six categories of assets and seven catego-ries of bank liabilities, the paper tested the effect of ALMon bank profitability measures by net interest incomeand net income. It further examined the differences inALM-profitability relationship across different categoriesaccording to ownership status (Domestic and Foreignbanks) and profit levels (High-profit banks and Low-profit banks).
Overall, the central hypothesis of the statistical costaccounting model is confirmed by this paper since wefound most of the estimated rates of return on assets (lia-bilities) to be positive (negative) and vary across assets(liabilities). There is also evidence that profitability islinked to balance sheet items since most of the asset andliability compositions were statistically significant whenregressed on the two income measures. This implies thatproper asset-liability management has direct impact onthe overall performance of banks. In examining the dif-ference between domestic banks and foreign banks, thisstudy found that domestic banks have higher rate ofreturn on assets than foreign banks over the study period.The domestic banks equally recorded higher rate of coston liabilities than foreign banks. Cash and equivalentand other assets are among the high earning assets ofdomestic banks whilst fixed assets and other assets arethe high earning assets for foreign banks. Saving depositsare the cheapest source of funding for domestic bankswhilst demand deposits are for foreign banks.
With respect to bank profit levels, this paper con-cludes that High-profit banks generate higher rate ofreturn on assets compared to Low-profit. Demand
deposits are the cheapest cost of funding for Low-profitbanks whilst long term liabilities and other short ternfunds are the cheapest for High-profit banks.
The findings have the following implications for bankmanagement and regulators in Ghana and other emerg-ing markets. First, for bank manager, this study informsthem different assets and liabilities contribute differentlyto profitability of their banks and for that matter there isneed to identify assets with higher returns and liabilitieswith lower cost in order to increase their profitability.Efficient management of these assets and liabilities willhelp banks to maximize profit and create value for share-holders. And for policymakers, the study has revealedthat the rate of return on loans to customers are very lowwhich implies if banks decide to cut down their lendingto household and business, this will affect credit creationin the economy which can stifle economy growth. Thereis, therefore, the need for policies to stimulate credit tothe private sector and also to boost returns from theseloan assets. In addition, the study highlights that policieson ALM can have dire consequence on profitability ofbanks in the country so thorough review of policiesshould be made before they are rolled out.
For future studies, we recommend the inclusion ofother variables as in the case of Kwast and Rose (1982)and since this study was limited to only major DepositMobilizing Banks (DBMs), future studies can considerthe other banks and deposit accepting institutions (likerural bank, saving and loans and microfinance institu-tions) which were excluded from this study.
ACKNOWLEDGEMENTSThe authors acknowledge the assistance of EmmanuelJoel Aikins Abakah, University of Adelaide BusinessSchool for proofreading and reviewing the final draft ofthe paper. All caveats apply.
DATA AVAILABILITY STATEMENTData available on request from the authors: The data thatsupport the findings of this study are available from thecorresponding author upon reasonable request.
ORCIDFreeman Brobbey Owusu https://orcid.org/0000-0002-6633-4922
REFERENCESAboagye, A. Q. Q., Akoena, S. K., Antwi-Asare, T. O., &
Gockel, F. A. (2008). Explaining interest rate spreads in Ghana.African Development Review, 20(3), 378–399.
Acheampong, N. K. (2013). The effects of foreign Bank entry onfinancial performance of domestic-owned banks in Ghana(2013). The International Journal of Business and Finance
OWUSU AND ALHASSAN 13
Research, 7(3), 93–104 Retrieved from SRN https://ssrn.com/abstract=2149814
Adei, S. (2006). Governance, state-ownership and divestiture: TheGhanaian experience. African Journal of Public Administrationand Administration, 17(2), 11–28.
Alhassan, A. L., Kyereboah-Coleman, A., & Andoh, C. (2014). Assetquality in a crisis period: An empirical examination of Ghana-ian banks. Review of Development Finance, 4(1), 50–62.
Alhassan, A. L., Tetteh, M. L., & Owusu, F. B. (2016). Marketpower, efficiency and bank profitability: Evidence from Ghana.Economic Change and Restructuring, 49(1), 71–93.
Allen, F., Otchere, I., & Senbet, L. W. (2011). African financial sys-tems: A review. Review of Development Finance, 1(2011),79–113.
Antwi-Asare, T. O., & Addison, E. K. Y. (2000). Financial SectorReforms and bank Performance in Ghana. London, England:Overseas Development Institute.
Aryeetey, E., Hettige, H., Nissanke, M., & Steel, W. (1997). Finan-cial markets fragmentation and reforms in Ghana, Malawi,Nigeria and Tanzania. World Bank Economic Review, 11(2), 95–218. https://doi.org/10.1093/wber/11.2.195
Asiri, B. K. (2007). Assets-liabilities management in bank - a case ofKuwait. Indian Journal of Economics and Business, 6(1),103–115.
Ayadi, R., Arbak, E., Naceur, S. B., & De Groen, W. P. (2015).Financial Development, Bank Efficiency, and EconomicGrowth across the Mediterranean. In Ayadi, R., Dabrowski, M.,& De Wulf, L. (eds), Economic and Social Development of theSouthern and Eastern Mediterranean Countries (pp. 219–233).Cham: Springer.
Bank of Ghana (2009). Annual report. Retrieved from https://www.bog.gov.gh/wp-content/uploads/2019/07/AnnRep-2009.pdf
Bank of Ghana (2012). Annual report. Retrieved from https://www.bog.gov.gh/wp-content/uploads/2019/07/AnnRep-2012.pdf
Bank of Ghana (2013). Annual report. Retrieved from https://www.bog.gov.gh/wp-content/uploads/2019/07/AnnRep-2013.pdf
Bank of Ghana (2015). Annual report. Retrieved from https://www.bog.gov.gh/wp-content/uploads/2019/07/AnnRep-2015.pdf
Bank of Ghana (2016). Annual report. Retrieved from https://www.bog.gov.gh/wp-content/uploads/2019/07/AnnRep-2016.pdf
Bank of Ghana (2017). Annual report. Retrieved from https://www.bog.gov.gh/wp-content/uploads/2019/07/AnnRep-2017.pdf
Bank of Ghana (2017). Press release: GCB bank takes over UT bankand Capital bank. Retrieved from http://www.annualreportsghana.com/Home/Documents/GSE-Filings/2017/BOG_FAQ.aspx.
Bank of Ghana (2018). Press release: Government establishes newindigenous bank. Retrieved from https://www.bog.gov.gh/wp-content/uploads/2019/07/PRESS-RELEASE-Grand-Final-August-2018.pdf.
Beck, T., Demirgüç-Kunt, A., & Levine, R. (2006). Bank concentra-tion, competition, and crises: First results. Journal of Banking &Finance, 30(5), 1581–1603.
Berlin, M., & Mester, L. J. (1999). Deposits and relationship lending.The Review of Financial Studies, Fall, 12(3), 579–607.
Boadi, I., Leo Paul Dana, L. P., Mertens, G., & Mensah, L. (2017).SMEs' financing and banks' profitability: A “good date” forbanks in Ghana. Journal of African Business, 18(2), 257–277.
Boldrin, M., & Levine, D. K. (2009). Market size and intellectualproperty protection. International Economic Review, 50(3),855–881.
Brick, J. R. (2014). Asset-liability management: Theory, practice,implementation, and the role of judgment, EE.UU, Madison, WI:. Filene Research Institute.
Caprio, G. J., & Klingebiel, D. (1996). Bank insolvencies: Cross-coun-try experience. Policy research working paper, no. 1620. Washing-ton, DC: World Bank.
Chatterjee, C., & Dutta, P. (2016). Exploring the linkage betweenprofits and asset–liability management. Paradigm, 20(2), 131–142. https://doi.org/10.1177/0971890716670707
Das, U.S., Lu, Y, Papaioannou, M.G., & Petrova, I. (2012). Sovereignrisk and asset and liability management – Conceptual issues.IMF Working Paper No. WP/12/241 .Washington, D.C.: IMF.
Daumont, R., Le Gall, F., & Leroux, F., (2004). Banking in Sub-Saharan Africa: What Went Wrong? IMF working paper, 04/55.Retrieved from www.imf.org/external/pubs/ft/wp/2004/wp0455.pdf.
Demirgüç-Kunt, A., & Levine, R. (2008). Finance, financial sectorpolicies, and long-run growth. (World Bank Policy ResearchPaper 4469). Washington, DC: World Bank Retrieved Septem-ber 23, 2011, from http://papers.ssrn.com/
Fama, E. F. (1980). Banking in the theory of finance. Journal ofMonetary Economics, 6, 39–57.
Giokas, D., & Vassiloglou, M. (1991). A goal programming modelfor bank assets and liabilities management. European Journalof Operational Research, 50(1), 48–60.
Goodhart, C. (Ed.). (2004). Financial development and economicgrowth: Explaining the links, London: . Palgrave Macmillan.
Gu¨ven, S., & Persentili, E. (1997). A linear programming model forbank balance-sheet management. Omega, 25(4), 449–459.
Gup, B. E., & Brooks, R. (1993). Interest rate risk management. BurrRidge, IL: Irwin Professional Publishing.
Haslem, J. A., Scheraga, C. A., & Bedingfield, J. P. (1999). DEA effi-ciency profiles of U.S. banks operating internationally. Interna-tional Review of Economics & Finance, 8(2), 165–182.
Hausman, J. A. (1978). Specification tests in econometrics. Eco-nometrica: Journal of the Econometric Society, 1251–1271.
Hester, D. D., & Pierce, J. L. (1975). Bank management and portfoliobehavior. New Haven, CT: Yale University Press.
Hester, D. D., & Zoellner, J. F. (1966). The relation between bankportfolios and earnings: An econometric analysis. Review ofEconomics and Statistics, 48, 372–386.
Isshaq, Z., Bokpin, G. A., & Amoah, B. (2012). K. Menyah & J. AborEfficiency and Risk-Taking Behaviour of Ghanaian Banks.Finance and Development in Africa (Research in Accounting inEmerging Economies, Vol. 12 Part B) (pp. 53–74). Bingley: Emer-ald Group Publishing Limited.
Kapur, I., Hadjimichael, M. T., Hilber, P., & Szymczak, P. (1991).Ghana: Adjustment and growth, 1983–1991. IMF occasionalpaper, no 86. Washington, DC.International Monetary Fund.
Korhonen, A. (1987). A dynamic bank portfolio planning modelwith multiple scenarios, multiple goals and changing priorities.European Journal of Operational Research, 30, 13–23.
Kosmidou, K., Pasiouras, F., & Floropoulos, J. (2004). Linking profitsto asset liability management of domestic and foreign banks inthe UK. Applied Financial Economics, 14(18), 1319–1324.
14 OWUSU AND ALHASSAN
Kwast, M. L., & Rose, J. T. (1982). Pricing, operating, efficiency,and profitability among large commercial banks. Journal ofBanking and Finance, 6, 233–254.
Morris, G., & Turner, P. (1996). Banking crises in emerging econo-mies: Origins and policy options. BIS Economic Paper. No. 46.Basel, Switzerland: Bank for International Settlements.
Og˘uzsoy, C. B., & Gu¨ven, S. (1997). Bank asset-liability manage-ment under uncertainty. European Journal of OperationalResearch, 102, 575–600.
Pouw, L., & Kakes, J. (2013). What drives bank earnings? Evidencefor 28 banking sectors. Applied Economics Letters, 20(11), 1062–1066.
PwC (2018). 2018 Ghana Banking Survey, Accra: PWC.. Retrievedfrom https://www.pwc.com/gh/en/assets/pdf/2018-gh-banking-survey.pdf
PwC (2019). 2019 Ghana Banking Survey. Banking reforms so far:Topmost issues on the minds of bank CEOs. Accra: PWC.Retrieved from https://www.pwc.com/gh/en/assets/pdf/ghana-banking-survey-2019.pdf
Saksonova, S. (2014). The role of net interest margin in improvingbanks' asset structure and assessing the stability and efficiency
of their operations. Procedia – Social and Behavioral Sciences,150, 132–141.
Sayeed, M. A., Edirisuriya, P., & Haque, M. (2012). Bank profitabil-ity: The case of Bangladesh. International Review of BusinessResearch Papers, 8(4), 157–176.
Tektas, A., Nur Ozkan-Gunay, E., & Gunay, G. (2005). Asset andliability management in financial crisis. The Journal of RiskFinance, 6(2), 135–149.
Vasiliou, D. (1996). Linking profits to Greek bank production man-agement. International Journal of Production Economics, 43,67–73.
How to cite this article: Owusu FB,Alhassan AL. Asset-Liability Management andbank profitability: Statistical cost accountinganalysis from an emerging market. Int J Fin Econ.2020;1–15. https://doi.org/10.1002/ijfe.1860
OWUSU AND ALHASSAN 15
Related Documents