School Board Report Dufferin-Peel Catholic DSB (67083) Results as of September 6, 2018 1 of 41 School Board Report Assessments of Reading, Writing and Mathematics Primary Division (Grades 1–3) and Junior Division (Grades 4–6), 2017–2018 Board: Dufferin-Peel Catholic DSB (67083) WHERE TO FIND… PAGE Grade 3 Grade 6 Percentages of all students at or above the provincial standard: 2017–2018 ……….…………………………………………………. 1 1 Over time …………………………………………………………... 2 3 Tips for using this report ……………………………………….……… 4 4 Contextual information: 2017–2018 ………………………………….. 5 9 Results for groups of students: 2017–2018 All students ….……….……………………………………………. 6 10 Participating students …………………………………………… 7 11 Students by gender ………………………………………………. 8 12 Contextual information: Over time …………………………………… 13 17 Results for all students: Over time …………………………………... 14 18 Results for all students: Over time by gender ……………………... 21 22 Student questionnaire results ………………………………………… 23 32 Explanation of terms ……………………………………………………. 41 41 PERCENTAGE OF ALL STUDENTS AT OR ABOVE THE PROVINCIAL STANDARD (LEVELS 3 AND 4), 2017–2018 Grade 3 Grade 6 On behalf of EQAO, I am pleased to present the results of the 2017–2018 Assessments of Reading, Writing and Mathematics for the primary (Grades 1–3) and junior (Grades 4–6) divisions. This report includes results from 2017–2018 as well as from previous years, so you can track progress over time. You will additionally find demographic and attitudinal information, which provides context for interpreting achievement results. By assessing each student in relation to the learning expectations outlined in The Ontario Curriculum, EQAO is able to offer objective data at the individual, school, board and provincial levels to support the professional practice of the education community. Using EQAO’s independent data, in addition to classroom and board information, helps the education community consider the focus for collaborative inquiries and to make evidence-informed decisions when developing and monitoring plans that foster equitable and inclusive learning environments. Achievement, contextual, attitudinal and behavioural data all offer valuable insights into student learning and support educators as they continue to meet the needs of every student. We look forward to continuing our work with you in support of the children and youth of Ontario, so that all students are positioned for success in their futures, regardless of background or circumstances. Kind Regards, Norah Marsh Chief Executive Officer Education Quality and Accountability Office Board Province

Welcome message from author
This document is posted to help you gain knowledge. Please leave a comment to let me know what you think about it! Share it to your friends and learn new things together.
Transcript
School Board Report Dufferin-Peel Catholic DSB (67083)
Results as of September 6, 2018 1 of 41
School BoardReport
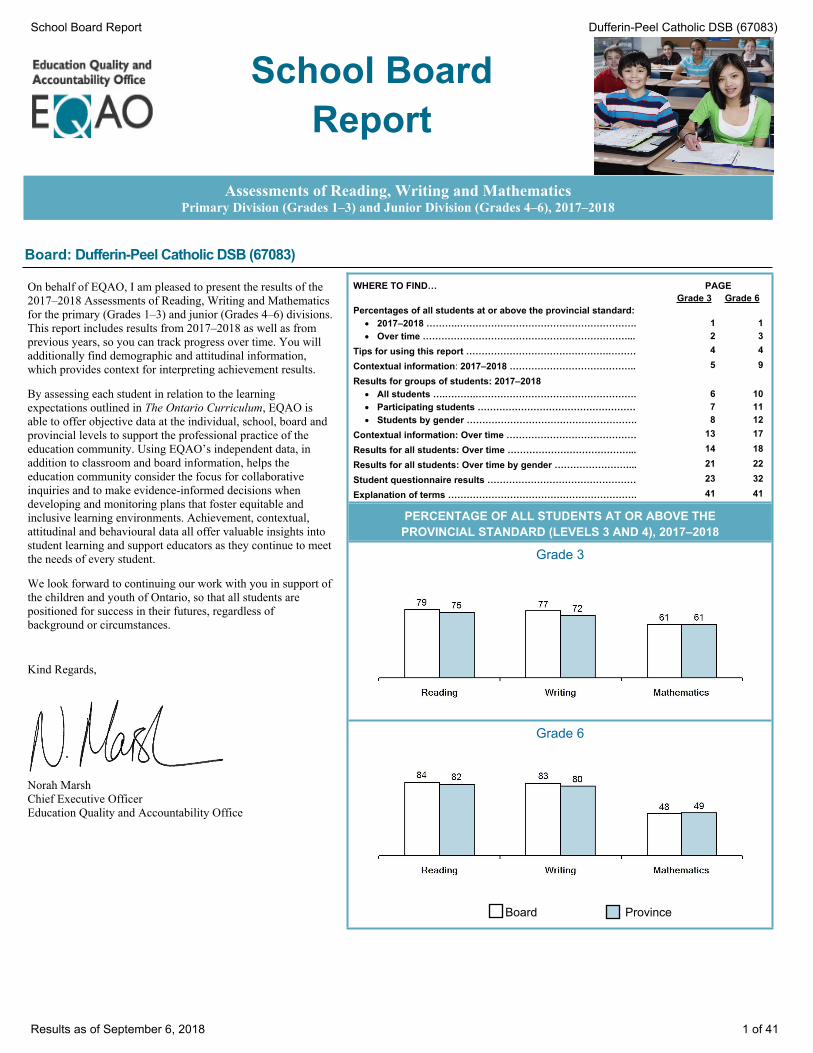
Assessments of Reading, Writing and MathematicsPrimary Division (Grades 1–3) and Junior Division (Grades 4–6), 2017–2018
Board: Dufferin-Peel Catholic DSB (67083)
WHERE TO FIND… PAGEGrade 3 Grade 6
Percentages of all students at or above the provincial standard: 2017–2018 ……….…………………………………………………. 1 1 Over time …………………………………………………………... 2 3
Tips for using this report ……………………………………….……… 4 4Contextual information: 2017–2018 ………………………………….. 5 9Results for groups of students: 2017–2018
All students ….……….……………………………………………. 6 10 Participating students …………………………………………… 7 11 Students by gender ………………………………………………. 8 12
Contextual information: Over time …………………………………… 13 17Results for all students: Over time …………………………………... 14 18Results for all students: Over time by gender ……………………... 21 22Student questionnaire results ………………………………………… 23 32Explanation of terms ……………………………………………………. 41 41
PERCENTAGE OF ALL STUDENTS AT OR ABOVE THEPROVINCIAL STANDARD (LEVELS 3 AND 4), 2017–2018
Grade 3
Grade 6
On behalf of EQAO, I am pleased to present the results of the 2017–2018 Assessments of Reading, Writing and Mathematics for the primary (Grades 1–3) and junior (Grades 4–6) divisions. This report includes results from 2017–2018 as well as from previous years, so you can track progress over time. You will additionally find demographic and attitudinal information, which provides context for interpreting achievement results.
By assessing each student in relation to the learning expectations outlined in The Ontario Curriculum, EQAO is able to offer objective data at the individual, school, board and provincial levels to support the professional practice of the education community. Using EQAO’s independent data, in addition to classroom and board information, helps the education community consider the focus for collaborative inquiries and to make evidence-informed decisions when developing and monitoring plans that foster equitable and inclusive learning environments. Achievement, contextual, attitudinal and behavioural data all offer valuable insights into student learning and support educators as they continue to meet the needs of every student.
We look forward to continuing our work with you in support of the children and youth of Ontario, so that all students are positioned for success in their futures, regardless of background or circumstances.
Kind Regards,
Norah MarshChief Executive OfficerEducation Quality and Accountability Office
Board Province
School Board Report Dufferin-Peel Catholic DSB (67083)
Results as of September 6, 2018 2 of 41
2017–2018
Assessments of Reading, Writing and Mathematics, 2017–2018
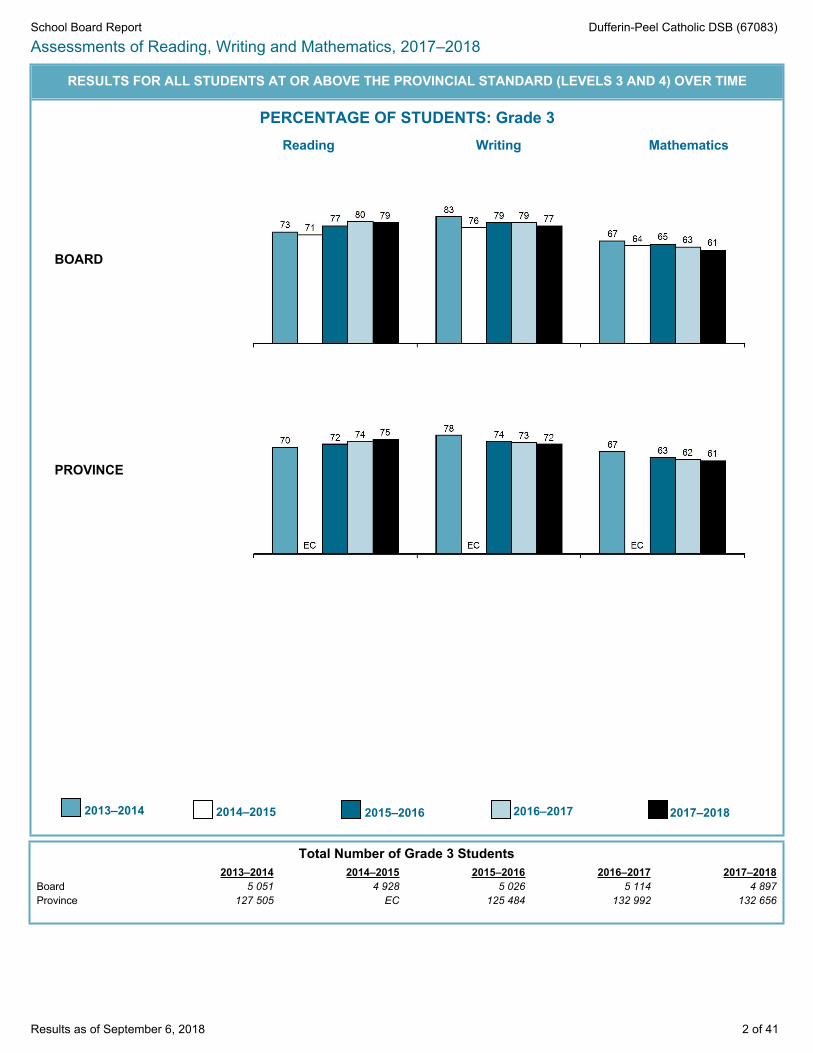
RESULTS FOR ALL STUDENTS AT OR ABOVE THE PROVINCIAL STANDARD (LEVELS 3 AND 4) OVER TIME
PERCENTAGE OF STUDENTS: Grade 3Reading Writing Mathematics
BOARD
PROVINCE
Total Number of Grade 3 Students2013–2014 2014–2015 2015–2016 2016–2017 2017–2018
Board 5 051 4 928 5 026 5 114 4 897Province 127 505 EC 125 484 132 992 132 656
2013–2014 2014–2015 2015–2016 2016–2017
School Board Report Dufferin-Peel Catholic DSB (67083)
Results as of September 6, 2018 3 of 41
2017–2018
Assessments of Reading, Writing and Mathematics, 2017–2018
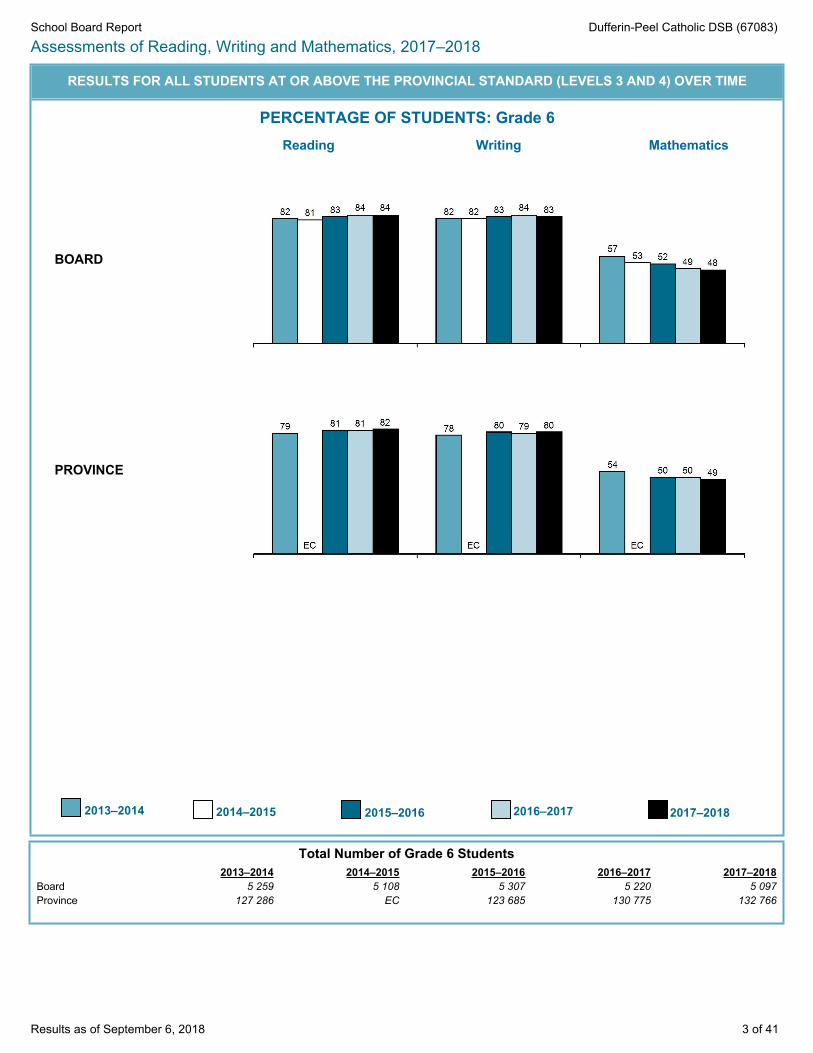
RESULTS FOR ALL STUDENTS AT OR ABOVE THE PROVINCIAL STANDARD (LEVELS 3 AND 4) OVER TIME
PERCENTAGE OF STUDENTS: Grade 6Reading Writing Mathematics
BOARD
PROVINCE
Total Number of Grade 6 Students2013–2014 2014–2015 2015–2016 2016–2017 2017–2018
Board 5 259 5 108 5 307 5 220 5 097Province 127 286 EC 123 685 130 775 132 766
2013–2014 2014–2015 2015–2016 2016–2017

School Board Report Dufferin-Peel Catholic DSB (67083)
Results as of September 6, 2018 4 of 41
Assessments of Reading, Writing and Mathematics, 2017–2018
TIPS
Each school or board is unique. To appreciate the distinctive character of a school or board, look at the contextual information to understand the features and characteristics of the community it serves.
Every assessment captures the performance of students at one point in time each year. Consider the results along with other information about students’ achievement in reading, writing and mathematics.
Exercise caution wheninterpreting results for small schools or boards. Resultsmay vary considerably fromyear to year, and differences may look exaggerated. Forexample, in a school of 20students, a difference of10% represents only two students.
Trends may be difficult toidentify or to interpret. This isespecially true in smallschools or boards, or inschools where there is ahigh turnover in the student population.
EQAO values students' privacy. Results are not reported publicly for schools or boards where fewer than 10 students participated because it might be possible to identify individual students.
ABOUT THIS SCHOOL OR BOARD REPORT
This report shows how well students have met curriculum expectations to the end of the Primary Division and the end of the Junior Division. Students complete a set of test booklets that allow them to show what they have learned in reading, writing and mathematics. The assessments are based on The Ontario Curriculum.
This report includes results for this year; a comparison of results of the current and previous administrations to aid in
monitoring improvement; information about the characteristics of the students who participated; summary graphs showing the percentage of students achieving the provincial
standard in reading, writing and mathematics; detailed tables and graphs showing results for all levels of achievement, results
by gender and participation information; student questionnaire results; and an explanation of all terms used in this report.
HOW TO USE THIS REPORT Examine the contextual information to understand the similarities and
differences between the school, the board and the province; the board and the province. Consider the challenges that any differences might present.
Examine the results for reading, writing and mathematics.• Are these results consistent with what you would expect?• How do the school results compare to the board and the province; the board
results compare to the province?• How do these results compare over time?• What influence might students' attitudes have on student performance (refer to
the questionnaire results)?
Speak to school or board staff about the goals for school improvement related to reading, writing and mathematics.
The Education Quality and Accountability Office is an independent agency that gathers information about student achievement through province-wide assessments. Each year, all Grade 3 and Grade 6 students across Ontario take part in these assessments of reading, writing and mathematics. Individual results are reported to students and to parents and guardians. School, board and provincial results are released publicly.
Learn more about us at www.eqao.com.
School Board Report Dufferin-Peel Catholic DSB (67083)
Results as of September 6, 2018 5 of 41
Assessments of Reading, Writing and Mathematics, 2017–2018
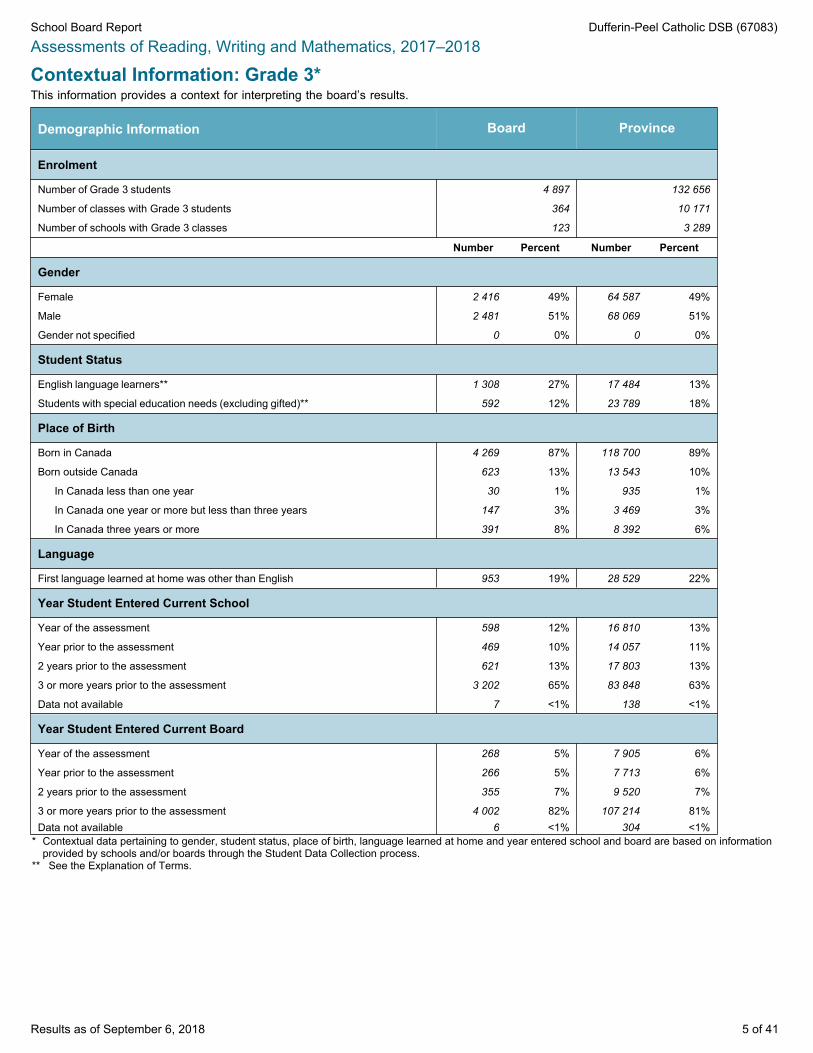
Contextual Information: Grade 3*This information provides a context for interpreting the board’s results.
Demographic Information Board Province
Enrolment
Number of Grade 3 students 4 897 132 656
Number of classes with Grade 3 students 364 10 171
Number of schools with Grade 3 classes 123 3 289
Number Percent Number Percent
Gender
Female 2 416 49% 64 587 49%
Male 2 481 51% 68 069 51%
Gender not specified 0 0% 0 0%
Student Status
English language learners** 1 308 27% 17 484 13%
Students with special education needs (excluding gifted)** 592 12% 23 789 18%
Place of Birth
Born in Canada 4 269 87% 118 700 89%
Born outside Canada 623 13% 13 543 10%
In Canada less than one year 30 1% 935 1%
In Canada one year or more but less than three years 147 3% 3 469 3%
In Canada three years or more 391 8% 8 392 6%
Language
First language learned at home was other than English 953 19% 28 529 22%
Year Student Entered Current School
Year of the assessment 598 12% 16 810 13%
Year prior to the assessment 469 10% 14 057 11%
2 years prior to the assessment 621 13% 17 803 13%
3 or more years prior to the assessment 3 202 65% 83 848 63%
Data not available 7 <1% 138 <1%
Year Student Entered Current Board
Year of the assessment 268 5% 7 905 6%
Year prior to the assessment 266 5% 7 713 6%
2 years prior to the assessment 355 7% 9 520 7%
3 or more years prior to the assessment 4 002 82% 107 214 81%Data not available 6 <1% 304 <1%
* Contextual data pertaining to gender, student status, place of birth, language learned at home and year entered school and board are based on information provided by schools and/or boards through the Student Data Collection process.
** See the Explanation of Terms.
School Board Report Dufferin-Peel Catholic DSB (67083)
Results as of September 6, 2018 6 of 41
Assessments of Reading, Writing and Mathematics, 2017–2018
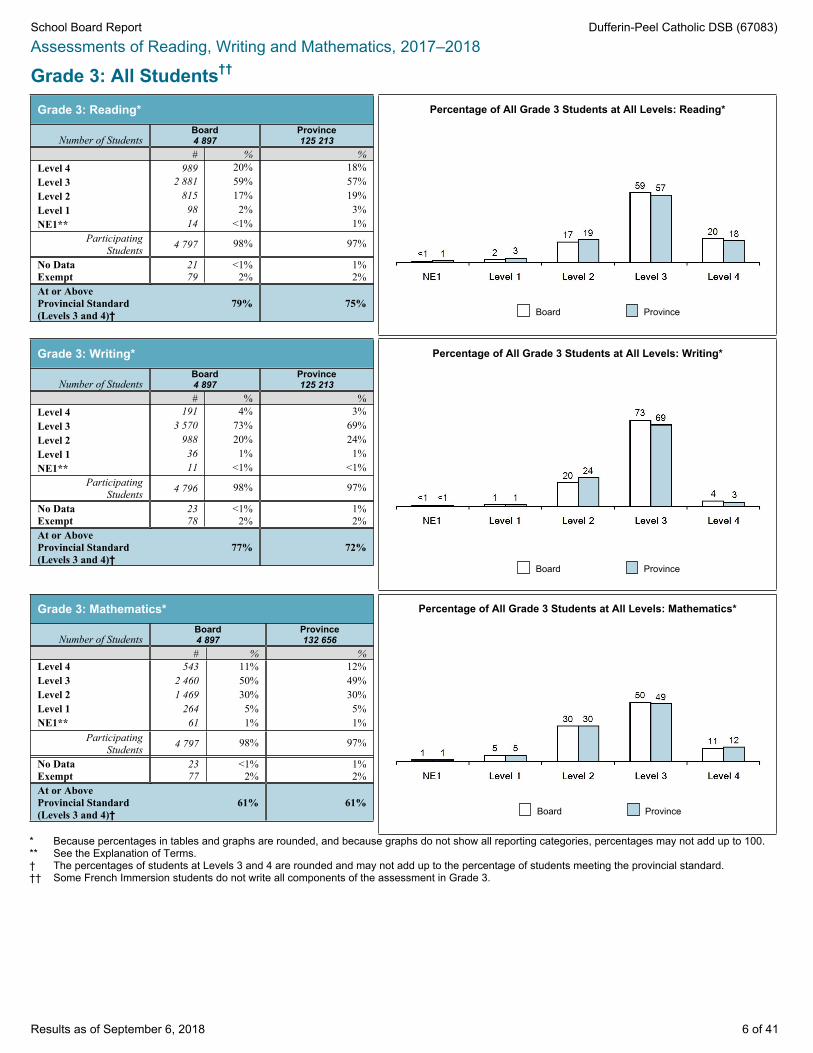
Grade 3: All Students††
Grade 3: Reading*
Number of StudentsBoard4 897
Province125 213
# % %Level 4 989 20% 18%Level 3 2 881 59% 57%Level 2 815 17% 19%Level 1 98 2% 3%NE1** 14 <1% 1%
ParticipatingStudents 4 797 98% 97%
No Data 21 <1% 1%Exempt 79 2% 2%At or Above Provincial Standard(Levels 3 and 4)†
79% 75%
Percentage of All Grade 3 Students at All Levels: Reading*
Board Province
Grade 3: Writing*
Number of StudentsBoard4 897
Province125 213
# % %Level 4 191 4% 3%Level 3 3 570 73% 69%Level 2 988 20% 24%Level 1 36 1% 1%NE1** 11 <1% <1%
ParticipatingStudents 4 796 98% 97%
No Data 23 <1% 1%Exempt 78 2% 2%At or Above Provincial Standard(Levels 3 and 4)†
77% 72%
Percentage of All Grade 3 Students at All Levels: Writing*
Board Province
Grade 3: Mathematics*
Number of StudentsBoard4 897
Province132 656
# % %Level 4 543 11% 12%Level 3 2 460 50% 49%Level 2 1 469 30% 30%Level 1 264 5% 5%NE1** 61 1% 1%
ParticipatingStudents 4 797 98% 97%
No Data 23 <1% 1%Exempt 77 2% 2%At or Above Provincial Standard(Levels 3 and 4)†
61% 61%
Percentage of All Grade 3 Students at All Levels: Mathematics*
Board Province
* Because percentages in tables and graphs are rounded, and because graphs do not show all reporting categories, percentages may not add up to 100.** See the Explanation of Terms.† The percentages of students at Levels 3 and 4 are rounded and may not add up to the percentage of students meeting the provincial standard.†† Some French Immersion students do not write all components of the assessment in Grade 3.

School Board Report Dufferin-Peel Catholic DSB (67083)
Results as of September 6, 2018 7 of 41
Assessments of Reading, Writing and Mathematics, 2017–2018Grade 3: Participating Students (excludes “no data” and “exempt” categories)
Grade 3: Reading*
Number of StudentsBoard4 797
Province121 227
# % %Level 4 989 21% 19%
Level 3 2 881 60% 59%
Level 2 815 17% 19%
Level 1 98 2% 3%
NE1** 14 <1% 1%
At or Above Provincial Standard(Levels 3 and 4)†
81% 77%
Percentage of Participating Grade 3 Students at All Levels: Reading*
Board Province
;
Grade 3: Writing*
Number of StudentsBoard4 796
Province121 344
# % %Level 4 191 4% 3%
Level 3 3 570 74% 71%
Level 2 988 21% 24%
Level 1 36 1% 1%
NE1** 11 <1% <1%
At or Above Provincial Standard(Levels 3 and 4)†
78% 74%
Percentage of Participating Grade 3 Students at All Levels: Writing*
Board Province
Grade 3: Mathematics*
Number of StudentsBoard4 797
Province128 792
# % %Level 4 543 11% 12%
Level 3 2 460 51% 50%
Level 2 1 469 31% 31%
Level 1 264 6% 6%
NE1** 61 1% 1%
At or Above Provincial Standard(Levels 3 and 4)†
63% 62%
Percentage of Participating Grade 3 Students at All Levels: Mathematics*
Board Province
* Because percentages in tables and graphs are rounded, percentages may not add up to 100.** See the Explanation of Terms.† The percentages of students at Levels 3 and 4 are rounded and may not add up to the percentage of students meeting the provincial standard.

School Board Report Dufferin-Peel Catholic DSB (67083)
Results as of September 6, 2018 8 of 41
Assessments of Reading, Writing and Mathematics, 2017–2018Grade 3: Gender††
Grade 3: Board*
Reading Writing Mathematics
Number of StudentsFemale2 416
Male2 481
Female2 416
Male2 481
Female2 416
Male2 481
Level 4 25% 16% 6% 2% 10% 12%Level 3 59% 59% 77% 69% 51% 50%Level 2 13% 20% 15% 25% 32% 28%Level 1 1% 3% 1% 1% 5% 6%NE1** <1% 1% <1% <1% 1% 1%
ParticipatingStudents 99% 97% 99% 97% 99% 97%
No Data <1% <1% <1% 1% <1% <1%Exempt 1% 2% 1% 2% 1% 2%At or Above Provincial Standard(Levels 3 and 4)†
84% 75% 83% 71% 60% 62%
Percentage of All Grade 3 StudentsAt or Above Provincial Standard: Board†
Female Male
Grade 3: Province*
Reading Writing Mathematics
Number of StudentsFemale60 493
Male64 720
Female60 493
Male64 720
Female64 587
Male68 069
Level 4 22% 14% 4% 2% 11% 13%Level 3 57% 57% 73% 65% 49% 49%Level 2 16% 21% 19% 28% 31% 29%Level 1 2% 3% 1% 1% 5% 5%NE1** <1% 1% <1% <1% 1% 1%
ParticipatingStudents 98% 96% 98% 96% 98% 97%
No Data 1% 1% 1% 1% 1% 1%Exempt 2% 3% 2% 3% 2% 3%At or Above Provincial Standard(Levels 3 and 4)†
79% 71% 78% 67% 60% 61%
Percentage of All Grade 3 StudentsAt or Above Provincial Standard: Province†
Female Male
* Because percentages in tables are rounded, percentages may not add up to 100.** See the Explanation of Terms.† The percentages of students at Levels 3 and 4 are rounded and may not add up to the percentage of students meeting the provincial standard.†† Results include only students for whom gender data were available.

School Board Report Dufferin-Peel Catholic DSB (67083)
Results as of September 6, 2018 9 of 41
Assessments of Reading, Writing and Mathematics, 2017–2018Contextual Information: Grade 6*This information provides a context for interpreting the board’s results.
Demographic Information Board Province
Enrolment
Number of Grade 6 students 5 097 132 766
Number of classes with Grade 6 students 399 8 644
Number of schools with Grade 6 classes 123 3 122
Number Percent Number Percent
Gender
Female 2 443 48% 64 627 49%
Male 2 654 52% 68 138 51%
Gender not specified 0 0% 1 <1%
Student Status
English language learners** 977 19% 14 532 11%
Students with special education needs (excluding gifted)** 806 16% 28 757 22%
Place of Birth
Born in Canada 4 266 84% 116 090 87%
Born outside Canada 827 16% 16 461 12%
In Canada less than one year 21 <1% 822 1%
In Canada one year or more but less than three years 129 3% 3 099 2%
In Canada three years or more 616 12% 11 860 9%
Language
First language learned at home was other than English 1 155 23% 30 206 23%
Year Student Entered Current School
Year of the assessment 543 11% 27 626 21%
Year prior to the assessment 802 16% 12 265 9%
2 years prior to the assessment 322 6% 11 687 9%
3 or more years prior to the assessment 3 427 67% 81 093 61%
Data not available 3 <1% 95 <1%
Year Student Entered Current Board
Year of the assessment 245 5% 7 017 5%
Year prior to the assessment 243 5% 6 714 5%
2 years prior to the assessment 213 4% 6 032 5%
3 or more years prior to the assessment 4 390 86% 111 795 84%
Data not available 6 <1% 1 208 1%* Contextual data pertaining to gender, student status, place of birth, language learned at home and year entered school and board are based on information
provided by schools and/or boards through the Student Data Collection process. ** See the Explanation of Terms.
School Board Report Dufferin-Peel Catholic DSB (67083)
Results as of September 6, 2018 10 of 41
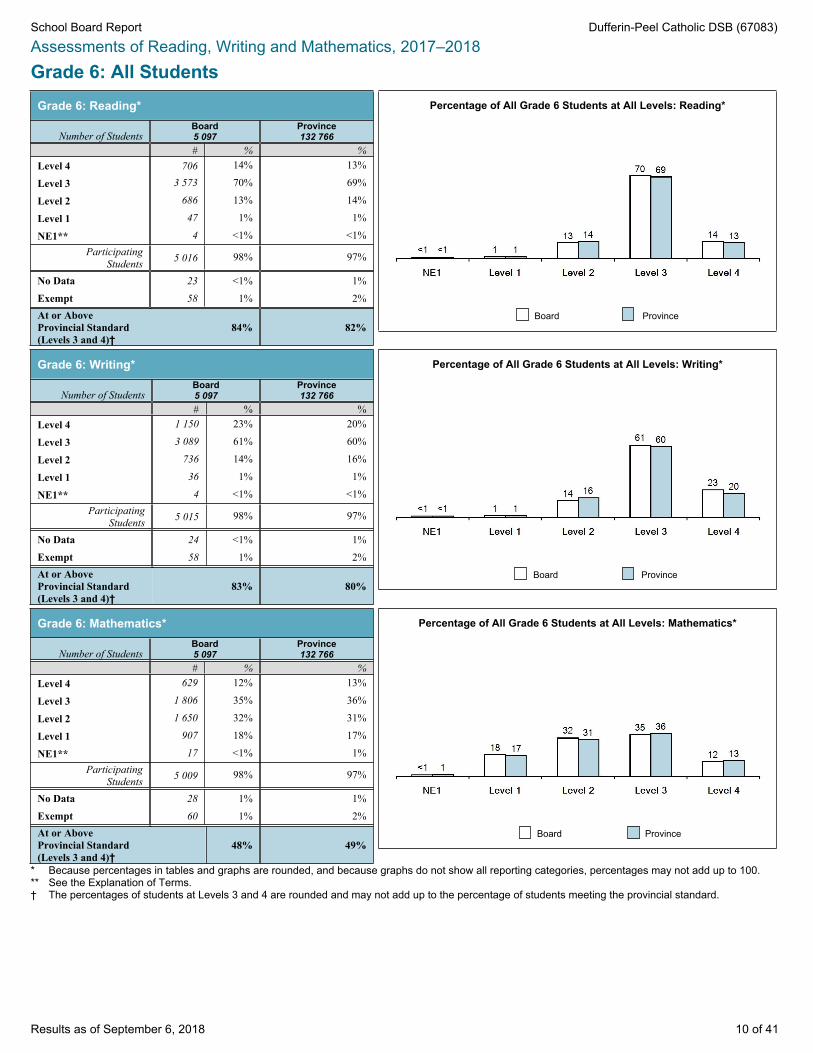
Assessments of Reading, Writing and Mathematics, 2017–2018Grade 6: All Students
Grade 6: Reading*
Number of StudentsBoard5 097
Province132 766
# % %Level 4 706 14% 13%
Level 3 3 573 70% 69%
Level 2 686 13% 14%
Level 1 47 1% 1%
NE1** 4 <1% <1%Participating
Students 5 016 98% 97%
No Data 23 <1% 1%Exempt 58 1% 2%At or Above Provincial Standard(Levels 3 and 4)†
84% 82%
Percentage of All Grade 6 Students at All Levels: Reading*
Board Province
Grade 6: Writing*
Number of StudentsBoard5 097
Province132 766
# % %Level 4 1 150 23% 20%
Level 3 3 089 61% 60%
Level 2 736 14% 16%
Level 1 36 1% 1%
NE1** 4 <1% <1%Participating
Students 5 015 98% 97%
No Data 24 <1% 1%Exempt 58 1% 2%At or Above Provincial Standard(Levels 3 and 4)†
83% 80%
Percentage of All Grade 6 Students at All Levels: Writing*
Board Province
Grade 6: Mathematics*
Number of StudentsBoard5 097
Province132 766
# % %Level 4 629 12% 13%
Level 3 1 806 35% 36%
Level 2 1 650 32% 31%
Level 1 907 18% 17%
NE1** 17 <1% 1%Participating
Students 5 009 98% 97%
No Data 28 1% 1%Exempt 60 1% 2%At or Above Provincial Standard(Levels 3 and 4)†
48% 49%
Percentage of All Grade 6 Students at All Levels: Mathematics*
Board Province
* Because percentages in tables and graphs are rounded, and because graphs do not show all reporting categories, percentages may not add up to 100.** See the Explanation of Terms.† The percentages of students at Levels 3 and 4 are rounded and may not add up to the percentage of students meeting the provincial standard.
School Board Report Dufferin-Peel Catholic DSB (67083)
Results as of September 6, 2018 11 of 41
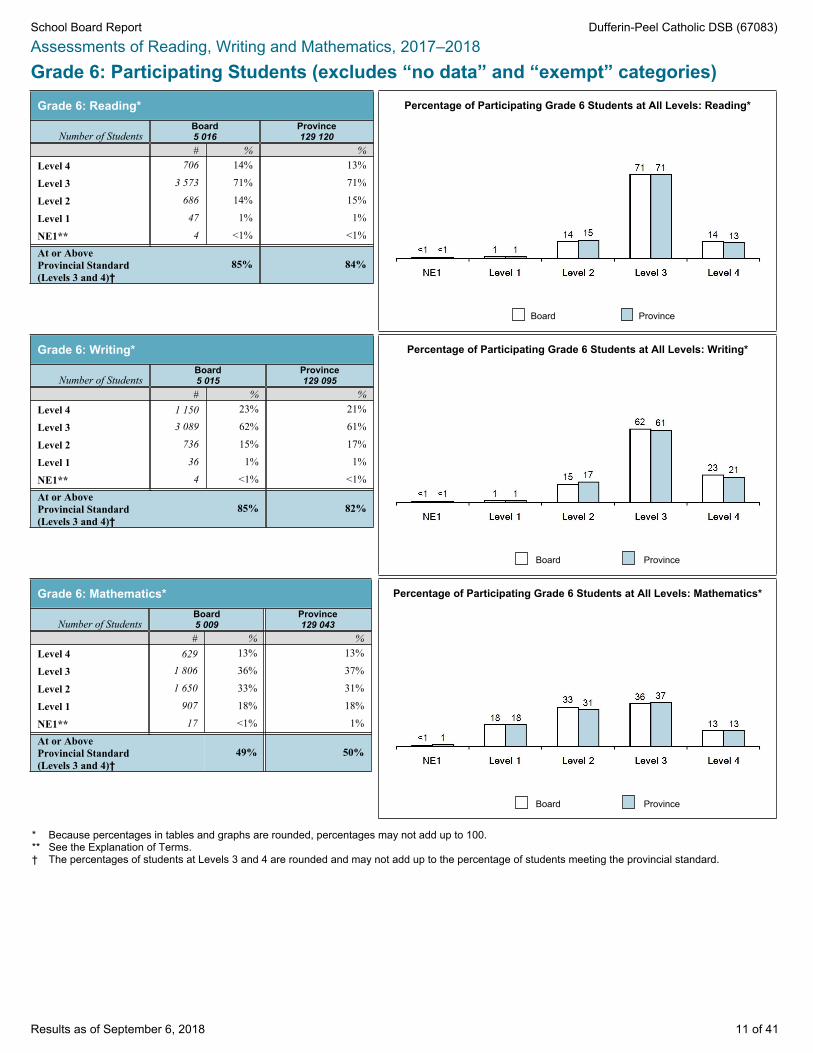
Assessments of Reading, Writing and Mathematics, 2017–2018Grade 6: Participating Students (excludes “no data” and “exempt” categories)
Grade 6: Reading*
Number of StudentsBoard5 016
Province129 120
# % %Level 4 706 14% 13%
Level 3 3 573 71% 71%
Level 2 686 14% 15%
Level 1 47 1% 1%
NE1** 4 <1% <1%
At or Above Provincial Standard(Levels 3 and 4)†
85% 84%
Percentage of Participating Grade 6 Students at All Levels: Reading*
Board Province
Grade 6: Writing*
Number of StudentsBoard5 015
Province129 095
# % %Level 4 1 150 23% 21%
Level 3 3 089 62% 61%
Level 2 736 15% 17%
Level 1 36 1% 1%
NE1** 4 <1% <1%
At or Above Provincial Standard(Levels 3 and 4)†
85% 82%
Percentage of Participating Grade 6 Students at All Levels: Writing*
Board Province
Grade 6: Mathematics*
Number of StudentsBoard5 009
Province129 043
# % %Level 4 629 13% 13%
Level 3 1 806 36% 37%
Level 2 1 650 33% 31%
Level 1 907 18% 18%
NE1** 17 <1% 1%
At or Above Provincial Standard(Levels 3 and 4)†
49% 50%
Percentage of Participating Grade 6 Students at All Levels: Mathematics*
Board Province
* Because percentages in tables and graphs are rounded, percentages may not add up to 100.** See the Explanation of Terms.† The percentages of students at Levels 3 and 4 are rounded and may not add up to the percentage of students meeting the provincial standard.

School Board Report Dufferin-Peel Catholic DSB (67083)
Results as of September 6, 2018 12 of 41
Assessments of Reading, Writing and Mathematics, 2017–2018
Grade 6: Gender††
Grade 6: Board*
Reading Writing Mathematics
Number of StudentsFemale2 443
Male2 654
Female2 443
Male2 654
Female2 443
Male2 654
Level 4 18% 10% 32% 14% 11% 13%
Level 3 70% 70% 58% 63% 36% 35%
Level 2 10% 17% 8% 20% 34% 31%
Level 1 <1% 1% <1% 1% 16% 19%
NE1** <1% <1% <1% <1% <1% <1%Participating
Students 99% 98% 99% 98% 98% 98%
No Data <1% 1% <1% 1% <1% 1%
Exempt 1% 1% 1% 1% 1% 1%
At or Above Provincial Standard(Levels 3 and 4)†
88% 80% 90% 77% 48% 48%
Percentage of All Grade 6 StudentsAt or Above Provincial Standard: Board†
Female Male
Grade 6: Province*
Reading Writing Mathematics
Number of StudentsFemale64 627
Male68 138
Female64 627
Male68 138
Female64 627
Male68 138
Level 4 17% 9% 29% 12% 13% 13%
Level 3 69% 69% 59% 61% 37% 35%
Level 2 11% 18% 10% 22% 32% 30%
Level 1 1% 2% 1% 1% 16% 19%
NE1** <1% <1% <1% <1% <1% 1%Participating
Students 98% 97% 98% 97% 98% 97%
No Data 1% 1% 1% 1% 1% 1%
Exempt 1% 2% 1% 2% 1% 2%
At or Above Provincial Standard(Levels 3 and 4)†
86% 77% 87% 73% 49% 48%
Percentage of All Grade 6 StudentsAt or Above Provincial Standard: Province†
Female Male
* Because percentages in tables and graphs are rounded, percentages may not add up to 100.** See the Explanation of Terms.† The percentages of students at Levels 3 and 4 are rounded and may not add up to the percentage of students meeting the provincial standard.†† Results include only students for whom gender data were available.
School Board Report Dufferin-Peel Catholic DSB (67083)
Results as of September 6, 2018 13 of 41
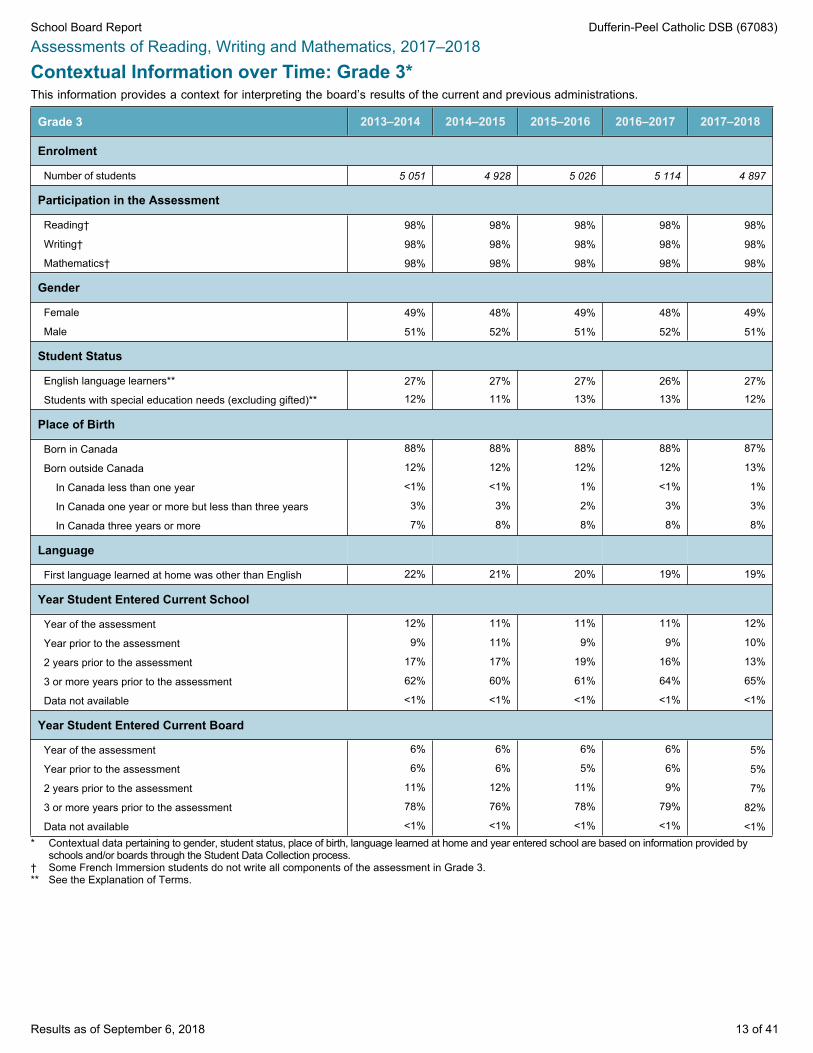
Assessments of Reading, Writing and Mathematics, 2017–2018Contextual Information over Time: Grade 3*This information provides a context for interpreting the board’s results of the current and previous administrations.
Grade 3 2013–2014 2014–2015 2015–2016 2016–2017 2017–2018
Enrolment
Number of students 5 051 4 928 5 026 5 114 4 897
Participation in the Assessment
Reading† 98% 98% 98% 98% 98%
Writing† 98% 98% 98% 98% 98%
Mathematics† 98% 98% 98% 98% 98%
Gender
Female 49% 48% 49% 48% 49%
Male 51% 52% 51% 52% 51%
Student Status
English language learners** 27% 27% 27% 26% 27%
Students with special education needs (excluding gifted)** 12% 11% 13% 13% 12%
Place of Birth
Born in Canada 88% 88% 88% 88% 87%
Born outside Canada 12% 12% 12% 12% 13%
In Canada less than one year <1% <1% 1% <1% 1%
In Canada one year or more but less than three years 3% 3% 2% 3% 3%
In Canada three years or more 7% 8% 8% 8% 8%
Language
First language learned at home was other than English 22% 21% 20% 19% 19%
Year Student Entered Current School
Year of the assessment 12% 11% 11% 11% 12%
Year prior to the assessment 9% 11% 9% 9% 10%
2 years prior to the assessment 17% 17% 19% 16% 13%
3 or more years prior to the assessment 62% 60% 61% 64% 65%
Data not available <1% <1% <1% <1% <1%
Year Student Entered Current Board
Year of the assessment 6% 6% 6% 6% 5%
Year prior to the assessment 6% 6% 5% 6% 5%
2 years prior to the assessment 11% 12% 11% 9% 7%
3 or more years prior to the assessment 78% 76% 78% 79% 82%
Data not available <1% <1% <1% <1% <1%* Contextual data pertaining to gender, student status, place of birth, language learned at home and year entered school are based on information provided by
schools and/or boards through the Student Data Collection process.† Some French Immersion students do not write all components of the assessment in Grade 3.** See the Explanation of Terms.

School Board Report Dufferin-Peel Catholic DSB (67083)
Results as of September 6, 2018 14 of 41
2014–2015 2016–20172015–2016 2017–2018
2014–2015 2016–20172015–2016 2017–2018
Assessments of Reading, Writing and Mathematics, 2017–2018Results over Time, 2014–2015 to 2017–2018♦
Grade 3: ReadingGrade 3 Reading: Board*
Year '14–'15 '15–'16 '16–'17 '17–'18
Number of Students 4 927 5 026 5 114 4 897
Level 4 14% 16% 19% 20%
Level 3 57% 61% 60% 59%
Level 2 23% 19% 17% 17%
Level 1 3% 2% 2% 2%
NE1** 1% <1% <1% <1%Participating
Students 98% 98% 98% 98%
No Data <1% <1% <1% <1%
Exempt 1% 1% 1% 2%
At or Above Provincial Standard†
71% 77% 80% 79%
Percentage of All Grade 3 Students at All Levels in Reading: Board*
Grade 3 Reading: Province*
Year '14–'15 '15–'16 '16–'17 '17–'18
Number of Students EC 118 838 126 016 125 213
Level 4 EC 16% 17% 18%
Level 3 EC 56% 57% 57%
Level 2 EC 21% 19% 19%
Level 1 EC 3% 3% 3%
NE1** EC 1% 1% 1%Participating
Students EC 97% 97% 97%
No Data EC 1% 1% 1%
Exempt EC 3% 3% 2%
At or Above Provincial Standard†
EC 72% 74% 75%
Percentage of All Grade 3 Students at All Levels in Reading: Province*
♦ Refer to the EQAO Web site (www.eqao.com) for data from previous years.* Because percentages in tables and graphs are rounded, and because graphs do not show all reporting categories, percentages may not add up to 100.** See the Explanation of Terms.† The percentages of students at Levels 3 and 4 are rounded and may not add up to the percentage of students meeting the provincial standard.

School Board Report Dufferin-Peel Catholic DSB (67083)
Results as of September 6, 2018 15 of 41
2014–2015 2016–20172015–2016 2017–2018
2014–2015 2016–20172015–2016 2017–2018
Assessments of Reading, Writing and Mathematics, 2017–2018Results over Time, 2014–2015 to 2017–2018♦
Grade 3: WritingGrade 3 Writing: Board*
Year '14–'15 '15–'16 '16–'17 '17–'18
Number of Students 4 927 5 026 5 114 4 897
Level 4 5% 5% 4% 4%
Level 3 71% 74% 76% 73%
Level 2 21% 18% 18% 20%
Level 1 1% 1% <1% 1%
NE1** <1% <1% <1% <1%Participating
Students 98% 98% 98% 98%
No Data <1% <1% <1% <1%
Exempt 1% 1% 1% 2%
At or Above Provincial Standard†
76% 79% 79% 77%
Percentage of All Grade 3 Students at All Levels in Writing: Board*
Grade 3 Writing: Province*
Year '14–'15 '15–'16 '16–'17 '17–'18
Number of Students EC 118 860 126 036 125 213
Level 4 EC 4% 3% 3%
Level 3 EC 70% 70% 69%
Level 2 EC 22% 22% 24%
Level 1 EC 1% 1% 1%
NE1** EC <1% <1% <1%Participating
Students EC 97% 97% 97%
No Data EC 1% 1% 1%
Exempt EC 2% 2% 2%
At or Above Provincial Standard†
EC 74% 73% 72%
Percentage of All Grade 3 Students at All Levels in Writing: Province*
♦ Refer to the EQAO Web site (www.eqao.com) for data from previous years.* Because percentages in tables and graphs are rounded, and because graphs do not show all reporting categories, percentages may not add up to 100.** See the Explanation of Terms.† The percentages of students at Levels 3 and 4 are rounded and may not add up to the percentage of students meeting the provincial standard.
School Board Report Dufferin-Peel Catholic DSB (67083)
Results as of September 6, 2018 16 of 41
2014–2015 2016–20172015–2016 2017–2018
2014–2015 2016–20172015–2016 2017–2018
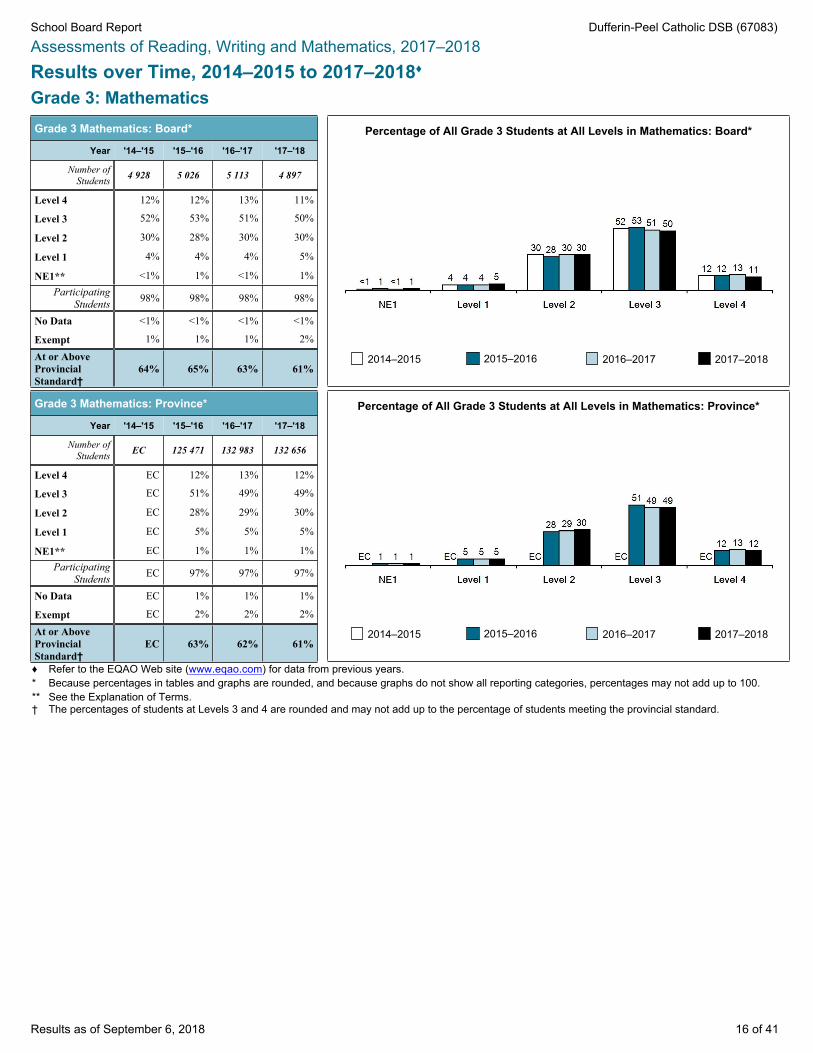
Assessments of Reading, Writing and Mathematics, 2017–2018Results over Time, 2014–2015 to 2017–2018♦
Grade 3: MathematicsGrade 3 Mathematics: Board*
Year '14–'15 '15–'16 '16–'17 '17–'18
Number of Students 4 928 5 026 5 113 4 897
Level 4 12% 12% 13% 11%
Level 3 52% 53% 51% 50%
Level 2 30% 28% 30% 30%
Level 1 4% 4% 4% 5%
NE1** <1% 1% <1% 1%Participating
Students 98% 98% 98% 98%
No Data <1% <1% <1% <1%
Exempt 1% 1% 1% 2%
At or Above Provincial Standard†
64% 65% 63% 61%
Percentage of All Grade 3 Students at All Levels in Mathematics: Board*
Grade 3 Mathematics: Province*
Year '14–'15 '15–'16 '16–'17 '17–'18
Number of Students EC 125 471 132 983 132 656
Level 4 EC 12% 13% 12%
Level 3 EC 51% 49% 49%
Level 2 EC 28% 29% 30%
Level 1 EC 5% 5% 5%
NE1** EC 1% 1% 1%Participating
Students EC 97% 97% 97%
No Data EC 1% 1% 1%
Exempt EC 2% 2% 2%
At or Above Provincial Standard†
EC 63% 62% 61%
Percentage of All Grade 3 Students at All Levels in Mathematics: Province*
♦ Refer to the EQAO Web site (www.eqao.com) for data from previous years.* Because percentages in tables and graphs are rounded, and because graphs do not show all reporting categories, percentages may not add up to 100.** See the Explanation of Terms.† The percentages of students at Levels 3 and 4 are rounded and may not add up to the percentage of students meeting the provincial standard.

School Board Report Dufferin-Peel Catholic DSB (67083)
Results as of September 6, 2018 17 of 41
Assessments of Reading, Writing and Mathematics, 2017–2018Contextual Information over Time: Grade 6*This information provides a context for interpreting the board’s results of the current and previous administrations.
Grade 6 2013–2014 2014–2015 2015–2016 2016–2017 2017–2018
Enrolment
Number of students 5 259 5 108 5 307 5 220 5 097
Participation in the Assessment
Reading 99% 98% 99% 99% 98%
Writing 99% 98% 99% 99% 98%
Mathematics 99% 98% 99% 99% 98%
Gender
Female 48% 49% 48% 49% 48%
Male 52% 51% 52% 51% 52%
Student Status
English language learners** 14% 16% 17% 16% 19%
Students with special education needs (excluding gifted)** 15% 17% 16% 16% 16%
Place of Birth
Born in Canada 83% 83% 84% 85% 84%
Born outside Canada 16% 16% 16% 15% 16%
In Canada less than one year <1% <1% <1% <1% <1%
In Canada one year or more but less than three years 2% 2% 2% 2% 3%
In Canada three years or more 12% 13% 12% 11% 12%
Language
First language learned at home was other than English 27% 25% 24% 23% 23%
Year Student Entered Current School
Year of the assessment 11% 10% 9% 9% 11%
Year prior to the assessment 13% 14% 14% 13% 16%
2 years prior to the assessment 6% 7% 8% 7% 6%
3 or more years prior to the assessment 69% 69% 69% 70% 67%
Data not available <1% <1% <1% <1% <1%
Year Student Entered Current Board
Year of the assessment 6% 5% 5% 5% 5%
Year prior to the assessment 4% 5% 4% 5% 5%
2 years prior to the assessment 4% 4% 5% 4% 4%
3 or more years prior to the assessment 85% 85% 86% 86% 86%
Data not available <1% <1% <1% <1% 5%* Contextual data pertaining to gender, student status, place of birth, language learned at home and year entered school are based on information provided by
schools and/or boards through the Student Data Collection process. ** See the Explanation of Terms.
School Board Report Dufferin-Peel Catholic DSB (67083)
Results as of September 6, 2018 18 of 41
2014–2015 2016–20172015–2016 2017–2018
2014–2015 2016–20172015–2016 2017–2018
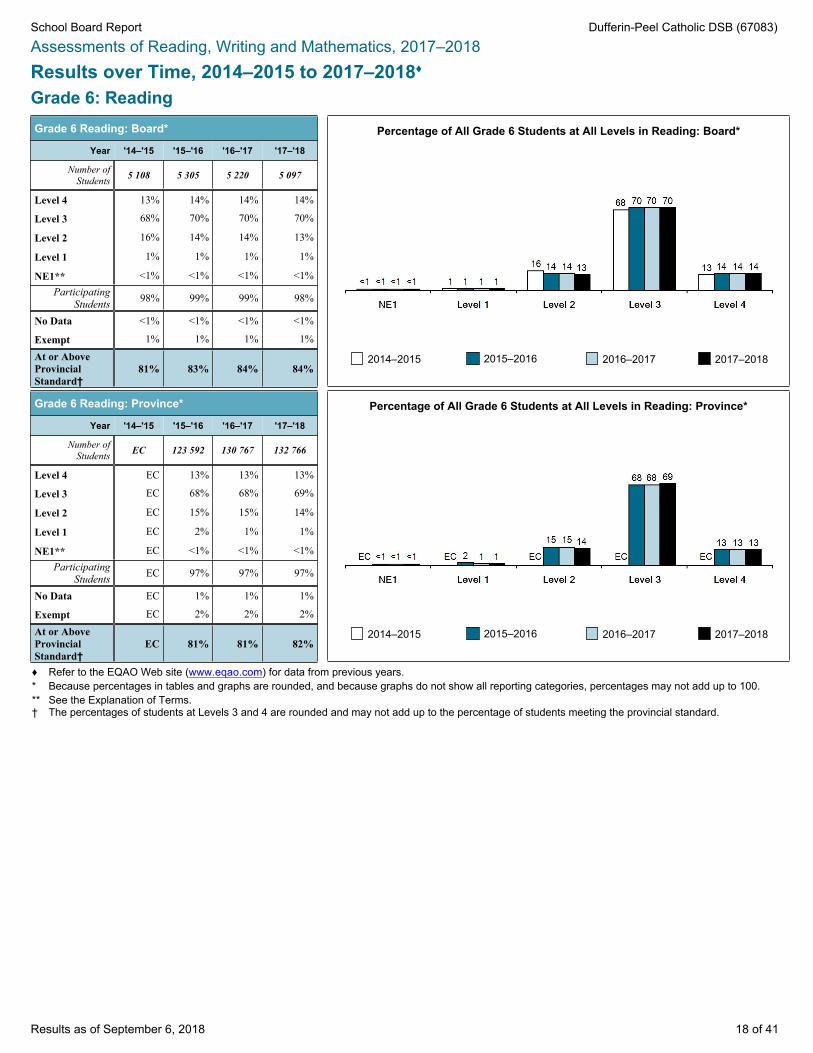
Assessments of Reading, Writing and Mathematics, 2017–2018Results over Time, 2014–2015 to 2017–2018♦
Grade 6: ReadingGrade 6 Reading: Board*
Year '14–'15 '15–'16 '16–'17 '17–'18
Number of Students 5 108 5 305 5 220 5 097
Level 4 13% 14% 14% 14%
Level 3 68% 70% 70% 70%
Level 2 16% 14% 14% 13%
Level 1 1% 1% 1% 1%
NE1** <1% <1% <1% <1%Participating
Students 98% 99% 99% 98%
No Data <1% <1% <1% <1%
Exempt 1% 1% 1% 1%
At or Above Provincial Standard†
81% 83% 84% 84%
Percentage of All Grade 6 Students at All Levels in Reading: Board*
Grade 6 Reading: Province*
Year '14–'15 '15–'16 '16–'17 '17–'18
Number of Students EC 123 592 130 767 132 766
Level 4 EC 13% 13% 13%
Level 3 EC 68% 68% 69%
Level 2 EC 15% 15% 14%
Level 1 EC 2% 1% 1%
NE1** EC <1% <1% <1%Participating
Students EC 97% 97% 97%
No Data EC 1% 1% 1%
Exempt EC 2% 2% 2%
At or Above Provincial Standard†
EC 81% 81% 82%
Percentage of All Grade 6 Students at All Levels in Reading: Province*
♦ Refer to the EQAO Web site (www.eqao.com) for data from previous years.* Because percentages in tables and graphs are rounded, and because graphs do not show all reporting categories, percentages may not add up to 100.** See the Explanation of Terms.† The percentages of students at Levels 3 and 4 are rounded and may not add up to the percentage of students meeting the provincial standard.
School Board Report Dufferin-Peel Catholic DSB (67083)
Results as of September 6, 2018 19 of 41
2014–2015 2016–20172015–2016 2017–2018
2014–2015 2016–20172015–2016 2017–2018
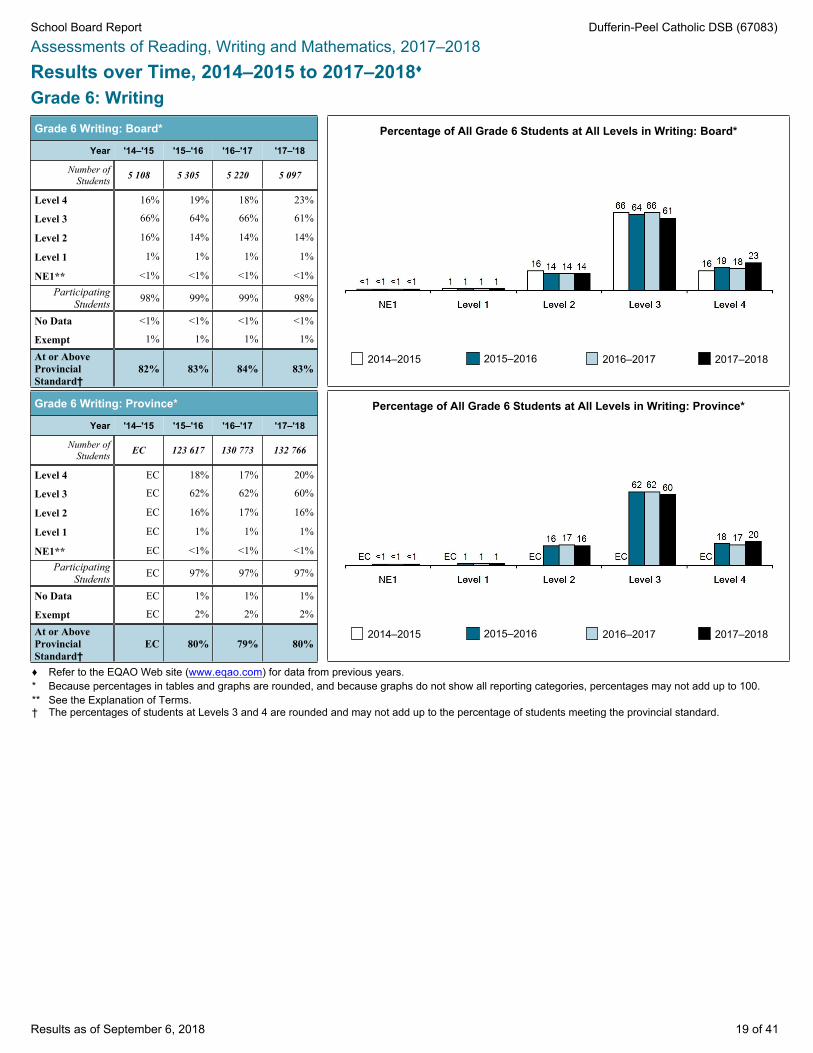
Assessments of Reading, Writing and Mathematics, 2017–2018Results over Time, 2014–2015 to 2017–2018♦
Grade 6: WritingGrade 6 Writing: Board*
Year '14–'15 '15–'16 '16–'17 '17–'18
Number of Students 5 108 5 305 5 220 5 097
Level 4 16% 19% 18% 23%
Level 3 66% 64% 66% 61%
Level 2 16% 14% 14% 14%
Level 1 1% 1% 1% 1%
NE1** <1% <1% <1% <1%Participating
Students 98% 99% 99% 98%
No Data <1% <1% <1% <1%
Exempt 1% 1% 1% 1%
At or Above Provincial Standard†
82% 83% 84% 83%
Percentage of All Grade 6 Students at All Levels in Writing: Board*
Grade 6 Writing: Province*
Year '14–'15 '15–'16 '16–'17 '17–'18
Number of Students EC 123 617 130 773 132 766
Level 4 EC 18% 17% 20%
Level 3 EC 62% 62% 60%
Level 2 EC 16% 17% 16%
Level 1 EC 1% 1% 1%
NE1** EC <1% <1% <1%Participating
Students EC 97% 97% 97%
No Data EC 1% 1% 1%
Exempt EC 2% 2% 2%
At or Above Provincial Standard†
EC 80% 79% 80%
Percentage of All Grade 6 Students at All Levels in Writing: Province*
♦ Refer to the EQAO Web site (www.eqao.com) for data from previous years.* Because percentages in tables and graphs are rounded, and because graphs do not show all reporting categories, percentages may not add up to 100.** See the Explanation of Terms.† The percentages of students at Levels 3 and 4 are rounded and may not add up to the percentage of students meeting the provincial standard.
School Board Report Dufferin-Peel Catholic DSB (67083)
Results as of September 6, 2018 20 of 41
2014–2015 2016–20172015–2016 2017–2018
2014–2015 2016–20172015–2016 2017–2018
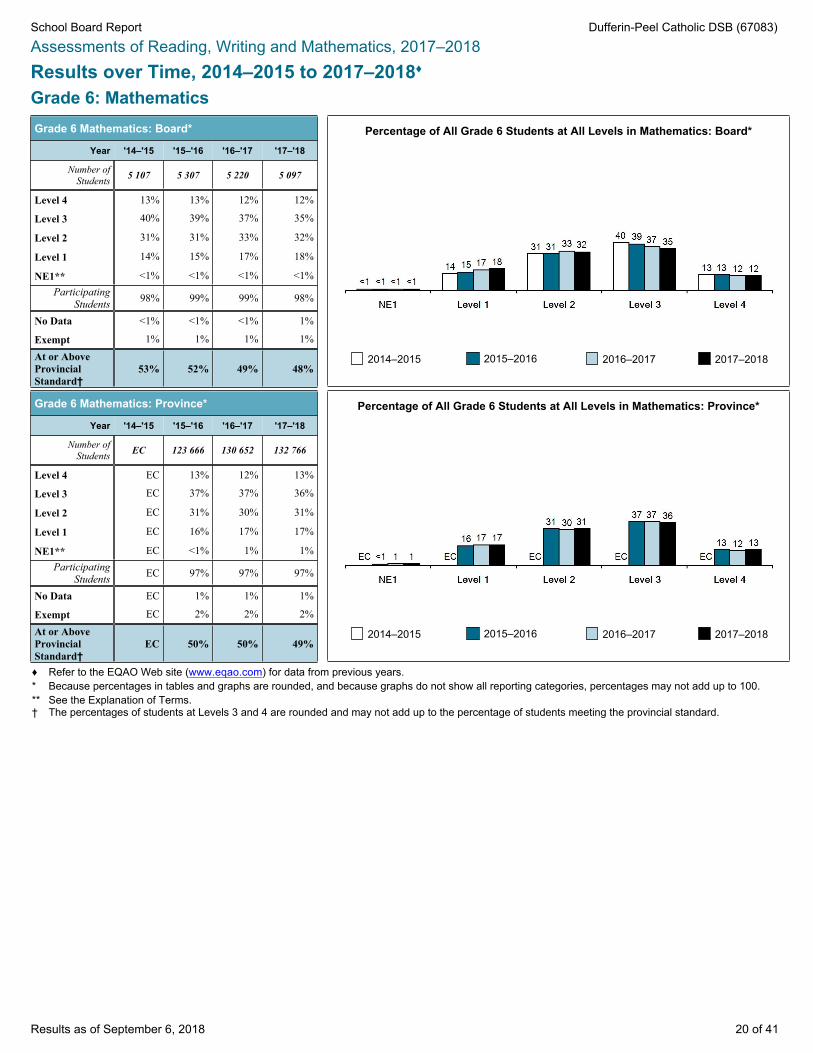
Assessments of Reading, Writing and Mathematics, 2017–2018Results over Time, 2014–2015 to 2017–2018♦
Grade 6: MathematicsGrade 6 Mathematics: Board*
Year '14–'15 '15–'16 '16–'17 '17–'18
Number of Students 5 107 5 307 5 220 5 097
Level 4 13% 13% 12% 12%
Level 3 40% 39% 37% 35%
Level 2 31% 31% 33% 32%
Level 1 14% 15% 17% 18%
NE1** <1% <1% <1% <1%Participating
Students 98% 99% 99% 98%
No Data <1% <1% <1% 1%
Exempt 1% 1% 1% 1%
At or Above Provincial Standard†
53% 52% 49% 48%
Percentage of All Grade 6 Students at All Levels in Mathematics: Board*
Grade 6 Mathematics: Province*
Year '14–'15 '15–'16 '16–'17 '17–'18
Number of Students EC 123 666 130 652 132 766
Level 4 EC 13% 12% 13%
Level 3 EC 37% 37% 36%
Level 2 EC 31% 30% 31%
Level 1 EC 16% 17% 17%
NE1** EC <1% 1% 1%Participating
Students EC 97% 97% 97%
No Data EC 1% 1% 1%
Exempt EC 2% 2% 2%
At or Above Provincial Standard†
EC 50% 50% 49%
Percentage of All Grade 6 Students at All Levels in Mathematics: Province*
♦ Refer to the EQAO Web site (www.eqao.com) for data from previous years.* Because percentages in tables and graphs are rounded, and because graphs do not show all reporting categories, percentages may not add up to 100.** See the Explanation of Terms.† The percentages of students at Levels 3 and 4 are rounded and may not add up to the percentage of students meeting the provincial standard.

School Board Report Dufferin-Peel Catholic DSB (67083)
Results as of September 6, 2018 21 of 41
Assessments of Reading, Writing and Mathematics, 2017–2018
RESULTS FOR ALL STUDENTS OVER TIME BY GENDER*
Percentage of Students At or Above the Provincial Standard (Levels 3 and 4): Grade 3
2013–2014 2014–2015 2015–2016 2016–2017 2017–2018
READING
WRITING
MATHEMATICS
Total Number of Grade 3 Students*2013–2014 2014–2015 2015–2016 2016–2017 2017–2018
Female Male Female Male Female Male Female Male Female MaleBoard 2 488 2 563 2 354 2 574 2 440 2 586 2 470 2 644 2 416 2 481
* Includes only students for whom gender data were available.
Female Male
School Board Report Dufferin-Peel Catholic DSB (67083)
Results as of September 6, 2018 22 of 41
Assessments of Reading, Writing and Mathematics, 2017–2018
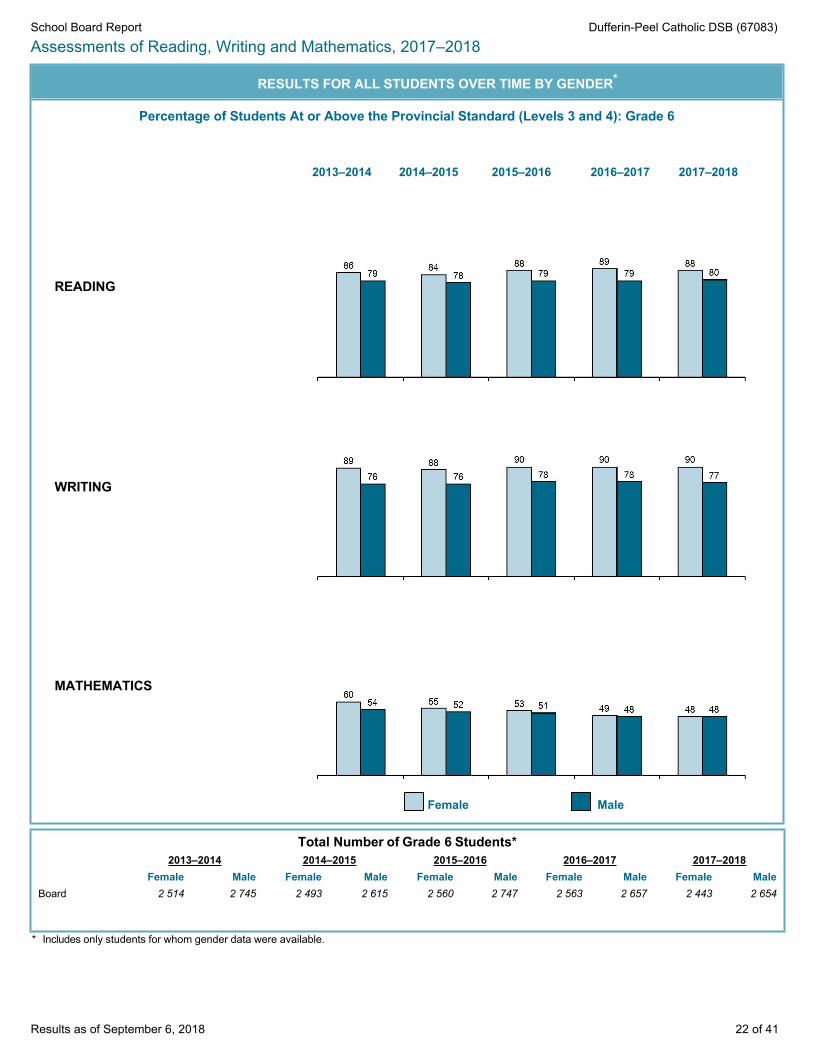
RESULTS FOR ALL STUDENTS OVER TIME BY GENDER*
Percentage of Students At or Above the Provincial Standard (Levels 3 and 4): Grade 6
2013–2014 2014–2015 2015–2016 2016–2017 2017–2018
READING
WRITING
MATHEMATICS
Total Number of Grade 6 Students*2013–2014 2014–2015 2015–2016 2016–2017 2017–2018
Female Male Female Male Female Male Female Male Female MaleBoard 2 514 2 745 2 493 2 615 2 560 2 747 2 563 2 657 2 443 2 654
* Includes only students for whom gender data were available.
Female Male
School Board Report Dufferin-Peel Catholic DSB (67083)
Results as of September 6, 2018 23 of 41
Sometimes
Assessments of Reading, Writing and Mathematics, 2017–2018
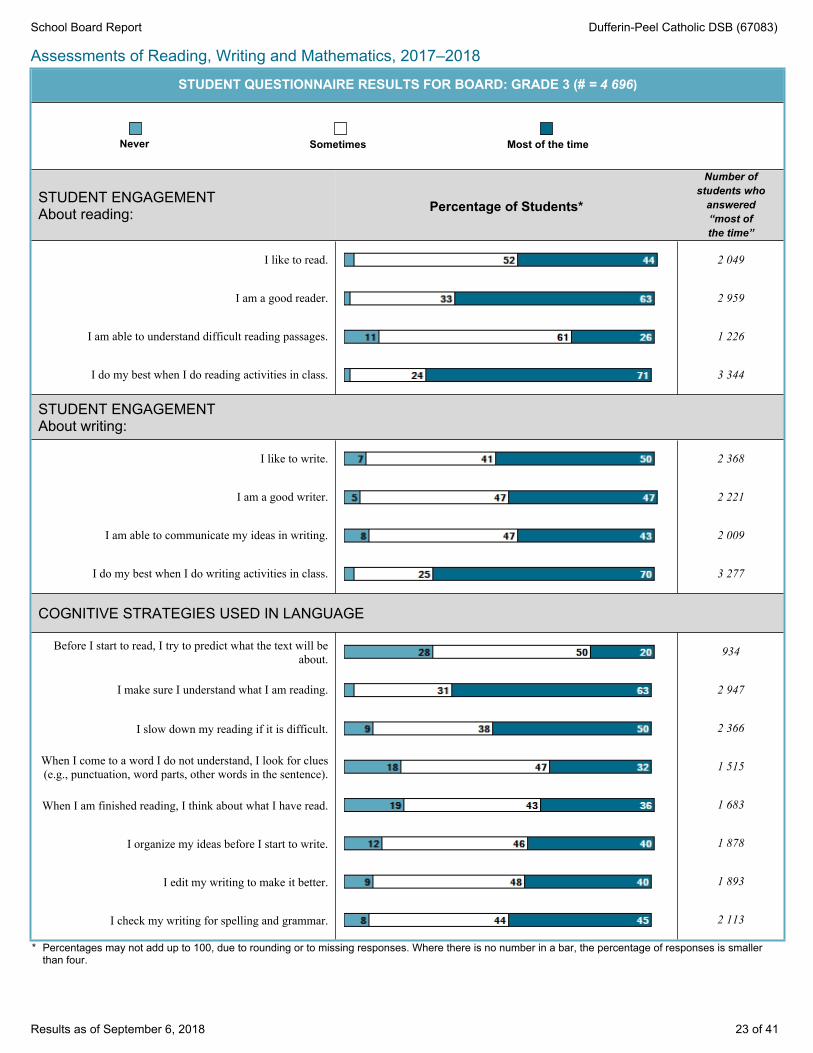
STUDENT QUESTIONNAIRE RESULTS FOR BOARD: GRADE 3 (# = 4 696)
STUDENT ENGAGEMENTAbout reading: Percentage of Students*
Number of students who
answered “most of the time”
I like to read. 2 049
I am a good reader. 2 959
I am able to understand difficult reading passages. 1 226
I do my best when I do reading activities in class. 3 344
STUDENT ENGAGEMENTAbout writing:
I like to write. 2 368
I am a good writer. 2 221
I am able to communicate my ideas in writing. 2 009
I do my best when I do writing activities in class. 3 277
COGNITIVE STRATEGIES USED IN LANGUAGE
Before I start to read, I try to predict what the text will be about. 934
I make sure I understand what I am reading. 2 947
I slow down my reading if it is difficult. 2 366
When I come to a word I do not understand, I look for clues (e.g., punctuation, word parts, other words in the sentence). 1 515
When I am finished reading, I think about what I have read. 1 683
I organize my ideas before I start to write. 1 878
I edit my writing to make it better. 1 893
I check my writing for spelling and grammar. 2 113
* Percentages may not add up to 100, due to rounding or to missing responses. Where there is no number in a bar, the percentage of responses is smaller than four.
Never Most of the time
School Board Report Dufferin-Peel Catholic DSB (67083)
Results as of September 6, 2018 24 of 41
Sometimes
Assessments of Reading, Writing and Mathematics, 2017–2018
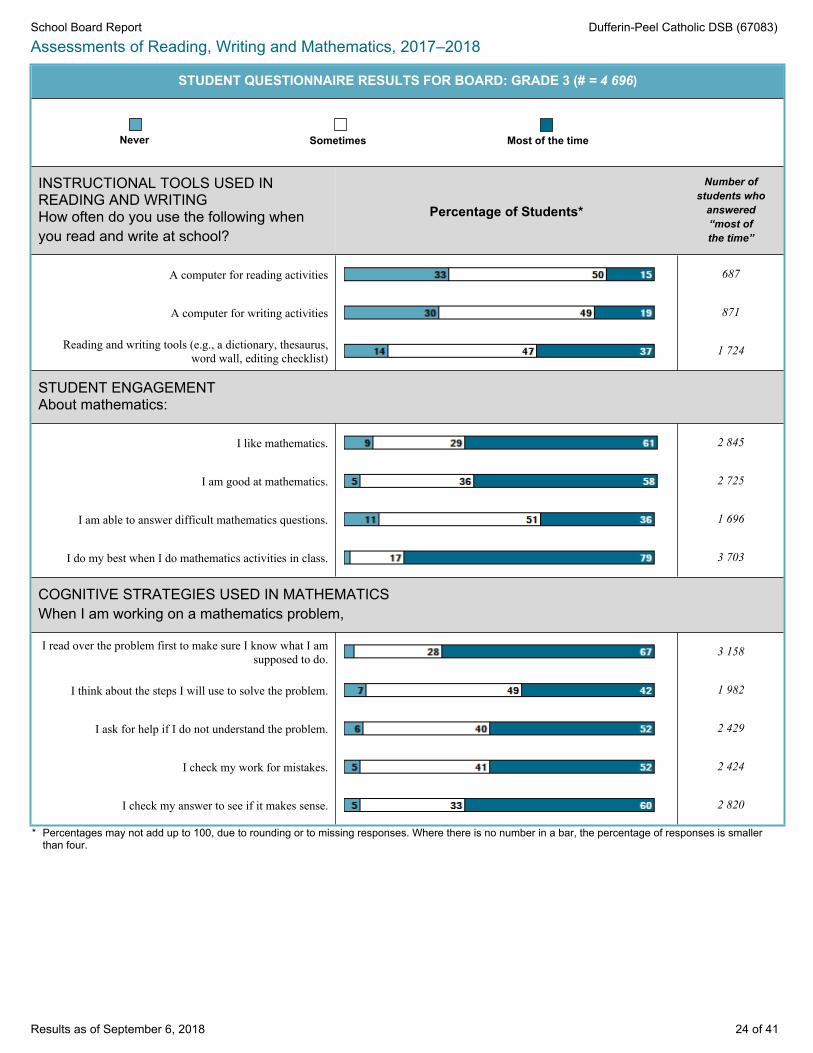
STUDENT QUESTIONNAIRE RESULTS FOR BOARD: GRADE 3 (# = 4 696)
INSTRUCTIONAL TOOLS USED IN READING AND WRITINGHow often do you use the following when you read and write at school?
Percentage of Students*
Number of students who
answered “most of the time”
A computer for reading activities 687
A computer for writing activities 871
Reading and writing tools (e.g., a dictionary, thesaurus, word wall, editing checklist) 1 724
STUDENT ENGAGEMENTAbout mathematics:
I like mathematics. 2 845
I am good at mathematics. 2 725
I am able to answer difficult mathematics questions. 1 696
I do my best when I do mathematics activities in class. 3 703
COGNITIVE STRATEGIES USED IN MATHEMATICSWhen I am working on a mathematics problem,
I read over the problem first to make sure I know what I am supposed to do. 3 158
I think about the steps I will use to solve the problem. 1 982
I ask for help if I do not understand the problem. 2 429
I check my work for mistakes. 2 424
I check my answer to see if it makes sense. 2 820
* Percentages may not add up to 100, due to rounding or to missing responses. Where there is no number in a bar, the percentage of responses is smaller than four.
Never Most of the time
School Board Report Dufferin-Peel Catholic DSB (67083)
Results as of September 6, 2018 25 of 41
Sometimes
Assessments of Reading, Writing and Mathematics, 2017–2018
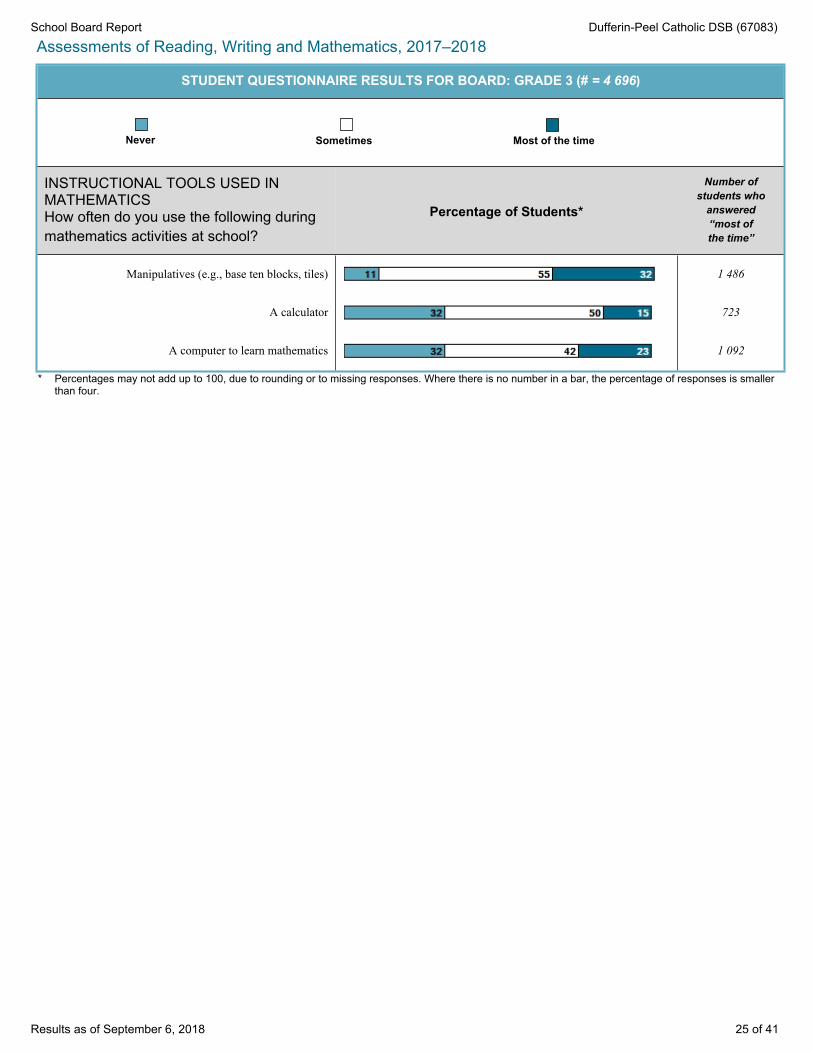
STUDENT QUESTIONNAIRE RESULTS FOR BOARD: GRADE 3 (# = 4 696)
INSTRUCTIONAL TOOLS USED IN MATHEMATICSHow often do you use the following during mathematics activities at school?
Percentage of Students*
Number of students who
answered “most of the time”
Manipulatives (e.g., base ten blocks, tiles) 1 486
A calculator 723
A computer to learn mathematics 1 092
* Percentages may not add up to 100, due to rounding or to missing responses. Where there is no number in a bar, the percentage of responses is smaller than four.
Never Most of the time
School Board Report Dufferin-Peel Catholic DSB (67083)
Results as of September 6, 2018 26 of 41
Every day or almost every day
Assessments of Reading, Writing and Mathematics, 2017–2018
STUDENT QUESTIONNAIRE RESULTS FOR BOARD: GRADE 3 (# = 4 696)
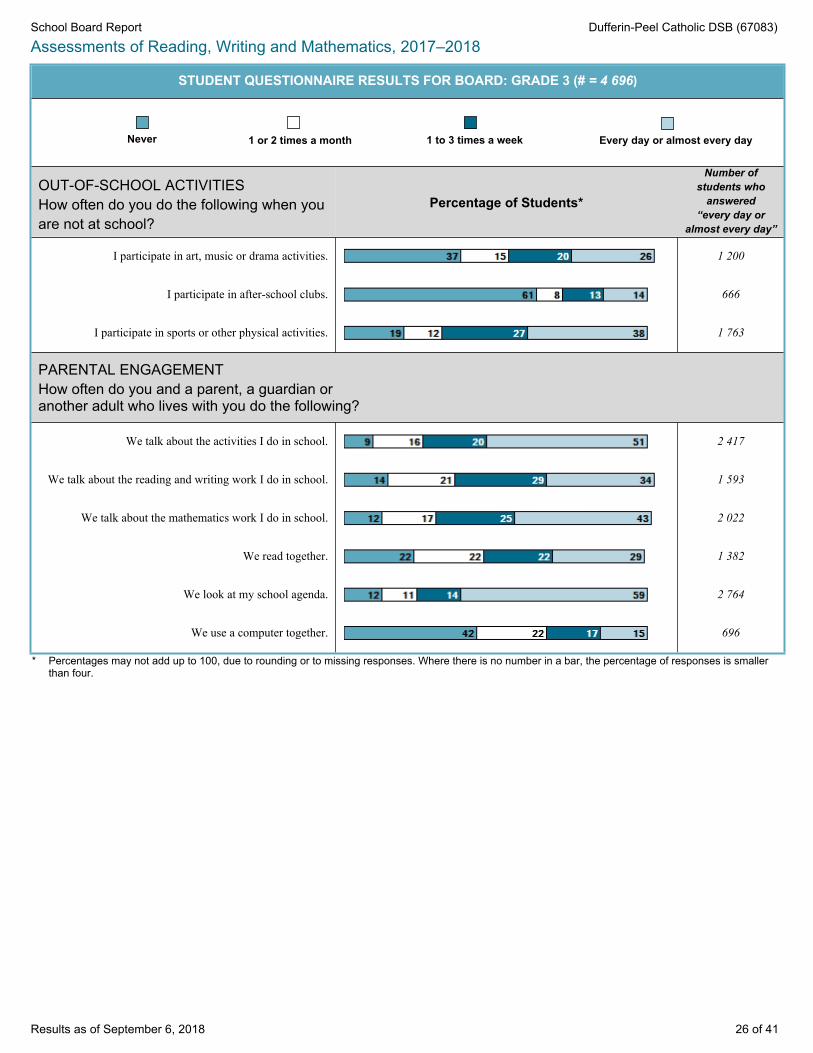
OUT-OF-SCHOOL ACTIVITIESHow often do you do the following when you are not at school?
Percentage of Students*
Number of students who
answered “every day or
almost every day”
I participate in art, music or drama activities. 1 200
I participate in after-school clubs. 666
I participate in sports or other physical activities. 1 763
PARENTAL ENGAGEMENTHow often do you and a parent, a guardian or another adult who lives with you do the following?
We talk about the activities I do in school. 2 417
We talk about the reading and writing work I do in school. 1 593
We talk about the mathematics work I do in school. 2 022
We read together. 1 382
We look at my school agenda. 2 764
We use a computer together. 696
* Percentages may not add up to 100, due to rounding or to missing responses. Where there is no number in a bar, the percentage of responses is smaller than four.
Never 1 to 3 times a week1 or 2 times a month
School Board Report Dufferin-Peel Catholic DSB (67083)
Results as of September 6, 2018 27 of 41
Another language (or other languages)as often as English
Assessments of Reading, Writing and Mathematics, 2017–2018
STUDENT QUESTIONNAIRE RESULTS FOR BOARD: GRADE 3 (# = 4 696)
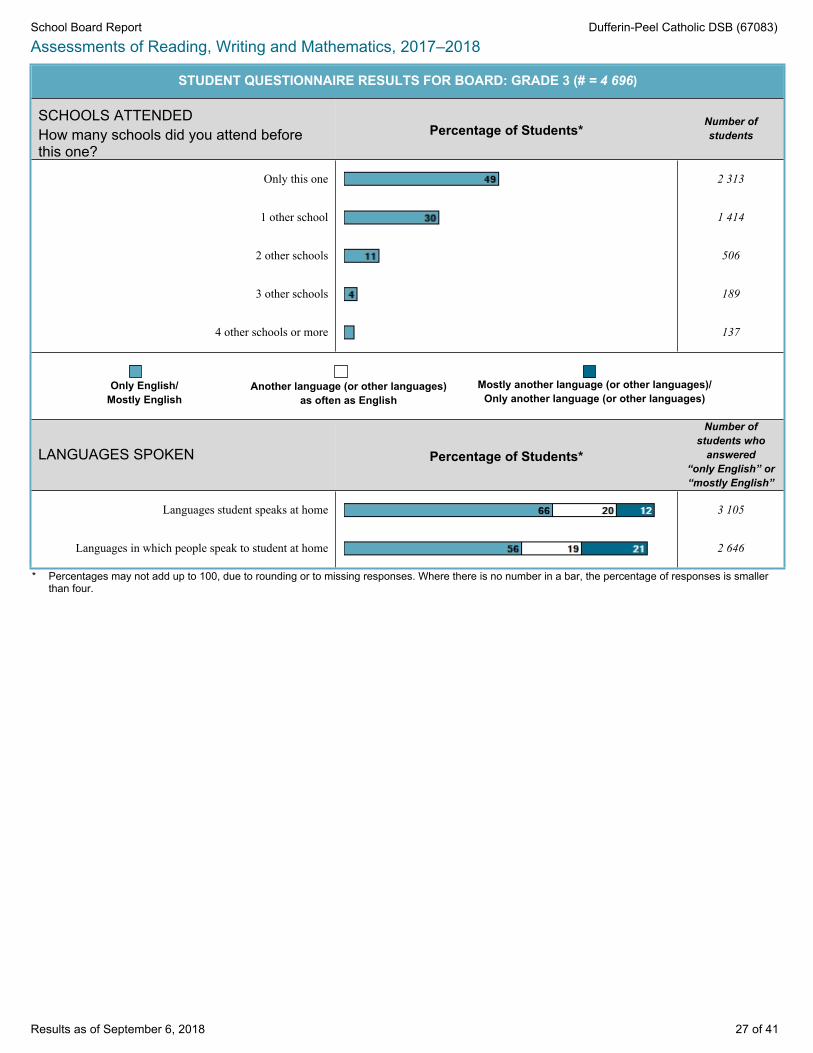
SCHOOLS ATTENDEDHow many schools did you attend before this one?
Percentage of Students*Number of students
Only this one 2 313
1 other school 1 414
2 other schools 506
3 other schools 189
4 other schools or more 137
LANGUAGES SPOKEN Percentage of Students*
Number of students who
answered “only English” or “mostly English”
Languages student speaks at home 3 105
Languages in which people speak to student at home 2 646
* Percentages may not add up to 100, due to rounding or to missing responses. Where there is no number in a bar, the percentage of responses is smaller than four.
Only English/Mostly English
Mostly another language (or other languages)/Only another language (or other languages)
School Board Report Dufferin-Peel Catholic DSB (67083)
Results as of September 6, 2018 28 of 41
Assessments of Reading, Writing and Mathematics, 2017–2018Board Province
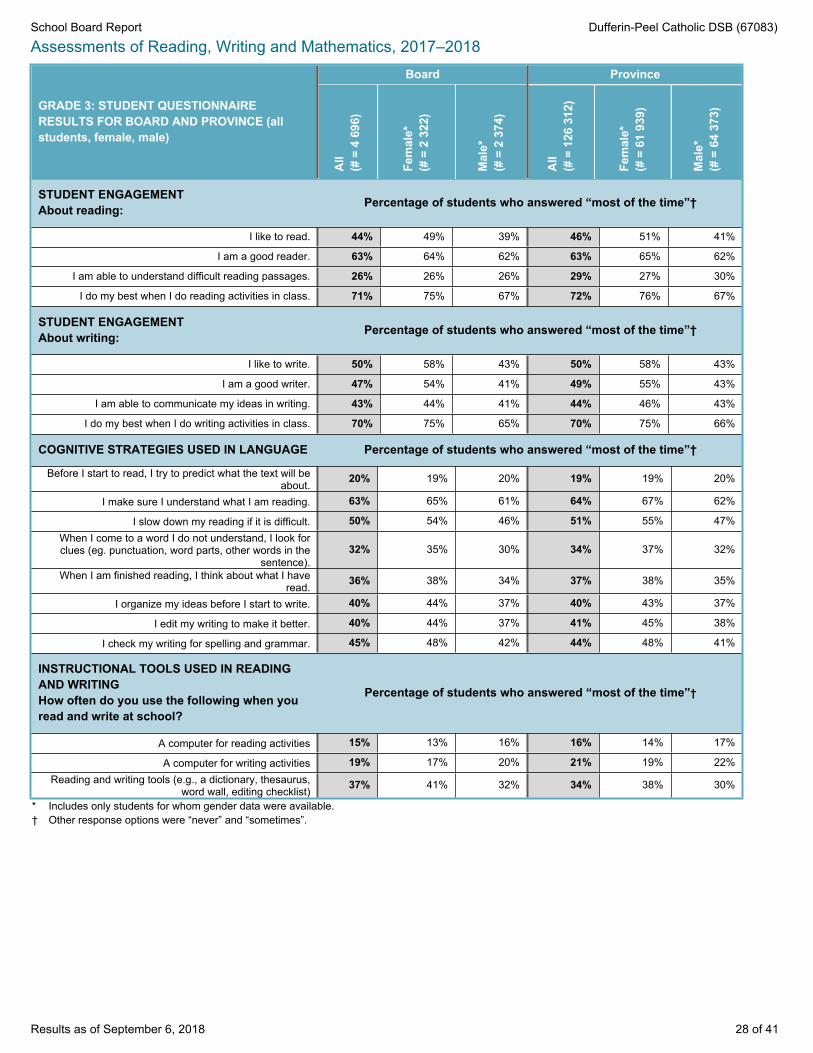
GRADE 3: STUDENT QUESTIONNAIRE RESULTS FOR BOARD AND PROVINCE (all students, female, male)
All
(# =
4 6
96)
Fem
ale*
(# =
2 3
22)
Mal
e*(#
= 2
374
)
All
(# =
126
312
)
Fem
ale*
(# =
61
939)
Mal
e*(#
= 6
4 37
3)
STUDENT ENGAGEMENTAbout reading: Percentage of students who answered “most of the time”†
I like to read. 44% 49% 39% 46% 51% 41%
I am a good reader. 63% 64% 62% 63% 65% 62%
I am able to understand difficult reading passages. 26% 26% 26% 29% 27% 30%
I do my best when I do reading activities in class. 71% 75% 67% 72% 76% 67%
STUDENT ENGAGEMENTAbout writing: Percentage of students who answered “most of the time”†
I like to write. 50% 58% 43% 50% 58% 43%
I am a good writer. 47% 54% 41% 49% 55% 43%
I am able to communicate my ideas in writing. 43% 44% 41% 44% 46% 43%
I do my best when I do writing activities in class. 70% 75% 65% 70% 75% 66%
COGNITIVE STRATEGIES USED IN LANGUAGE Percentage of students who answered “most of the time”†
Before I start to read, I try to predict what the text will be about. 20% 19% 20% 19% 19% 20%
I make sure I understand what I am reading. 63% 65% 61% 64% 67% 62%
I slow down my reading if it is difficult. 50% 54% 46% 51% 55% 47%When I come to a word I do not understand, I look for clues (eg. punctuation, word parts, other words in the
sentence).32% 35% 30% 34% 37% 32%
When I am finished reading, I think about what I have read. 36% 38% 34% 37% 38% 35%
I organize my ideas before I start to write. 40% 44% 37% 40% 43% 37%
I edit my writing to make it better. 40% 44% 37% 41% 45% 38%
I check my writing for spelling and grammar. 45% 48% 42% 44% 48% 41%
INSTRUCTIONAL TOOLS USED IN READING AND WRITINGHow often do you use the following when you read and write at school?
Percentage of students who answered “most of the time”†
A computer for reading activities 15% 13% 16% 16% 14% 17%
A computer for writing activities 19% 17% 20% 21% 19% 22%Reading and writing tools (e.g., a dictionary, thesaurus,
word wall, editing checklist) 37% 41% 32% 34% 38% 30%
* Includes only students for whom gender data were available.† Other response options were “never” and “sometimes”.
School Board Report Dufferin-Peel Catholic DSB (67083)
Results as of September 6, 2018 29 of 41
Assessments of Reading, Writing and Mathematics, 2017–2018Board Province
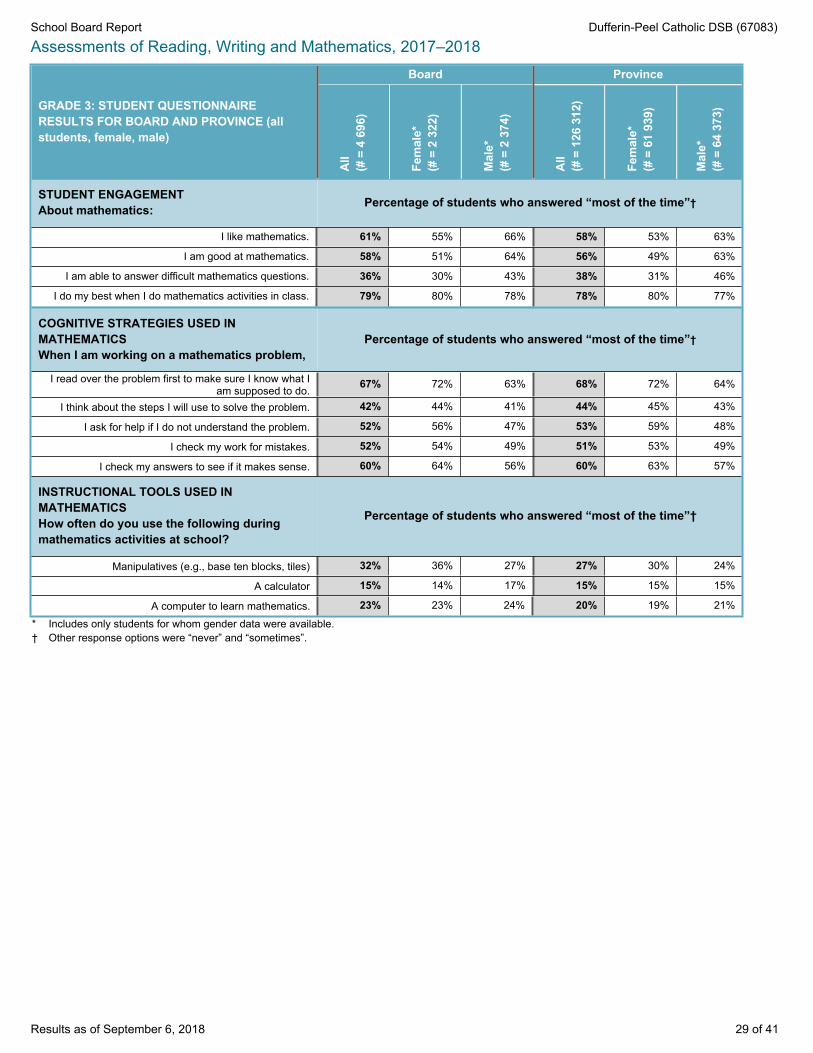
GRADE 3: STUDENT QUESTIONNAIRE RESULTS FOR BOARD AND PROVINCE (all students, female, male)
All
(# =
4 6
96)
Fem
ale*
(# =
2 3
22)
Mal
e*(#
= 2
374
)
All
(# =
126
312
)
Fem
ale*
(# =
61
939)
Mal
e*(#
= 6
4 37
3)
STUDENT ENGAGEMENTAbout mathematics: Percentage of students who answered “most of the time”†
I like mathematics. 61% 55% 66% 58% 53% 63%
I am good at mathematics. 58% 51% 64% 56% 49% 63%
I am able to answer difficult mathematics questions. 36% 30% 43% 38% 31% 46%
I do my best when I do mathematics activities in class. 79% 80% 78% 78% 80% 77%
COGNITIVE STRATEGIES USED IN MATHEMATICSWhen I am working on a mathematics problem,
Percentage of students who answered “most of the time”†
I read over the problem first to make sure I know what I am supposed to do. 67% 72% 63% 68% 72% 64%
I think about the steps I will use to solve the problem. 42% 44% 41% 44% 45% 43%
I ask for help if I do not understand the problem. 52% 56% 47% 53% 59% 48%
I check my work for mistakes. 52% 54% 49% 51% 53% 49%
I check my answers to see if it makes sense. 60% 64% 56% 60% 63% 57%
INSTRUCTIONAL TOOLS USED IN MATHEMATICSHow often do you use the following during mathematics activities at school?
Percentage of students who answered “most of the time”†
Manipulatives (e.g., base ten blocks, tiles) 32% 36% 27% 27% 30% 24%
A calculator 15% 14% 17% 15% 15% 15%
A computer to learn mathematics. 23% 23% 24% 20% 19% 21%
* Includes only students for whom gender data were available.† Other response options were “never” and “sometimes”.
School Board Report Dufferin-Peel Catholic DSB (67083)
Results as of September 6, 2018 30 of 41
Assessments of Reading, Writing and Mathematics, 2017–2018Board Province
GRADE 3: STUDENT QUESTIONNAIRE RESULTS FOR BOARD AND PROVINCE (all students, female, male)
All
(# =
4 6
96)
Fem
ale*
(# =
2 3
22)
Mal
e*(#
= 2
374
)
All
(# =
126
312
)
Fem
ale*
(# =
61
939)
Mal
e*(#
= 6
4 37
3)
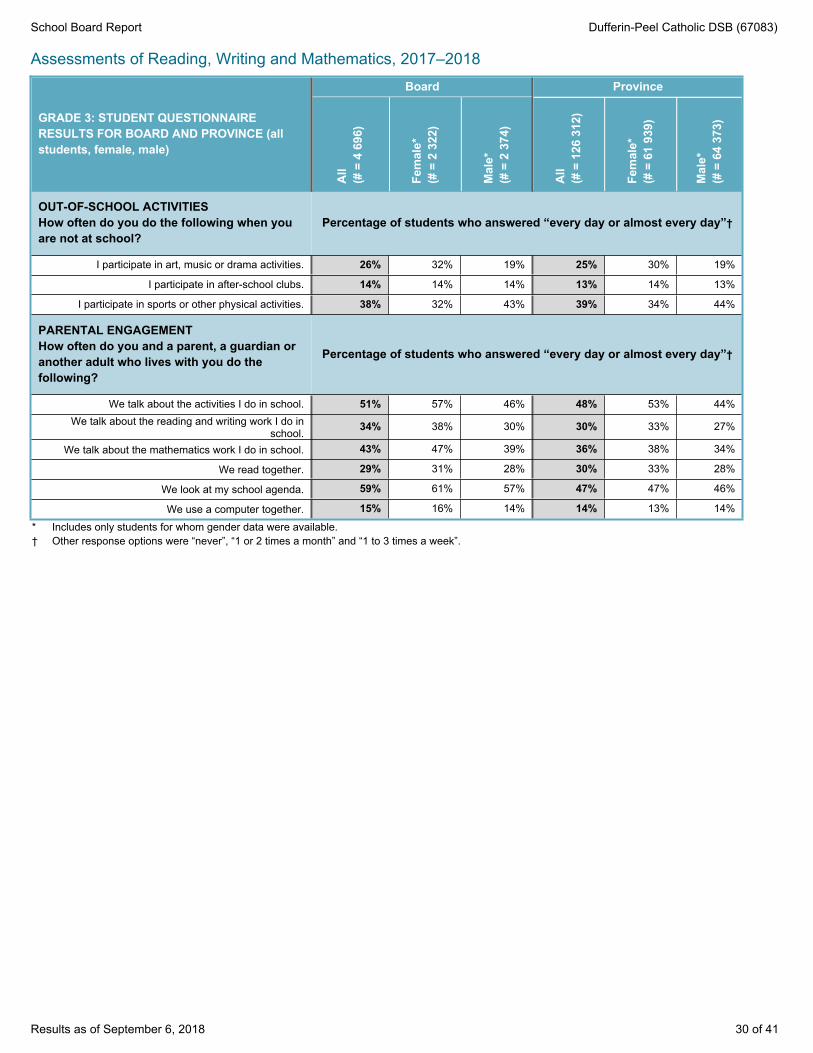
OUT-OF-SCHOOL ACTIVITIESHow often do you do the following when you are not at school?
Percentage of students who answered “every day or almost every day”†
I participate in art, music or drama activities. 26% 32% 19% 25% 30% 19%
I participate in after-school clubs. 14% 14% 14% 13% 14% 13%
I participate in sports or other physical activities. 38% 32% 43% 39% 34% 44%
PARENTAL ENGAGEMENTHow often do you and a parent, a guardian or another adult who lives with you do the following?
Percentage of students who answered “every day or almost every day”†
We talk about the activities I do in school. 51% 57% 46% 48% 53% 44%We talk about the reading and writing work I do in
school. 34% 38% 30% 30% 33% 27%
We talk about the mathematics work I do in school. 43% 47% 39% 36% 38% 34%
We read together. 29% 31% 28% 30% 33% 28%
We look at my school agenda. 59% 61% 57% 47% 47% 46%
We use a computer together. 15% 16% 14% 14% 13% 14%
* Includes only students for whom gender data were available.† Other response options were “never”, “1 or 2 times a month” and “1 to 3 times a week”.

School Board Report Dufferin-Peel Catholic DSB (67083)
Results as of September 6, 2018 31 of 41
Assessments of Reading, Writing and Mathematics, 2017–2018Board Province
GRADE 3: STUDENT QUESTIONNAIRE RESULTS FOR BOARD AND PROVINCE (all students, female, male)
All
(# =
4 6
96)
Fem
ale*
(# =
2 3
22)
Mal
e*(#
= 2
374
)
All
(# =
126
312
)
Fem
ale*
(# =
61
939)
Mal
e*(#
= 6
4 37
3)
SCHOOLS ATTENDEDHow many schools did you attend before this one?
Percentage of students†
Only this school/1 other school 79% 80% 79% 77% 78% 77%
2 other schools/3 other schools 15% 15% 14% 16% 15% 16%
4 other schools or more 3% 2% 4% 4% 4% 4%
LANGUAGES STUDENTS SPEAK AT HOME Percentage of students†
Only English/Mostly English 66% 65% 67% 71% 70% 72%Another language (or other languages) as often as
English 20% 21% 19% 16% 17% 15%
Mostly another language (or other languages)/Only another language (or other languages) 12% 12% 11% 11% 11% 11%
LANGUAGES SPOKEN TO STUDENTS AT HOME
Percentage of students†
Only English/Mostly English 56% 54% 58% 65% 64% 66%Another language (or other languages) as often as
English 19% 21% 17% 13% 14% 13%
Mostly another language (or other languages)/Only another language (or other languages) 21% 21% 20% 17% 17% 17%
* Includes only students for whom gender data were available.† Percentages may not add up to 100, due to rounding or to missing responses.

School Board Report Dufferin-Peel Catholic DSB (67083)
Results as of September 6, 2018 32 of 41
Sometimes
Assessments of Reading, Writing and Mathematics, 2017–2018
STUDENT QUESTIONNAIRE RESULTS FOR BOARD: GRADE 6 (# = 4 939)
STUDENT ENGAGEMENTAbout reading: Percentage of Students*
Number of students who
answered “most of the time”
I like to read. 1 881
I am a good reader. 3 178
I am able to understand difficult reading passages. 1 776
I do my best when I do reading activities in class. 3 513
STUDENT ENGAGEMENTAbout writing:
I like to write. 1 949
I am a good writer. 1 965
I am able to communicate my ideas in writing. 2 390
I do my best when I do writing activities in class. 3 441
COGNITIVE STRATEGIES USED IN LANGUAGE
Before I start to read, I try to predict what the text will be about. 806
I make sure I understand what I am reading. 3 451
I slow down my reading if it is difficult. 2 731
When I come to a word I do not understand, I look for clues (e.g., punctuation, word parts, other words in the sentence).
1 931
When I am finished reading, I think about what I have read. 1 878
I organize my ideas before I start to write. 1 656
I edit my writing to make it better. 2 396
I check my writing for spelling and grammar. 2 616
* Percentages may not add up to 100, due to rounding or to missing responses. Where there is no number in a bar, the percentage of responses is smaller than four.
Never Most of the time

School Board Report Dufferin-Peel Catholic DSB (67083)
Results as of September 6, 2018 33 of 41
Sometimes
Assessments of Reading, Writing and Mathematics, 2017–2018
STUDENT QUESTIONNAIRE RESULTS FOR BOARD: GRADE 6 (# = 4 939)
INSTRUCTIONAL TOOLS USED IN READING AND WRITINGHow often do you use the following when you read and write at school?
Percentage of Students*Number of
students who answered “most
of the time”
A computer for reading activities 595
A computer for writing activities 1 586
Reading and writing tools (e.g., a dictionary, thesaurus, word wall, editing checklist) 1 479
The Internet to find information 2 978
STUDENT ENGAGEMENTAbout mathematics:
I like mathematics. 2 521
I am good at mathematics. 2 557
I am able to answer difficult mathematics questions. 1 814
I do my best when I do mathematics activities in class. 3 824
COGNITIVE STRATEGIES USED IN MATHEMATICSWhen I am working on a mathematics problem,
I read over the problem first to make sure I know what I am supposed to do. 3 865
I think about the steps I will use to solve the problem. 2 507
I ask for help if I do not understand the problem. 2 756
I check my work for mistakes. 2 421
I check my answer to see if it makes sense. 3 188
* Percentages may not add up to 100, due to rounding or to missing responses. Where there is no number in a bar, the percentage of responses is smaller than four.
Never Most of the time
School Board Report Dufferin-Peel Catholic DSB (67083)
Results as of September 6, 2018 34 of 41
Sometimes
Assessments of Reading, Writing and Mathematics, 2017–2018
STUDENT QUESTIONNAIRE RESULTS FOR BOARD: GRADE 6 (# = 4 939)
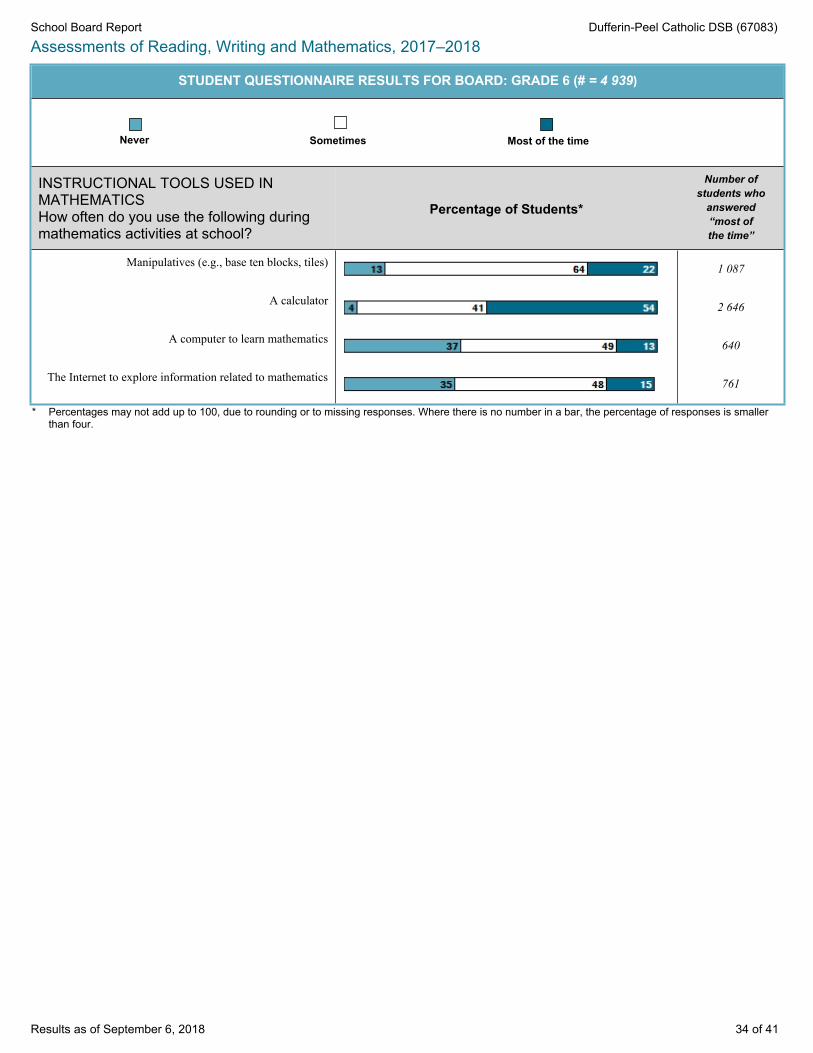
INSTRUCTIONAL TOOLS USED IN MATHEMATICSHow often do you use the following during mathematics activities at school?
Percentage of Students*
Number of students who
answered “most of the time”
Manipulatives (e.g., base ten blocks, tiles) 1 087
A calculator 2 646
A computer to learn mathematics 640
The Internet to explore information related to mathematics 761
* Percentages may not add up to 100, due to rounding or to missing responses. Where there is no number in a bar, the percentage of responses is smaller than four.
Never Most of the time

School Board Report Dufferin-Peel Catholic DSB (67083)
Results as of September 6, 2018 35 of 41
Every day or almost every day
Assessments of Reading, Writing and Mathematics, 2017–2018
STUDENT QUESTIONNAIRE RESULTS FOR BOARD: GRADE 6 (# = 4 939)
OUT-OF-SCHOOL ACTIVITIESHow often do you do the following when you are not at school?
Percentage of Students*
Number of students who
answered “every day or
almost every day”
I participate in art, music or drama activities. 825
I participate in after-school clubs. 452
I participate in sports or other physical activities. 1 888
PARENTAL ENGAGEMENTHow often do you and a parent, a guardian or another adult who lives with you do the following?
We talk about the activities I do in school. 2 324
We talk about the reading and writing work I do in school. 1 087
We talk about the mathematics work I do in school. 1 769
We read together. 372
We look at my school agenda. 1 734
We use a computer together. 489
* Percentages may not add up to 100, due to rounding or to missing responses. Where there is no number in a bar, the percentage of responses is smaller than four.
Never 1 to 3 times a week1 or 2 times a month
School Board Report Dufferin-Peel Catholic DSB (67083)
Results as of September 6, 2018 36 of 41
Another language (or other languages)as often as English
Assessments of Reading, Writing and Mathematics, 2017–2018
STUDENT QUESTIONNAIRE RESULTS FOR BOARD: GRADE 6 (# = 4 939)
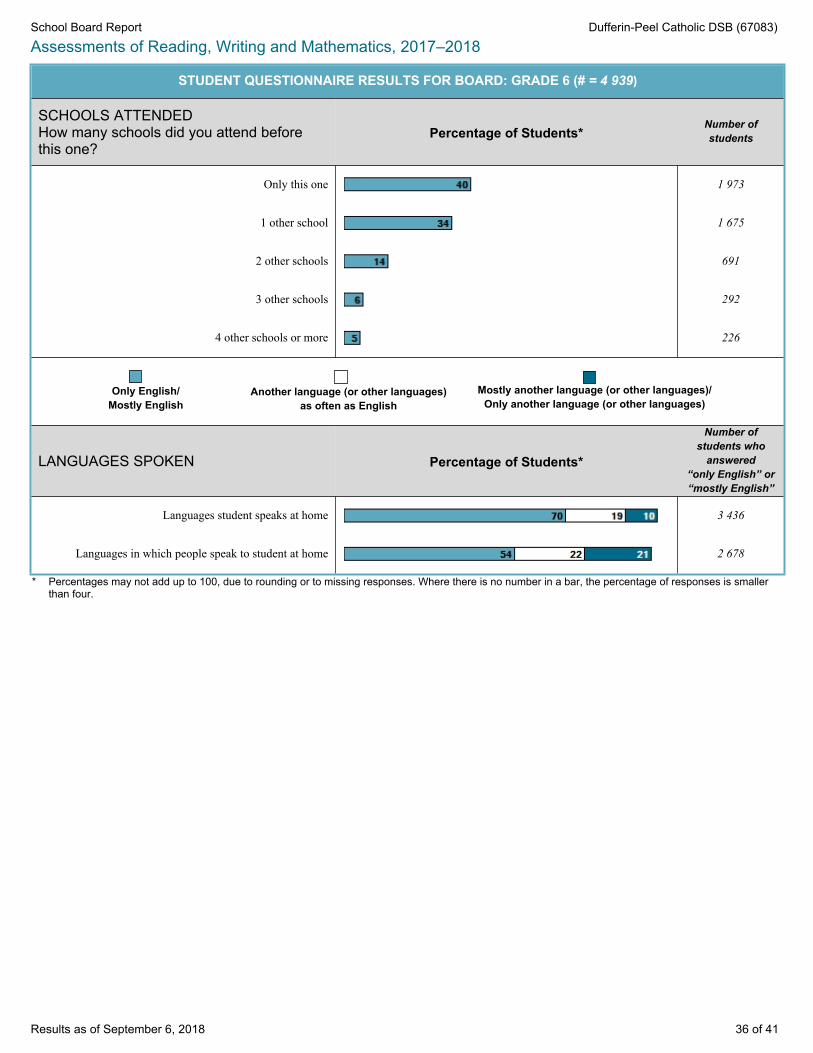
SCHOOLS ATTENDEDHow many schools did you attend before this one?
Percentage of Students*Number of students
Only this one 1 973
1 other school 1 675
2 other schools 691
3 other schools 292
4 other schools or more 226
LANGUAGES SPOKEN Percentage of Students*
Number of students who
answered “only English” or “mostly English”
Languages student speaks at home 3 436
Languages in which people speak to student at home 2 678
* Percentages may not add up to 100, due to rounding or to missing responses. Where there is no number in a bar, the percentage of responses is smaller than four.
Only English/Mostly English
Mostly another language (or other languages)/Only another language (or other languages)
School Board Report Dufferin-Peel Catholic DSB (67083)
Results as of September 6, 2018 37 of 41
Assessments of Reading, Writing and Mathematics, 2017–2018Board Province
GRADE 6: STUDENT QUESTIONNAIRE RESULTS FOR BOARD AND PROVINCE (all students, female, male)
All
(# =
4 9
39)
Fem
ale*
(# =
2 3
74)
Mal
e*(#
= 2
565
)
All
(# =
126
424
)
Fem
ale*
(# =
62
073)
Mal
e*(#
= 6
4 35
0)
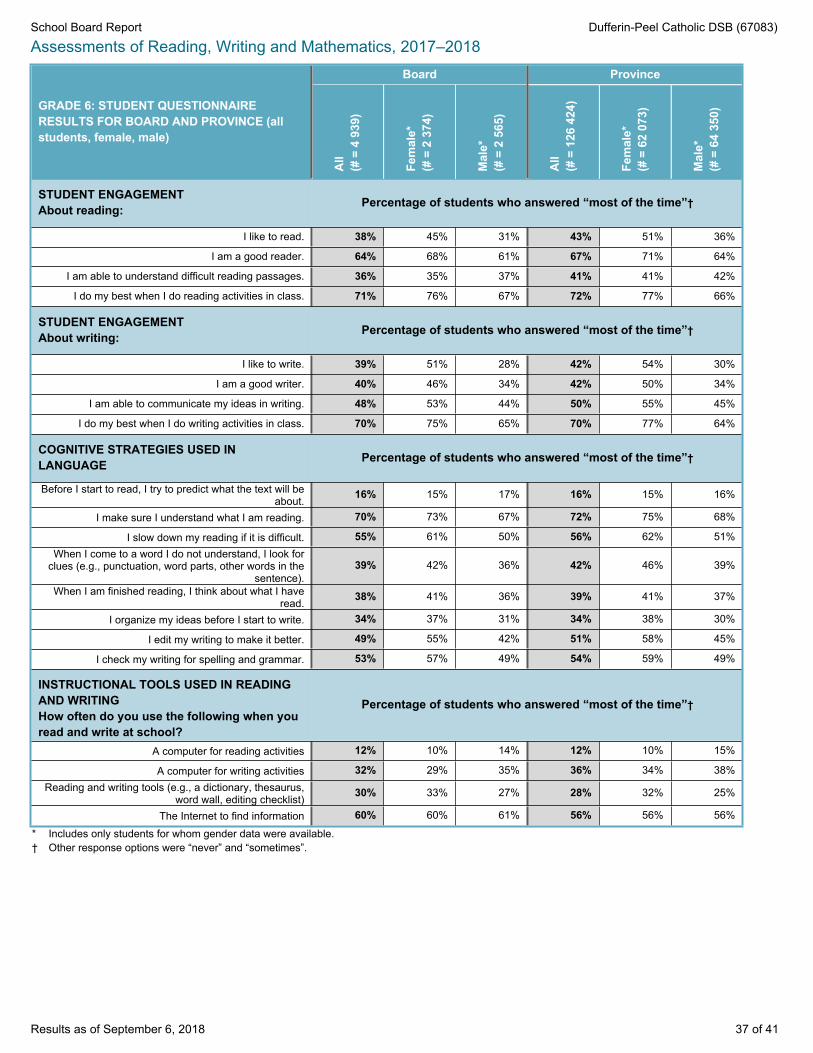
STUDENT ENGAGEMENTAbout reading: Percentage of students who answered “most of the time”†
I like to read. 38% 45% 31% 43% 51% 36%
I am a good reader. 64% 68% 61% 67% 71% 64%
I am able to understand difficult reading passages. 36% 35% 37% 41% 41% 42%
I do my best when I do reading activities in class. 71% 76% 67% 72% 77% 66%
STUDENT ENGAGEMENTAbout writing: Percentage of students who answered “most of the time”†
I like to write. 39% 51% 28% 42% 54% 30%
I am a good writer. 40% 46% 34% 42% 50% 34%
I am able to communicate my ideas in writing. 48% 53% 44% 50% 55% 45%
I do my best when I do writing activities in class. 70% 75% 65% 70% 77% 64%
COGNITIVE STRATEGIES USED IN LANGUAGE Percentage of students who answered “most of the time”†
Before I start to read, I try to predict what the text will be about. 16% 15% 17% 16% 15% 16%
I make sure I understand what I am reading. 70% 73% 67% 72% 75% 68%
I slow down my reading if it is difficult. 55% 61% 50% 56% 62% 51%When I come to a word I do not understand, I look for
clues (e.g., punctuation, word parts, other words in the sentence).
39% 42% 36% 42% 46% 39%
When I am finished reading, I think about what I have read. 38% 41% 36% 39% 41% 37%
I organize my ideas before I start to write. 34% 37% 31% 34% 38% 30%
I edit my writing to make it better. 49% 55% 42% 51% 58% 45%
I check my writing for spelling and grammar. 53% 57% 49% 54% 59% 49%
INSTRUCTIONAL TOOLS USED IN READING AND WRITINGHow often do you use the following when you read and write at school?
Percentage of students who answered “most of the time”†
A computer for reading activities 12% 10% 14% 12% 10% 15%
A computer for writing activities 32% 29% 35% 36% 34% 38%Reading and writing tools (e.g., a dictionary, thesaurus,
word wall, editing checklist) 30% 33% 27% 28% 32% 25%
The Internet to find information 60% 60% 61% 56% 56% 56%
* Includes only students for whom gender data were available.† Other response options were “never” and “sometimes”.

School Board Report Dufferin-Peel Catholic DSB (67083)
Results as of September 6, 2018 38 of 41
Assessments of Reading, Writing and Mathematics, 2017–2018Board Province
GRADE 6: STUDENT QUESTIONNAIRE RESULTS FOR BOARD AND PROVINCE (all students, female, male)
All
(# =
4 9
39)
Fem
ale*
(# =
2 3
74)
Mal
e*(#
= 2
565
)
All
(# =
126
42
4)
Fem
ale*
(# =
62
073)
Mal
e*(#
= 6
4 35
0)
STUDENT ENGAGEMENTAbout mathematics: Percentage of students who answered “most of the time”†
I like mathematics. 51% 42% 59% 50% 42% 58%
I am good at mathematics. 52% 43% 59% 52% 44% 60%
I am able to answer difficult mathematics questions. 37% 27% 46% 38% 29% 47%
I do my best when I do mathematics activities in class. 77% 76% 79% 78% 78% 78%
COGNITIVE STRATEGIES USED IN MATHEMATICSWhen I am working on a mathematics problem,
Percentage of students who answered “most of the time”†
I read over the problem first to make sure I know what I am supposed to do. 78% 82% 75% 80% 84% 76%
I think about the steps I will use to solve the problem. 51% 50% 51% 51% 51% 50%
I ask for help if I do not understand the problem. 56% 58% 53% 58% 61% 54%
I check my work for mistakes. 49% 50% 48% 49% 50% 47%
I check my answers to see if it makes sense. 65% 66% 63% 64% 67% 62%
INSTRUCTIONAL TOOLS USED IN MATHEMATICSHow often do you use the following during mathematics activities at school?
Percentage of students who answered “most of the time”†
Manipulatives (e.g., base ten blocks, tiles) 22% 24% 20% 17% 19% 15%
A calculator 54% 58% 49% 51% 56% 46%
A computer to learn mathematics 13% 12% 14% 10% 9% 11%The Internet to explore information related to
mathematics 15% 15% 16% 13% 11% 14%
* Includes only students for whom gender data were available.† Other response options were “never” and “sometimes”.

School Board Report Dufferin-Peel Catholic DSB (67083)
Results as of September 6, 2018 39 of 41
Assessments of Reading, Writing and Mathematics, 2017–2018Board Province
GRADE 6: STUDENT QUESTIONNAIRE RESULTS FOR BOARD AND PROVINCE (all students, female, male)
All
(# =
4 9
39)
Fem
ale*
(# =
2 3
74)
Mal
e*(#
= 2
565
)
All
(# =
126
42
4)
Fem
ale*
(# =
62
073)
Mal
e*(#
= 6
4 35
0)
OUT-OF-SCHOOL ACTIVITIESHow often do you do the following when you are not at school?
Percentage of students who answered “every day or almost every day”†
I participate in art, music or drama activities. 17% 21% 13% 17% 21% 13%
I participate in after-school clubs. 9% 9% 9% 10% 11% 10%
I participate in sports or other physical activities. 38% 31% 45% 42% 36% 48%
PARENTAL ENGAGEMENTHow often do you and a parent, a guardian or another adult who lives with you do the following?
Percentage of students who answered “every day or almost every day”†
We talk about the activities I do in school. 47% 50% 44% 47% 51% 43%We talk about the reading and writing work I do in
school. 22% 23% 21% 22% 25% 20%
We talk about the mathematics work I do in school. 36% 36% 35% 34% 36% 33%
We read together. 8% 7% 8% 8% 8% 9%
We look at my school agenda. 35% 34% 36% 24% 24% 25%
We use a computer together. 10% 10% 10% 10% 9% 11%
* Includes only students for whom gender data were available.† Other response options were “never”, “1 or 2 times a month” and “1 to 3 times a week.”

School Board Report Dufferin-Peel Catholic DSB (67083)
Results as of September 6, 2018 40 of 41
Assessments of Reading, Writing and Mathematics, 2017–2018Board Province
GRADE 6: STUDENT QUESTIONNAIRE RESULTS FOR BOARD AND PROVINCE (all students, female, male)
All
(# =
4 9
39)
Fem
ale*
(# =
2 3
74)
Mal
e*(#
= 2
565
)
All
(# =
126
424
)
Fem
ale*
(# =
62
073)
Mal
e*(#
= 6
4 35
0)
SCHOOLS ATTENDEDHow many schools did you attend before this one?
Percentage of students†
Only this school/1 other school 74% 73% 75% 70% 70% 70%
2 other schools/3 other schools 20% 20% 20% 22% 22% 22%
4 other schools or more 5% 6% 4% 6% 6% 6%
LANGUAGES STUDENTS SPEAK AT HOME Percentage of students†
Only English/Mostly English 70% 69% 70% 73% 73% 73%Another language (or other languages) as often as
English 19% 21% 19% 17% 18% 16%
Mostly another language (or other languages)/Only another language (or other languages) 10% 10% 10% 8% 8% 9%
LANGUAGES SPOKEN TO STUDENTS AT HOME
Percentage of students†
Only English/Mostly English 54% 53% 55% 66% 66% 66%Another language (or other languages) as often as
English 22% 22% 22% 15% 15% 14%
Mostly another language (or other languages)/Only another language (or other languages) 21% 21% 21% 16% 16% 16%
* Includes only students for whom gender data were available.† Percentages may not add up to 100, due to rounding or to missing responses.
School Board Report Dufferin-Peel Catholic DSB (67083)
Results as of September 6, 2018 41 of 41
Assessments of Reading, Writing and Mathematics, 2017–2018
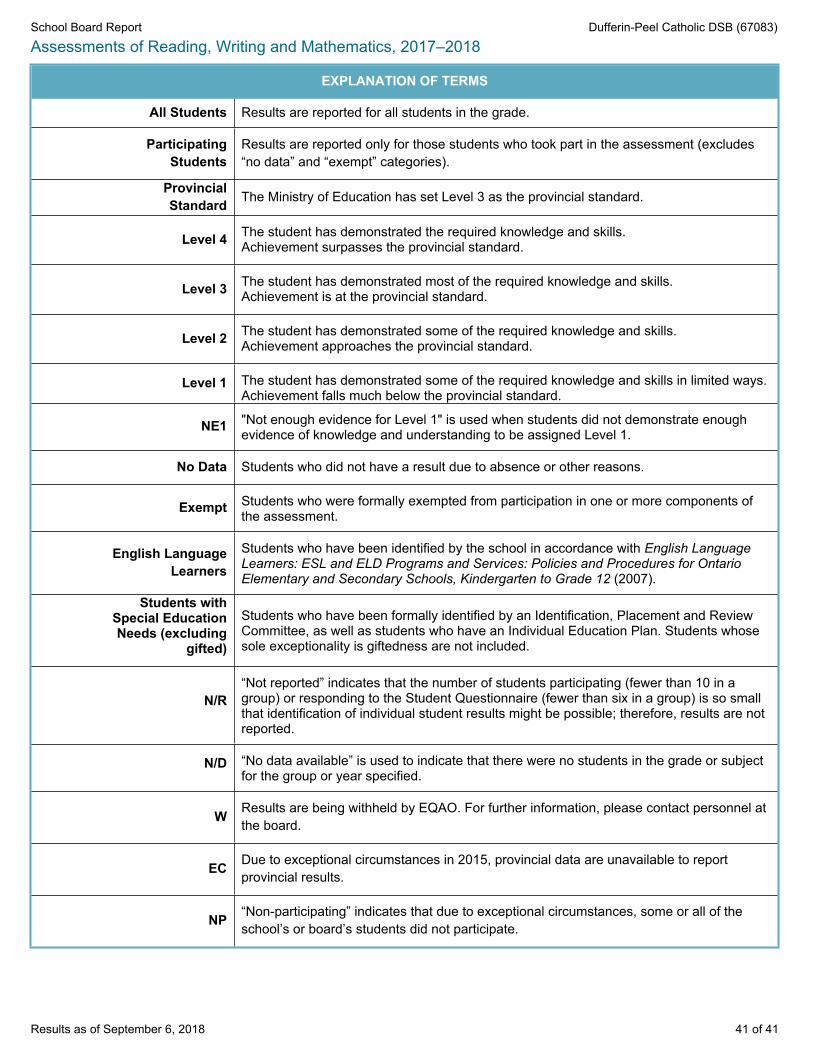
EXPLANATION OF TERMS
All Students Results are reported for all students in the grade.
ParticipatingStudents
Results are reported only for those students who took part in the assessment (excludes “no data” and “exempt” categories).
ProvincialStandard The Ministry of Education has set Level 3 as the provincial standard.
Level 4 The student has demonstrated the required knowledge and skills.Achievement surpasses the provincial standard.
Level 3 The student has demonstrated most of the required knowledge and skills.Achievement is at the provincial standard.
Level 2 The student has demonstrated some of the required knowledge and skills.Achievement approaches the provincial standard.
Level 1 The student has demonstrated some of the required knowledge and skills in limited ways. Achievement falls much below the provincial standard.
NE1 "Not enough evidence for Level 1" is used when students did not demonstrate enough evidence of knowledge and understanding to be assigned Level 1.
No Data Students who did not have a result due to absence or other reasons.
Exempt Students who were formally exempted from participation in one or more components of the assessment.
English LanguageLearners
Students who have been identified by the school in accordance with English Language Learners: ESL and ELD Programs and Services: Policies and Procedures for Ontario Elementary and Secondary Schools, Kindergarten to Grade 12 (2007).
Students withSpecial EducationNeeds (excluding
gifted)
Students who have been formally identified by an Identification, Placement and ReviewCommittee, as well as students who have an Individual Education Plan. Students whose sole exceptionality is giftedness are not included.
N/R“Not reported” indicates that the number of students participating (fewer than 10 in a group) or responding to the Student Questionnaire (fewer than six in a group) is so small that identification of individual student results might be possible; therefore, results are not reported.
N/D “No data available” is used to indicate that there were no students in the grade or subject for the group or year specified.
W Results are being withheld by EQAO. For further information, please contact personnel at the board.
EC Due to exceptional circumstances in 2015, provincial data are unavailable to report provincial results.
NP “Non-participating” indicates that due to exceptional circumstances, some or all of the school’s or board’s students did not participate.
Related Documents