ASSESSMENT OF GROUND WATER VULNERABILITY USING GIS-A CASE STUDY ON THIRUVANNAMALAI DISTRICT,TAMILNADU,INDIA Praveen Kumar.G * ,Kaviarasan.M,G.Rashmi, P.Geetha Remote Sensing and Wireless Sensor Networks Division, Centre for Excellence in Computational Engineering and Networking, Amrita Vishwa Vidyapeetham University,Coimbatore-641112. [email protected] Commission VI, WG VI/4 KEY WORDS: Water Quality,Groundwater contamination,Physico-chemical parameter, GIS,Thiruvannamalai,WHO ABSTRACT: Water is indispensable for sustaining life on earth. Millions of people lack access to clean water owing to geographical and anthro- pogenic factors. Ground water contamination has always been a reason of concern and it is very expensive and difficult to clean up. In a country like India where the population density and land use is high, ground water is highly prone to contamination. The consequences of contamination manifests as poisoning and diseases such as hepatitis and cancer. Hence an assessment and subse- quent action is needed.The present work is a survey of ground water samples in rural and urban location of Thiruvannamalai district in the state of Tamil Nadu, India. The physico-chemical parameters of water samples like pH, EC, Total Hardness, Ca, Mg, Na, K, sulphate,nitrate,Chloride are analyzed. A comparison of each parameter is performed with that of the standard permissible limit as recommended by World Health Organization (WHO). Our main objective is to determine the quality of ground water with the help of Geographical Information System (GIS) which gives the exact location of ground water contamination. 1. INTRODUCTION Water availability and its quality has a profound impact on the overall well being of people of a country and in its development. With the ever increasing demand for food production, industrial growth, population explosion a situation of unprecedented ex- ploitation and contamination of both surface and ground water prevails. Ground Water has an important role in meeting the wa- ter requirements of agriculture, industrial and domestic sectors in India. About 85 percent of India’s rural domestic water re- quirements, 50 percent of its urban water requirements and more than 50 percent of its irrigation requirements are being met from ground water resources (Dynamic Ground Water Resources of India, 2011). The ground water recharge is the amount of water that will percolate down to the water table. It greatly depends on rainfall, nature of soil, rocks etc. It has been recognized that the quality of ground water is of nearly equal importance to quantity. As greater development and use of ground water continues, com- bined with the reuse of water, quality suffers unless consideration is given to protecting it (Adhikary et al., n.d.). The Remote Sens- ing Technology and Geographical Information System (GIS) has enabled data collection and subsequent assessment possible even in the most inaccessible areas thus helping in effective study of ground water. GIS helps in creating geographical databases and thematic models of ground water depth, quality etc . Ground wa- ter contains a wide variety of dissolved inorganic chemical con- stituents in various concentrations resulting from chemical and biochemical interactions between water and geological materi- als. Inorganic contaminants include salinity, chloride, flouride, nitrate, iron and arsenic are important in determining the suitabil- ity of ground water for drinking purposes (Ground Water Qual- ity In Shallow Aquifers of India, 2010).Chemical composition of ground water is influenced not only by geographical factors like type of soil, rocks through which the water percolates but also by anthropogenic factors like use of chemical fertilizers, pesti- * Corresponding [email protected] cides, uncontrolled disposal of industrial wastes etc. In this pa- per, the ground water samples of Thiruvannamalai district, Tamil Nadu is analysed. The ground water level in this district has come down owing to erratic precipitation. Ground water quality of this district is analyzed by studying the physico-chemical parameters present, against the WHO standards. A case study is carried on the spatial assessment of ground water vulnerability of Thiruvan- namalai district using GIS. 1.1 Study Area Thiruvannamalai district of TamilNadu, India is well renowed for its cultural significance. It covers a distance of 6191km 2 and lies between 11 ◦ 55 0 and 13 ◦ 15 0 North latitude and 78 ◦ 20 0 to 79 ◦ 50 0 East longitude. The district is bounded by Vellore dis- trict on the north and west, by Villupuram district on the south, by Dharmapuri district on southwest and by Kanchipuram district on the east. The district has a population of 2,464,875 as per the 2011 census. Nearly 41 percent of the area is used for agriculture and dug wells are the major source of irrigation. The rivers Palar, Cheyyar and Ponnaiyar drain this district on a seasonal basis and it also forms a portion of the basins of Palar and Ponnaiyar. It has a tropical climate and gets rainfall of 601.80mm from the North East monsoon and about 485.90mm from the South West mon- soon. 2. METHODOLOGY GIS is a powerful tool for the integration of the spatial data with the attribute data along the ground truth. Topomaps of Thiru- vannamalai district were obtained from the Geological survey of India, Chennai. The maps are scanned and digitized followed by georeferencing of the map with digitization of boundaries using ARCGIS software. Then maps are traced out along the toposheets to create the spatial database of the taluks and blocks. Then the labelling is carried in blocks. Attribute database of the depth level

Welcome message from author
This document is posted to help you gain knowledge. Please leave a comment to let me know what you think about it! Share it to your friends and learn new things together.
Transcript
ASSESSMENT OF GROUND WATER VULNERABILITY USING GIS-A CASE STUDY ONTHIRUVANNAMALAI DISTRICT,TAMILNADU,INDIA
Praveen Kumar.G∗,Kaviarasan.M,G.Rashmi, P.Geetha
Remote Sensing and Wireless Sensor Networks Division,Centre for Excellence in Computational Engineering and Networking,
Amrita Vishwa Vidyapeetham University,[email protected]
Commission VI, WG VI/4
KEY WORDS: Water Quality,Groundwater contamination,Physico-chemical parameter, GIS,Thiruvannamalai,WHO
ABSTRACT:
Water is indispensable for sustaining life on earth. Millions of people lack access to clean water owing to geographical and anthro-pogenic factors. Ground water contamination has always been a reason of concern and it is very expensive and difficult to cleanup. In a country like India where the population density and land use is high, ground water is highly prone to contamination. Theconsequences of contamination manifests as poisoning and diseases such as hepatitis and cancer. Hence an assessment and subse-quent action is needed.The present work is a survey of ground water samples in rural and urban location of Thiruvannamalai districtin the state of Tamil Nadu, India. The physico-chemical parameters of water samples like pH, EC, Total Hardness, Ca, Mg, Na, K,sulphate,nitrate,Chloride are analyzed. A comparison of each parameter is performed with that of the standard permissible limit asrecommended by World Health Organization (WHO). Our main objective is to determine the quality of ground water with the help ofGeographical Information System (GIS) which gives the exact location of ground water contamination.
1. INTRODUCTION
Water availability and its quality has a profound impact on theoverall well being of people of a country and in its development.With the ever increasing demand for food production, industrialgrowth, population explosion a situation of unprecedented ex-ploitation and contamination of both surface and ground waterprevails. Ground Water has an important role in meeting the wa-ter requirements of agriculture, industrial and domestic sectorsin India. About 85 percent of India’s rural domestic water re-quirements, 50 percent of its urban water requirements and morethan 50 percent of its irrigation requirements are being met fromground water resources (Dynamic Ground Water Resources ofIndia, 2011). The ground water recharge is the amount of waterthat will percolate down to the water table. It greatly depends onrainfall, nature of soil, rocks etc. It has been recognized that thequality of ground water is of nearly equal importance to quantity.As greater development and use of ground water continues, com-bined with the reuse of water, quality suffers unless considerationis given to protecting it (Adhikary et al., n.d.). The Remote Sens-ing Technology and Geographical Information System (GIS) hasenabled data collection and subsequent assessment possible evenin the most inaccessible areas thus helping in effective study ofground water. GIS helps in creating geographical databases andthematic models of ground water depth, quality etc . Ground wa-ter contains a wide variety of dissolved inorganic chemical con-stituents in various concentrations resulting from chemical andbiochemical interactions between water and geological materi-als. Inorganic contaminants include salinity, chloride, flouride,nitrate, iron and arsenic are important in determining the suitabil-ity of ground water for drinking purposes (Ground Water Qual-ity In Shallow Aquifers of India, 2010).Chemical composition ofground water is influenced not only by geographical factors liketype of soil, rocks through which the water percolates but alsoby anthropogenic factors like use of chemical fertilizers, pesti-∗Corresponding [email protected]
cides, uncontrolled disposal of industrial wastes etc. In this pa-per, the ground water samples of Thiruvannamalai district, TamilNadu is analysed. The ground water level in this district has comedown owing to erratic precipitation. Ground water quality of thisdistrict is analyzed by studying the physico-chemical parameterspresent, against the WHO standards. A case study is carried onthe spatial assessment of ground water vulnerability of Thiruvan-namalai district using GIS.
1.1 Study Area
Thiruvannamalai district of TamilNadu, India is well renowed forits cultural significance. It covers a distance of 6191km2 andlies between 11◦55′ and 13◦15′ North latitude and 78◦20′ to79◦50′ East longitude. The district is bounded by Vellore dis-trict on the north and west, by Villupuram district on the south,by Dharmapuri district on southwest and by Kanchipuram districton the east. The district has a population of 2,464,875 as per the2011 census. Nearly 41 percent of the area is used for agricultureand dug wells are the major source of irrigation. The rivers Palar,Cheyyar and Ponnaiyar drain this district on a seasonal basis andit also forms a portion of the basins of Palar and Ponnaiyar. It hasa tropical climate and gets rainfall of 601.80mm from the NorthEast monsoon and about 485.90mm from the South West mon-soon.
2. METHODOLOGY
GIS is a powerful tool for the integration of the spatial data withthe attribute data along the ground truth. Topomaps of Thiru-vannamalai district were obtained from the Geological survey ofIndia, Chennai. The maps are scanned and digitized followed bygeoreferencing of the map with digitization of boundaries usingARCGIS software. Then maps are traced out along the toposheetsto create the spatial database of the taluks and blocks. Then thelabelling is carried in blocks. Attribute database of the depth level
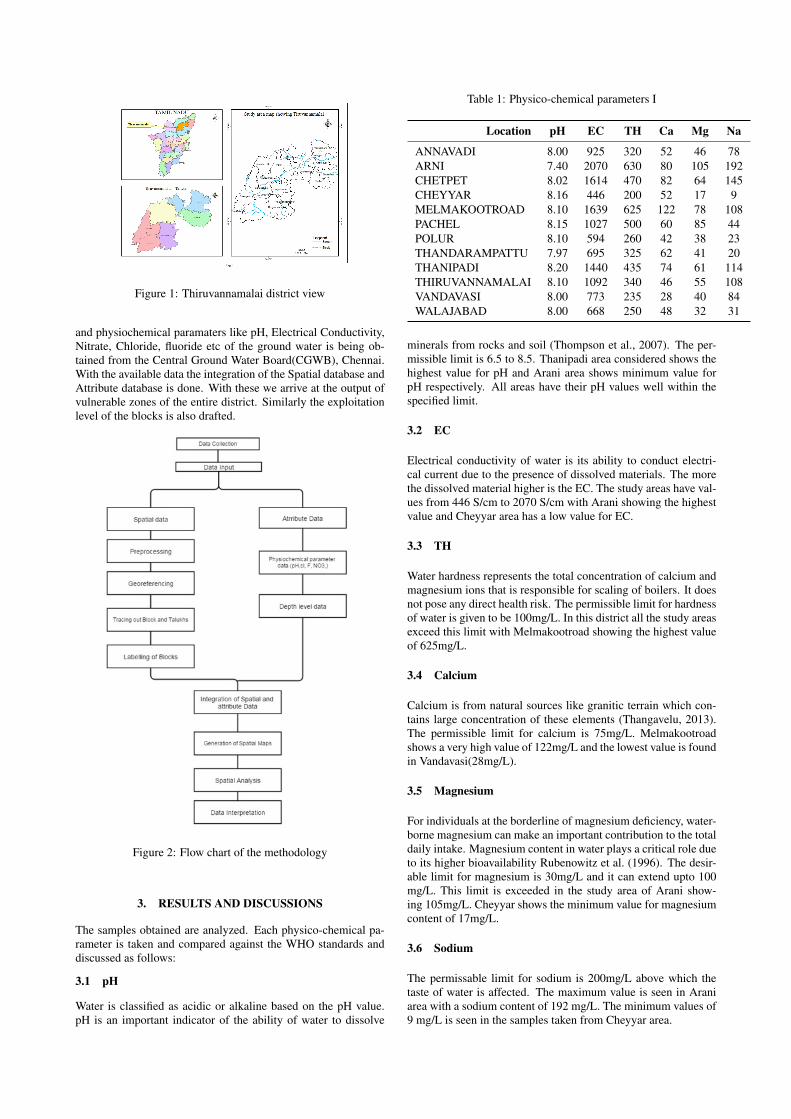
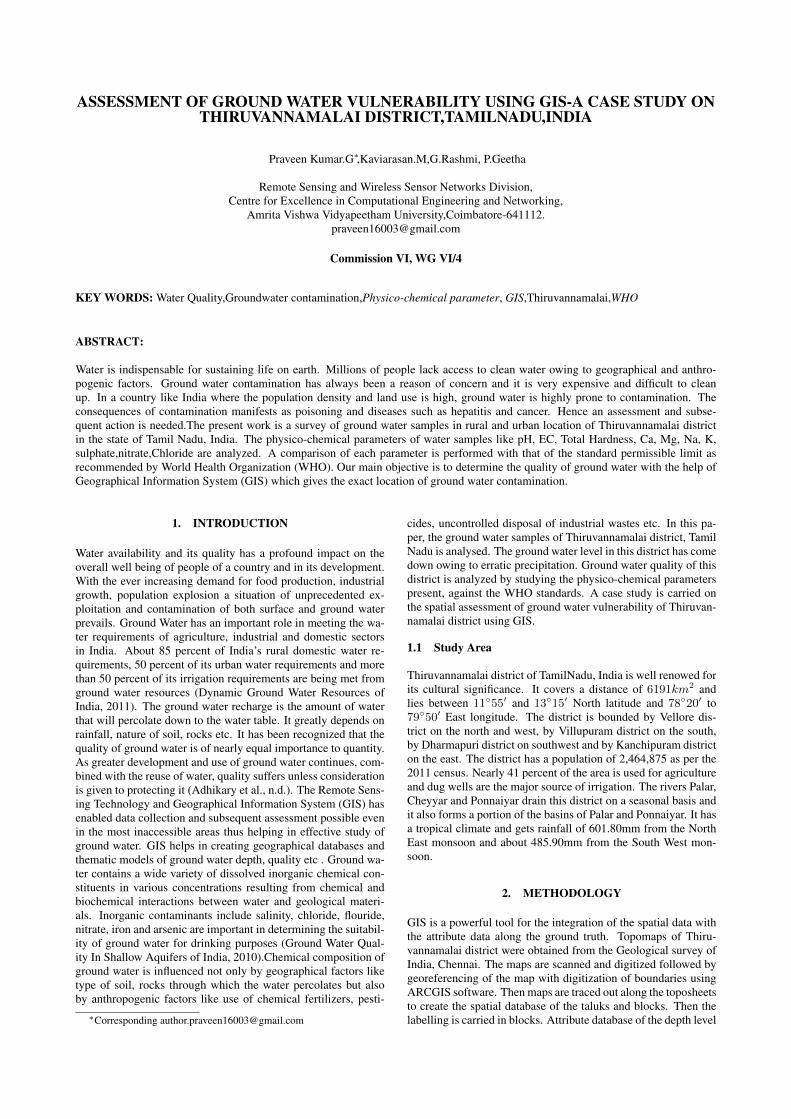
Figure 1: Thiruvannamalai district view
and physiochemical paramaters like pH, Electrical Conductivity,Nitrate, Chloride, fluoride etc of the ground water is being ob-tained from the Central Ground Water Board(CGWB), Chennai.With the available data the integration of the Spatial database andAttribute database is done. With these we arrive at the output ofvulnerable zones of the entire district. Similarly the exploitationlevel of the blocks is also drafted.
Figure 2: Flow chart of the methodology
3. RESULTS AND DISCUSSIONS
The samples obtained are analyzed. Each physico-chemical pa-rameter is taken and compared against the WHO standards anddiscussed as follows:
3.1 pH
Water is classified as acidic or alkaline based on the pH value.pH is an important indicator of the ability of water to dissolve
Table 1: Physico-chemical parameters I
Location pH EC TH Ca Mg Na
ANNAVADI 8.00 925 320 52 46 78ARNI 7.40 2070 630 80 105 192CHETPET 8.02 1614 470 82 64 145CHEYYAR 8.16 446 200 52 17 9MELMAKOOTROAD 8.10 1639 625 122 78 108PACHEL 8.15 1027 500 60 85 44POLUR 8.10 594 260 42 38 23THANDARAMPATTU 7.97 695 325 62 41 20THANIPADI 8.20 1440 435 74 61 114THIRUVANNAMALAI 8.10 1092 340 46 55 108VANDAVASI 8.00 773 235 28 40 84WALAJABAD 8.00 668 250 48 32 31
minerals from rocks and soil (Thompson et al., 2007). The per-missible limit is 6.5 to 8.5. Thanipadi area considered shows thehighest value for pH and Arani area shows minimum value forpH respectively. All areas have their pH values well within thespecified limit.
3.2 EC
Electrical conductivity of water is its ability to conduct electri-cal current due to the presence of dissolved materials. The morethe dissolved material higher is the EC. The study areas have val-ues from 446 S/cm to 2070 S/cm with Arani showing the highestvalue and Cheyyar area has a low value for EC.
3.3 TH
Water hardness represents the total concentration of calcium andmagnesium ions that is responsible for scaling of boilers. It doesnot pose any direct health risk. The permissible limit for hardnessof water is given to be 100mg/L. In this district all the study areasexceed this limit with Melmakootroad showing the highest valueof 625mg/L.
3.4 Calcium
Calcium is from natural sources like granitic terrain which con-tains large concentration of these elements (Thangavelu, 2013).The permissible limit for calcium is 75mg/L. Melmakootroadshows a very high value of 122mg/L and the lowest value is foundin Vandavasi(28mg/L).
3.5 Magnesium
For individuals at the borderline of magnesium deficiency, water-borne magnesium can make an important contribution to the totaldaily intake. Magnesium content in water plays a critical role dueto its higher bioavailability Rubenowitz et al. (1996). The desir-able limit for magnesium is 30mg/L and it can extend upto 100mg/L. This limit is exceeded in the study area of Arani show-ing 105mg/L. Cheyyar shows the minimum value for magnesiumcontent of 17mg/L.
3.6 Sodium
The permissable limit for sodium is 200mg/L above which thetaste of water is affected. The maximum value is seen in Araniarea with a sodium content of 192 mg/L. The minimum values of9 mg/L is seen in the samples taken from Cheyyar area.
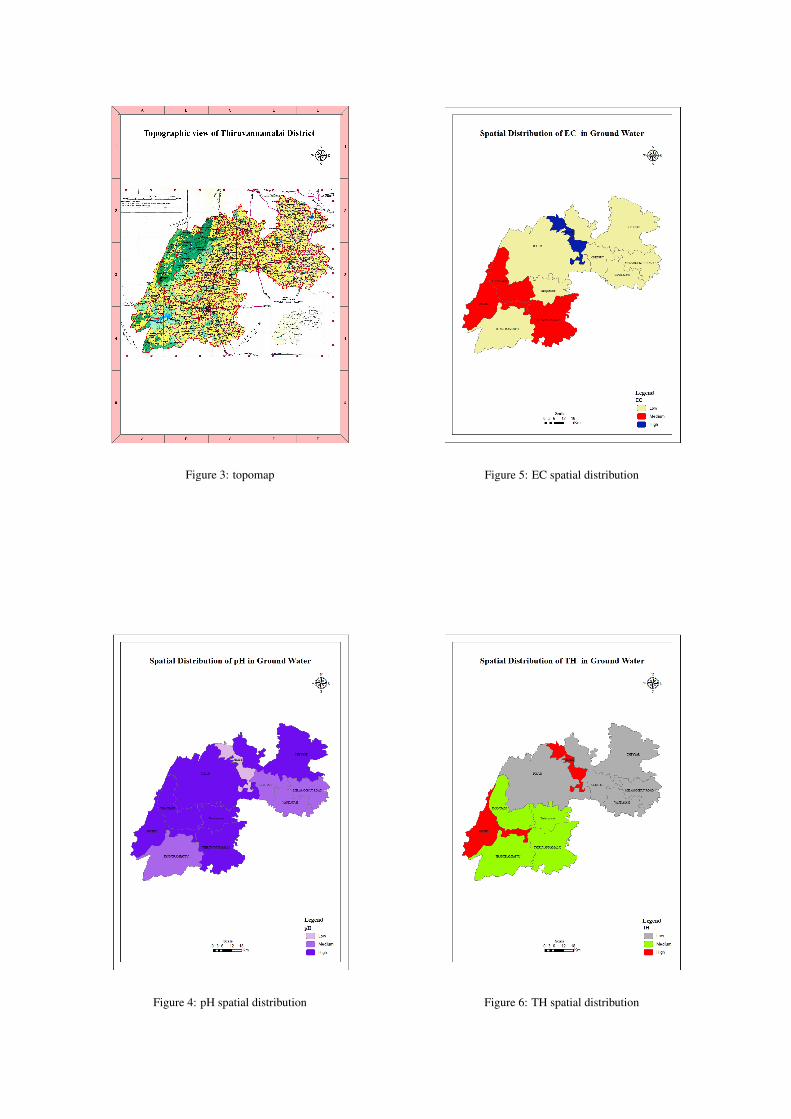
Figure 3: topomap
Figure 4: pH spatial distribution
Figure 5: EC spatial distribution
Figure 6: TH spatial distribution
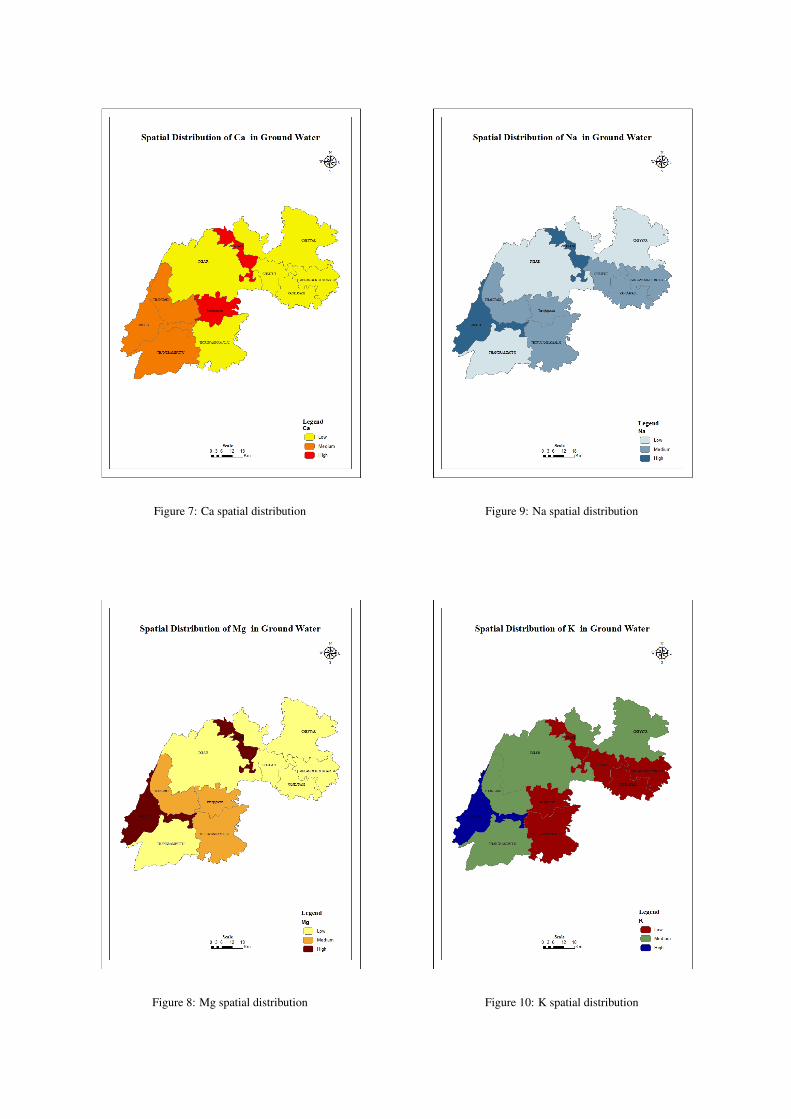
Figure 7: Ca spatial distribution
Figure 8: Mg spatial distribution
Figure 9: Na spatial distribution
Figure 10: K spatial distribution
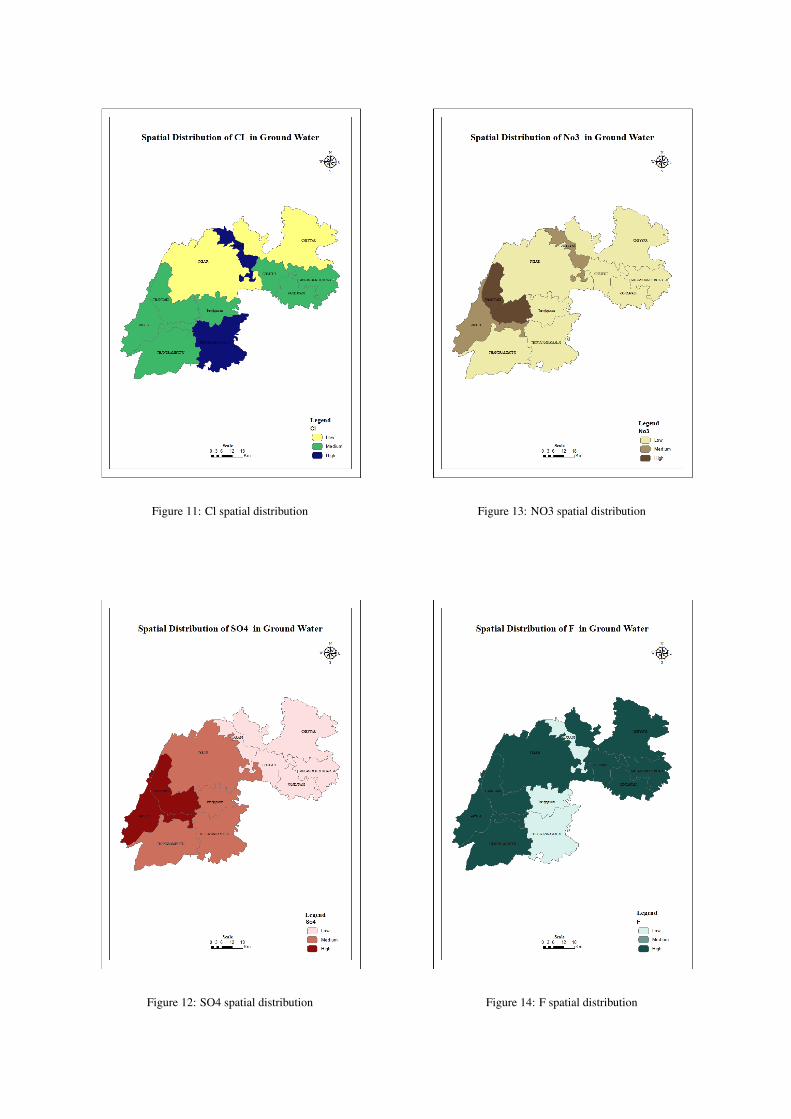
Figure 11: Cl spatial distribution
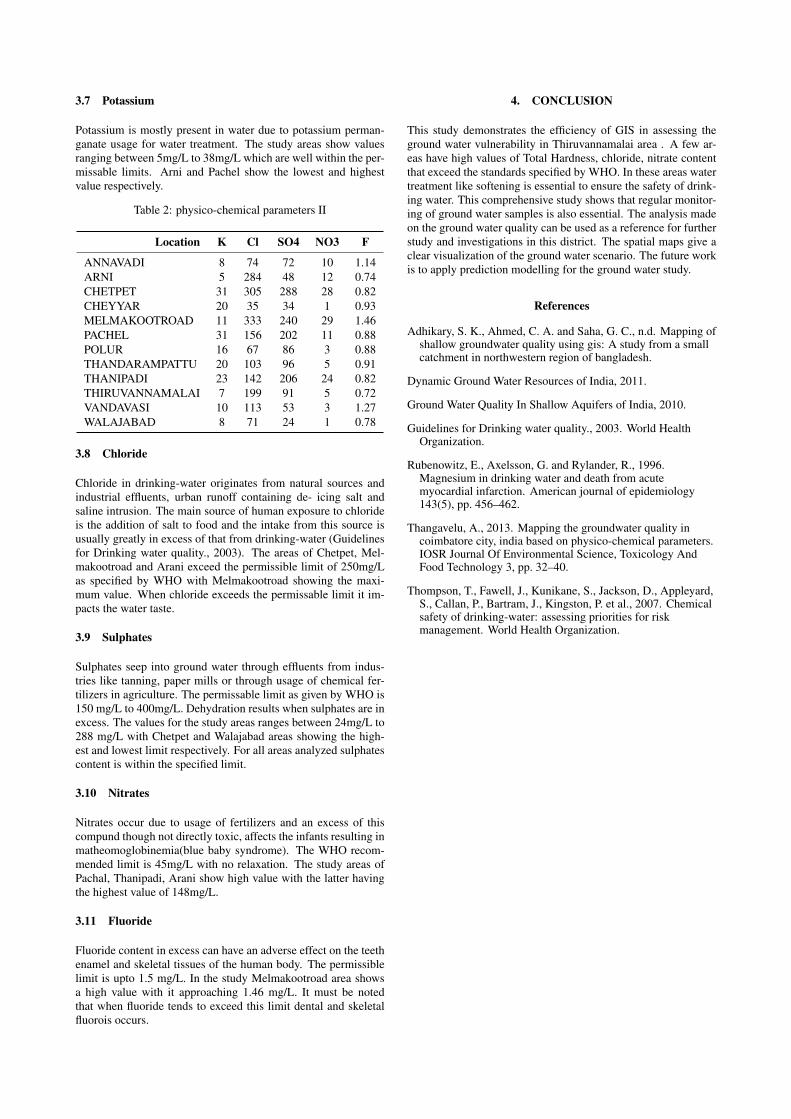
Figure 12: SO4 spatial distribution
Figure 13: NO3 spatial distribution
Figure 14: F spatial distribution
3.7 Potassium
Potassium is mostly present in water due to potassium perman-ganate usage for water treatment. The study areas show valuesranging between 5mg/L to 38mg/L which are well within the per-missable limits. Arni and Pachel show the lowest and highestvalue respectively.
Table 2: physico-chemical parameters II
Location K Cl SO4 NO3 F
ANNAVADI 8 74 72 10 1.14ARNI 5 284 48 12 0.74CHETPET 31 305 288 28 0.82CHEYYAR 20 35 34 1 0.93MELMAKOOTROAD 11 333 240 29 1.46PACHEL 31 156 202 11 0.88POLUR 16 67 86 3 0.88THANDARAMPATTU 20 103 96 5 0.91THANIPADI 23 142 206 24 0.82THIRUVANNAMALAI 7 199 91 5 0.72VANDAVASI 10 113 53 3 1.27WALAJABAD 8 71 24 1 0.78
3.8 Chloride
Chloride in drinking-water originates from natural sources andindustrial effluents, urban runoff containing de- icing salt andsaline intrusion. The main source of human exposure to chlorideis the addition of salt to food and the intake from this source isusually greatly in excess of that from drinking-water (Guidelinesfor Drinking water quality., 2003). The areas of Chetpet, Mel-makootroad and Arani exceed the permissible limit of 250mg/Las specified by WHO with Melmakootroad showing the maxi-mum value. When chloride exceeds the permissable limit it im-pacts the water taste.
3.9 Sulphates
Sulphates seep into ground water through effluents from indus-tries like tanning, paper mills or through usage of chemical fer-tilizers in agriculture. The permissable limit as given by WHO is150 mg/L to 400mg/L. Dehydration results when sulphates are inexcess. The values for the study areas ranges between 24mg/L to288 mg/L with Chetpet and Walajabad areas showing the high-est and lowest limit respectively. For all areas analyzed sulphatescontent is within the specified limit.
3.10 Nitrates
Nitrates occur due to usage of fertilizers and an excess of thiscompund though not directly toxic, affects the infants resulting inmatheomoglobinemia(blue baby syndrome). The WHO recom-mended limit is 45mg/L with no relaxation. The study areas ofPachal, Thanipadi, Arani show high value with the latter havingthe highest value of 148mg/L.
3.11 Fluoride
Fluoride content in excess can have an adverse effect on the teethenamel and skeletal tissues of the human body. The permissiblelimit is upto 1.5 mg/L. In the study Melmakootroad area showsa high value with it approaching 1.46 mg/L. It must be notedthat when fluoride tends to exceed this limit dental and skeletalfluorois occurs.
4. CONCLUSION
This study demonstrates the efficiency of GIS in assessing theground water vulnerability in Thiruvannamalai area . A few ar-eas have high values of Total Hardness, chloride, nitrate contentthat exceed the standards specified by WHO. In these areas watertreatment like softening is essential to ensure the safety of drink-ing water. This comprehensive study shows that regular monitor-ing of ground water samples is also essential. The analysis madeon the ground water quality can be used as a reference for furtherstudy and investigations in this district. The spatial maps give aclear visualization of the ground water scenario. The future workis to apply prediction modelling for the ground water study.
References
Adhikary, S. K., Ahmed, C. A. and Saha, G. C., n.d. Mapping ofshallow groundwater quality using gis: A study from a smallcatchment in northwestern region of bangladesh.
Dynamic Ground Water Resources of India, 2011.
Ground Water Quality In Shallow Aquifers of India, 2010.
Guidelines for Drinking water quality., 2003. World HealthOrganization.
Rubenowitz, E., Axelsson, G. and Rylander, R., 1996.Magnesium in drinking water and death from acutemyocardial infarction. American journal of epidemiology143(5), pp. 456–462.
Thangavelu, A., 2013. Mapping the groundwater quality incoimbatore city, india based on physico-chemical parameters.IOSR Journal Of Environmental Science, Toxicology AndFood Technology 3, pp. 32–40.
Thompson, T., Fawell, J., Kunikane, S., Jackson, D., Appleyard,S., Callan, P., Bartram, J., Kingston, P. et al., 2007. Chemicalsafety of drinking-water: assessing priorities for riskmanagement. World Health Organization.
Related Documents


