water Communication Assessment of Water Quality in Indo-Gangetic Plain of South-Eastern Asia under Organic vs. Conventional Rice Farming Debjani Sihi 1, * , † , Biswanath Dari 2, * , † , Zhengjuan Yan 3 , Dinesh Kumar Sharma 4 , Himanshu Pathak 4 , Om Prakash Sharma 5 and Lata Nain 6 1 Climate Change Science Institute and Environmental Sciences Division, Oak Ridge National Laboratory, 1 Bethel Valley Rd, Oak Ridge, TN 37830, USA 2 Department of Crop and Soil Science, Klamath Basin Research and Extension Center, Oregon State University, 6923 Washburn Way, Klamath Falls, OR 97603, USA 3 School of Chemical Engineering, Sichuan University, No. 24 South Section 1, Yihuan Road, Chengdu 610065, China; [email protected] 4 Division of Environmental Sciences, Indian Agricultural Research Institute, New Delhi 110012, India; dks_env@rediffmail.com (D.K.S.); [email protected] (H.P.) 5 National Centre of Integrated Pest Management, New Delhi 110012, India; [email protected] 6 Division of Microbiology, Indian Agricultural Research Institute, New Delhi 110012, India; [email protected] * Correspondence: [email protected] (D.S.); [email protected] (B.D.); Tel.: +1-352-222-5655 (D.S.); +1-352-222-9565 (B.D.) † These two authors have contributed equally in every aspect of this article. Therefore they both are leading/first authors. Received: 1 March 2020; Accepted: 24 March 2020; Published: 28 March 2020 Abstract: Water contamination is often reported in agriculturally intensive areas such as the Indo-Gangetic Plain (IGP) in south-eastern Asia. We evaluated the impact of the organic and conventional farming of basmati rice on water quality during the rainy season (July to October) of 2011 and 2016 at Kaithal, Haryana, India. The study area comprised seven organic and seven conventional fields where organic farming has been practiced for more than two decades. Water quality parameters used for drinking (nitrate, NO 3 ; total dissolved solids (TDS); electrical conductivity (EC) pH) and irrigation (sodium adsorption ratio (SAR) and residual sodium carbonate (RSC)) purposes were below permissible limits for all samples collected from organic fields and those from conventional fields over the long-term (~15 and ~20 years). Importantly, the magnitude of water NO 3 contamination in conventional fields was approximately double that of organic fields, which is quite alarming and needs attention in future for farming practices in the IGP in south-eastern Asia. Keywords: water quality; conventional farming; organic farming; nitrate; residual sodium carbonate; sodium adsorption ratio; total dissolved solids 1. Introduction The enormous rate of agricultural production required to feed the burgeoning population in India (and other parts of south-eastern Asia) needs a constant supply of irrigation water. One such reliable source of irrigation is well water (~borewell water) in the Indo-Gangetic Plain (IGP), India, where deep wells extract water from the underlying aquifer [1]. The global importance of well water for both irrigation and drinking purposes in south-eastern Asia is obvious, but its deteriorating quality has become a serious decadal concern in IGP for intensive agriculture operations [2,3]. Basmati rice is an Water 2020, 12, 960; doi:10.3390/w12040960 www.mdpi.com/journal/water

Welcome message from author
This document is posted to help you gain knowledge. Please leave a comment to let me know what you think about it! Share it to your friends and learn new things together.
Transcript

water
Communication
Assessment of Water Quality in Indo-Gangetic Plainof South-Eastern Asia under Organic vs.Conventional Rice Farming
Debjani Sihi 1,*,† , Biswanath Dari 2,*,† , Zhengjuan Yan 3, Dinesh Kumar Sharma 4,Himanshu Pathak 4, Om Prakash Sharma 5 and Lata Nain 6
1 Climate Change Science Institute and Environmental Sciences Division, Oak Ridge National Laboratory,1 Bethel Valley Rd, Oak Ridge, TN 37830, USA
2 Department of Crop and Soil Science, Klamath Basin Research and Extension Center, Oregon StateUniversity, 6923 Washburn Way, Klamath Falls, OR 97603, USA
3 School of Chemical Engineering, Sichuan University, No. 24 South Section 1, Yihuan Road,Chengdu 610065, China; [email protected]
4 Division of Environmental Sciences, Indian Agricultural Research Institute, New Delhi 110012, India;[email protected] (D.K.S.); [email protected] (H.P.)
5 National Centre of Integrated Pest Management, New Delhi 110012, India; [email protected] Division of Microbiology, Indian Agricultural Research Institute, New Delhi 110012, India;
[email protected]* Correspondence: [email protected] (D.S.); [email protected] (B.D.); Tel.: +1-352-222-5655 (D.S.);
+1-352-222-9565 (B.D.)† These two authors have contributed equally in every aspect of this article. Therefore they both are
leading/first authors.
Received: 1 March 2020; Accepted: 24 March 2020; Published: 28 March 2020�����������������
Abstract: Water contamination is often reported in agriculturally intensive areas such as theIndo-Gangetic Plain (IGP) in south-eastern Asia. We evaluated the impact of the organic andconventional farming of basmati rice on water quality during the rainy season (July to October) of 2011and 2016 at Kaithal, Haryana, India. The study area comprised seven organic and seven conventionalfields where organic farming has been practiced for more than two decades. Water quality parametersused for drinking (nitrate, NO3; total dissolved solids (TDS); electrical conductivity (EC) pH) andirrigation (sodium adsorption ratio (SAR) and residual sodium carbonate (RSC)) purposes were belowpermissible limits for all samples collected from organic fields and those from conventional fieldsover the long-term (~15 and ~20 years). Importantly, the magnitude of water NO3 contamination inconventional fields was approximately double that of organic fields, which is quite alarming andneeds attention in future for farming practices in the IGP in south-eastern Asia.
Keywords: water quality; conventional farming; organic farming; nitrate; residual sodium carbonate;sodium adsorption ratio; total dissolved solids
1. Introduction
The enormous rate of agricultural production required to feed the burgeoning population in India(and other parts of south-eastern Asia) needs a constant supply of irrigation water. One such reliablesource of irrigation is well water (~borewell water) in the Indo-Gangetic Plain (IGP), India, wheredeep wells extract water from the underlying aquifer [1]. The global importance of well water for bothirrigation and drinking purposes in south-eastern Asia is obvious, but its deteriorating quality hasbecome a serious decadal concern in IGP for intensive agriculture operations [2,3]. Basmati rice is an
Water 2020, 12, 960; doi:10.3390/w12040960 www.mdpi.com/journal/water
Water 2020, 12, 960 2 of 9
important commodity for the Indian economy related to the export business, and reports are limited tothe effects of basmati rice cultivation on groundwater quality.
Nitrate (NO3) concentrations exceeding the permissible limits in well water due to agriculturalmanagement practices (e.g., fertilizer/manure application, irrigation etc.) have been reportedthroughout the world including the United States [4], Europe [5], Australia [6], China [7], Germany [8]and France [9]. Other than well water nitrates, pH, electrical conductivity (EC), and total dissolvedsolids (TDS) (i.e., factors directly related to dissolved mineral matter) are other useful indicators of wellwater quality for drinking purposes due to their close association with human health problems [1]. Theassessment of well water quality for irrigation purposes is usually achieved by using indices includingthe sodium adsorption ratio (SAR) and residual sodium carbonate (RSC), which are calculated usingthe concentrations of various nutrients such as carbonate (CO3
2−), bicarbonate (HCO3−), calcium
(Ca2+), magnesium (Mg2+), and sodium (Na+) in well water [1].The simultaneous evaluation of the long-term (~15–20 years) effects of farming practices (organic
vs. conventional) on well water quality parameters has still seldom been practiced. To that end, wefocused on assessing water quality parameters, for both drinking (NO3
−, pH, EC, TDS) and irrigation(SAR, RSC) purposes, under long-term organic vs. conventional practices of basmati rice in theIndo-Gangetic Plain (IGP)—the bread basket of south-eastern Asia. We have assessed these well waterquality parameters with the hypothesis that well water pollution will be higher in conventional farmingsystems than in organic farming systems under long-term (~15 and ~20 years) cultivation practices.
2. Materials and Methods
2.1. Site Description and Well Water Samples Collection
The study area is situated in Kaithal, Haryana, India (Table S1 and Figure S1). Seven farmers’fields, from both organic and conventional basmati rice systems, were chosen for comparative analysiswith farmers’ participation during the Kharif (or rainy) season (July to October) of 2011 [10,11] and2016 (unpublished data) (see Appendix A for details). The well water samples were collected at theend of the growing season after 15 (2011) and 20 (2016) years of rice cultivation in both systems (seeAppendix B for details). All samples were collected and preserved following the operating procedurefor well water sampling [12]. Well water samples were collected at each site from the wells or bore well(or tube wells) with depths ranging from approximately 28.7 to 89.3 m. Details of study sites, farmingpractices and sample collection are described in the Appendix section (as Supplementary Materials).
2.2. Analysis of Well Water Samples
Well water quality parameters for drinking purposes were measured following the standardmethods used by the American Public Health Association and American Water Works Association [13].Well water pH and EC were measured using a pH and EC meter following the standard method ofwater sample analysis [14]. TDS was measured following the procedure in [15]. Nitrate was measuredusing salicylic acid nitration methods [16]. RSC and SAR were calculated following the methoddescribed in [14].
2.3. Statistical Analysis
The effects of farming practices on well water quality parameters were determined based on thecompletely randomized design using an analysis of variance (ANOVA) in JMP Pro 14.0 [17]. The yearwas treated as a random factor. Tukey’s test was used to perform post-hoc multiple comparisons. Allstatistical analyses were conducted at a 5% level of significance.
Water 2020, 12, 960 3 of 9
3. Results and Discussion
3.1. Evaluation of Well Water Quality Parameters for Drinking Purposes
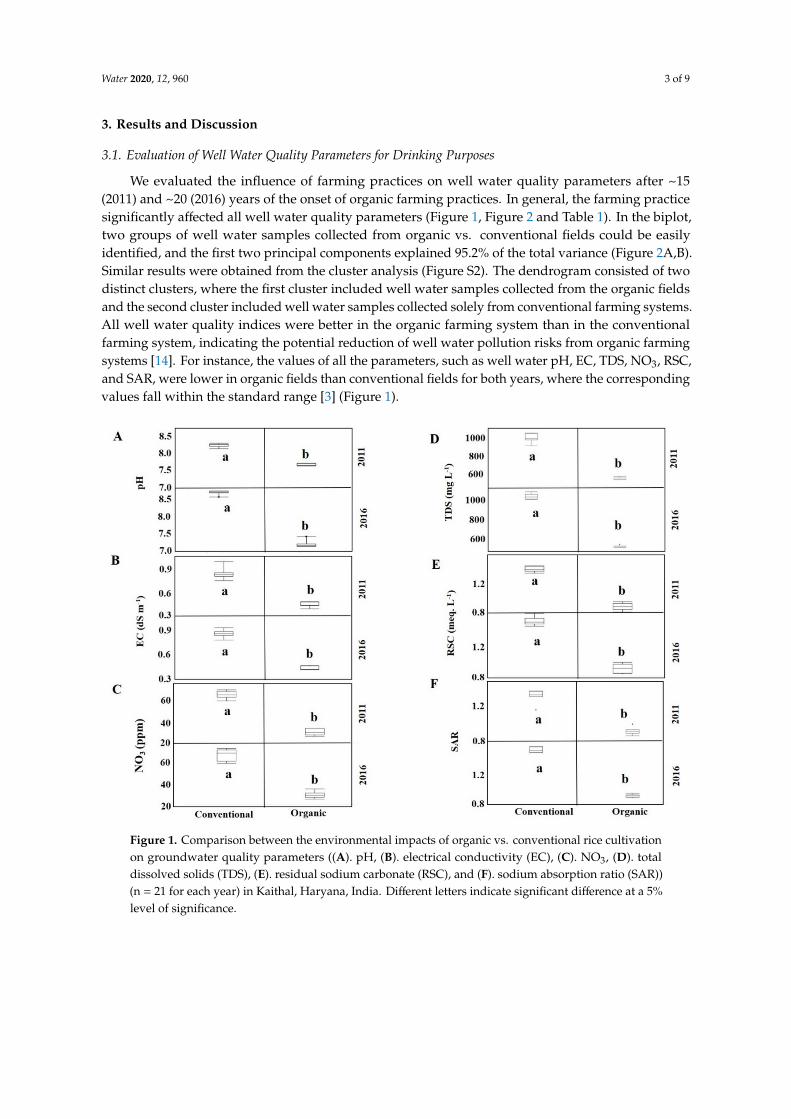
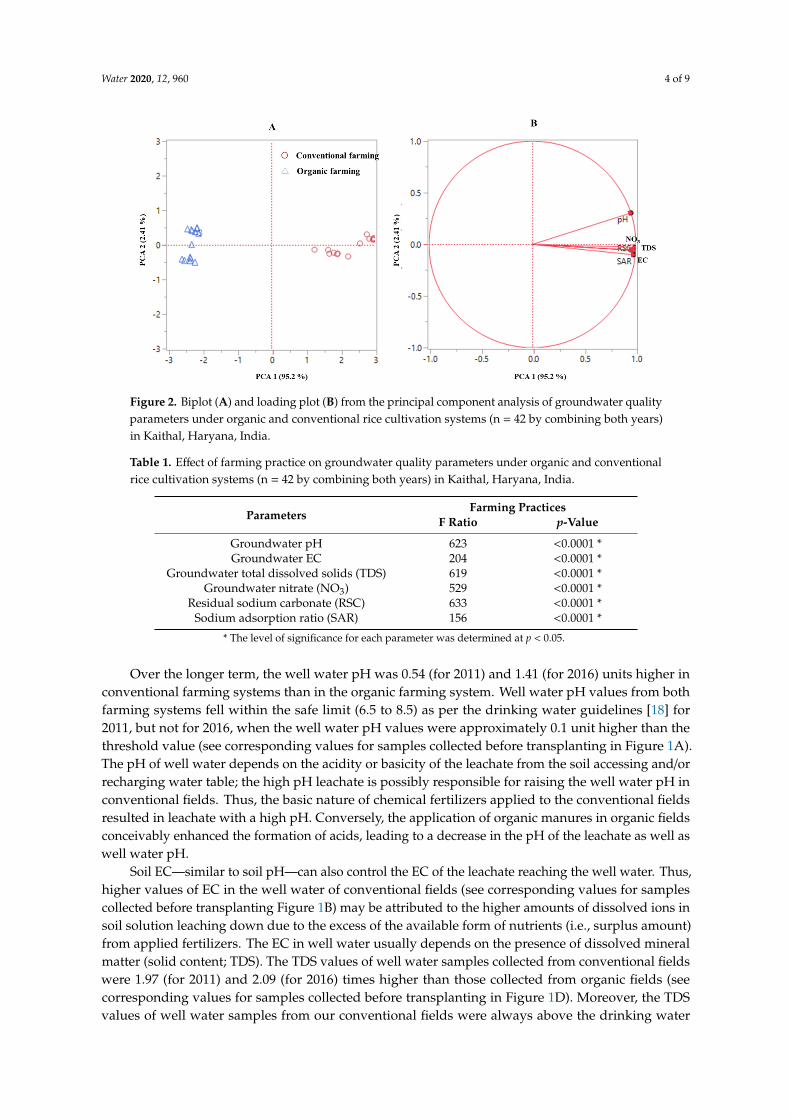
We evaluated the influence of farming practices on well water quality parameters after ~15(2011) and ~20 (2016) years of the onset of organic farming practices. In general, the farming practicesignificantly affected all well water quality parameters (Figure 1, Figure 2 and Table 1). In the biplot,two groups of well water samples collected from organic vs. conventional fields could be easilyidentified, and the first two principal components explained 95.2% of the total variance (Figure 2A,B).Similar results were obtained from the cluster analysis (Figure S2). The dendrogram consisted of twodistinct clusters, where the first cluster included well water samples collected from the organic fieldsand the second cluster included well water samples collected solely from conventional farming systems.All well water quality indices were better in the organic farming system than in the conventionalfarming system, indicating the potential reduction of well water pollution risks from organic farmingsystems [14]. For instance, the values of all the parameters, such as well water pH, EC, TDS, NO3, RSC,and SAR, were lower in organic fields than conventional fields for both years, where the correspondingvalues fall within the standard range [3] (Figure 1).
Water 2020, 12, x FOR PEER REVIEW 3 of 9
We evaluated the influence of farming practices on well water quality parameters after ~15 (2011) and ~20 (2016) years of the onset of organic farming practices. In general, the farming practice significantly affected all well water quality parameters (Figure 1, Figure 2 and Table 1). In the biplot, two groups of well water samples collected from organic vs. conventional fields could be easily identified, and the first two principal components explained 95.2% of the total variance (Figures 2A,2B). Similar results were obtained from the cluster analysis (Figure S2). The dendrogram consisted of two distinct clusters, where the first cluster included well water samples collected from the organic fields and the second cluster included well water samples collected solely from conventional farming systems. All well water quality indices were better in the organic farming system than in the conventional farming system, indicating the potential reduction of well water pollution risks from organic farming systems [14]. For instance, the values of all the parameters, such as well water pH, EC, TDS, NO3, RSC, and SAR, were lower in organic fields than conventional fields for both years, where the corresponding values fall within the standard range [3] (Figure 1).
Figure 1. Comparison between the environmental impacts of organic vs. conventional rice cultivation on groundwater quality parameters (A. pH, B. electrical conductivity (EC), C. NO3, D. total dissolved solids (TDS), E. residual sodium carbonate (RSC), and F. sodium absorption ratio (SAR)) (n = 21 for each year) in Kaithal, Haryana, India. Different letters indicate significant difference at a 5% level of significance.
Figure 1. Comparison between the environmental impacts of organic vs. conventional rice cultivationon groundwater quality parameters ((A). pH, (B). electrical conductivity (EC), (C). NO3, (D). totaldissolved solids (TDS), (E). residual sodium carbonate (RSC), and (F). sodium absorption ratio (SAR))(n = 21 for each year) in Kaithal, Haryana, India. Different letters indicate significant difference at a 5%level of significance.
Water 2020, 12, 960 4 of 9Water 2020, 12, x FOR PEER REVIEW 4 of 9
Figure 2. Biplot (A) and loading plot (B) from the principal component analysis of groundwater quality parameters under organic and conventional rice cultivation systems (n = 42 by combining both years) in Kaithal, Haryana, India.
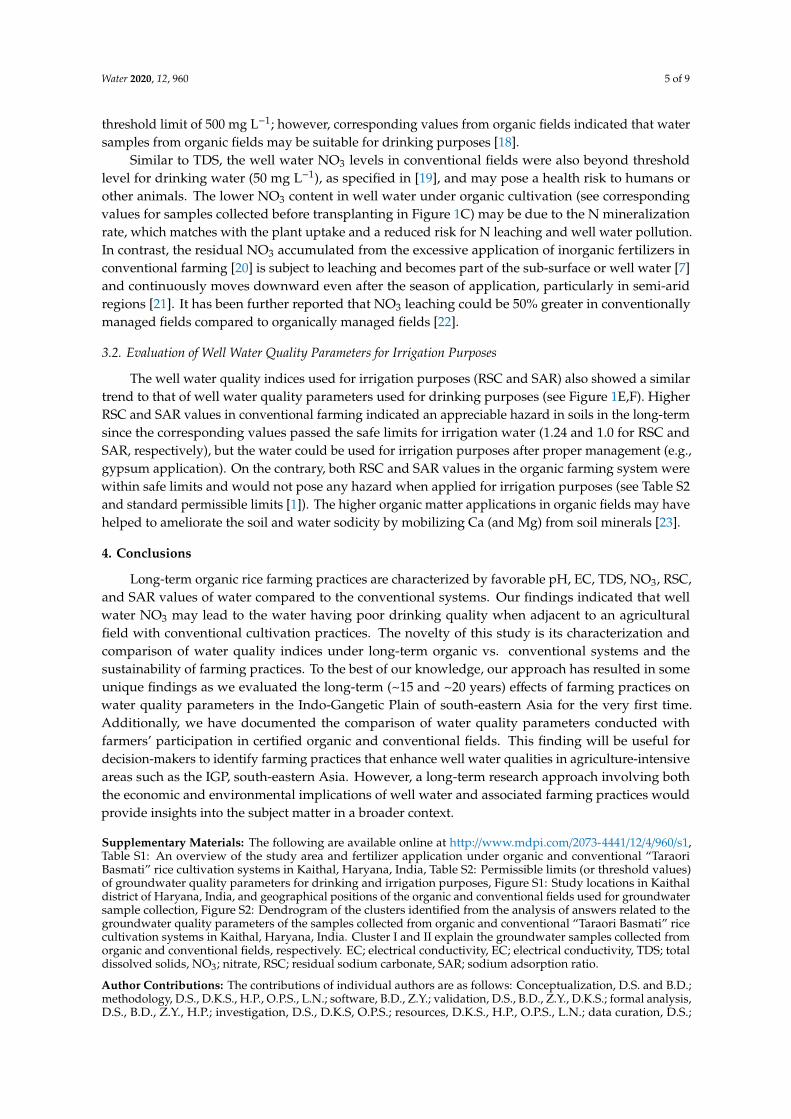
Table 1. Effect of farming practice on groundwater quality parameters under organic and conventional rice cultivation systems (n = 42 by combining both years) in Kaithal, Haryana, India.
Parameters Farming Practices
F Ratio p-value Groundwater pH 623 <0.0001 * Groundwater EC 204 <0.0001 *
Groundwater total dissolved solids (TDS) 619 <0.0001 * Groundwater nitrate (NO3) 529 <0.0001 *
Residual sodium carbonate (RSC) 633 <0.0001 * Sodium adsorption ratio (SAR) 156 <0.0001 *
* The level of significance for each parameter was determined at p < 0.05.
Over the longer term, the well water pH was 0.54 (for 2011) and 1.41 (for 2016) units higher in conventional farming systems than in the organic farming system. Well water pH values from both farming systems fell within the safe limit (6.5 to 8.5) as per the drinking water guidelines [18] for 2011, but not for 2016, when the well water pH values were approximately 0.1 unit higher than the threshold value (see corresponding values for samples collected before transplanting in Figure 1A). The pH of well water depends on the acidity or basicity of the leachate from the soil accessing and/or recharging water table; the high pH leachate is possibly responsible for raising the well water pH in conventional fields. Thus, the basic nature of chemical fertilizers applied to the conventional fields resulted in leachate with a high pH. Conversely, the application of organic manures in organic fields conceivably enhanced the formation of acids, leading to a decrease in the pH of the leachate as well as well water pH.
Soil EC—similar to soil pH—can also control the EC of the leachate reaching the well water. Thus, higher values of EC in the well water of conventional fields (see corresponding values for samples collected before transplanting Figure 1B) may be attributed to the higher amounts of dissolved ions in soil solution leaching down due to the excess of the available form of nutrients (i.e., surplus amount) from applied fertilizers. The EC in well water usually depends on the presence of dissolved mineral matter (solid content; TDS). The TDS values of well water samples collected from conventional fields were 1.97 (for 2011) and 2.09 (for 2016) times higher than those collected from organic fields (see corresponding values for samples collected before transplanting in Figure 1D).
Figure 2. Biplot (A) and loading plot (B) from the principal component analysis of groundwater qualityparameters under organic and conventional rice cultivation systems (n = 42 by combining both years)in Kaithal, Haryana, India.
Table 1. Effect of farming practice on groundwater quality parameters under organic and conventionalrice cultivation systems (n = 42 by combining both years) in Kaithal, Haryana, India.
ParametersFarming Practices
F Ratio p-Value
Groundwater pH 623 <0.0001 *Groundwater EC 204 <0.0001 *
Groundwater total dissolved solids (TDS) 619 <0.0001 *Groundwater nitrate (NO3) 529 <0.0001 *
Residual sodium carbonate (RSC) 633 <0.0001 *Sodium adsorption ratio (SAR) 156 <0.0001 *
* The level of significance for each parameter was determined at p < 0.05.
Over the longer term, the well water pH was 0.54 (for 2011) and 1.41 (for 2016) units higher inconventional farming systems than in the organic farming system. Well water pH values from bothfarming systems fell within the safe limit (6.5 to 8.5) as per the drinking water guidelines [18] for2011, but not for 2016, when the well water pH values were approximately 0.1 unit higher than thethreshold value (see corresponding values for samples collected before transplanting in Figure 1A).The pH of well water depends on the acidity or basicity of the leachate from the soil accessing and/orrecharging water table; the high pH leachate is possibly responsible for raising the well water pH inconventional fields. Thus, the basic nature of chemical fertilizers applied to the conventional fieldsresulted in leachate with a high pH. Conversely, the application of organic manures in organic fieldsconceivably enhanced the formation of acids, leading to a decrease in the pH of the leachate as well aswell water pH.
Soil EC—similar to soil pH—can also control the EC of the leachate reaching the well water. Thus,higher values of EC in the well water of conventional fields (see corresponding values for samplescollected before transplanting Figure 1B) may be attributed to the higher amounts of dissolved ions insoil solution leaching down due to the excess of the available form of nutrients (i.e., surplus amount)from applied fertilizers. The EC in well water usually depends on the presence of dissolved mineralmatter (solid content; TDS). The TDS values of well water samples collected from conventional fieldswere 1.97 (for 2011) and 2.09 (for 2016) times higher than those collected from organic fields (seecorresponding values for samples collected before transplanting in Figure 1D). Moreover, the TDSvalues of well water samples from our conventional fields were always above the drinking water
Water 2020, 12, 960 5 of 9
threshold limit of 500 mg L−1; however, corresponding values from organic fields indicated that watersamples from organic fields may be suitable for drinking purposes [18].
Similar to TDS, the well water NO3 levels in conventional fields were also beyond thresholdlevel for drinking water (50 mg L−1), as specified in [19], and may pose a health risk to humans orother animals. The lower NO3 content in well water under organic cultivation (see correspondingvalues for samples collected before transplanting in Figure 1C) may be due to the N mineralizationrate, which matches with the plant uptake and a reduced risk for N leaching and well water pollution.In contrast, the residual NO3 accumulated from the excessive application of inorganic fertilizers inconventional farming [20] is subject to leaching and becomes part of the sub-surface or well water [7]and continuously moves downward even after the season of application, particularly in semi-aridregions [21]. It has been further reported that NO3 leaching could be 50% greater in conventionallymanaged fields compared to organically managed fields [22].
3.2. Evaluation of Well Water Quality Parameters for Irrigation Purposes
The well water quality indices used for irrigation purposes (RSC and SAR) also showed a similartrend to that of well water quality parameters used for drinking purposes (see Figure 1E,F). HigherRSC and SAR values in conventional farming indicated an appreciable hazard in soils in the long-termsince the corresponding values passed the safe limits for irrigation water (1.24 and 1.0 for RSC andSAR, respectively), but the water could be used for irrigation purposes after proper management (e.g.,gypsum application). On the contrary, both RSC and SAR values in the organic farming system werewithin safe limits and would not pose any hazard when applied for irrigation purposes (see Table S2and standard permissible limits [1]). The higher organic matter applications in organic fields may havehelped to ameliorate the soil and water sodicity by mobilizing Ca (and Mg) from soil minerals [23].
4. Conclusions
Long-term organic rice farming practices are characterized by favorable pH, EC, TDS, NO3, RSC,and SAR values of water compared to the conventional systems. Our findings indicated that wellwater NO3 may lead to the water having poor drinking quality when adjacent to an agriculturalfield with conventional cultivation practices. The novelty of this study is its characterization andcomparison of water quality indices under long-term organic vs. conventional systems and thesustainability of farming practices. To the best of our knowledge, our approach has resulted in someunique findings as we evaluated the long-term (~15 and ~20 years) effects of farming practices onwater quality parameters in the Indo-Gangetic Plain of south-eastern Asia for the very first time.Additionally, we have documented the comparison of water quality parameters conducted withfarmers’ participation in certified organic and conventional fields. This finding will be useful fordecision-makers to identify farming practices that enhance well water qualities in agriculture-intensiveareas such as the IGP, south-eastern Asia. However, a long-term research approach involving boththe economic and environmental implications of well water and associated farming practices wouldprovide insights into the subject matter in a broader context.
Supplementary Materials: The following are available online at http://www.mdpi.com/2073-4441/12/4/960/s1,Table S1: An overview of the study area and fertilizer application under organic and conventional “TaraoriBasmati” rice cultivation systems in Kaithal, Haryana, India, Table S2: Permissible limits (or threshold values)of groundwater quality parameters for drinking and irrigation purposes, Figure S1: Study locations in Kaithaldistrict of Haryana, India, and geographical positions of the organic and conventional fields used for groundwatersample collection, Figure S2: Dendrogram of the clusters identified from the analysis of answers related to thegroundwater quality parameters of the samples collected from organic and conventional “Taraori Basmati” ricecultivation systems in Kaithal, Haryana, India. Cluster I and II explain the groundwater samples collected fromorganic and conventional fields, respectively. EC; electrical conductivity, EC; electrical conductivity, TDS; totaldissolved solids, NO3; nitrate, RSC; residual sodium carbonate, SAR; sodium adsorption ratio.
Author Contributions: The contributions of individual authors are as follows: Conceptualization, D.S. and B.D.;methodology, D.S., D.K.S., H.P., O.P.S., L.N.; software, B.D., Z.Y.; validation, D.S., B.D., Z.Y., D.K.S.; formal analysis,D.S., B.D., Z.Y., H.P.; investigation, D.S., D.K.S, O.P.S.; resources, D.K.S., H.P., O.P.S., L.N.; data curation, D.S.;

Water 2020, 12, 960 6 of 9
writing—original draft preparation, D.S., B.D., Z.Y.; writing—review and editing, D.S., B.D., Z.Y., D.K.S., H.P.,O.P.S., L.N.; visualization, D.S., B.D., Z.Y., supervision, D.K.S, H.P.; project administration, D.K.S., H.P., fundingacquisition, D.S., D.K.S. All authors have read and agreed to the published version of the manuscript.
Funding: This research received no external funding.
Acknowledgments: The author wish to thank the Junior Research Fellowship (JRF) program of the Indian Councilof Agricultural Research (ICAR) and Sushmita Munda, Totan Adak, and all fourteen farmers for the support ofthis study.
Conflicts of Interest: The authors declare no conflict of interest. The funders had no role in the design of thestudy; in the collection, analyses, or interpretation of data; in the writing of the manuscript, or in the decision topublish the results.
Appendix A
Site Description and Details of Organic Farming Practices and Related Management PracticesOrganic farming practices have been conducted in partnership with Agrocel Pvt. Ltd., a private
company certified by SKAL (also known as the Control Union certification, which is accredited toAPEDA, Agricultural and Processed Food Products Export Development Authority) since late 1990’s inKaithal (Haryana, India). This company is the second largest organic rice exporter of India and mainlyfocused on Taraori Basmati Rice (i.e., CSR-30 or Yamini). The certified farming practices under contractorganic farming have been conducted since last 15 years with the same partnership in Kaithal area andwas recognized by FLO and Fair-Trade in 2007. Originally, the activities were developed in parallelstrategies with IFOAM (International Federation of Organic Agriculture Movements) under farmers’participatory mode. Currently, 5750 ha land has been included in this contract organic farming with apublic-private partnership.
A tropical steppe, semi-arid and hot climate usually prevails in the Kaithal district in Haryana,India (study area). The average annual precipitation and temperature of the region are 568 mm and24.6 ◦C, respectively. The soils of study region can generally be categorized as sandy to sandy loam,marginally fertile, and named as Sierozem soil (under major zonal soil classification system in India).The lands were prepared by plowing the plots using a tractor draw mold board plow followed bycross-disking and leveling and pressing with a tractor drawn leveler. In organic fields, recommendeddose of certified organic fertilizers in terms of farm yard manure i.e., FYM (0.5% N, 0.2% P2O5 and0.5% K2O) and decorticated neem cake (a bio-fertilizer-cum-organic soil amendment made of neem[Azadirachta indica L.] seed kernels after removing the husk, 2.0 to 5.0% N, 0.5 to 1% P and 1.0 to 2.0% K)were applied @ 5 t ha−1 and 125 kg ha−1, respectively. In conventional fields, the inorganic fertilizers interms of urea, diammonium phosphate (DAP) or single super phosphate (SSP), and muriate of potash(MOP) were applied as recommended doses (150 kg N ha−1, 40 kg P2O5 ha−1, and 40 kg K2O ha−1,respectively). A recommended practices i.e., wet method of nursery raising was followed to raisethe nursery of rice followed by transplanting using 30 d old seedlings @2–3 seedlings per hill inrows and 20 cm apart. A 2–3 cm water level was maintained during the initial stage followed by4–5 cm to maintain a standard water level in the rice field up to milk or dough stage. No syntheticchemical or plant growth regulator has been applied in organic fields. The hexaconazole @300 mLha−1, tricyclazole @120 g ha−1, carbendazim @1.35 kg ai ha−1 were applied for controlling bacterial leafblight (BLB), sheath blight, stem borer and leaf folder diseases, respectively in the conventional fields.The harvesting was performed with sickle at 110 d after transplanting when about 90% of the grains inpanicle had ripened.
Appendix B
Well Water Sample CollectionThe depth of water table in the entire study area ranged between 31 to 37 m below ground level,
which closely matches with that a standard method used in the area [24]. The information on thewater table depth was collected from individual farmers who estimated the depth while diggingthe tube wells in <2 years before our first field campaign. Thus, we carefully chose farmers’ fields
Water 2020, 12, 960 7 of 9
such that there was potentially negligible gravity-driven lateral flow of groundwater as adjacentfields which were of the similar hydraulic head (or, groundwater table depth) [2]. Additionally, aconsiderable distance (a minimum of 10 km radius) was always maintained between an organic and anadjacent conventional field used in this study to avoid any contamination between these two farmingsystems. Given the geology of the region (unconsolidated alluvial deposits of Quaternary age) [25],climate (hot semi-arid climate as per Köppen-Geiger climate classification system; Geiger 1954), andsoil type (sandy loam) [11] are similar in both conventional and organic fields, the managementpractices associated with the type of fertilizers/manures played an instrumental role in controlling thegroundwater quality parameters.
Appendix C
Collection of Groundwater SamplesField campaigns were conducted before transplanting and after harvest of the growing basmati
rice crop in both the systems. All samples were collected and preserved following the operatingprocedure for groundwater sampling [12]. Three field replicates of groundwater samples were collectedat each site from the boreholes (or tube wells) with depth ranging from approximately 120 to 180 feet(~37–55 m). Thus, the number of our collected samples equate to a total of twenty-one samples (3 fieldreplicates × 7 farmer’s field) from both organic and conventional farming systems. We used boreholes(or tube wells) because of its increased use in extracting groundwater for both drinking and irrigationwater purposes in the Indian subcontinent [24]. All samples were poured in high-density polyethylene(HDPE) round plastic bottles with a threaded cap. After collection, all samples were transported to thelaboratory facility of the Division of Environmental Sciences, Indian Agricultural Research Institute(IARI) and stored at 4 ◦C until processed.
Analysis of Groundwater SamplesGroundwater quality parameters were measured following the standard protocol for water quality
parameters analysis [13]. To measure total dissolved solids (TDS), the water samples were filtered withglass microfiber filter, and then 50 mL of filtrate was added to a pre-weighed ceramic dish and placed ina drying oven to evaporate at 105 ◦C. Quantification of TDS was done by subtracting the initial weightof the empty ceramic dish from the weight of the ceramic dish with the dried residue. Carbonate (CO3
−)and bicarbonate (HCO3
−) in groundwater sample were determined by titrating 25 mL of water sampleagainst standardized 0.1 N H2SO4 using phenolphthalein and methyl red as indicators, respectively.The concentration of calcium (Ca++) and magnesium (Mg++) was determined by versenate titrationmethod by titrating against 0.01 (N) EDTA-disodium salt solution using Erichrome black T dye as anindicator and ammonium chloride-ammonium hydroxide buffer. Sodium (Na+) concentration wasmeasured using a flame photometer. The pH of groundwater samples was measured by shaking 50 mLof water sample in a 100-mL beaker using a glass electrode in a pH meter. The electrical conductivity(EC) (dS m−1 at 25 ◦C) was measured in 50 mL of the water sample using conductivity meter [14].
The NO3− concentration in groundwater was derived on the basis of nitration of salicylic acid [16].
One mL standard or sample was transferred into a 50 mL Erlenmeyer flask and 0.5 mL TRI solution (1 gsodium salicylate + 0.2 g NaCl + 0.1 g NH4SO3NH2) and swirled thoroughly. Evaporated to drynessfor 5 min at 100–120 ◦C) and cooled thereafter. The residue was wetted with 1 mL concentrationH2SO4, swirled, and allowed to stand for 5 min. Then, 5 mL MilliQ water and 5 mL 40 percent NaOHwere also added down the flask wall and swirled and cooled. The absorbance of the yellow color wasmeasured at 410 nm immediately after the solution solutions were cooled.
Indices of Groundwater Quality Parameters for Irrigation PurposesResidual Sodium Carbonate (RSC)The RSC exists when the content of the (CO3
− and HCO3−) exceeds the (Ca++ and Mg++) content
of the irrigation water. RSC was defined as follows [14] (Equation (A1)).
RSC = (CO3− + HCO3
−) − (Ca++ + Mg++) (A1)
Water 2020, 12, 960 8 of 9
The safe limit of RSC for irrigation purpose is <1.24 meq. L−1 (Table S2). Irrigation water havingRSC values higher than safe limits pose hazards to the crop development (or growth) and leads toaccumulation of Na in the soils. It also exerts higher EC and excess salinity in soils.
Sodium Adsorption Ratio (SAR)The SAR is the relative concentration of Na to the combined concentration of (Ca++ and Mg++).
Usually, it is used to predict the hazards of Na+ in soils. As such, it is a measure of the sodicity/alkalinehazard of irrigation water [14], calculated (Equation (A2)) using the concentration of ions in millimol(+)/1.
SAR =Na+√
Ca+++Mg++
2
(A2)
Irrigation water is considered to be hazardous with a SAR value >1.0 [14].
References
1. Abdel-Satar, A.M.; Al-Khabbas, M.H.; Alahmad, W.R.; Yousef, W.M.; Alsomadi, R.H.; Iqbal, T. Qualityassessment of well water and agricultural soil in Hail region, Saudi Arabia. Egypt. J. Aquat. Res. 2017, 43,55–64. [CrossRef]
2. MacDonald, A.M.; Bonsor, H.C.; Ahmed, K.M.; Burgess, W.G.; Basharat, M.; Calow, R.C.; Dixit, A.;Foster, S.S.D.; Gopal, K.; Lapworth, D.J.; et al. Groundwater quality and depletion in the Indo-GangeticBasin mapped from in situ observations. Nat. Geosci. 2016, 9, 762–766. [CrossRef]
3. Malan, A.; Sharma, H.R. Groundwater quality in open-defecation-free villages (NIRMAL grams) ofKurukshetra district, Haryana, India. Environ. Monit. Assess. 2018, 190, 472. [CrossRef] [PubMed]
4. Sahoo, P.K.; Kim, K.; Powell, M.A. Managing well water nitrate contamination from livestock farms:Implication for nitrate management guidelines. Current Pollution Reports. 2016, 2, 178–187. [CrossRef]
5. Laegreid, M.; Bøckman, O.C.; Kaarstad, O. Agriculture, Fertilizers and the Environment; Norsk Hydro ASA:Porsgrunn, Norway, 1999.
6. Thorburn, P.J.; Biggs, J.S.; Weier, K.L.; Keating, B.A. Nitrate in well water of intensive agricultural areas incoastal Northeastern Australia. Agric. Ecosyst. Environ. 2003, 94, 49–58. [CrossRef]
7. Cui, Z.; Chen, X.; Zhang, F. Current nitrogen management status and measures to improve the intensivewheat–maize system in China. AMBIO 2010, 39, 376–384. [CrossRef] [PubMed]
8. Van der Ploeg, R.R.; Horton, R.; Kirkham, D. Steady flow to drains and wells. In Agricultural Drainage;Agronomy Series No. 38, ASA–CSSA–SSSA; Skaggs, R.W., van Schilfgaarde, J., Eds.; Wiley Publishers:Madison, WI, USA, 1999; pp. 213–263.
9. Beaudoin, N.; Saad, J.K.; Van Laethem, C.; Machet, J.M.; Maucorps, J.; Mary, B. Nitrate leaching in intensiveagriculture in Northern France: Effect of farming practices, soils and crop rotations. Agric. Ecosyst. Environ.2005, 111, 292–310. [CrossRef]
10. Sihi, D.; Sharma, D.K.; Pathak, H.; Singh, Y.V.; Sharma, O.P.; Nain, L.; Chaudhary, A.; Dari, B. Effect oforganic farming on productivity and quality of basmati rice. Oryza Int. J. Rice 2012, 49, 24–29.
11. Sihi, D.; Dari, B.; Sharma, D.K.; Pathak, H.; Nain, L.; Sharma, O.P. Evaluation of soil health in organic vs.conventional farming of basmati rice in North India. J. Plant Nutr. Soil Sci. 2017, 180, 389–406. [CrossRef]
12. SESD. U.S. Environmental Protection Agency-Science and Ecosystem Division, Operating Procedure for Well WaterSampling; SESDPROC-301-R3; 2013. Available online: https://www.epa.gov/quality/surface-water-sampling(accessed on 16 December 2016).
13. APHA; AWWA. Standard Methods for the Examination of Water and Wastewater; American Public HealthAssociation/American Water Works Association/Water Environment Federation: Washington, DC, USA, 1995.
14. Richards, L.A. Diagnosis and Improvement of Saline and Alkali Soils; Government Printing Office: Washington,DC, USA, 1954.
15. Chowdary, V.M.; Rao, N.H.; Sharma, P.B.S. Decision support framework for assessment of non-point-sourcepollution of well water in large irrigation projects. Agric. Water Manag. 2005, 75, 194–225. [CrossRef]
16. Vendrell, P.F.; Zupancic, J. Determination of soil nitrate by transnitration of salicylic acid. Commun. Soil Sci.Plant Anal. 1990, 21, 1705–1713. [CrossRef]
17. JMP. Statistical Software 2010 (Version 10.0); SAS Institute. Inc.: Cary, NC, USA, 2010.
Water 2020, 12, 960 9 of 9
18. Environmental Protection Agency (EPA) (Ed.) Drinking Water Standards and Health Advisories; OxfordAcademics: Washington, DC, USA, 2012.
19. World Health Organization. Guidelines for Drinking Water Quality. Incorporating the First and Second Addenda,Volume 1, Recommendations, 3rd ed.; WHO Chronicle: Geneva, Switzerland, 2008.
20. Lenka, S.; Singh, A.K.; Lenka, N.K. Soil water and nitrogen interaction effect on residual soil nitrate and cropnitrogen recovery under maize–wheat cropping system in the semi-arid region of northern India. Agric.Ecosyst. Environ. 2013, 179, 108–115. [CrossRef]
21. Ibrikci, H.; Cetin, M.; Karnez, E.; Flügel, W.A.; Tilkici, B.; Bulbul, Y.; Ryan, J. Irrigation-induced nitrate lossesassessed in a Mediterranean irrigation district. Agric. Water Manag. 2015, 148, 223–231. [CrossRef]
22. Drinkwater, L.E.; Wagoner, P.; Sarrantonio, M. Legume-based cropping systems have reduced carbon andnitrogen losses. Nature 1998, 396, 262–265. [CrossRef]
23. Poonia, S.R.; Mehta, S.C.; Pal, R. Calcium-sodium, magnesium exchange equilibria in relation to organicmatter in soils. In International Symposium on Salt Affected Soils; Central Soil Salinity Research Institute:Karnal, India, 1980; pp. 134–142.
24. Suhag, R. Overview of Ground Water in India; PRS Legislative Research Standing Committee on WaterResources: Delhi, India, 2016.
25. Sharma, A. Groundwater Information Booklet Kaithal District, Haryono; Central Groundwater Board: Chandigarh,India, 2008.
© 2020 by the authors. Licensee MDPI, Basel, Switzerland. This article is an open accessarticle distributed under the terms and conditions of the Creative Commons Attribution(CC BY) license (http://creativecommons.org/licenses/by/4.0/).
Related Documents