www.ccsenet.org/ijc International Journal of Chemistry Vol. 3, No. 2; June 2011 Published by Canadian Center of Science and Education 79 Assessment of Water Quality in Four Main Water Reservoirs in Northern Jordan Safwan M. Obeidat (Corresponding author) & Ahmed Alomary Department of Chemistry, faculty of science, Yarmouk University, Irbid, Jordan Tel: 962-2-721-1111 ext. 2821 E-mail: [email protected] Wassef Sekhaneh Department of Conservation and Management of Cultural Resources Faculty of Archaeology and Anthropology, Yarmouk University, Irbid, Jordan Idrees Al-momani & Amer J. Al Abdel Hamid Department of Chemistry, faculty of science, Yarmouk University, Irbid, Jordan Received: September 15, 2010 Accepted: September 28, 2010 doi:10.5539/ijc.v3n2p79 Abstract We have investigated water quality and the correlation between water composition and sampling site. Thirty six samples (nine from each reservoir) were collected every month from four main water reservoirs in northern Jordan. Several chemometrical methods were employed to conduct this investigation. These methods are Partial Least Square Discriminant Analysis (PLSDA), Cluster Analysis (CA) and Principal Component Analysis (PCA). The correlation between water sample and site was achieved successfully. In addition to that, we have found that water quality from Wadi Al-Arab, Zeglab (Sharhabeel ben Hasneh) and Al-Wihdeh Reservoirs were nearly close but different from King Talal reservoir. Keywords: Water quality, Partial Least Square Discriminant Analysis, Cluster Analysis, Principal Component Analysis 1. Introduction Jordan is situated on the east Bank of the Jordan River. Jordan’s climate is hot, dry and moderate in summer but cool and, variable in winter during which practically all of the precipitation occurs. The country receives less than twelve centimeters of rain a year and may be classified as a dry desert. The Jordan River’s principal tributary is the Al-Yarmouk River where Al-Wihdeh Reservoir is constructed. Az Zarqa River is the second main tributary of the Jordan River, rises and empties entirely within the East Bank of the Jordan River (Sekhaneh, W. 2005). Water research in Jordan is very important due to the fact that Jordan is classified among the world’s scarcest countries of water resources. Modern developments may also contribute in expanding the water problem in Jordan through polluting some of the available water resources. Hence, treated waste water and water reservoirs play an essential role in Jordan’s water strategy especially for irrigation purposes (Saadoun, T. et. al 2008). In this study four main water reservoirs in Jordan which are mainly used for irrigation were chemically examined. These reservoirs are Wadi Al-Arab (capacity of 16.9 millions m 3 ), Zeqlab or Sharhabeel ben Hasneh (capacity of 3.9 millions m 3 ), Al-Wihdeh (capacity of 110 millions m 3 ) and King Talal (capacity of 75 millions m 3 ). Wadi Al-Arab Reservoir is located in the northern part of Jordan Valley, about 25 km from Irbid City. The reservoir water comes mainly from the King Abdallah Canal and partially from precipitation. This reservoir is mainly used for irrigation. However, it supplies drinking water during the water shortage periods. Zeqlab Reservoir is about 10 km southern Wadi Al-Arab Reservoir and the reservoir water comes mainly from precipitation. Al-Wihdeh Reservoir which is the largest water reservoir in Jordan is located about 30 km northern Irbid City. The main water source for this reservoir is Al-Yarmouk River. King Talal Reservoir is located in hills of northern Jordan about 40 km from the capital Amman, the water source is mainly Az Zarqa River. In Fact, King Talal Reservoir particularly is highly subjected to pollution because it happens that several industrial activities and sewage plants are scattered along-side the Az Zarqa River (Jordan Valley Authority, 2009). The

Welcome message from author
This document is posted to help you gain knowledge. Please leave a comment to let me know what you think about it! Share it to your friends and learn new things together.
Transcript
www.ccsenet.org/ijc International Journal of Chemistry Vol. 3, No. 2; June 2011
Published by Canadian Center of Science and Education 79
Assessment of Water Quality in Four Main Water Reservoirs in Northern Jordan
Safwan M. Obeidat (Corresponding author) & Ahmed Alomary
Department of Chemistry, faculty of science, Yarmouk University, Irbid, Jordan
Tel: 962-2-721-1111 ext. 2821 E-mail: [email protected]
Wassef Sekhaneh
Department of Conservation and Management of Cultural Resources
Faculty of Archaeology and Anthropology, Yarmouk University, Irbid, Jordan
Idrees Al-momani & Amer J. Al Abdel Hamid
Department of Chemistry, faculty of science, Yarmouk University, Irbid, Jordan
Received: September 15, 2010 Accepted: September 28, 2010 doi:10.5539/ijc.v3n2p79
Abstract
We have investigated water quality and the correlation between water composition and sampling site. Thirty six samples (nine from each reservoir) were collected every month from four main water reservoirs in northern Jordan. Several chemometrical methods were employed to conduct this investigation. These methods are Partial Least Square Discriminant Analysis (PLSDA), Cluster Analysis (CA) and Principal Component Analysis (PCA). The correlation between water sample and site was achieved successfully. In addition to that, we have found that water quality from Wadi Al-Arab, Zeglab (Sharhabeel ben Hasneh) and Al-Wihdeh Reservoirs were nearly close but different from King Talal reservoir.
Keywords: Water quality, Partial Least Square Discriminant Analysis, Cluster Analysis, Principal Component Analysis
1. Introduction
Jordan is situated on the east Bank of the Jordan River. Jordan’s climate is hot, dry and moderate in summer but cool and, variable in winter during which practically all of the precipitation occurs. The country receives less than twelve centimeters of rain a year and may be classified as a dry desert. The Jordan River’s principal tributary is the Al-Yarmouk River where Al-Wihdeh Reservoir is constructed. Az Zarqa River is the second main tributary of the Jordan River, rises and empties entirely within the East Bank of the Jordan River (Sekhaneh, W. 2005). Water research in Jordan is very important due to the fact that Jordan is classified among the world’s scarcest countries of water resources. Modern developments may also contribute in expanding the water problem in Jordan through polluting some of the available water resources. Hence, treated waste water and water reservoirs play an essential role in Jordan’s water strategy especially for irrigation purposes (Saadoun, T. et. al 2008). In this study four main water reservoirs in Jordan which are mainly used for irrigation were chemically examined. These reservoirs are Wadi Al-Arab (capacity of 16.9 millions m3), Zeqlab or Sharhabeel ben Hasneh (capacity of 3.9 millions m3), Al-Wihdeh (capacity of 110 millions m3) and King Talal (capacity of 75 millions m3). Wadi Al-Arab Reservoir is located in the northern part of Jordan Valley, about 25 km from Irbid City. The reservoir water comes mainly from the King Abdallah Canal and partially from precipitation. This reservoir is mainly used for irrigation. However, it supplies drinking water during the water shortage periods. Zeqlab Reservoir is about 10 km southern Wadi Al-Arab Reservoir and the reservoir water comes mainly from precipitation. Al-Wihdeh Reservoir which is the largest water reservoir in Jordan is located about 30 km northern Irbid City. The main water source for this reservoir is Al-Yarmouk River. King Talal Reservoir is located in hills of northern Jordan about 40 km from the capital Amman, the water source is mainly Az Zarqa River. In Fact, King Talal Reservoir particularly is highly subjected to pollution because it happens that several industrial activities and sewage plants are scattered along-side the Az Zarqa River (Jordan Valley Authority, 2009). The
www.ccsenet.org/ijc International Journal of Chemistry Vol. 3, No. 2; June 2011
ISSN 1916-9698 E-ISSN 1916-9701 80
goal of this study is to find a correlation between sampling locations and variables obtained by both chemical and physical measurements. Chemometrics can be applied on such data to construct a fast calibration model for classifying different water quality samples and a more continuous description of water quality management. Many published papers used chemomteric tools (i. e. Principal Component Analysis (PCA), Linear Discriminant Analysis LDA, Classification Analysis (CA) and others) for analyzing environmental data and extracting useful information (Alkarahi, A. et. al 2009, Li, R. et. al 2007, Vandendriessche, S. et. al 2006). For example PCA particularly was used for discriminating and separating rain water samples (Zhang, P. et. al 1992). It has been also used for characterization of ground waters (Šnuderl, K. et. al 2007, Vončina, E. et. al 2007) as well as for river waters (Kotti, M. E. et. al 2005, Brodnjak-Vončina, D. et. al 2002). In this work the water quality results of four main water reservoirs in Jordan along with their chemometrical analysis were presented. The data analysis was executed to explore the extent of differences among the water samples from the four sites. The current work may hold the potential of detecting future water pollution especially in those reservoirs which are being used in Jordan for drinking purposes. Despite the old history of water shortage problem in Jordan, to the best of the author’s knowledge this is the first work which studies the chemical composition of water in these four main water reservoirs and differentiates their water by using chemometrical techniques at this region.
2. Materials and method
2.1 Sampling and study area
Sampling in this work was achieved according to the direct method of the Environmental Protection Agency (EPA) standard methods. Three samples from three different locations at about 30 cm depth in each of the four reservoirs were collected every month from October 2008 to June of 2009. Figure 1, is a map showing the location of the studied reservoirs in the northern Jordan. A total of 108 samples were collected in deionized water pre-rinsed polyethelene bottles. Each sample was collected in two different bottles. One of these bottles was used for measuring the major ions while the other one was used for determining the trace metals. The polyethylene bottles used for trace metals analysis were acidified to avoid adsorption on the inside walls of the bottles. To remove any insoluble particles all samples were filtered through glass-fiber filters. Samples taken in each month from all locations were analyzed together the day next to the sample collection day. Samples were stored in a refrigerator (3°C) until the time of analysis.
2.2 Analytical Methods
Sixteen variables including, pH, conductivity, trace metals, anions and cations were measured for all samples. EPA standard methods were followed in measuring all variables. The pH and the conductivity were measured in-situ using WTW Multiline F/set3. A Dionex Ion chromatography was used for major anions determination (Cl−, Br−, HCO3
−, NO3−, and SO4
2−) (EPA method 300.0 1983). Sodium and potassium were determined using a Varian flame atomic emission spectrometry (EPA method 273.1 1983). Calcium and magnesium were determined using the EDTA titration method (EPA method 130.2 1983). Trace metals were determined using inductively coupled plasma-atomic emission spectrometry (ICP-AES) (EPA method 200.7 1983).
2.3 Data Analysis
A total of 108 samples were collected (27 samples from each reservoir). Sixteen variables were measured for each sample (pH, conductivity, Cl−, Br−, HCO3
−, NO3−, SO4
2−, Ca+2, Mg+2, Na+, K+, Fe, Cu, Cr, Pb, Ni). The results show that, the concentrations of each of Cr, Pb and Ni were below the detection limit of the used instruments. Hence only the left thirteen variables were involved in the data analysis of this work. The results of the analysis for the three samples of each month in every reservoir were averaged. This means that 9 representative samples were used instead of 27 samples for each reservoir. The resulted data of the thirteen variables from the four reservoirs were concatenated in a single two-dimensional data matrix. The resulted data matrix contains 13 columns and 36 rows. Several chemometrical algorithms were applied to the data matrix. MatLab 7.0.4 (MathWorks, MA, USA) and PLS_Toolbox 4.0 (Eigenvector Research, Inc, WA, USA) were used for data processing and analysis.
2.3.1 Partial Least Square Discriminant Analysis (PLSDA)
When a group of samples have similar composition it is defined as a class. PLSDA is a powerful classification technique that can efficiently identify the differences among two or more classes. It finds the fundamental relations among the data sets and classifying classes (similar samples in composition) together in a separate cluster away from other classes in the PLSDA model. Mathematically, the PLSDA technique relays upon calculating the most significant latent variables (LVs) that are associated with the maximum variation captured in the data set including all classes. The important LVs are then selected and utilized for constructing a two or

www.ccsenet.org/ijc International Journal of Chemistry Vol. 3, No. 2; June 2011
Published by Canadian Center of Science and Education 81
three dimensional PLSDA model. The resulted PLSDA model can be used for estimating the similarities and differences among samples. Also it serves as a calibration model for testing future samples (Obeidat, S. et. al 2009, Poulli, K. I. et. al 2007, Trygg, J. et. al 2007).
2.3.2 Cluster analysis (CA)
The aim of the CA is to understand the patterns exist in a particular data set and to identify samples which are similar and samples which are different in the tested data. This method is based on calculating the distances (e.g. via Mahalanobis distance) between all samples. Samples which are close together in the measurement space (e.g. Principal Component Analysis (PCA) model) are likely to belong to the same group (Wise, B. et. al 2007, Skrobot, V. L. et. al 2005). Similar samples (smallest distance) are merged together to form a single cluster. This procedure is repeated. The distances between all pairs of clusters are calculated again, and the pair of closest distance is merged into a separate cluster (Obeidat, S. et. al 2009, Alkarahi, A. et. al 2009). The results of CA are displayed graphically as a connection dendrogram. Therefore, dendrogram sorts the tested data set into groups of samples (clusters). All samples of particular cluster are similar and are different from the samples in the other clusters.
2.3.3 Principal Component Analysis (PCA)
PCA is a pattern recognition method that is used for finding similarities and differences among the samples in a given data set. PCA can minimize the data size without a significant loss of information. Mathematically, PCA represents the eigenvectors for the covariance or correlation matrix of the given data set. The eigenvector associated with the greatest eigenvalue is known as the first principal component (PC). The second principal component is the eigenvector that is associated with the next greatest eigenvalue and so on. All PCs are mutually orthogonal (Wise, B. et. al 1999). The first PC accounts for the maximum variation in the data as possible, while the rest of succeeding components account for as much of the remaining variability. Hence, usually only the first few PCs are used in the analysis because they contain the maximum variation in the data set (Anderson, D. M. et. al 2006).
3. Results and Discussion
3.1 Data summary
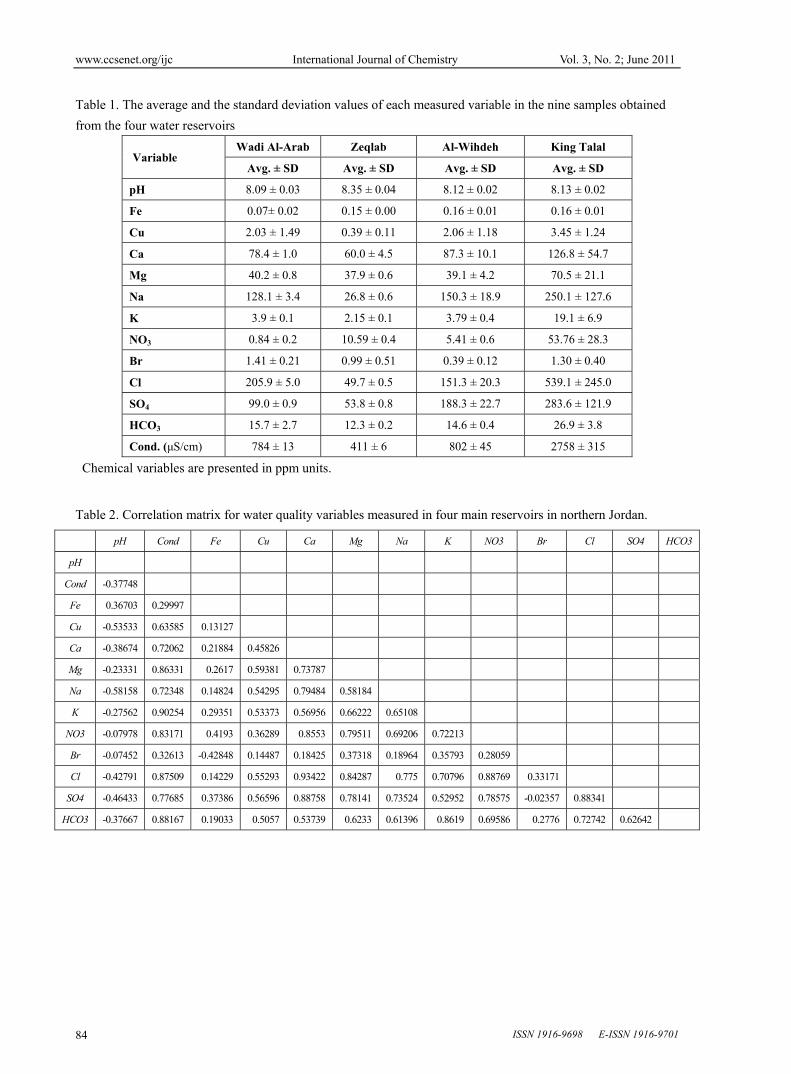
Table 1, represents the average and the standard deviation values of each measured variable in the nine samples obtained from the four water reservoirs. For instant, it is apparent from this table that the acidity of all samples from all sites is almost the same. However, King Talal Reservoir has the highest levels of the measured variables than the rest of the reservoirs. Also the conductivity in King Talal water samples was found to be nearly 3 times higher than those observed in water samples collected from Wadi Al-Arab and Al-Wihdeh Reservoirs and about 7 times higher than samples collected from Zeqlab Reservoir.
3.2 Spatial similarity and sampling site clustering
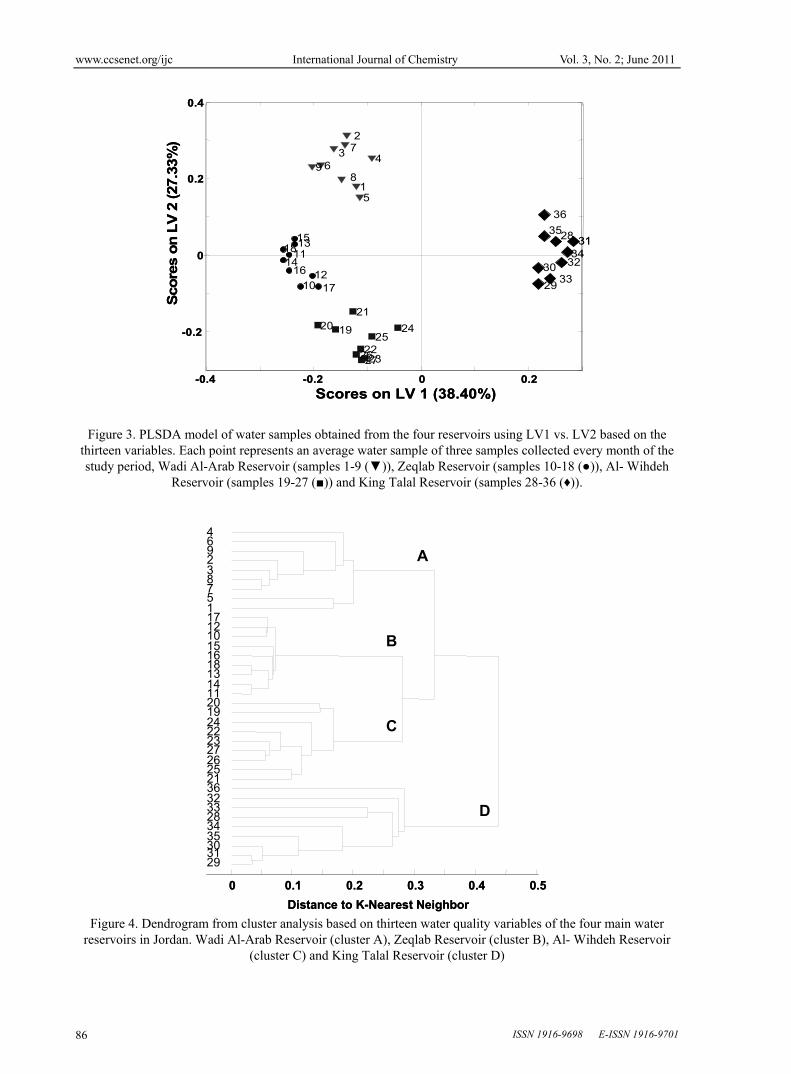
Generally, chemometric methods require variables to be fit to the normal distribution. Thus, kurtosis analysis and skewness test were employed to check the normality of distribution for each variable (Papatheodorou, G. et. al 2006, Kowalkowski, T. et. al 2006). The values for kurtosis were found to be between – 1.20 and 3.08. Skeweness values were found to range from –1.40 to 2.02. P-value was also found to be greater than 0.05. These values indicate that no significant skewness was found which means that variable distribution was close to normality within the 95% confident limit. Consequently, no transformation functions were used. Prior to CA data were auto-scaled (mean =0 and variance =1) to render the data dimensionless (Liu, C. W. et. al 2003). Both CA and PLSDA were utilized to differentiate among the water samples of the four different sites. In PLSDA several LVs were examined. Figure 2, shows that the first five LVs account for more than 90% of the total captured variance in the dataset. Therefore a two or a three dimensional PLSDA model can be created using some of these LVs. Hence, complete information concerning all water quality variables along with their locations can be reduced and explained with the aid of the pre-calculated LVs. In this study, the best result is illustrated in a PLSDA model (Figure 3) which was constructed using the first and the second LVs. The choice of these LVs was based on the amount of variance captured within the original dataset (almost 65% of the total variance). The best results concerning the separation of the samples into well-resolved clusters were also achieved in the current PLSDA model (Figure 3) using only the first two LVs. In extracting results out of a PLSDA model, the further the distances between sample clusters the more different they are. In Figure 3, samples from the four reservoirs are clearly grouped into four independent clusters. Each cluster represents samples of a separate site (reservoir). It can be clearly seen that, samples of a particular cluster have some differences. However the sample-sample variation (distance) from one site is much less than that from site-site
www.ccsenet.org/ijc International Journal of Chemistry Vol. 3, No. 2; June 2011
ISSN 1916-9698 E-ISSN 1916-9701 82
variation. This shows evidence that discriminating among water samples from the four reservoirs is possible using the thirteen measured variables. It can also be seen that, the first LV in this model (Figure 3) was enough to discriminate the water from King Talal Reservoir from the water in the rest of the water reservoirs. However, the second LV was necessary to differentiate among Zeglab (Sharhabeel ben Hasneh), Wadi Al-Arab and Al-Wihdeh reservoirs. This indicates that the water from King Talal Reservoir is quite different in composition from the other three reservoirs which required a second LV that accounts for almost 27% of the total variation to be differentiated. CA was also used to recognize the clusters relying on the distances among them in multidimensional space of choice (similarity). The resulted CA dendrogram (Figure 4) was created based on calculating the distances between all samples in a PCA model using the first 4 PCs which account for more than 90% of the total variance in the data. The dendrogram in Figure 4, displays all monitored sites to be grouped in four statistically significant clusters; A, B, C and D. Each one of the resulted groups or clusters in the dendrogram in Figure 4 contains only samples from a particular reservoir. Hence, the four clusters represent the four monitored water reservoirs. It can be seen that the nearest clusters to each other in space are cluster B which contains the water samples from Zeglab Reservoir and cluster C (Al-Wihdeh water samples). This reflects the close water characteristics (quality) of those two reservoirs. Cluster A which represents Wadi Al-Arab Reservoir is joined next in the dendrogram close to cluster B and C. Again this means that water from this location has different composition from Al-Wihdeh and Zeglab Reservoirs, but still has a close water quality measurements. Finally, the water samples from King Talal reservoir form th fourth cluster (cluster D) which is the furthest cluster among all clusters. This reflects the relative difference in correlation of water quality of King Talal water reservoir compared with the other three reservoirs in the study. The results of the dendrogram (Figure 4) are also consistent with those obtained from the PLSDA model (Figure 3). Pattern recognition of correlations among the 13 variables was best summarized by the PCA algorithm to find similarities and differences among the data set. A PCA model using only the first two PCs which accounts for almost 65% of the variance in the dataset was studied. A score plot of PC1 versus PC2 (not shown) produced four resolved clusters; each one of these clusters represented a particular water reservoir. Again using only the first PC, water from King Talal water reservoir was distinguished from the rest of the water reservoirs. In general the results obtained from the two dimensional PCA score plot were very consistent with those obtained by both the PLSDA and the CA, Figures 3 and 4 respectively.
3.3 Contribution of variables in differentiation
A score plot of PC1 versus PC2 (not shown) produced similar results to those obtained by PLSDA and CA. For further investigation, loadings plot was also studied. Figure 5 shows the PCA loadings plot resulted for the data set. Again, only the first two loadings were used. In this plot the mutual locations of the 13 original variables are displayed. It can be noticed that the first PC is mainly associated with conductivity and the concentration of both potassium and carbonate. On the other hand, the second PC is correlated (negatively) with the iron concentration. Also the correlation matrix of the measured variables of the four water reservoirs was examined. The correlation matrix data is shown in Table 2. As can be seen in the table, a strong correlation was found between the conductivity and each of Cu, Ca+2, Mg+2, Na+, K+, NO3
–, Br−, Cl−, SO42− and HCO3
−. Also there is a good and positive correlation among all measured chemical variables excluding (pH, Br, and Fe) which is also consistent with the PCA loadings plot (Figure 5). A negative correlation between Fe and Br was also found. A similar correlation was noticed between all measured variables with pH except for Fe where positive but weak correlation was found.
4. Conclusions
In this work, we have investigated the relationship between chemical composition, physical properties of water and sampling site in northern Jordan. This was achieved through applying multivariate chemometrical techniques for data analysis. To explain the total variance in the data, only a limited number of components were used. Water samples from Wadi Al-Arab, Zeqlab, Al Wihdeh and King Talal reservoirs were successfully identified and differentiated based on their chemical and physical properties. As expected, water measurements from King Talal Reservoir were quite different from those of the rest of reservoirs. This is attributed to the fact that many industrial activities are distributed along both sides of the Az Zerga River which is considered to be the major water supplier for King Talal Reservoir. All obtained results from the analysis of the data using PLSDA, CA and PCA were found to be very consistent as an innovative chemoassessment technique.
The results of this research can hold future potential in monitoring water quality in Jordan by using approaches similar to those presented in this work.
www.ccsenet.org/ijc International Journal of Chemistry Vol. 3, No. 2; June 2011
Published by Canadian Center of Science and Education 83
References
Alkarahi, A., Ahmad, A., & Easa, A. (2009). Assessment of surface watrer quality of selected estuaries of Malaysia: multivariate statistical techniques. Environmentalist, 29, 255-262.
Anderson D. M., Rayson, G. D. et. al. (2006). Use of fluorometry to differentiate among clipped species in the Genera, Astragalus, Oxytropis and Pleuraphis. Rangeland Ecol Manage, 59, 557–56.
Brodnjak-Vončina, D., Dobčnik, D. et. al. (2002). Chemometrics characterisation of the quality of river water. Anal. Chim. Acta, 462, 87-100.
Jordan Valley Authority. (2009). Annual report, Al-Fanar press, Amman, Jordan.
Kowalkowski, T., Zbytniewski, R. et. al. (2006). Application of chemometrics in river water classification. Water Res., 40, 774-752.
Kotti, M. E., Vlessidis, A. G. et. al. (2005). Assessment of rever water quality in northwestern Greece. Wat. Res. Management, 19, 77-94.
Li, R., Dong, M. et. al. (2007). Assessment of water quality and identification of polluted sources of Plateau lakes in Yannan (China). Environ. Qual. 36, 291- 297.
Liu, C. W., Lin, K. H., & Kuo, Y. M. (2003). Application of factor analysis in the assessment of groundwater quality in a blackfoot disease area in Taiwan. Sci. Total Environ, 313, 77-89.
Obeidat, S., Khanfar, M., Obeidat, W. (2009). Classification of edible oils and uncovering adulteration of virgin olive oil using FTIR with the aid of chemometrics. Aust. J. Basic & Appl. Sci., 3(3), 2048-2053.
Papatheodorou, G., Demopoulou, G., Lambrakis, N. (2006). A long-term study of temporal hydrochemical data in a shallow lake using multivariate statistical techniques. Ecol. Model., 193, 795-776.
Poulli, K. I., Mousdis, G. A., Georgiou, C. A. (2005). Classification of edible and lampante virgin olive oil based on synchronous fluorescence and total luminescence spectroscopy. Anal. Chim. Acta, 542, 151-156.
Saadoun, I., Bataineh, E., Al-Handal, A. Y. (2008). The primary production condition of Wadi Al-Arab Dam (Reservoir), Jordan. JJBS, 1, 67-62.
Sekhaneh, W. (2005). The Bedouin of northern Jordan, scientific publisher (WVB) (1st ed), Berlin, Germany.
Skrobot, V. L., Castro, V. E. et. al. (2005). Identification of Adulteration of Gasoline Applying Multivariate Data Techniques HCA and KNN in Cromatographic Data. Energ. Fuel, 19 (6), 2350-2356.
Šnuderl, K., Simonič, M. et. al. (2007). Multivariate data analysis of natural mineral waters. Acta Chim. Slov. 54, 33-39.
Trygg, J., Wold, S. (2002). Orthogonal projections to latent structures (O-PLS). J. Chemometrics, 16(3), 119-128.
U.S Environmental Protection Agency. (1983). Methods for chemical analysis of water and wastes, EPA-600/4-79-020.
Vandendriessche, S., Vincx, M., Degraer, S. (2006). Floating seaweed in the neustonic environment: a case study from Belgian coastal waters. Sea Res., 55, 103-112.
Vončina, E., Brodnjak-Vončina, D. et. al. (2007). Chemometric characterization of the quality of ground waters from different wells in slovenia. Acta Chim. Slov., 54, 119-125.
Wise, B., Gallagher, N. B. et. al. (2007). PLS Toolbox 4.0, Manson, WA. USA Eigenvector Research Inc.
Wise, B., Gallagher, N. B. et. al. (1999). Comparison of principal component analysis, multiway principal component analysis, Trilinear decomposition and parallel factor analysis for fault detection in a semiconductor etch process. J. Chemometrics, 13, 379-596.
Zhang, P., Dudley, N. et. al. (1992). application of principal component analysis to the interpretation of rainwater compositional data. Anal. Chim. Acta, 258, 1-10.
www.ccsenet.org/ijc International Journal of Chemistry Vol. 3, No. 2; June 2011
ISSN 1916-9698 E-ISSN 1916-9701 84
Table 1. The average and the standard deviation values of each measured variable in the nine samples obtained
from the four water reservoirs
Variable Wadi Al-Arab Zeqlab Al-Wihdeh King Talal
Avg. ± SD Avg. ± SD Avg. ± SD Avg. ± SD
pH 8.09 ± 0.03 8.35 ± 0.04 8.12 ± 0.02 8.13 ± 0.02
Fe 0.07± 0.02 0.15 ± 0.00 0.16 ± 0.01 0.16 ± 0.01
Cu 2.03 ± 1.49 0.39 ± 0.11 2.06 ± 1.18 3.45 ± 1.24
Ca 78.4 ± 1.0 60.0 ± 4.5 87.3 ± 10.1 126.8 ± 54.7
Mg 40.2 ± 0.8 37.9 ± 0.6 39.1 ± 4.2 70.5 ± 21.1
Na 128.1 ± 3.4 26.8 ± 0.6 150.3 ± 18.9 250.1 ± 127.6
K 3.9 ± 0.1 2.15 ± 0.1 3.79 ± 0.4 19.1 ± 6.9
NO3 0.84 ± 0.2 10.59 ± 0.4 5.41 ± 0.6 53.76 ± 28.3
Br 1.41 ± 0.21 0.99 ± 0.51 0.39 ± 0.12 1.30 ± 0.40
Cl 205.9 ± 5.0 49.7 ± 0.5 151.3 ± 20.3 539.1 ± 245.0
SO4 99.0 ± 0.9 53.8 ± 0.8 188.3 ± 22.7 283.6 ± 121.9
HCO3 15.7 ± 2.7 12.3 ± 0.2 14.6 ± 0.4 26.9 ± 3.8
Cond. (μS/cm) 784 ± 13 411 ± 6 802 ± 45 2758 ± 315
Chemical variables are presented in ppm units.
Table 2. Correlation matrix for water quality variables measured in four main reservoirs in northern Jordan.
pH Cond Fe Cu Ca Mg Na K NO3 Br Cl SO4 HCO3
pH
Cond -0.37748
Fe 0.36703 0.29997
Cu -0.53533 0.63585 0.13127
Ca -0.38674 0.72062 0.21884 0.45826
Mg -0.23331 0.86331 0.2617 0.59381 0.73787
Na -0.58158 0.72348 0.14824 0.54295 0.79484 0.58184
K -0.27562 0.90254 0.29351 0.53373 0.56956 0.66222 0.65108
NO3 -0.07978 0.83171 0.4193 0.36289 0.8553 0.79511 0.69206 0.72213
Br -0.07452 0.32613 -0.42848 0.14487 0.18425 0.37318 0.18964 0.35793 0.28059
Cl -0.42791 0.87509 0.14229 0.55293 0.93422 0.84287 0.775 0.70796 0.88769 0.33171
SO4 -0.46433 0.77685 0.37386 0.56596 0.88758 0.78141 0.73524 0.52952 0.78575 -0.02357 0.88341
HCO3 -0.37667 0.88167 0.19033 0.5057 0.53739 0.6233 0.61396 0.8619 0.69586 0.2776 0.72742 0.62642

www.ccsenet.org/ijc International Journal of Chemistry Vol. 3, No. 2; June 2011
Published by Canadian Center of Science and Education 85
Figure 1. Location of the studied reservoirs in the northern Jordan
0
10
20
30
40
50
1 2 3 4 5Latent Variable number
% v
ari
ance
cap
ture
d b
y m
od
el
0
10
20
30
40
50
1 2 3 4 5Latent Variable number
% v
ari
ance
cap
ture
d b
y m
od
el
Figure 2. The percentage of the total variation associated with the first five latent variables (LVs) in data set for
all samples
www.ccsenet.org/ijc International Journal of Chemistry Vol. 3, No. 2; June 2011
ISSN 1916-9698 E-ISSN 1916-9701 86
-0.4 -0.2 0 0.2
-0.2
0
0.2
0.4
Scores on LV 1 (38.40%)
Sco
res
on L
V 2
(27
.33%
)1
2
3 4
5
6
7
89
10
11
12
13
14
15
16
17
18
192021
2223
2425
2627
28
29
30
31
32
33
34
35
36
-0.4 -0.2 0 0.2
-0.2
0
0.2
0.4
Scores on LV 1 (38.40%)
Sco
res
on L
V 2
(27
.33%
)1
2
3 4
5
6
7
89
10
11
12
13
14
15
16
17
18
192021
2223
2425
2627
28
29
30
31
32
33
34
35
36
Figure 3. PLSDA model of water samples obtained from the four reservoirs using LV1 vs. LV2 based on the thirteen variables. Each point represents an average water sample of three samples collected every month of the study period, Wadi Al-Arab Reservoir (samples 1-9 (▼)), Zeqlab Reservoir (samples 10-18 (●)), Al- Wihdeh
Reservoir (samples 19-27 (■)) and King Talal Reservoir (samples 28-36 (♦)).
Distance to K-Nearest Neighbor
0 0.1 0.2 0.3 0.4 0.5
1
23
4
5
6
78
9
10
11
12
1314
1516
17
18
1920
21
2223
24
252627
28
29
3031
3233
3435
36
A
C
B
D
Distance to K-Nearest Neighbor
0 0.1 0.2 0.3 0.4 0.5
1
23
4
5
6
78
9
10
11
12
1314
1516
17
18
1920
21
2223
24
252627
28
29
3031
3233
3435
36
A
C
B
D
Figure 4. Dendrogram from cluster analysis based on thirteen water quality variables of the four main water
reservoirs in Jordan. Wadi Al-Arab Reservoir (cluster A), Zeqlab Reservoir (cluster B), Al- Wihdeh Reservoir (cluster C) and King Talal Reservoir (cluster D)

www.ccsenet.org/ijc International Journal of Chemistry Vol. 3, No. 2; June 2011
Published by Canadian Center of Science and Education 87
- 0.1 0.1 0.3 0.5- 0.8
- 0.4
0
0.4
0.8
Loadings on PC 1
Lo
adin
gs
on
PC
2
pH
Cond
Fe
Cu Ca
Mg Na
K
NO3
Br
Cl
SO4
CO3
- 0.1 0.1 0.3 0.5- 0.8
- 0.4
0
0.4
0.8
Loadings on PC 1
Lo
adin
gs
on
PC
2
pH
Cond
Fe
Cu Ca
Mg Na
K
NO3
Br
Cl
SO4
CO3
Figure 5. PCA loading/loading plot in the first and second principal component (PC1 PC2) respectively
Related Documents