Originally published as: Galbraith, C. G., Clarke, D. B., Trumbull, R. B., Wiedenbeck, M. (2009): Assessment of Tourmaline Compositions as an Indicator of Emerald Mineralization at the Tsa da Glisza Prospect, Yukon Territory, Cananda. - Economic Geology, 104, 5, 713-731 DOI: 10.2113/gsecongeo.104.5.713

Welcome message from author
This document is posted to help you gain knowledge. Please leave a comment to let me know what you think about it! Share it to your friends and learn new things together.
Transcript
Originally published as: Galbraith, C. G., Clarke, D. B., Trumbull, R. B., Wiedenbeck, M. (2009): Assessment of Tourmaline Compositions as an Indicator of Emerald Mineralization at the Tsa da Glisza Prospect, Yukon Territory, Cananda. - Economic Geology, 104, 5, 713-731 DOI: 10.2113/gsecongeo.104.5.713
Assessment of Tourmaline Compositions as an Indicator of Emerald Mineralization at the Tsa da Glisza Prospect, Yukon Territory, Canada
Christopher G. Galbraith*
Department of Earth Sciences, Dalhousie University, Halifax, NS, Canada B3H 3J5
D. Barrie Clarke
Department of Earth Sciences, Dalhousie University, Halifax, NS, Canada B3H 3J5
Robert B. Trumbull
GFZ German Research Centre for Geosciences, Telegrafenberg, 14473 Potsdam, Germany
and Michael Wiedenbeck GFZ German Research Centre for Geosciences, Telegrafenberg, 14473 Potsdam, Germany
Abstract
Tourmaline is ubiquitous at the Tsa da Glisza emerald prospect, Yukon Territory, occurring as
porphyroblasts in greenschist-facies meta-volcanic and ultramafic rocks, and as crystals in granites,
aplites, and quartz-tourmaline veins. The principal occurrence of emerald is along contacts between
the quartz-tourmaline veins and mafic country rocks, but it also occurs in the aplites. We assess the
potential of using tourmaline compositions as a guide to emerald mineralization at Tsa da Glisza based
on major-element, trace-element (Li, Be, Sc, Cr, V, Mn, Ni, Co, Cu, Zn, As, Rb, Sr, Y, Zr, Nb, Cd,
Mo, Sn, Sb, Cs, Ba, Ta, W, Bi, Pb, Th, and U), REE (La, Ce, Pr, Nd, Sm, Eu, Yb, Lu), and boron
isotopic data. The tourmaline compositions encompass Na-Fe schorl, Na-Mg dravite, and Ca-Mg uvite
and show a strong dependence on host-rock chemistry. Tourmalines closely associated with emeralds
(intergrown in same hand specimen) are slightly more iron-rich dravites compared with those from
schists and alteration zones lacking emerald. Binary and ternary plots of major- and trace-element
concentrations show that emerald-associated tourmalines occupy restricted ranges of composition,
albeit considerably overlapping those not associated with emerald. Trace-element concentrations in
tourmaline associated with emerald mineralization include 20 – 40 ppm Co, ~50 ppm Ni, 0.5 ppm La,
0.5 ppm Y, 100 – 200 ppm Li, and 300 – 600 ppm Zn. Boron isotope (δ 11B) values range from -15.6
to -4.2 ‰ for all tourmalines (n=80). Low values are most common, and are consistent with a
dominantly granitic source of boron. Higher isotope ratios (> -8 ‰ ) are confined to tourmalines from
country rocks and quartz veins, suggesting a contribution of isotopically heavy B from the mafic-
* Contributing author: [email protected]
1
ultramafic series. The three emerald-related samples have a restricted, intermediate range of -10.3 to
-7.9‰.
Multivariate cluster analysis defines two populations of tourmalines corresponding to host-
rock type. One cluster includes tourmaline from country rocks and quartz-tourmaline veins and the
other is dominated by samples from granites and aplites. The latter cluster also includes all
tourmalines associated with emeralds. With trace-element concentrations and boron isotope values as
input variables, one stepwise discriminant function analysis model produces a 91% correct
classification matrix and an 88% correct jackknifed classification matrix. This result suggests that
tourmaline has potential as an indicator mineral at the Tsa da Glisza prospect, and possibly also in the
exploration for emeralds elsewhere.
Introduction
Emerald, the green variety of gem beryl, can form in a variety of environments but its
occurrence invariably requires chemical input from two highly contrasting sources. Beryllium, an
essential constituent of beryl, is a trace element in most rocks and tends to concentrate in felsic rocks,
particularly granitic pegmatites. In contrast, the trace elements Cr and V, needed for the emerald green
color, have low concentrations in felsic rocks, but high concentrations in most mafic and ultramafic
rocks. One major geological setting for emerald formation worldwide is in mafic to ultramafic schists
(greenstones) associated with granitic intrusions or felsic metavolcanic rocks. In these schist-hosted
emerald deposits, a granitic magma or hydrothermal fluids derived from granitic or felsic volcanic
bodies, provides the source for Be, Al, and Si, whereas the greenstones provide the Cr (±V). Examples
of such schist-hosted emerald deposits are Gravelotte, South Africa (Grundmann and Morteani, 1989),
Habachtal, Austria (Grundmann and Morteani, 1989; Trumbull et al., 2008b), Kafubu, Zambia (Seifert
et al., 2004; Zachariás et al., 2005), Sikait-Zabara-Umm Kabo, Egypt (Grundmann and Morteani,
2007), and Khaltaro, Pakistan (Laurs et al., 1996). Tourmaline is common in association with beryl in
the schist-type emerald deposits, presumably because boron concentrations also tend to be high in Be-
rich plutons and their derived fluids.
This paper deals with tourmalines from the Tsa da Glisza (TdG) emerald prospect in Yukon
Territory, Canada (Groat et al., 2002, 2005; Marshall et al., 2003; Neufeld, 2004; Neufeld et al., 2003,
2
2004; Davison, 2005), which is primarily schist-hosted and occurs within a greenstone terrane
intruded by granite, aplite dikes, and hydrothermal quartz-tourmaline veins (QT). Tourmaline is
widespread at TdG and occurs in the metabasic and ultrabasic schists, in granite and aplite dikes, in
quartz-tourmaline veins that cut the schists, and as granular aggregates in highly-altered gossan or
fault zones.
The purpose of this study is to assess the utility of tourmaline composition as an indicator
mineral for emerald mineralization. Indicator minerals that are useful in exploration may be of two
types. In one type, the indicator mineral or mineral assemblage is compositionally distinctive for the
chemical environment of interest, and is modally much more abundant than the mineral of economic
interest (e.g., chrome pyrope, chrome diopside, and magnesian ilmenite as potential indicators of
diamond in kimberlite). In the other type, the indicator mineral has a wide range of chemical
compositions, and can modify its chemical composition to reflect the presence of the mineral of
economic interest.
Tourmaline has potential as an indicator mineral of this second type. With the formula
XY3Z6(BO3)3Si6O18(O,OH,F)4, the tourmaline group is one of the most chemically variable silicates,
having 14 recognized mineral species (Hawthorne and Henry, 1999) and an extremely wide range of
cation sizes and charges that can occupy the X, Y, and Z sites. Add to these properties the large P-T
stability field of tourmaline, its propensity to develop and retain chemical zoning, and its resistance to
alteration and weathering, and it thus is an excellent mineral archive. The chemical composition of
tourmaline has proven useful as a proximity indicator for a range of mineral deposits (Henry and
Guidotti, 1985; Jolliff et al., 1986; Clarke et al., 1989; Pirajno and Smithies, 1992; Slack, 1996; Keller
et al., 1999; Yu and Jiang., 2003; Garda et al., 2003; Jiang et al., 2004). Furthermore, the B-isotope
compositions of tourmaline may discriminate among different protoliths and/or fluid sources in
mineral deposits (e.g., Palmer and Slack, 1989; Jiang et al., 1999; Trumbull and Chaussidon, 1999;
Krienitz et al., 2008; Trumbull et al., 2008a, 2008b; Xavier et al., 2008).
The scope of our investigation of the Tsa da Glisza emerald prospect is based on in-situ
microanalysis of tourmaline from 35 samples representing emerald-bearing and emerald-free
assemblages in a variety of host-rock types. Our dataset comprises major- and trace-element analyses
3
and B-isotope ratios (11B/10B). Data interpretation is based on a combination of standard bivariate and
trivariate plots, as well as multivariate statistics (cluster and discriminant function analysis).
Geological Setting
Regional geology
The Tsa da Glisza ("green stones" in the Native Kaska language; formerly Regal Ridge)
emerald prospect occurs in the Pelly Mountain Range, southern Yukon Territory, several kilometers
north of the Tintina Fault. This region is part of the Yukon-Tanana terrane, which is primarily
composed of pre-Late Devonian metamorphosed quartz-rich meta-clastic and carbonate rocks, and
Late Devonian to Mississippian metavolcanic and meta-plutonic rocks that formed in a continental arc
setting (Groat et al., 2002). The principal rock types present in the vicinity of the deposit are Devonian
greenschist-facies ultramafic and mafic schists and meta-plutonic rocks (Fig. 1). The ultramafic rocks
consist of meta-pyroxenite and meta-peridotite, whereas the mafic rocks are boninitic metabasalt and
meta-andesite that have been altered to chlorite and biotite schists, some displaying well-defined
foliation. The mafic and ultramafic rocks have also undergone variable degrees of serpentinization. A
Cretaceous peraluminous granitic pluton (ca. 112 Ma; Groat et al., 2002) intruded the Devonian rocks,
creating a weak contact aureole and injecting an array of aplite sheets and quartz-tourmaline veins,
both of which extend continuously or discontinuously for up to hundreds of meters into the
greenschists. Contact metamorphism and weathering of the country rocks produced a gossan-like mass
of jarosite, limonite, phlogopite, talc, and tourmaline.
Mineralization model for emerald
The quartz-tourmaline veins and aplite sheets appear to have transported beryllium and boron
into the country rocks from the granitic intrusion, promoting crystallization of beryl along boundaries
of the veins near the contacts with the country rock (Neufeld et al., 2003, 2004) and the widespread
formation of tourmaline (Groat et al., 2002, 2005). A Cretaceous timing of mineralization is inferred
from an Ar-Ar plateau age of 108.7 ± 1.2 Ma for micas associated with emerald in a schist, which
supports the argument of a granite association (Groat et al., 2002, 2005). The mafic and ultramafic
4
greenschists are the probable sources of the chromium and vanadium (~960 ppm Cr and ~160 ppm V
in bulk rock), which impart the green color to the emeralds (Groat et al., 2002), although Cr appears to
be the dominant chromophore in the Tsa da Glisza emeralds (Groat et al, 2002, 2005; Neufeld et al.,
2003, 2004). In addition to their elevated levels of Cr and V, the TdG emeralds also contain high
concentrations of Sc and low concentrations of Fe (Groat et al., 2002). Emerald and tourmaline
mineralization coincided with the later stages of regional deformation of the Devonian rocks, and with
contact metamorphism from the granite (Groat et al., 2002, 2005, Neufeld et al., 2003, 2004).
Geothermobarometry by Marshall et al. (2003) indicated depths of mineralization between 3 and 8
km, and temperature between 365° and 500°C. Emeralds are mainly confined to the contacts between
quartz-tourmaline veins and mafic greenschists, to zones of limonite-phlogopite-talc-tourmaline
alteration (Fig. 2A, B), and to mafic schist (i.e., not in the ultramafic rocks). Rarely, emeralds or
colorless beryl also occur within the quartz-tourmaline veins (Fig. 2A, C) and the aplites. Field
observations show that emerald-bearing rocks typically contain tourmaline, but the presence of
tourmaline in veins and alteration zones does not necessarily indicate the occurrence of emeralds (see
below).
Tourmaline and emeralds at Tsa da Glisza
The use of tourmaline as an indicator for emerald mineralization depends on a genetic
association between these two minerals. Evidence that they are genetically related includes the
following:
(i) Spatial – Tourmaline and emerald occur in both the endo- and exo-contact regions of
the granite body itself, and of its derivatives (aplite, pegmatite, quartz veins). Aplites
and pegmatites, clearly derived from the granite, contain tourmaline and either beryl or
emerald. Also, tourmaline-bearing quartz veins occur in both the granite and country
rocks, and in areas where the country rocks are most affected by contact
metamorphism, these veins are associated with emeralds (Groat et al. 2002; Neufeld et
al. 2003, 2004).
5
(ii) Textural – Groat et al. (2002, Figs. 8e,f) illustrated the existence of subhedral to
euhedral inclusions of tourmaline in emerald, and one of our samples (Fig. 2B) shows a
single quench-textured intergrowth of tourmaline and emerald in an aplite dike. Figures
2C and 2D also show intergrown tourmalines and emeralds, in some cases with their
long crystallographic axes aligned in a common plane, indicating that tourmalines and
emeralds are coeval at TdG.
(iii) Temporal – A compilation of 40Ar/39Ar and U-Pb ages for the intrusion and
mineralization at Tsa da Glisza (Mortensen et al. 1999; Groat et al. 2002) suggests that
only one intrusion-mineralization event occurred in this area at 108-112 Ma.
(iv) Chemical – In his chemical classification of mineralized granites, Strong (1981)
identified a Be-B-Li-P group, characterized by high concentrations of these cations. By
this definition, the pluton at TdG is a peraluminous Be-B-Li-P granite, and it appears to
be a suitable source for both the B for tourmaline and the Be for beryl/emerald.
On the strength of this evidence that tourmaline and emerald formed in the same magmatic-
hydrothermal event and are paragenetically related, we believe the conditions are met to test the
potential of tourmaline composition as an indicator mineral for emerald mineralization at TdG.
Analytical Methods
Major-element analyses were obtained from polished thin sections of the 35 tourmaline-bearing
rock samples. Trace-element and B-isotope analyses reported were obtained on polished grain mounts
containing from 2 to 5 tourmaline grains from each sample.
Electron Microprobe
Major-element analyses of tourmaline were obtained at Dalhousie University using the JEOL
8200 electron microprobe with a spot size of 5 μm. From 5-11 points on various tourmaline grains
were measured on each sample. In both the country rocks and the veins, some tourmalines display
optical zoning (Fig. 2G, H). In cases of zoned tourmalines, analyses were obtained from the rims and
the cores; however, only one sample (QTMO7) indicated significant chemical zoning. The mean
6
values are reported in Table 1a. Elements determined were: Si, Al, Na, Ca, Fe (total), Mg, Mn, Cr, V,
Ti, K, and F. Jadeite was used as standard for Na, sanidine for K, Al, and Si, pyrolusite for Mn, garnet
12442 for Fe; and Kakanui kaersutite for Ca, Mg, and Ti. Pure metals were used as standards for Cr
and V. Boron was not determined, and concentrations in Table 1 are reported with a constant value of
10.4 wt% B2O3, approximating a stoichiometric 3.00 B atoms per formula unit (apfu). The major-
element concentrations, including Cr and V, were converted to apfu, based on 31 oxygens, and
distributed to cation sites according to the following scheme. Elements Na, Ca, and K occupy only the
X-site. If the sum Na + Ca + K is less than 1.00 apfu, the remainder represents vacancies in the X-site.
The T-site is occupied by Si, and enough Al to total 6.00 cations. Elements Fe, Mn, Ti, Cr, and V
occupy only the Y-site. The Mg and Al can occupy both Y- and Z-sites; whereby we assume that for
Ca in the X-site, charge balance is maintained by assigning an equal amount of Mg in the Z-site (uvite
component). All remaining Mg is assigned to the Y-site. Some Al can be added to the Y-site such that
the sum of all cations is equal to 3.00 (i.e., Fe + MgY + Mn + Cr + V + Ti + AlY = 3.00). Whatever Al
remains must therefore occupy the Z-site; in all cases of TdG tourmalines, the number of cations in
this site is equal to, or close to, 6.00. The F-site consists of 4.00 anions, where the assigned OH = 4.00
- F. Although O may also occupy this site, for simplicity we assume it does not. Our assessment of
tourmaline as an indicator mineral is independent of the method chosen to calculate structural
formulae.
Laser Ablation ICP-MS
Trace-element analyses were performed on 35 samples by Laser Ablation-Inductively Coupled
Plasma-Mass Spectroscopy (LA-ICP-MS) at Memorial University of Newfoundland (MUN), using a
HP4500 ICP-MS coupled to a NUWAVE UP213nm Nd:YAG laser. Elements measured were Li, Be,
B, Al, Sc, Cr, V, Mn, Ni, Co, Cu, Zn, As, Rb, Sr, Y, Zr, Nb, Mo, Sn, Sb, Cs, Ba, La, Ce, Pr, Nd, Sm,
Eu, Yb, Lu, Ta, W, Bi, Pb, Th, and U. Ablations were performed in helium carrier gas, which was
combined with argon just prior to the feed to the torch. Nebulizer flow rates were about 0.9 l/min He
and 0.75 l/min Ar. Laser energy was about 0.35 mJ (about 7 J/cm2) at a laser repetition rate of 10 Hz,
producing a 80 µm diameter spot on the sample. The trace-element concentrations were calculated
7
using Si as an internal reference and the average SiO2 content determined for each sample by electron
microprobe analysis. Quadrupole settling time was about 2 msec and the integration (dwell) time was
10 msec on each mass. The sampling time per sweep was 0.461503 sec with an acquisition window of
about 100 sec. Approximately 30 sec of gas background data (with the laser beam off) were collected
prior to each 60 sec ablation of standards and unknowns. NIST glass NBS 612 was used as reference
(calibration) material and analyzed in the first two and last two positions of each run; basalt glass
(USGS) BCR-2G was analyzed as an unknown twice in each run. Element values for NBS 612 are
from Pearce et al. (1997) and for BCR-2G are from compilations at MUN (S. E. Jackson, unpub.
data). Counts-per-second data were reduced using MUN’s in-house CONVERT and LAMTRACE
spreadsheet programs, which employ procedures described by Longerich et al. (1996). From 5 to 7
points were analyzed on each sample with the exception of ECRFW5 that was too small for more than
three points. In the zoned sample, QTMO7, analyses were obtained from various points, but there was
no identifiable difference in trace elements. Furthermore, both the LA-ICPMS-MS and SIMS analyses
(below) were made on embedded and polished grain fragments too thick for optical examination, so
identification of "rim" and "core" domains is not unambiguous. Values in Table 2 are averages for
each sample. Some individual analyses show spikes in Cs and W that probably represent mineral
inclusions within the tourmaline, not noticed in optical examination but intersected by the laser.
Secondary Ion Mass Spectrometry (SIMS)
The boron isotope compositions of tourmaline were determined with the CAMECA ims6f
instrument at GFZ Potsdam. The analyses were performed after ICP-MS and electron microprobe
analyses on the same sample mounts after re-polishing with alumina and distilled water, ultrasonic
cleaning with ethanol, and coating with a ~35nm-thick layer of high-purity gold. Only 34 of 35
samples could be measured for boron isotope concentrations; no data are reported for sample
ECRFW5. The SIMS setup used a nominally 12.5 kV 16O- primary beam focused to about 10 µm
diameter, with a beam current of 4 nA and a count rate on 11B of about 400 kHz. Prior to each analysis
a three minute pre-burn was used in order to remove the gold coat and to establish equilibrium
sputtering conditions. The mass-resolving power M/ΔM was 1360, which is sufficient to separate the
8
isobaric interference of 10B1H on the 11B mass station and the 9Be1H peak on 10B. A 50µm-diameter
contrast aperture, 1800µm-field aperture (equivalent to a 150 µm field of view), and 50 V energy
window were used with no voltage offset. Each analysis consisted of 100 scans of 10B (2 s) and 11B (1
s). Instrumental mass fractionation (IMF) and analytical quality were determined by replicate analyses
of tourmaline reference materials dravite HS 108796, elbaite HS 98144 and schorl HS 112566 (Dyar
et al., 2001) and tourmaline B4 (Tonarini et al., 2003). Internal precision for individual analyses was
typically 0.3-0.5 ‰ (1 sd), and the repeatability on reference samples averaged 1 ‰ (1 sd). The
variations in mass fractionation for the reference samples is less than 1.5 ‰, which we believe to be
the best estimate of the reliability of the data set. Boron isotope compositions are reported in δ11B
notation (δ11B = {(11B/10BBsample/ B/ Breference11 10
B ) - 1} x 1000) relative to NBS 951, which has a reported
11B/10B ratio of 4.04362 (Cantanzaro et al., 1970). Our procedure was to measure two points on each
sample mount, generally one each on two separate grains, and a third point if the first two values
differed by more than 2‰. This was the case for only 3 of the 34 samples, and in these, δ 11B
variations were 4 to 6 ‰ (Table 3).
Geochemical Results
Major Elements
Tables 1A and 1B show the major-element compositions of the 35 analyzed TdG tourmalines,
and their structural formulae, respectively. Figure 3A uses X-site occupancy data to determine that
most of the tourmalines belong to the alkalic group of Hawthorne and Henry (1999); five samples
from the country rocks and quartz-tourmaline veins are calcic in this scheme. Figure 3B shows the
cation ratios Na/(Na+Ca) in the X-site and Fe/(Fe+Mg) in the Y-site, which classify most of the TdG
tourmalines as intermediate dravite and schorl. Five tourmalines from mafic country rocks and quartz-
tourmaline veins are compositionally different from the others and classify as uvite in this system.
Major-element correlations were assessed with Pearson correlation coefficients. Element pairs with
strong negative correlation coefficients (r2< -0.85) are Fe-Mg (Fig. 4A, Table 4), Ca-Na (Table 4), Ca-
Al, and Mg-Al (Fig. 4B), all of which are related to cation substitution in the tourmaline structure. The
only major-element pair with a strong positive correlation coefficient (r2 > 0.85) is Ca-Mg, which
9
presumably represents the uvite substitution and a chemical influence of the mafic country rocks. As
mentioned, chemical zoning is generally lacking. Significant core-rim differences occur only in
sample QTMO7, where rims are Mg-rich dravite and cores are Fe-rich schorl.
Tourmaline compositions are at least partly dependent on host-rock chemistry; our results
distinguish tourmalines from country rocks and granites. In general, the country rock tourmalines are
uvite-dravite, whereas the granite-related tourmalines are dravite-schorl. Granite-related tourmalines
are systematically higher in MnO, Al2O3, and Na2O, and lower in CaO, relative to tourmalines from
the country rocks (Figs. 3 – 4). Tourmaline compositions from the quartz-tourmaline veins overlap the
ranges of the other two sample types. Tourmalines associated with emerald have major-element
compositions that are transitional between those from country rocks and those from intrusive (Fig. 3 –
5).
Trace Elements
Table 2 presents trace-element compositions of the TdG tourmalines grouped according to
host lithology, and shown as averages of up to five analyses from each of the 35 samples. A first-order
feature of these data is the variability in concentrations, some of which (e.g., Zr, W, Cs) may relate to
unseen mineral inclusions intersected by the laser pit. These cases show up as outliers in the dataset,
and even excluding them, the standard deviation for most trace elements is over 100% of the mean for
each host-rock category (Table 2). It is notable that tourmalines from emerald-bearing country rock
(prefix ECR on Table 2) have lower compositional variations than tourmalines from the other country-
rock samples (relative standard deviations less than 50%). This limited variation may partly reflect the
smaller number of emerald-bearing vs. barren samples analyzed. Not surprising given these large
variations, few trace-element pairs show strong Pearson correlation coefficients (r2 > 0.85).
Exceptions are positive correlations among the rare earth elements (La-Ce, La-Nd, Ce-Nd) and Y-Yb
(Table 4), which are expected based on the close geochemical similarity of these elements. An
exceptionally strong correlation is Li-Zn (r2 = 0.95), which is not readily explained by crystal-
chemical or geochemical arguments, and thus may reflect a characteristic of the local fluid-rock
system. None of the element pairs shows strong negative correlations.
10
The mean trace-element concentrations in Table 2 show some systematic variations according
to host rock type (Fig. 5). In general, tourmalines from the granitic rocks have higher concentrations
of Li, Zn, Nb, Ta, REE, Pb, Th, and U than the country-rock tourmalines, and lower Sr, Sc, V, Co, and
Ni. Tourmalines from quartz-tourmaline veins are not compositionally distinctive. Given the higher
contents of V, Sc, Co and Ni in tourmalines from the country rocks, one might also expect higher Cr,
but the ranges of Cr in granite-hosted and metabasite-hosted tourmalines are approximately the same,
and both sample groups show large variations (Table 1). Tourmalines associated with emerald from
TdG have similar and variably high Cr contents as those from the emerald-free samples; however, the
highest Cr concentration in tourmaline in this study is 8572 ppm, from an emerald-bearing sample
(ECRFW5). The trace-element data also lack any correlation of Be concentrations in tourmaline with
the presence of emerald in the samples (Table 2).
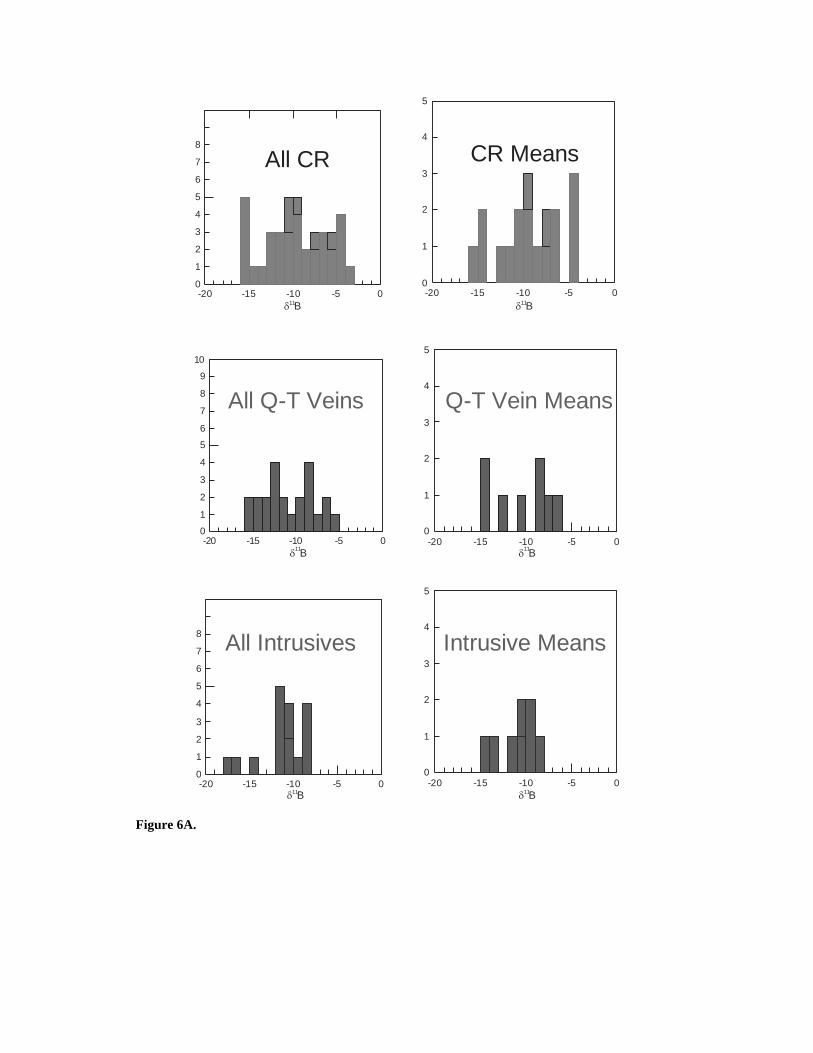
Boron Isotopes
Boron isotope ratios in 80 analyses of 34 TdG tourmalines range from -17.2 to -3.8 ‰ in the
δ11B notation (Table 3 and Figure 6). The maximum within-sample variation is 6 ‰ and all but three
samples show variations less than 2 ‰. The ranges of δ11B values for tourmalines from different host
rock types overlap, but the granite-hosted tourmalines, on average, are isotopically lighter than those
in the country rocks. None of the tourmalines from granitic host rocks has a B-isotope composition
heavier than -9 ‰, whereas about half of the country-rock tourmalines display δ11B values of -8 to -
4‰ (Fig. 6). The quartz-tourmaline vein samples have a range of B-isotope ratios that overlaps those
of both other sample groups. Tourmalines from emerald-bearing samples have δ11B values in the
range from -11 to -6 ‰, which is intermediate and narrower than the total range at Tsa da Glisza, also
a characteristic of the major- and trace-element compositions.
Previous studies have noted a general lack of correlation between chemical and B-isotope
compositions in tourmaline (Krienitz et al., 2008; Trumbull et al., 2008a) and this is also true for the
TdG tourmalines. Pearson correlation coefficients for δ11B values and with other chemical variables
are consistently low; however, δ11B and Be do show a weak negative Pearson correlation coefficient
11
(r2 = -0.47) for the entire data set. This δ11B - Be negative correlation increases to r2 = -0.71 for
tourmalines in the country rocks only (Fig. 6B).
Discussion
The significance of the chemical and boron isotopic compositions of tourmalines from TdG is
two-fold: (i) the chemical variations provide evidence about the sources of elements for the
tourmalines; and (ii) statistical treatment of the data shows some potential to distinguish between
emerald-related and barren tourmalines.
(i) Source constraints
Groat et al. (2002) suggested that the essential element boron in the TdG tourmalines originated
from the granite intrusion, as did the beryllium in the emeralds. A granitic source of boron is partly
supported by our B-isotope results. A recent compilation by Marschall and Ludwig (2006) showed
that tourmalines from granite and granitic pegmatite host rocks worldwide have δ 11B values equal to
or lower than that of average continental crust at -10 ± 3‰ (Kasemann et al., 2000). The relatively
low B-isotope values of most TdG tourmalines (Fig. 6) are consistent with a granitic origin for the
boron. However, several of the TdG tourmalines from country rocks and veins display δ 11B values
significantly higher than -7‰, which require a contribution of isotopically heavier boron. A likely
source for heavy boron in this setting is the greenstone lithologies (Fig. 1), because MORB and,
especially, seawater-altered oceanic crust have zero to positive δ 11B values (Palmer and Swihart,
1996). A possible analogue for the TdG data is provided by tourmaline B-isotope compositions from
the Habachtal emerald deposit, which is hosted by a serpentinite-mafic schist sequence (Trumbull et
al., 2008b). The range of δ 11B values for tourmaline in mafic schist at Habachtal is -9 to -5‰, similar
to that at TdG, whereas tourmaline from metapelite country rocks at Habachtal has considerably lower
values (-14 to -10‰), typical for continental crust and in agreement with the δ 11B values of granite-
hosted tourmalines at TdG. Trumbull et al. (2008b) interpreted the contrasting B-isotope values of
Habachtal tourmaline as reflecting different fluid sources, one of regional metamorphic origin that
12
equilibrated with metapelites and the other of local origin confined to serpentinized shear zones in the
mafic schists.
A rigorous interpretation of the isotopic composition of tourmaline from TdG requires more
detailed investigations than the reconnaissance-level of this study. Nonetheless, the present findings
are consistent with a two-fluid genetic model like that proposed for the Habachtal deposit. It is
significant in this respect that O- and H-isotope variations in TdG emeralds reported by Groat et al.
(2002) also suggest an origin involving isotopic mixing between metamorphic and magmatic fluids.
The systematic variations of major and trace-element concentrations in TdG tourmalines
according to host-rock type clearly indicate contributions from both the country rocks and granitic
rocks or magmatic fluid, the details of which are a complex function of element availability and
solubility in the magma-fluid-rock system(s). In general, tourmalines in the mafic country rocks are
dravite (Mg-Ca rich), whereas those in the granitic rocks are schorl (Fe-Na rich). Sensibly, the
characteristic elements contributed by the mafic country rock source are Ca, Mg, Sc, V, Co, Ni, and
Sr, and those contributed by the granite source are Na, Al, Fe, Li, Zn, Nb, Ta, REE, and Pb (Tables 1,
2). Apparently, the larger the surface area/volume ratio of the granitic component at sample sites,
and/or the larger the role of fluids (QT > aplite > granite), the greater is the evidence for hybridization
of granitic and country-rock components in the tourmalines.
(ii) Chemical Distinctions
Of primary interest in this study is the possible utility of tourmaline as an indicator mineral for
emerald exploration. The simplest approach to compositional discrimination is the use of binary plots
comparing mineralized (i.e., emerald-associated) and barren samples (Fig. 3 – 5). On such plots,
tourmalines associated with emerald occupy restricted ranges of both major- and trace-element
composition, which generally lie in an intermediate position relative to those of barren tourmalines
from the granitic and country-rock hosts. In those simple terms, there appears to be no diagnostic
composition of tourmaline that signals the presence or absence of emerald. Because Cr and V are the
main chromophores distinguishing emerald from common (e.g., white to pale green) beryl, logically
these elements should be high in tourmaline associated with emerald mineralization. Some TdG
13
tourmaline grains do have high Cr and V concentrations, and the highest Cr content in a tourmaline
(8572 ppm Cr; sample ECRFW5) is a sample closely associated with emerald. However, elevated Cr
concentrations (>2000 ppm) also occur in barren tourmaline samples from the country rock and
granitic hosts, so Cr concentration alone is an unreliable guide for emerald mineralization. Similarly,
because Be is an essential element of beryl, one might expect higher Be concentrations in tourmalines
associated with emeralds, but no pattern appears to exist for Be in TdG tourmalines (Table 2, Fig. 6b),
probably because of crystal-chemical limitations on Be substitution in tourmaline (Grew, 2002). A
better approach may be to simultaneously examine groups of elements, such as Fe - Mn - Ni - Zn,
which together outline a distinctive geochemical signature in emerald-related tourmalines.
Multivariate statistical methods are ideally suited to such an approach. They have the ability to
define natural groupings (cluster analysis) among unclassified samples, or to discriminate among
defined groups (discriminant function analysis), using many compositional variables simultaneously.
In geological applications, such multivariate statistical procedures encounter logistical and financial
disadvantages because the number of samples should ideally be large relative to the number of
variables. In this respect, with our database of 34 samples and 30 variables, the statistical analysis
must be considered provisional.
We performed cluster and discriminant function analyses on the TdG tourmaline data with the
following restrictions and conditions:
1. Because of closure problems and tourmaline stoichiometry, the major elements Si, Al, B, Fe, Mg,
Ca, and Na are not independently variable and were excluded.
2. We included the minor elements (Ti, Mn, K, Cr, V, and F) and those trace elements for which all
samples have concentrations above the limit of detection, thus including Li, Be, Sc, Co, Ni, Zn,
Sr, Y, Nb, Sn, Sb, Cs, Ba, La, Ce, Nd, Eu, Yb, Ta, W, Pb, Bi, U, and excluding Cu, As, Rb, Zr,
Mo, Cd, Pr, Sm, Lu, and Th. The addition of δ 11B gives a total of 30 variables.
3. We defined two categories of tourmaline-emerald association based solely on the proximity of the
two minerals, regardless of host-rock lithology. A “narrow” association (tourmaline and
emerald occurring in the same hand specimen) holds for samples ECR322807, ECR322810,
EAPMT1; and a “wide” association (tourmaline occurring arbitrarily within 10 m of an emerald
14
in outcrop) holds for the three “narrow” samples, plus samples CR322807B, CR776T4,
CRFW2, APT1, QT322807A, QTFW3, QTHRT3, QTSUM1.
4. For each “narrow” and “wide” sample category, we generated two models. The "complete" model
starts with and retains all 30 chemical variables, regardless of their discriminating power. The
"stepwise" model starts with 30 variables, but sequentially eliminates variables which contribute
least to the discrimination. A significance level of 0.15 was used as a threshold, so that at each
step the variable with largest P value greater than 0.15 (smallest "F-to-remove") is dropped. The
procedure terminates when no further variables can be eliminated.
5. We also produced two classification matrices for each model, one in which all the samples define
the discriminant function to classify each of the samples (classification matrix), and the other in
which n-1 samples define the discriminant function used to classify each nth sample (jackknifed
classification matrix). Given the relatively small sample size, the jackknifed matrix is probably
more meaningful.
The cluster analysis method plots all variables in multidimensional hyperspace, and then detects
natural groupings (clusters) in the dataset. The investigator specifies only the number of clusters to be
defined based on the context of the study and expectation that the clusters have geological meaning. In
our study, we initially defined two clusters with the potential meaning being emerald-related vs.
unrelated samples regardless of host lithology; or alternatively, a host-lithologic control with little or
no relation to the presence of emeralds. The results of the two-cluster models (Table 5) show that the
statistically-defined clusters relate mostly to host lithology. One cluster consists of tourmalines within
mafic country rocks and in quartz-tourmaline veins, whereas the other cluster consists of tourmalines
from granite and aplites, including the three emerald-associated tourmalines regardless of host
lithology. Subsequent models run for more than two clusters did not differ significantly from the two-
cluster model, and mainly resulted in isolation of outlier samples.
Discriminant function analysis (DFA) also plots all variables in multidimensional hyperspace
and then finds a mathematical function of the variables that best separates the investigator-defined
populations, which in our study are tourmalines with and without an emerald association (using the
"narrow" and "wide" definitions of the term explained above). Table 6 summarizes all the
15
discriminant function solutions for the "complete" and "step-wise" modes of calculation, also
explained above. Model 1 (narrow, complete) produced a 100% correct classification matrix, but the
percentage of correctly-classified tourmalines in the jackknifed matrix fell to 62% (1 of 3 emerald-
associated tourmalines misclassified as emerald-free, and 12 of 31 emerald-free tourmalines
misclassified as emerald-associated). Model 2 (narrow, stepwise), which retained only 9 variables
(Mn, Sc, V, Ni, Nb, Sn, Ba, Ce, and W), produced a 91% correct classification matrix for tourmalines
associated with emerald, and the jackknifed matrix was 88% correct (with 3 of 31 emerald-free
tourmalines misclassified as emerald-associated). Model 3 (wide, complete) produced a 97% correct
classification matrix for tourmalines associated with emerald, but the percentages of correctly-
classified tourmalines for the jackknifed matrix is only 50% (7 of 11 emerald-associated tourmaliness
miclassified as emerald-free, and 10 of 23 emerald-free tourmalines misclassified as emerald-
associated). Finally, Model 4 (wide, stepwise), retaining only 6 variables (Co, Ni, Sr, Sn, Ba, Ce),
produced an 88% correct classification matrix, and a 79% correct jackknifed matrix (2 of 11 emerald-
associated tourmalines misclassified and 5 of 23 emerald-free tourmalines misclassified).
In summary, the DFA results using the "narrow" definition of tourmaline-emerald association
(Models 1 and 2) produced better discriminations than the "wide" ones (Models 3 and 4). Also, based
on the jackknifed results, the narrow stepwise Model 2 is preferable to the narrow complete Model 1.
The “wide” models perform less well. These models tacitly assume that the chemical signal of
emerald-bearing fluids influences the compositions of tourmalines growing at distances up to 10 m.
The poorer performance of the "wide" model classification matrices suggests such influence does not
occur. These “wide” models may still be useful from an exploration point of view, because emerald-
unassociated tourmalines misclassified as emerald-associated (false positives) are preferable to the
reverse case (false negatives).
In our preferred Model 2, DFA uses only Mn, Sc, V, Ni, Nb, Sn, Ba, Ce, and W as
discriminators. The inclusion of V, Sc and Ni makes sense in terms of emerald mineralization,
because these elements indicate input from the mafic schist, and W also makes geological sense, based
on the scheelite association with tourmaline-rich zones of emerald mineralization (Groat et al. 2002;
Neufeld et al., 2003). However, the absence of Cr in the DFA model is enigmatic. The B-isotope
16
composition of tourmalines does not contribute significantly to the discriminant function. Also,
despite inclusion of δ 11B as a variable in the complete models, all stepwise solutions eliminated it as a
variable. Finally, we note that the particular combination of elements identified as significant for
discrimination in this study may be specific to the TdG deposit and thus may not be universal for
schist-hosted emerald deposits generally. In any case, the outcome of this study does demonstrate the
potential for DFA to distinguish between tourmalines associated with emerald mineralization and
those that are not.
Conclusions
We have investigated the major-element, trace-element, and boron isotopic composition of
tourmaline to evaluate its utility as an indicator mineral for emerald mineralization in the Tsa da
Glisza prospect, Yukon Territory. Tourmalines occur in metamorphosed mafic-ultramafic rocks of the
Devonian Fire Lake Formation as well as in granitic-aplitic veins associated with a Cretaceous granite
pluton, and in quartz-tourmaline veins. The major- and trace-element data show a strong influence of
host lithology on tourmaline composition. Granite- and aplite-hosted tourmalines have low boron
isotope values (averages: δ11B = -14 to -9‰), which are within the expected range for granite-sourced
crustal boron. The B-isotope compositions of tourmaline from the mafic country rocks overlap with
the granitic range and extend to much higher values (maximum average: δ11B = -4 ‰), which require
contributions from isotopically heavy B, presumably derived from the mafic-ultramafic rocks. Quartz
vein-hosted tourmalines have B-isotope compositions intermediate between those of the other two
groups (averages: δ11B = -14 to -7‰).
Simple bivariate chemical variation diagrams show that tourmalines associated with emerald
have a restricted range of compositions. Any tourmaline with a composition in that restricted range
may (or may not) have associated emerald. Multivariate cluster analysis distinguishes two populations
of tourmaline compositions that are strongly correlated with host lithology: one associated with the
country rocks and quartz-tourmaline veins, and the other with the granites and aplites. Stepwise
discriminant function analysis, using only Mn, Sc, V, Ni, Nb, Sn, Ba, Ce, and W as discriminators,
can successfully classify 91% of the narrowly defined populations of emerald-associated tourmaline.
17
We conclude that tourmaline compositions can be useful as proximity indicators for emerald
mineralization. The specific DFA results for the TdG tourmalines are unlikely to be applicable to
other emerald deposits because of the sensitivity of tourmaline composition to host rock composition.
Nevertheless, this study demonstrates that application of multivariate statistical methods to tourmaline
compositions has clear potential as a proximity indicator of emeralds and the method should be further
tested and refined elsewhere.
Acknowledgements
We thank Greg Davison of True North Gems, Ltd., for the opportunity to work on this project. For
expert technical assistance in the laboratories, we thank Gordon Brown and Patricia Stoffyn of
Dalhousie University, Wilfredo Diegor of Memorial University, and Ilona Schäpan of GFZ Potsdam.
For their constructive reviews of our manuscript, we also thank Lee Groat of the University of British
Columbia and John Slack of United States Geological Survey. A Natural Sciences and Engineering
Research Council Discovery Grant to D.B. Clarke covered the costs of sample preparation,
microprobe analysis, and LA-ICP-MS analysis, and his opportunity to be a visiting scientist in the
Chemistry and Physics of Earth Materials section of GFZ Potsdam made the international
collaboration possible.
References
Catanzaro, E.J., Champion, C.E., Garner, E.L., Maienko, G., Sappenfield, K.M., and Shields, W.R.,
1970, Boric acid: Isotopic and assay standard reference materials: National Bureau of Standards
Special Publication 260-17, 70 p.
Clarke, D.B., Reardon, N.C., Chatterjee, A.K., and Gregoire, D.C., 1989, Tourmaline composition as
a guide to mineral exploration: A reconnaissance study from Nova Scotia using discriminant
function analysis: Economic Geology, v. 84, p. 1921-1935.
Davison, J.G., 2005, 2005-2006 Activities on the Goal and RS claims, The Tsa da Glisza project,
Finalyson Lake area, Yukon Territory, Canada: True North Gems Internal 43-101 Report, 67 p.
18
Dyar, M.D., Wiedenbeck, M., Robertson, D., Cross, L.R., Delaney, J.S., Ferguson, K., Francis, C.A.,
Grew, E.S., Guidotti, C.V., Hervig, R.L., Hughes, J.M., Husler, J., Leeman, W., McGuire, A.V.,
Rhede, D., Rothe, H., Paul, R.L., Richards, I., and Yates, M., 2001, Reference minerals for
microanalysis of light elements: Geostandards Newsletter, 25, p. 441-463.
Garda, G.M., Beljavskis, P., Juliani, C., and Silva, D., 2003, Geochemistry associated with iron
formation and quartz veins of the Morro da Pedra Preta Formation, Serro do Itaberaba Group (Sao
Paulo, Brazil): Anais da Academia Brasileira de Ciencias, v. 75 (2), p. 209-234.
Geological Survey of Canada, 2007, Pieces of a giant jigsaw puzzle: Cordilleran terranes: Natural
Resources Canada, http://cgc.rncan.gc.ca/cordgeo/terrane_e.php.
Grew, E.S., 2002, Beryllium in metamorphic environments (emphasis on aluminous compositions):
Reviews in Mineralogy and Geochemistry, v. 50, p. 487-550.
Groat, L.A., Hart, C.J.R., Lewis, L.L., and Neufeld, H.L.D., 2005, Emerald and aquamarine
mineralization in Canada: Geoscience Canada, v. 32, p. 65-76.
Groat, L.A., Marshall, D.D., Giuliani, G., Murphy, D.C., Piercey, S.J., Jambor, J.L., Mortensen, J.K.,
Ercit, T.S., Gault, R.A., Mattey, D.P., Schwarz, D., Maluski, H., Wise, M.A., Wengzynowksi, W,
and Eaton, D.W., 2002, Mineralogical and geochemical study of the Regal Ridge emerald
showing, southeastern Yukon: Canadian Mineralogist, v. 40, p. 1313-1338.
Grundmann, G., and Morteani, G., 1989, Emerald mineralization during regional metamorphism: The
Habachtal (Austria) and Leydsdorp (Transvaal, South Africa) deposits: Economic Geology, v. 84,
p. 1835-1849.
Grundmann, G., and Morteani, G., 2007, Multi-stage emerald formation during Pan-African regional
metamorphism: The Zababa, Sikait and Umm Kabo deposits, south eastern desert of Egypt:
Journal of African Earth Sciences, v. 50, p. 168-187.
Hawthorne, F.C., and Henry, D.J., 1999, Classification of the minerals of the tourmaline group:
European Journal of Mineralogy, v. 11, p. 201-215.
Henry, D.J., and Guidotti, C.V., 1985, Tourmaline as a petrogenetic indicator mineral: An example
from the staurolite-grade metapelites of NW Maine: American Mineralogist, v. 70, p. 1-15.
19
Jiang, S.-Y., Palmer M.R., Slack J.F., and Shaw, D.R., 1999, Boron isotope systematics of tourmaline
formation in the Sullivan Pb–Zn–Ag deposit, British Columbia, Canada: Chemical Geology, v.
158, p. 131-144.
Jiang, S.-Y., Yu, J.-M., and Lu, J.-J., 2004, Trace and rare-earth element geochemistry in tourmaline
and cassiterite from the Yunlong tin deposit, Yunnan, China: Implication for migmatitic–
hydrothermal fluid evolution and ore genesis: Chemical Geology, v. 209, p. 193-213.
Jolliff, B.L., Papike, J.J., and Shearer, C.K., 1986, Tourmaline as a recorder of pegmatite evolution:
Bob Ingersoll pegmatite, Black Hills, South Dakota: American Mineralogist, v. 71, p. 472-500.
Kasemann, S., Erzinger, J., and Franz, G., 2000, Boron recycling in the continental crust of the central
Andes from the Palaeozoic to Mesozoic, NW Argentina: Contributions to Mineralogy and
Petrology, v. 140, p. 328-343.
Keller, P., Robles, E.R., Pérez, A.P., and Fontan, F., 1999, Chemistry, paragenesis and significance of
tourmaline in pegmatites of the southern tin belt, central Namibia: Chemical Geology, v. 158, p.
203-225.
Krienitz, M.-S., Trumbull, R.B., Hellmann, A., Kolb, J., Meyer, F.M., and Wiedenbeck, M., 2008,
Hydrothermal gold mineralization at the Hira Buddini gold mine, India: Constraints on fluid
sources and evolution from boron isotopic compositions of tourmaline: Mineralium
Deposita, v. 43, p. 421-434.
Laurs, B.M., Dilles, J.H., and Snee, L.W., 1996, Emerald mineralization and metasomatism of
amphibolite, Khaltaro granitic pegmatite–hydrothermal vein system, Haramosh Mountains,
northern Pakistan: Canadian Mineralogist, v. 34, p. 1253-1286.
Longerich, H.P., Jackson, S.E., and Gunther, D., 1996. Laser ablation inductively coupled plasma
mass spectrometric transient signal data acquisition and analyte concentration calculation.
Journal of Analytical Atomic Spectrometry, v. 11, p. 899-904.
Marschall, H.R., and Ludwig, T., 2006, Re-examination of the boron isotopic composition of
tourmaline from the Lavicky granite, Czech Republic, by secondary ion mass spectrometry: Back
to normal: Geochemical Journal, v. 40, p. 631-638.
20
Marshall, D., Groat, L.A., Giuliani, G., Murphy, D., Mattey, D., Ercit, T.S., Wise, M.A.,
Wengzynowski, W., and Eaton, W.D., 2003, Pressure, temperature, and fluid inclusion conditions
during emerald precipitation, southeastern Yukon, Canada: Fluid inclusion and stable isotope
evidence: Chemical Geology, v. 194, p. 287-199.
Neufeld, H.L.D., 2004, The Tsa da Glisza emerald occurrence: Descriptive, genetic, and exploration
models: Unpublished M.Sc. Thesis, University of British Columbia, 85 p.
Neufeld, H.L.D., Groat, L.A., and Mortensen, J.K., 2003. Preliminary investigations of emerald
mineralization in the Regal Ridge area, Finlayson Lake district, southeastern Yukon, in Edmond,
D.S., and Lewis, L.L. (eds.) Yukon Exploration and Geology 2002: Whitehorse, Yukon,
Exploration and Geological Services Division, Yukon Region, Indian and Northern Affairs
Canada, p. 281-284.
Neufeld, H.L.D., Israel, S., Groat, L.A., and Mortensen, J.K., 2004, Geology and structural setting of
the Regal Ridge emerald property, Finlayson Lake district, southeastern Yukon. in Emond, D.S.,
and Lewis, L.L. (eds.) Yukon Exploration and Geology 2003: Whitehorse, Yukon, Yukon
Geological Survey, p. 281-288.
Palmer, M.R. and Slack, J.F., 1989, Boron isotopic composition of tourmaline from massive sulfide
deposits and tourmalinites: Contributions to Mineralogy and Petrology, v. 103, p. 434-451.
Palmer, M.R., and Swihart, G.H., 1996, Boron isotope geochemistry: An overview, in Grew, E.S., and
Anovitz, L.M., eds, Boron: Mineralogy, petrology, and geochemistry: Reviews in Mineralogy, v.
33, p. 709-744.
Pearce, N.J.G., Perkins, W.T., Westgate, J.A., Gorton, M.P., Jackson, S.E., Neal, C.R., and Chenery,
S.P., 1997, A compilation of new and published major and trace-element data for NIST SRM 610
and NIST SRM 612 glass reference materials. Geostandards Newsletter, v. 21 (1), p. 115-144.
Pirajno, F., and Smithies, R.H., 1992, The FeO/(FeO+MgO) ratio of tourmaline: A useful indicator of
spatial variations in granite-related hydrothermal mineral deposits: Journal of Geochemical
Exploration, v. 42, p. 371-381.
21
Seifert, A.V., Žáček, V., Vrána, S., Pecina, V., Zachariáš, J., and Zwaan, J.C., 2004, Emerald
mineralization in the Kafubu area, Zambia: Czech Geological Survey Bulletin of Geosciences, v.
79, p. 1-40.
Slack, J.F., 1996, Tourmaline associations with hydrothermal ore deposits. in Grew, E.S., and
Anovitz, L.M. eds, Boron: Mineralogy, petrology and geochemistry: Reviews in Mineralogy, v.
33, p. 559-643.
Strong, D.F., 1981. Ore deposit models – 5. A model for granophile mineral deposits. Geoscience
Canada, v. 8, p. 155-161.
Tonarini, S., Pennisi, M., Adorni-Braccesi, A., Dini, A., Ferrara, G., Gonfiantini, R., Wiedenbeck, M.,
and Gröning, M., 2003, Intercomparison of boron isotope and concentration measurements. Part I:
Selection, preparation and homogeneity tests of the intercomparison materials. Geostandards
Newsletter, v. 27, p. 21-39.
Trumbull, R.B., and Chaussidon, M., 1999, Chemical and boron isotopic composition of magmatic
and hydrothermal tourmalines from the Sinceni granite-pegmatite system in Swaziland: Chemical
Geology, v. 153, p. 125-137.
Trumbull, R.B., Krienitz, M.-S., Gottesmann, B., and Wiedenbeck, M., 2008a, Chemical and boron-
isotope variations in tourmalines from an S-type granite and its source rocks: The Erongo granite
and tourmalinites in the Damara Belt, Namibia: Contributions to Mineralogy and Petrology, v.
155, p. 1-18.
Trumbull, R.B., Krienitz, M.-S., Grundmann, G., and Wiedenbeck, M., 2008b, Tourmaline
geochemistry and δ11B variations as a guide to fluid–rock interaction in the Habachtal emerald
deposit, Tauern Window, Austria: Contributions to Mineralogy and Petrology, doi.
10.1007/s00410-008-0342-9.
Xavier, R.P., Wiedenbeck, M., Trumbull, R.B., Dreher, A.M., Monteiro, L.V.S., Rhede, D., de
Araújo, C.E.G., and Torresi, I., 2008, Tourmaline B-isotopes fingerprint marine evaporites as the
source of high salinity ore fluids in iron oxide-copper-gold deposits, Carajás mineral province
(Brazil): Geology, v. 36, p. 743-746.
22
Yu, J.-M., and Jiang, S.-Y., 2003, Chemical composition of tourmaline from the Yunlong tin deposit,
Yunnan, China: Implications for ore genesis and mineral exploration: Mineralogy and Petrology,
v. 77, p. 67-84.
Zachariáš, J., Žáček, V., Pudilová, M., and Machovič,V., 2005, Fluid inclusion and stable isotope
study of quartz-tourmaline veins associated with beryl and emerald mineralization, Kafubu area,
Zambia: Chemical Geology, v. 223, p. 136-152.
23
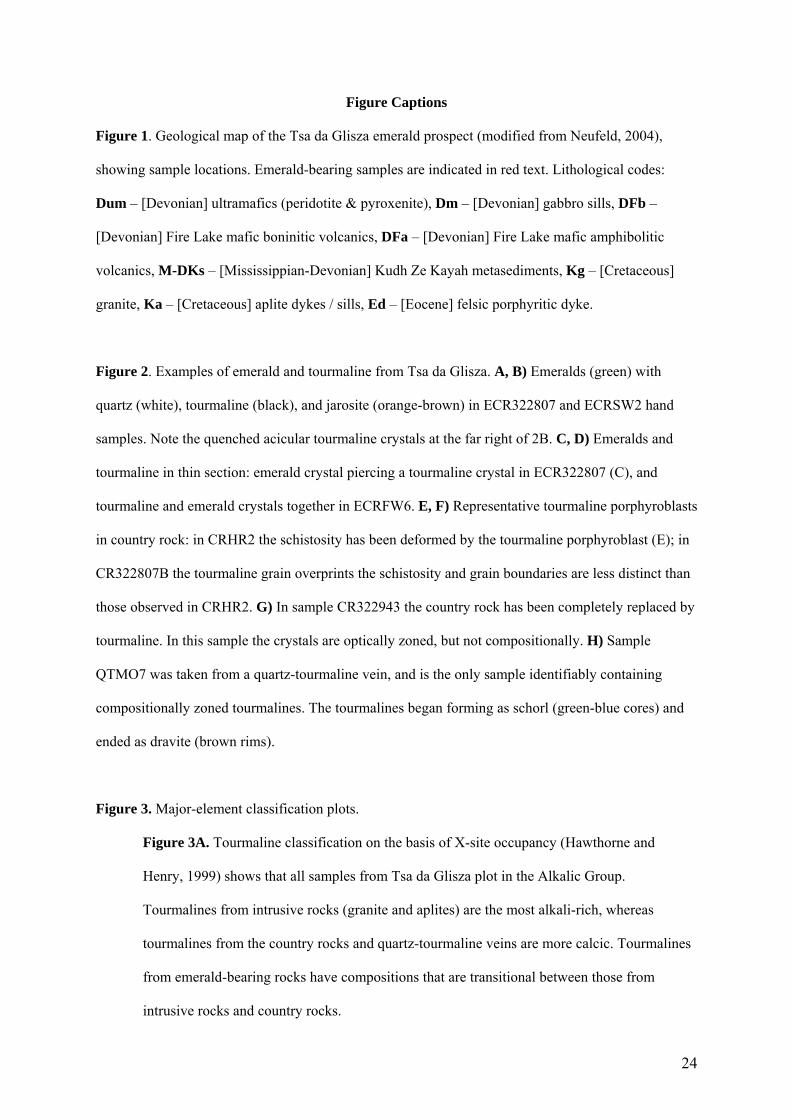
Figure Captions
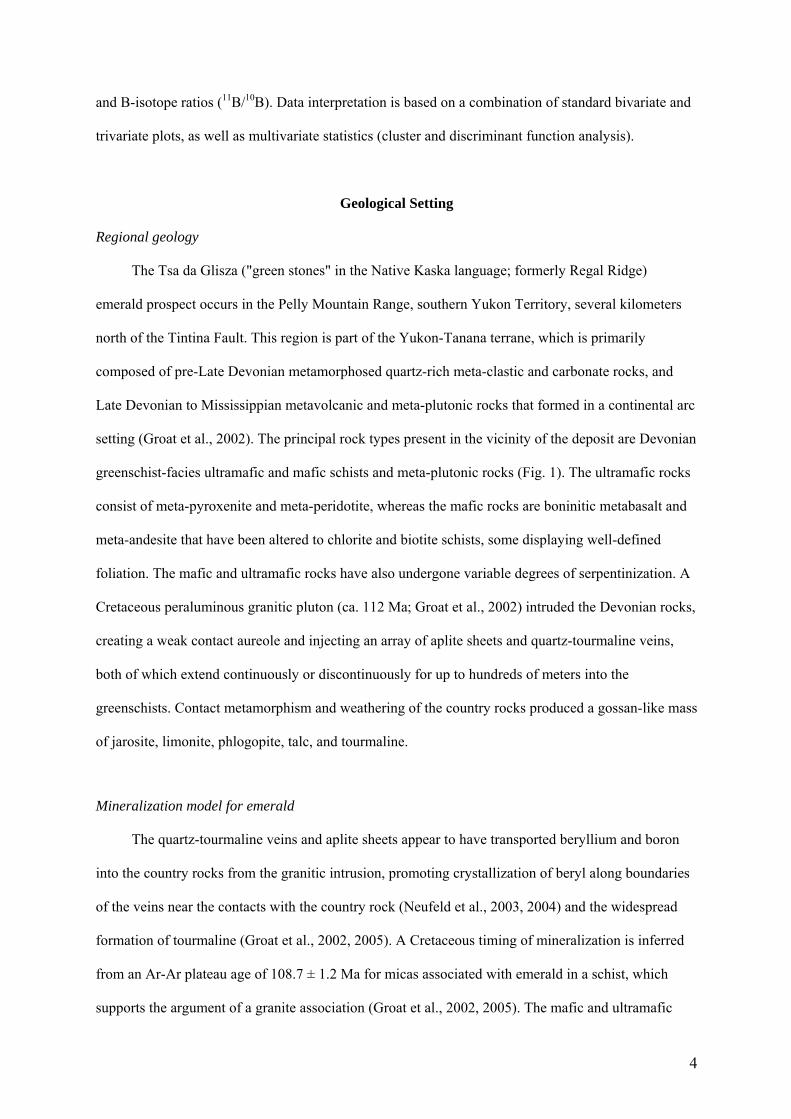
Figure 1. Geological map of the Tsa da Glisza emerald prospect (modified from Neufeld, 2004),
showing sample locations. Emerald-bearing samples are indicated in red text. Lithological codes:
Dum – [Devonian] ultramafics (peridotite & pyroxenite), Dm – [Devonian] gabbro sills, DFb –
[Devonian] Fire Lake mafic boninitic volcanics, DFa – [Devonian] Fire Lake mafic amphibolitic
volcanics, M-DKs – [Mississippian-Devonian] Kudh Ze Kayah metasediments, Kg – [Cretaceous]
granite, Ka – [Cretaceous] aplite dykes / sills, Ed – [Eocene] felsic porphyritic dyke.
Figure 2. Examples of emerald and tourmaline from Tsa da Glisza. A, B) Emeralds (green) with
quartz (white), tourmaline (black), and jarosite (orange-brown) in ECR322807 and ECRSW2 hand
samples. Note the quenched acicular tourmaline crystals at the far right of 2B. C, D) Emeralds and
tourmaline in thin section: emerald crystal piercing a tourmaline crystal in ECR322807 (C), and
tourmaline and emerald crystals together in ECRFW6. E, F) Representative tourmaline porphyroblasts
in country rock: in CRHR2 the schistosity has been deformed by the tourmaline porphyroblast (E); in
CR322807B the tourmaline grain overprints the schistosity and grain boundaries are less distinct than
those observed in CRHR2. G) In sample CR322943 the country rock has been completely replaced by
tourmaline. In this sample the crystals are optically zoned, but not compositionally. H) Sample
QTMO7 was taken from a quartz-tourmaline vein, and is the only sample identifiably containing
compositionally zoned tourmalines. The tourmalines began forming as schorl (green-blue cores) and
ended as dravite (brown rims).
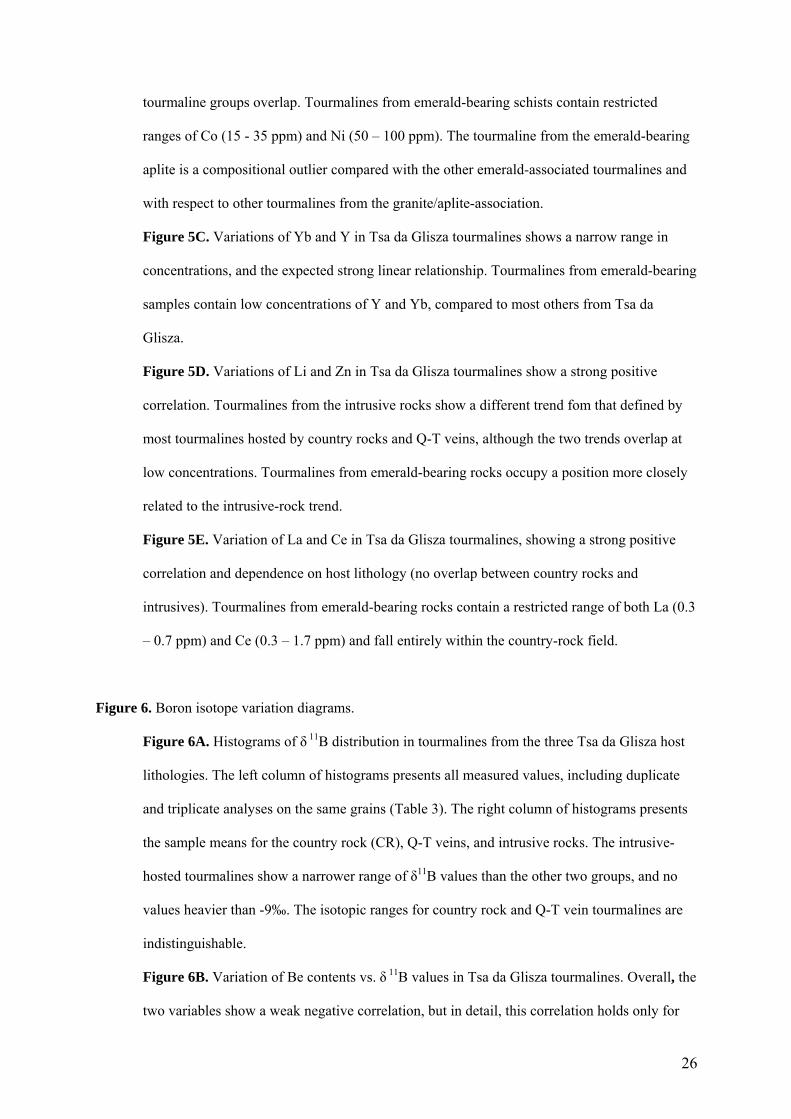
Figure 3. Major-element classification plots.
Figure 3A. Tourmaline classification on the basis of X-site occupancy (Hawthorne and
Henry, 1999) shows that all samples from Tsa da Glisza plot in the Alkalic Group.
Tourmalines from intrusive rocks (granite and aplites) are the most alkali-rich, whereas
tourmalines from the country rocks and quartz-tourmaline veins are more calcic. Tourmalines
from emerald-bearing rocks have compositions that are transitional between those from
intrusive rocks and country rocks.
24
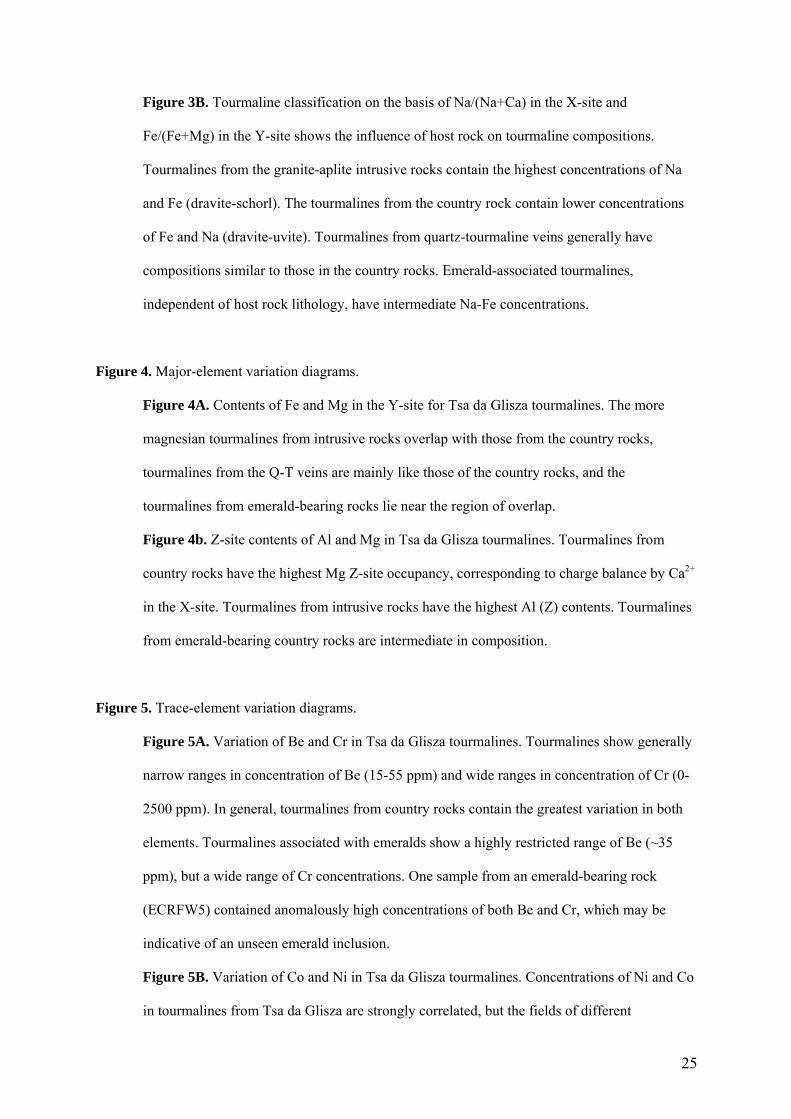
Figure 3B. Tourmaline classification on the basis of Na/(Na+Ca) in the X-site and
Fe/(Fe+Mg) in the Y-site shows the influence of host rock on tourmaline compositions.
Tourmalines from the granite-aplite intrusive rocks contain the highest concentrations of Na
and Fe (dravite-schorl). The tourmalines from the country rock contain lower concentrations
of Fe and Na (dravite-uvite). Tourmalines from quartz-tourmaline veins generally have
compositions similar to those in the country rocks. Emerald-associated tourmalines,
independent of host rock lithology, have intermediate Na-Fe concentrations.
Figure 4. Major-element variation diagrams.
Figure 4A. Contents of Fe and Mg in the Y-site for Tsa da Glisza tourmalines. The more
magnesian tourmalines from intrusive rocks overlap with those from the country rocks,
tourmalines from the Q-T veins are mainly like those of the country rocks, and the
tourmalines from emerald-bearing rocks lie near the region of overlap.
Figure 4b. Z-site contents of Al and Mg in Tsa da Glisza tourmalines. Tourmalines from
country rocks have the highest Mg Z-site occupancy, corresponding to charge balance by Ca2+
in the X-site. Tourmalines from intrusive rocks have the highest Al (Z) contents. Tourmalines
from emerald-bearing country rocks are intermediate in composition.
Figure 5. Trace-element variation diagrams.
Figure 5A. Variation of Be and Cr in Tsa da Glisza tourmalines. Tourmalines show generally
narrow ranges in concentration of Be (15-55 ppm) and wide ranges in concentration of Cr (0-
2500 ppm). In general, tourmalines from country rocks contain the greatest variation in both
elements. Tourmalines associated with emeralds show a highly restricted range of Be (~35
ppm), but a wide range of Cr concentrations. One sample from an emerald-bearing rock
(ECRFW5) contained anomalously high concentrations of both Be and Cr, which may be
indicative of an unseen emerald inclusion.
Figure 5B. Variation of Co and Ni in Tsa da Glisza tourmalines. Concentrations of Ni and Co
in tourmalines from Tsa da Glisza are strongly correlated, but the fields of different
25
tourmaline groups overlap. Tourmalines from emerald-bearing schists contain restricted
ranges of Co (15 - 35 ppm) and Ni (50 – 100 ppm). The tourmaline from the emerald-bearing
aplite is a compositional outlier compared with the other emerald-associated tourmalines and
with respect to other tourmalines from the granite/aplite-association.
Figure 5C. Variations of Yb and Y in Tsa da Glisza tourmalines shows a narrow range in
concentrations, and the expected strong linear relationship. Tourmalines from emerald-bearing
samples contain low concentrations of Y and Yb, compared to most others from Tsa da
Glisza.
Figure 5D. Variations of Li and Zn in Tsa da Glisza tourmalines show a strong positive
correlation. Tourmalines from the intrusive rocks show a different trend fom that defined by
most tourmalines hosted by country rocks and Q-T veins, although the two trends overlap at
low concentrations. Tourmalines from emerald-bearing rocks occupy a position more closely
related to the intrusive-rock trend.
Figure 5E. Variation of La and Ce in Tsa da Glisza tourmalines, showing a strong positive
correlation and dependence on host lithology (no overlap between country rocks and
intrusives). Tourmalines from emerald-bearing rocks contain a restricted range of both La (0.3
– 0.7 ppm) and Ce (0.3 – 1.7 ppm) and fall entirely within the country-rock field.
Figure 6. Boron isotope variation diagrams.
Figure 6A. Histograms of δ 11B distribution in tourmalines from the three Tsa da Glisza host
lithologies. The left column of histograms presents all measured values, including duplicate
and triplicate analyses on the same grains (Table 3). The right column of histograms presents
the sample means for the country rock (CR), Q-T veins, and intrusive rocks. The intrusive-
hosted tourmalines show a narrower range of δ11B values than the other two groups, and no
values heavier than -9‰. The isotopic ranges for country rock and Q-T vein tourmalines are
indistinguishable.
Figure 6B. Variation of Be contents vs. δ 11B values in Tsa da Glisza tourmalines. Overall, the
two variables show a weak negative correlation, but in detail, this correlation holds only for
26
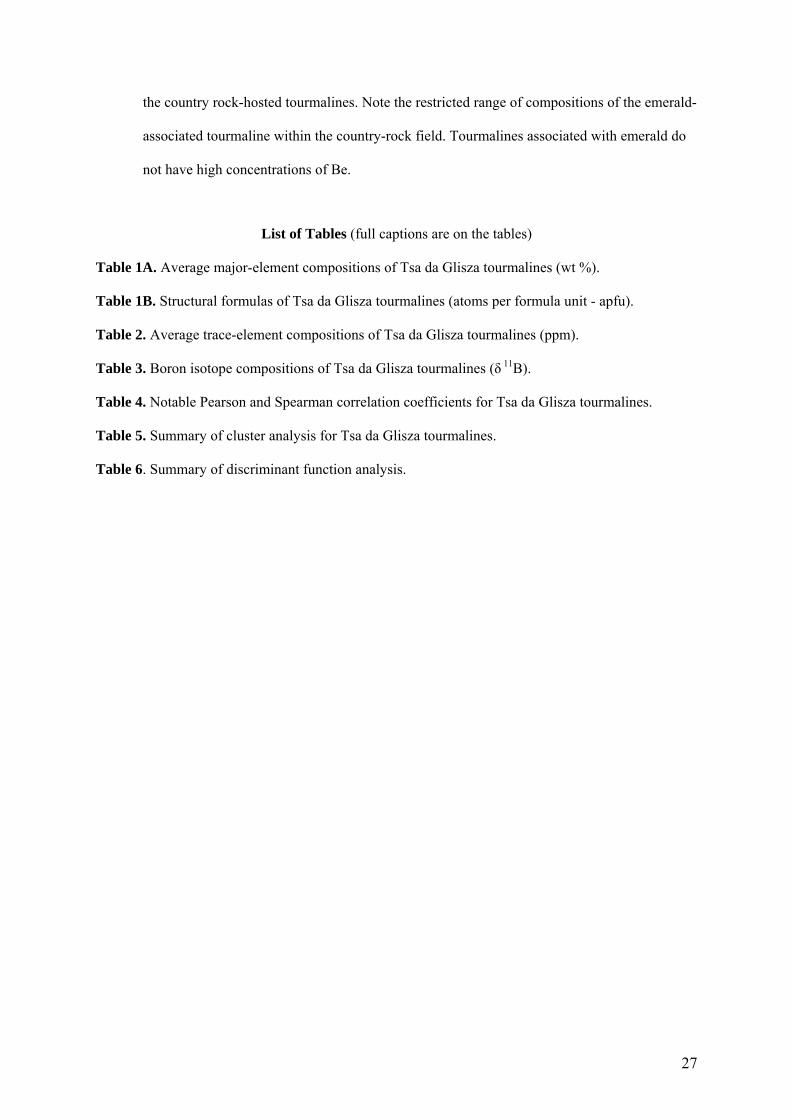
the country rock-hosted tourmalines. Note the restricted range of compositions of the emerald-
associated tourmaline within the country-rock field. Tourmalines associated with emerald do
not have high concentrations of Be.
List of Tables (full captions are on the tables)
Table 1A. Average major-element compositions of Tsa da Glisza tourmalines (wt %). Table 1B. Structural formulas of Tsa da Glisza tourmalines (atoms per formula unit - apfu). Table 2. Average trace-element compositions of Tsa da Glisza tourmalines (ppm). Table 3. Boron isotope compositions of Tsa da Glisza tourmalines (δ 11B). Table 4. Notable Pearson and Spearman correlation coefficients for Tsa da Glisza tourmalines. Table 5. Summary of cluster analysis for Tsa da Glisza tourmalines. Table 6. Summary of discriminant function analysis.
27
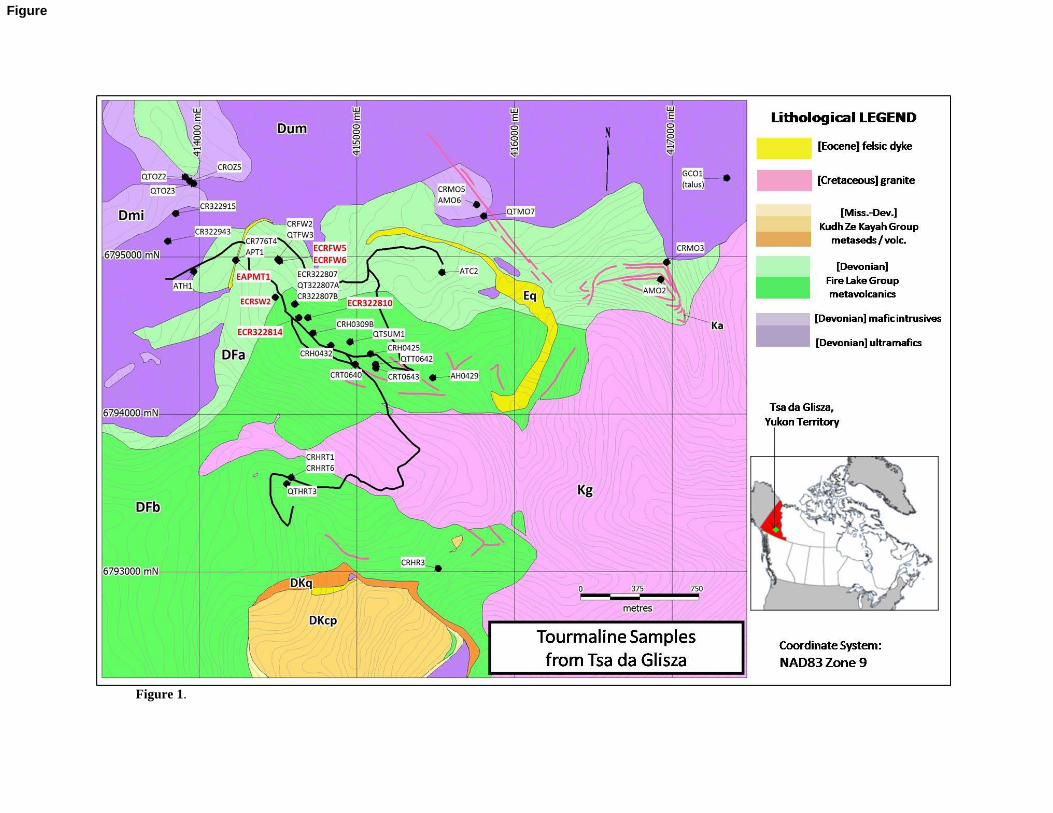
Figure 1.
Figure
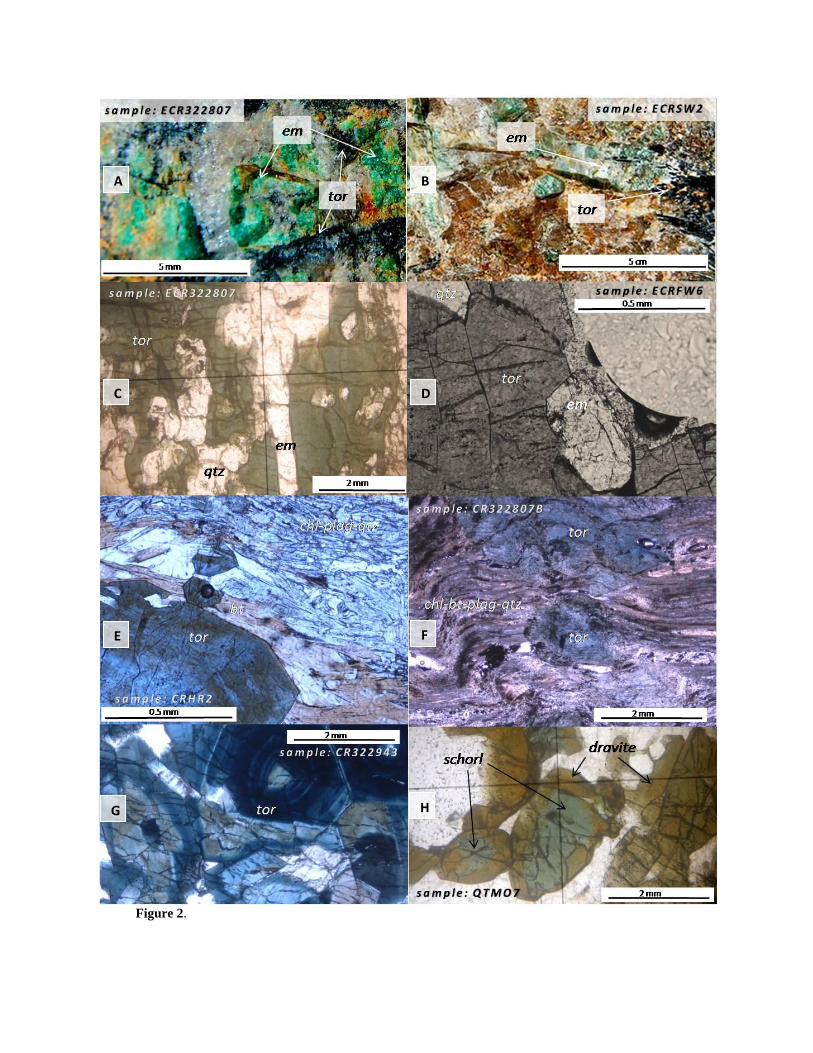
Figure 2.
A...
B...
C...
D...
E...
F...
G...
H...
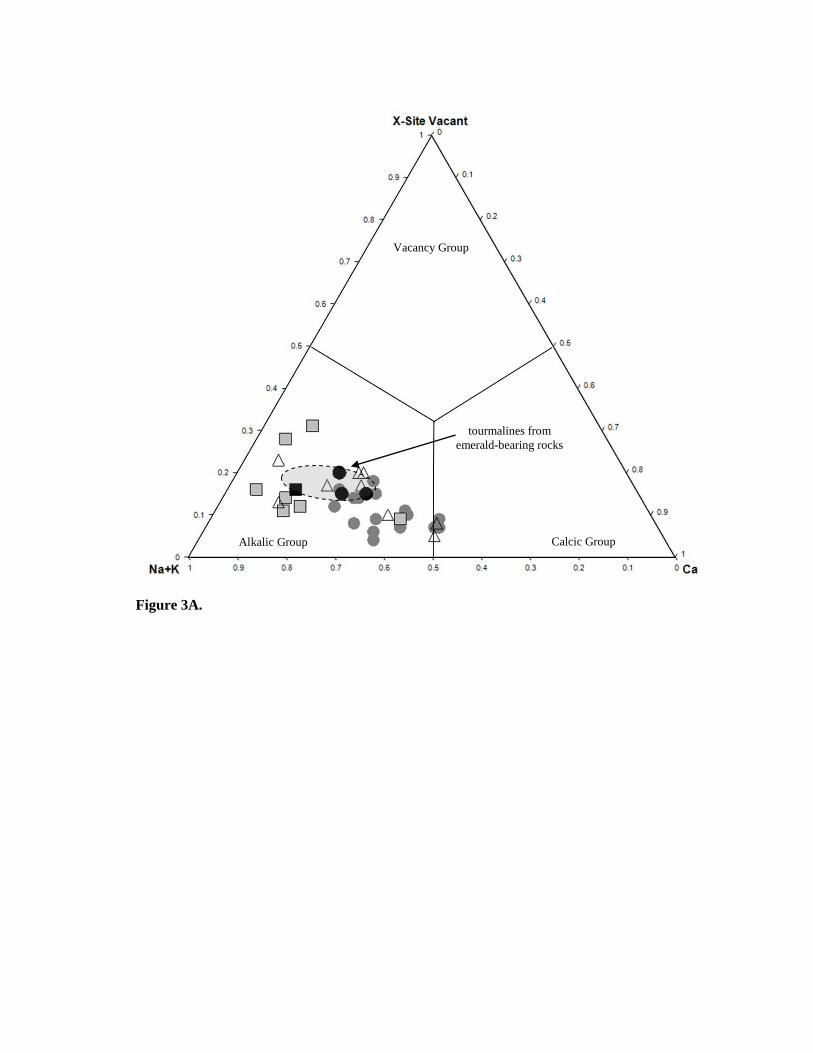
Figure 3A.
Calcic Group Alkalic Group
Vacancy Group
tourmalines from
emerald-bearing rocks
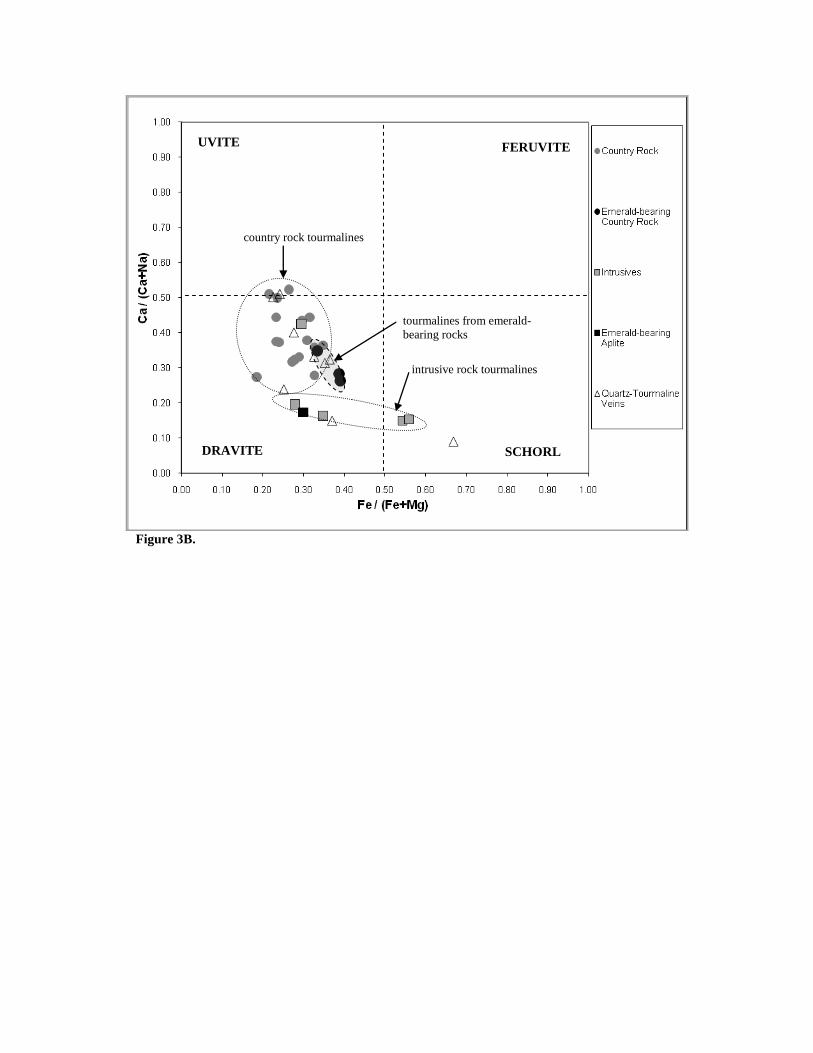
Figure 3B.
country rock tourmalines
intrusive rock tourmalines
tourmalines from emerald-
bearing rocks
UVITE
DRAVITE
FERUVITE
SCHORL
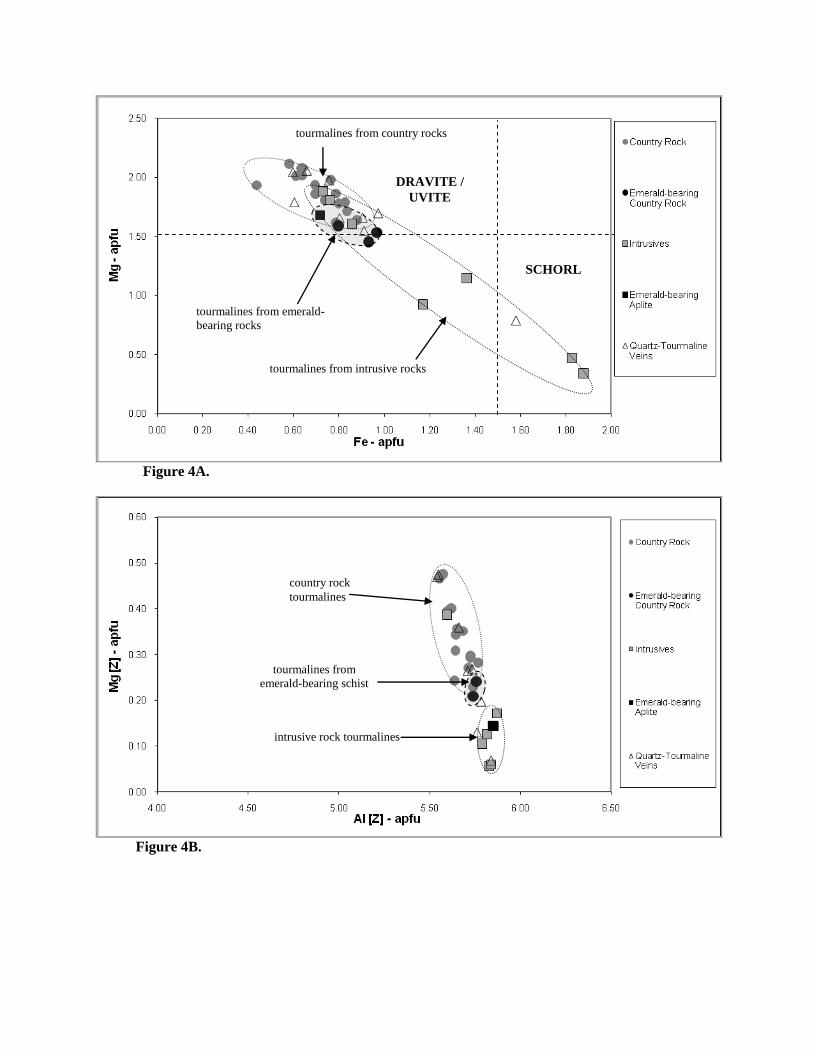
Figure 4A.
Figure 4B.
tourmalines from emerald-
bearing rocks
tourmalines from intrusive rocks
tourmalines from country rocks
SCHORL
DRAVITE /
UVITE
country rock
tourmalines
intrusive rock tourmalines
tourmalines from
emerald-bearing schist
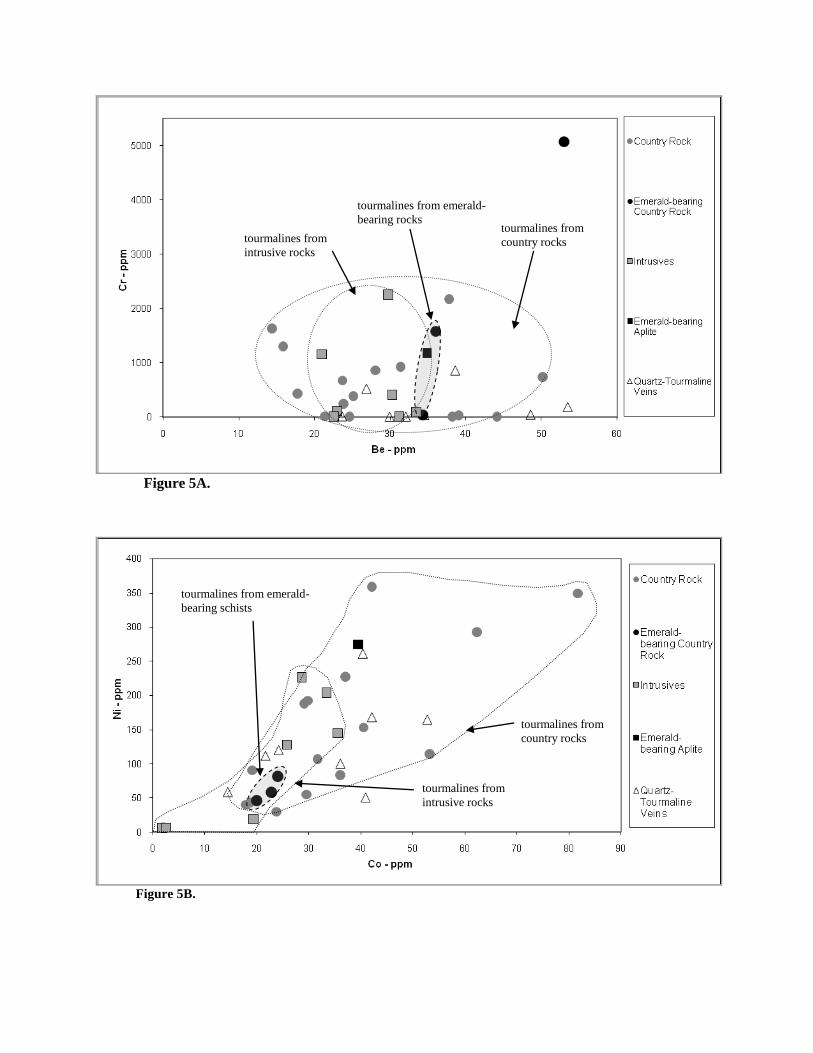
Figure 5A.
Figure 5B.
tourmalines from emerald-
bearing rocks
tourmalines from
intrusive rocks
tourmalines from
country rocks
tourmalines from emerald-
bearing schists
tourmalines from
intrusive rocks
tourmalines from
country rocks
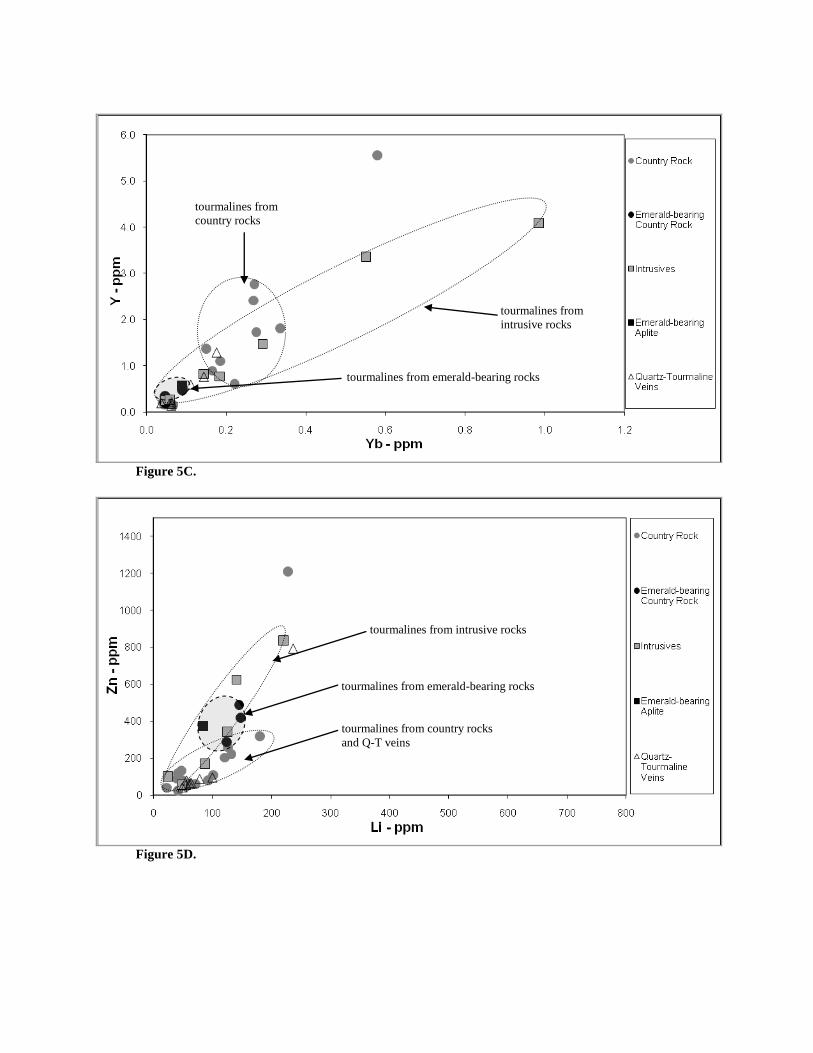
Figure 5C.
Figure 5D.
tourmalines from emerald-bearing rocks
tourmalines from
intrusive rocks
tourmalines from
country rocks
tourmalines from emerald-bearing rocks
tourmalines from country rocks
and Q-T veins
tourmalines from intrusive rocks
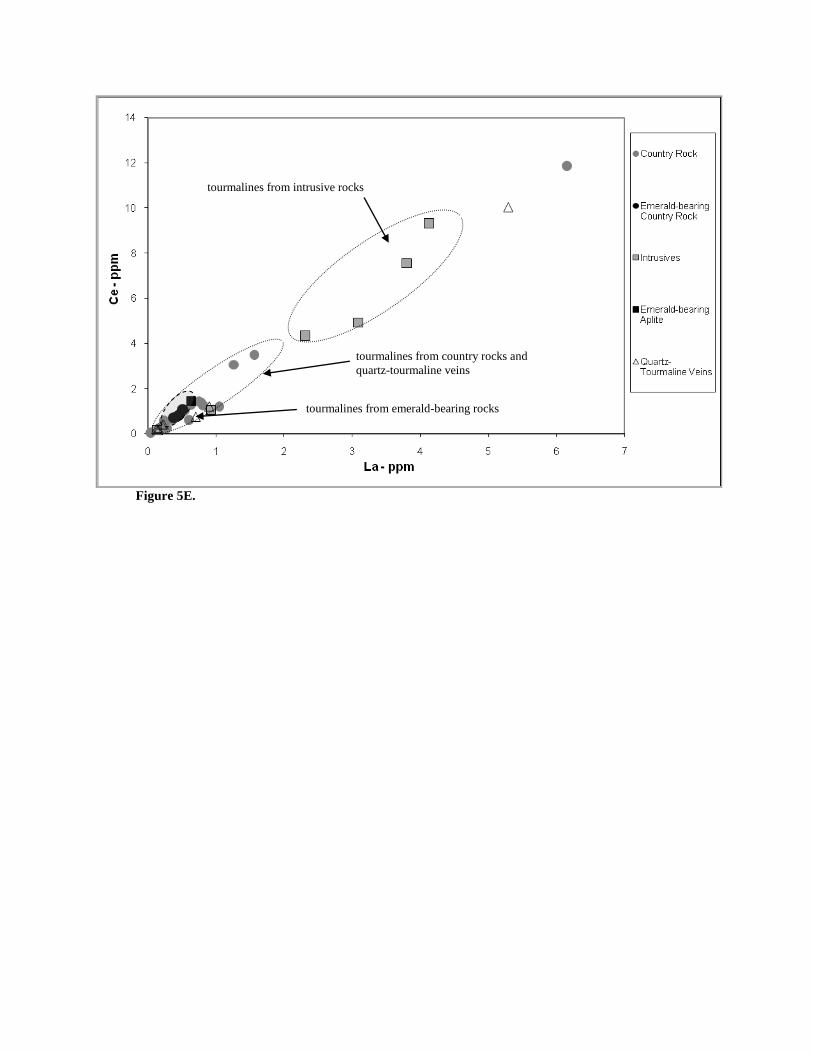
Figure 5E.
tourmalines from intrusive rocks
tourmalines from emerald-bearing rocks
tourmalines from country rocks and
quartz-tourmaline veins
-20 -15 -10 -5 00
1
2
3
4
5
6
7
8
9
10
d11B
All Q-T Veins
-20 -15 -10 -5 00
1
2
3
4
5
6
7
8
All CR
d11B
-20 -15 -10 -5 00
1
2
3
4
5
6
7
8
All Intrusives
d11B
-20 -15 -10 -5 00
1
2
3
4
5
d11B
CR Means
-20 -15 -10 -5 00
1
2
3
4
5
d11B
Intrusive Means
-20 -15 -10 -5 00
1
2
3
4
5
d11B
Q-T Vein Means
Figure 6A.
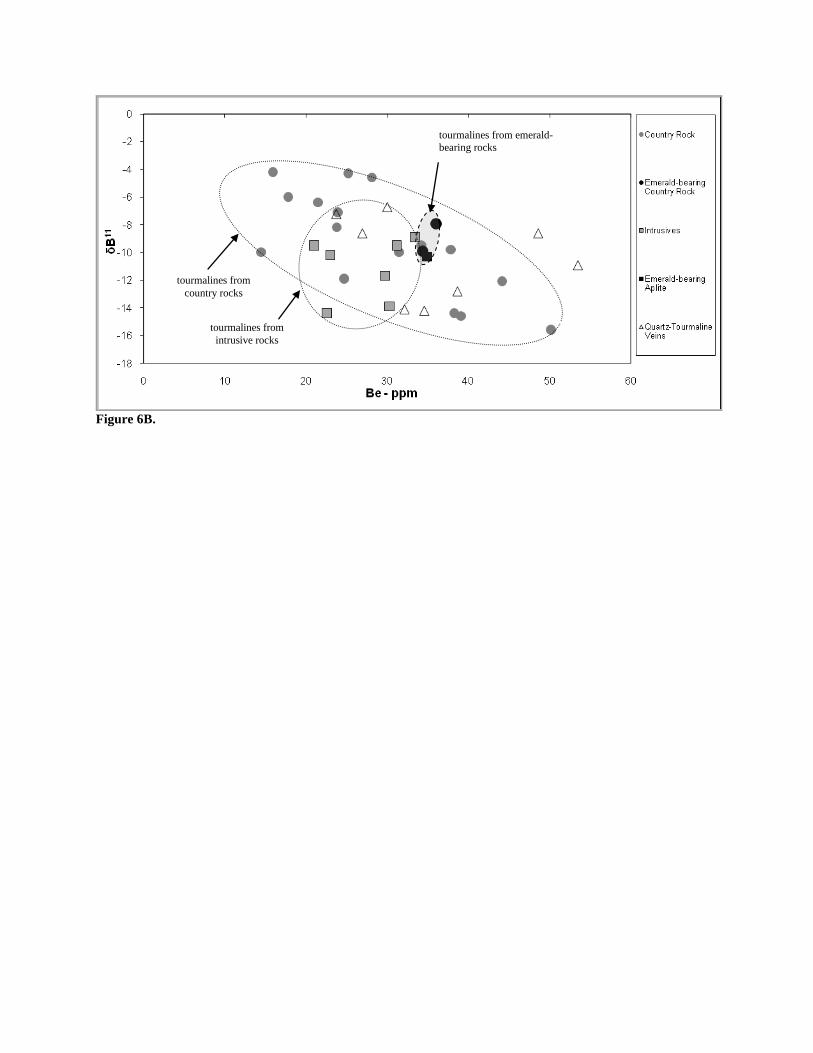
Figure 6B.
tourmalines from emerald-
bearing rocks
tourmalines from
country rocks
tourmalines from
intrusive rocks
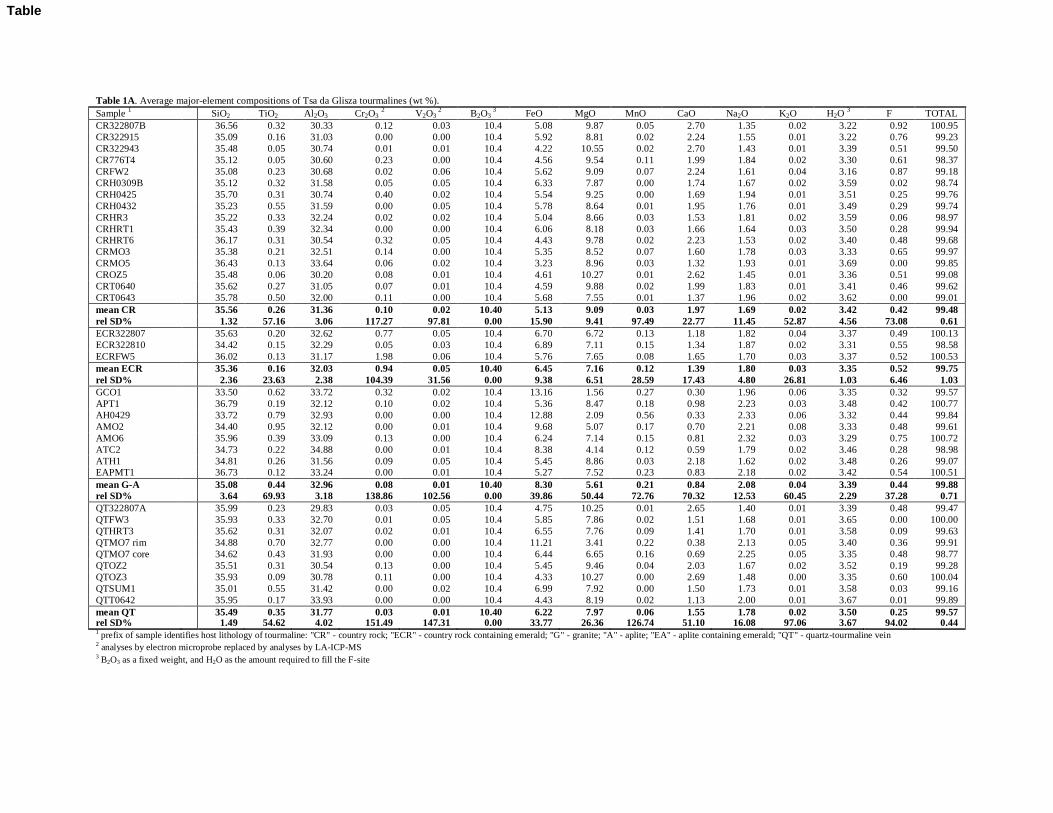
Table 1A. Average major-element compositions of Tsa da Glisza tourmalines (wt %).
Sample 1 SiO2 TiO2 Al2O3 Cr2O3
2 V2O3
2 B2O3
3 FeO MgO MnO CaO Na2O K2O H2O
3 F TOTAL
CR322807B 36.56 0.32 30.33 0.12 0.03 10.4 5.08 9.87 0.05 2.70 1.35 0.02 3.22 0.92 100.95
CR322915
35.09 0.16 31.03 0.00 0.00 10.4 5.92 8.81 0.02 2.24 1.55 0.01 3.22 0.76 99.23
CR322943
35.48 0.05 30.74 0.01 0.01 10.4 4.22 10.55 0.02 2.70 1.43 0.01 3.39 0.51 99.50
CR776T4
35.12 0.05 30.60 0.23 0.00 10.4 4.56 9.54 0.11 1.99 1.84 0.02 3.30 0.61 98.37
CRFW2
35.08 0.23 30.68 0.02 0.06 10.4 5.62 9.09 0.07 2.24 1.61 0.04 3.16 0.87 99.18
CRH0309B
35.12 0.32 31.58 0.05 0.05 10.4 6.33 7.87 0.00 1.74 1.67 0.02 3.59 0.02 98.74
CRH0425
35.70 0.31 30.74 0.40 0.02 10.4 5.54 9.25 0.00 1.69 1.94 0.01 3.51 0.25 99.76
CRH0432
35.23 0.55 31.59 0.00 0.05 10.4 5.78 8.64 0.01 1.95 1.76 0.01 3.49 0.29 99.74
CRHR3
35.22 0.33 32.24 0.02 0.02 10.4 5.04 8.66 0.03 1.53 1.81 0.02 3.59 0.06 98.97
CRHRT1
35.43 0.39 32.34 0.00 0.00 10.4 6.06 8.18 0.03 1.66 1.64 0.03 3.50 0.28 99.94 CRHRT6
36.17 0.31 30.54 0.32 0.05 10.4 4.43 9.78 0.02 2.23 1.53 0.02 3.40 0.48 99.68
CRMO3
35.38 0.21 32.51 0.14 0.00 10.4 5.35 8.52 0.07 1.60 1.78 0.03 3.33 0.65 99.97
CRMO5
36.43 0.13 33.64 0.06 0.02 10.4 3.23 8.96 0.03 1.32 1.93 0.01 3.69 0.00 99.85
CROZ5
35.48 0.06 30.20 0.08 0.01 10.4 4.61 10.27 0.01 2.62 1.45 0.01 3.36 0.51 99.08
CRT0640
35.62 0.27 31.05 0.07 0.01 10.4 4.59 9.88 0.02 1.99 1.83 0.01 3.41 0.46 99.62
CRT0643
35.78 0.50 32.00 0.11 0.00 10.4 5.68 7.55 0.01 1.37 1.96 0.02 3.62 0.00 99.01
mean CR 35.56 0.26 31.36 0.10 0.02 10.40 5.13 9.09 0.03 1.97 1.69 0.02 3.42 0.42 99.48
rel SD% 1.32 57.16 3.06 117.27 97.81 0.00 15.90 9.41 97.49 22.77 11.45 52.87 4.56 73.08 0.61
ECR322807 35.63 0.20 32.62 0.77 0.05 10.4 6.70 6.72 0.13 1.18 1.82 0.04 3.37 0.49 100.13
ECR322810 34.42 0.15 32.29 0.05 0.03 10.4 6.89 7.11 0.15 1.34 1.87 0.02 3.31 0.55 98.58
ECRFW5
36.02 0.13 31.17 1.98 0.06 10.4 5.76 7.65 0.08 1.65 1.70 0.03 3.37 0.52 100.53
mean ECR 35.36 0.16 32.03 0.94 0.05 10.40 6.45 7.16 0.12 1.39 1.80 0.03 3.35 0.52 99.75
rel SD% 2.36 23.63 2.38 104.39 31.56 0.00 9.38 6.51 28.59 17.43 4.80 26.81 1.03 6.46 1.03
GCO1
33.50 0.62 33.72 0.32 0.02 10.4 13.16 1.56 0.27 0.30 1.96 0.06 3.35 0.32 99.57
APT1
36.79 0.19 32.12 0.10 0.02 10.4 5.36 8.47 0.18 0.98 2.23 0.03 3.48 0.42 100.77
AH0429
33.72 0.79 32.93 0.00 0.00 10.4 12.88 2.09 0.56 0.33 2.33 0.06 3.32 0.44 99.84
AMO2
34.40 0.95 32.12 0.00 0.01 10.4 9.68 5.07 0.17 0.70 2.21 0.08 3.33 0.48 99.61
AMO6
35.96 0.39 33.09 0.13 0.00 10.4 6.24 7.14 0.15 0.81 2.32 0.03 3.29 0.75 100.72
ATC2
34.73 0.22 34.88 0.00 0.01 10.4 8.38 4.14 0.12 0.59 1.79 0.02 3.46 0.28 98.98
ATH1
34.81 0.26 31.56 0.09 0.05 10.4 5.45 8.86 0.03 2.18 1.62 0.02 3.48 0.26 99.07 EAPMT1
36.73 0.12 33.24 0.00 0.01 10.4 5.27 7.52 0.23 0.83 2.18 0.02 3.42 0.54 100.51
mean G-A 35.08 0.44 32.96 0.08 0.01 10.40 8.30 5.61 0.21 0.84 2.08 0.04 3.39 0.44 99.88
rel SD% 3.64 69.93 3.18 138.86 102.56 0.00 39.86 50.44 72.76 70.32 12.53 60.45 2.29 37.28 0.71
QT322807A 35.99 0.23 29.83 0.03 0.05 10.4 4.75 10.25 0.01 2.65 1.40 0.01 3.39 0.48 99.47
QTFW3
35.93 0.33 32.70 0.01 0.05 10.4 5.85 7.86 0.02 1.51 1.68 0.01 3.65 0.00 100.00
QTHRT3
35.62 0.31 32.07 0.02 0.01 10.4 6.55 7.76 0.09 1.41 1.70 0.01 3.58 0.09 99.63
QTMO7 rim
34.88 0.70 32.77 0.00 0.00 10.4 11.21 3.41 0.22 0.38 2.13 0.05 3.40 0.36 99.91
QTMO7 core
34.62 0.43 31.93 0.00 0.00 10.4 6.44 6.65 0.16 0.69 2.25 0.05 3.35 0.48 98.77
QTOZ2
35.51 0.31 30.54 0.13 0.00 10.4 5.45 9.46 0.04 2.03 1.67 0.02 3.52 0.19 99.28
QTOZ3
35.93 0.09 30.78 0.11 0.00 10.4 4.33 10.27 0.00 2.69 1.48 0.00 3.35 0.60 100.04
QTSUM1
35.01 0.55 31.42 0.00 0.02 10.4 6.99 7.92 0.00 1.50 1.73 0.01 3.58 0.03 99.16
QTT0642
35.95 0.17 33.93 0.00 0.00 10.4 4.43 8.19 0.02 1.13 2.00 0.01 3.67 0.01 99.89
mean QT 35.49 0.35 31.77 0.03 0.01 10.40 6.22 7.97 0.06 1.55 1.78 0.02 3.50 0.25 99.57 rel SD% 1.49 54.62 4.02 151.49 147.31 0.00 33.77 26.36 126.74 51.10 16.08 97.06 3.67 94.02 0.44 1 prefix of sample identifies host lithology of tourmaline: "CR" - country rock; "ECR" - country rock containing emerald; "G" - granite; "A" - aplite; "EA" - aplite containing emerald; "QT" - quartz-tourmaline vein 2 analyses by electron microprobe replaced by analyses by LA-ICP-MS 3 B2O3 as a fixed weight, and H2O as the amount required to fill the F-site
Table
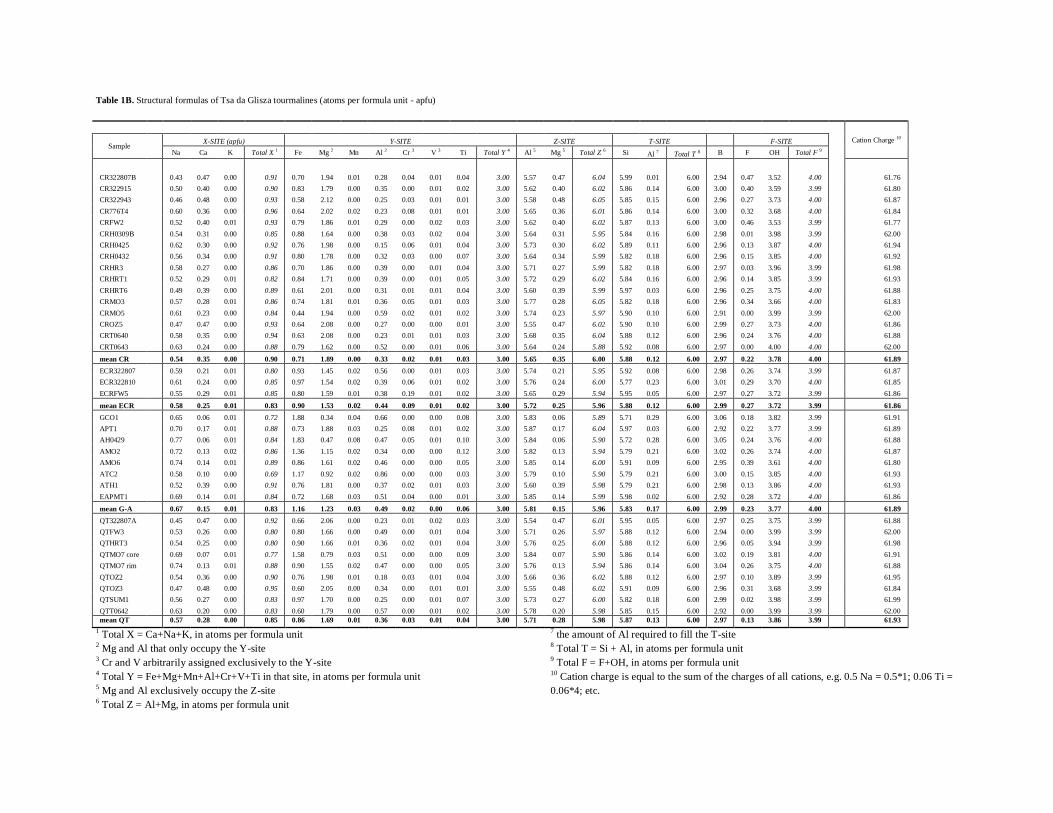
Table 1B. Structural formulas of Tsa da Glisza tourmalines (atoms per formula unit - apfu)
Cation Charge 10 Sample
X-SITE (apfu) Y-SITE Z-SITE T-SITE F-SITE
Na Ca K Total X 1 Fe Mg 2 Mn Al 2 Cr 3 V 3 Ti Total Y 4 Al 5 Mg 5 Total Z 6 Si Al 7 Total T 8 B F OH Total F 9
CR322807B 0.43 0.47 0.00 0.91 0.70 1.94 0.01 0.28 0.04 0.01 0.04 3.00 5.57 0.47 6.04 5.99 0.01 6.00 2.94 0.47 3.52 4.00
61.76
CR322915 0.50 0.40 0.00 0.90 0.83 1.79 0.00 0.35 0.00 0.01 0.02 3.00 5.62 0.40 6.02 5.86 0.14 6.00 3.00 0.40 3.59 3.99
61.80
CR322943 0.46 0.48 0.00 0.93 0.58 2.12 0.00 0.25 0.03 0.01 0.01 3.00 5.58 0.48 6.05 5.85 0.15 6.00 2.96 0.27 3.73 4.00
61.87
CR776T4 0.60 0.36 0.00 0.96 0.64 2.02 0.02 0.23 0.08 0.01 0.01 3.00 5.65 0.36 6.01 5.86 0.14 6.00 3.00 0.32 3.68 4.00
61.84
CRFW2 0.52 0.40 0.01 0.93 0.79 1.86 0.01 0.29 0.00 0.02 0.03 3.00 5.62 0.40 6.02 5.87 0.13 6.00 3.00 0.46 3.53 3.99
61.77
CRH0309B 0.54 0.31 0.00 0.85 0.88 1.64 0.00 0.38 0.03 0.02 0.04 3.00 5.64 0.31 5.95 5.84 0.16 6.00 2.98 0.01 3.98 3.99
62.00
CRH0425 0.62 0.30 0.00 0.92 0.76 1.98 0.00 0.15 0.06 0.01 0.04 3.00 5.73 0.30 6.02 5.89 0.11 6.00 2.96 0.13 3.87 4.00
61.94
CRH0432 0.56 0.34 0.00 0.91 0.80 1.78 0.00 0.32 0.03 0.00 0.07 3.00 5.64 0.34 5.99 5.82 0.18 6.00 2.96 0.15 3.85 4.00
61.92
CRHR3 0.58 0.27 0.00 0.86 0.70 1.86 0.00 0.39 0.00 0.01 0.04 3.00 5.71 0.27 5.99 5.82 0.18 6.00 2.97 0.03 3.96 3.99
61.98
CRHRT1 0.52 0.29 0.01 0.82 0.84 1.71 0.00 0.39 0.00 0.01 0.05 3.00 5.72 0.29 6.02 5.84 0.16 6.00 2.96 0.14 3.85 3.99
61.93
CRHRT6 0.49 0.39 0.00 0.89 0.61 2.01 0.00 0.31 0.01 0.01 0.04 3.00 5.60 0.39 5.99 5.97 0.03 6.00 2.96 0.25 3.75 4.00
61.88
CRMO3 0.57 0.28 0.01 0.86 0.74 1.81 0.01 0.36 0.05 0.01 0.03 3.00 5.77 0.28 6.05 5.82 0.18 6.00 2.96 0.34 3.66 4.00
61.83
CRMO5 0.61 0.23 0.00 0.84 0.44 1.94 0.00 0.59 0.02 0.01 0.02 3.00 5.74 0.23 5.97 5.90 0.10 6.00 2.91 0.00 3.99 3.99
62.00
CROZ5 0.47 0.47 0.00 0.93 0.64 2.08 0.00 0.27 0.00 0.00 0.01 3.00 5.55 0.47 6.02 5.90 0.10 6.00 2.99 0.27 3.73 4.00
61.86
CRT0640 0.58 0.35 0.00 0.94 0.63 2.08 0.00 0.23 0.01 0.01 0.03 3.00 5.68 0.35 6.04 5.88 0.12 6.00 2.96 0.24 3.76 4.00
61.88
CRT0643 0.63 0.24 0.00 0.88 0.79 1.62 0.00 0.52 0.00 0.01 0.06 3.00 5.64 0.24 5.88 5.92 0.08 6.00 2.97 0.00 4.00 4.00
62.00
mean CR 0.54 0.35 0.00 0.90 0.71 1.89 0.00 0.33 0.02 0.01 0.03 3.00 5.65 0.35 6.00 5.88 0.12 6.00 2.97 0.22 3.78 4.00 61.89
ECR322807 0.59 0.21 0.01 0.80 0.93 1.45 0.02 0.56 0.00 0.01 0.03 3.00 5.74 0.21 5.95 5.92 0.08 6.00 2.98 0.26 3.74 3.99
61.87
ECR322810 0.61 0.24 0.00 0.85 0.97 1.54 0.02 0.39 0.06 0.01 0.02 3.00 5.76 0.24 6.00 5.77 0.23 6.00 3.01 0.29 3.70 4.00
61.85
ECRFW5 0.55 0.29 0.01 0.85 0.80 1.59 0.01 0.38 0.19 0.01 0.02 3.00 5.65 0.29 5.94 5.95 0.05 6.00 2.97 0.27 3.72 3.99
61.86
mean ECR 0.58 0.25 0.01 0.83 0.90 1.53 0.02 0.44 0.09 0.01 0.02 3.00 5.72 0.25 5.96 5.88 0.12 6.00 2.99 0.27 3.72 3.99 61.86
GCO1 0.65 0.06 0.01 0.72 1.88 0.34 0.04 0.66 0.00 0.00 0.08 3.00 5.83 0.06 5.89 5.71 0.29 6.00 3.06 0.18 3.82 3.99
61.91
APT1 0.70 0.17 0.01 0.88 0.73 1.88 0.03 0.25 0.08 0.01 0.02 3.00 5.87 0.17 6.04 5.97 0.03 6.00 2.92 0.22 3.77 3.99
61.89
AH0429 0.77 0.06 0.01 0.84 1.83 0.47 0.08 0.47 0.05 0.01 0.10 3.00 5.84 0.06 5.90 5.72 0.28 6.00 3.05 0.24 3.76 4.00
61.88
AMO2 0.72 0.13 0.02 0.86 1.36 1.15 0.02 0.34 0.00 0.00 0.12 3.00 5.82 0.13 5.94 5.79 0.21 6.00 3.02 0.26 3.74 4.00
61.87
AMO6 0.74 0.14 0.01 0.89 0.86 1.61 0.02 0.46 0.00 0.00 0.05 3.00 5.85 0.14 6.00 5.91 0.09 6.00 2.95 0.39 3.61 4.00
61.80
ATC2 0.58 0.10 0.00 0.69 1.17 0.92 0.02 0.86 0.00 0.00 0.03 3.00 5.79 0.10 5.90 5.79 0.21 6.00 3.00 0.15 3.85 4.00
61.93
ATH1 0.52 0.39 0.00 0.91 0.76 1.81 0.00 0.37 0.02 0.01 0.03 3.00 5.60 0.39 5.98 5.79 0.21 6.00 2.98 0.13 3.86 4.00
61.93
EAPMT1 0.69 0.14 0.01 0.84 0.72 1.68 0.03 0.51 0.04 0.00 0.01 3.00 5.85 0.14 5.99 5.98 0.02 6.00 2.92 0.28 3.72 4.00
61.86
mean G-A 0.67 0.15 0.01 0.83 1.16 1.23 0.03 0.49 0.02 0.00 0.06 3.00 5.81 0.15 5.96 5.83 0.17 6.00 2.99 0.23 3.77 4.00 61.89
QT322807A 0.45 0.47 0.00 0.92 0.66 2.06 0.00 0.23 0.01 0.02 0.03 3.00 5.54 0.47 6.01 5.95 0.05 6.00 2.97 0.25 3.75 3.99
61.88
QTFW3 0.53 0.26 0.00 0.80 0.80 1.66 0.00 0.49 0.00 0.01 0.04 3.00 5.71 0.26 5.97 5.88 0.12 6.00 2.94 0.00 3.99 3.99
62.00
QTHRT3 0.54 0.25 0.00 0.80 0.90 1.66 0.01 0.36 0.02 0.01 0.04 3.00 5.76 0.25 6.00 5.88 0.12 6.00 2.96 0.05 3.94 3.99
61.98
QTMO7 core 0.69 0.07 0.01 0.77 1.58 0.79 0.03 0.51 0.00 0.00 0.09 3.00 5.84 0.07 5.90 5.86 0.14 6.00 3.02 0.19 3.81 4.00
61.91
QTMO7 rim
0.74 0.13 0.01 0.88 0.90 1.55 0.02 0.47 0.00 0.00 0.05 3.00 5.76 0.13 5.94 5.86 0.14 6.00 3.04 0.26 3.75 4.00
61.88
QTOZ2 0.54 0.36 0.00 0.90 0.76 1.98 0.01 0.18 0.03 0.01 0.04 3.00 5.66 0.36 6.02 5.88 0.12 6.00 2.97 0.10 3.89 3.99
61.95
QTOZ3 0.47 0.48 0.00 0.95 0.60 2.05 0.00 0.34 0.00 0.01 0.01 3.00 5.55 0.48 6.02 5.91 0.09 6.00 2.96 0.31 3.68 3.99
61.84
QTSUM1 0.56 0.27 0.00 0.83 0.97 1.70 0.00 0.25 0.00 0.01 0.07 3.00 5.73 0.27 6.00 5.82 0.18 6.00 2.99 0.02 3.98 3.99
61.99
QTT0642 0.63 0.20 0.00 0.83 0.60 1.79 0.00 0.57 0.00 0.01 0.02 3.00 5.78 0.20 5.98 5.85 0.15 6.00 2.92 0.00 3.99 3.99
62.00
mean QT
0.57 0.28 0.00 0.85 0.86 1.69 0.01 0.36 0.03 0.01 0.04 3.00 5.71 0.28 5.98 5.87 0.13 6.00 2.97 0.13 3.86 3.99
61.93
1 Total X = Ca+Na+K, in atoms per formula unit
2 Mg and Al that only occupy the Y-site
3 Cr and V arbitrarily assigned exclusively to the Y-site
4 Total Y = Fe+Mg+Mn+Al+Cr+V+Ti in that site, in atoms per formula unit
5 Mg and Al exclusively occupy the Z-site
6 Total Z = Al+Mg, in atoms per formula unit
7 the amount of Al required to fill the T-site
8 Total T = Si + Al, in atoms per formula unit
9 Total F = F+OH, in atoms per formula unit
10 Cation charge is equal to the sum of the charges of all cations, e.g. 0.5 Na = 0.5*1; 0.06 Ti =
0.06*4; etc.
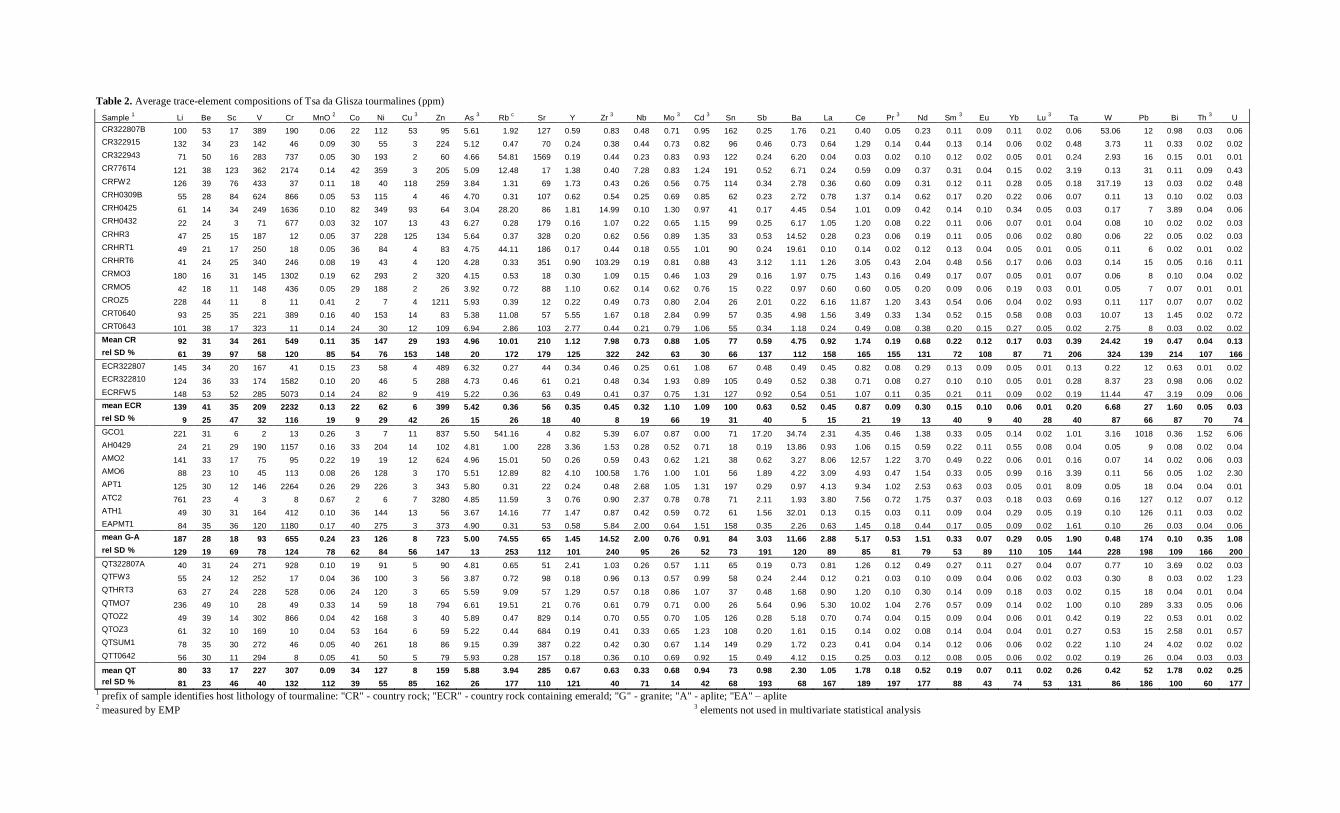
Table 2. Average trace-element compositions of Tsa da Glisza tourmalines (ppm)
Sample 1 Li Be Sc V Cr MnO
2 Co Ni Cu
3 Zn As
3 Rb
c Sr Y Zr
3 Nb Mo
3 Cd
3 Sn Sb Ba La Ce Pr
3 Nd Sm
3 Eu Yb Lu
3 Ta W Pb Bi Th
3 U
CR322807B 100 53 17 389 190 0.06 22 112 53 95 5.61 1.92 127 0.59 0.83 0.48 0.71 0.95 162 0.25 1.76 0.21 0.40 0.05 0.23 0.11 0.09 0.11 0.02 0.06 53.06 12 0.98 0.03 0.06
CR322915
132 34 23 142 46 0.09 30 55 3 224 5.12 0.47 70 0.24 0.38 0.44 0.73 0.82 96 0.46 0.73 0.64 1.29 0.14 0.44 0.13 0.14 0.06 0.02 0.48 3.73 11 0.33 0.02 0.02
CR322943
71 50 16 283 737 0.05 30 193 2 60 4.66 54.81 1569 0.19 0.44 0.23 0.83 0.93 122 0.24 6.20 0.04 0.03 0.02 0.10 0.12 0.02 0.05 0.01 0.24 2.93 16 0.15 0.01 0.01
CR776T4
121 38 123 362 2174 0.14 42 359 3 205 5.09 12.48 17 1.38 0.40 7.28 0.83 1.24 191 0.52 6.71 0.24 0.59 0.09 0.37 0.31 0.04 0.15 0.02 3.19 0.13 31 0.11 0.09 0.43
CRFW2
126 39 76 433 37 0.11 18 40 118 259 3.84 1.31 69 1.73 0.43 0.26 0.56 0.75 114 0.34 2.78 0.36 0.60 0.09 0.31 0.12 0.11 0.28 0.05 0.18 317.19 13 0.03 0.02 0.48
CRH0309B
55 28 84 624 866 0.05 53 115 4 46 4.70 0.31 107 0.62 0.54 0.25 0.69 0.85 62 0.23 2.72 0.78 1.37 0.14 0.62 0.17 0.20 0.22 0.06 0.07 0.11 13 0.10 0.02 0.03
CRH0425
61 14 34 249 1636 0.10 82 349 93 64 3.04 28.20 86 1.81 14.99 0.10 1.30 0.97 41 0.17 4.45 0.54 1.01 0.09 0.42 0.14 0.10 0.34 0.05 0.03 0.17 7 3.89 0.04 0.06
CRH0432
22 24 3 71 677 0.03 32 107 13 43 6.27 0.28 179 0.16 1.07 0.22 0.65 1.15 99 0.25 6.17 1.05 1.20 0.08 0.22 0.11 0.06 0.07 0.01 0.04 0.08 10 0.02 0.02 0.03
CRHR3
47 25 15 187 12 0.05 37 228 125 134 5.64 0.37 328 0.20 0.62 0.56 0.89 1.35 33 0.53 14.52 0.28 0.23 0.06 0.19 0.11 0.05 0.06 0.02 0.80 0.06 22 0.05 0.02 0.03
CRHRT1
49 21 17 250 18 0.05 36 84 4 83 4.75 44.11 186 0.17 0.44 0.18 0.55 1.01 90 0.24 19.61 0.10 0.14 0.02 0.12 0.13 0.04 0.05 0.01 0.05 0.11 6 0.02 0.01 0.02
CRHRT6
41 24 25 340 246 0.08 19 43 4 120 4.28 0.33 351 0.90 103.29 0.19 0.81 0.88 43 3.12 1.11 1.26 3.05 0.43 2.04 0.48 0.56 0.17 0.06 0.03 0.14 15 0.05 0.16 0.11
CRMO3
180 16 31 145 1302 0.19 62 293 2 320 4.15 0.53 18 0.30 1.09 0.15 0.46 1.03 29 0.16 1.97 0.75 1.43 0.16 0.49 0.17 0.07 0.05 0.01 0.07 0.06 8 0.10 0.04 0.02
CRMO5
42 18 11 148 436 0.05 29 188 2 26 3.92 0.72 88 1.10 0.62 0.14 0.62 0.76 15 0.22 0.97 0.60 0.60 0.05 0.20 0.09 0.06 0.19 0.03 0.01 0.05 7 0.07 0.01 0.01
CROZ5
228 44 11 8 11 0.41 2 7 4 1211 5.93 0.39 12 0.22 0.49 0.73 0.80 2.04 26 2.01 0.22 6.16 11.87 1.20 3.43 0.54 0.06 0.04 0.02 0.93 0.11 117 0.07 0.07 0.02
CRT0640
93 25 35 221 389 0.16 40 153 14 83 5.38 11.08 57 5.55 1.67 0.18 2.84 0.99 57 0.35 4.98 1.56 3.49 0.33 1.34 0.52 0.15 0.58 0.08 0.03 10.07 13 1.45 0.02 0.72
CRT0643 101 38 17 323 11 0.14 24 30 12 109 6.94 2.86 103 2.77 0.44 0.21 0.79 1.06 55 0.34 1.18 0.24 0.49 0.08 0.38 0.20 0.15 0.27 0.05 0.02 2.75 8 0.03 0.02 0.02
Mean CR 92 31 34 261 549 0.11 35 147 29 193 4.96 10.01 210 1.12 7.98 0.73 0.88 1.05 77 0.59 4.75 0.92 1.74 0.19 0.68 0.22 0.12 0.17 0.03 0.39 24.42 19 0.47 0.04 0.13
rel SD % 61 39 97 58 120 85 54 76 153 148 20 172 179 125 322 242 63 30 66 137 112 158 165 155 131 72 108 87 71 206 324 139 214 107 166
ECR322807 145 34 20 167 41 0.15 23 58 4 489 6.32 0.27 44 0.34 0.46 0.25 0.61 1.08 67 0.48 0.49 0.45 0.82 0.08 0.29 0.13 0.09 0.05 0.01 0.13 0.22 12 0.63 0.01 0.02
ECR322810 124 36 33 174 1582 0.10 20 46 5 288 4.73 0.46 61 0.21 0.48 0.34 1.93 0.89 105 0.49 0.52 0.38 0.71 0.08 0.27 0.10 0.10 0.05 0.01 0.28 8.37 23 0.98 0.06 0.02
ECRFW5 148 53 52 285 5073 0.14 24 82 9 419 5.22 0.36 63 0.49 0.41 0.37 0.75 1.31 127 0.92 0.54 0.51 1.07 0.11 0.35 0.21 0.11 0.09 0.02 0.19 11.44 47 3.19 0.09 0.06
mean ECR 139 41 35 209 2232 0.13 22 62 6 399 5.42 0.36 56 0.35 0.45 0.32 1.10 1.09 100 0.63 0.52 0.45 0.87 0.09 0.30 0.15 0.10 0.06 0.01 0.20 6.68 27 1.60 0.05 0.03
rel SD % 9 25 47 32 116 19 9 29 42 26 15 26 18 40 8 19 66 19 31 40 5 15 21 19 13 40 9 40 28 40 87 66 87 70 74
GCO1
221 31 6 2 13 0.26 3 7 11 837 5.50 541.16 4 0.82 5.39 6.07 0.87 0.00 71 17.20 34.74 2.31 4.35 0.46 1.38 0.33 0.05 0.14 0.02 1.01 3.16 1018 0.36 1.52 6.06
AH0429
24 21 29 190 1157 0.16 33 204 14 102 4.81 1.00 228 3.36 1.53 0.28 0.52 0.71 18 0.19 13.86 0.93 1.06 0.15 0.59 0.22 0.11 0.55 0.08 0.04 0.05 9 0.08 0.02 0.04
AMO2
141 33 17 75 95 0.22 19 19 12 624 4.96 15.01 50 0.26 0.59 0.43 0.62 1.21 38 0.62 3.27 8.06 12.57 1.22 3.70 0.49 0.22 0.06 0.01 0.16 0.07 14 0.02 0.06 0.03
AMO6
88 23 10 45 113 0.08 26 128 3 170 5.51 12.89 82 4.10 100.58 1.76 1.00 1.01 56 1.89 4.22 3.09 4.93 0.47 1.54 0.33 0.05 0.99 0.16 3.39 0.11 56 0.05 1.02 2.30
APT1
125 30 12 146 2264 0.26 29 226 3 343 5.80 0.31 22 0.24 0.48 2.68 1.05 1.31 197 0.29 0.97 4.13 9.34 1.02 2.53 0.63 0.03 0.05 0.01 8.09 0.05 18 0.04 0.04 0.01
ATC2
761 23 4 3 8 0.67 2 6 7 3280 4.85 11.59 3 0.76 0.90 2.37 0.78 0.78 71 2.11 1.93 3.80 7.56 0.72 1.75 0.37 0.03 0.18 0.03 0.69 0.16 127 0.12 0.07 0.12
ATH1
49 30 31 164 412 0.10 36 144 13 56 3.67 14.16 77 1.47 0.87 0.42 0.59 0.72 61 1.56 32.01 0.13 0.15 0.03 0.11 0.09 0.04 0.29 0.05 0.19 0.10 126 0.11 0.03 0.02
EAPMT1 84 35 36 120 1180 0.17 40 275 3 373 4.90 0.31 53 0.58 5.84 2.00 0.64 1.51 158 0.35 2.26 0.63 1.45 0.18 0.44 0.17 0.05 0.09 0.02 1.61 0.10 26 0.03 0.04 0.06
mean G-A 187 28 18 93 655 0.24 23 126 8 723 5.00 74.55 65 1.45 14.52 2.00 0.76 0.91 84 3.03 11.66 2.88 5.17 0.53 1.51 0.33 0.07 0.29 0.05 1.90 0.48 174 0.10 0.35 1.08
rel SD % 129 19 69 78 124 78 62 84 56 147 13 253 112 101 240 95 26 52 73 191 120 89 85 81 79 53 89 110 105 144 228 198 109 166 200
QT322807A 40 31 24 271 928 0.10 19 91 5 90 4.81 0.65 51 2.41 1.03 0.26 0.57 1.11 65 0.19 0.73 0.81 1.26 0.12 0.49 0.27 0.11 0.27 0.04 0.07 0.77 10 3.69 0.02 0.03
QTFW3
55 24 12 252 17 0.04 36 100 3 56 3.87 0.72 98 0.18 0.96 0.13 0.57 0.99 58 0.24 2.44 0.12 0.21 0.03 0.10 0.09 0.04 0.06 0.02 0.03 0.30 8 0.03 0.02 1.23
QTHRT3
63 27 24 228 528 0.06 24 120 3 65 5.59 9.09 57 1.29 0.57 0.18 0.86 1.07 37 0.48 1.68 0.90 1.20 0.10 0.30 0.14 0.09 0.18 0.03 0.02 0.15 18 0.04 0.01 0.04
QTMO7
236 49 10 28 49 0.33 14 59 18 794 6.61 19.51 21 0.76 0.61 0.79 0.71 0.00 26 5.64 0.96 5.30 10.02 1.04 2.76 0.57 0.09 0.14 0.02 1.00 0.10 289 3.33 0.05 0.06
QTOZ2
49 39 14 302 866 0.04 42 168 3 40 5.89 0.47 829 0.14 0.70 0.55 0.70 1.05 126 0.28 5.18 0.70 0.74 0.04 0.15 0.09 0.04 0.06 0.01 0.42 0.19 22 0.53 0.01 0.02
QTOZ3
61 32 10 169 10 0.04 53 164 6 59 5.22 0.44 684 0.19 0.41 0.33 0.65 1.23 108 0.20 1.61 0.15 0.14 0.02 0.08 0.14 0.04 0.04 0.01 0.27 0.53 15 2.58 0.01 0.57
QTSUM1
78 35 30 272 46 0.05 40 261 18 86 9.15 0.39 387 0.22 0.42 0.30 0.67 1.14 149 0.29 1.72 0.23 0.41 0.04 0.14 0.12 0.06 0.06 0.02 0.22 1.10 24 4.02 0.02 0.02
QTT0642 56 30 11 294 8 0.05 41 50 5 79 5.93 0.28 157 0.18 0.36 0.10 0.69 0.92 15 0.49 4.12 0.15 0.25 0.03 0.12 0.08 0.05 0.06 0.02 0.02 0.19 26 0.04 0.03 0.03
mean QT
80 33 17 227 307 0.09 34 127 8 159 5.88 3.94 285 0.67 0.63 0.33 0.68 0.94 73 0.98 2.30 1.05 1.78 0.18 0.52 0.19 0.07 0.11 0.02 0.26 0.42 52 1.78 0.02 0.25
rel SD % 81 23 46 40 132 112 39 55 85 162 26 177 110 121 40 71 14 42 68 193 68 167 189 197 177 88 43 74 53 131 86 186 100 60 177 1 prefix of sample identifies host lithology of tourmaline: "CR" - country rock; "ECR" - country rock containing emerald; "G" - granite; "A" - aplite; "EA" – aplite
2 measured by EMP
3 elements not used in multivariate statistical analysis
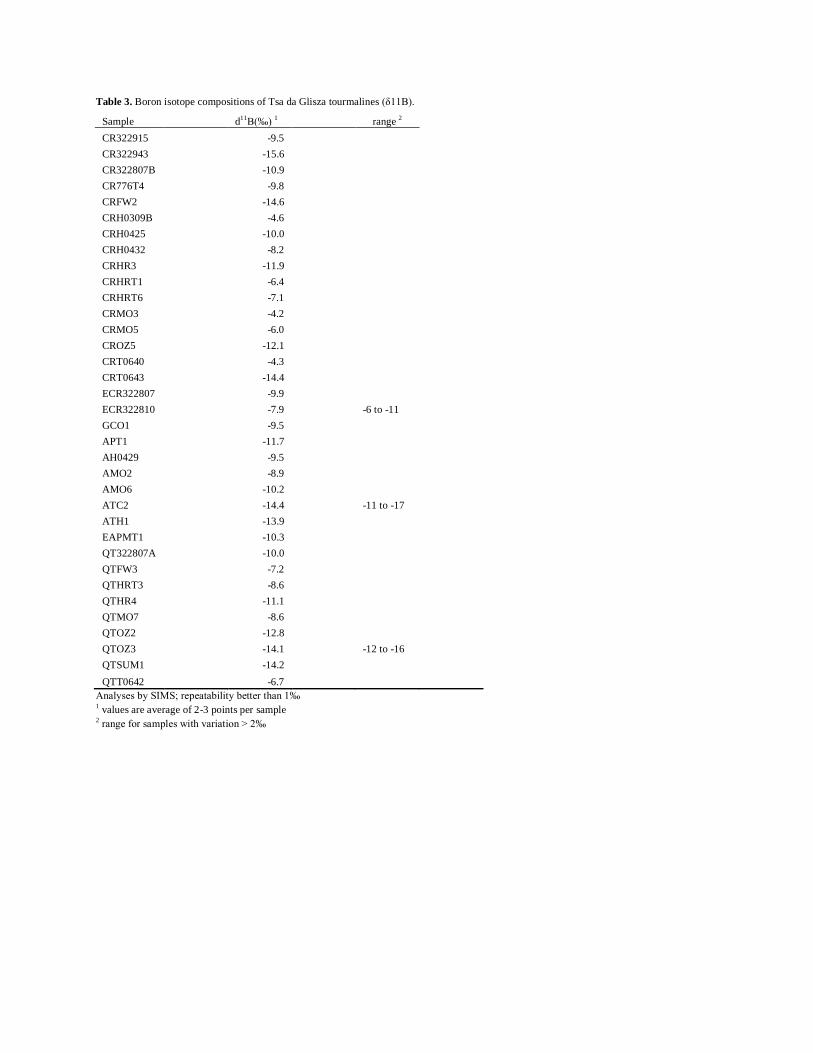
Table 3. Boron isotope compositions of Tsa da Glisza tourmalines (δ11B).
Sample d11
B(‰) 1 range
2
CR322915
-9.5
CR322943
-15.6
CR322807B -10.9
CR776T4
-9.8
CRFW2
-14.6
CRH0309B
-4.6
CRH0425
-10.0
CRH0432
-8.2
CRHR3
-11.9
CRHRT1
-6.4
CRHRT6
-7.1
CRMO3
-4.2
CRMO5
-6.0
CROZ5
-12.1
CRT0640
-4.3
CRT0643
-14.4
ECR322807 -9.9
ECR322810 -7.9
-6 to -11
GCO1
-9.5
APT1
-11.7
AH0429
-9.5
AMO2
-8.9
AMO6
-10.2
ATC2
-14.4
-11 to -17
ATH1
-13.9
EAPMT1
-10.3
QT322807A -10.0
QTFW3
-7.2
QTHRT3
-8.6
QTHR4
-11.1
QTMO7
-8.6
QTOZ2
-12.8
QTOZ3
-14.1
-12 to -16
QTSUM1
-14.2
QTT0642 -6.7
Analyses by SIMS; repeatability better than 1‰ 1 values are average of 2-3 points per sample
2 range for samples with variation > 2‰
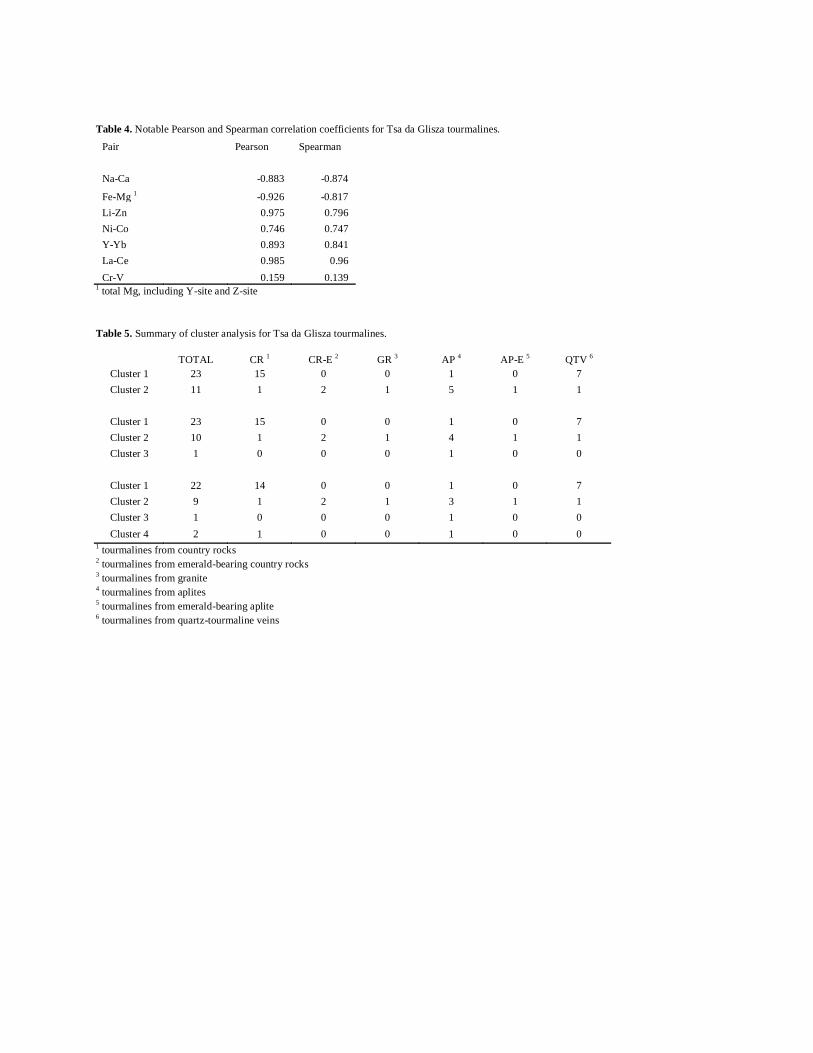
Table 4. Notable Pearson and Spearman correlation coefficients for Tsa da Glisza tourmalines.
Pair
Pearson Spearman
Na-Ca
-0.883 -0.874
Fe-Mg 1
-0.926 -0.817
Li-Zn
0.975 0.796
Ni-Co
0.746 0.747
Y-Yb
0.893 0.841
La-Ce
0.985 0.96
Cr-V 0.159 0.139 1 total Mg, including Y-site and Z-site
Table 5. Summary of cluster analysis for Tsa da Glisza tourmalines.
TOTAL CR 1 CR-E
2 GR
3 AP
4 AP-E
5 QTV
6
Cluster 1 23 15 0 0 1 0 7
Cluster 2 11 1 2 1 5 1 1
Cluster 1 23 15 0 0 1 0 7
Cluster 2 10 1 2 1 4 1 1
Cluster 3 1 0 0 0 1 0 0
Cluster 1 22 14 0 0 1 0 7
Cluster 2 9 1 2 1 3 1 1
Cluster 3 1 0 0 0 1 0 0
Cluster 4 2 1 0 0 1 0 0 1 tourmalines from country rocks
2 tourmalines from emerald-bearing country rocks
3 tourmalines from granite
4 tourmalines from aplites
5 tourmalines from emerald-bearing aplite
6 tourmalines from quartz-tourmaline veins
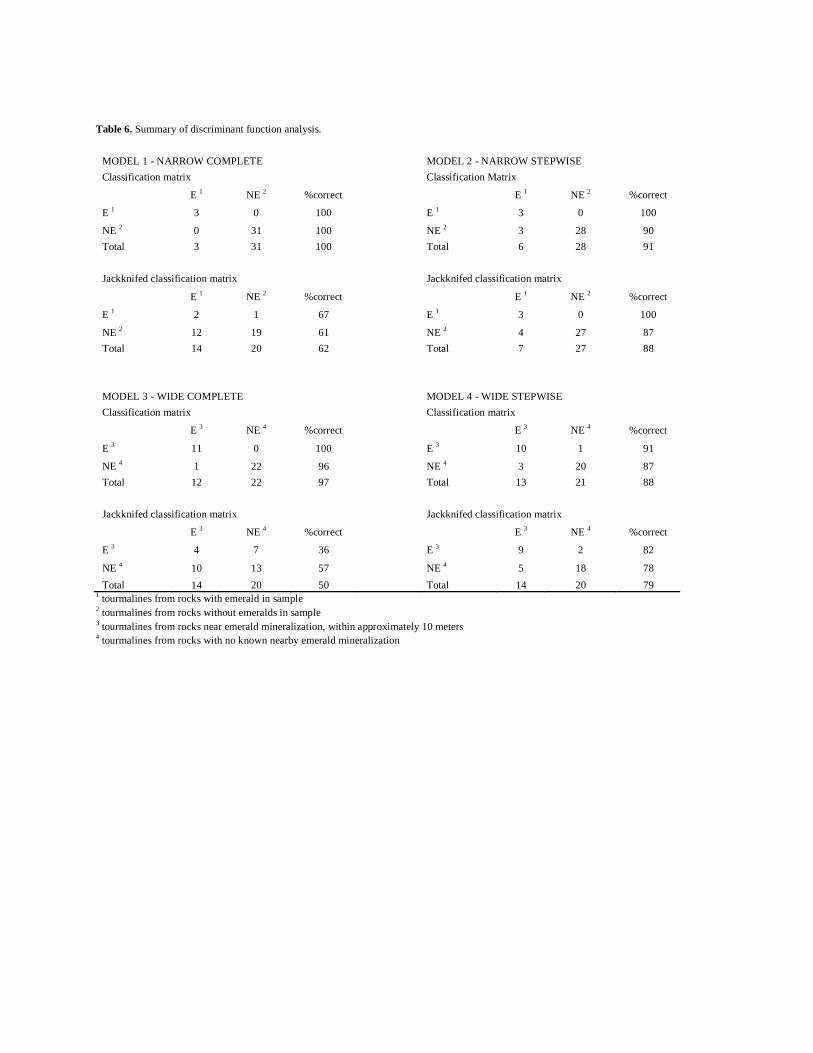
Table 6. Summary of discriminant function analysis.
MODEL 1 - NARROW COMPLETE
MODEL 2 - NARROW STEPWISE
Classification matrix
Classification Matrix
E 1 NE
2 %correct
E 1 NE
2 %correct
E 1 3 0 100
E 1 3 0 100
NE 2 0 31 100
NE 2 3 28 90
Total 3 31 100
Total 6 28 91
Jackknifed classification matrix
Jackknifed classification matrix
E 1 NE
2 %correct
E 1 NE
2 %correct
E 1 2 1 67
E 1 3 0 100
NE 2 12 19 61
NE 2 4 27 87
Total 14 20 62
Total 7 27 88
MODEL 3 - WIDE COMPLETE
MODEL 4 - WIDE STEPWISE
Classification matrix
Classification matrix
E 3 NE
4 %correct
E 3 NE
4 %correct
E 3 11 0 100
E 3 10 1 91
NE 4 1 22 96
NE 4 3 20 87
Total 12 22 97
Total 13 21 88
Jackknifed classification matrix
Jackknifed classification matrix
E 3 NE
4 %correct
E 3 NE
4 %correct
E 3 4 7 36
E 3 9 2 82
NE 4 10 13 57
NE 4 5 18 78
Total 14 20 50 Total 14 20 79 1 tourmalines from rocks with emerald in sample
2 tourmalines from rocks without emeralds in sample
3 tourmalines from rocks near emerald mineralization, within approximately 10 meters
4 tourmalines from rocks with no known nearby emerald mineralization
Related Documents