Journal of Water Resource and Protection, 2014, 6, 583-598 Published Online April 2014 in SciRes. http://www.scirp.org/journal/jwarp http://dx.doi.org/10.4236/jwarp.2014.66057 How to cite this paper: Mulat, A.G. and Moges, S.A. (2014) Assessment of the Impact of the Grand Ethiopian Renaissance Dam on the Performance of the High Aswan Dam. Journal of Water Resource and Protection, 6, 583-598. http://dx.doi.org/10.4236/jwarp.2014.66057 Assessment of the Impact of the Grand Ethiopian Renaissance Dam on the Performance of the High Aswan Dam Asegdew G. Mulat, Semu A. Moges School of Civil and Environmental Engineering, AAIT, Addis Ababa University, Addis Ababa, Ethiopia Email: [email protected] , [email protected] Received 9 February 2014; revised 8 March 2014; accepted 5 April 2014 Copyright © 2014 by authors and Scientific Research Publishing Inc. This work is licensed under the Creative Commons Attribution International License (CC BY). http://creativecommons.org/licenses/by/4.0/ Abstract A Large scale hydropower dam known as Grand Ethiopian Renaissance Dam (GERD) is under con- struction on the Blue Nile River just upstream of the Ethiopian-Sudan border in Ethiopia. The GERD has an active storage capacity of more than 60,000 Mm 3 and is anticipated to produce 6000 MW of hydropower energy. The aim of this study was to assess the potential impact of the dam on the performance of the High Aswan Dam (HAD) during filling and operation phases using a simu- lation model using Mike Basin river basin simulation model. The results indicate the planned 6 years filling period is sufficient to fill the reservoir with little impact on the current irrigation wa- ter demands from HAD in Egypt without additional management investment. There will be about 12% and 7% of reduction of annual energy output from High Aswan Dam during the filling and af- ter filling stage of GERD respectively. Cumulative Energy production from the two dams will in- crease significantly Water loss at HAD due to evaporation will decreases by 22%. Overall perfor- mance of HAD during and after filling of the GERD remains at a reliability level of 96%. The study advises to utilize the results cautiously as it is based on only one historical realization of the many possible scenarios that may evolve in the future. Keywords Impounding Impact, Renaissance Dam, Abbay River Basin, Eastern Nile 1. Introduction The Nile represents a crucial resource for the economy of eastern and north-eastern Africa. The basin has two important water supply sources and one important water user groups. The water supply sources are the Easter

Welcome message from author
This document is posted to help you gain knowledge. Please leave a comment to let me know what you think about it! Share it to your friends and learn new things together.
Transcript
Journal of Water Resource and Protection, 2014, 6, 583-598 Published Online April 2014 in SciRes. http://www.scirp.org/journal/jwarp http://dx.doi.org/10.4236/jwarp.2014.66057
How to cite this paper: Mulat, A.G. and Moges, S.A. (2014) Assessment of the Impact of the Grand Ethiopian Renaissance Dam on the Performance of the High Aswan Dam. Journal of Water Resource and Protection, 6, 583-598. http://dx.doi.org/10.4236/jwarp.2014.66057
Assessment of the Impact of the Grand Ethiopian Renaissance Dam on the Performance of the High Aswan Dam Asegdew G. Mulat, Semu A. Moges School of Civil and Environmental Engineering, AAIT, Addis Ababa University, Addis Ababa, Ethiopia Email: [email protected], [email protected] Received 9 February 2014; revised 8 March 2014; accepted 5 April 2014
Copyright © 2014 by authors and Scientific Research Publishing Inc. This work is licensed under the Creative Commons Attribution International License (CC BY). http://creativecommons.org/licenses/by/4.0/
Abstract A Large scale hydropower dam known as Grand Ethiopian Renaissance Dam (GERD) is under con- struction on the Blue Nile River just upstream of the Ethiopian-Sudan border in Ethiopia. The GERD has an active storage capacity of more than 60,000 Mm3 and is anticipated to produce 6000 MW of hydropower energy. The aim of this study was to assess the potential impact of the dam on the performance of the High Aswan Dam (HAD) during filling and operation phases using a simu- lation model using Mike Basin river basin simulation model. The results indicate the planned 6 years filling period is sufficient to fill the reservoir with little impact on the current irrigation wa- ter demands from HAD in Egypt without additional management investment. There will be about 12% and 7% of reduction of annual energy output from High Aswan Dam during the filling and af- ter filling stage of GERD respectively. Cumulative Energy production from the two dams will in- crease significantly Water loss at HAD due to evaporation will decreases by 22%. Overall perfor- mance of HAD during and after filling of the GERD remains at a reliability level of 96%. The study advises to utilize the results cautiously as it is based on only one historical realization of the many possible scenarios that may evolve in the future.
Keywords Impounding Impact, Renaissance Dam, Abbay River Basin, Eastern Nile
1. Introduction The Nile represents a crucial resource for the economy of eastern and north-eastern Africa. The basin has two important water supply sources and one important water user groups. The water supply sources are the Easter
A. G. Mulat, S. A. Moges
584
Nile (Ethiopia) which contributes almost 85% of the flow of the Nile and Eastern equatorial Nile (Nile Equa- torial countries) which contributes 15% of the flow. Water is emerging as the critical resource in the entire basin due to population pressure, hydrological variability and the desire of the economic development of upstream countries.
The water resources availability and uses are unevenly distributed amongst the countries: Egypt and Sudan are the largest water consumers while this is negligible for Ethiopia, even though 85% of the Nile waters come from Ethiopian highlands. Both Egypt, and to a lesser extent Sudan, are almost wholly dependent on water that originates from the Nile with significant irrigation in both countries [1]. In contrast Ethiopia has developed less than 5% of the irrigable land in the basin and less than 3% of the hydropower potential [2]. Ethiopia possesses abundant water resources and hydropower potential, second only to the Democratic Republic of Congo in all of Africa [3]. Currently, 83% of Ethiopia’s population lacks access to electricity, with 94% still relying on fuel wood for daily cooking and heating [4]. The Ethiopian government is therefore pursuing ambitious plans and programs to develop hydropower in an effort to substantially reduce poverty and create an atmosphere for social change. This would be an impressive upgrade over the existing hydroelectric power within Ethiopia [5].
The Grand Ethiopian Renaissance Dam is under-construction gravity dam on the Blue Nile River in Ethiopia. Renaissance dam located close to Ethiopia-Sudan boarder will form the largest hydropower producing dam in Africa with over 60,000 MCM of active reservoir storage. When completed, it is anticipated to produce maxi- mum of 6000 MW of hydropower energy. The potential impacts of the dam have been the source of regional controversy. The Government of Egypt, a country which relies heavily on the waters of the Nile, protests the dam which it believes will reduce the amount of water that it gets from Nile.
The eventual site for the Grand Ethiopian Renaissance Dam was identified by the United States Bureau of Reclamation during a Blue Nile survey conducted between 1956 and 1964. The Ethiopian Government surveyed the site in October 2009 and August 2010. On 31 March 2011 the project was made public. The first two gene- rators are expected to become operational after 44 months of construction.
The construction of the GERD dam hereafter is partly the result of the stalling of the cooperative framework agreement in the basin and partly the dire energy requirement of the emerging economic development of Ethi- opia. Several hydro-economic modeling results indicate that hydropower development in the Blue Nile is not only attractive economically but also is also one of the Nile sub-basins with the largest hydropower potential [6]-[10].
Furthermore, the anticipated Nile basin cooperative framework agreement which was toiled for more than a decade hasn’t produced a tangible result. Major components of the agreed upon joint multipurpose projects ha- ven’t yet been realized or thought about to be realized. The major bottleneck for impasse was mainly the late in- troduction of a new concept of “water security” in the developed Cooperative Framework agreement (CFA) [11]. Consequently, all countries in the Nile basin are emerging to precede developing their resources unilaterally to improve their economy and alleviate poverty in their respective countries. The construction of the Renaissance dam can be considered the dire manifestation of the economic development needs of the riparian countries.
This study is probably the first attempt to study the impact of the GERD dam on the current water use of the downstream riparian countries mainly on High Aswan Dam (HAD). Other past simulation studies on future dams across the Blue Nile have mostly considered four cascaded large reservoirs which includes Karadobi, Be- ko Abo, Mendya and Border (USBR, 1964). On the basis of simulation studies, the construction of the series of dam across the Blue Nile enhances regional power as well as well as benefits Ethiopia economically. GERD is the enlarged form of the border dam. The impact of this enlarged dam on downstream riparian countries hasn’t been studied. We hope this study opens up research gate to further long term studies.
2. Description of the Eastern Nile The Nile is the second largest basin in Africa next to Congo basin and traverses a total of eleven countries in- cluding Burundi, Democratic Congo, Egypt, Ethiopia, Eritrea Kenya, Rwanda, South Sudan, Sudan, Tanzania, and Uganda. The Nile has two important water supply sources. The Easter Nile (Ethiopia) which contributes almost 85% of the flow of the Nile and Eastern Equatorial Nile (Nile Equatorial countries) which contributes 15% of the flow. The Blue Nile contributes about 60% of the total flow at Aswan and remains an important river ba- sin to the Eastern Nile countries.
The Blue Nile basin (BNB) is characterized by highly rugged topography and considerable variation in alti-
A. G. Mulat, S. A. Moges
585
tude. The elevation of the basin varies greatly from over 4000 m in headwaters of some tributaries to 700 m at the foot of plateau. This gives Blue Nile unique advantage to develop hydropower in the basin. The upper Blue Nile flow is contributed from a number of tributaries. Some of the major tributaries are Beshilo, Weleka, Jemma, Beles, Muger, Guder, Finchaa, and Didessa from the east and south; and the Birr, Fettam, and Dura from the north and Dabus from the west. Lake Tana, which has 16,500 km2 and 3600 km2 catchment and surface area re- spectively, contributions less than 10% of the Blue Nile annual flow.
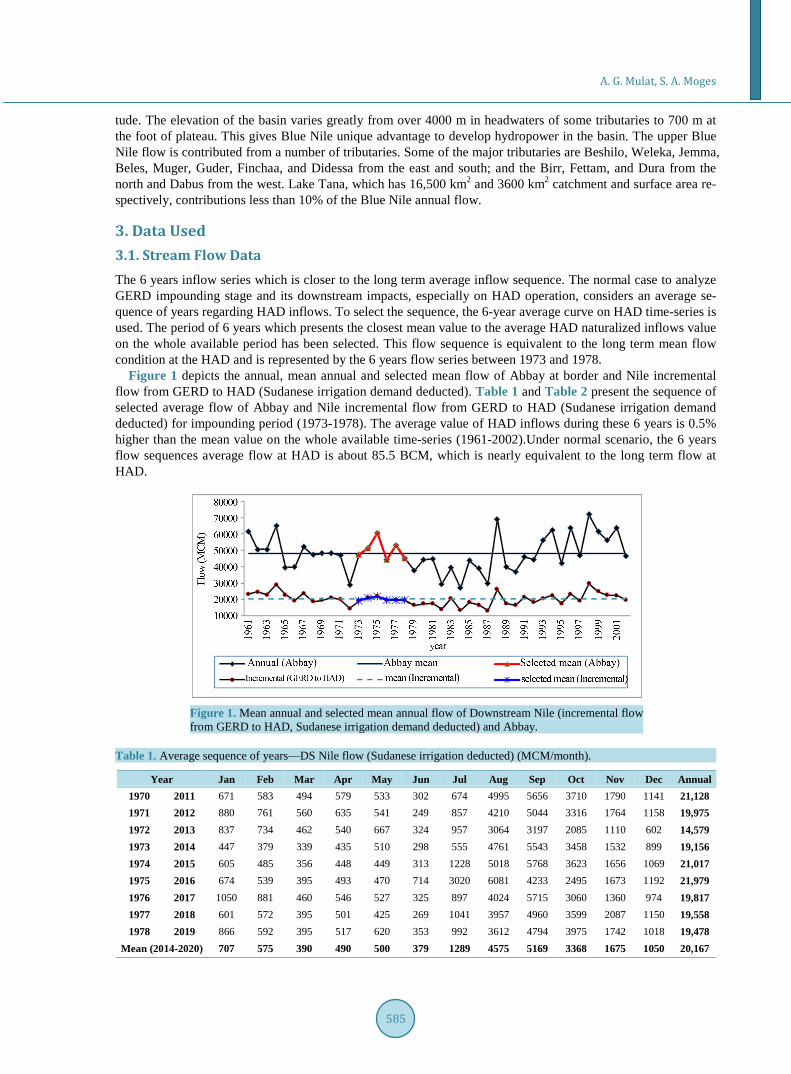
3. Data Used 3.1. Stream Flow Data The 6 years inflow series which is closer to the long term average inflow sequence. The normal case to analyze GERD impounding stage and its downstream impacts, especially on HAD operation, considers an average se- quence of years regarding HAD inflows. To select the sequence, the 6-year average curve on HAD time-series is used. The period of 6 years which presents the closest mean value to the average HAD naturalized inflows value on the whole available period has been selected. This flow sequence is equivalent to the long term mean flow condition at the HAD and is represented by the 6 years flow series between 1973 and 1978.
Figure 1 depicts the annual, mean annual and selected mean flow of Abbay at border and Nile incremental flow from GERD to HAD (Sudanese irrigation demand deducted). Table 1 and Table 2 present the sequence of selected average flow of Abbay and Nile incremental flow from GERD to HAD (Sudanese irrigation demand deducted) for impounding period (1973-1978). The average value of HAD inflows during these 6 years is 0.5% higher than the mean value on the whole available time-series (1961-2002).Under normal scenario, the 6 years flow sequences average flow at HAD is about 85.5 BCM, which is nearly equivalent to the long term flow at HAD.
Figure 1. Mean annual and selected mean annual flow of Downstream Nile (incremental flow from GERD to HAD, Sudanese irrigation demand deducted) and Abbay.
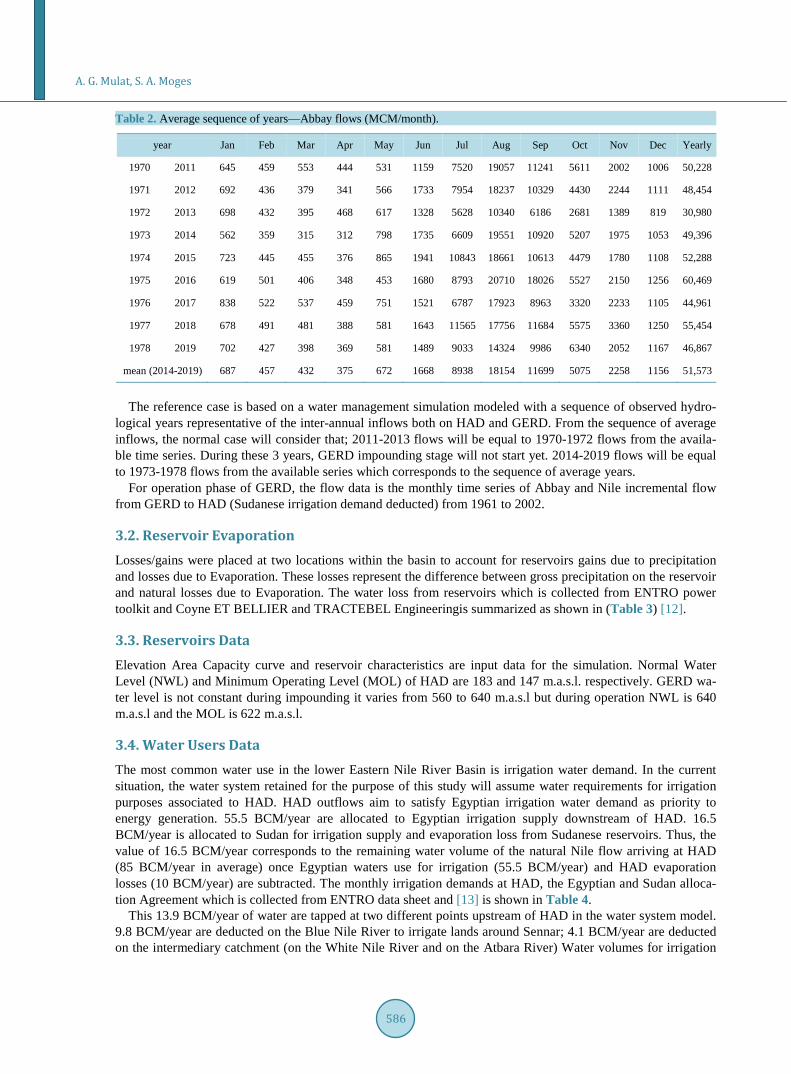
Table 1. Average sequence of years—DS Nile flow (Sudanese irrigation deducted) (MCM/month).
Year Jan Feb Mar Apr May Jun Jul Aug Sep Oct Nov Dec Annual 1970 2011 671 583 494 579 533 302 674 4995 5656 3710 1790 1141 21,128 1971 2012 880 761 560 635 541 249 857 4210 5044 3316 1764 1158 19,975 1972 2013 837 734 462 540 667 324 957 3064 3197 2085 1110 602 14,579 1973 2014 447 379 339 435 510 298 555 4761 5543 3458 1532 899 19,156 1974 2015 605 485 356 448 449 313 1228 5018 5768 3623 1656 1069 21,017 1975 2016 674 539 395 493 470 714 3020 6081 4233 2495 1673 1192 21,979 1976 2017 1050 881 460 546 527 325 897 4024 5715 3060 1360 974 19,817 1977 2018 601 572 395 501 425 269 1041 3957 4960 3599 2087 1150 19,558 1978 2019 866 592 395 517 620 353 992 3612 4794 3975 1742 1018 19,478
Mean (2014-2020) 707 575 390 490 500 379 1289 4575 5169 3368 1675 1050 20,167
A. G. Mulat, S. A. Moges
586
Table 2. Average sequence of years—Abbay flows (MCM/month).
year Jan Feb Mar Apr May Jun Jul Aug Sep Oct Nov Dec Yearly
1970 2011 645 459 553 444 531 1159 7520 19057 11241 5611 2002 1006 50,228
1971 2012 692 436 379 341 566 1733 7954 18237 10329 4430 2244 1111 48,454
1972 2013 698 432 395 468 617 1328 5628 10340 6186 2681 1389 819 30,980
1973 2014 562 359 315 312 798 1735 6609 19551 10920 5207 1975 1053 49,396
1974 2015 723 445 455 376 865 1941 10843 18661 10613 4479 1780 1108 52,288
1975 2016 619 501 406 348 453 1680 8793 20710 18026 5527 2150 1256 60,469
1976 2017 838 522 537 459 751 1521 6787 17923 8963 3320 2233 1105 44,961
1977 2018 678 491 481 388 581 1643 11565 17756 11684 5575 3360 1250 55,454
1978 2019 702 427 398 369 581 1489 9033 14324 9986 6340 2052 1167 46,867
mean (2014-2019) 687 457 432 375 672 1668 8938 18154 11699 5075 2258 1156 51,573
The reference case is based on a water management simulation modeled with a sequence of observed hydro-
logical years representative of the inter-annual inflows both on HAD and GERD. From the sequence of average inflows, the normal case will consider that; 2011-2013 flows will be equal to 1970-1972 flows from the availa- ble time series. During these 3 years, GERD impounding stage will not start yet. 2014-2019 flows will be equal to 1973-1978 flows from the available series which corresponds to the sequence of average years.
For operation phase of GERD, the flow data is the monthly time series of Abbay and Nile incremental flow from GERD to HAD (Sudanese irrigation demand deducted) from 1961 to 2002.
3.2. Reservoir Evaporation Losses/gains were placed at two locations within the basin to account for reservoirs gains due to precipitation and losses due to Evaporation. These losses represent the difference between gross precipitation on the reservoir and natural losses due to Evaporation. The water loss from reservoirs which is collected from ENTRO power toolkit and Coyne ET BELLIER and TRACTEBEL Engineeringis summarized as shown in (Table 3) [12].
3.3. Reservoirs Data Elevation Area Capacity curve and reservoir characteristics are input data for the simulation. Normal Water Level (NWL) and Minimum Operating Level (MOL) of HAD are 183 and 147 m.a.s.l. respectively. GERD wa- ter level is not constant during impounding it varies from 560 to 640 m.a.s.l but during operation NWL is 640 m.a.s.l and the MOL is 622 m.a.s.l.
3.4. Water Users Data The most common water use in the lower Eastern Nile River Basin is irrigation water demand. In the current situation, the water system retained for the purpose of this study will assume water requirements for irrigation purposes associated to HAD. HAD outflows aim to satisfy Egyptian irrigation water demand as priority to energy generation. 55.5 BCM/year are allocated to Egyptian irrigation supply downstream of HAD. 16.5 BCM/year is allocated to Sudan for irrigation supply and evaporation loss from Sudanese reservoirs. Thus, the value of 16.5 BCM/year corresponds to the remaining water volume of the natural Nile flow arriving at HAD (85 BCM/year in average) once Egyptian waters use for irrigation (55.5 BCM/year) and HAD evaporation losses (10 BCM/year) are subtracted. The monthly irrigation demands at HAD, the Egyptian and Sudan alloca- tion Agreement which is collected from ENTRO data sheet and [13] is shown in Table 4.
This 13.9 BCM/year of water are tapped at two different points upstream of HAD in the water system model. 9.8 BCM/year are deducted on the Blue Nile River to irrigate lands around Sennar; 4.1 BCM/year are deducted on the intermediary catchment (on the White Nile River and on the Atbara River) Water volumes for irrigation
A. G. Mulat, S. A. Moges
587
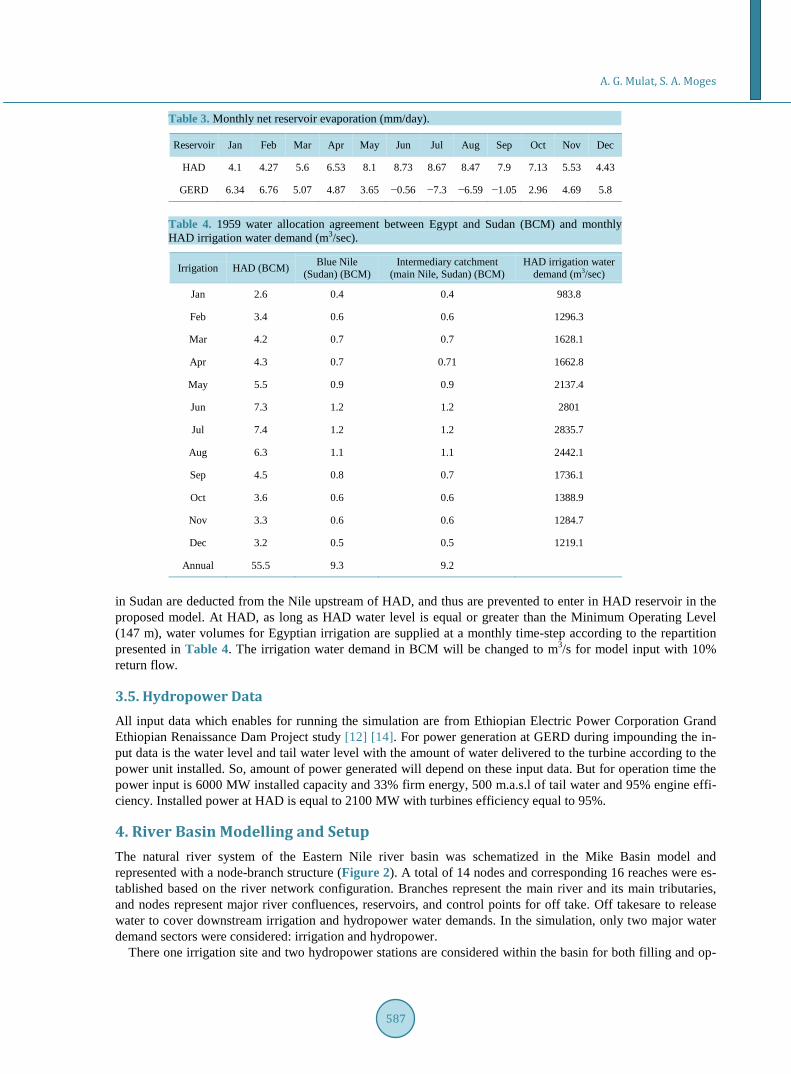
Table 3. Monthly net reservoir evaporation (mm/day).
Reservoir Jan Feb Mar Apr May Jun Jul Aug Sep Oct Nov Dec
HAD 4.1 4.27 5.6 6.53 8.1 8.73 8.67 8.47 7.9 7.13 5.53 4.43
GERD 6.34 6.76 5.07 4.87 3.65 −0.56 −7.3 −6.59 −1.05 2.96 4.69 5.8
Table 4. 1959 water allocation agreement between Egypt and Sudan (BCM) and monthly HAD irrigation water demand (m3/sec).
Irrigation HAD (BCM) Blue Nile (Sudan) (BCM)
Intermediary catchment (main Nile, Sudan) (BCM)
HAD irrigation water demand (m3/sec)
Jan 2.6 0.4 0.4 983.8
Feb 3.4 0.6 0.6 1296.3
Mar 4.2 0.7 0.7 1628.1
Apr 4.3 0.7 0.71 1662.8
May 5.5 0.9 0.9 2137.4
Jun 7.3 1.2 1.2 2801
Jul 7.4 1.2 1.2 2835.7
Aug 6.3 1.1 1.1 2442.1
Sep 4.5 0.8 0.7 1736.1
Oct 3.6 0.6 0.6 1388.9
Nov 3.3 0.6 0.6 1284.7
Dec 3.2 0.5 0.5 1219.1
Annual 55.5 9.3 9.2
in Sudan are deducted from the Nile upstream of HAD, and thus are prevented to enter in HAD reservoir in the proposed model. At HAD, as long as HAD water level is equal or greater than the Minimum Operating Level (147 m), water volumes for Egyptian irrigation are supplied at a monthly time-step according to the repartition presented in Table 4. The irrigation water demand in BCM will be changed to m3/s for model input with 10% return flow.
3.5. Hydropower Data All input data which enables for running the simulation are from Ethiopian Electric Power Corporation Grand Ethiopian Renaissance Dam Project study [12] [14]. For power generation at GERD during impounding the in- put data is the water level and tail water level with the amount of water delivered to the turbine according to the power unit installed. So, amount of power generated will depend on these input data. But for operation time the power input is 6000 MW installed capacity and 33% firm energy, 500 m.a.s.l of tail water and 95% engine effi- ciency. Installed power at HAD is equal to 2100 MW with turbines efficiency equal to 95%.
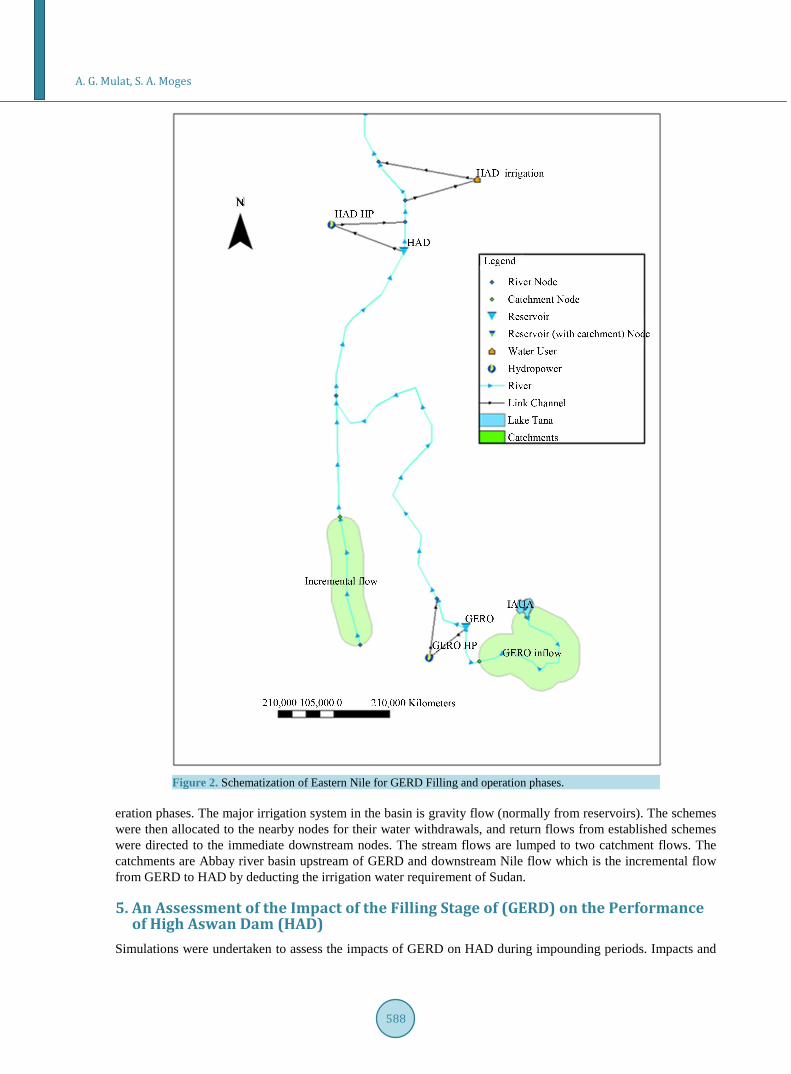
4. River Basin Modelling and Setup The natural river system of the Eastern Nile river basin was schematized in the Mike Basin model and represented with a node-branch structure (Figure 2). A total of 14 nodes and corresponding 16 reaches were es- tablished based on the river network configuration. Branches represent the main river and its main tributaries, and nodes represent major river confluences, reservoirs, and control points for off take. Off takesare to release water to cover downstream irrigation and hydropower water demands. In the simulation, only two major water demand sectors were considered: irrigation and hydropower.
There one irrigation site and two hydropower stations are considered within the basin for both filling and op-
A. G. Mulat, S. A. Moges
588
Figure 2. Schematization of Eastern Nile for GERD Filling and operation phases.
eration phases. The major irrigation system in the basin is gravity flow (normally from reservoirs). The schemes were then allocated to the nearby nodes for their water withdrawals, and return flows from established schemes were directed to the immediate downstream nodes. The stream flows are lumped to two catchment flows. The catchments are Abbay river basin upstream of GERD and downstream Nile flow which is the incremental flow from GERD to HAD by deducting the irrigation water requirement of Sudan.
5. An Assessment of the Impact of the Filling Stage of (GERD) on the Performance of High Aswan Dam (HAD)
Simulations were undertaken to assess the impacts of GERD on HAD during impounding periods. Impacts and
A. G. Mulat, S. A. Moges
589
benefits are assessed based on the local situations and the considering the basin as a system for selected mean flow. The computed results of the sensitive analysis related to irrigation water demand coverage and Hydro- power are synthesized. Comparative analysis of HAD operation results for the current situation and HAD with GERD has been conducted.
5.1. The GERD Dam Filling Strategies According to the envisaged construction and first impounding schedule (Coyne ET BELLIER and TRACTEBEL Engineering) [12] it is considered that: • GERD impounding stage will start in January 2014; • Energy generation can start in September 2014, considering that 2 groups will be installed and once water
level will reach 560 m.a.s.l; • GERD will be completed in June 2016 and then, the water level will not decrease below 622 m.a.s.l, which
is the minimum release level; • The impounding stage will be considered complete when GERD water level will reach its Normal Water
Level (640 m.a.s.l).
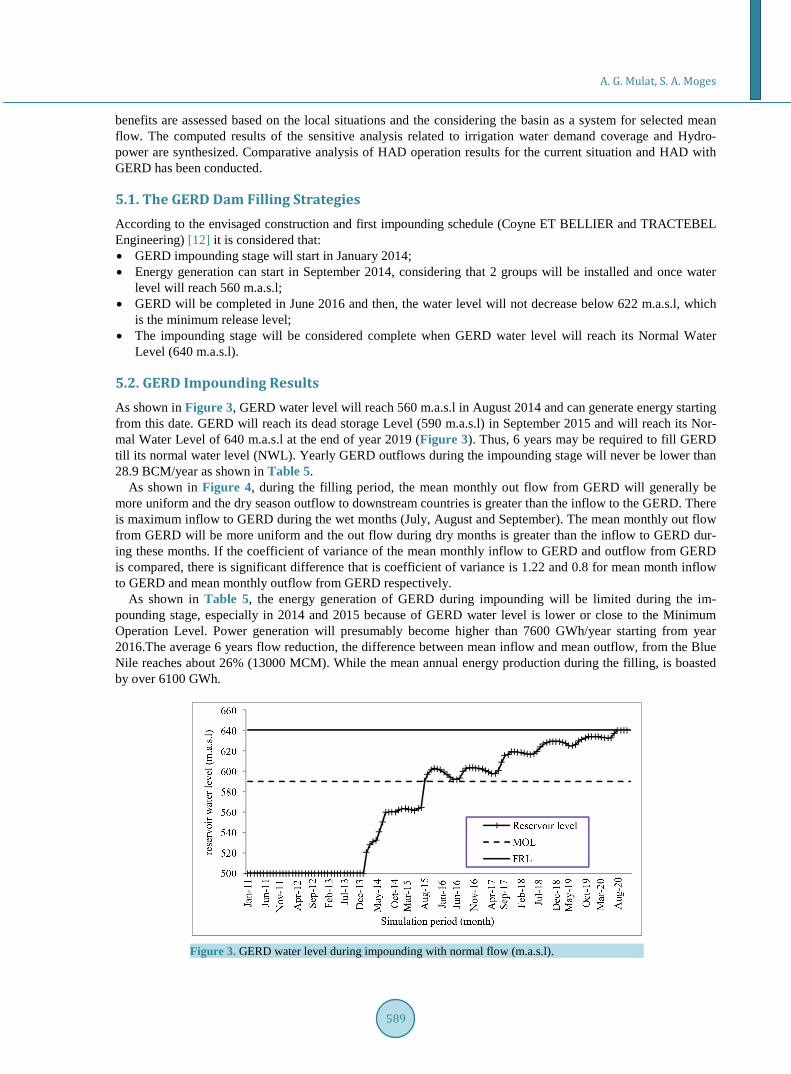
5.2. GERD Impounding Results As shown in Figure 3, GERD water level will reach 560 m.a.s.l in August 2014 and can generate energy starting from this date. GERD will reach its dead storage Level (590 m.a.s.l) in September 2015 and will reach its Nor- mal Water Level of 640 m.a.s.l at the end of year 2019 (Figure 3). Thus, 6 years may be required to fill GERD till its normal water level (NWL). Yearly GERD outflows during the impounding stage will never be lower than 28.9 BCM/year as shown in Table 5.
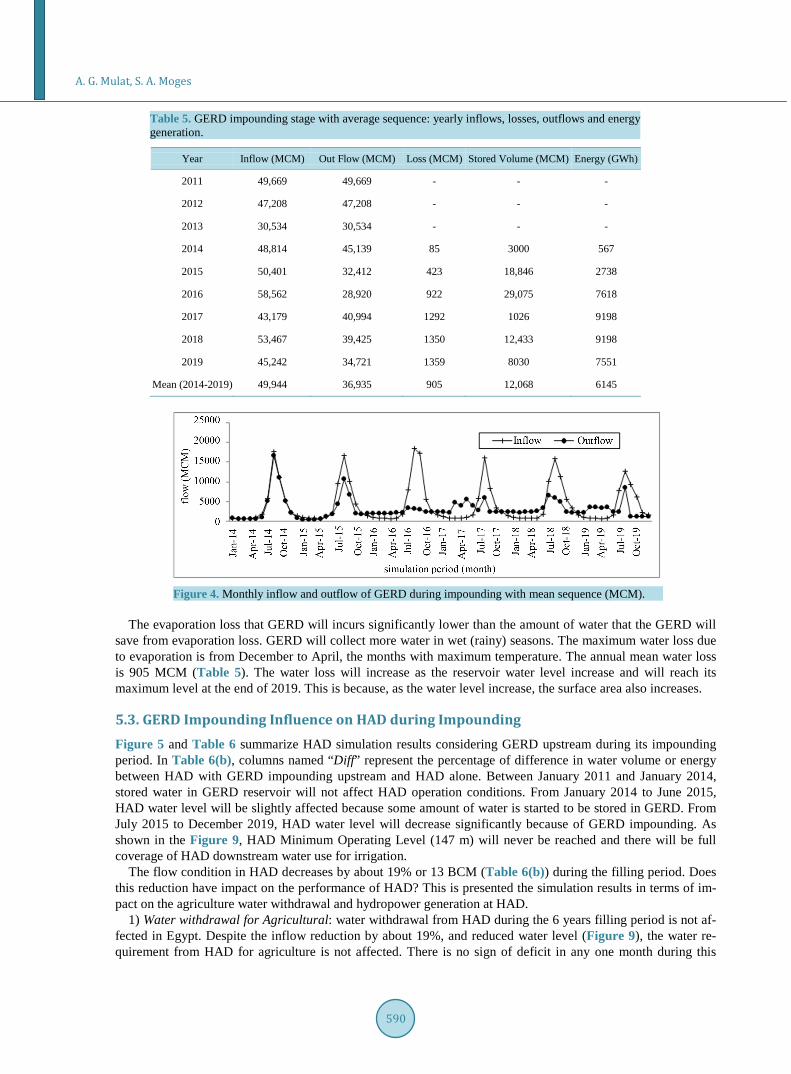
As shown in Figure 4, during the filling period, the mean monthly out flow from GERD will generally be more uniform and the dry season outflow to downstream countries is greater than the inflow to the GERD. There is maximum inflow to GERD during the wet months (July, August and September). The mean monthly out flow from GERD will be more uniform and the out flow during dry months is greater than the inflow to GERD dur- ing these months. If the coefficient of variance of the mean monthly inflow to GERD and outflow from GERD is compared, there is significant difference that is coefficient of variance is 1.22 and 0.8 for mean month inflow to GERD and mean monthly outflow from GERD respectively.
As shown in Table 5, the energy generation of GERD during impounding will be limited during the im- pounding stage, especially in 2014 and 2015 because of GERD water level is lower or close to the Minimum Operation Level. Power generation will presumably become higher than 7600 GWh/year starting from year 2016.The average 6 years flow reduction, the difference between mean inflow and mean outflow, from the Blue Nile reaches about 26% (13000 MCM). While the mean annual energy production during the filling, is boasted by over 6100 GWh.
Figure 3. GERD water level during impounding with normal flow (m.a.s.l).
A. G. Mulat, S. A. Moges
590
Table 5. GERD impounding stage with average sequence: yearly inflows, losses, outflows and energy generation.
Year Inflow (MCM) Out Flow (MCM) Loss (MCM) Stored Volume (MCM) Energy (GWh)
2011 49,669 49,669 - - -
2012 47,208 47,208 - - -
2013 30,534 30,534 - - -
2014 48,814 45,139 85 3000 567
2015 50,401 32,412 423 18,846 2738
2016 58,562 28,920 922 29,075 7618
2017 43,179 40,994 1292 1026 9198
2018 53,467 39,425 1350 12,433 9198
2019 45,242 34,721 1359 8030 7551
Mean (2014-2019) 49,944 36,935 905 12,068 6145
Figure 4. Monthly inflow and outflow of GERD during impounding with mean sequence (MCM).
The evaporation loss that GERD will incurs significantly lower than the amount of water that the GERD will
save from evaporation loss. GERD will collect more water in wet (rainy) seasons. The maximum water loss due to evaporation is from December to April, the months with maximum temperature. The annual mean water loss is 905 MCM (Table 5). The water loss will increase as the reservoir water level increase and will reach its maximum level at the end of 2019. This is because, as the water level increase, the surface area also increases.
5.3. GERD Impounding Influence on HAD during Impounding Figure 5 and Table 6 summarize HAD simulation results considering GERD upstream during its impounding period. In Table 6(b), columns named “Diff” represent the percentage of difference in water volume or energy between HAD with GERD impounding upstream and HAD alone. Between January 2011 and January 2014, stored water in GERD reservoir will not affect HAD operation conditions. From January 2014 to June 2015, HAD water level will be slightly affected because some amount of water is started to be stored in GERD. From July 2015 to December 2019, HAD water level will decrease significantly because of GERD impounding. As shown in the Figure 9, HAD Minimum Operating Level (147 m) will never be reached and there will be full coverage of HAD downstream water use for irrigation.
The flow condition in HAD decreases by about 19% or 13 BCM (Table 6(b)) during the filling period. Does this reduction have impact on the performance of HAD? This is presented the simulation results in terms of im- pact on the agriculture water withdrawal and hydropower generation at HAD.
1) Water withdrawal for Agricultural: water withdrawal from HAD during the 6 years filling period is not af- fected in Egypt. Despite the inflow reduction by about 19%, and reduced water level (Figure 9), the water re- quirement from HAD for agriculture is not affected. There is no sign of deficit in any one month during this
A. G. Mulat, S. A. Moges
591
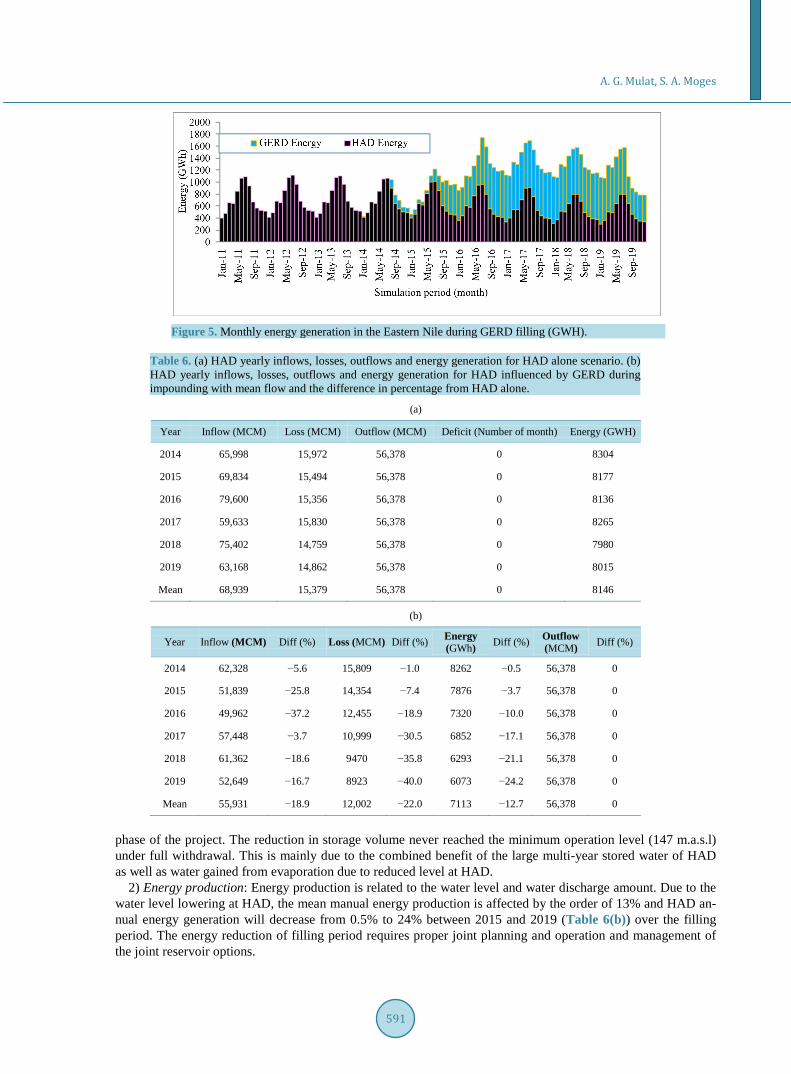
Figure 5. Monthly energy generation in the Eastern Nile during GERD filling (GWH).
Table 6. (a) HAD yearly inflows, losses, outflows and energy generation for HAD alone scenario. (b) HAD yearly inflows, losses, outflows and energy generation for HAD influenced by GERD during impounding with mean flow and the difference in percentage from HAD alone.
(a)
Year Inflow (MCM) Loss (MCM) Outflow (MCM) Deficit (Number of month) Energy (GWH)
2014 65,998 15,972 56,378 0 8304
2015 69,834 15,494 56,378 0 8177
2016 79,600 15,356 56,378 0 8136
2017 59,633 15,830 56,378 0 8265
2018 75,402 14,759 56,378 0 7980
2019 63,168 14,862 56,378 0 8015
Mean 68,939 15,379 56,378 0 8146
(b)
Year Inflow (MCM) Diff (%) Loss (MCM) Diff (%) Energy (GWh) Diff (%) Outflow
(MCM) Diff (%)
2014 62,328 −5.6 15,809 −1.0 8262 −0.5 56,378 0
2015 51,839 −25.8 14,354 −7.4 7876 −3.7 56,378 0
2016 49,962 −37.2 12,455 −18.9 7320 −10.0 56,378 0
2017 57,448 −3.7 10,999 −30.5 6852 −17.1 56,378 0
2018 61,362 −18.6 9470 −35.8 6293 −21.1 56,378 0
2019 52,649 −16.7 8923 −40.0 6073 −24.2 56,378 0
Mean 55,931 −18.9 12,002 −22.0 7113 −12.7 56,378 0
phase of the project. The reduction in storage volume never reached the minimum operation level (147 m.a.s.l) under full withdrawal. This is mainly due to the combined benefit of the large multi-year stored water of HAD as well as water gained from evaporation due to reduced level at HAD.
2) Energy production: Energy production is related to the water level and water discharge amount. Due to the water level lowering at HAD, the mean manual energy production is affected by the order of 13% and HAD an- nual energy generation will decrease from 0.5% to 24% between 2015 and 2019 (Table 6(b)) over the filling period. The energy reduction of filling period requires proper joint planning and operation and management of the joint reservoir options.
A. G. Mulat, S. A. Moges
592
When viewed from regional perspective, the overall energy benefits from joint operation of GERD and HAD increases tremendously even during the filling phase. Figure 5 demonstrates the cumulative monthly energy production of the two reservoirs during GERD filling. The total energy production from the joint operation of the two dams provides a gain of about 5112 GWh/year and which is more than 63% energy gain during the fill- ing period than HAD alone situation.
3) Water gain from HAD: HAD evaporation losses will be reduced during GERD impounding. Annual water loss from HAD will be less as compared to the current situation.The overall 6 years average water loss due to evaporation at HAD has shown a gain of almost 22% from the past average losses. This means the water gain from lost evaporation over 6 years period reaches to 3.4 BCM (Table 6(b)). The cumulative loss from the two reservoirs will be less than the current situation’s loss. The mean annual loss from both reservoirs will be 12907 MCM which is 16% less than the loss from HAD alone operation.
This gained water from the evaporation effectively contributes to maintain HAD to fully withdraw irrigation water without being affected during the infilling phase of the GERD project. It is also a manifestation of how water be gained from Operating HAD at lower level in the future.
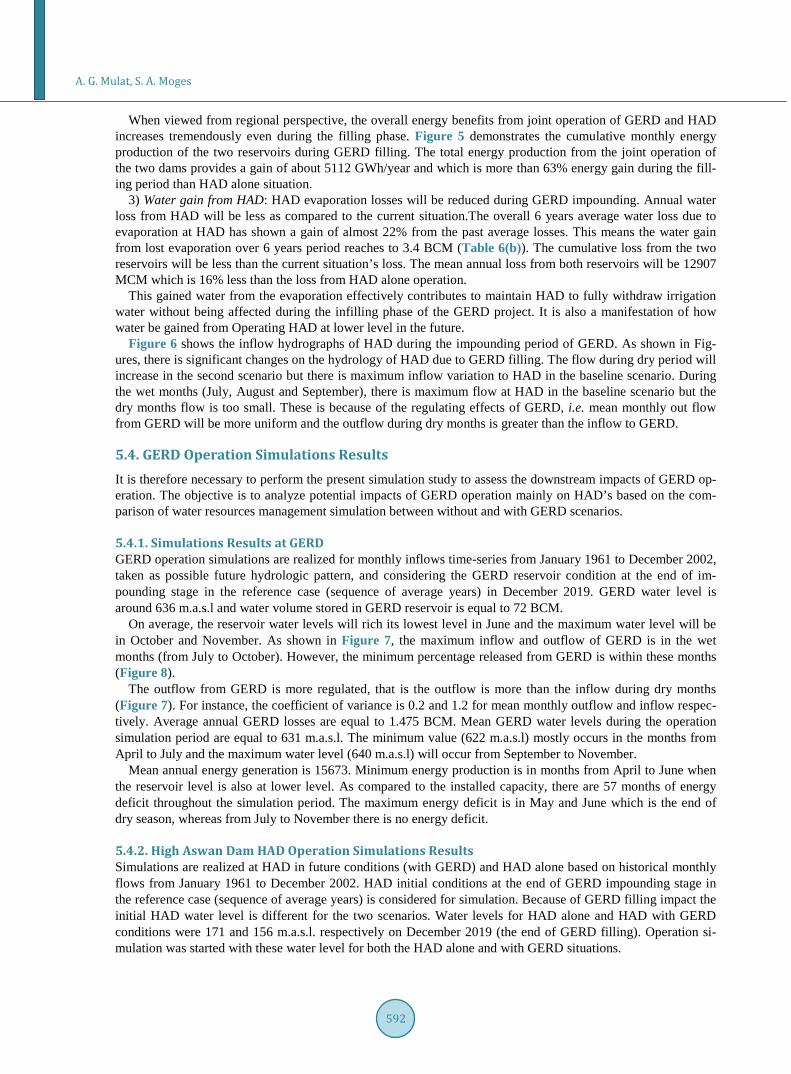
Figure 6 shows the inflow hydrographs of HAD during the impounding period of GERD. As shown in Fig- ures, there is significant changes on the hydrology of HAD due to GERD filling. The flow during dry period will increase in the second scenario but there is maximum inflow variation to HAD in the baseline scenario. During the wet months (July, August and September), there is maximum flow at HAD in the baseline scenario but the dry months flow is too small. These is because of the regulating effects of GERD, i.e. mean monthly out flow from GERD will be more uniform and the outflow during dry months is greater than the inflow to GERD.
5.4. GERD Operation Simulations Results It is therefore necessary to perform the present simulation study to assess the downstream impacts of GERD op- eration. The objective is to analyze potential impacts of GERD operation mainly on HAD’s based on the com- parison of water resources management simulation between without and with GERD scenarios.
5.4.1. Simulations Results at GERD GERD operation simulations are realized for monthly inflows time-series from January 1961 to December 2002, taken as possible future hydrologic pattern, and considering the GERD reservoir condition at the end of im- pounding stage in the reference case (sequence of average years) in December 2019. GERD water level is around 636 m.a.s.l and water volume stored in GERD reservoir is equal to 72 BCM.
On average, the reservoir water levels will rich its lowest level in June and the maximum water level will be in October and November. As shown in Figure 7, the maximum inflow and outflow of GERD is in the wet months (from July to October). However, the minimum percentage released from GERD is within these months (Figure 8).
The outflow from GERD is more regulated, that is the outflow is more than the inflow during dry months (Figure 7). For instance, the coefficient of variance is 0.2 and 1.2 for mean monthly outflow and inflow respec- tively. Average annual GERD losses are equal to 1.475 BCM. Mean GERD water levels during the operation simulation period are equal to 631 m.a.s.l. The minimum value (622 m.a.s.l) mostly occurs in the months from April to July and the maximum water level (640 m.a.s.l) will occur from September to November.
Mean annual energy generation is 15673. Minimum energy production is in months from April to June when the reservoir level is also at lower level. As compared to the installed capacity, there are 57 months of energy deficit throughout the simulation period. The maximum energy deficit is in May and June which is the end of dry season, whereas from July to November there is no energy deficit.
5.4.2. High Aswan Dam HAD Operation Simulations Results Simulations are realized at HAD in future conditions (with GERD) and HAD alone based on historical monthly flows from January 1961 to December 2002. HAD initial conditions at the end of GERD impounding stage in the reference case (sequence of average years) is considered for simulation. Because of GERD filling impact the initial HAD water level is different for the two scenarios. Water levels for HAD alone and HAD with GERD conditions were 171 and 156 m.a.s.l. respectively on December 2019 (the end of GERD filling). Operation si- mulation was started with these water level for both the HAD alone and with GERD situations.
A. G. Mulat, S. A. Moges
593
Figure 6. Monthly inflow to HAD during impounding with mean flow (MCM).
Figure 7. Inflow and out flow of GERD (MCM).
Figure 8. Percentage of water released from GERD.
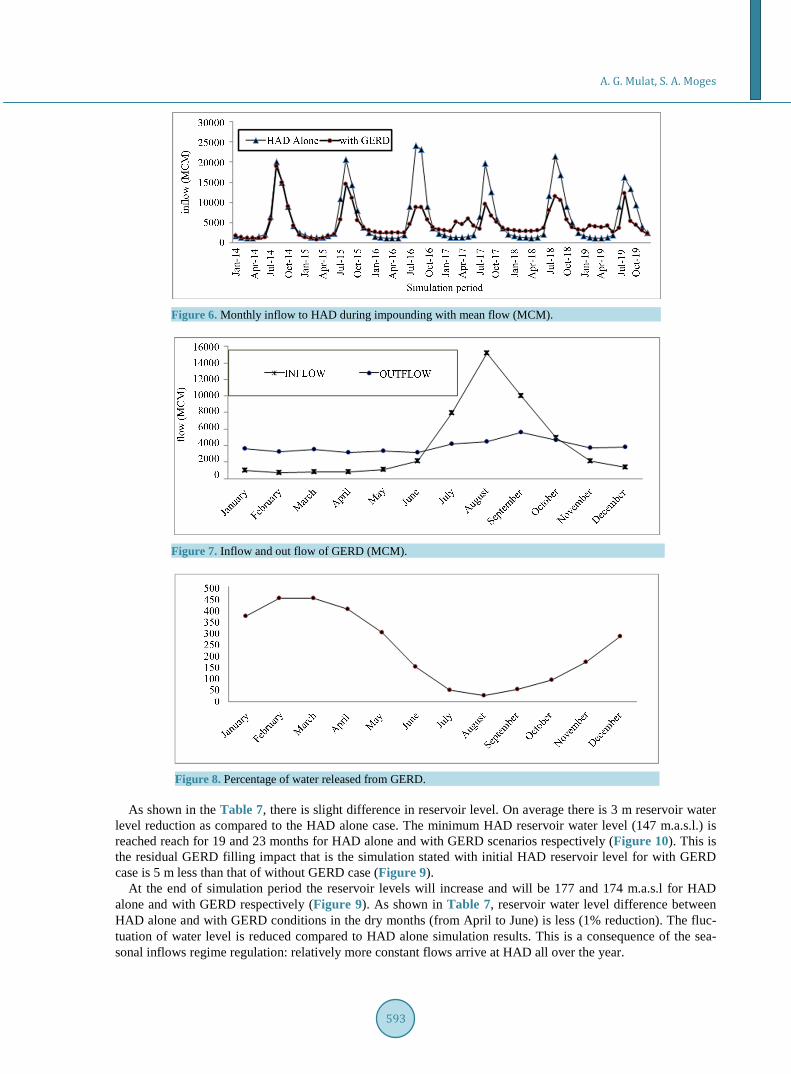
As shown in the Table 7, there is slight difference in reservoir level. On average there is 3 m reservoir water
level reduction as compared to the HAD alone case. The minimum HAD reservoir water level (147 m.a.s.l.) is reached reach for 19 and 23 months for HAD alone and with GERD scenarios respectively (Figure 10). This is the residual GERD filling impact that is the simulation stated with initial HAD reservoir level for with GERD case is 5 m less than that of without GERD case (Figure 9).
At the end of simulation period the reservoir levels will increase and will be 177 and 174 m.a.s.l for HAD alone and with GERD respectively (Figure 9). As shown in Table 7, reservoir water level difference between HAD alone and with GERD conditions in the dry months (from April to June) is less (1% reduction). The fluc- tuation of water level is reduced compared to HAD alone simulation results. This is a consequence of the sea- sonal inflows regime regulation: relatively more constant flows arrive at HAD all over the year.
A. G. Mulat, S. A. Moges
594
Table 7. HAD Inflow, energy and reservoir pool level and the difference between the two scenarios (with GERD and without GERD) (%).
Month Inflow to HAD (MCM) HAD Energy(GWh) HAD Reservoir pool level (m.a.s.l)
Before GERD
After GERD
Difference (%)
Before GERD
After GERD
Difference (%)
Before GERD
After GERD Difference %
Jan 1779 4401 147 349 316 −10 166 161 −3
Feb 1410 3927 178 409 377 −8 165 161 −2
Mar 1290 3999 210 552 522 −5 164 161 −2
Apr 1367 3761 175 525 502 −4 163 161 −2
May 1672 3890 133 670 645 −4 162 160 −1
Jun 2512 3597 43 808 784 −3 161 159 −1
Jul 9135 5382 −41 834 806 −3 159 158 −1
Aug 19084 8410 −56 738 688 −7 159 157 −1
Sep 14908 10569 −29 553 487 −12 163 157 −4
Oct 8539 8248 −3 484 422 −13 165 159 −4
Nov 3960 5512 39 441 388 −12 166 160 −4
Dec 2428 4909 102 432 386 −11 166 161 −3
Yearly 68084 66605 −2 6797 6323 −7 163 160 −2.3
Figure 9. HAD reservoir water level during filling and operation phases of GERD.
The major modification will concern the seasonal Blue Nile flows distribution which will be more uniform
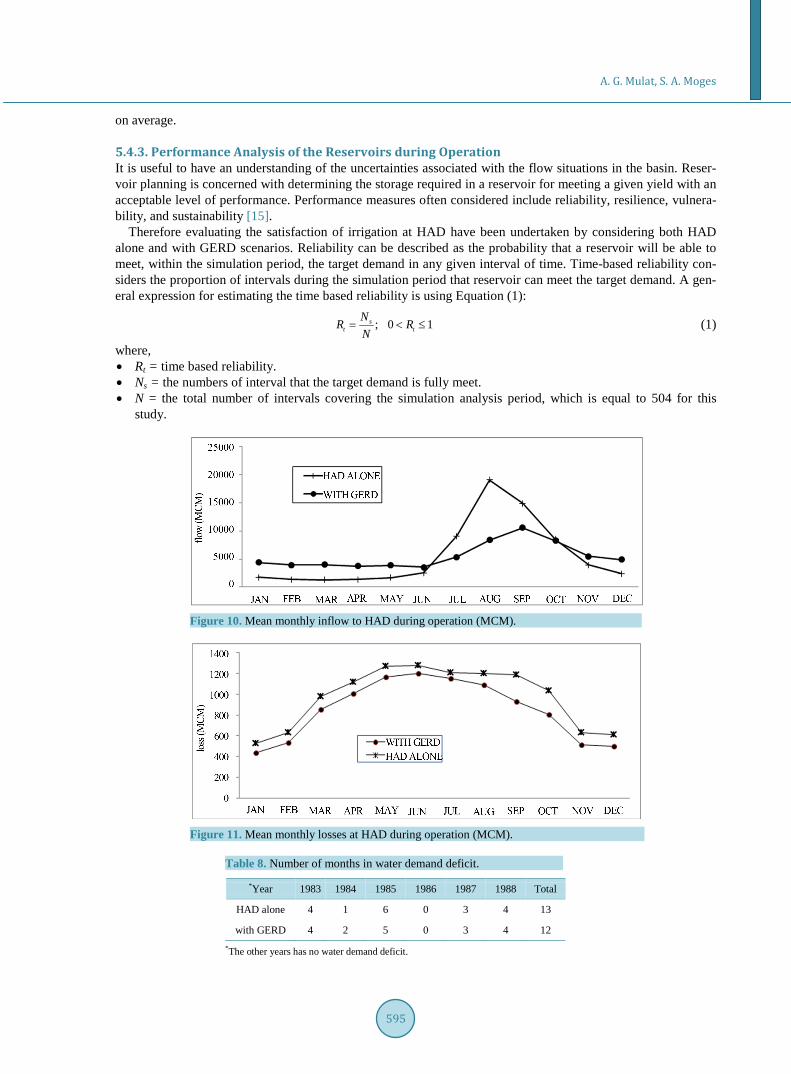
along the year therefore beneficial to flood control downstream GERD. Figure 10 shows that HAD inflows will increase from November to June, and decrease from July to October, and will be more regular. The inflow to HAD is more uniform due to the presence of GERD. As shown in Table 7, the dry months’ inflow to HAD with GERD is more than the inflow to HAD without GERD. The mean annual inflow difference to HAD with and without GERD is 2% reduction.
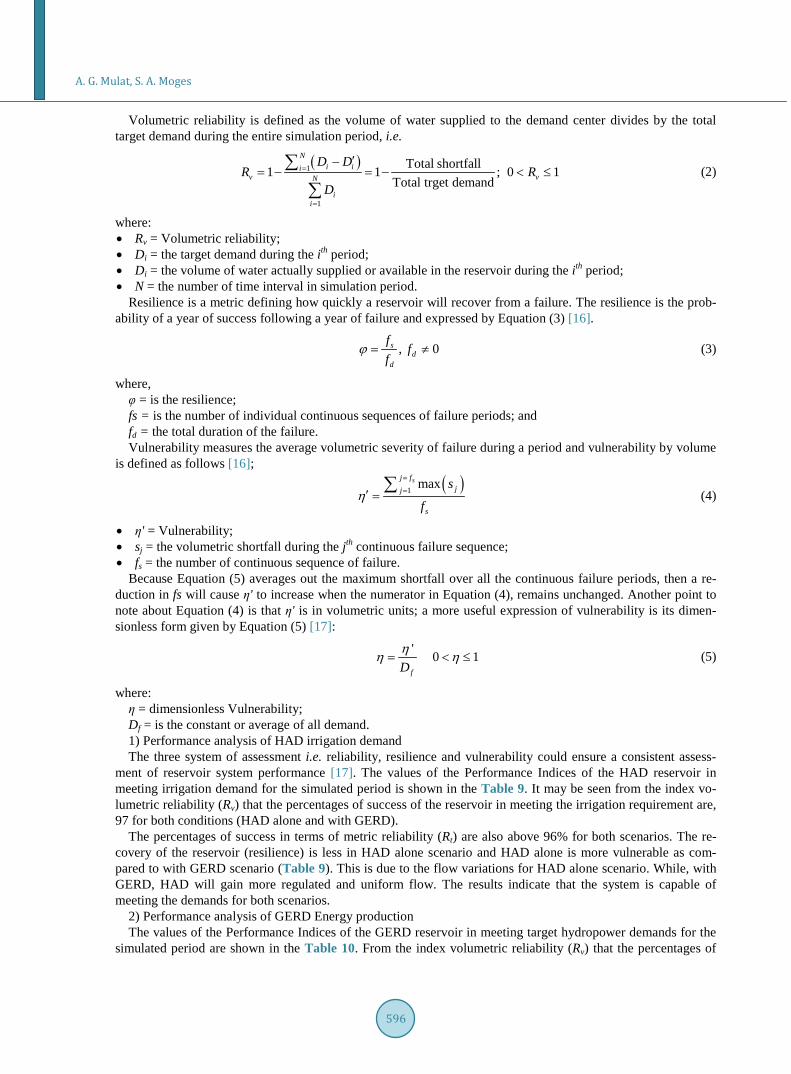
There are months with the water level reaches its minimum operation level (147 m.a.s.l) and the amount of outflow is less. In these months there is also water demand deficit. Table 8 shows the number of months in wa- ter demand deficit at HAD. Mean monthly energy production will be decrease up to 7% as compared to baseline scenario (Table 7). This reduction is a consequence of the average reservoir water level reduction of HAD. Figure 11 shows mean monthly water loss at HAD. There is water loss reduction due to GERD by at least 11%
A. G. Mulat, S. A. Moges
595
on average.
5.4.3. Performance Analysis of the Reservoirs during Operation It is useful to have an understanding of the uncertainties associated with the flow situations in the basin. Reser- voir planning is concerned with determining the storage required in a reservoir for meeting a given yield with an acceptable level of performance. Performance measures often considered include reliability, resilience, vulnera- bility, and sustainability [15].
Therefore evaluating the satisfaction of irrigation at HAD have been undertaken by considering both HAD alone and with GERD scenarios. Reliability can be described as the probability that a reservoir will be able to meet, within the simulation period, the target demand in any given interval of time. Time-based reliability con- siders the proportion of intervals during the simulation period that reservoir can meet the target demand. A gen- eral expression for estimating the time based reliability is using Equation (1):
; 0 1st t
NR RN
= < ≤ (1)
where, • Rt = time based reliability. • Ns = the numbers of interval that the target demand is fully meet. • N = the total number of intervals covering the simulation analysis period, which is equal to 504 for this
study.
Figure 10. Mean monthly inflow to HAD during operation (MCM).
Figure 11. Mean monthly losses at HAD during operation (MCM).
Table 8. Number of months in water demand deficit.
*Year 1983 1984 1985 1986 1987 1988 Total
HAD alone 4 1 6 0 3 4 13
with GERD 4 2 5 0 3 4 12 *The other years has no water demand deficit.
A. G. Mulat, S. A. Moges
596
Volumetric reliability is defined as the volume of water supplied to the demand center divides by the total target demand during the entire simulation period, i.e.
( )1
1
Total shortfall1 1 ; 0 1Total trget demand
Ni ii
v vN
ii
D DR R
D
=
=
′−= − = − < ≤∑
∑ (2)
where: • Rv = Volumetric reliability; • Di = the target demand during the ith period; • Di = the volume of water actually supplied or available in the reservoir during the ith period; • N = the number of time interval in simulation period.
Resilience is a metric defining how quickly a reservoir will recover from a failure. The resilience is the prob- ability of a year of success following a year of failure and expressed by Equation (3) [16].
, 0sd
d
ff
fϕ = ≠ (3)
where, φ = is the resilience; fs = is the number of individual continuous sequences of failure periods; and fd = the total duration of the failure. Vulnerability measures the average volumetric severity of failure during a period and vulnerability by volume
is defined as follows [16];
( )1 maxsj fjj
s
s
fη
=
=′ =∑
(4)
• η' = Vulnerability; • sj = the volumetric shortfall during the jth continuous failure sequence; • fs = the number of continuous sequence of failure.
Because Equation (5) averages out the maximum shortfall over all the continuous failure periods, then a re- duction in fs will cause η' to increase when the numerator in Equation (4), remains unchanged. Another point to note about Equation (4) is that η' is in volumetric units; a more useful expression of vulnerability is its dimen- sionless form given by Equation (5) [17]:
' 0 1fD
ηη η= < ≤ (5)
where: η = dimensionless Vulnerability; Df = is the constant or average of all demand. 1) Performance analysis of HAD irrigation demand The three system of assessment i.e. reliability, resilience and vulnerability could ensure a consistent assess-
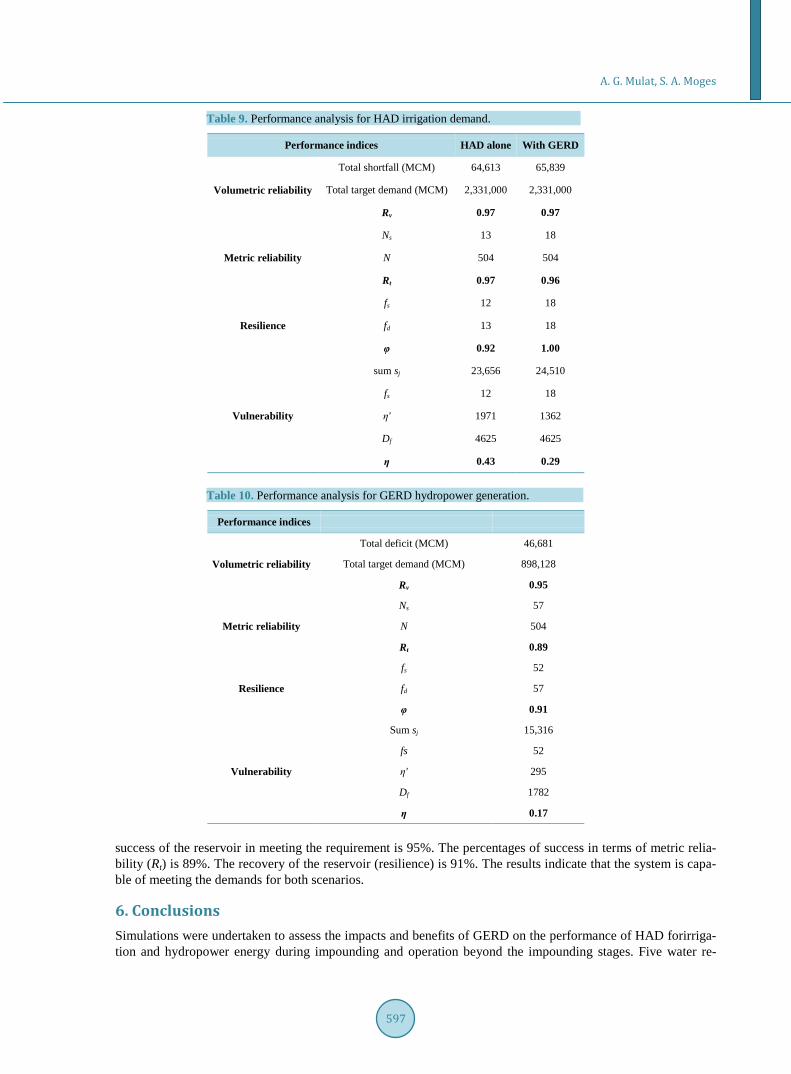
ment of reservoir system performance [17]. The values of the Performance Indices of the HAD reservoir in meeting irrigation demand for the simulated period is shown in the Table 9. It may be seen from the index vo- lumetric reliability (Rv) that the percentages of success of the reservoir in meeting the irrigation requirement are, 97 for both conditions (HAD alone and with GERD).
The percentages of success in terms of metric reliability (Rt) are also above 96% for both scenarios. The re- covery of the reservoir (resilience) is less in HAD alone scenario and HAD alone is more vulnerable as com- pared to with GERD scenario (Table 9). This is due to the flow variations for HAD alone scenario. While, with GERD, HAD will gain more regulated and uniform flow. The results indicate that the system is capable of meeting the demands for both scenarios.
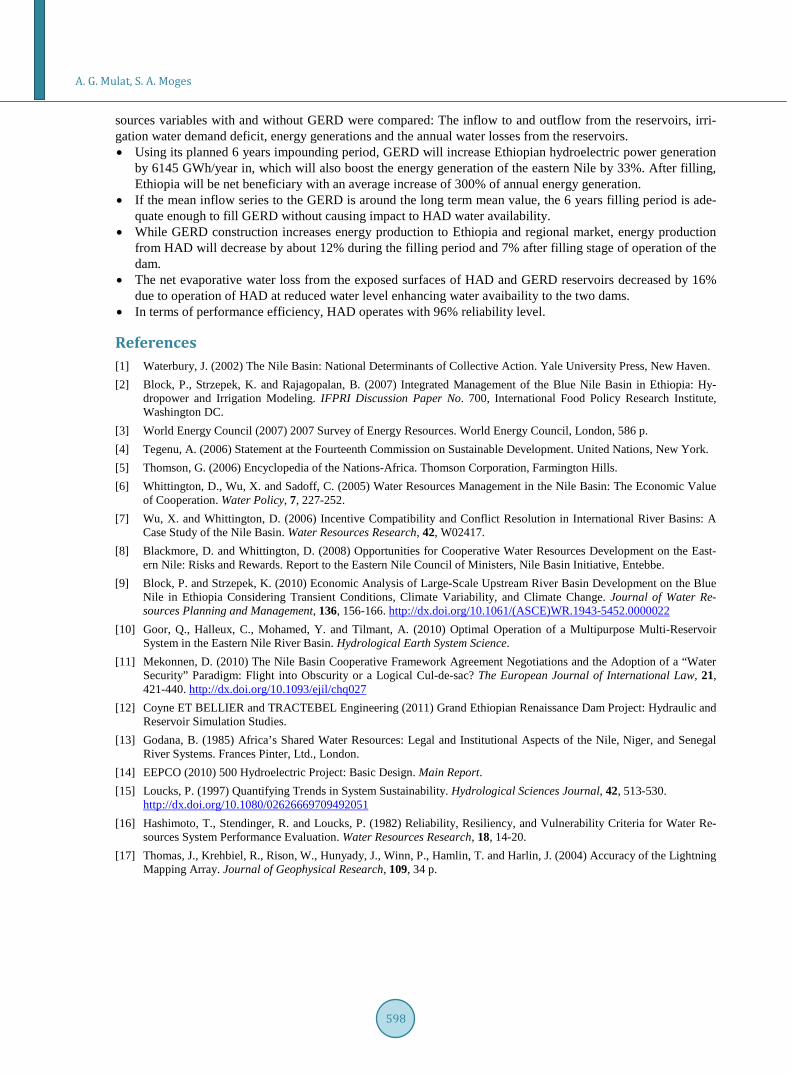
2) Performance analysis of GERD Energy production The values of the Performance Indices of the GERD reservoir in meeting target hydropower demands for the
simulated period are shown in the Table 10. From the index volumetric reliability (Rv) that the percentages of
A. G. Mulat, S. A. Moges
597
Table 9. Performance analysis for HAD irrigation demand.
Performance indices HAD alone With GERD
Volumetric reliability
Total shortfall (MCM) 64,613 65,839
Total target demand (MCM) 2,331,000 2,331,000
Rv 0.97 0.97
Metric reliability
Ns 13 18
N 504 504
Rt 0.97 0.96
Resilience
fs 12 18
fd 13 18
φ 0.92 1.00
Vulnerability
sum sj 23,656 24,510
fs 12 18
η' 1971 1362
Df 4625 4625
η 0.43 0.29
Table 10. Performance analysis for GERD hydropower generation.
Performance indices
Volumetric reliability
Total deficit (MCM) 46,681
Total target demand (MCM) 898,128
Rv 0.95
Metric reliability
Ns 57
N 504
Rt 0.89
Resilience
fs 52
fd 57
φ 0.91
Vulnerability
Sum sj 15,316
fs 52
η' 295
Df 1782
η 0.17
success of the reservoir in meeting the requirement is 95%. The percentages of success in terms of metric relia- bility (Rt) is 89%. The recovery of the reservoir (resilience) is 91%. The results indicate that the system is capa- ble of meeting the demands for both scenarios.
6. Conclusions Simulations were undertaken to assess the impacts and benefits of GERD on the performance of HAD forirriga- tion and hydropower energy during impounding and operation beyond the impounding stages. Five water re-
A. G. Mulat, S. A. Moges
598
sources variables with and without GERD were compared: The inflow to and outflow from the reservoirs, irri- gation water demand deficit, energy generations and the annual water losses from the reservoirs. • Using its planned 6 years impounding period, GERD will increase Ethiopian hydroelectric power generation
by 6145 GWh/year in, which will also boost the energy generation of the eastern Nile by 33%. After filling, Ethiopia will be net beneficiary with an average increase of 300% of annual energy generation.
• If the mean inflow series to the GERD is around the long term mean value, the 6 years filling period is ade- quate enough to fill GERD without causing impact to HAD water availability.
• While GERD construction increases energy production to Ethiopia and regional market, energy production from HAD will decrease by about 12% during the filling period and 7% after filling stage of operation of the dam.
• The net evaporative water loss from the exposed surfaces of HAD and GERD reservoirs decreased by 16% due to operation of HAD at reduced water level enhancing water avaibaility to the two dams.
• In terms of performance efficiency, HAD operates with 96% reliability level.
References [1] Waterbury, J. (2002) The Nile Basin: National Determinants of Collective Action. Yale University Press, New Haven. [2] Block, P., Strzepek, K. and Rajagopalan, B. (2007) Integrated Management of the Blue Nile Basin in Ethiopia: Hy-
dropower and Irrigation Modeling. IFPRI Discussion Paper No. 700, International Food Policy Research Institute, Washington DC.
[3] World Energy Council (2007) 2007 Survey of Energy Resources. World Energy Council, London, 586 p. [4] Tegenu, A. (2006) Statement at the Fourteenth Commission on Sustainable Development. United Nations, New York. [5] Thomson, G. (2006) Encyclopedia of the Nations-Africa. Thomson Corporation, Farmington Hills. [6] Whittington, D., Wu, X. and Sadoff, C. (2005) Water Resources Management in the Nile Basin: The Economic Value
of Cooperation. Water Policy, 7, 227-252. [7] Wu, X. and Whittington, D. (2006) Incentive Compatibility and Conflict Resolution in International River Basins: A
Case Study of the Nile Basin. Water Resources Research, 42, W02417. [8] Blackmore, D. and Whittington, D. (2008) Opportunities for Cooperative Water Resources Development on the East-
ern Nile: Risks and Rewards. Report to the Eastern Nile Council of Ministers, Nile Basin Initiative, Entebbe. [9] Block, P. and Strzepek, K. (2010) Economic Analysis of Large-Scale Upstream River Basin Development on the Blue
Nile in Ethiopia Considering Transient Conditions, Climate Variability, and Climate Change. Journal of Water Re- sources Planning and Management, 136, 156-166. http://dx.doi.org/10.1061/(ASCE)WR.1943-5452.0000022
[10] Goor, Q., Halleux, C., Mohamed, Y. and Tilmant, A. (2010) Optimal Operation of a Multipurpose Multi-Reservoir System in the Eastern Nile River Basin. Hydrological Earth System Science.
[11] Mekonnen, D. (2010) The Nile Basin Cooperative Framework Agreement Negotiations and the Adoption of a “Water Security” Paradigm: Flight into Obscurity or a Logical Cul-de-sac? The European Journal of International Law, 21, 421-440. http://dx.doi.org/10.1093/ejil/chq027
[12] Coyne ET BELLIER and TRACTEBEL Engineering (2011) Grand Ethiopian Renaissance Dam Project: Hydraulic and Reservoir Simulation Studies.
[13] Godana, B. (1985) Africa’s Shared Water Resources: Legal and Institutional Aspects of the Nile, Niger, and Senegal River Systems. Frances Pinter, Ltd., London.
[14] EEPCO (2010) 500 Hydroelectric Project: Basic Design. Main Report. [15] Loucks, P. (1997) Quantifying Trends in System Sustainability. Hydrological Sciences Journal, 42, 513-530.
http://dx.doi.org/10.1080/02626669709492051 [16] Hashimoto, T., Stendinger, R. and Loucks, P. (1982) Reliability, Resiliency, and Vulnerability Criteria for Water Re-
sources System Performance Evaluation. Water Resources Research, 18, 14-20. [17] Thomas, J., Krehbiel, R., Rison, W., Hunyady, J., Winn, P., Hamlin, T. and Harlin, J. (2004) Accuracy of the Lightning
Mapping Array. Journal of Geophysical Research, 109, 34 p.
Related Documents