Turkish Journal of Computer and Mathematics Education Vol.12 No.4 (2021), 1434-1454 Research Article 1434 Assessment of the feasibility of hybrid renewable power for supply pumping system for irrigation Hicham Mhamdi *, Mohamed Ahticha, omar Kerrou, Azeddine Frimane, Mohammed Bakraoui, Mohammed Aggour Laboratory of Electronic Systems, Information Processing, Mechanics and Energetics,Faculty of Sciences Kenitra, University Ibn Tofail Kenitra, Kenitra, Morocco *Mail: [email protected] Postal address: Ibn Tofail University, Faculty of Sciences, University campus, BP: 133, Kenitra, Morocco Article History: Received: 11 January 2021; Accepted: 27 February 2021; Published online: 5 April 2021 Abstract: Crop identification is vital to make an inventory of the crops grown in a given area and their cultivation period. The Remote sensing (RS) techniques can provide information on the distribution of cultivated land, crop types, and areas for the agricultural sector's effective management. In remote sensing, various vegetation indices (VI) can analyze and evaluate multiple phenomena and themes. The Normalized Difference Vegetation Index (NDVI) is an essential and highly significant remote measurement widely used in agriculture for phenological monitoring and crop health (Ray and Dadhwal, 2001). In this work, we present a methodology for the contribution of NDVI from Landsat 7 (TM) and (ETM+) images to crop mapping in the Gharb region using a classification based on the pixel approach and estimating rice crop coefficient from NDVI. The classification results concern six main types of crops planted in this region (beet, maize, sugar cane, market gardening, cereals, and rice). The classification map showed differences in agricultural practices adopted by farmers in crop spatial distribution. The classification results showed the ability of this methodology to discriminate between crops. Crop coefficients were deduced from the NDVI extracted from the images. Due to meteorological data collected from the meteorological station TCSC of SK Tlet, the estimation of the reference evapotranspiration was made and subsequently the potential evapotranspiration of each crop during the agricultural season 2019-2020. The highest values for ETC were obtained when the crop was in its full development when water was mainly lost through transpiration after a slight decrease in the ratio values observed during the phase of the vegetative cycle (maturity). The water requirements (daily, monthly and annual) for the crops were determined and their electrical energy consumption. Renewable energy can be an effective solution to meet the energy needs of plots , greenhouses and large farms. A technical-economic study of different combinations of autonomous hybrid renewable energy systems (HRES) in order to meet the power supply needs of the above mentioned crops in the Gharb region. The renewable energy sources considered are solar, wind and biomass. The results show that for an average energy requirement of 92 kWh/day and a peak load of 6.5 kW, the unit energy cost of the optimal configuration scenario A (PV-wind-biomass-battery) is 0.19 $/kWh. Therefore, the design, development and implementation of the proposed system is a promising solution for the security of energy supply. For a 100% integration of renewable energy, the HRES produces electricity according to the following distribution: 11% from wind, 41% from solar and 48% from biomass. Keywords: Remote sensing, Evapotranspiration, NDVI, Crop coefficient, Hybrid System, Feasibility, HOMER. Abbreviations mia mount of manure per head [-] Zanem anemometer height [m] Vb annual volume of biogas received in manure [m3] A area in [m2] Dd battery’s depth of discharge [ -]

Welcome message from author
This document is posted to help you gain knowledge. Please leave a comment to let me know what you think about it! Share it to your friends and learn new things together.
Transcript

Turkish Journal of Computer and Mathematics Education Vol.12 No.4 (2021), 1434-1454
Research Article
1434
Assessment of the feasibility of hybrid renewable power for supply
pumping system for irrigation
Hicham Mhamdi *, Mohamed Ahticha, omar Kerrou, Azeddine Frimane, Mohammed Bakraoui, Mohammed Aggour
Laboratory of Electronic Systems, Information Processing, Mechanics and Energetics,Faculty of Sciences Kenitra,
University Ibn Tofail Kenitra, Kenitra, Morocco
*Mail: [email protected]
Postal address: Ibn Tofail University, Faculty of Sciences, University campus, BP: 133, Kenitra, Morocco
Article History: Received: 11 January 2021; Accepted: 27 February 2021; Published online: 5 April 2021
Abstract:
Crop identification is vital to make an inventory of the crops grown in a given area and their cultivation period. The
Remote sensing (RS) techniques can provide information on the distribution of cultivated land, crop types, and areas for
the agricultural sector's effective management.
In remote sensing, various vegetation indices (VI) can analyze and evaluate multiple phenomena and themes. The
Normalized Difference Vegetation Index (NDVI) is an essential and highly significant remote measurement widely used
in agriculture for phenological monitoring and crop health (Ray and Dadhwal, 2001).
In this work, we present a methodology for the contribution of NDVI from Landsat 7 (TM) and (ETM+) images to crop
mapping in the Gharb region using a classification based on the pixel approach and estimating rice crop coefficient from
NDVI.
The classification results concern six main types of crops planted in this region (beet, maize, sugar cane, market
gardening, cereals, and rice). The classification map showed differences in agricultural practices adopted by farmers in
crop spatial distribution. The classification results showed the ability of this methodology to discriminate between crops.
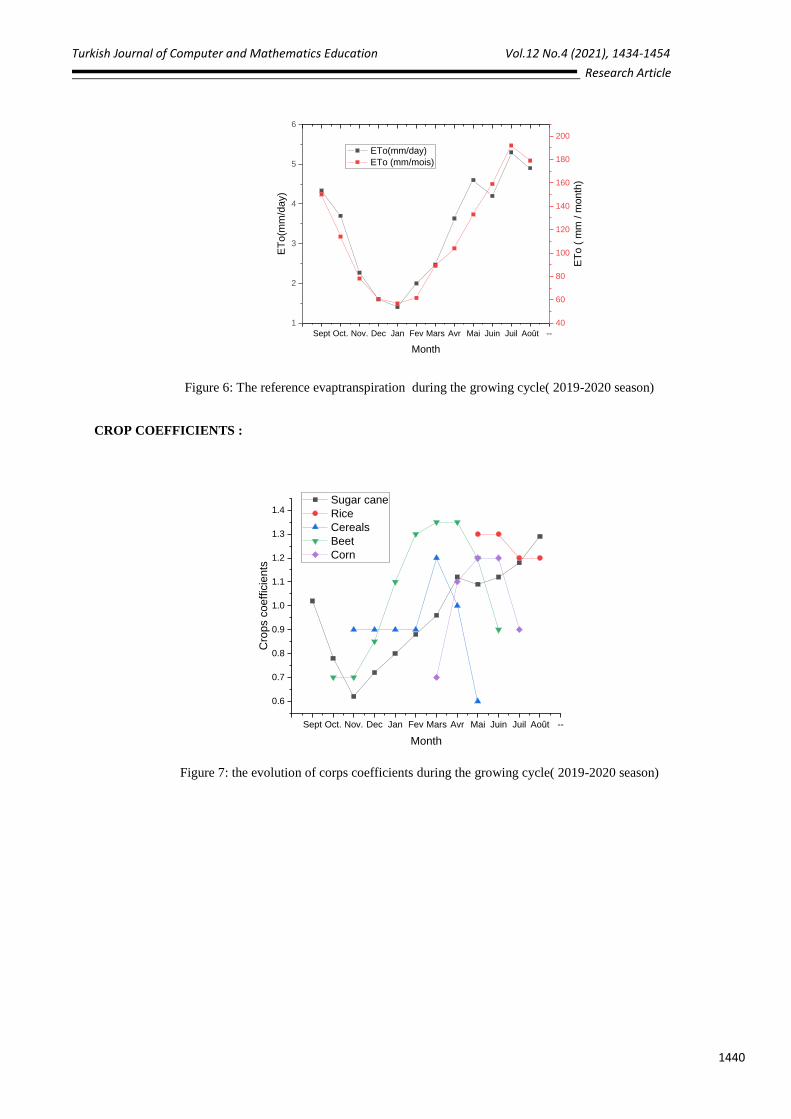
Crop coefficients were deduced from the NDVI extracted from the images. Due to meteorological data collected from
the meteorological station TCSC of SK Tlet, the estimation of the reference evapotranspiration was made and
subsequently the potential evapotranspiration of each crop during the agricultural season 2019-2020.
The highest values for ETC were obtained when the crop was in its full development when water was mainly lost
through transpiration after a slight decrease in the ratio values observed during the phase of the vegetative cycle
(maturity).
The water requirements (daily, monthly and annual) for the crops were determined and their electrical energy
consumption. Renewable energy can be an effective solution to meet the energy needs of plots , greenhouses and large
farms.
A technical-economic study of different combinations of autonomous hybrid renewable energy systems (HRES) in
order to meet the power supply needs of the above mentioned crops in the Gharb region. The renewable energy sources
considered are solar, wind and biomass. The results show that for an average energy requirement of 92 kWh/day and a
peak load of 6.5 kW, the unit energy cost of the optimal configuration scenario A (PV-wind-biomass-battery) is 0.19
$/kWh. Therefore, the design, development and implementation of the proposed system is a promising solution for the
security of energy supply. For a 100% integration of renewable energy, the HRES produces electricity according to the
following distribution: 11% from wind, 41% from solar and 48% from biomass.
Keywords: Remote sensing, Evapotranspiration, NDVI, Crop coefficient, Hybrid System, Feasibility, HOMER.
Abbreviations
mia mount of manure per head [-]
Zanem anemometer height [m]
Vb annual volume of biogas received in manure [m3]
A area in [m2]
Dd battery’s depth of discharge [-]

Turkish Journal of Computer and Mathematics Education Vol.12 No.4 (2021), 1434-1454
Research Article
1435
Vbi biogas production of the material organic [m3/tons]
Ke coefficient of electric efficiency of the plant [-]
KOMi content of organic matter [-]
Da daily autonomy [-]
R density of air [kg/m3]
Dele daily electrical energy demand [kWh/day]
rWater density of water [1000 kg/m3]
KDMi dry matter content in manure [-]
hb efficiency of the battery [%]
hinv efficiency of the converter [%]
hg efficiency of generator [%]
P electric power generation from the biomass [kW]
Zhub hub height of the wind turbine [m]
Cp performance density of air [-]
Eb potential of obtainable energy from manure [kWh]
PPV power at the output of the cell [kW]
Pout power output of the wind turbine [kW]
Bc storage capacity of the battery [Ah]
KT temperature coefficient of the maximum power [-]
Tref temperature on the photovoltaic at 25 _C [_C]
Ni total annual manure [tons]
A total number of animals [-]
TC total operation hours of the plant throughout the
year [-]
V wind velocity [m/s]
Uanem wind velocity at anemometer [m/s]
Uhub wind velocity at the hub height [m/s]
1. Introduction
Agriculture is a vital and crucial element in the economy of the Gharb region. To ensure efficient management of
agriculture, geospatial data and statistics are indispensable. However, traditional data collection techniques are
expensive and unsuitable for monitoring seasonal crop development. The RS allows the mapping of crop types by
monitoring their seasonal development using multidate images covering the crop growing cycle.
The use of RS for crop identification in semi-arid areas is significant and useful [5].
Several research projects have been conducted to monitor the evolution of the crop growing cycle and evaluate crop
yields using RS combined with modeling approaches (Bastiaansen and al. i 2003; Doraiswamy and al.. 2004; Inoue and
al.. 2008, etc.). [6] These models simulate the entire crop cycle's biophysical processes, considering as many
components of the soil, the atmosphere, etc. description of crop growing (Doraiswamy et al. 2004). [9]
Research has shown a good simulation of crop coefficients derived from VI from multispectral images (Hunsaker et al.,
2003). [15]
Several researchers (Allen and al.. (2011)), Hunsaker and al.. (2005), Gonzalez-Dugo and al.. (2009) have studied and
defined the correlation and the best possible relationship between the crop coefficients of multispectral NDVI images
based on the vegetation surface's reflectance. The VI allows bio-physical parameters to emerge from multispectral
images using empirical equations. The VI can be used to define and monitor different crop parameters. [20]
Different formulae were developed to estimate evapotranspiration; there are formulae based on energy balance (Penman,
1948; Allen and al.., 1998b; Nouri and al.., 2013) [18], formulas referring to the air temperature (Thornthwaite, 1948;
Blaney, 1952) [19].
The FAO-56 PM equation is more accurate in ETO estimation because it uses many parameters and is the most widely
used formula for estimating evapotranspiration in agriculture (Allen and al.., 1998b; Allen, 2000).
Many research studies have been carried out on estimating Kc values for vegetable crops (peas, onions, and tomatoes)
[26, 22].
Researchers have revealed that VI extracted from satellite images can be used to estimate crop coefficients. [24-25-29].

Turkish Journal of Computer and Mathematics Education Vol.12 No.4 (2021), 1434-1454
Research Article
1436
2. Materials and methods
2.1The region of study
Figure 1 : The region of Gharb
The region of Gharb constitutes one of Morocco's most important agricultural perimeters, with a surface area of 116
000 ha. The perimeter is experiencing a real dynamic concerning the transition to drip irrigation.
2.2 Meteorological data
All meteorological data were collected from the TCSC weather station located in SA TAZI. The data are temperature
(Tmax, Tmin, Taverage ), wind speed, net radiation, relative humidity, and reference evapotranspiration during the season
2019-2020.
The rice crop evapotranspiration was estimated by in situ lysimetric measurements per decade for the growing season
2019-2020.
2.3 Penman Monteith equation
The FAO-56 PM formula is expressed by the following equation : [1]
ETO =0.408Δ( Rn − G) + γ
Cn
T + 273U2(es − ea)
Δ + γ(1 + CdU2)
Where :
ETO = reference evapotranspiration (mm/day)
Rn = crop’s net radiation surface (MJ/m2/day),
G = soil heat flux density (MJ/m2/day),
T = mean daily air temperature ( 2m height ),
u2 = wind speed at 2m height (m/s),
es = saturation vapor pressure (kPa),
ea = actual vapor pressure (kPa),
Δ = slope vapor pressure curve (kPa/C),
γ =psychrometric constant (kPa/C).
The FAO-56 PM equation requires standard climatological data of solar radiation, humidity, air temperature, and wind
speed. [16]. All the meteorological data were recorded at the 2 m elevation point.

Turkish Journal of Computer and Mathematics Education Vol.12 No.4 (2021), 1434-1454
Research Article
1437
[2]
[3]
Figure 2 : THE METHODOLOGY FLOWCHART
2.4 Estimation of crop evapotranspiration :
The following formula expresses crop evapotranspiration:
𝑬𝑻𝑪 = 𝑬𝑻𝒐 ∗ 𝑲𝒄
ETC is the potential evapotranspiration of the crop, and Kc is the crop coefficient; it is a parameter that depends on the
crop's growth stage. The crop coefficient indicates various environmental factors and the influence of the crop on
evapotranspiration. Multiple comparisons of ETO and Kc measurements have been provided for different locations under
differing conditions. [21]
The NDVI is derived from LANDSAT 7 satellite images (TM and ETM+) for six different crop stages according to the
following equation :
Monitoring the evolution of the growing cycle of crops and agricultural production is often carried out using VI,
particularly the NDVI.
Field experimentaion
Metoerological data
Electricity consumption ( kwh)
Water need for crops (mm)
Electricity load of the site( kwh
ETref ( FAO-56
Penman)( mm/day)
monteith )
ETC (mm/days)
Renewable ressources
Technico-economic analysis
(HOMER)
Resultat and discussion
NDVI
LANDSAT Satellite images
crop coefficient ( kc) derived from the NDVI
During the growing periode or issue from measurement or Kc
from( Fao Table )
𝑵𝑫𝑽𝑰 =( PNIR − Pred)
( PNIR + Pred)

Turkish Journal of Computer and Mathematics Education Vol.12 No.4 (2021), 1434-1454
Research Article
1438
The NDVI is the parameter that allows monitoring the evolution of the spectral response of the crop to applied irrigation
rates while giving the different quality statuses of the crop (Bell and al.., 2009) [10]. The NDVI is an indicator of the
chlorophyll activity in vegetation. [4]
Researches were made by ( Doorenbos and Pruitt, 1977; Allen and al.., 1998) to elaborate the Kc values of different
crops during their growing cycles. [11] Kc is estimated from NDVI due to the strong relationship between the NDVI
and the Kc (Ray and Dadhwal, 2001) [12].Due to the relationship between NDVI and KC, NDVI has always been
considered as a parameter for monitoring and control of vegetation during its growth cycle (Justice and Townshend,
2002) [13]. High photosynthetic activity leads to high NDVI values; in contrast, high temperatures lead to low NDVI
values (Boegh et al. 1999). [14]
Efficient and rational management of irrigation water requires a reliable quantitative estimate of evapotranspiration. In
situ measurement of rice crop using a lysimeter is necessary for a reliable estimation of the crop coefficient's evolution
over the entire period of its growth.
2.5 Data collection
The data used to validate classification results are the field data of the types of crops existing in the region of Gharb at
the date of 14/04/2019. The data distinguishes six types of crops in addition to 3 land uses. The data presenting the crop
types in plots have been divided to distinguish the data to validate the results and the characterization during the
classification.
The crop identification based on phenology requires temporal monitoring during the stages of crop evolution. Crop
mapping in our study was carried out for the agricultural season 2019-2020 according to field data availability.
Figure 3 : Result of the SVM classification based on pixel
2. Methodology
The adopted methodology in this work is shown in the methodology flowchart. The proposed system is an autonomous
hybrid system containing biomass generator, solar PV field and wind turbines as power generation options. A data
collection and preliminary assessment of the irrigation characteristics in terms of energy demand, available energy
infrastructure, current and future renewable projects underway in the region have been conducted. System configuration
is determined and optimum size of each power generation technology is achieved based on the local economic and
energy requirement inputs.for irrigation. ETC is defined as the process by which water is lost by evapotranspiration.
(Doorenbos, 1984; Running and al.., 2017) [7].The two processes of transpiration and evaporation are simultaneous and
closely related (Ding et al., 2013). [8]

Turkish Journal of Computer and Mathematics Education Vol.12 No.4 (2021), 1434-1454
Research Article
1439
Sept Oct. Nov. Dec Jan Fev Mars Avr Mai Juin Juily Août --
0
20
40
60
80
100
120
140
average precipitation P (mm)
Effective rain (0.65*P/Nday) (mm/Day)
Moonth
avera
ge p
recip
itatio
n P
(m
m)
0.0
0.5
1.0
1.5
2.0
2.5
3.0
Eff
ective r
ain
(0
.65
*P/N
da
y)
(m
m/D
ay)
Figure 4 : Effective rain and average precipitation for the 20192020 compaigne
SEP OCT NOV DEC JAN FEB MAR APR MAI JUN JUL AUG --
10
12
14
16
18
20
22
24
Temperature (C°)
Wind speed U(m/s)
relative humidity (%)
Month
2.2
2.4
2.6
2.8
3.0
3.2
3.4
70
72
74
76
78
80
82
Figure 5: climatic data during the compaign season 2019-2020
Turkish Journal of Computer and Mathematics Education Vol.12 No.4 (2021), 1434-1454
Research Article
1440
Sept Oct. Nov. Dec Jan Fev Mars Avr Mai Juin Juil Août --
1
2
3
4
5
6
ETo(mm/day)
ETo (mm/mois)
Month
ET
o(m
m/d
ay)
40
60
80
100
120
140
160
180
200
ET
o (
mm
/ m
on
th)
Figure 6: The reference evaptranspiration during the growing cycle( 2019-2020 season)
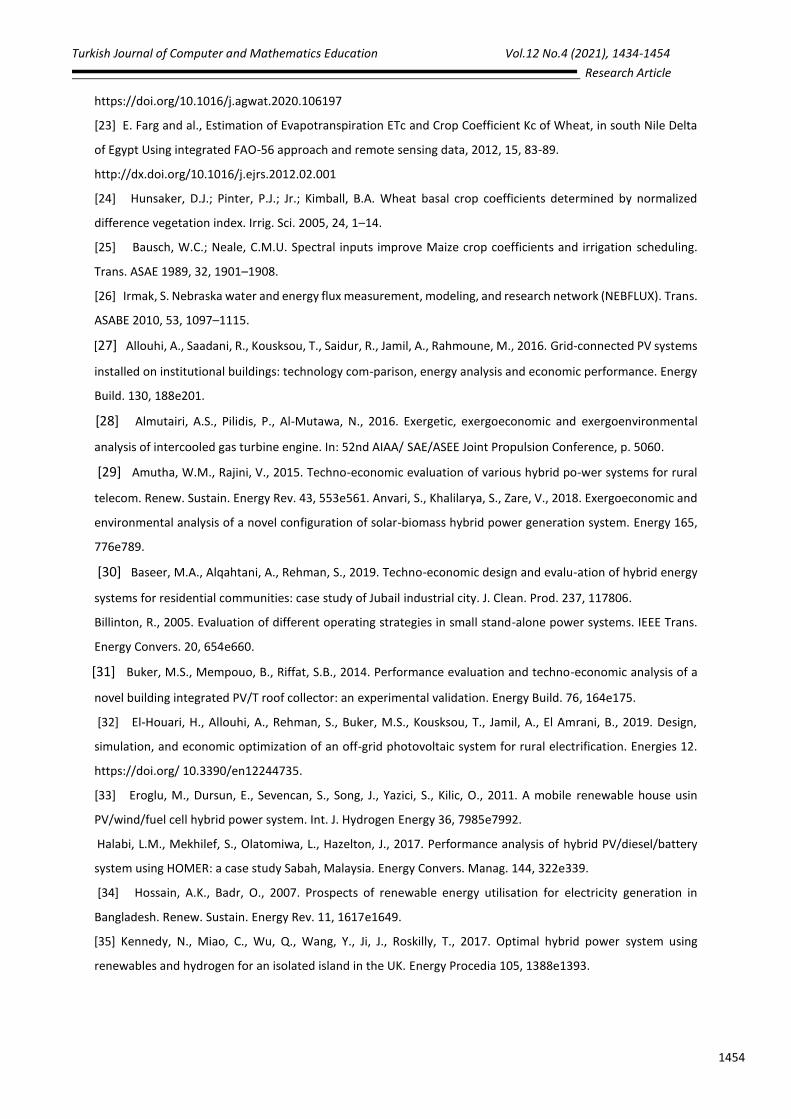
CROP COEFFICIENTS :
Sept Oct. Nov. Dec Jan Fev Mars Avr Mai Juin Juil Août --
0.6
0.7
0.8
0.9
1.0
1.1
1.2
1.3
1.4
Cro
ps c
oeffic
ients
Month
Sugar cane
Rice
Cereals
Beet
Corn
Figure 7: the evolution of corps coefficients during the growing cycle( 2019-2020 season)

Turkish Journal of Computer and Mathematics Education Vol.12 No.4 (2021), 1434-1454
Research Article
1441
Sept Oct. Nov. Dec Jan Fev Mars Avr Mai Juin Juil Août --
0
5
10
15
20
25
ET
C (
mm
/ D
ay)
Month
Sugar cane
Rice
Cereals
Beet
Corn
total water need
Figure 8: the daily ETC of crops during the growing cycle ( 2019-2020 season)
Sept Oct. Nov. Dec Jan Fev Mars Avr Mai Juin Juil Août --
0
100
200
300
400
500
600
700
800
ET
C (
mm
/month
)
Month
Sugar cane
Rice
Cereals
Beet
Corn
total water need
Figure 9: The monthly ETC of crops during the growing cycle ( 2019-2020 season)
3.2. Load assessment
The proposed system seems to be a promising option to supply the pumping station electricity need for irrigation
purposes. The case study consists of six man crops supplied by irrigation water by pumping station connected to the
electricity grid. However, the main purpose of this manuscript is to analyse the possibility of implementing centralized
stand-alone HRES in similar rural area with irrigation is done traditionally due to not access to electricity network.
Fig. 13 shows the distribution of the monthly electricity consumption throughout the year 2019-2020 for the six man
crops on the Gharb region . A maximum of monthly consumption is seen over the months of July and August with an
average value of 1891.2 kWh and the minimum in January with the average of 1140.12 kWh.
The distribution of the average electric load per hour for the year 2019-2020 is depicted in Fig 14. A maximum load of
6.44 kW (at 23:00 h) is identified in the summer season.

Turkish Journal of Computer and Mathematics Education Vol.12 No.4 (2021), 1434-1454
Research Article
1442
2.3. Resources assessment
The Gharb region possesses a high potential of renewable energy resources notably biomass, wind and solar. The details
of these resources are covered in the following paragraphs.
3.2.1. Solar irradiation data Solar energy data for the region under examination is collected from meteorological station TSGC in SK Tlet. Fig. 10
and Fig.11 displays the daily irradiation for two typically days. The annual average solar global horizontal irradiance is
5.07 kWh/m2/ day with maximum of 7.18 kWh/m2/day observed in June and a minimum of 2.74 kWh/m2/day in
December.
Figure 10: Solar radiation for a typical clear sky day.
Figure 11: Solar radiation for a typical cloudy sky day.

Turkish Journal of Computer and Mathematics Education Vol.12 No.4 (2021), 1434-1454
Research Article
1443
3.2.2. Wind data
The monthly mean wind speed is obtained from the meteorological station TCSG in SK tlet in Fig 5 .
3.2.3. Biomass resource
Biomass is among the oldest power sources in the world and through which methane (CH4) and carbon dioxide (CO2)
gases are produced in the absence of oxygen by microorganisms. It is obtained from agricultural residues, animal waste,
wood, and human waste etc (Zafar and Owais, 2006).
Figure 12 : Distribution of electricity consumption by sector.
Sept Oct. Nov. Dec Jan Feb Mars Apr Mai June July Aug
0
200
400
600
800
1000
1200
1400
1600
1800
2000
Ele
ctr
icity c
onsum
ption (
kw
h )
Monthly average load
Figure 13: Monthly average load for irrigation compaign saison 2019-2020

Turkish Journal of Computer and Mathematics Education Vol.12 No.4 (2021), 1434-1454
Research Article
1444
1 3 5 7 9 11 13 15 17 19 21 23
0
1
2
3
4
5
6
7
Ele
ctr
ic load (
kw
)
Hours
Electric load ( kw)
Figure 14 : Typical summer day load demand
4. HRES detail and equipment
The autonomous Hybrid Renewable Energy System proposed in this manuscript is illustrated in Fig. 15, which
contains five major components: biomass generator, PV Modules, wind turbines, converter, and batteries for storage.
4.1. Solar photovoltaic system
The photovoltaic modules are polycrystalline silicon connected to each other, oriented towards the south and tilted at
33 , which is the optimum inclination in the studied region. Photovoltaic panels do not have a tracking system. The
generating power by the PV modules is dependent on the upcoming solar radiation as well as ambient temperature. The
initial price in the Moroccan market is approximately 1600 $/kW and considering that the module lifespan equals to the
project life and the replacement price is taken to be zero. The operating and maintenance costs are estimated at 15 $/yr
which is a reasonable value in the Moroccan scenario. The project lifespan is considered as 25 years. Power generated
by PV modules is calculated as follows: [27]
PPV = YPV ∗ fPV ∗ ( GPV
Grefa
) ∗ (1 + KT(TC − Tref)
Figure 15 : Configuration of the proposed hybrid power system
Diesel Generator
Converter
Electric Load 2 kwh/day PV
battery
AC DC

Turkish Journal of Computer and Mathematics Education Vol.12 No.4 (2021), 1434-1454
Research Article
1445
where PPV is the produced power, YPV is the PV generation under standard test conditions [kW], fPV is the rated PV
capacity [%], GPV and Gref represent the solar energy incident on the photovoltaic field in the current time and under
the standard conditions [1 kW/ m2], respectively. KT is the temperature coefficient of the maximumpower [%/ C] and
Tc and Tref are temperatures of the photovoltaic surface at standard tests conditions [25 C], respectively. The derating
factor considered is around 80%. In this study, the ground reflectance is equal to 20%.
4.2. Wind turbine
The wind turbine considered in this study is of horizontal axis type, producing nominal 5.1 kW of AC current at the
output. Technical specifications are tabulated in Table 1. The hub height of the wind turbine is 12 m and has a lifetime
of 25 years. The wind velocity at the chosen hub height Uhub and the corresponding power output PWout are calculated
using the following equations (Kennedy et al., 2017). [28]
Uhub = Uanem ∗ ( Zhub
Zanem)⍺
where Uanem represents the wind velocity at anemometer height, respectively. Zhub is the wind turbine hub height, Zanem
is the anemometer height, and a is the power law exponent.
𝐏𝐖𝐨𝐮𝐭 =𝟏
𝟐∗ 𝛒 ∗ 𝐀 ∗ 𝐕 ∗ 𝐂𝐩 ∗ ᶯ𝐭 ∗ ᶯ𝐠 [29]
where r is the air density, A is the rotor area in m2, V is wind velocity in m/s, Cp is performance density of air coefficient
of the turbine and ht and hg are the efficiencies of wind turbine and the generator, respectively. The initial cost according
to the Moroccan market of the wind turbine unit is considered as $10,775 with the replacement cost of $0 considering
the equality between the project life and the wind turbine lifespan and the operation and maintenance cost of 20 $/year.
4.3. Biogas generator
The gasification reaction takes place under very high temperature conditions (>1000 C) (Heydari and Askarzadeh,
2016). Syngas is used as a source of electricity production from gas turbines. In this case, the cost of fuel is not
considered because the fuel is the animal waste, which can be found abundantly. The initial price of biomass generator
is taken as 1600 $/kW, the replacement and operating costs are assumed as 1250 $/kW and 0.1 $/h, respectively. The
life of the biogas generator is taken as 20,000 h so as the lower heating value of 5.5 MJ/kg, and the percentage carbon
content as 5%.
4.4. Converter
The converters are among the most important components of the hybrid system utilized to convert alternating current (AC) to
direct current (DC) or the opposite way. To do this, it is placed between the AC and DC segments. The efficiency of the latter
relies on the other devices of the hybrid system (Eroglu et al., 2011). In the present case, the initial, replacement, and
maintenance costs per kW capacity are taken as $400, $400, and $0 per year, respectively. The lifetime of the converter is
taken as 15 years. Efficiency of the inverter and rectifier are considered as 90% and 95%, respectively.
Property Specification
Brand name AWS-HC 5.1 kW
Rated power (W) 5100
Rated wind speed (m/s) 11e25
Number of blades 3
Rotor diameter (m) 5.24
Cut in speed (m/s) 2.76
Table 1. Properties of the selected wind
turbine.

Turkish Journal of Computer and Mathematics Education Vol.12 No.4 (2021), 1434-1454
Research Article
1446
4.5. Battery
In hybrid systems, which are not usually connected to the electricity network, batteries play an important role as they
ensure the continuous power supply during the periods when there is no or inadequate electricity production and
maintain constant voltage during the peak demanding of irrigation . The storage capacityof the battery, Bc, is
calculated using equation (8) (Malheiro et al., 2015). In equation (8), Dele is the daily electrical demand in
[kWh/day].the daily electrical demand in [kWh/day], Dd is the depth of discharge of the battery, Na is the daily range
Na is the daily autonomy, and hb and hinv are the efficiencies of the battery and converter, respectively.
In this work, the battery employed has a capacity of 167 Ah with a nominal voltage of 6V. The capital cost and the
replacement cost in Moroccan market of this battery is $330, the maintenance cost is equal to 10 $/year, with the
expected lifetime of 15 years.Table 1 summarizes the specifications of the selected battery.
Simulation process and economic considerations
For the economic analysis, the life of the project is equal to 25 years; the discount rate and inflation rate are considered
as 5% and 2.5%, respectively (Allouhi et al., 2016). Table3 summarizes the capital, replacement, and operating and
maintenance (O&M) fees for each component of the hybrid system.
4.6. Net present cost
The hybrid power system optimization tool, HOMER, is exploited to optimize the system rested on the minimum
net present cost (NPC) that can be evaluated as follows.
CNPC = Uanem ∗ ( Cann,tot
CRF(i,Rproj)) [30]
With
𝐶𝑅𝐹 =i∗ (1+i)𝑁
(1+i)𝑁−1 [31]
where Cann tot and CNPC represent total annualized cost ($/year) and total net cost ($), CRF is the capital recovery
factor, Rproj is the project life time in years and i is the interest rate (%).
2.5.2. Levelized cost of electricity The levelized COE is a very important indicator for economic analysis of any hybrid system. The COE means the cost
of a kWh electricity generated by the system. The COE is calculated by Homer by dividing total annualized cost
(TAC) with respect to the total annualized primary served load (kWh/yr) Eprim, as following:
𝑇𝐴𝐶 = NPC × CRT(i, N) [32]
CNPC = 𝑇𝐴𝐶
EPrim [33]
Table 2. Properties of the selected battery.
Properties Specifications
Nominal voltage 6 VDC
Nominal capacity 167 Ah
Roundtrip efficiency 90%
Maximum charge current 167 A
Maximum discharge current 500 A
lifespan 15 years

Turkish Journal of Computer and Mathematics Education Vol.12 No.4 (2021), 1434-1454
Research Article
1447
Table 3. Information regarding Hybrid power system components.
4.6.1. Compared to a scenario of diesel power generation.
The second approach quantifies the amount of avoided CO2 emissions comparing with the scenario of diesel-based
power generation. Homer calculates CO2 emissions caused by a diesel
EMAV,DG = (3.667 ∗ mf ∗ HVf ∗ Xf ∗ CEFf ) − EMHRES [34]
where mf represents the fuel volume (liter), HVf refers to the calorific number of the fuel (MJ/L), Xf means fraction of
the oxidized carbon and CEFf means the carbon emission factor (tonne of car-bon/TJ), EMHRES and means the
emissions emitted by the system.
In this work, a hybrid system is designed and its performance characteristics are carefully examined to successfully
fulfil the energy demand of the studied area. The proposed hybrid power system is optimized using HOMER, which
delivers outcomes regarding the system optimization, performance and sensitivity analysis. HOMER identifies the
optimum configuration of the off-grid taking into account the solar, wind and biomass renewable energy sources.
HOMER performs simulations to describe the operation of each possible configuration by considering energy balance
computations in each time step. At each time, HOMER predicts the energy demand to the corresponding energy from
the proposed system, and evaluates the flows of energy between whether to charge/discharge the batteries. According
to the computations, HOMER indicates whether a configuration is viable first in terms of satisfying the electric load
under the given conditions. Then, it gives a detailed financial evaluation of costs during the whole project lifetime. As
such, for each possible configuration, HOMER sorts by net present cost of the investigated options and indicates
optimum scenarios inducing lowest life cycle expenditures. Table 5 describes the different scenarios examined by the
simulation process.
5.1 HRES optimization results
Table 4 shows the possible configurations of supplying the electric load to the studied zone based on the available
energy sources. It also indicates design options and installed capacities with respect to each configuration.
The most cost-effective system (Scenario A), as described in Table 5, consists of PV-Wind-Biomass-Battery as it yields
the lowest Net Present Cost (NPC) of $123,887.00 and accordingly the lowest Cost of Energy (COE) of 0.2 $/kWh,
respectively.
Switching to scenario B that excludes the utilization of wind power does not generate a considerable difference in NPC
at around 2.18%. As seen, Scenario B is characterized by a larger PV field to substitute energy production from the
wind turbine as compared to scenario A.
The use of wind energy, photovoltaic panels and the battery(scenario C) will generate an additional NPC of 74.4%. The
NPC of scenarios D, E and F remains costly options compared to scenario A. All scenarios have 100% renewable
fraction since there is no diesel or other engine. Under unmet load and excess production, scenario E presents 0 kWh/yr
Parameters Components
1 kW 1 kW 1 kW 1 Unit 1 kW
Capital cost ($)
1600.00
2155.0
0
1600.0
0
330.00
400.00
Replacement cost
($) 0.00 0.00
1250.0
0 330.00 400.00
O & M cost
($/year) 15.00 20.00 876.00 10.00 0.00
Life-time, (years) 25 25 2.28 15 15
Efficiency, (%) e e e 90 95
Current type DC AC AC e e
PV Wind Biomass
Generator Converter Battery

Turkish Journal of Computer and Mathematics Education Vol.12 No.4 (2021), 1434-1454
Research Article
1448
for unmet load with an excess production of the order of 253 kWh/yr. Following, scenario A has unmet load and excess
production 21.4 kWh/yr and 2071 kWh/yr,respectively.
The last scenario engenders the higher annual electricity production that surplus is estimated to be 52,605 kWh/year. In
the rest of the discussion, the scenario A consisting of the Solar-Wind-Bio sources will be analysed, forming the
optimum HRES configuration. Such a configuration is of a particular interest, particularly for guiding strategic policies
for diversifying energy mixes.
5.2 Analysis of the optimum scenario (A)
The capital cost, the NPC, and operations costs of the suggested system (scenario A) which contains PV-Wind-Biomass-
Battery are found to be $49,524, $123,887, and $4,008, respectively. The levelized (COE) is considered to be 0.2 $/kWh
. The scenario A consists of a wind turbine with 5.1 kW capacity, 9.11 kW of PV panel, 3 kW of biomass generator, 53
167 Ah of accumulator, 4.7 kW converter with the strategy of cycle charging load. This optimal configuration emits
about 9.58 kg/year of CO2. Table 6 shows the pollutants and their concentrations for the optimal configuration. The
very low quantity of CO2 emissions can be attributed to the fact that the proposed system does not contain non-renewable
energy sources.
Table 4. Proposed HRES for application in study site.
Proposed HRES Scenario
PV/Wind/Biomass/Battery A
PV/Biomass/Battery B
PV/Wind/Battery C
PV/Battery D
Wind/Biomass/Battery E
Wind/Battery F
Table 5. Comparison of different scenarios based on simulation results
Scenario A B C D E F
PV (kW) 9.11 14.3 46.0 46.7 0 0
Wind AWS 5.1 kW 1 0 3 0 3 20
Biomass (kW) 3 3 0 0 3 0
Battery 1 kWh 53 54 134 235 276 447
Converter kW 4.7 5.26 7.37 8.52 4.07 19.9
COE ($) 0.200 0.205 0.349 0.411 0.477 0.875
NPC ($) 123,887 126,595 216,099 253,977 295,353 541,278
O&M ($) 4008 4261 3397 5295 8921 9179
Capital cost ($) 49,524.40 47,538 153,073 155,742 192,834 370,980
Production (kWh/year) 36,974 42,278 88,745 77,493 34,851 83,334
excess production (kWh/year) 2071 7221 52,605 40,290 253 47,489

Turkish Journal of Computer and Mathematics Education Vol.12 No.4 (2021), 1434-1454
Research Article
1449
A B C D E F
0
20
40
60
80
100 COE/100 ($)
Cap cost*10000 ($)
NPC/10000 ($)
Unmet laod
O&M*100 ($)
Excess Prod*1000 (Kwh /year)
Figure 16 : Configuration of the proposed hybrid power system
Table 6. Pollutant emissions corresponding to the optimal configuration.
Types of polluting greenhouse gases Value (kg/year)
Carbon dioxide (CO2) 9.85
Carbon monoxide (CO) 0.106
Unburned hydrocarbons 0
Particulate matter 0
Sulfur dioxide (SO2) 0
Nitrogen oxides (NO2) 0.0664
5.2.1. Electricity production and economic
analysis for system A Fig. 17 illustrates the monthly average energy generation produced by scenario A. It is observed
that the average monthly electricity generation is nearly constant for the biogas generator and solar panels throughout
the year. Solar energy generation experiences a slight decrease in October, November, December and January (rainy
season with low radiation values, rain and overcast conditions) and the maximum generation is reached in June and July
(peak of the summer season ). For the production of electricity generated by biomass decreases in June/July and its
maximum is predicted in December.
The relative contribution of each component is as 11% of wind power, 41% of solar power and 48% of biomass power,
respectively . The biomass generates more power with annual pro-duction of 17,701.00 kWh than other components in
the proposed system. PV panels have annual energy contribution of 15,106.00 kWh. The lowest amount of energy is
derived from the WT, which is envisaged to be 4167.00 kWh. Table 5 shows that there is energy surplus totalling of
2071 kWh, that is to say 5.6% of overall production. This excess energy can be used to support the increasing energy
needs of the farmers (household appliances , greenhouses , …). Unmet load electric for this scenario is around 21.4
kWh/yr, (equivalent to 0.0642%) which is insignificant value proving the effectiveness of the proposed architecture.

Turkish Journal of Computer and Mathematics Education Vol.12 No.4 (2021), 1434-1454
Research Article
1450
JAN FEB Mar Apr May Jun Jul Aug Sep Oct Nov Dec
0
1
2
3
4
5
KW
WT
BIO
PV
Figure 17: Electrical power generation of scenario A
As for the corresponding cost figures, Table 7 provides the capital, replacement, O&M, and salvage costs for each
element of the hybrid energy system which are found to be $49,524.40, $32,779.54, and $46,142.01, respectively.
5.3 Sensitivity analysis
In this study, for a complete technical-economic evaluation of the proposed HRES (scenario A), it is critical to carry
out sensitivity analyses on key operating/financial parameters. The first sensitivity deals with the impact of the variation
of the discount rate and the inflation rate on the cost of energy and the net present cost of the system. Both parameters
were varied from 0% to 10% with an increment of 0.5%.
The cost of electricity (COE) generated by the system hybrid (PV/ Wind/Biomass/Battery) is illustrated in a surface
plot as shown in Fig.19. The discount rate (%) is taken along x-axis and the inflation rate (%) along y-axis. According
to this figure, the inflation rate and discount rate have an influential effect on the economic performance of the HRES.
In other words, by increasing the inflation rate and decreasing the discount rate decreases the unit cost of the energy
produced (Nyeche and Diemuodeke, 2020).
The second sensitivity study is to evidence the effect of capital cost reduction on the HRES financial performance. The
initial cost
5.4 Environmental and carbon market analysis
Morocco was committed to COP21 to reduce its GHG emissions in 2030 by 40% compared to projected emissions
by 2030. This goal corresponds to a cumulative reduction of 523.5 Mt CO2-eq over the period between 2020 and 2030.
The integration of systems based on renewable sources to produce electricity is vital to reduce greenhouse gas
emissions and fossil fuel based resources (Anvari et al., 2018). Quantification of CO2 emissions avoided by the pro-
posed system is introduced and compared to the different power generation modes.
5.4.1. Scenario based on grid extension
The avoided CO2 emissions that can arise from replacing grid electrification by the PV-wind-biomass system
arecalculated based on Eq. (34). The quantity of CO2 emissions in this case was esti-mated to be around 26.48 tonnes
of CO2 per year.
5.4.2. Scenario based on diesel power generation
An additional simulation was carried out considering the same electric demand at the same region. The proposed system
contains a non-renewable energy source consisting of the DG-battery to assess the CO2 emissions avoided due to the
utilization of The hybrid system based on renewable energy resources. The capital cost and the replacement cost of the
diesel generator are consid-ered as 300 $/kW while the maintenance cost is taken equal to 0.03 $/hours.
The simulation results are illustrated in Table 7 (Scenario 1). It is an interesting configuration since it allows assessing
the amount of CO2 avoided by the PV-Wind-Biomass Battery system discussed above. That is to say, the production of

Turkish Journal of Computer and Mathematics Education Vol.12 No.4 (2021), 1434-1454
Research Article
1451
electricity in this case will only be ensured by the diesel generator.In addition to the environmental damage that will be
caused by this system, the price of the electricity produced is equal to 0.354.
Table 7. Annual electricity production of hybrid system and consumption.
Table 8. Summary of various costs related to the PV-Wind-Biomass-Battery hybrid system.
0
10000
20000
30000
40000
50000
60000
Net P
resent C
ost $
Wind turbine
Battery
Biogas generator
PV panels
Converter
Figure 18 : Cash flow summary of each energy components
Figure 19 : impact of the capital cost reduction on COE of the system
Component Capital ($) Replacement ($) O&M ($) Salvage ($) Total ($)
Battery 17,490.00 12,184.52 9833.37 3191.78 36,316.11
Bio-Generator 4800.00 19,284.17 33,401.92 1023.95 56,462.14
Converter 1881.64 1310.85 0.00 343.38 2849.11 PV 14,577.76 0.00 2535.65 0.00 17,113.41
Wind-turbine 10775.00 0.00 371.07 0.00 11146.07
System 49,524.40 32,779.54 46,142.01 4559.11 123,886.83
Technology Energy production kWh/year Energy contribution (%) Load Type Energy consumption kWh/year Contribution (%)
PV 15,106.00 41.00 AC primary load 33,332.00 100.00 Biomass 17,701.00 48.00 DC primary load 0.00 0.00
Wind 4167.00 11.00 Total 33,332.00 100.00
Total 36,974.00 100.00

Turkish Journal of Computer and Mathematics Education Vol.12 No.4 (2021), 1434-1454
Research Article
1452
Table 9. Summary of DG-Battery system.
4. Conclusion :
The monitoring of agricultural fields in terms of production and irrigation water management efficiency at the regional
level can be based on the extraction of information from satellite images through the temporal dynamics of biophysical
variables that affect crop photosynthesis. The annual NDVI LANDSAT series has been processed according to the
classification based on the pixel approach.
The results showed the ability of this methodology to discriminate between cultures.
converting to renewable energy in the world in general and in Morocco in particular via several projects such as the
Moroccan green plan and green generation in irrigation has become an essential solution, it is in this perspective that
we have made a technical study to evaluate first the need for electricity to ensure an irrigation demand and without
interruption of six crops in the region of GHarb as shown on the map, and a technical-economic study to evaluate the
different variants available.
Simulation and analysis results showed that with an average daily energy demand of 92 kWh and a peak load of 6.5
kW, the energy cost of the optimal configuration (scenario A) is $0.19/kWh. This cost increases from scenario A to
scenario F. Therefore, option A is the most cost-effective and is chosen as the optimal configuration. For the biomass-
wind-PV-battery option A, it was shown that the initial investment cost, maintenance cost, NPC and electricity cost are
$49,524.40, $4,008, $123,887 and $0.2/kWh respectively. These are competitive figures that outperform the other
alternatives studied.
References [1]Allen and al., 2006. Crop Evapotranspiration: Guidelines for Computing Crop Water Requirements. Irrigation
and DrainagePaper 56. FAO, Rome, Italy.
[2] Allen, R.G., Pereira, L.S., Howell, T.A., Jensen, M.E., 2011. Evapotranspiration information reporting: I: factors
governing measurements accuracy. Review.Agric. Water Manag. 98, 899–920.
[3] Quarmby and al., 1993. The use of multi-temporal NDVI measurements from AVHRR data for crop yield
estimation and prediction. Int. J. Remote Sens. 14 (2), 199–210. https://doi.org/10.1080/01431169308904332
[4] Rouse and al. The 3rd earth resources technology satellite-1 symposium, Greenbelt, MD, pp. 309–317. Santin-
Janin, H., Garel, M., Chapuis, J.L., Pontier, D., 2009. Assessing the performance of NDVI as a proxy for plant
biomass using non-linear models: a case study on the Kerguelen archipelago. Polar Biol. 32 (6), 861–871.
[5] Bharathkumar and Mohammed-Aslam 2015. INTERNATIONAL CONFERENCE ON WATER RESOURCES,
COASTAL AND OCEAN ENGINEERING (ICWRCOE 2015) Crop Pattern Mapping of Tumkur Taluk using NDVI
Technique: A Remote Sensing and GIS Approach
Components/Para
meters Unit
Without introducing a penalty for CO2
emissions (Scenario 1)
With introducing a penalty for CO2
emissions (Scenario 2)
DG kW 7.1 7.1
Converter kW 3.33 3.33
Battery Qty 17 17
Net present cost $ 128,962 230,193
Cost of energy
$/kW
h 0.354 0.372
Operating cost $ 11,313 11,318
Renewable
fraction % 0 0
Initial capital $ 9073 9073

Turkish Journal of Computer and Mathematics Education Vol.12 No.4 (2021), 1434-1454
Research Article
1453
[6] Kuenzer, Claudia; Knauer, Kim (2013). Remote sensing of rice crop areas. International Journal of Remote
Sensing, 34(6), 2101-2139. http://dx.doi.org/10.1080/01431161.2012.738946
[7] Doorenbos, J., 1984. Guidelines for Predicting Crop Water Requirement Irrigation and drainage paper 24.
Food and Agriculture Organization of the United Nations, Rome.
[8] Ding, R., Kang, S., Zhang, Y., Hao, X., Tong, L., Du, T., 2013. Partitioning evapotranspiration into soil
evaporation and transpiration using a modified dual crop coefficient model in irrigated maize field with ground-
mulching. Agric. Water Manag. 127, 85–96. https://doi.org/10.1016/j.agwat.2013.05.018[9] Doraiswamy et al.,
September 2004. Crop condition and yield simulations using Landsat and MODIS, Remote Sensing of
Environment 92(4), DOI: 10.1016/j.rse.2004.05.017
[10] Bell, G.E., Martin, D.L., Koh, K., Han, H.R., 2009. Comparison of turfgrass visual quality ratings with ratings
determined using a handheld optical sensor. HortTechnology 19 (2), 309–316.
https://doi.org/10.1016/j.agwat.2020.106586
[11] Doorenbos, J., Pruitt, W.O., 1977. Crop Water Requirements, FAO Irrigation and Drainage Paper No. 24.
Food and Agriculture Organization, Rome, Italy.
[12] Ray, S.S., Dadhwal, V.K., 2001. Estimation of crop evapotranspiration of irrigation command area using
remote sensing and GIS. Agric. Water Manage. 49, 239–249. Rosenstein, O., Haymann, N., Kaplan, G., Tanny, J.,
2018. Estimating cotton water consumption using a time series of Sentinel-2 imagery. Agric. Water Manage. 207,
44–52.
[13] Justice, C.O., Townshend, J.R.G., 2002. Special issue on the Moderate Resolution Imaging Spectroradiometer
(MODIS): a new generation of land surface monitoring. Remote Sens. Environ. 83 (1), 1–2
[14] Boegh, E., Søgaard, H., Hanan, N., Kabat, P., Lesch, L., 1999. A remote sensing study of the NDVI–Ts
relationship and the transpiration from sparse vegetation in the Sahel based on high-resolution satellite data.
Remote Sens. Environ. 69 (3), 224–240 1
[15] Hunsaker, D.J., Barnes, E.M., Clarke, T.R., Fitzgerald, G.J., Pinter, P.J., 2005. Cotton irrigation scheduling using
remotely sensed and FAO-56 basal crop coefficients. Trans. ASAE 48, 1395–1407
[16]. Batchelor C.H., Roberts J., Evaporation from the irrigation water, foliage and panicles of paddy rice in north-
east Sri Lanka, Agric. Meteorol. 29 (1983) 11–26.
[18] Penman, H.L., 1948. Natural evaporation from open water, bare soil, and grass. Proceedings of the Royal
Society of London A: Mathematical, Physical and Engineering Sciences. The Royal Society. pp. 120–145
[19] Thornthwaite, C.W., 1948. An approach toward a rational classification of climate. Geogr. Rev. 38, 55–94.
[20] Nouri, H., Glenn, E.P., Beecham, S., Chavoshi Boroujeni, S., Sutton, P., Alaghmand, S., Noori, B., Nagler, P.,
2016. Comparing three evapotranspiration estimation approaches in mixed urban vegetation: field-based,
remote sensing-based, and observational-based methods. Remote Sens. (Basel) 8, 492.
[21] Irmak, S., Odhiambo, L.O., Specht, J.E., Djaman, K., 2013. Hourly and daily single and basal
evapotranspiration crop coefficients as a function of growing degree days after emergence, leaf area index,
fractional green canopy
[22] L.S. Pereira, Prediction of crop coefficients from the fraction of ground cover and height. Background and
validation using ground and remote sensing data.
Turkish Journal of Computer and Mathematics Education Vol.12 No.4 (2021), 1434-1454
Research Article
1454
https://doi.org/10.1016/j.agwat.2020.106197
[23] E. Farg and al., Estimation of Evapotranspiration ETc and Crop Coefficient Kc of Wheat, in south Nile Delta
of Egypt Using integrated FAO-56 approach and remote sensing data, 2012, 15, 83-89.
http://dx.doi.org/10.1016/j.ejrs.2012.02.001
[24] Hunsaker, D.J.; Pinter, P.J.; Jr.; Kimball, B.A. Wheat basal crop coefficients determined by normalized
difference vegetation index. Irrig. Sci. 2005, 24, 1–14.
[25] Bausch, W.C.; Neale, C.M.U. Spectral inputs improve Maize crop coefficients and irrigation scheduling.
Trans. ASAE 1989, 32, 1901–1908.
[26] Irmak, S. Nebraska water and energy flux measurement, modeling, and research network (NEBFLUX). Trans.
ASABE 2010, 53, 1097–1115.
[27] Allouhi, A., Saadani, R., Kousksou, T., Saidur, R., Jamil, A., Rahmoune, M., 2016. Grid-connected PV systems
installed on institutional buildings: technology com-parison, energy analysis and economic performance. Energy
Build. 130, 188e201.
[28] Almutairi, A.S., Pilidis, P., Al-Mutawa, N., 2016. Exergetic, exergoeconomic and exergoenvironmental
analysis of intercooled gas turbine engine. In: 52nd AIAA/ SAE/ASEE Joint Propulsion Conference, p. 5060.
[29] Amutha, W.M., Rajini, V., 2015. Techno-economic evaluation of various hybrid po-wer systems for rural
telecom. Renew. Sustain. Energy Rev. 43, 553e561. Anvari, S., Khalilarya, S., Zare, V., 2018. Exergoeconomic and
environmental analysis of a novel configuration of solar-biomass hybrid power generation system. Energy 165,
776e789.
[30] Baseer, M.A., Alqahtani, A., Rehman, S., 2019. Techno-economic design and evalu-ation of hybrid energy
systems for residential communities: case study of Jubail industrial city. J. Clean. Prod. 237, 117806.
Billinton, R., 2005. Evaluation of different operating strategies in small stand-alone power systems. IEEE Trans.
Energy Convers. 20, 654e660.
[31] Buker, M.S., Mempouo, B., Riffat, S.B., 2014. Performance evaluation and techno-economic analysis of a
novel building integrated PV/T roof collector: an experimental validation. Energy Build. 76, 164e175.
[32] El-Houari, H., Allouhi, A., Rehman, S., Buker, M.S., Kousksou, T., Jamil, A., El Amrani, B., 2019. Design,
simulation, and economic optimization of an off-grid photovoltaic system for rural electrification. Energies 12.
https://doi.org/ 10.3390/en12244735.
[33] Eroglu, M., Dursun, E., Sevencan, S., Song, J., Yazici, S., Kilic, O., 2011. A mobile renewable house usin
PV/wind/fuel cell hybrid power system. Int. J. Hydrogen Energy 36, 7985e7992.
Halabi, L.M., Mekhilef, S., Olatomiwa, L., Hazelton, J., 2017. Performance analysis of hybrid PV/diesel/battery
system using HOMER: a case study Sabah, Malaysia. Energy Convers. Manag. 144, 322e339.
[34] Hossain, A.K., Badr, O., 2007. Prospects of renewable energy utilisation for electricity generation in
Bangladesh. Renew. Sustain. Energy Rev. 11, 1617e1649.
[35] Kennedy, N., Miao, C., Wu, Q., Wang, Y., Ji, J., Roskilly, T., 2017. Optimal hybrid power system using
renewables and hydrogen for an isolated island in the UK. Energy Procedia 105, 1388e1393.
Related Documents