Economic Commission for Latin America and the Caribbean Subregional Headquarters for the Caribbean AN ASSESSMENT OF THE ECONOMIC IMPACT OF CLIMATE CHANGE ON THE WATER SECTOR IN GRENADA _________ This document has been reproduced without formal editing. LIMITED LC/CAR/L.329 22 October 2011 ORIGINAL: ENGLISH

Welcome message from author
This document is posted to help you gain knowledge. Please leave a comment to let me know what you think about it! Share it to your friends and learn new things together.
Transcript
Economic Commission for Latin America and the Caribbean
Subregional Headquarters for the Caribbean
AN ASSESSMENT OF THE ECONOMIC IMPACT OF CLIMATE CHANGE ON THE WATER SECTOR IN GRENADA
_________
This document has been reproduced without formal editing.
LIMITED
LC/CAR/L.329
22 October 2011
ORIGINAL: ENGLISH

i
Acknowledgement
The Economic Commission for Latin America and the Caribbean (ECLAC) Subregional Headquarters for the Caribbean wishes to acknowledge the assistance of Eleanor Jones, consultant, in the preparation of
this report.
ii
List of contents
I. INTRODUCTION ................................................................................................................................... 1
A. PURPOSE ............................................................................................................................................... 1
B. THE WATER SECTOR DEFINED ............................................................................................................. 1
C. CONTEXTUAL BACKGROUND ............................................................................................................... 2
II. LITERATURE REVIEW ..................................................................................................................... 5
A. APPROACHES TO MEASURING IMPACT OF CLIMATE CHANGE ON THE WATER SECTOR ..................... 5
1. Overview .......................................................................................................................................... 5
2. The Economic Valuation of Water ................................................................................................... 5
3. Conceptual Framework for Impact Evaluation ................................................................................ 5
4. Supply-Side Approaches .................................................................................................................. 6
5. Demand-Side Approaches ................................................................................................................ 9
B. TOWARDS SELECTING A MODEL ........................................................................................................ 11
C. PROJECTED IMPACTS OF CLIMATE CHANGE ON THE WATER SECTOR OF THE CARIBBEAN ................ 13
D. IPCC SRES SCENARIOS ..................................................................................................................... 16
III. ANALYSIS OF CLIMATE FOR GUIDANCE TO THE WATER SECTOR ............................. 20
A. EXISTING CLIMATE VARIABLES ........................................................................................................ 20
1. Rainfall ........................................................................................................................................... 20
2. Temperature ................................................................................................................................... 21
B. CLIMATE CHANGE AND GRENADA .................................................................................................... 22
1. Temperature ................................................................................................................................... 22
2. Rainfall ........................................................................................................................................... 22
3. Sea-Level Rise ................................................................................................................................ 22
4. Climate Variability ......................................................................................................................... 23
5. Extreme Events .............................................................................................................................. 23
IV. SOCIOECONOMIC SETTING, VULNERABILITIES AND THREATS ................................... 24
A. WATER SUPPLY CHARACTERISTICS ................................................................................................... 24
1. Surface Water Quality .................................................................................................................... 25
2. Ground Water Quality .................................................................................................................... 25
iii
3. Demand and Supply by Sector ....................................................................................................... 26
4. Surface Water Supply ..................................................................................................................... 27
5. Groundwater ................................................................................................................................... 27
6. Existing Constraints or Challenges to Grenada‘s Water Sector ..................................................... 28
7. Drought ........................................................................................................................................... 30
B. SOCIOECONOMIC SETTING ................................................................................................................. 32
1. Demographics and Settlement Patterns .......................................................................................... 32
2. Economic Indicators ....................................................................................................................... 32
3. Economic Growth........................................................................................................................... 34
C. ECONOMIC SECTORS .......................................................................................................................... 34
1. Tourism .......................................................................................................................................... 35
2. Construction ................................................................................................................................... 35
3. Manufacturing ................................................................................................................................ 36
4. Agriculture ..................................................................................................................................... 36
5. Export Earnings .............................................................................................................................. 36
6. Revenue Generation ....................................................................................................................... 37
D. GEOPHYSICAL BASE AND CLIMATIC PARAMETERS ............................................................................ 38
1. Hydrological Basins and Watershed Management Units ............................................................... 38
2. Natural Hazard Vulnerability ......................................................................................................... 38
3. Land Ownership, Use and Management ........................................................................................ 40
E. INSTITUTIONAL MAP ........................................................................................................................... 41
V. CLIMATE MODELLING AND WATER SUPPLY 2011-2050 ...................................................... 41
A. WATER DEMAND ........................................................................................................................... 41
1. Residential Water Demand ............................................................................................................. 42
2. Tourism Water Demand ................................................................................................................. 43
3. Agriculture Water Demand ............................................................................................................ 45
B. CLIMATE DATA: HISTORICAL, A2 AND B2 FORECASTS ..................................................................... 47
C. WATER SUPPLY .............................................................................................................................. 48
1. Forecast .......................................................................................................................................... 49
D. RESULTS & DISCUSSIONS ............................................................................................................ 50
1. Forecasted Net Water Demand 2011 - 2050 .................................................................................. 50
iv
VI. ADAPTATION STRATEGIES ......................................................................................................... 53
A. INCREASING ADAPTIVE CAPACITY .................................................................................................... 54
B. SELECTING STRATEGIES ..................................................................................................................... 55
C. CURRENT WATER MANAGEMENT INITIATIVES IN GRENADA ................................................. 56
1. Data collection, Monitoring and Analysis ...................................................................................... 56
2. Institutional Capacity Building ...................................................................................................... 57
3. Infrastructure Maintenance and Improvement ............................................................................... 57
4. Land Information and Management ............................................................................................... 58
5. Integrated Watershed Management ................................................................................................ 58
6. Forest Rehabilitation ...................................................................................................................... 58
7. Integrated Water Resource Management ....................................................................................... 60
8. Rainwater Harvesting ..................................................................................................................... 61
D. PRIORITISING OPTIONS FOR GRENADA .............................................................................................. 66
E. SUMMARY PRIORITIES ........................................................................................................................ 71
F. OTHER PROPOSED STRATEGIES .......................................................................................................... 72
G. CLIMATE CHANGE MITIGATION THROUGH THE WATER SECTOR ...................................................... 72
VII. COST BENEFIT CONSIDERATIONS .......................................................................................... 73
A. ADAPTATION EXPERIENCES ............................................................................................................... 74
B. PROJECT IDENTIFICATION STUDIES UNDERTAKEN, OR PROPOSED, OF RELEVANCE TO
GRENADA............................................................................................................................................. 74
1. Desalination .................................................................................................................................... 75
2. Rainwater Harvesting ..................................................................................................................... 76
3. Water Resources Conservation and Management .......................................................................... 77
4. Fiscal Incentives in Support of Adaptation .................................................................................... 77
5. Irrigation ......................................................................................................................................... 78
6. A list of Proposed Prioritized Projects with indicative costs ......................................................... 78
C. BUDGETARY APPROACH TO MEETING WATER DEMAND .................................................................. 78
1. The current cost of water production.............................................................................................. 80
D. AN ESTIMATE OF THE COST OF CLIMATE CHANGE ............................................................................ 82
VIII. CONCLUSION ................................................................................................................................ 83
ANNEX I .................................................................................................................................................... 85

v
ANNEX II - DATA SET ........................................................................................................................... 87
ANNEX III - REGRESSION OUTPUT .................................................................................................. 94
REFERENCES .......................................................................................................................................... 95
vi
List of figures FIGURE 1: GEOGRAPHICAL LOCATION OF GRENADA ...................................................................................................... 3
FIGURE 2: CONCEPTUAL FRAMEWORK TO IMPACT VALUATION ..................................................................................... 6
FIGURE 3: SCHEMATIC REPRESENTATION OF THE SUPPLY-SIDE SIMULATION MODEL ................................................... 8
FIGURE 4: EQUATION FOR ESTIMATING NATIONAL LOSS ............................................................................................... 8
FIGURE 5: EQUATION FOR MODELLING THE PRODUCTION SECTOR .............................................................................. 12
FIGURE 6: EQUATION FOR MODELLING THE WATER SECTOR ....................................................................................... 12
FIGURE 7: SPECIAL REPORT ON EMISSION SCENARIOS (SRES) SCHEMATIC................................................................. 16
FIGURE 8: CHANGES IN MONTHLY RAINFALL PATTERNS, A1B SCENARIO 1990S-2070S (EARTH SIMULATOR‘S SUPER-
HIGH RESOLUTION GCM; JAPAN‘S METEOROLOGICAL RESEARCH INSTITUTE). ................................................. 18
FIGURE 9: CHANGES IN MONTHLY RAINFALL PATTERNS, A2 SCENARIO 1990S-2070S, AS SIMULATED BY THE U.K.
HADLEY CENTRE‘S PRECIS REGIONAL CLIMATE MODEL. .................................................................................. 19
FIGURE 10: MEAN ANNUAL RAINFALL ON MAINLAND ................................................................................................ 21
FIGURE 11: GRENADA‘S WATER SUPPLY AND DISTRIBUTION NETWORK ....................................................................... 24
FIGURE 12: NUMBER OF CONSECUTIVE DRY MONTHS WHERE DRY EVAPOTRANSPIRATION EXCEEDS RAINFALL ON
GRENADA ........................................................................................................................................................... 31
FIGURE13: ESTIMATED RAW WATER YIELD FROM CATCHMENT AREAS IN DRIEST AND WETTEST MONTHS ................... 31
FIGURE 14: 1999 LABOUR FORCE ESTIMATE BY OCCUPATION ..................................................................................... 33
FIGURE 15: GRENADA REAL GDP GROWTH RATE 1998-2009 ..................................................................................... 34
FIGURE 16: SECTOR CONTRIBUTION TO GDP ............................................................................................................... 35
FIGURE 17: GRENADA‘S MERCHANDISE TRADE PERFORMANCE (US$ MILLION) ......................................................... 37
FIGURE 18: WATERSHED MANAGEMENT UNITS IN MAINLAND GRENADA AND CARRIACOU ........................................ 39
FIGURE 19: CARIBBEAN BASIN TRACKS ....................................................................................................................... 39
FIGURE 20: GRENADA‘S PROPOSED WATER SECTOR ARRANGEMENTS .......................................................................... 42
FIGURE 21: GRENADA RESIDENTIAL WATER DEMAND 2011 TO 2050 .......................................................................... 43
FIGURE 22: TOURISM WATER DEMAND GRENADA 2011 TO 2050 ................................................................................ 45
FIGURE 23: GRENADA AGRICULTURE WATER DEMAND 2011 TO 2050 ........................................................................ 46
FIGURE 24: GRENADA RAINFALL A2 AND B2, 2011TO 2050 ........................................................................................ 47
FIGURE 25: GRENADA TEMPERATURE FORECASTS A2 AND B2, 2011 TO 2050 ............................................................ 48
FIGURE 26: GRENADA WATER SUPPLY 2011 TO 2050 .................................................................................................. 50
FIGURE 27: A2 WATER NEEDS 2011 TO 2050 ............................................................................................................... 51
FIGURE 28: B2 NET WATER NEEDS 2011 TO 2050 ........................................................................................................ 51
FIGURE 29: BAU NET WATER NEEDS 2011 TO 2050 .................................................................................................... 52
FIGURE 30: TARGET COMMUNITIES FOR RWH INVESTMENT ....................................................................................... 61
vii
List of tables
TABLE 1: PRIORITY INVESTMENTS WITH INDICATIVE COSTS ......................................................................................... X
TABLE 2: SUMMARY OF GLOBAL SEAL LEVEL RISE PROJECTIONS FOR 21ST CENTURY (UNDP) ................................. 15
TABLE 3: IPCC STORYLINES......................................................................................................................................... 17
TABLE 4: SHOWING AVERAGE RAINFALL IN INCHES AT SELECTED MONITORING STATIONS (2004- 2008) .................. 21
TABLE 5: GROUNDWATER QUALITY ............................................................................................................................. 25
TABLE 6: AGRICULTURAL WATER DEMAND AND IRRIGATION-EQUIVALENT AREA – GRENADA .................................... 26
TABLE 7: NON-AGRICULTURAL WATER CAPACITY AND DEMAND IN GRENADA (2000)................................................. 27
TABLE 8: GROUND WATER RESOURCES IN CARRIACOU ................................................................................................ 28
TABLE 9: GEOGRAPHICAL DISTRIBUTION OF GRENADA'S POPULATION ....................................................................... 33
TABLE 10: RECENT FISCAL PERFORMANCE 2003 TO 2009 FIRST QUARTER (EC$M) ................................................... 38
TABLE 11: COEFFICIENTS FOR GRENADA WATER SUPPLY REGRESSION ...................................................................... 49
TABLE 12: DISTRIBUTION OF LAND AREA IN GRENADA ................................................................................................ 59
TABLE 13: PROJECT COST BREAKDOWN – FOREST REHABILITATION PROJECT ............................................................ 59
TABLE 14: COMPONENT 4 COSTS – INFRASTRUCTURAL DEVELOPMENT ...................................................................... 62
TABLE 15: COMPONENT 1 COSTS - AWARENESS RAISING ............................................................................................ 62
TABLE 16: COMPONENT 2 COSTS - CAPACITY BUILDING .............................................................................................. 63
TABLE 17: COMPONENT 3 COSTS - LEGISLATIVE AND POLICY FORMULATION ............................................................. 64
TABLE 18: COSTS- PROGRAMME ADMINISTRATION MONITORING AND EVALUATION .................................................. 64
TABLE 19: WATER AND SEWAGE TARIFF STRUCTURE (NAWASA ACT REGULATION) ............................................... 65
TABLE 20: EXISTING WATER RATES FOR CARRIACOU (FROM COMMUNAL CISTERN) ................................................... 66
TABLE 21: PRIORITISING OPTIONS FOR GRENADA (AFTER ECLAC 2010 AND RECCC, WATER SECTOR 2011) .......... 67
TABLE 22: SUMMARY OF RECOMMENDED ADAPTATION STRATEGIES AND CORRESPONDING ADAPTATION EXPERIENCES
........................................................................................................................................................................... 75
TABLE 23: CAPITAL COST ESTIMATES – INITIAL INVESTMENT 2010 (US$M 2008 CONSTANT PRICES) .......................... 76
TABLE 24: PRIORITY INVESTMENTS WITH INDICATIVE COSTS ...................................................................................... 79
TABLE 25: COST OF WATER PRODUCTION.................................................................................................................... 80
TABLE 26: NPV OF INVESTMENT SCENARIOS IN WATER PRODUCTION 2012-2050 (US$M) ......................................... 82
TABLE 27: COST OF CLIMATE CHANGE UNDER BAU AND COST BENEFIT RATIO OF INVESTMENT UNDER B2 ............. 83
TABLE 28: GRENADA‘S CLIMATE CHANGE IMPACT AND GDP - 2025-2100 ................................................................. 84
viii
List of Acronyms
ACCC Adaptation to Climate Change in the Caribbean
ARIMA Autoregressive Moving Average
BAU Business as Usual
CCCCC Caribbean Climate Change Centre
CEHI Caribbean Environmental Health Institute
CPACC Caribbean Planning for Adaptation to Global Climate Change
CWSA Central Water and Sewage Authority
DfID Department for International Development
DJF December January February
ECLAC Economic Commission for Latin America and the Caribbean
ENSO El Niño Southern Oscillation
FAO Food and Agriculture Organization
GEF Global Environment Fund
GDP Gross Domestic Product
GHG Green House Gases
GOG Government of Grenada
JJA June July August
IPCC Inter-Governmental Panel on Climate Change
MACC Mainstreaming Adaptation to Climate Change
NCSP National Communications Support Program
RECC Review the Economics of Climate Change in the Caribbean
SIDS Small Island Developing States
SLR Sea Level Rise
SON September October November
SRES Special Report on Emission Scenarios
UNEP United Nations Environment Programme
UNFCCC United Nations Framework Convention on Climate Change
UNESCO United Nations Educational, Scientific and Cultural Organization
WHO World Health Organization
ix
EXECUTIVE SUMMARY
Changing precipitation patterns and temperature relate directly to water resources and water security. This report presents the findings of an assessment of the water sector in Grenada with respect to the projected impact of climate change.
Grenada‘s water resources comprise primarily surface water, with an estimated groundwater potential to satisfy about 10%-15% of the present potable requirement. On the smaller islands Carriacou and Petite Martinique, domestic water is derived exclusively from rainwater catchments. Rainfall seasonality is marked and the available surface water during the dry season declines dramatically. Changing land use patterns, increase in population, expansion in tourism and future implementation of proposed irrigation schemes are projected to increase future water requirements.
Economic modeling approaches were implemented to estimate sectoral demand and supply between 2011 and 2050. Residential, tourism and domestic demand were analysed for the A2, B2 and BAU scenarios as illustrated. The results suggest that water supply will exceed forecasted water demand under B2 and BAU during all four decades. However under the A2 scenario, water demand will exceed water supply by the year 2025.
It is important to note that the model has been constrained by the omission of several key parameters, and time series for climate indicators, data for which are unavailable. Some of these include time series for discharge data, rainfall-runoff data, groundwater recharge rates, and evapotranspiration. Further, the findings which seem to indicate adequacy of water are also masked by seasonality in a given year, variation from year to year, and spatial variation within the nation state. It is imperative that some emphasis be placed on data generation in order to better project for the management of Grenada‘s water security. This analysis indicates the need for additional water catchment, storage and distribution infrastructure, as well as institutional strengthening, in order to meet the future needs of the Grenadian population.
Strategic priorities should be adopted to increase water production, increase efficiency, strengthen the institutional framework, and decrease wastage. Grenada has embarked on several initiatives that can be considered strategies toward adaptation to the variabilities associated with climate change. The Government should ensure that these programs be carried out to the optimal levels for reasons described above. The ―no-regrets approach‖ which intimates that measures will be beneficial with or without climate change should be adopted.
A study on the Costs of Inaction for the Caribbean in the face of climate change listed Grenada among the countries which would experience significant impacts on GDP between now and 2100 without adaptation interventions. Investment in the water sector is germane to building Grenada‘s capacity to cope with the multivariate impact of changes in the parameters of climate.
x
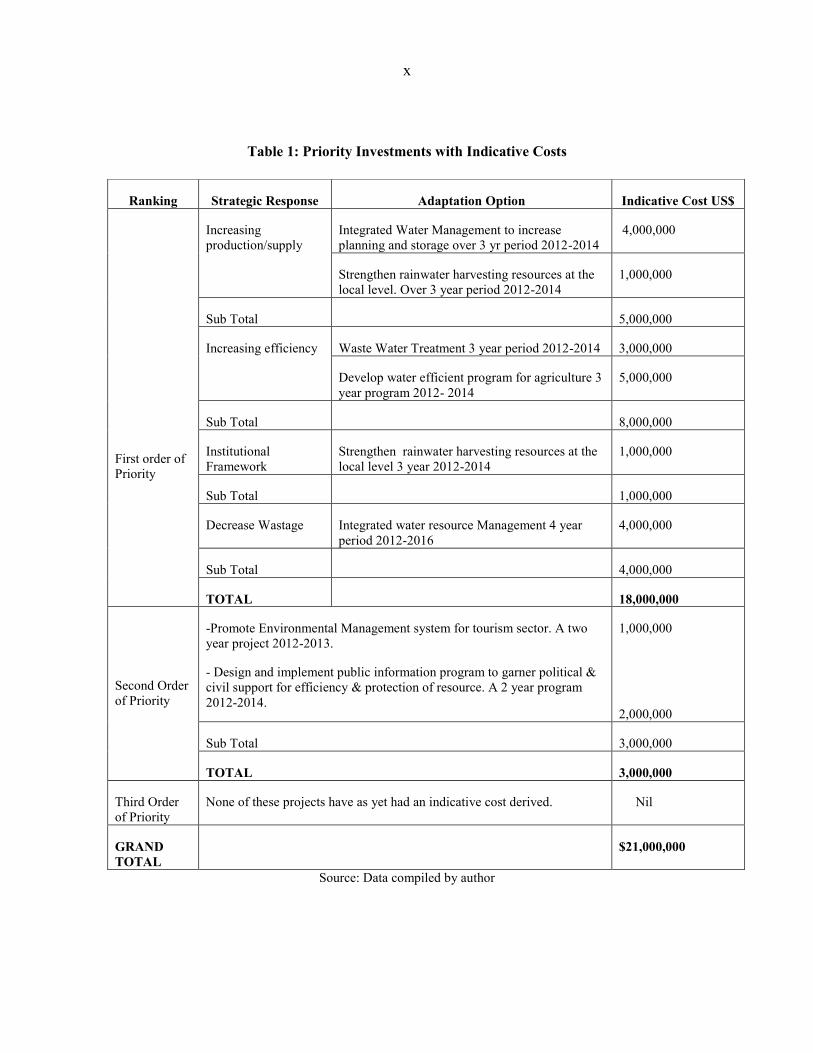
Table 1: Priority Investments with Indicative Costs
Source: Data compiled by author
Ranking Strategic Response Adaptation Option Indicative Cost US$
First order of Priority
Increasing production/supply
Integrated Water Management to increase planning and storage over 3 yr period 2012-2014
4,000,000
Strengthen rainwater harvesting resources at the local level. Over 3 year period 2012-2014
1,000,000
Sub Total 5,000,000
Increasing efficiency Waste Water Treatment 3 year period 2012-2014 3,000,000
Develop water efficient program for agriculture 3 year program 2012- 2014
5,000,000
Sub Total 8,000,000
Institutional Framework
Strengthen rainwater harvesting resources at the local level 3 year 2012-2014
1,000,000
Sub Total 1,000,000
Decrease Wastage Integrated water resource Management 4 year period 2012-2016
4,000,000
Sub Total 4,000,000
TOTAL 18,000,000
Second Order of Priority
-Promote Environmental Management system for tourism sector. A two year project 2012-2013.
- Design and implement public information program to garner political & civil support for efficiency & protection of resource. A 2 year program 2012-2014.
1,000,000
2,000,000
Sub Total 3,000,000
TOTAL 3,000,000
Third Order of Priority
None of these projects have as yet had an indicative cost derived. Nil
GRAND TOTAL
$21,000,000
1
I. INTRODUCTION
A. PURPOSE
This document presents an economic assessment of the potential impact of climate change on the water sector in Grenada projected to 2050. It is expected that the results of the assessment will stimulate governments, institutions, private sector and civil society to craft effective climate change adaptation and mitigation measures to ameliorate the projected impacts within the respective sectors and the economy.
The availability of water is pivotal in the dialogue on climate change, as changing precipitation patterns and temperature relate directly to water resources and water security. Water security which is essential to life and livelihood, health and sanitation, is determined not only by the water resource, but also by the quality of water, the ability to store surplus from precipitation and runoff, as well as access to and affordability of supply.
B. THE WATER SECTOR DEFINED
For the purposes of this report, the water sector in the context of the assessment and discussion on the impact of climate change includes consideration of the existing as well as the projected available water resource and the demand in terms of quantity and quality of surface and ground water; water supply infrastructure - collection, storage, treatment, distribution; and potential for adaptation. Analysis of the changing ratios between water availability and demand needs to consider not only changes in parameters of climate and socioeconomic variables expressed through demand and supply, but also measures to be employed for strengthening the resilience of the sector to the threats posed by climate change.
The study involved three scenarios a) Business as Usual (BAU) in which the status quo in Grenada is maintained in terms of no action by the Government on climate change adaptation and mitigation; b) the A2 scenario in which the global trajectory figures continue as is and c) the B2 scenario in which mitigation measures lead to modified emissions and reduced rates of warming.
The approach to the study included:
a. review of relevant regional and national reports on climate threats, climate change projections, natural hazard vulnerability, and water sector issues such as demand and supply and approaches to economic modelling, and proposed investments in adaptation measures to meet changing supply;
b. data collection and analysis as elaborated in Appendix I .
The sector review is informed by an understanding of the current socio-economic situation in Grenada as it relates to water demand and supply, and the key climatic threats - floods, drought, extreme tropical weather systems (storms, hurricanes), storm surge, changes in rainfall patterns and rising sea levels - under the various scenarios and carbon emission trajectories for the 40 year period.
2
C. CONTEXTUAL BACKGROUND
The SIDS of the Caribbean are regarded as hotspots for climate change, and a significant aspect of climate change is the impact on water resources. Several territories within the region already suffer from the extremes of flood and drought and at varying times throughout any given year access to adequate water supply in both urban and rural areas may elude a significant proportion of the population. In many instances natural occurrence exceeds demand, but supply is conditioned by spatial demand particularly with increasing urbanisation, agricultural needs, and growth in the tourism sector (Jones, 2007).
The primary and secondary impacts associated with repeated incidence of flood- producing rainfall events, hurricanes, storm surge, and drought wreak frequent havoc on surface flows and groundwater as well as the supply systems. Sea level rise, saltwater intrusion and salinisation of freshwater lenses in the coastal aquifers will further limit natural water availability, and pollution of resources will exacerbate the declining resource. The effects of global warming and climate change are projected to exacerbate these conditions (ESL, 2008).
It is worthy of note that although the islands of the Caribbean generally report widespread access to water and sanitation facilities, and good progress toward meeting Target 7C of the Millennium Development Goals (MDG) to halve, by 2015, the proportion of people without sustainable access to safe drinking water and basic sanitation, there is an apparent disconnect between access and use, and little consideration of the seasonality and variability which also affects quantity and quality of the resource. According to a report by the Caribbean Environmental Health Institute, the Caribbean subregion has the least water available per capita as compared to other SIDS regions (Caribbean Environmental Health Institute (CEHI], 2007).
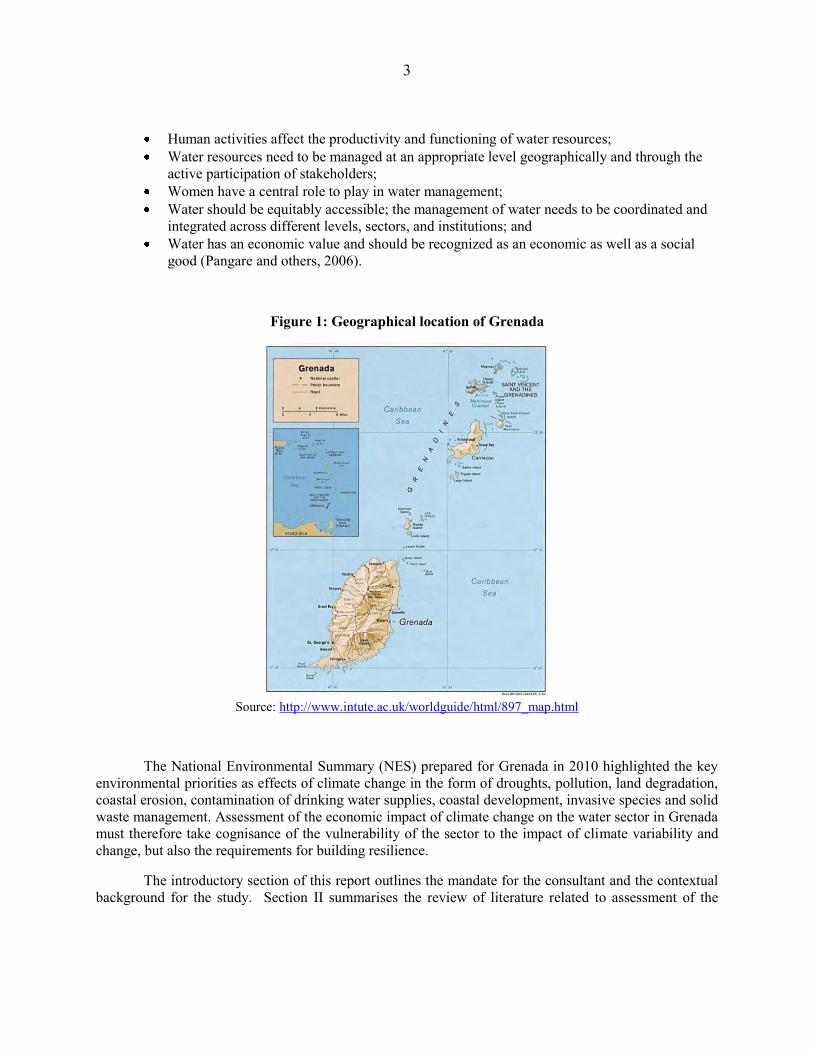
Grenada is among the island states already considered to be water stressed. Grenada is the southernmost of the Windward Islands located between latitudes 11 o 59‘ and 12 o 14‘North and longitudes 61 o 36‘ and 61 o 48‘ West (SCBD, 2000). The term ―Grenada‖ refers to the tri-island state: including Grenada, Carriacou, and Petit Martinique, unless otherwise stated (figure 1). Within a distance of 5 km, it ranges in elevation from sea level to 850 m (SCBD, 2000) and covers some 34,000 hectares of volcanic mountain tops at the southern end of the Lesser Antilles (Turner, 2009) within an area of 312 km2 (SCBD, 2000).
Seasonality and variability in rainfall can cause up to a 40% reduction in available water resources during the dry season (Cashman and others, 2010). Agriculture and tourism, two major water users, are significant economic activities in Grenada. Agriculture, though considerably declined with the loss of nutmeg export preferences, still plays a significant role in Grenada‘s economy.
The Global Water Partnership in its 2005 policy brief suggested that the best way for countries to build the capacity to adapt to climate change will be to improve their ability to cope with today‘s climate variability (GWP, 2005). Further it has been suggested that among the portfolio of water sector actions for SIDS should be integrated water resources management, demand management, water quality capacity-building; water governance and hydrological cycle observing systems (Overmars and Gottlieb, 2009). The principles of IWRM are instructive for adaptation considerations. They include the following:
Recognition that water is a finite resource and an integral part of ecosystems;
3
Human activities affect the productivity and functioning of water resources; Water resources need to be managed at an appropriate level geographically and through the
active participation of stakeholders; Women have a central role to play in water management; Water should be equitably accessible; the management of water needs to be coordinated and
integrated across different levels, sectors, and institutions; and Water has an economic value and should be recognized as an economic as well as a social
good (Pangare and others, 2006).
Figure 1: Geographical location of Grenada
Source: http://www.intute.ac.uk/worldguide/html/897_map.html
The National Environmental Summary (NES) prepared for Grenada in 2010 highlighted the key environmental priorities as effects of climate change in the form of droughts, pollution, land degradation, coastal erosion, contamination of drinking water supplies, coastal development, invasive species and solid waste management. Assessment of the economic impact of climate change on the water sector in Grenada must therefore take cognisance of the vulnerability of the sector to the impact of climate variability and change, but also the requirements for building resilience.
The introductory section of this report outlines the mandate for the consultant and the contextual background for the study. Section II summarises the review of literature related to assessment of the

4
projected impact of climate change on the water sector and approaches to simulation modelling and assessment of impacts. Section III provides an analysis of climate characteristics that may impact the water sector and Section IV describes the Socioeconomic setting, vulnerabilities of and threats to the water sector. Section V presents the Analysis of climate for Water Sector Guidance. Section VI presents the results of the modelling in terms of the BAU, A2 and B2 scenarios. Section VII recommends adaptation and mitigation strategies and findings and recommendations are summarised in Section VIII.
5
II. LITERATURE REVIEW
A. APPROACHES TO MEASURING IMPACT OF CLIMATE CHANGE ON THE WATER SECTOR
1. Overview
The Fourth Assessment Report of the Intergovernmental Panel on Climate Change (IPCC), released in 2007, identified the water sector, along with agriculture, as being the ―most sensitive to climate change-induced impacts‖ (cited in Yanda and others, 2006, pp. 14). Bates and others (2008), in a 2008 IPCC technical paper, confirmed, inter alia, that:- (a) higher water temperatures are likely to affect water quality and exacerbate water pollution (p. 43), (b) increased precipitation variability are likely to increase the risks of flooding and drought (p. 56), (c) several gaps exist in knowledge related to climate change and water (p. 133), and (d) current water management practices may not cope with the impacts of climate change (p. 63). In the light of (c) and (d), particularly, Hansen and others (2009) and Mavromatis and Jones 1998) suggest that research into the risk that climate variability and change pose to water resources needs to be integrated into all related programmes and projects through:- (a) observations and analyses, (b) model simulations, (c) seasonal water outlooks, (d) climate scenario constructions, and (e) assessments of the hydrological sensitivity of catchments. The resulting improved understanding of long-term climate variability and change should (a) assist water management practices and productivity, (b) facilitate improved water supply systems, (c) maximise opportunities for sustainable ecosystem management, and (d) improve water resource management options and policy response (Gleick and others, 2000; Gleick and others, 2001; Ringler, 2008).
2. The Economic Valuation of Water
Water is a complex resource. The boundaries of the sector are unclear; it enters almost every economic and ecological good and process; the good is typically not priced in the market (often subsidized); and values are unstable (seasonal/spatial variation; ADB, 2010). The economic value of water (with or without climate change) is, therefore, not easy to establish (Rodgers 2010b). This, no doubt, compromises the reliability and validity of the projections for climate-change associated costs and benefits – the future status of the resource and its price (as determined by the interaction of demand and supply functions), a position solidified by Turner and others (2004). As IPCC reports and technical papers have only indicated the ‗likely‘ impact of climate change on water resources, it is clear that there exists a wide range of underlying uncertainties and risks. Despite this, researchers have coalesced around two key points, crucial for establishing a premise for the discussions contained herein:-
climate risks exacerbate the existing stresses on water resources due to rapid economic development, demographic changes, and associated increases in water demand (Bakker and van Schaik, 2010; Cashman and others, 2010; Rodgers, 2010b; ECLAC, 2010), and
the sustainability of water, irrigation and farming systems is dependent on climate variability and their future viability are threatened by climate change (Diaz and Morehouse, 2003; Yano and others, 2007; Chakanda and others, 2008; ECLAC, 2010).
3. Conceptual Framework for Impact Evaluation
Many of the studies aiming to evaluate and quantify the impact of climate change on specific resources such as water have failed to outline a conceptual framework for achieving their stated objectives that is
6
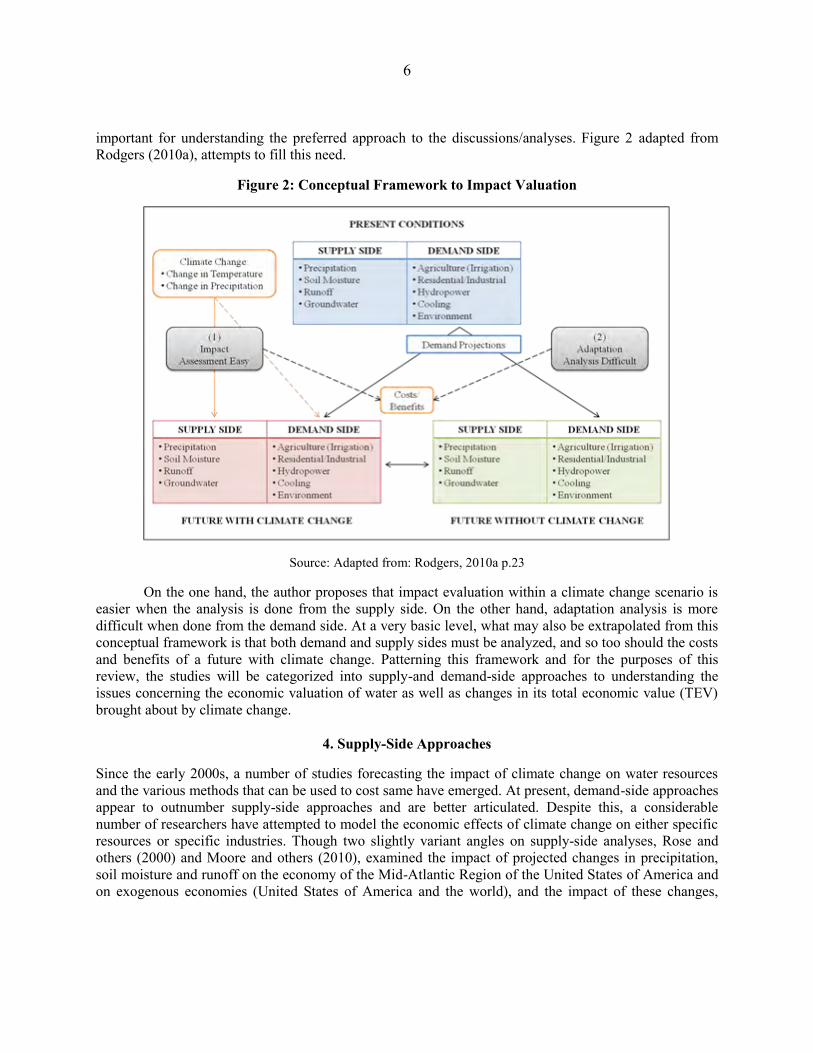
important for understanding the preferred approach to the discussions/analyses. Figure 2 adapted from Rodgers (2010a), attempts to fill this need.
Figure 2: Conceptual Framework to Impact Valuation
Source: Adapted from: Rodgers, 2010a p.23
On the one hand, the author proposes that impact evaluation within a climate change scenario is easier when the analysis is done from the supply side. On the other hand, adaptation analysis is more difficult when done from the demand side. At a very basic level, what may also be extrapolated from this conceptual framework is that both demand and supply sides must be analyzed, and so too should the costs and benefits of a future with climate change. Patterning this framework and for the purposes of this review, the studies will be categorized into supply-and demand-side approaches to understanding the issues concerning the economic valuation of water as well as changes in its total economic value (TEV) brought about by climate change.
4. Supply-Side Approaches
Since the early 2000s, a number of studies forecasting the impact of climate change on water resources and the various methods that can be used to cost same have emerged. At present, demand-side approaches appear to outnumber supply-side approaches and are better articulated. Despite this, a considerable number of researchers have attempted to model the economic effects of climate change on either specific resources or specific industries. Though two slightly variant angles on supply-side analyses, Rose and others (2000) and Moore and others (2010), examined the impact of projected changes in precipitation, soil moisture and runoff on the economy of the Mid-Atlantic Region of the United States of America and on exogenous economies (United States of America and the world), and the impact of these changes,
7
particularly sea level rise, on the profitability and viability of the tourism industry in Barbados, respectively.
North America: Based on the premise that: - (a) a translation of the physical impacts of climate change into dollars provides a convenient basis for comparison of impacts and a bottom-line unit of account, and (b) the ultimate welfare effects of the physical impacts of climate change depend on economic choices made from available response options, Rose and others (2000) provided models for analyzing how climate change will affect the economy of the Mid-Atlantic Region (MAR)1 of the US. Using input-output (I-O) models along with the Impact Analysis for Planning (IMPLAN) System2, the authors were able to generate intermediate inputs for sectors such as agriculture and forestry, mining and utilities (water and electricity) as well as derive demand functions for personal consumption, government, investment/inventory and exports.
Additionally, the authors calculated three types of impacts using the I-O models:- (1) demand-driven multiplier impacts (the standard I-O multipliers that measure upstream stimulus to the MAR economy through the chain of suppliers to each affected subsector), (2) supply-driven multiplier impacts (the downstream stimulus to the MAR economy through the chain of customers of each affected subsector), and (3) price impacts (the cost-push inflation for the MAR economy as a result of productivity losses in each affected sector) (Rose and others, 2000, pp. 180-181). The supply-driven analysis, over the demand-driven analysis, revealed larger direct impacts and more significant total impacts amounting to -US$150.1 million where most of the impacts affected the agriculture and forestry industries. The authors also highlighted the possibility of muting the supply-driven impacts while bringing attention to the fact that ―[it] may be difficult if other supplying regions are impacted by climate variability at a level equal to or greater than the MAR‖ (Rose and others, 2000, p. 181).
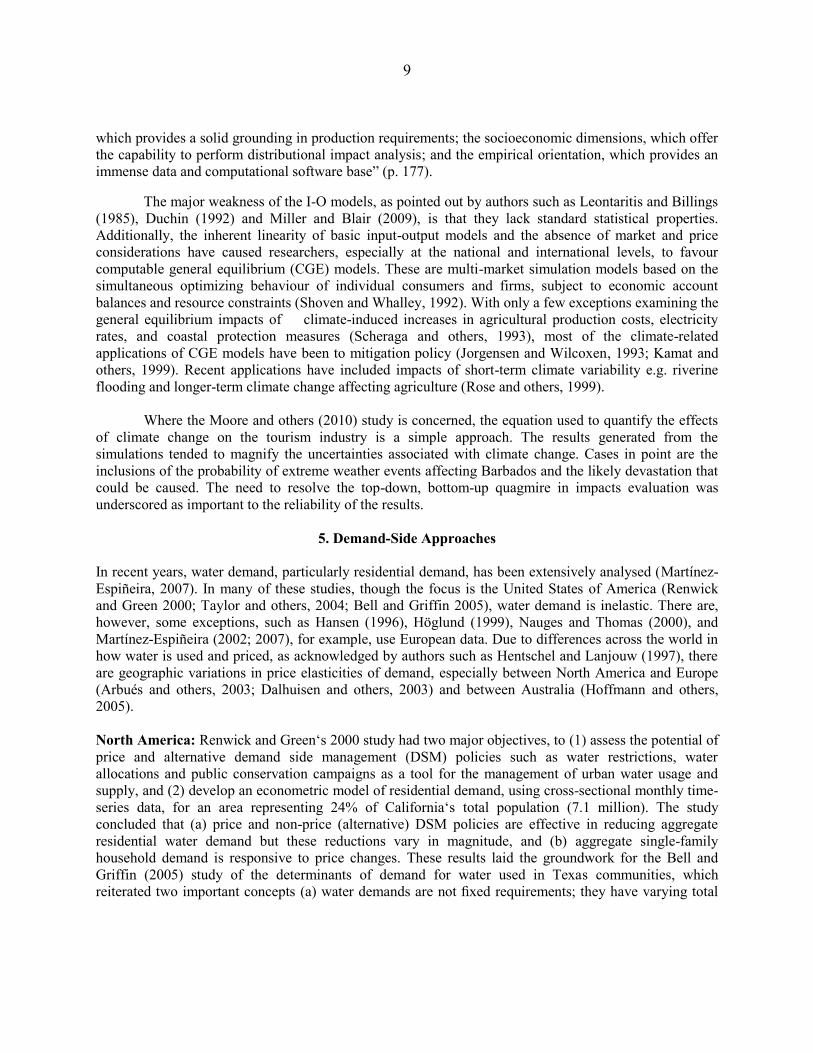
The Caribbean: Using data from one hundred and eighty one establishments, Moore and others (2010) examined the potential effects of climate change on the tourism industry in Barbados by generating supply-side simulations conducted particularly ―in relation to the impacts of rising sea levels and greater storm activity on the ability of the island to supply accommodation services‖ (p. 5). By way of the model captured in figure 3 and the equation given as figure 4, the authors were able to corroborate the general findings of Chandler (2004), which showed storms in North Carolina, United States of America, resulting in physical damages and loss revenues of between US$96-US$125 million to the lodgings industry between September and October 1999. Though disadvantaged by the limited availability of historical data on hurricanes impacting Barbados (p. 11), the study found that possible losses from future extreme climatic events would far outweigh the possible losses from potential sea level rise. When modest
1 The MAR includes states such as New York, New Jersey, Washington, D.C.
2 The IMPLAN System was developed by the US Forest Service of the Service, Federal Emergency Management
Agency, and several other federal government agencies. IMPLAN consists of an extensive national and regional
database, algorithms for generating non-survey I-O tables for any county or county grouping in the US, and
algorithms for performing impact analyses (IMPLAN 1997).
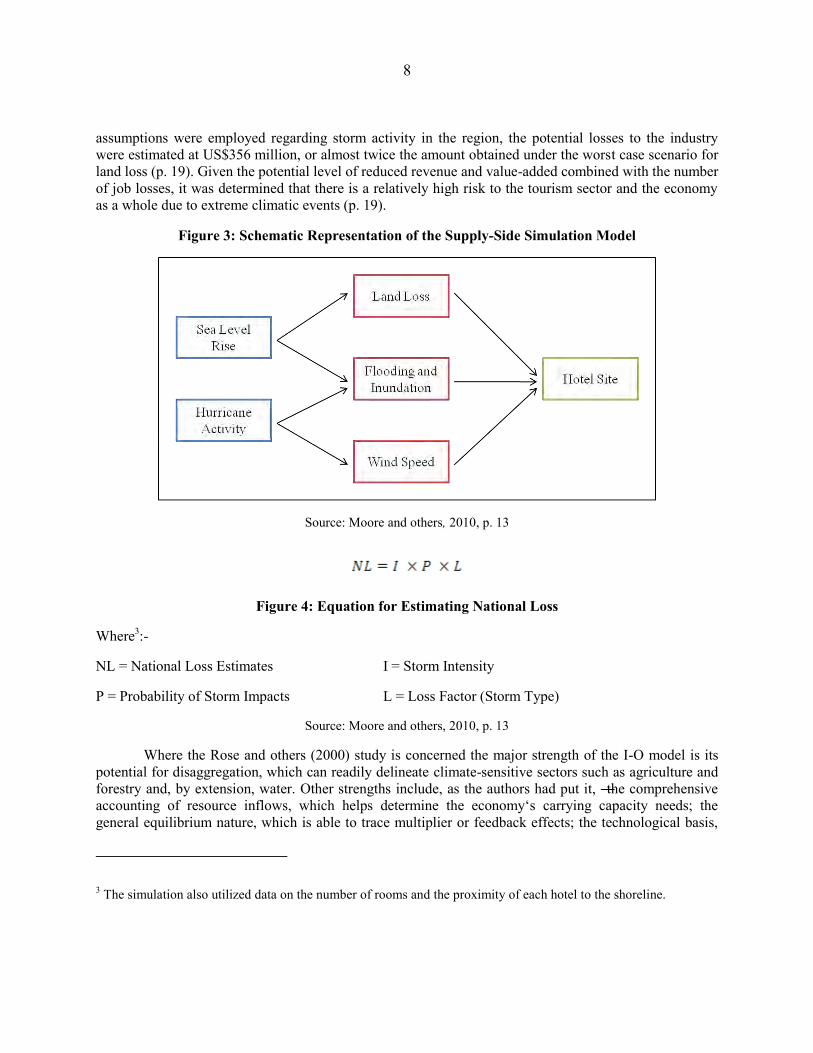
8
assumptions were employed regarding storm activity in the region, the potential losses to the industry were estimated at US$356 million, or almost twice the amount obtained under the worst case scenario for land loss (p. 19). Given the potential level of reduced revenue and value-added combined with the number of job losses, it was determined that there is a relatively high risk to the tourism sector and the economy as a whole due to extreme climatic events (p. 19).
Figure 3: Schematic Representation of the Supply-Side Simulation Model
Source: Moore and others, 2010, p. 13
Figure 4: Equation for Estimating National Loss
Where3:-
NL = National Loss Estimates I = Storm Intensity
P = Probability of Storm Impacts L = Loss Factor (Storm Type)
Source: Moore and others, 2010, p. 13
Where the Rose and others (2000) study is concerned the major strength of the I-O model is its potential for disaggregation, which can readily delineate climate-sensitive sectors such as agriculture and forestry and, by extension, water. Other strengths include, as the authors had put it, ―the comprehensive accounting of resource inflows, which helps determine the economy‘s carrying capacity needs; the general equilibrium nature, which is able to trace multiplier or feedback effects; the technological basis,
3 The simulation also utilized data on the number of rooms and the proximity of each hotel to the shoreline.
9
which provides a solid grounding in production requirements; the socioeconomic dimensions, which offer the capability to perform distributional impact analysis; and the empirical orientation, which provides an immense data and computational software base‖ (p. 177).
The major weakness of the I-O models, as pointed out by authors such as Leontaritis and Billings (1985), Duchin (1992) and Miller and Blair (2009), is that they lack standard statistical properties. Additionally, the inherent linearity of basic input-output models and the absence of market and price considerations have caused researchers, especially at the national and international levels, to favour computable general equilibrium (CGE) models. These are multi-market simulation models based on the simultaneous optimizing behaviour of individual consumers and firms, subject to economic account balances and resource constraints (Shoven and Whalley, 1992). With only a few exceptions examining the general equilibrium impacts of climate-induced increases in agricultural production costs, electricity rates, and coastal protection measures (Scheraga and others, 1993), most of the climate-related applications of CGE models have been to mitigation policy (Jorgensen and Wilcoxen, 1993; Kamat and others, 1999). Recent applications have included impacts of short-term climate variability e.g. riverine flooding and longer-term climate change affecting agriculture (Rose and others, 1999).
Where the Moore and others (2010) study is concerned, the equation used to quantify the effects
of climate change on the tourism industry is a simple approach. The results generated from the simulations tended to magnify the uncertainties associated with climate change. Cases in point are the inclusions of the probability of extreme weather events affecting Barbados and the likely devastation that could be caused. The need to resolve the top-down, bottom-up quagmire in impacts evaluation was underscored as important to the reliability of the results.
5. Demand-Side Approaches
In recent years, water demand, particularly residential demand, has been extensively analysed (Martínez-Espiñeira, 2007). In many of these studies, though the focus is the United States of America (Renwick and Green 2000; Taylor and others, 2004; Bell and Griffin 2005), water demand is inelastic. There are, however, some exceptions, such as Hansen (1996), Höglund (1999), Nauges and Thomas (2000), and Martínez-Espiñeira (2002; 2007), for example, use European data. Due to differences across the world in how water is used and priced, as acknowledged by authors such as Hentschel and Lanjouw (1997), there are geographic variations in price elasticities of demand, especially between North America and Europe (Arbués and others, 2003; Dalhuisen and others, 2003) and between Australia (Hoffmann and others, 2005). North America: Renwick and Green‘s 2000 study had two major objectives, to (1) assess the potential of price and alternative demand side management (DSM) policies such as water restrictions, water allocations and public conservation campaigns as a tool for the management of urban water usage and supply, and (2) develop an econometric model of residential demand, using cross-sectional monthly time-series data, for an area representing 24% of California‘s total population (7.1 million). The study concluded that (a) price and non-price (alternative) DSM policies are effective in reducing aggregate residential water demand but these reductions vary in magnitude, and (b) aggregate single-family household demand is responsive to price changes. These results laid the groundwork for the Bell and Griffin (2005) study of the determinants of demand for water used in Texas communities, which reiterated two important concepts (a) water demands are not fixed requirements; they have varying total
10
and marginal economic values (also Harou and others, 2009), and (b) price elasticity may not be constant from month to month, though constant price elasticity forms are common in water management models that include the computation of consumer surplus (Griffin, 1990; Jenkins and others, 2003).
Australia: Using linear and non-linear regression techniques, deriving descriptive statistics such as sample means, standard deviations, skewness, kurtosis and p-values, and using one dependent (quantity of water consumed) and four independent variables (for example, marginal price of water and household size), Hoffmann and others (2005) modelled household water demand with fixed volumetric charging in Brisbane between 1998 and 2004. The study resolved that:- (a) residential water supply is both price and income inelastic, (b) price inelasticity of demand is larger than previously thought, (c) price and income elasticity of demand in owner-occupied households is higher than in renter households (-0.681 and -0.509; 0.267 and 0.290, respectively), (d) factors exogenous to water authorities also have an influence on residential water demand, and (e) weather (especially the number of warm days) is likely to exert more influence on residential water consumption than any other factor subject to the usual demand management strategies.
Europe: Martínez-Espiñeira (2007), in modelling residential water consumption and demand in Seville, Spain, between 1991 and 1999, used co-integration and error correction techniques - unit root tests and time-series monthly data - the first of its kind in Europe. The dynamic properties of the series (e.g. water use) were analysed and found to be non-stationary. The study also found that:- (a) the estimates of the price effects obtained are less than one in absolute value, thus confirming the inelasticity of household demand with respect to the price of water, and (b) long-run price elasticity (estimated at -0.5) is greater in absolute terms than its short-run counterpart (estimated at -0.1).
The referencing of the above studies indicates that the trend in econometric approaches to estimate price-response and marginal benefits for the consumer is towards the use of cross-sectional data as well as time series and panel data (Arbués and others, 2003). The discussions in the literature have focused on which variables to include in the model in addition to water quantity and price, the best functional forms for statistical estimation, data, and magnitudes of the estimated price and income elasticities (Dalhuisen and others, 2003). There is no widespread support in the literature for the use of all the variables listed in each of the studies. The incorporation of household size, for example, a variable deemed statistically significant by Hoffmann and others (2005), has been critiqued elsewhere; Arbués and others (2000) found that water use is less than proportional to an increase in household size because of economies of scale in discretionary and nondiscretionary usage such as cooking and cleaning.
Other major challenges to econometric estimations of water price elasticity are the simultaneity problem posed by block-rate schedules, the level of disaggregation, dataset size, and the price specification (Harou and others, 2009; Young, 2005). Typical econometric applications include specifying a marginal price variable, a Taylor–Nordin difference variable (as was approach taken by Renwick and Green 2000, and Martínez-Espiñeira,, 2007), demographics, and climate data as regressors for water use (Griffin and Chang, 1991). Additionally, a number of indirect methods have been proposed to estimate economic costs of urban water scarcity based on optimization models that select the least-cost mix of residential water-saving techniques (Alcubilla and Lund, 2006; Rosenberg and others, 2007), to be achieved through contingent valuation surveys of willingness to pay in order to avoid shortages (Griffin and Mjelde, 2000).
11
Following the Martínez-Espiñeira (2007) study, the measure of the impact of pricing policies on the behaviour of households, depending on changes in tariff structures, remains an open area of research. What is evident is that the long-run effects of water pricing on water may need to be investigated using other datasets (also Rosenberg and others, 2007). The author even suggested a comparative approach using the different regions and longer time-series/panel data but was clear in recommending that water demand studies should be conducted on an individual level (i.e. country) with observations particularly linked to ownership (e.g. water as a public versus private good; owner-occupied versus renter households). This point is firmly corroborated by Bell and Griffin (2005) who reiterated that meta-analysis, while offering a hint of the potential properties of water demand, is no substitute for exacting studies.
B. TOWARDS SELECTING A MODEL
What is certain, though, is that any future study should aim to address a fundamental conundrum in the literature – the effectiveness of price relative to non-price controls. As would have been observed, a majority of the studies developing hydro-economic models in an effort to increase understanding of the inter-relationship between climate change and water resources, do not take into account the effect non-price controls such as water use restrictions and legislation. Additionally, Turner and others (2004) called on researchers engaged in evaluating the impacts of climate change on specific resources to pay special attention to: (a) geographic/temporal scale – the extent of the population affected and changes in direct use (both existing and potential), and the present value of costs and benefits, respectively,(b) aggregation and double counting, (c) allocation over time, (d) the impact of data limitations and/or budgetary constraints wherein the derived results should be understood in view of these (if any), (e) irreversible change, and (f) risk and uncertainty.
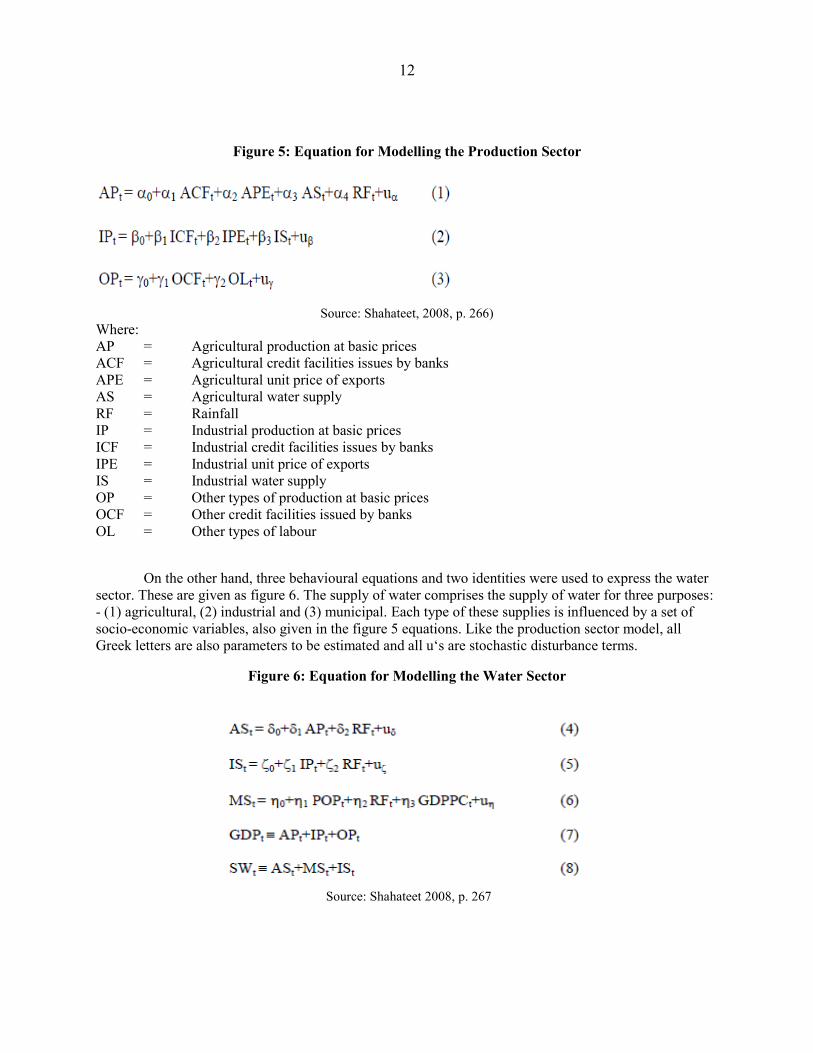
Particularly in respect of (d) and the data situation (i.e. shortage or inaccessibility) in the Caribbean, a model that takes this into consideration along with the financial woes experienced by governments may be better served. Shahateet (2008), in studying the water sector in Jordan, developed a model that took into account the country‘s increasing population size, declining rainfall, deepening shortage of supply and increasing demand for water, production of agricultural and industrial sectors, price of unit exports, and lack of financial resources, most of which are functions of climate change. The model comprised a system of equations that represents the production sector and the water sector, making it possible to conduct both supply-side and demand-side analyses. The author, on the one hand, used three behavioural equations to represent the production sector. These are given as figure 5. All Greek letters are parameters to be estimated and all u‘s are stochastic disturbance terms. Total production is divided into three categories (1) agricultural, (2) industrial, and (3) others. It is assumed that production in these sectors are greatly affected by the credit facilities that are extended by banks (and also government subventions as the case may be in the Caribbean) along with per unit price of agriculture exports, water supply to the sector, and quantity of rainfall (applicable only to the agriculture/forestry sectors).
12
Figure 5: Equation for Modelling the Production Sector
Source: Shahateet, 2008, p. 266)
Where: AP = Agricultural production at basic prices ACF = Agricultural credit facilities issues by banks APE = Agricultural unit price of exports AS = Agricultural water supply RF = Rainfall IP = Industrial production at basic prices ICF = Industrial credit facilities issues by banks IPE = Industrial unit price of exports IS = Industrial water supply OP = Other types of production at basic prices OCF = Other credit facilities issued by banks OL = Other types of labour
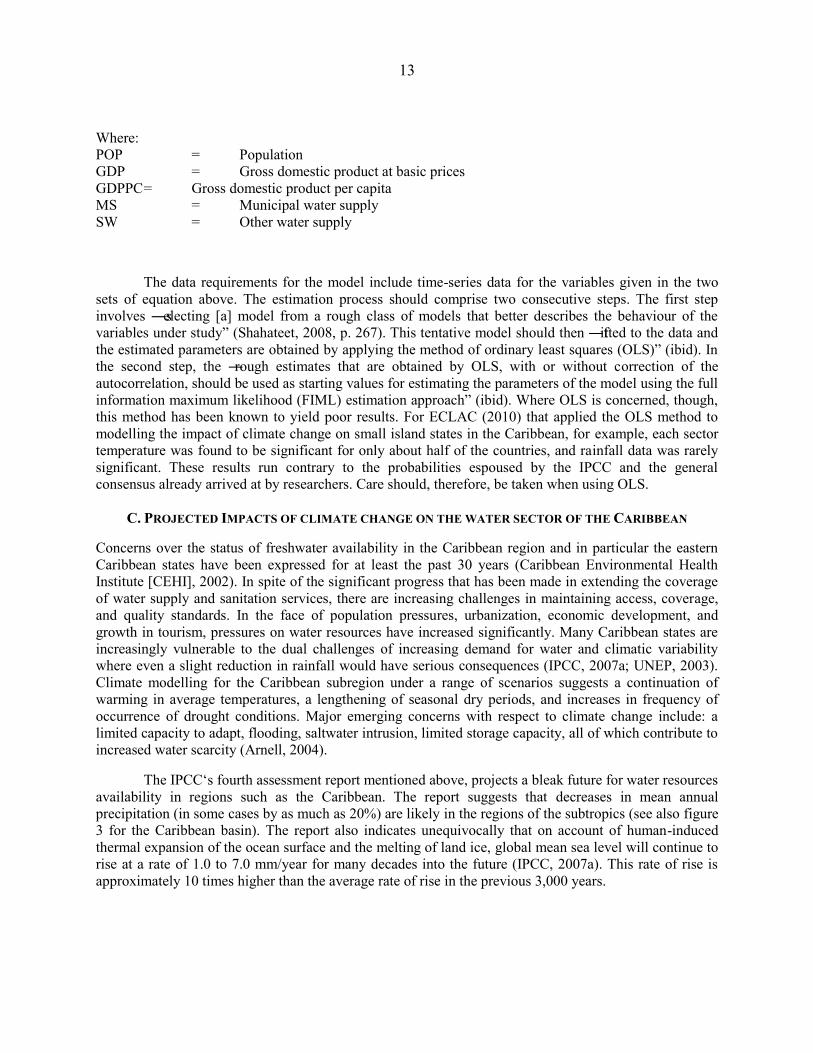
On the other hand, three behavioural equations and two identities were used to express the water sector. These are given as figure 6. The supply of water comprises the supply of water for three purposes: - (1) agricultural, (2) industrial and (3) municipal. Each type of these supplies is influenced by a set of socio-economic variables, also given in the figure 5 equations. Like the production sector model, all Greek letters are also parameters to be estimated and all u‘s are stochastic disturbance terms.
Figure 6: Equation for Modelling the Water Sector
Source: Shahateet 2008, p. 267
13
Where: POP = Population GDP = Gross domestic product at basic prices GDPPC = Gross domestic product per capita MS = Municipal water supply SW = Other water supply
The data requirements for the model include time-series data for the variables given in the two sets of equation above. The estimation process should comprise two consecutive steps. The first step involves ―selecting [a] model from a rough class of models that better describes the behaviour of the variables under study‖ (Shahateet, 2008, p. 267). This tentative model should then ―fitted to the data and the estimated parameters are obtained by applying the method of ordinary least squares (OLS)‖ (ibid). In the second step, the ―rough estimates that are obtained by OLS, with or without correction of the autocorrelation, should be used as starting values for estimating the parameters of the model using the full information maximum likelihood (FIML) estimation approach‖ (ibid). Where OLS is concerned, though, this method has been known to yield poor results. For ECLAC (2010) that applied the OLS method to modelling the impact of climate change on small island states in the Caribbean, for example, each sector temperature was found to be significant for only about half of the countries, and rainfall data was rarely significant. These results run contrary to the probabilities espoused by the IPCC and the general consensus already arrived at by researchers. Care should, therefore, be taken when using OLS.
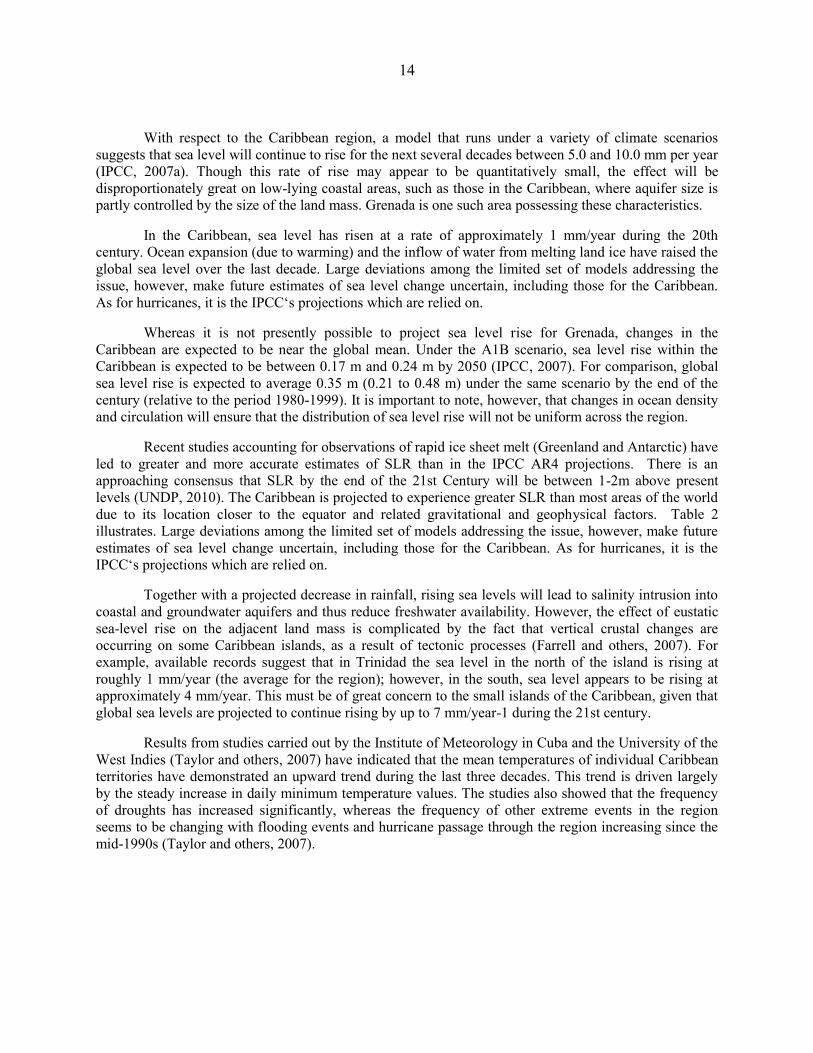
C. PROJECTED IMPACTS OF CLIMATE CHANGE ON THE WATER SECTOR OF THE CARIBBEAN
Concerns over the status of freshwater availability in the Caribbean region and in particular the eastern Caribbean states have been expressed for at least the past 30 years (Caribbean Environmental Health Institute [CEHI], 2002). In spite of the significant progress that has been made in extending the coverage of water supply and sanitation services, there are increasing challenges in maintaining access, coverage, and quality standards. In the face of population pressures, urbanization, economic development, and growth in tourism, pressures on water resources have increased significantly. Many Caribbean states are increasingly vulnerable to the dual challenges of increasing demand for water and climatic variability where even a slight reduction in rainfall would have serious consequences (IPCC, 2007a; UNEP, 2003). Climate modelling for the Caribbean subregion under a range of scenarios suggests a continuation of warming in average temperatures, a lengthening of seasonal dry periods, and increases in frequency of occurrence of drought conditions. Major emerging concerns with respect to climate change include: a limited capacity to adapt, flooding, saltwater intrusion, limited storage capacity, all of which contribute to increased water scarcity (Arnell, 2004).
The IPCC‘s fourth assessment report mentioned above, projects a bleak future for water resources availability in regions such as the Caribbean. The report suggests that decreases in mean annual precipitation (in some cases by as much as 20%) are likely in the regions of the subtropics (see also figure 3 for the Caribbean basin). The report also indicates unequivocally that on account of human-induced thermal expansion of the ocean surface and the melting of land ice, global mean sea level will continue to rise at a rate of 1.0 to 7.0 mm/year for many decades into the future (IPCC, 2007a). This rate of rise is approximately 10 times higher than the average rate of rise in the previous 3,000 years.
14
With respect to the Caribbean region, a model that runs under a variety of climate scenarios suggests that sea level will continue to rise for the next several decades between 5.0 and 10.0 mm per year (IPCC, 2007a). Though this rate of rise may appear to be quantitatively small, the effect will be disproportionately great on low-lying coastal areas, such as those in the Caribbean, where aquifer size is partly controlled by the size of the land mass. Grenada is one such area possessing these characteristics.
In the Caribbean, sea level has risen at a rate of approximately 1 mm/year during the 20th century. Ocean expansion (due to warming) and the inflow of water from melting land ice have raised the global sea level over the last decade. Large deviations among the limited set of models addressing the issue, however, make future estimates of sea level change uncertain, including those for the Caribbean. As for hurricanes, it is the IPCC‘s projections which are relied on.
Whereas it is not presently possible to project sea level rise for Grenada, changes in the Caribbean are expected to be near the global mean. Under the A1B scenario, sea level rise within the Caribbean is expected to be between 0.17 m and 0.24 m by 2050 (IPCC, 2007). For comparison, global sea level rise is expected to average 0.35 m (0.21 to 0.48 m) under the same scenario by the end of the century (relative to the period 1980-1999). It is important to note, however, that changes in ocean density and circulation will ensure that the distribution of sea level rise will not be uniform across the region.
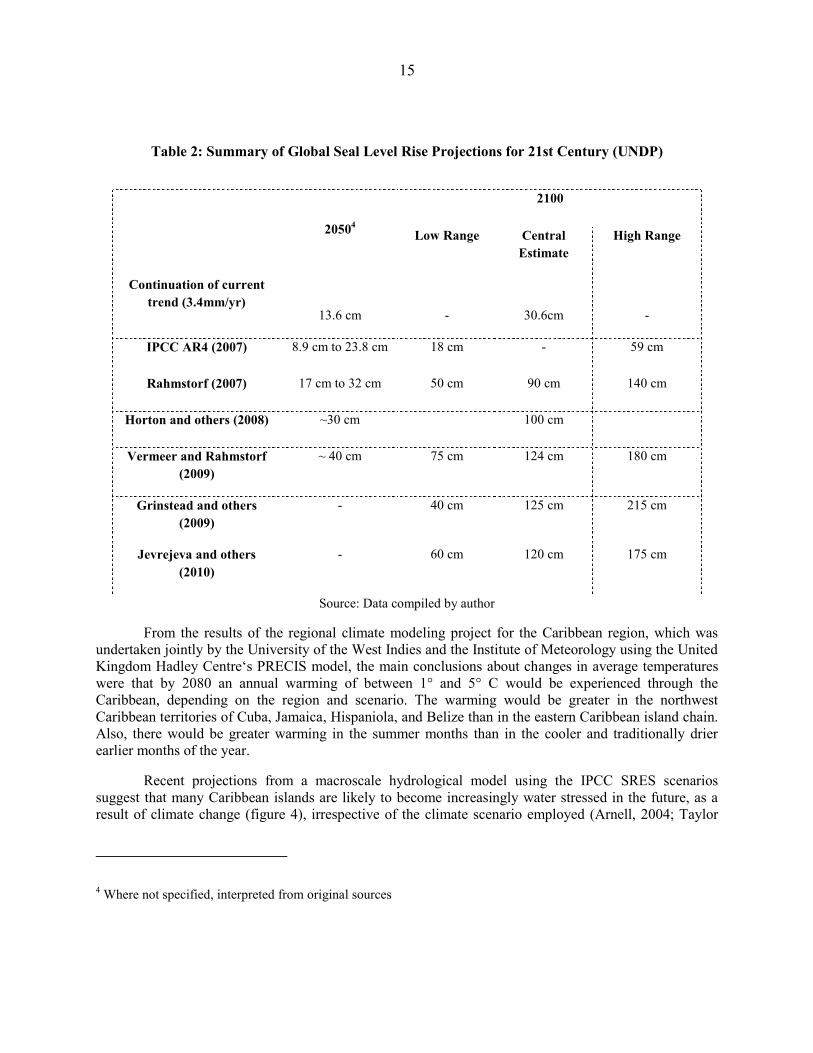
Recent studies accounting for observations of rapid ice sheet melt (Greenland and Antarctic) have led to greater and more accurate estimates of SLR than in the IPCC AR4 projections. There is an approaching consensus that SLR by the end of the 21st Century will be between 1-2m above present levels (UNDP, 2010). The Caribbean is projected to experience greater SLR than most areas of the world due to its location closer to the equator and related gravitational and geophysical factors. Table 2 illustrates. Large deviations among the limited set of models addressing the issue, however, make future estimates of sea level change uncertain, including those for the Caribbean. As for hurricanes, it is the IPCC‘s projections which are relied on.
Together with a projected decrease in rainfall, rising sea levels will lead to salinity intrusion into coastal and groundwater aquifers and thus reduce freshwater availability. However, the effect of eustatic sea-level rise on the adjacent land mass is complicated by the fact that vertical crustal changes are occurring on some Caribbean islands, as a result of tectonic processes (Farrell and others, 2007). For example, available records suggest that in Trinidad the sea level in the north of the island is rising at roughly 1 mm/year (the average for the region); however, in the south, sea level appears to be rising at approximately 4 mm/year. This must be of great concern to the small islands of the Caribbean, given that global sea levels are projected to continue rising by up to 7 mm/year-1 during the 21st century.
Results from studies carried out by the Institute of Meteorology in Cuba and the University of the West Indies (Taylor and others, 2007) have indicated that the mean temperatures of individual Caribbean territories have demonstrated an upward trend during the last three decades. This trend is driven largely by the steady increase in daily minimum temperature values. The studies also showed that the frequency of droughts has increased significantly, whereas the frequency of other extreme events in the region seems to be changing with flooding events and hurricane passage through the region increasing since the mid-1990s (Taylor and others, 2007).
15
Table 2: Summary of Global Seal Level Rise Projections for 21st Century (UNDP)
20504
2100
Low Range Central Estimate
High Range
Continuation of current trend (3.4mm/yr)
13.6 cm
-
30.6cm
-
IPCC AR4 (2007) 8.9 cm to 23.8 cm 18 cm - 59 cm
Rahmstorf (2007) 17 cm to 32 cm 50 cm 90 cm 140 cm
Horton and others (2008) ~30 cm 100 cm
Vermeer and Rahmstorf (2009)
~ 40 cm 75 cm 124 cm 180 cm
Grinstead and others (2009)
- 40 cm 125 cm 215 cm
Jevrejeva and others (2010)
- 60 cm 120 cm 175 cm
Source: Data compiled by author
From the results of the regional climate modeling project for the Caribbean region, which was undertaken jointly by the University of the West Indies and the Institute of Meteorology using the United Kingdom Hadley Centre‘s PRECIS model, the main conclusions about changes in average temperatures were that by 2080 an annual warming of between 1° and 5° C would be experienced through the Caribbean, depending on the region and scenario. The warming would be greater in the northwest Caribbean territories of Cuba, Jamaica, Hispaniola, and Belize than in the eastern Caribbean island chain. Also, there would be greater warming in the summer months than in the cooler and traditionally drier earlier months of the year.
Recent projections from a macroscale hydrological model using the IPCC SRES scenarios suggest that many Caribbean islands are likely to become increasingly water stressed in the future, as a result of climate change (figure 4), irrespective of the climate scenario employed (Arnell, 2004; Taylor
4 Where not specified, interpreted from original sources
16
and others, 2007). The A2 Scenario is based on a world of independently operating, self-reliant nations; continuously increasing population; regionally oriented economic development; and slower and more fragmented technological changes and improvements to per capita income. The B2 Scenario is based on assumptions of continuously increasing population, but at a slower rate than in A2; emphasis on local rather than global solutions to economic, social, and environmental stability; intermediate levels of economic development; and less rapid and fragmented technological changes. The A1B Scenario is based on the assumption of a balanced emphasis on all energy sources (IPCC, 2007a).
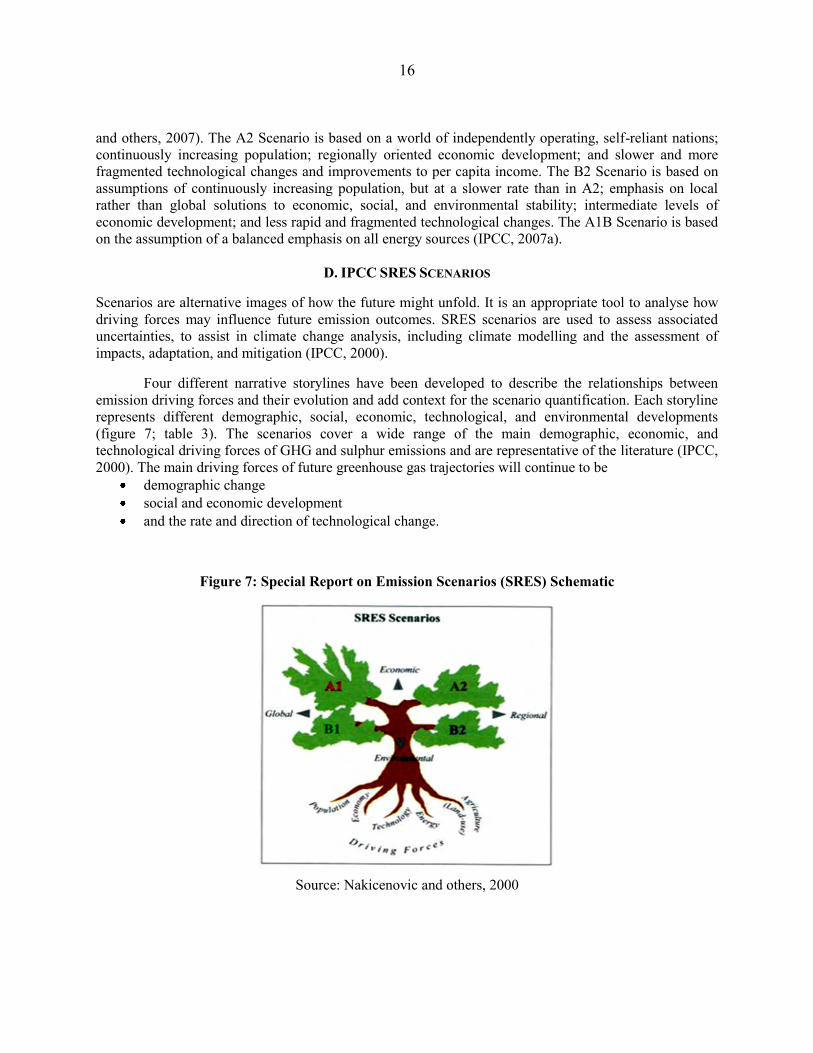
D. IPCC SRES SCENARIOS
Scenarios are alternative images of how the future might unfold. It is an appropriate tool to analyse how driving forces may influence future emission outcomes. SRES scenarios are used to assess associated uncertainties, to assist in climate change analysis, including climate modelling and the assessment of impacts, adaptation, and mitigation (IPCC, 2000).
Four different narrative storylines have been developed to describe the relationships between emission driving forces and their evolution and add context for the scenario quantification. Each storyline represents different demographic, social, economic, technological, and environmental developments (figure 7; table 3). The scenarios cover a wide range of the main demographic, economic, and technological driving forces of GHG and sulphur emissions and are representative of the literature (IPCC, 2000). The main driving forces of future greenhouse gas trajectories will continue to be
demographic change social and economic development and the rate and direction of technological change.
Figure 7: Special Report on Emission Scenarios (SRES) Schematic
Source: Nakicenovic and others, 2000
17
Monthly rainfall patterns for particular IPCC SRES scenarios have been derived using the PRECIS model (Cashman and others, 2010) (figures 8 and 9). The changes are shown as a percentage deviation from the mean monthly precipitation using the period between 1960 and 1999 as the baseline. The percentage deviations are shown in 10% intervals and are differentiated in the figures by increasing colour intensity; that is, the deeper the colour the greater the deviation from mean monthly precipitation (Cashman and others, 2010). The increasing intensity of blue indicates the projected percentage increase in monthly precipitation, mapped across the Caribbean Region, whereas an increasing intensity, from yellow to brown, indicates decreasing precipitation, mapped across the Caribbean region (Cashman and others, 2010).
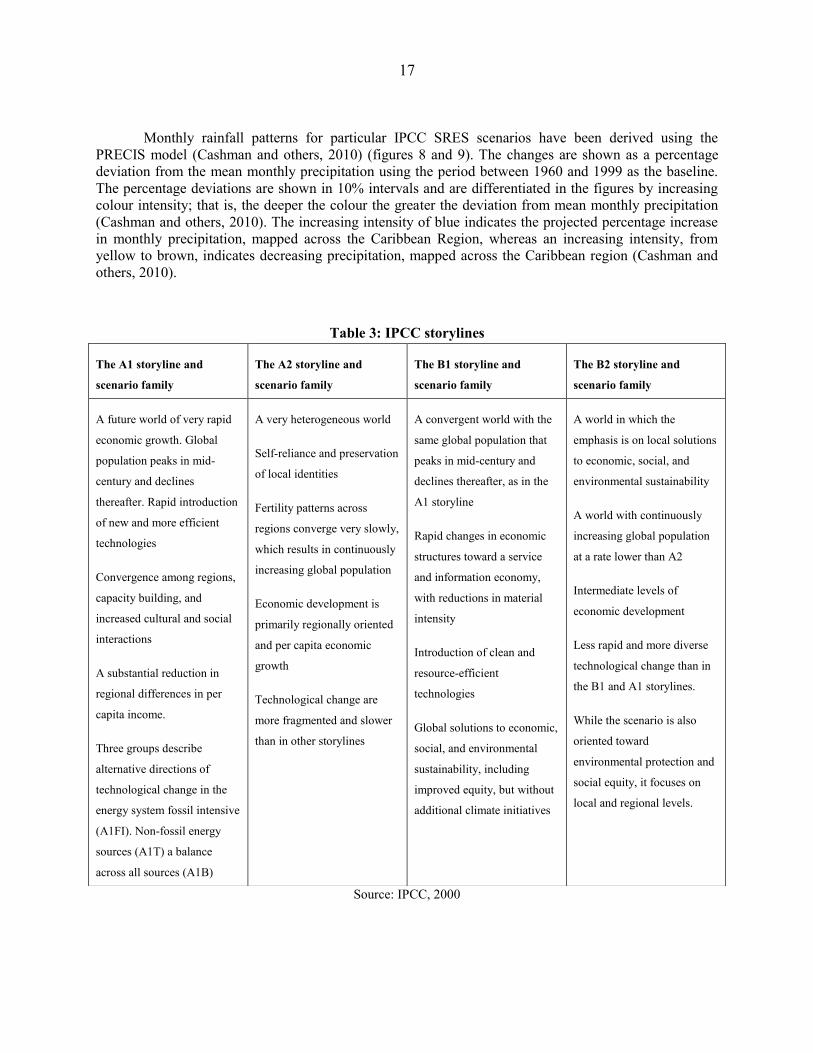
Table 3: IPCC storylines
Source: IPCC, 2000
The A1 storyline and
scenario family
The A2 storyline and
scenario family
The B1 storyline and
scenario family
The B2 storyline and
scenario family
A future world of very rapid
economic growth. Global
population peaks in mid-
century and declines
thereafter. Rapid introduction
of new and more efficient
technologies
Convergence among regions,
capacity building, and
increased cultural and social
interactions
A substantial reduction in
regional differences in per
capita income.
Three groups describe
alternative directions of
technological change in the
energy system fossil intensive
(A1FI). Non-fossil energy
sources (A1T) a balance
across all sources (A1B)
A very heterogeneous world
Self-reliance and preservation
of local identities
Fertility patterns across
regions converge very slowly,
which results in continuously
increasing global population
Economic development is
primarily regionally oriented
and per capita economic
growth
Technological change are
more fragmented and slower
than in other storylines
A convergent world with the
same global population that
peaks in mid-century and
declines thereafter, as in the
A1 storyline
Rapid changes in economic
structures toward a service
and information economy,
with reductions in material
intensity
Introduction of clean and
resource-efficient
technologies
Global solutions to economic,
social, and environmental
sustainability, including
improved equity, but without
additional climate initiatives
A world in which the
emphasis is on local solutions
to economic, social, and
environmental sustainability
A world with continuously
increasing global population
at a rate lower than A2
Intermediate levels of
economic development
Less rapid and more diverse
technological change than in
the B1 and A1 storylines.
While the scenario is also
oriented toward
environmental protection and
social equity, it focuses on
local and regional levels.
18
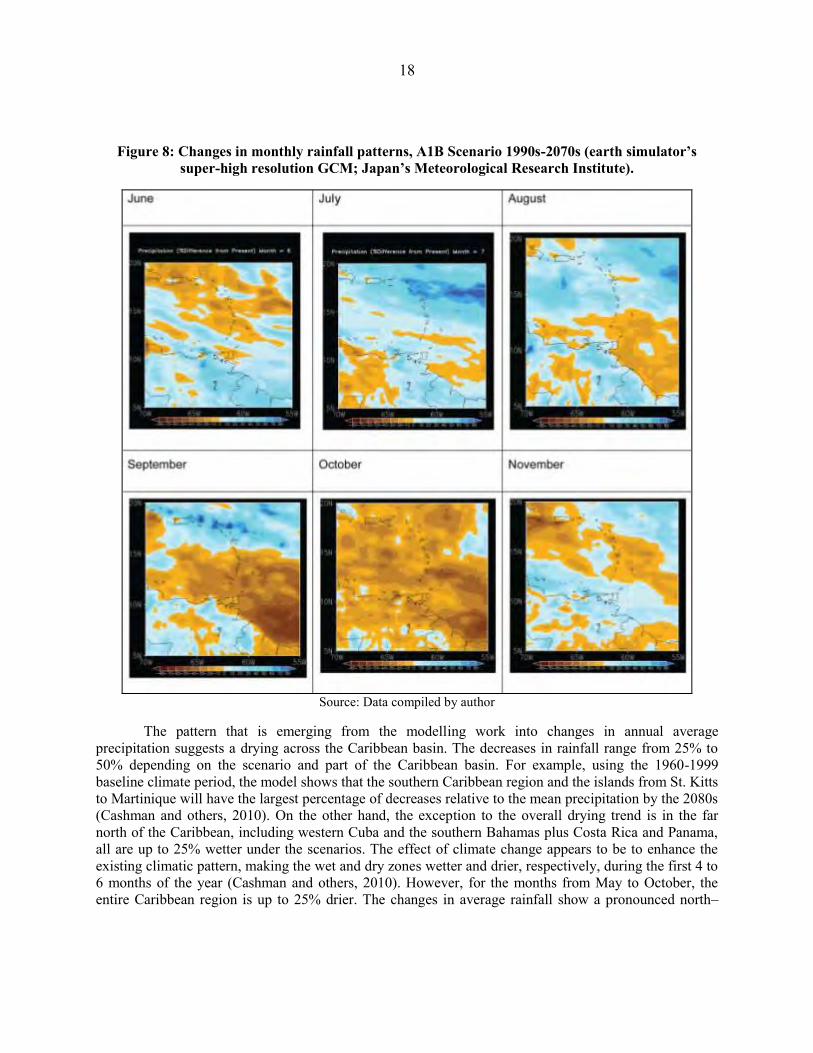
Figure 8: Changes in monthly rainfall patterns, A1B Scenario 1990s-2070s (earth simulator’s super-high resolution GCM; Japan’s Meteorological Research Institute).
Source: Data compiled by author
The pattern that is emerging from the modelling work into changes in annual average precipitation suggests a drying across the Caribbean basin. The decreases in rainfall range from 25% to 50% depending on the scenario and part of the Caribbean basin. For example, using the 1960-1999 baseline climate period, the model shows that the southern Caribbean region and the islands from St. Kitts to Martinique will have the largest percentage of decreases relative to the mean precipitation by the 2080s (Cashman and others, 2010). On the other hand, the exception to the overall drying trend is in the far north of the Caribbean, including western Cuba and the southern Bahamas plus Costa Rica and Panama, all are up to 25% wetter under the scenarios. The effect of climate change appears to be to enhance the existing climatic pattern, making the wet and dry zones wetter and drier, respectively, during the first 4 to 6 months of the year (Cashman and others, 2010). However, for the months from May to October, the entire Caribbean region is up to 25% drier. The changes in average rainfall show a pronounced north–
19
south gradient in rainfall change during the January-to-April dry season, whereas the summer drying is set to become more severe during the wet season (Taylor and others, 2007).
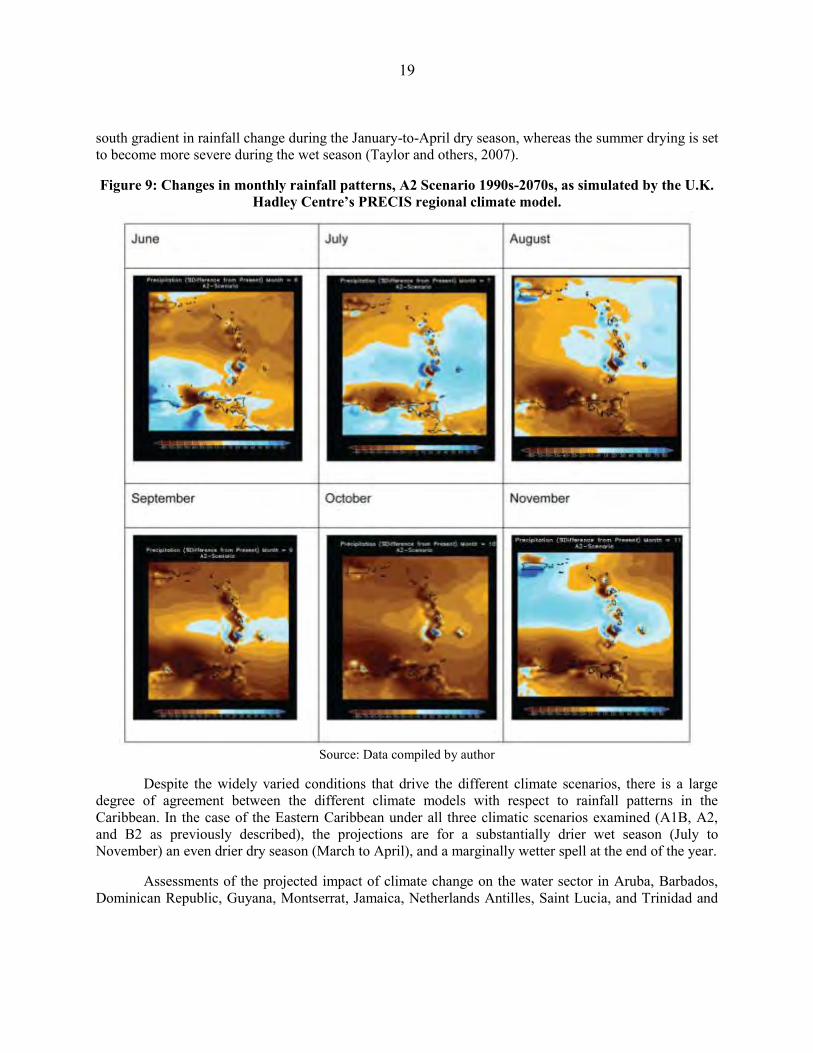
Figure 9: Changes in monthly rainfall patterns, A2 Scenario 1990s-2070s, as simulated by the U.K. Hadley Centre’s PRECIS regional climate model.
Source: Data compiled by author
Despite the widely varied conditions that drive the different climate scenarios, there is a large degree of agreement between the different climate models with respect to rainfall patterns in the Caribbean. In the case of the Eastern Caribbean under all three climatic scenarios examined (A1B, A2, and B2 as previously described), the projections are for a substantially drier wet season (July to November) an even drier dry season (March to April), and a marginally wetter spell at the end of the year.
Assessments of the projected impact of climate change on the water sector in Aruba, Barbados, Dominican Republic, Guyana, Montserrat, Jamaica, Netherlands Antilles, Saint Lucia, and Trinidad and
20
Tobago were pursued (LC/CAR/L.260; ECLAC, 2011) . The studies reviewed the effects of the BAU, A2 and B2 scenarios. The general finding was that climate change will affect all countries, and that relative to 2006, water demand will decline up to 2030, but will again increase reaching a projected level by 2100 of five times the 2006 figure. However, it was noted that unavailability of time series data constrained the analyses, and the use of proxies which did not fully match the respective country led to outcomes that were not as robust as they could be.
III. ANALYSIS OF CLIMATE FOR GUIDANCE TO THE WATER
SECTOR
A. EXISTING CLIMATE VARIABLES
1. Rainfall
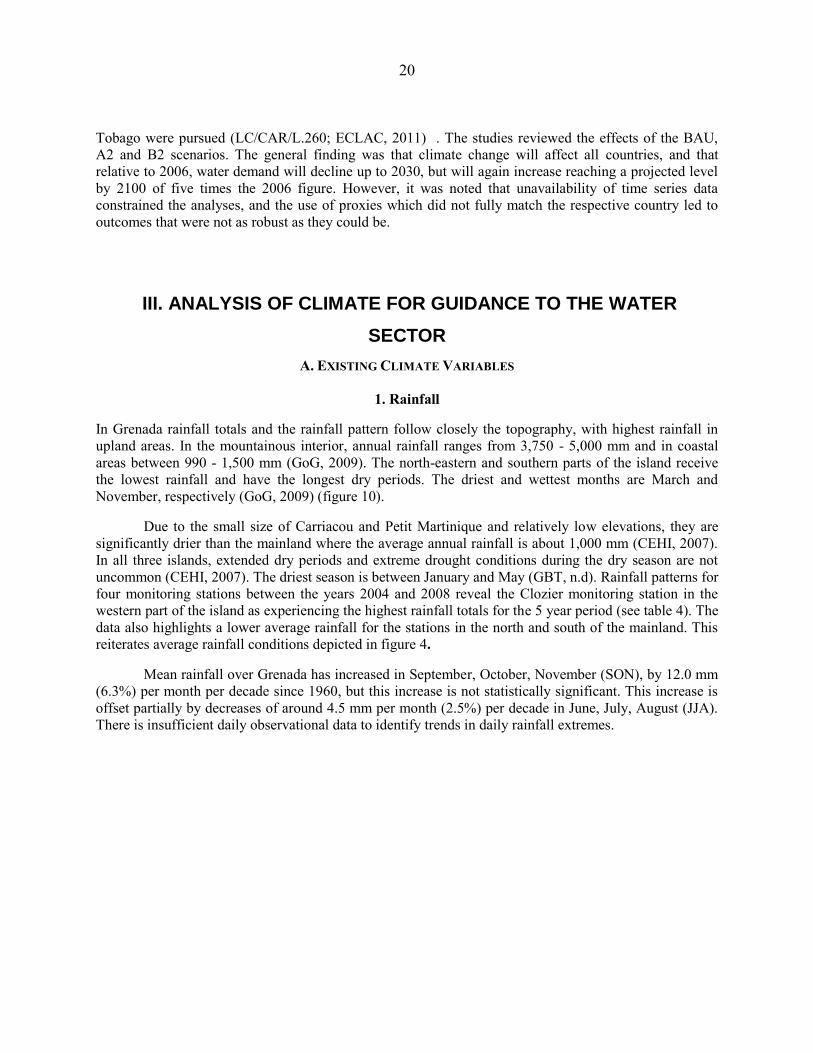
In Grenada rainfall totals and the rainfall pattern follow closely the topography, with highest rainfall in upland areas. In the mountainous interior, annual rainfall ranges from 3,750 - 5,000 mm and in coastal areas between 990 - 1,500 mm (GoG, 2009). The north-eastern and southern parts of the island receive the lowest rainfall and have the longest dry periods. The driest and wettest months are March and November, respectively (GoG, 2009) (figure 10).
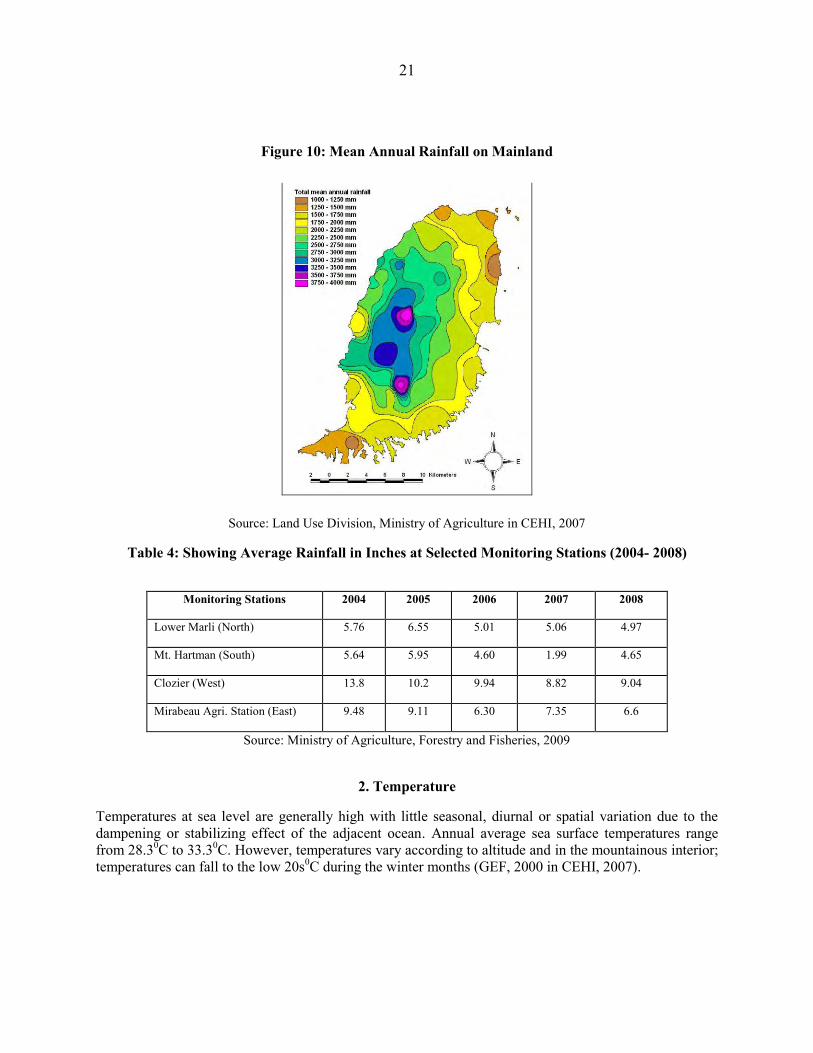
Due to the small size of Carriacou and Petit Martinique and relatively low elevations, they are significantly drier than the mainland where the average annual rainfall is about 1,000 mm (CEHI, 2007). In all three islands, extended dry periods and extreme drought conditions during the dry season are not uncommon (CEHI, 2007). The driest season is between January and May (GBT, n.d). Rainfall patterns for four monitoring stations between the years 2004 and 2008 reveal the Clozier monitoring station in the western part of the island as experiencing the highest rainfall totals for the 5 year period (see table 4). The data also highlights a lower average rainfall for the stations in the north and south of the mainland. This reiterates average rainfall conditions depicted in figure 4.
Mean rainfall over Grenada has increased in September, October, November (SON), by 12.0 mm (6.3%) per month per decade since 1960, but this increase is not statistically significant. This increase is offset partially by decreases of around 4.5 mm per month (2.5%) per decade in June, July, August (JJA). There is insufficient daily observational data to identify trends in daily rainfall extremes.
21
Figure 10: Mean Annual Rainfall on Mainland
Source: Land Use Division, Ministry of Agriculture in CEHI, 2007
Table 4: Showing Average Rainfall in Inches at Selected Monitoring Stations (2004- 2008)
Monitoring Stations 2004 2005 2006 2007 2008
Lower Marli (North) 5.76 6.55 5.01 5.06 4.97
Mt. Hartman (South) 5.64 5.95 4.60 1.99 4.65
Clozier (West) 13.8 10.2 9.94 8.82 9.04
Mirabeau Agri. Station (East) 9.48 9.11 6.30 7.35 6.6
Source: Ministry of Agriculture, Forestry and Fisheries, 2009
2. Temperature
Temperatures at sea level are generally high with little seasonal, diurnal or spatial variation due to the dampening or stabilizing effect of the adjacent ocean. Annual average sea surface temperatures range from 28.30C to 33.30C. However, temperatures vary according to altitude and in the mountainous interior; temperatures can fall to the low 20s0C during the winter months (GEF, 2000 in CEHI, 2007).
22
Average temperatures generally range from 750F to 850F (240C to 300C), tempered by the steady and cooling trade winds. The lowest temperatures occur between November and February.
Mean annual temperature in Grenada has increased by around 0.60C since 1960; at an average rate of 0.140C per decade. There is insufficient daily observational data to identify trends in daily temperature extremes and temperatures are the variables described below.
B. CLIMATE CHANGE AND GRENADA
The Climate change discussion for Grenada takes account of the UNDP Climate Change Country Profiles which were funded jointly by the National Communications Support Program (NCSP) and the UK Department for International Development (DFID). The intent was to address the climate change information gap in several developing countries by making use of existing climate data to generate country-level data plots from the most up-to-date climate observations and the multi-model projections from the WCRP CMIP3 archive. The results of Grenada‘s climate change profile (McSweeny and others, undated) for temperature and rainfall are presented below.
1. Temperature
The mean annual temperature is projected to increase by 0.7 to 2.60C by the 2060s, and 1.1 to 4.3 degrees by the 2090s. The range of projections by the 2090s under any one emission scenario is around 1-20C. The projected rate of warming is similar throughout the year.
All projections indicate substantial increases in the frequency of days and nights that are considered ‗hot‘ in current climate. Annual projections indicate that ‗hot‘ days will occur on 33-66% of days by the 2060s, and 41-89% of days by the 2090s. Days considered ‗hot‘ by current climate standards for their season are projected to increase most rapidly in December, January, February (DJF) and SON.
Nights that are considered ‗hot‘ for the annual climate of 1970-99 are projected to increase in frequency more rapidly than hot days, occurring on 33-83% of nights by the 2060s and 41-99% of nights by the 2090s. Nights that are hot for each season are projected to increase most rapidly in DJF and SON, occurring on 67-100% of nights in every season by the 2090s. All projections indicate decreases in the frequency of days and nights that are considered ‗cold‘ in current climate.
2. Rainfall
Projections of mean annual rainfall from different models in the ensemble are broadly consistent in indicating decreases in rainfall for Grenada. Annual projections vary between 61% and 23% by the 2090s, with median changes of 13% to 21%. The proportion of total rainfall that falls in heavy events decreases in most model projections, changing by 20% to 7% by the 2090s. The models project decrease in maximum 5-day rainfalls.
3. Sea-Level Rise
Ocean expansion due to warming and the inflow of water from melting glaciers have contributed to rising sea level globally, particularly over the last several decades. Whereas it is not presently possible to accurately project sea level rise for Grenada, changes in the Caribbean are expected to be near the global
23
mean. Under the A1B scenario, sea level rise within the Caribbean was expected to be between 0.17 m and 0.24 m by 2050 (IPCC 2007). For comparison, global sea level rise is expected to average 0.35 m (0.21 to 0.48 m) under the same scenario by the end of the century (relative to the period 1980 to 1999). It is important to note, however, that distribution of sea level rise will not be uniform across the region.
Recent studies accounting for observations of rapid ice sheet melt (Greenland and Antarctic) have led to greater and more accurate estimates of SLR than in the IPCC AR4 projections. There is an approaching consensus that SLR by the end of the 21st Century will be between 1-2m above present levels (UNDP, 2010). The Caribbean is projected to experience greater SLR than most areas of the world due to its location closer to the equator and related gravitational and geophysical factors. Saltwater intrusion from sea level rise would reduce the available groundwater on the main island of Grenada (GoG, 2000). Most of the groundwater deposits are within 1 km of the coast (GoG, 2000). In Carriacou and Petit Martinique, where the 27 major open wells are within 100 m of the shoreline, high salinity would lead to abandonment of these traditional wells (GoG, 2000).
Groundwater modeling is required to better interpret potential change in the resource. At present groundwater behaviour is not clearly understood (GoG, 2000). There has been some discussion as to whether movement inland of the salt- fresh water interface from rising sea level would push the fresh water lens closer to the surface and be beneficial to the groundwater resource (GoG, 2000). The other position is that saltwater intrusion would reduce the quality of the present wells and would make those wells in Petite Carenage and Windward, where the water is of a higher salinity, generally unusable (GoG, 2000).
4. Climate Variability
Inter-annual variability in the climate of the southern Caribbean is strongly influenced strongly by the El Nino Southern Oscillation (ENSO) through its influence on sea surface temperatures in the Atlantic and the Caribbean. El Niño episodes bring warmer and drier than average conditions during the late wet season, and La Niña episodes bring colder and wetter conditions at this time.
Grenada lies on what used to be regarded as the southern edge of the Atlantic hurricane belt, so the islands were not affected as frequently as other territories further north. However, recent experience has seen hurricanes tending to move from across the Caribbean from farther south. In the last decade Grenada had hurricane strikes in two consecutive years – 2004 and 2005. All models show continued ENSO inter-annual variability in the future. However there is no consistent indication of discernible changes in projected ENSO amplitude and frequency in the 21st century (IPCC, 2007).
5. Extreme Events
An increase in the frequency of extreme events may also be experienced over the next century, although some climate scientists have indicated insufficient evidence to establish a direct causal effect of climate change on hurricanes. It is predicted that by the year 2100, there will be a 5% to 10 % increase in the wind speeds of tropical storms worldwide for a Sea Surface Temperature increase of 2.20C (Knutson and others, 1998 in GoG, 2000). These projected changes are expected to be updated in time, with improvements in models and increased understanding of the science (GoG, 2000).
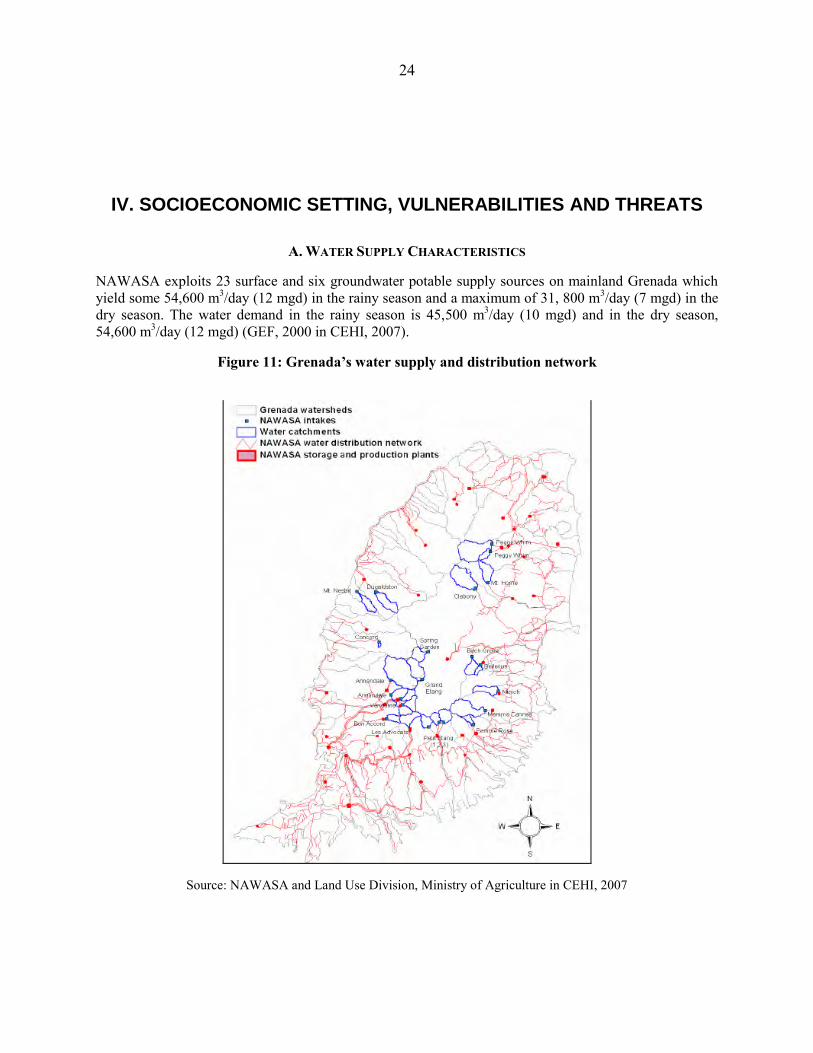
24
IV. SOCIOECONOMIC SETTING, VULNERABILITIES AND THREATS
A. WATER SUPPLY CHARACTERISTICS
NAWASA exploits 23 surface and six groundwater potable supply sources on mainland Grenada which yield some 54,600 m3/day (12 mgd) in the rainy season and a maximum of 31, 800 m3/day (7 mgd) in the dry season. The water demand in the rainy season is 45,500 m3/day (10 mgd) and in the dry season, 54,600 m3/day (12 mgd) (GEF, 2000 in CEHI, 2007).
Figure 11: Grenada’s water supply and distribution network
Source: NAWASA and Land Use Division, Ministry of Agriculture in CEHI, 2007
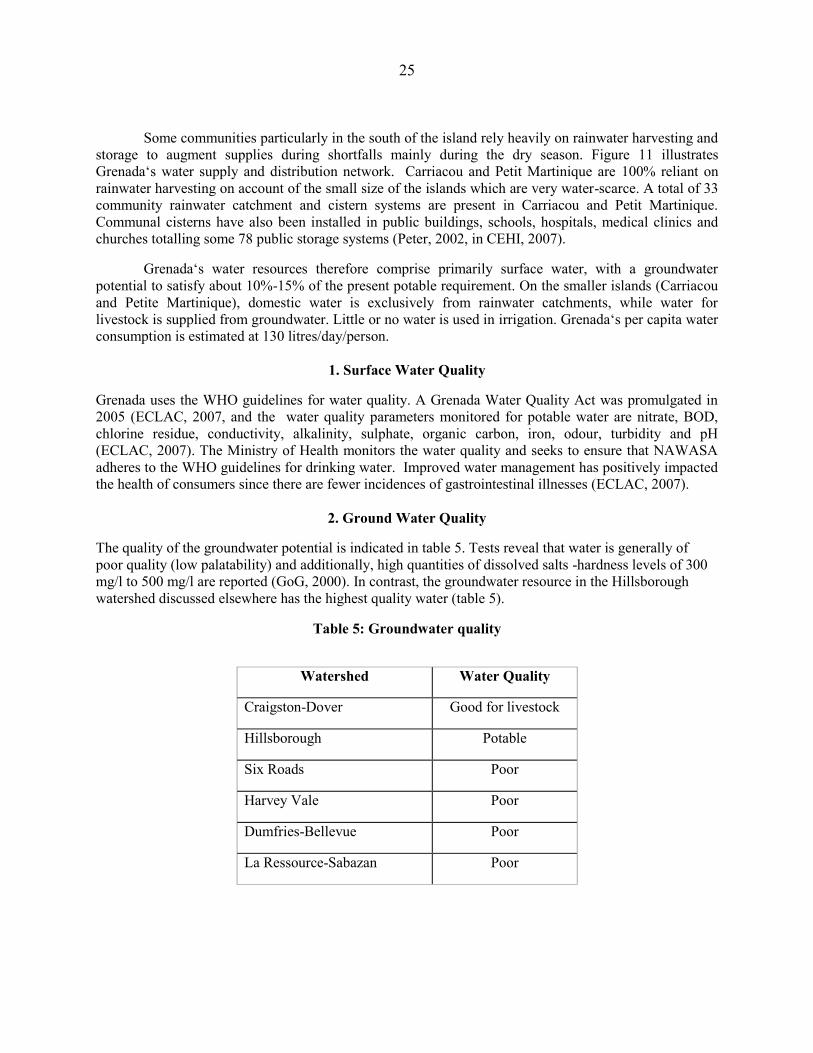
25
Some communities particularly in the south of the island rely heavily on rainwater harvesting and storage to augment supplies during shortfalls mainly during the dry season. Figure 11 illustrates Grenada‘s water supply and distribution network. Carriacou and Petit Martinique are 100% reliant on rainwater harvesting on account of the small size of the islands which are very water-scarce. A total of 33 community rainwater catchment and cistern systems are present in Carriacou and Petit Martinique. Communal cisterns have also been installed in public buildings, schools, hospitals, medical clinics and churches totalling some 78 public storage systems (Peter, 2002, in CEHI, 2007).
Grenada‘s water resources therefore comprise primarily surface water, with a groundwater potential to satisfy about 10%-15% of the present potable requirement. On the smaller islands (Carriacou and Petite Martinique), domestic water is exclusively from rainwater catchments, while water for livestock is supplied from groundwater. Little or no water is used in irrigation. Grenada‘s per capita water consumption is estimated at 130 litres/day/person.
1. Surface Water Quality
Grenada uses the WHO guidelines for water quality. A Grenada Water Quality Act was promulgated in 2005 (ECLAC, 2007, and the water quality parameters monitored for potable water are nitrate, BOD, chlorine residue, conductivity, alkalinity, sulphate, organic carbon, iron, odour, turbidity and pH (ECLAC, 2007). The Ministry of Health monitors the water quality and seeks to ensure that NAWASA adheres to the WHO guidelines for drinking water. Improved water management has positively impacted the health of consumers since there are fewer incidences of gastrointestinal illnesses (ECLAC, 2007).
2. Ground Water Quality
The quality of the groundwater potential is indicated in table 5. Tests reveal that water is generally of poor quality (low palatability) and additionally, high quantities of dissolved salts -hardness levels of 300 mg/l to 500 mg/l are reported (GoG, 2000). In contrast, the groundwater resource in the Hillsborough watershed discussed elsewhere has the highest quality water (table 5).
Table 5: Groundwater quality
Watershed Water Quality
Craigston-Dover Good for livestock
Hillsborough Potable
Six Roads Poor
Harvey Vale Poor
Dumfries-Bellevue Poor
La Ressource-Sabazan Poor
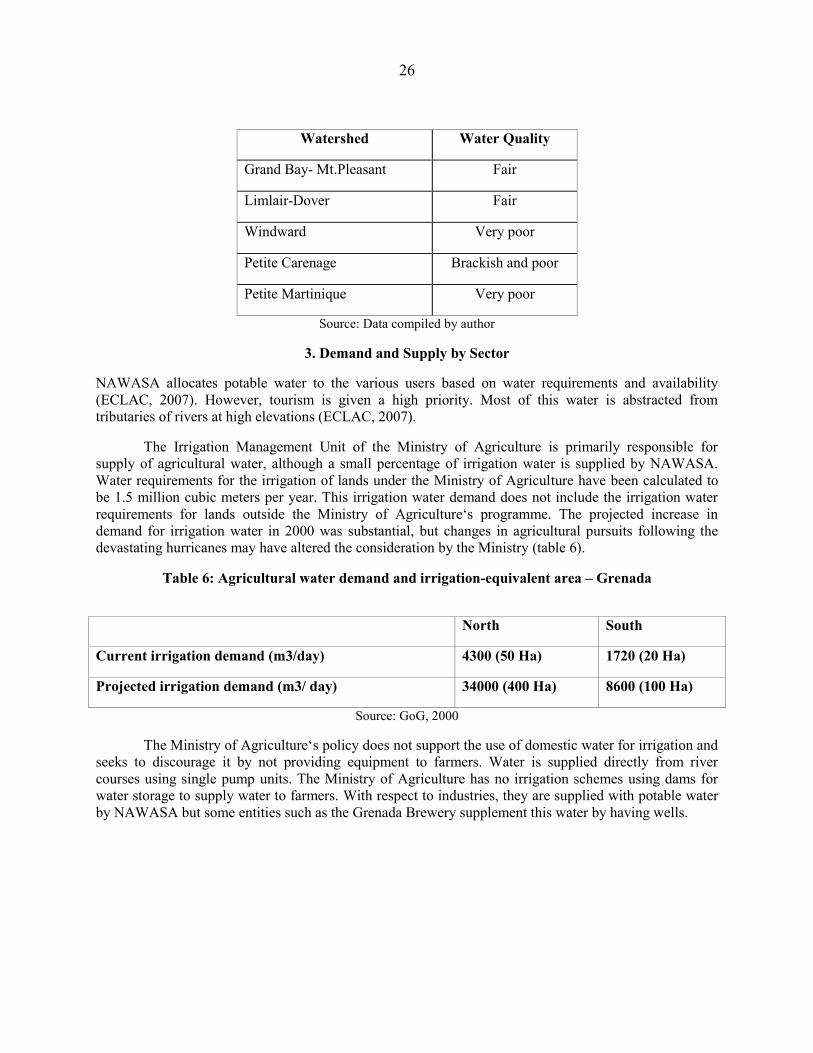
26
Watershed Water Quality
Grand Bay- Mt.Pleasant Fair
Limlair-Dover Fair
Windward Very poor
Petite Carenage Brackish and poor
Petite Martinique Very poor
Source: Data compiled by author
3. Demand and Supply by Sector
NAWASA allocates potable water to the various users based on water requirements and availability (ECLAC, 2007). However, tourism is given a high priority. Most of this water is abstracted from tributaries of rivers at high elevations (ECLAC, 2007).
The Irrigation Management Unit of the Ministry of Agriculture is primarily responsible for supply of agricultural water, although a small percentage of irrigation water is supplied by NAWASA. Water requirements for the irrigation of lands under the Ministry of Agriculture have been calculated to be 1.5 million cubic meters per year. This irrigation water demand does not include the irrigation water requirements for lands outside the Ministry of Agriculture‘s programme. The projected increase in demand for irrigation water in 2000 was substantial, but changes in agricultural pursuits following the devastating hurricanes may have altered the consideration by the Ministry (table 6).
Table 6: Agricultural water demand and irrigation-equivalent area – Grenada
North South
Current irrigation demand (m3/day) 4300 (50 Ha) 1720 (20 Ha)
Projected irrigation demand (m3/ day) 34000 (400 Ha) 8600 (100 Ha)
Source: GoG, 2000
The Ministry of Agriculture‘s policy does not support the use of domestic water for irrigation and seeks to discourage it by not providing equipment to farmers. Water is supplied directly from river courses using single pump units. The Ministry of Agriculture has no irrigation schemes using dams for water storage to supply water to farmers. With respect to industries, they are supplied with potable water by NAWASA but some entities such as the Grenada Brewery supplement this water by having wells.
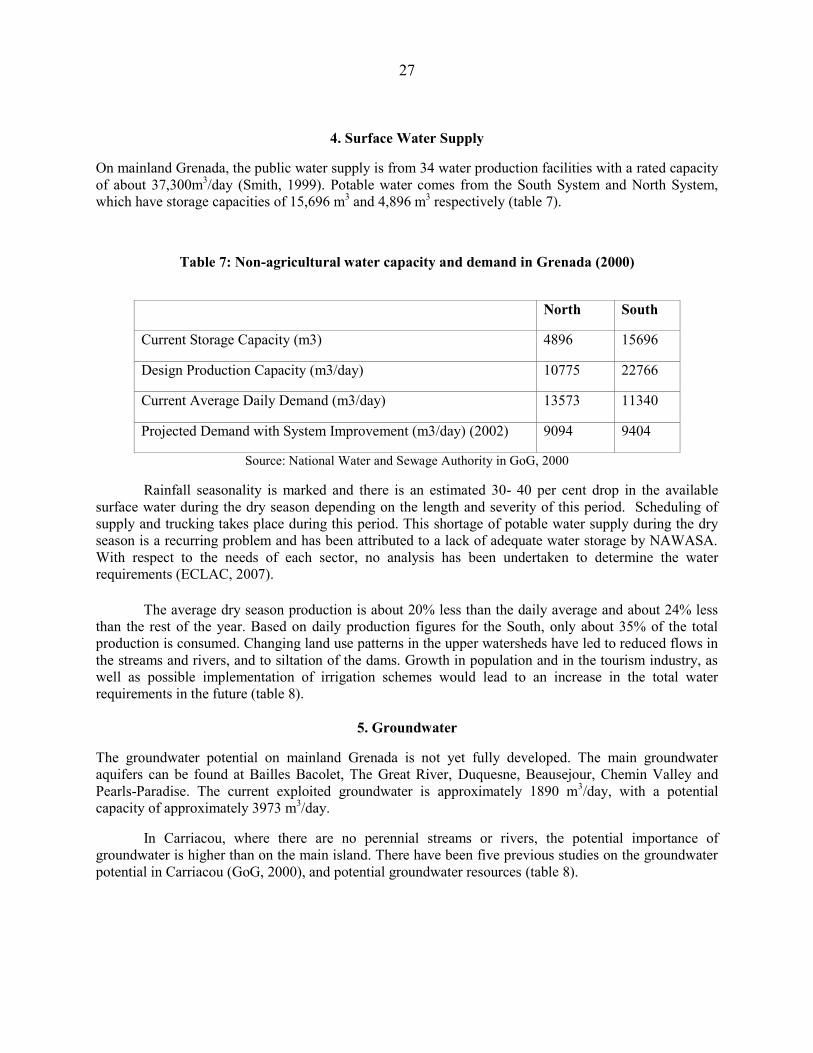
27
4. Surface Water Supply
On mainland Grenada, the public water supply is from 34 water production facilities with a rated capacity of about 37,300m3/day (Smith, 1999). Potable water comes from the South System and North System, which have storage capacities of 15,696 m3 and 4,896 m3 respectively (table 7).
Table 7: Non-agricultural water capacity and demand in Grenada (2000)
North South
Current Storage Capacity (m3) 4896 15696
Design Production Capacity (m3/day) 10775 22766
Current Average Daily Demand (m3/day) 13573 11340
Projected Demand with System Improvement (m3/day) (2002) 9094 9404
Source: National Water and Sewage Authority in GoG, 2000
Rainfall seasonality is marked and there is an estimated 30- 40 per cent drop in the available surface water during the dry season depending on the length and severity of this period. Scheduling of supply and trucking takes place during this period. This shortage of potable water supply during the dry season is a recurring problem and has been attributed to a lack of adequate water storage by NAWASA. With respect to the needs of each sector, no analysis has been undertaken to determine the water requirements (ECLAC, 2007).
The average dry season production is about 20% less than the daily average and about 24% less than the rest of the year. Based on daily production figures for the South, only about 35% of the total production is consumed. Changing land use patterns in the upper watersheds have led to reduced flows in the streams and rivers, and to siltation of the dams. Growth in population and in the tourism industry, as well as possible implementation of irrigation schemes would lead to an increase in the total water requirements in the future (table 8).
5. Groundwater
The groundwater potential on mainland Grenada is not yet fully developed. The main groundwater aquifers can be found at Bailles Bacolet, The Great River, Duquesne, Beausejour, Chemin Valley and Pearls-Paradise. The current exploited groundwater is approximately 1890 m3/day, with a potential capacity of approximately 3973 m3/day.
In Carriacou, where there are no perennial streams or rivers, the potential importance of groundwater is higher than on the main island. There have been five previous studies on the groundwater potential in Carriacou (GoG, 2000), and potential groundwater resources (table 8).
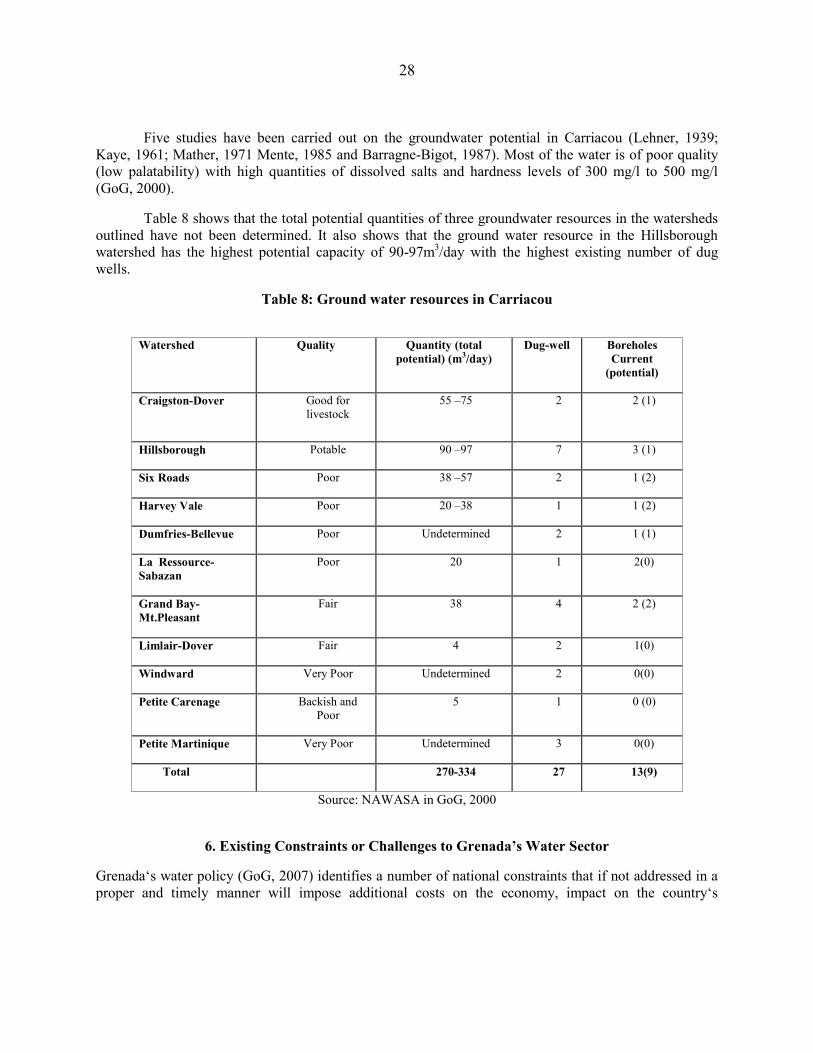
28
Five studies have been carried out on the groundwater potential in Carriacou (Lehner, 1939; Kaye, 1961; Mather, 1971 Mente, 1985 and Barragne-Bigot, 1987). Most of the water is of poor quality (low palatability) with high quantities of dissolved salts and hardness levels of 300 mg/l to 500 mg/l (GoG, 2000).
Table 8 shows that the total potential quantities of three groundwater resources in the watersheds outlined have not been determined. It also shows that the ground water resource in the Hillsborough watershed has the highest potential capacity of 90-97m3/day with the highest existing number of dug wells.
Table 8: Ground water resources in Carriacou
Watershed Quality Quantity (total
potential) (m3/day) Dug-well Boreholes
Current (potential)
Craigston-Dover Good for livestock
55 –75 2 2 (1)
Hillsborough Potable 90 –97 7 3 (1)
Six Roads Poor 38 –57 2 1 (2)
Harvey Vale Poor 20 –38 1 1 (2)
Dumfries-Bellevue Poor Undetermined 2 1 (1)
La Ressource-Sabazan
Poor 20 1 2(0)
Grand Bay- Mt.Pleasant
Fair 38 4 2 (2)
Limlair-Dover Fair 4 2 1(0)
Windward Very Poor Undetermined 2 0(0)
Petite Carenage Backish and Poor
5 1 0 (0)
Petite Martinique Very Poor Undetermined 3 0(0)
Total 270-334 27 13(9)
Source: NAWASA in GoG, 2000
6. Existing Constraints or Challenges to Grenada’s Water Sector
Grenada‘s water policy (GoG, 2007) identifies a number of national constraints that if not addressed in a proper and timely manner will impose additional costs on the economy, impact on the country‘s
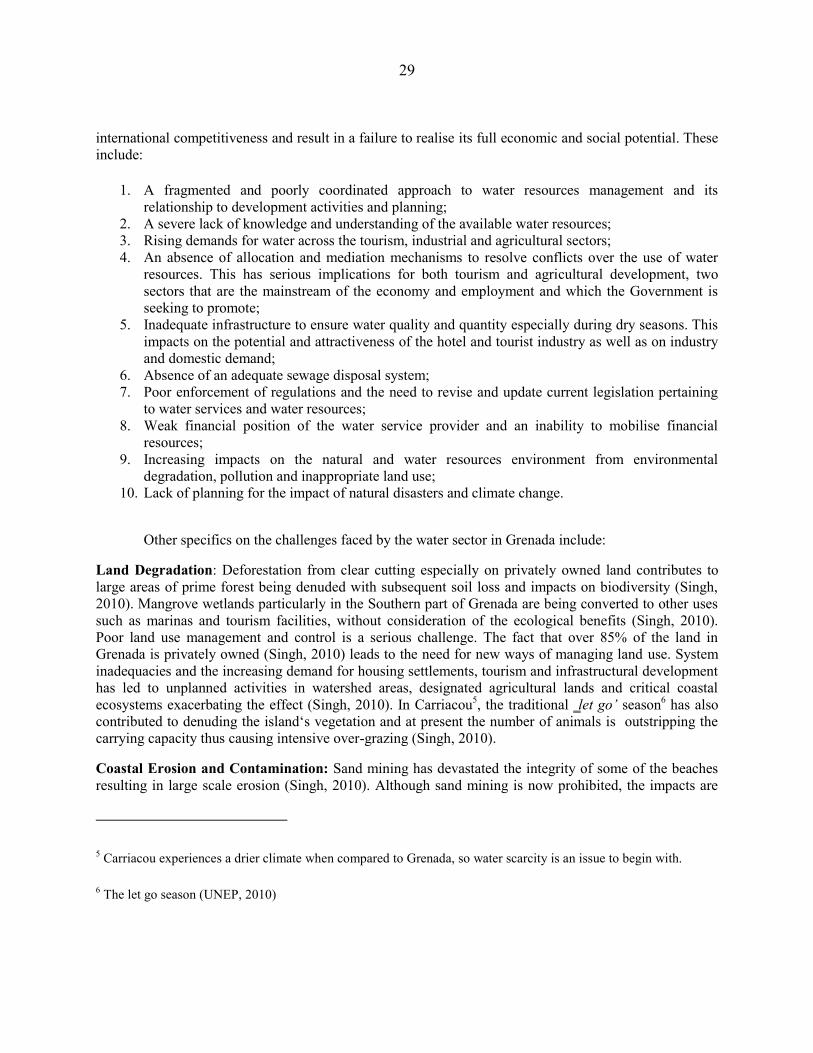
29
international competitiveness and result in a failure to realise its full economic and social potential. These include:
1. A fragmented and poorly coordinated approach to water resources management and its relationship to development activities and planning;
2. A severe lack of knowledge and understanding of the available water resources; 3. Rising demands for water across the tourism, industrial and agricultural sectors; 4. An absence of allocation and mediation mechanisms to resolve conflicts over the use of water
resources. This has serious implications for both tourism and agricultural development, two sectors that are the mainstream of the economy and employment and which the Government is seeking to promote;
5. Inadequate infrastructure to ensure water quality and quantity especially during dry seasons. This impacts on the potential and attractiveness of the hotel and tourist industry as well as on industry and domestic demand;
6. Absence of an adequate sewage disposal system; 7. Poor enforcement of regulations and the need to revise and update current legislation pertaining
to water services and water resources; 8. Weak financial position of the water service provider and an inability to mobilise financial
resources; 9. Increasing impacts on the natural and water resources environment from environmental
degradation, pollution and inappropriate land use; 10. Lack of planning for the impact of natural disasters and climate change.
Other specifics on the challenges faced by the water sector in Grenada include:
Land Degradation: Deforestation from clear cutting especially on privately owned land contributes to large areas of prime forest being denuded with subsequent soil loss and impacts on biodiversity (Singh, 2010). Mangrove wetlands particularly in the Southern part of Grenada are being converted to other uses such as marinas and tourism facilities, without consideration of the ecological benefits (Singh, 2010). Poor land use management and control is a serious challenge. The fact that over 85% of the land in Grenada is privately owned (Singh, 2010) leads to the need for new ways of managing land use. System inadequacies and the increasing demand for housing settlements, tourism and infrastructural development has led to unplanned activities in watershed areas, designated agricultural lands and critical coastal ecosystems exacerbating the effect (Singh, 2010). In Carriacou5, the traditional ‗let go’ season6 has also contributed to denuding the island‘s vegetation and at present the number of animals is outstripping the carrying capacity thus causing intensive over-grazing (Singh, 2010).
Coastal Erosion and Contamination: Sand mining has devastated the integrity of some of the beaches resulting in large scale erosion (Singh, 2010). Although sand mining is now prohibited, the impacts are
5 Carriacou experiences a drier climate when compared to Grenada, so water scarcity is an issue to begin with.
6 The let go season (UNEP, 2010)
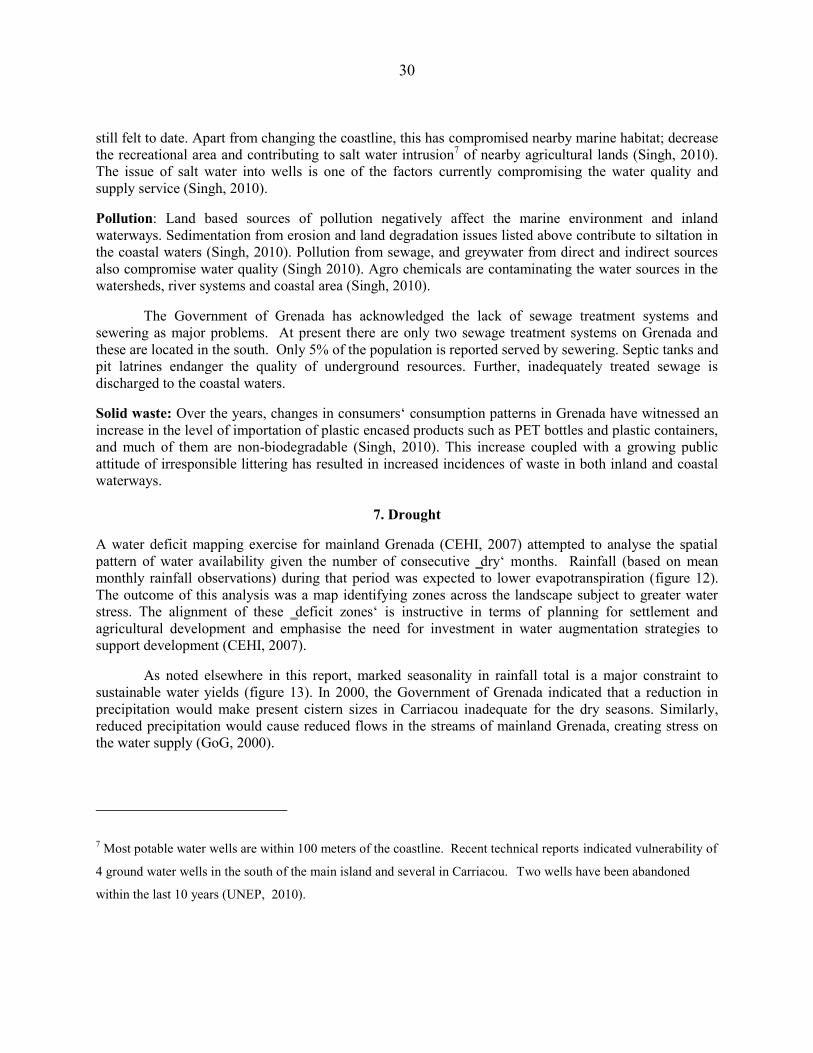
30
still felt to date. Apart from changing the coastline, this has compromised nearby marine habitat; decrease the recreational area and contributing to salt water intrusion7 of nearby agricultural lands (Singh, 2010). The issue of salt water into wells is one of the factors currently compromising the water quality and supply service (Singh, 2010).
Pollution: Land based sources of pollution negatively affect the marine environment and inland waterways. Sedimentation from erosion and land degradation issues listed above contribute to siltation in the coastal waters (Singh, 2010). Pollution from sewage, and greywater from direct and indirect sources also compromise water quality (Singh 2010). Agro chemicals are contaminating the water sources in the watersheds, river systems and coastal area (Singh, 2010).
The Government of Grenada has acknowledged the lack of sewage treatment systems and sewering as major problems. At present there are only two sewage treatment systems on Grenada and these are located in the south. Only 5% of the population is reported served by sewering. Septic tanks and pit latrines endanger the quality of underground resources. Further, inadequately treated sewage is discharged to the coastal waters.
Solid waste: Over the years, changes in consumers‘ consumption patterns in Grenada have witnessed an increase in the level of importation of plastic encased products such as PET bottles and plastic containers, and much of them are non-biodegradable (Singh, 2010). This increase coupled with a growing public attitude of irresponsible littering has resulted in increased incidences of waste in both inland and coastal waterways.
7. Drought
A water deficit mapping exercise for mainland Grenada (CEHI, 2007) attempted to analyse the spatial pattern of water availability given the number of consecutive ‗dry‘ months. Rainfall (based on mean monthly rainfall observations) during that period was expected to lower evapotranspiration (figure 12). The outcome of this analysis was a map identifying zones across the landscape subject to greater water stress. The alignment of these ‗deficit zones‘ is instructive in terms of planning for settlement and agricultural development and emphasise the need for investment in water augmentation strategies to support development (CEHI, 2007).
As noted elsewhere in this report, marked seasonality in rainfall total is a major constraint to sustainable water yields (figure 13). In 2000, the Government of Grenada indicated that a reduction in precipitation would make present cistern sizes in Carriacou inadequate for the dry seasons. Similarly, reduced precipitation would cause reduced flows in the streams of mainland Grenada, creating stress on the water supply (GoG, 2000).
7 Most potable water wells are within 100 meters of the coastline. Recent technical reports indicated vulnerability of
4 ground water wells in the south of the main island and several in Carriacou. Two wells have been abandoned
within the last 10 years (UNEP, 2010).
31
In 2009-2010 Grenada like several other Caribbean territories experienced the lowest annual rainfall total in the 24 year period of record. The lowest total for the single month of February, three months and six months, translated to extremely low flows and consequently water yield, depletion of water resources, and increased demand for irrigation water.
Figure 12: Number of consecutive dry months where dry evapotranspiration exceeds rainfall on Grenada
Source: CEHI, 2007
Figure13: Estimated raw water yield from catchment areas in driest and wettest months
Source: CEHI, 2006
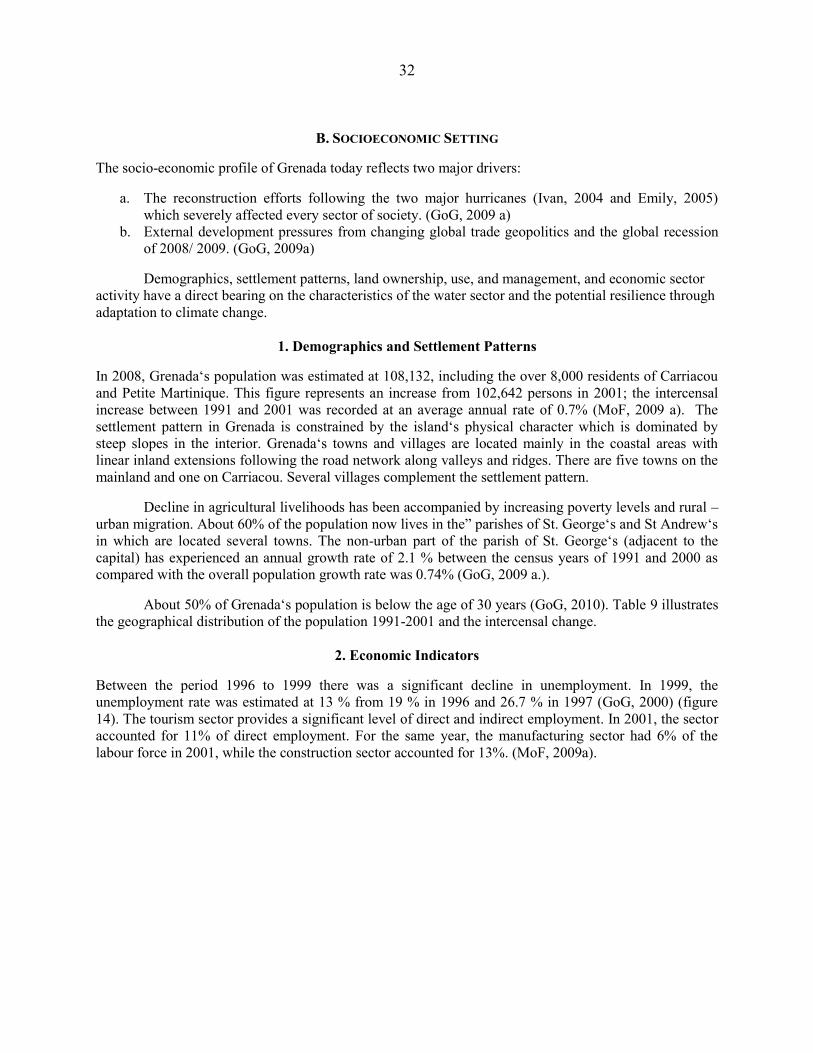
32
B. SOCIOECONOMIC SETTING
The socio-economic profile of Grenada today reflects two major drivers:
a. The reconstruction efforts following the two major hurricanes (Ivan, 2004 and Emily, 2005) which severely affected every sector of society. (GoG, 2009 a)
b. External development pressures from changing global trade geopolitics and the global recession of 2008/ 2009. (GoG, 2009a)
Demographics, settlement patterns, land ownership, use, and management, and economic sector activity have a direct bearing on the characteristics of the water sector and the potential resilience through adaptation to climate change.
1. Demographics and Settlement Patterns
In 2008, Grenada‘s population was estimated at 108,132, including the over 8,000 residents of Carriacou and Petite Martinique. This figure represents an increase from 102,642 persons in 2001; the intercensal increase between 1991 and 2001 was recorded at an average annual rate of 0.7% (MoF, 2009 a). The settlement pattern in Grenada is constrained by the island‘s physical character which is dominated by steep slopes in the interior. Grenada‘s towns and villages are located mainly in the coastal areas with linear inland extensions following the road network along valleys and ridges. There are five towns on the mainland and one on Carriacou. Several villages complement the settlement pattern.
Decline in agricultural livelihoods has been accompanied by increasing poverty levels and rural –urban migration. About 60% of the population now lives in the‖ parishes of St. George‘s and St Andrew‘s in which are located several towns. The non-urban part of the parish of St. George‘s (adjacent to the capital) has experienced an annual growth rate of 2.1 % between the census years of 1991 and 2000 as compared with the overall population growth rate was 0.74% (GoG, 2009 a.).
About 50% of Grenada‘s population is below the age of 30 years (GoG, 2010). Table 9 illustrates the geographical distribution of the population 1991-2001 and the intercensal change.
2. Economic Indicators
Between the period 1996 to 1999 there was a significant decline in unemployment. In 1999, the unemployment rate was estimated at 13 % from 19 % in 1996 and 26.7 % in 1997 (GoG, 2000) (figure 14). The tourism sector provides a significant level of direct and indirect employment. In 2001, the sector accounted for 11% of direct employment. For the same year, the manufacturing sector had 6% of the labour force in 2001, while the construction sector accounted for 13%. (MoF, 2009a).
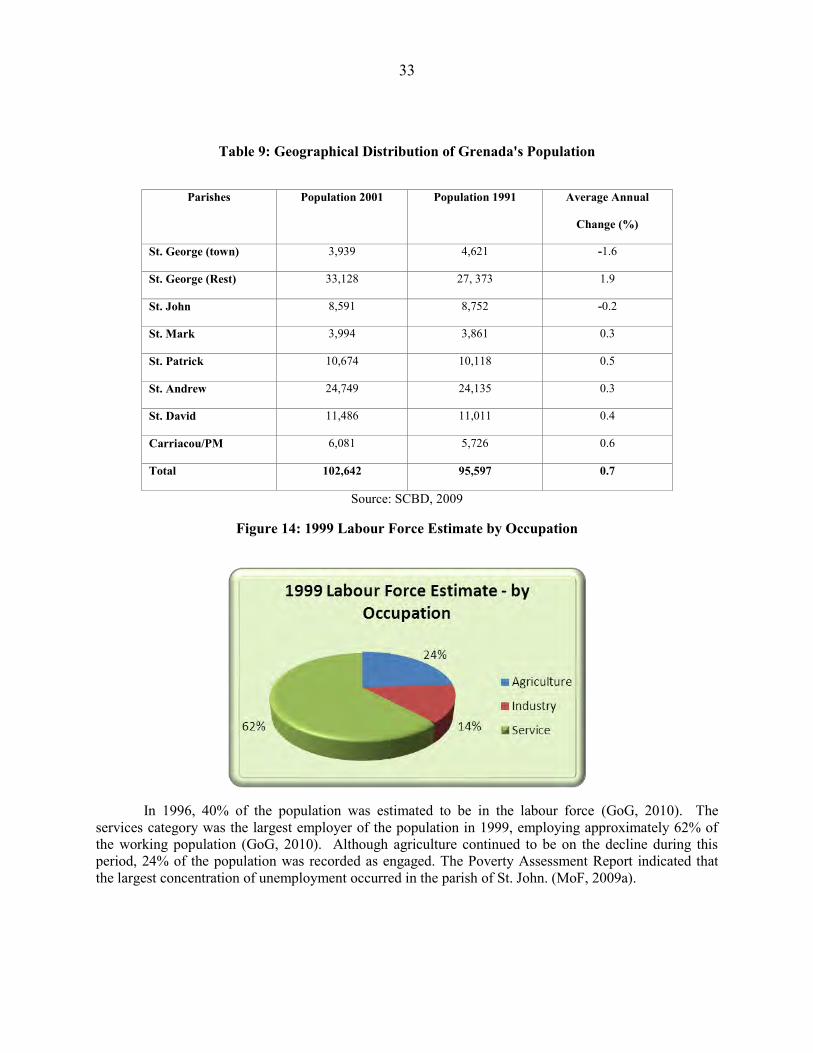
33
Table 9: Geographical Distribution of Grenada's Population
Parishes Population 2001 Population 1991 Average Annual
Change (%)
St. George (town) 3,939 4,621 -1.6
St. George (Rest) 33,128 27, 373 1.9
St. John 8,591 8,752 -0.2
St. Mark 3,994 3,861 0.3
St. Patrick 10,674 10,118 0.5
St. Andrew 24,749 24,135 0.3
St. David 11,486 11,011 0.4
Carriacou/PM 6,081 5,726 0.6
Total 102,642 95,597 0.7
Source: SCBD, 2009
Figure 14: 1999 Labour Force Estimate by Occupation
In 1996, 40% of the population was estimated to be in the labour force (GoG, 2010). The services category was the largest employer of the population in 1999, employing approximately 62% of the working population (GoG, 2010). Although agriculture continued to be on the decline during this period, 24% of the population was recorded as engaged. The Poverty Assessment Report indicated that the largest concentration of unemployment occurred in the parish of St. John. (MoF, 2009a).
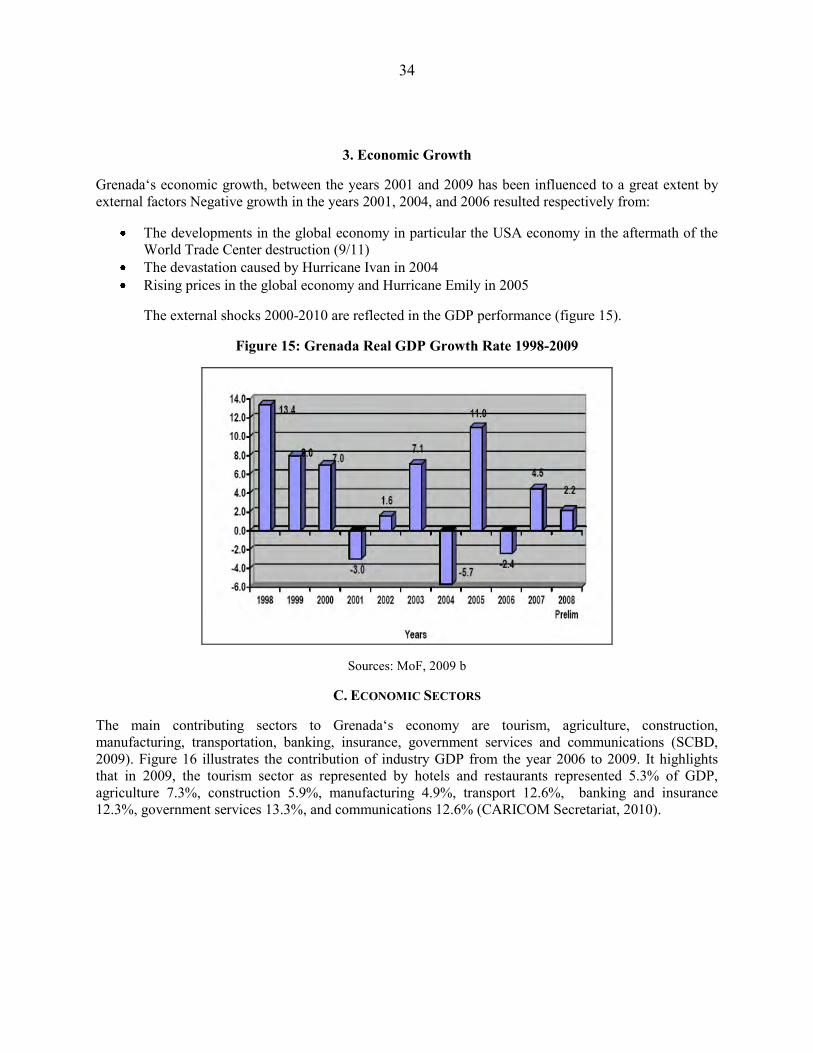
34
3. Economic Growth
Grenada‘s economic growth, between the years 2001 and 2009 has been influenced to a great extent by external factors Negative growth in the years 2001, 2004, and 2006 resulted respectively from:
The developments in the global economy in particular the USA economy in the aftermath of the World Trade Center destruction (9/11)
The devastation caused by Hurricane Ivan in 2004 Rising prices in the global economy and Hurricane Emily in 2005
The external shocks 2000-2010 are reflected in the GDP performance (figure 15).
Figure 15: Grenada Real GDP Growth Rate 1998-2009
Sources: MoF, 2009 b
C. ECONOMIC SECTORS
The main contributing sectors to Grenada‘s economy are tourism, agriculture, construction, manufacturing, transportation, banking, insurance, government services and communications (SCBD, 2009). Figure 16 illustrates the contribution of industry GDP from the year 2006 to 2009. It highlights that in 2009, the tourism sector as represented by hotels and restaurants represented 5.3% of GDP, agriculture 7.3%, construction 5.9%, manufacturing 4.9%, transport 12.6%, banking and insurance 12.3%, government services 13.3%, and communications 12.6% (CARICOM Secretariat, 2010).
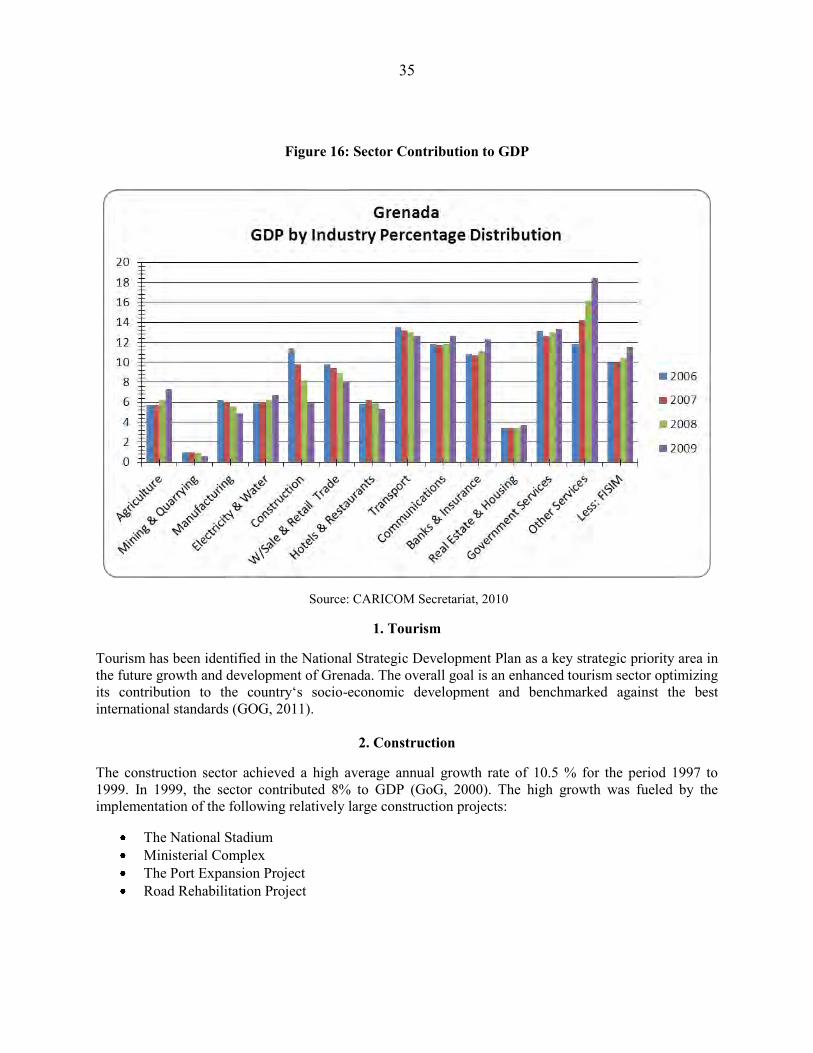
35
Figure 16: Sector Contribution to GDP
Source: CARICOM Secretariat, 2010
1. Tourism
Tourism has been identified in the National Strategic Development Plan as a key strategic priority area in the future growth and development of Grenada. The overall goal is an enhanced tourism sector optimizing its contribution to the country‘s socio-economic development and benchmarked against the best international standards (GOG, 2011).
2. Construction
The construction sector achieved a high average annual growth rate of 10.5 % for the period 1997 to 1999. In 1999, the sector contributed 8% to GDP (GoG, 2000). The high growth was fueled by the implementation of the following relatively large construction projects:
The National Stadium Ministerial Complex The Port Expansion Project Road Rehabilitation Project
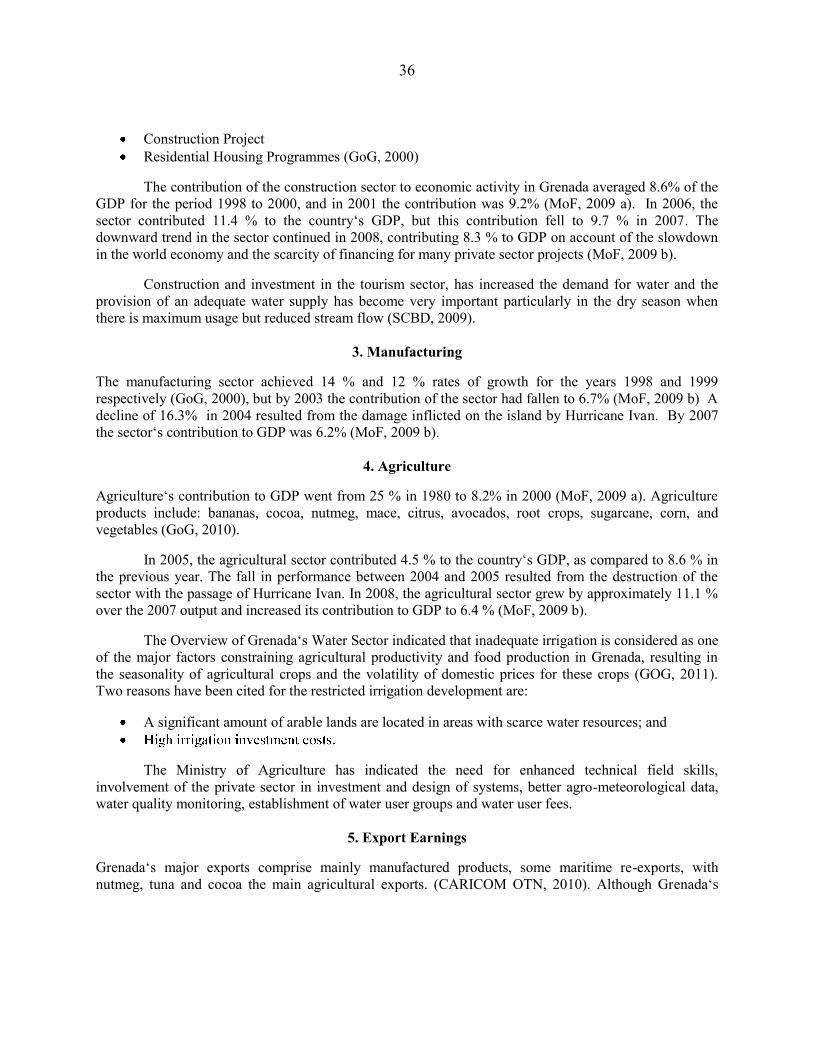
36
Construction Project Residential Housing Programmes (GoG, 2000)
The contribution of the construction sector to economic activity in Grenada averaged 8.6% of the GDP for the period 1998 to 2000, and in 2001 the contribution was 9.2% (MoF, 2009 a). In 2006, the sector contributed 11.4 % to the country‘s GDP, but this contribution fell to 9.7 % in 2007. The downward trend in the sector continued in 2008, contributing 8.3 % to GDP on account of the slowdown in the world economy and the scarcity of financing for many private sector projects (MoF, 2009 b).
Construction and investment in the tourism sector, has increased the demand for water and the provision of an adequate water supply has become very important particularly in the dry season when there is maximum usage but reduced stream flow (SCBD, 2009).
3. Manufacturing
The manufacturing sector achieved 14 % and 12 % rates of growth for the years 1998 and 1999 respectively (GoG, 2000), but by 2003 the contribution of the sector had fallen to 6.7% (MoF, 2009 b) A decline of 16.3% in 2004 resulted from the damage inflicted on the island by Hurricane Ivan. By 2007 the sector‘s contribution to GDP was 6.2% (MoF, 2009 b).
4. Agriculture
Agriculture‘s contribution to GDP went from 25 % in 1980 to 8.2% in 2000 (MoF, 2009 a). Agriculture products include: bananas, cocoa, nutmeg, mace, citrus, avocados, root crops, sugarcane, corn, and vegetables (GoG, 2010).
In 2005, the agricultural sector contributed 4.5 % to the country‘s GDP, as compared to 8.6 % in the previous year. The fall in performance between 2004 and 2005 resulted from the destruction of the sector with the passage of Hurricane Ivan. In 2008, the agricultural sector grew by approximately 11.1 % over the 2007 output and increased its contribution to GDP to 6.4 % (MoF, 2009 b).
The Overview of Grenada‘s Water Sector indicated that inadequate irrigation is considered as one of the major factors constraining agricultural productivity and food production in Grenada, resulting in the seasonality of agricultural crops and the volatility of domestic prices for these crops (GOG, 2011). Two reasons have been cited for the restricted irrigation development are:
A significant amount of arable lands are located in areas with scarce water resources; and
The Ministry of Agriculture has indicated the need for enhanced technical field skills, involvement of the private sector in investment and design of systems, better agro-meteorological data, water quality monitoring, establishment of water user groups and water user fees.
5. Export Earnings
Grenada‘s major exports comprise mainly manufactured products, some maritime re-exports, with nutmeg, tuna and cocoa the main agricultural exports. (CARICOM OTN, 2010). Although Grenada‘s
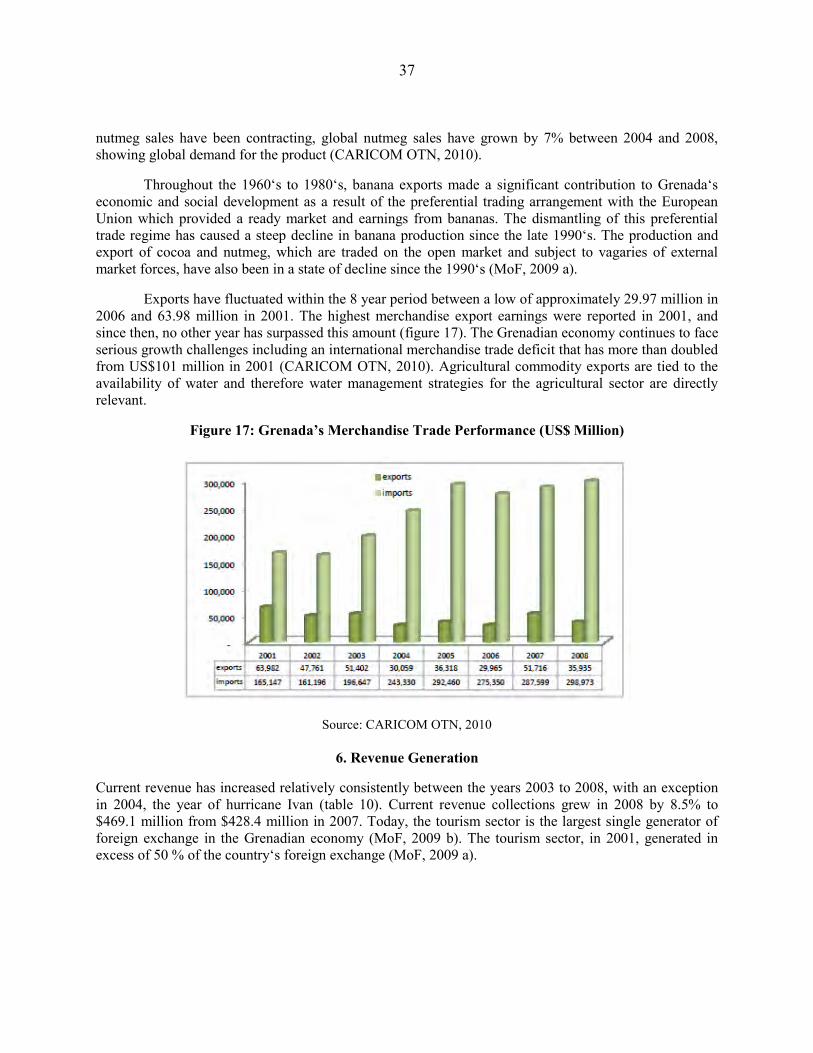
37
nutmeg sales have been contracting, global nutmeg sales have grown by 7% between 2004 and 2008, showing global demand for the product (CARICOM OTN, 2010).
Throughout the 1960‘s to 1980‘s, banana exports made a significant contribution to Grenada‘s economic and social development as a result of the preferential trading arrangement with the European Union which provided a ready market and earnings from bananas. The dismantling of this preferential trade regime has caused a steep decline in banana production since the late 1990‘s. The production and export of cocoa and nutmeg, which are traded on the open market and subject to vagaries of external market forces, have also been in a state of decline since the 1990‘s (MoF, 2009 a).
Exports have fluctuated within the 8 year period between a low of approximately 29.97 million in 2006 and 63.98 million in 2001. The highest merchandise export earnings were reported in 2001, and since then, no other year has surpassed this amount (figure 17). The Grenadian economy continues to face serious growth challenges including an international merchandise trade deficit that has more than doubled from US$101 million in 2001 (CARICOM OTN, 2010). Agricultural commodity exports are tied to the availability of water and therefore water management strategies for the agricultural sector are directly relevant.
Figure 17: Grenada’s Merchandise Trade Performance (US$ Million)
Source: CARICOM OTN, 2010
6. Revenue Generation
Current revenue has increased relatively consistently between the years 2003 to 2008, with an exception in 2004, the year of hurricane Ivan (table 10). Current revenue collections grew in 2008 by 8.5% to $469.1 million from $428.4 million in 2007. Today, the tourism sector is the largest single generator of foreign exchange in the Grenadian economy (MoF, 2009 b). The tourism sector, in 2001, generated in excess of 50 % of the country‘s foreign exchange (MoF, 2009 a).
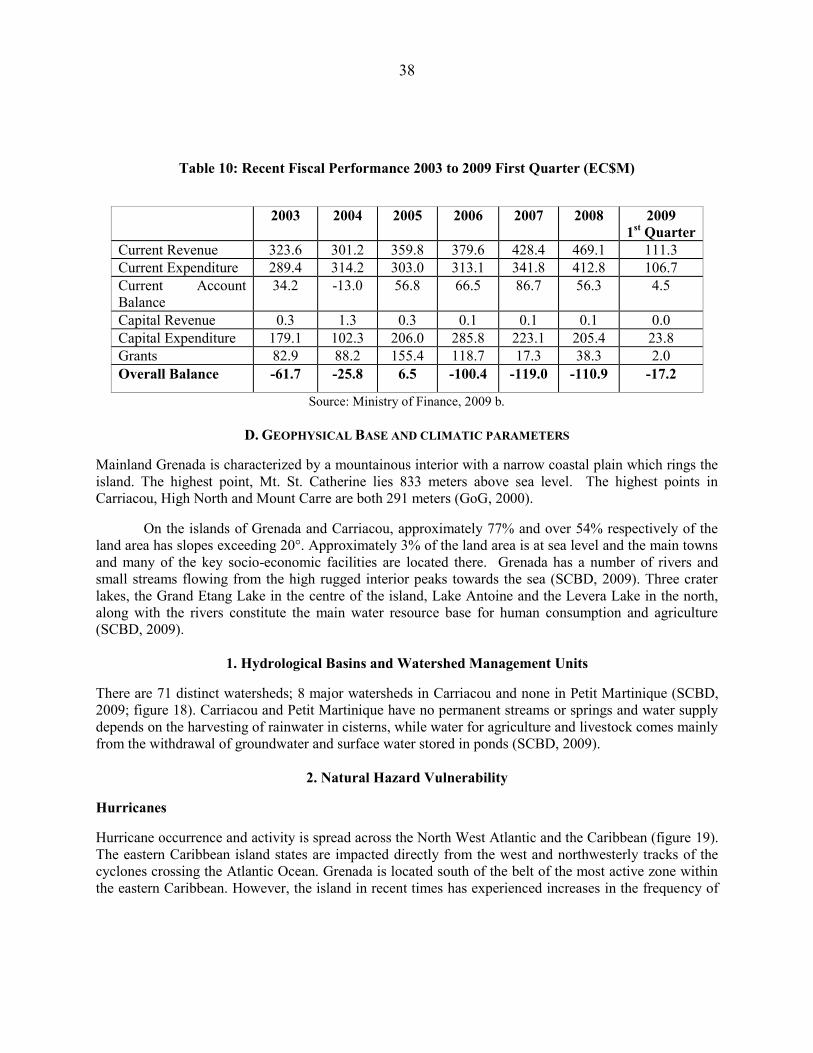
38
Table 10: Recent Fiscal Performance 2003 to 2009 First Quarter (EC$M)
2003 2004 2005 2006 2007 2008 2009
1st Quarter Current Revenue 323.6 301.2 359.8 379.6 428.4 469.1 111.3 Current Expenditure 289.4 314.2 303.0 313.1 341.8 412.8 106.7 Current Account Balance
34.2 -13.0 56.8 66.5 86.7 56.3 4.5
Capital Revenue 0.3 1.3 0.3 0.1 0.1 0.1 0.0 Capital Expenditure 179.1 102.3 206.0 285.8 223.1 205.4 23.8 Grants 82.9 88.2 155.4 118.7 17.3 38.3 2.0 Overall Balance -61.7 -25.8 6.5 -100.4 -119.0 -110.9 -17.2
Source: Ministry of Finance, 2009 b.
D. GEOPHYSICAL BASE AND CLIMATIC PARAMETERS
Mainland Grenada is characterized by a mountainous interior with a narrow coastal plain which rings the island. The highest point, Mt. St. Catherine lies 833 meters above sea level. The highest points in Carriacou, High North and Mount Carre are both 291 meters (GoG, 2000).
On the islands of Grenada and Carriacou, approximately 77% and over 54% respectively of the land area has slopes exceeding 20°. Approximately 3% of the land area is at sea level and the main towns and many of the key socio-economic facilities are located there. Grenada has a number of rivers and small streams flowing from the high rugged interior peaks towards the sea (SCBD, 2009). Three crater lakes, the Grand Etang Lake in the centre of the island, Lake Antoine and the Levera Lake in the north, along with the rivers constitute the main water resource base for human consumption and agriculture (SCBD, 2009).
1. Hydrological Basins and Watershed Management Units
There are 71 distinct watersheds; 8 major watersheds in Carriacou and none in Petit Martinique (SCBD, 2009; figure 18). Carriacou and Petit Martinique have no permanent streams or springs and water supply depends on the harvesting of rainwater in cisterns, while water for agriculture and livestock comes mainly from the withdrawal of groundwater and surface water stored in ponds (SCBD, 2009).
2. Natural Hazard Vulnerability
Hurricanes
Hurricane occurrence and activity is spread across the North West Atlantic and the Caribbean (figure 19). The eastern Caribbean island states are impacted directly from the west and northwesterly tracks of the cyclones crossing the Atlantic Ocean. Grenada is located south of the belt of the most active zone within the eastern Caribbean. However, the island in recent times has experienced increases in the frequency of
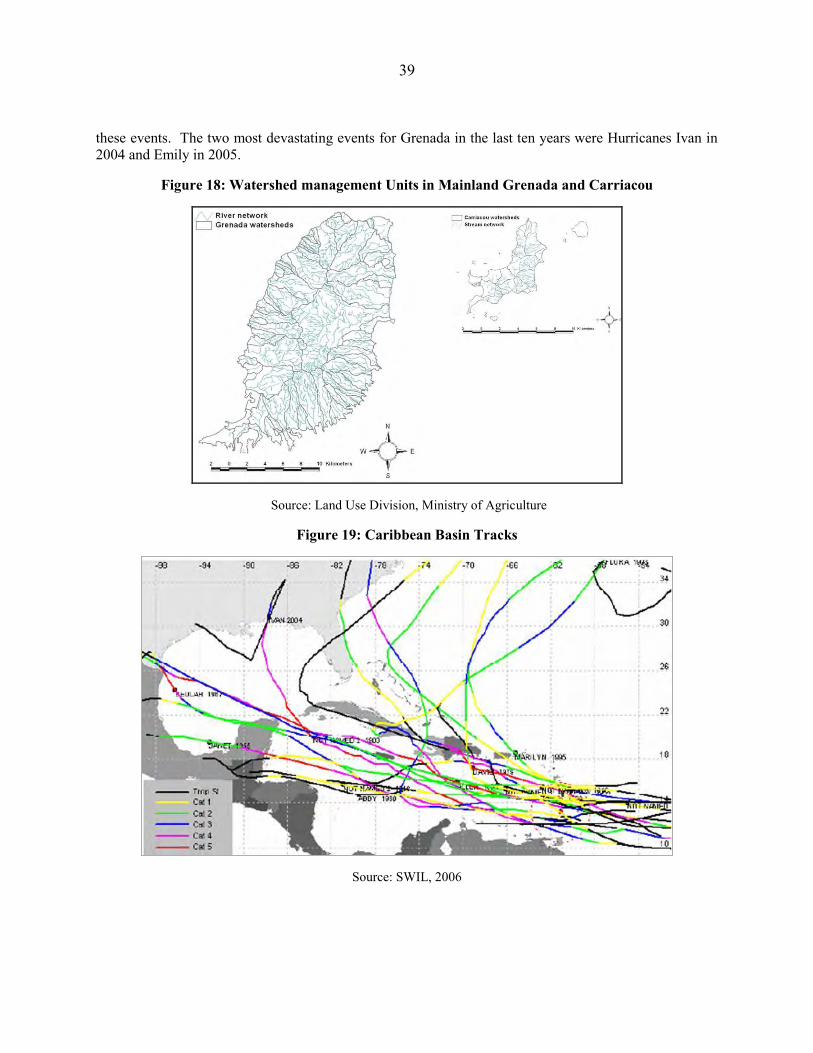
39
these events. The two most devastating events for Grenada in the last ten years were Hurricanes Ivan in 2004 and Emily in 2005.
Figure 18: Watershed management Units in Mainland Grenada and Carriacou
Source: Land Use Division, Ministry of Agriculture
Figure 19: Caribbean Basin Tracks
Source: SWIL, 2006
40
Grenada‘s water resources are threatened by the tropical cyclones to which the Caribbean is exposed. These events are expected to worsen and proper planning measures need to be put in place to manage the problems that arise during extreme flood events. Challenges under these conditions are listed below. These water resources and water supply challenges were experienced during Hurricane Ivan and Emily in 2004 and 2005.
Damage to roads and underground infrastructure, including water distribution pipes The restoration of electricity at water pumping stations throughout the country to restore water
services as early as possible The degradation of the watershed exposes the island to flash flooding that affected above ground
water distribution infrastructure Damage to the water sector including the siltation of water intakes and the destruction of low-
lying surface water pipes. Treatment facilities are old and susceptible to damage
Floods and Droughts are extreme manifestations of the hydrological cycle and have a direct bearing on water yield and quality.
Volcanic Hazard
Grenada is a volcanic island and the volcanic hazard is part of the archipelgo‘s geographic reality. In addition to mainland Grenada there is the submarine volcano ―Kick em Jenny‖ which has erupted several times since 1939. Potential eruption is a threat to water supply infrastructure and to the economy, but there is no direct bearing on climate variability and change.
3. Land Ownership, Use and Management
Issues of land use and management in Grenada play a major role in the development cornerstones of food security and export agriculture; water supply; housing and tourism. Growing population and changing paradigms of economic drivers have aggravated competition for land leading to uses that conflict with sustainable land use and sustainable yield of good quality water. Residential housing development on steep slopes and inappropriate siting of tourism infrastructure are the major issues.
The total land area in Grenada is approximately 84,000 acres (33,994 ha). Unlike other OECS territories, the Government of Grenada does not own a significant proportion of this land. Crown lands are estimated at about 10% of total holdings, with private land ownership of the remaining 90%. This would mean that land is as widespread a decision-making asset in individual investors‘ portfolio as would be savings and other assets. Thus, as the economy becomes diversified through private initiatives into other productive sectors such as manufacturing and tourism, the proportion of land utilized in agriculture will tend to decline. Most of the land in Grenada is privately owned with the exception of Grand Etang, Mt. St. Catherine and a few agricultural estates. (GoG, n.d.)
Regulation of land use and development activities is hindered by property rights, since private owners have little restrictions to develop or sell their property. It is therefore not uncommon to find agricultural and livestock projects in residential areas, or agricultural lands converted to tourism and residential use. Rural to urban migration and problems with squatting, especially on state-owned lands are common. Cultural trends are further reinforced by the lack of a land policy or land use code with
41
regulations for land development, zoning of land use, a land tax and pricing/value structure (ESL, 2010). The current situation of the quality of land resources, vulnerable areas and the rate of degradation has not been well documented for Grenada, Carriacou and Petit Martinique. However there is visual evidence that several landscapes are under pressure from human development or undergoing changes due to natural bio-geophysical processes (GoG, 2009 a).
Only 10% of forest cover has been replanted following Hurricanes of 2004 and 2005 over five years ago. This compares with the 90% replanting which occurred within ten months following Hurricane Janet in 1956. One school of thought is that the forest should be left to regenerate itself instead of introducing species for replanting. However, the fragility of the slopes and the interrelationship with water supply must be a major consideration (ESL 2010).
E. INSTITUTIONAL MAP
The Government has recognized that the continued success of the economy and social development is being put at risk by the current water sector arrangements. The most serious of the constraints that have been identified is the fragmented and poorly coordinated approach to water resources management and its relationship to development activities and planning. In that light the Draft Water Sector policy (GoG, 2007) outlines the proposed governance structure. The responsibility for the management of water resources, under current legislation falls under the National Water and Sewerage Authority (NAWASA). This function is to be separated from responsibility for the provision of water and wastewater services (performed by NAWASA). The proposed arrangements of functions and responsibilities are shown in the organizational diagram in figure 20).
V. CLIMATE MODELLING AND WATER SUPPLY 2011-2050
This section presents the approach to and results of modelling applied to establish the relationship between changing climate indicators, namely temperature and rainfall, and demand in selected sectors, as well as overall water supply for Grenada.
Climate change is expected to alter the livelihood and standard of living for a large portion of the world‘s population. One key aspect of this impact as discussed above is in the area of availability of water resources vis-à-vis the likely changes in the demand for these increasingly scarce resources. This section of the report estimates the demand and supply relating to these resources between 2011 and 2050 in order to provide policymakers with possible adaptation and mitigation measures that ought to be implemented.
A. WATER DEMAND
The historical data on national water demand and supply was generally available for Grenada on an annual basis between 1990 and 2009 with some gaps having to be interpolated from the data and incorporating proxy measures from other studies and countries. These calculations are explained below.
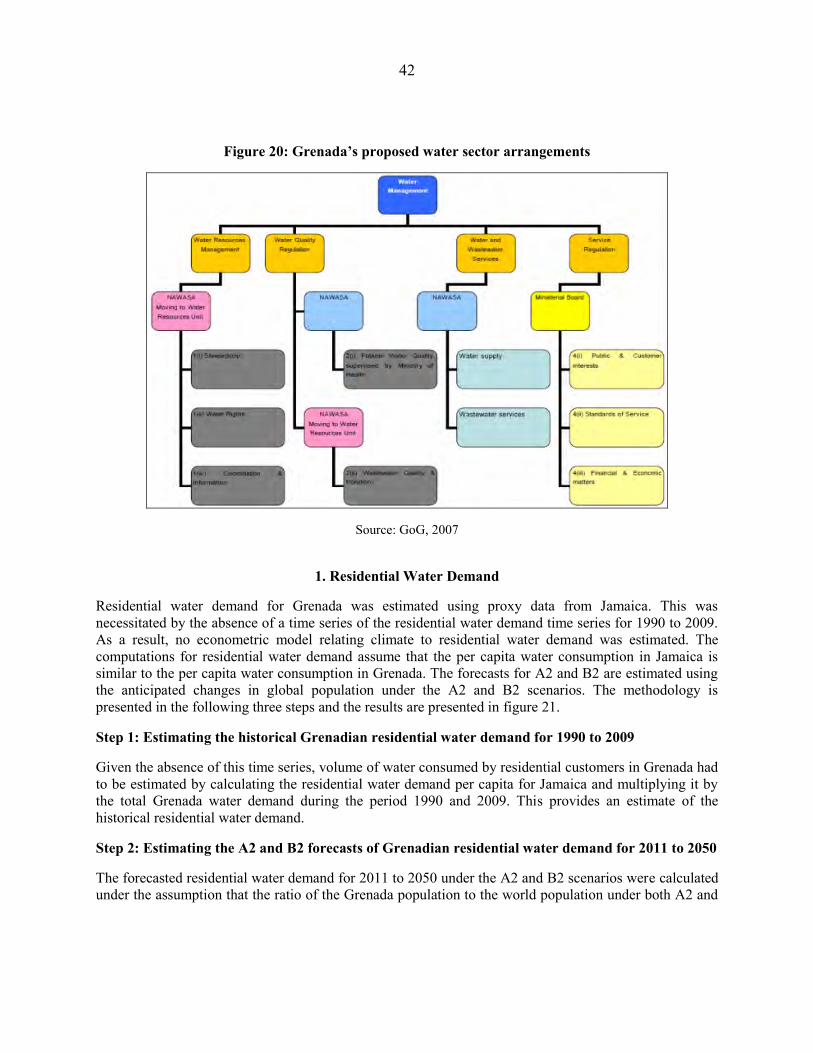
42
Figure 20: Grenada’s proposed water sector arrangements
Source: GoG, 2007
1. Residential Water Demand
Residential water demand for Grenada was estimated using proxy data from Jamaica. This was necessitated by the absence of a time series of the residential water demand time series for 1990 to 2009. As a result, no econometric model relating climate to residential water demand was estimated. The computations for residential water demand assume that the per capita water consumption in Jamaica is similar to the per capita water consumption in Grenada. The forecasts for A2 and B2 are estimated using the anticipated changes in global population under the A2 and B2 scenarios. The methodology is presented in the following three steps and the results are presented in figure 21.
Step 1: Estimating the historical Grenadian residential water demand for 1990 to 2009
Given the absence of this time series, volume of water consumed by residential customers in Grenada had to be estimated by calculating the residential water demand per capita for Jamaica and multiplying it by the total Grenada water demand during the period 1990 and 2009. This provides an estimate of the historical residential water demand.
Step 2: Estimating the A2 and B2 forecasts of Grenadian residential water demand for 2011 to 2050
The forecasted residential water demand for 2011 to 2050 under the A2 and B2 scenarios were calculated under the assumption that the ratio of the Grenada population to the world population under both A2 and
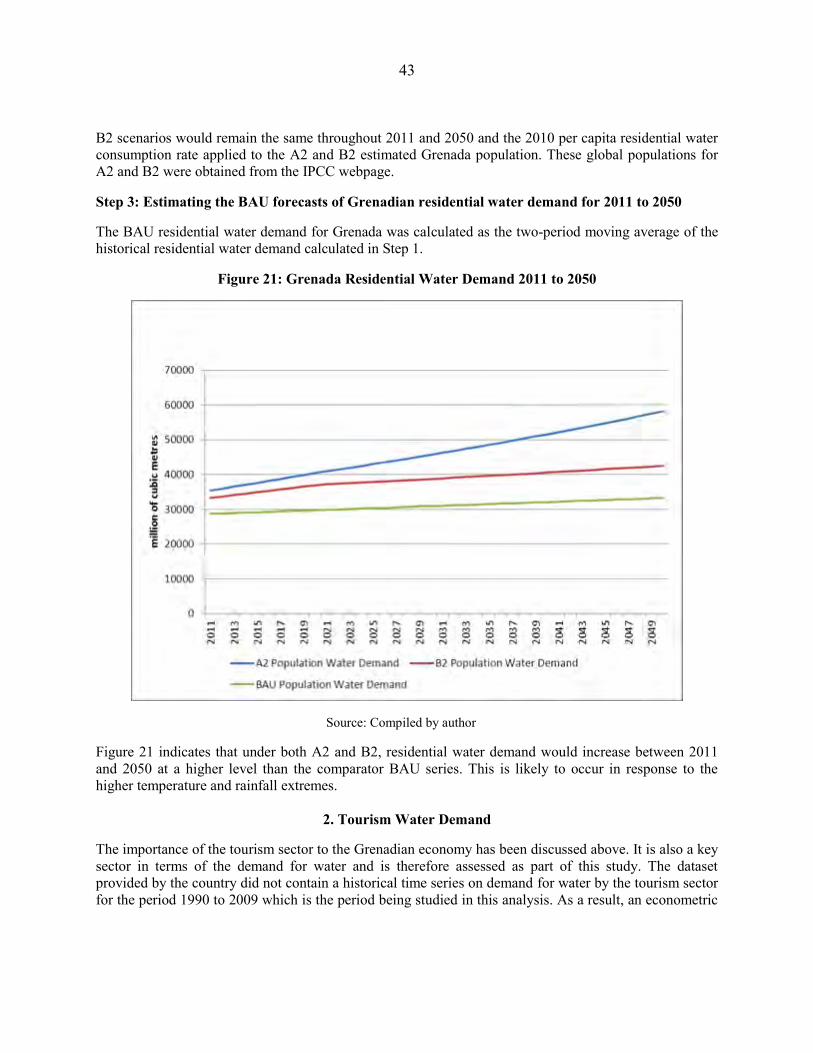
43
B2 scenarios would remain the same throughout 2011 and 2050 and the 2010 per capita residential water consumption rate applied to the A2 and B2 estimated Grenada population. These global populations for A2 and B2 were obtained from the IPCC webpage.
Step 3: Estimating the BAU forecasts of Grenadian residential water demand for 2011 to 2050
The BAU residential water demand for Grenada was calculated as the two-period moving average of the historical residential water demand calculated in Step 1.
Figure 21: Grenada Residential Water Demand 2011 to 2050
Source: Compiled by author
Figure 21 indicates that under both A2 and B2, residential water demand would increase between 2011 and 2050 at a higher level than the comparator BAU series. This is likely to occur in response to the higher temperature and rainfall extremes.
2. Tourism Water Demand
The importance of the tourism sector to the Grenadian economy has been discussed above. It is also a key sector in terms of the demand for water and is therefore assessed as part of this study. The dataset provided by the country did not contain a historical time series on demand for water by the tourism sector for the period 1990 to 2009 which is the period being studied in this analysis. As a result, an econometric
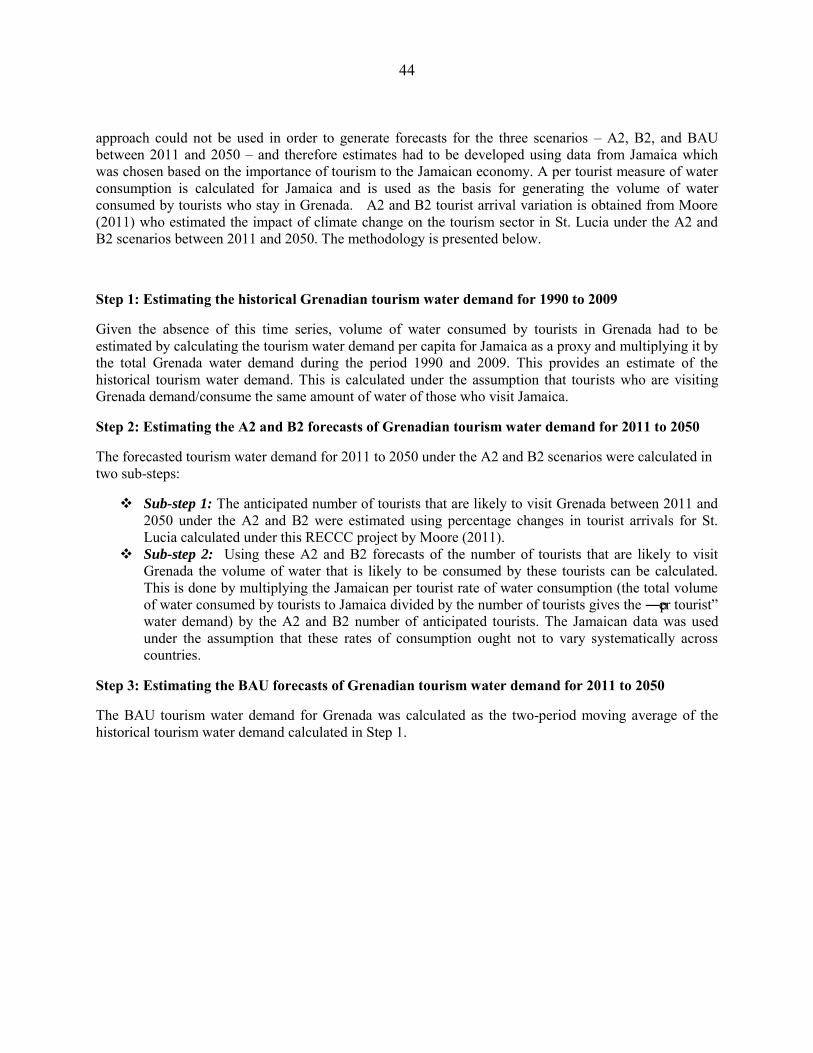
44
approach could not be used in order to generate forecasts for the three scenarios – A2, B2, and BAU between 2011 and 2050 – and therefore estimates had to be developed using data from Jamaica which was chosen based on the importance of tourism to the Jamaican economy. A per tourist measure of water consumption is calculated for Jamaica and is used as the basis for generating the volume of water consumed by tourists who stay in Grenada. A2 and B2 tourist arrival variation is obtained from Moore (2011) who estimated the impact of climate change on the tourism sector in St. Lucia under the A2 and B2 scenarios between 2011 and 2050. The methodology is presented below.
Step 1: Estimating the historical Grenadian tourism water demand for 1990 to 2009
Given the absence of this time series, volume of water consumed by tourists in Grenada had to be estimated by calculating the tourism water demand per capita for Jamaica as a proxy and multiplying it by the total Grenada water demand during the period 1990 and 2009. This provides an estimate of the historical tourism water demand. This is calculated under the assumption that tourists who are visiting Grenada demand/consume the same amount of water of those who visit Jamaica.
Step 2: Estimating the A2 and B2 forecasts of Grenadian tourism water demand for 2011 to 2050
The forecasted tourism water demand for 2011 to 2050 under the A2 and B2 scenarios were calculated in two sub-steps:
Sub-step 1: The anticipated number of tourists that are likely to visit Grenada between 2011 and 2050 under the A2 and B2 were estimated using percentage changes in tourist arrivals for St. Lucia calculated under this RECCC project by Moore (2011).
Sub-step 2: Using these A2 and B2 forecasts of the number of tourists that are likely to visit Grenada the volume of water that is likely to be consumed by these tourists can be calculated. This is done by multiplying the Jamaican per tourist rate of water consumption (the total volume of water consumed by tourists to Jamaica divided by the number of tourists gives the ―per tourist‖ water demand) by the A2 and B2 number of anticipated tourists. The Jamaican data was used under the assumption that these rates of consumption ought not to vary systematically across countries.
Step 3: Estimating the BAU forecasts of Grenadian tourism water demand for 2011 to 2050
The BAU tourism water demand for Grenada was calculated as the two-period moving average of the historical tourism water demand calculated in Step 1.
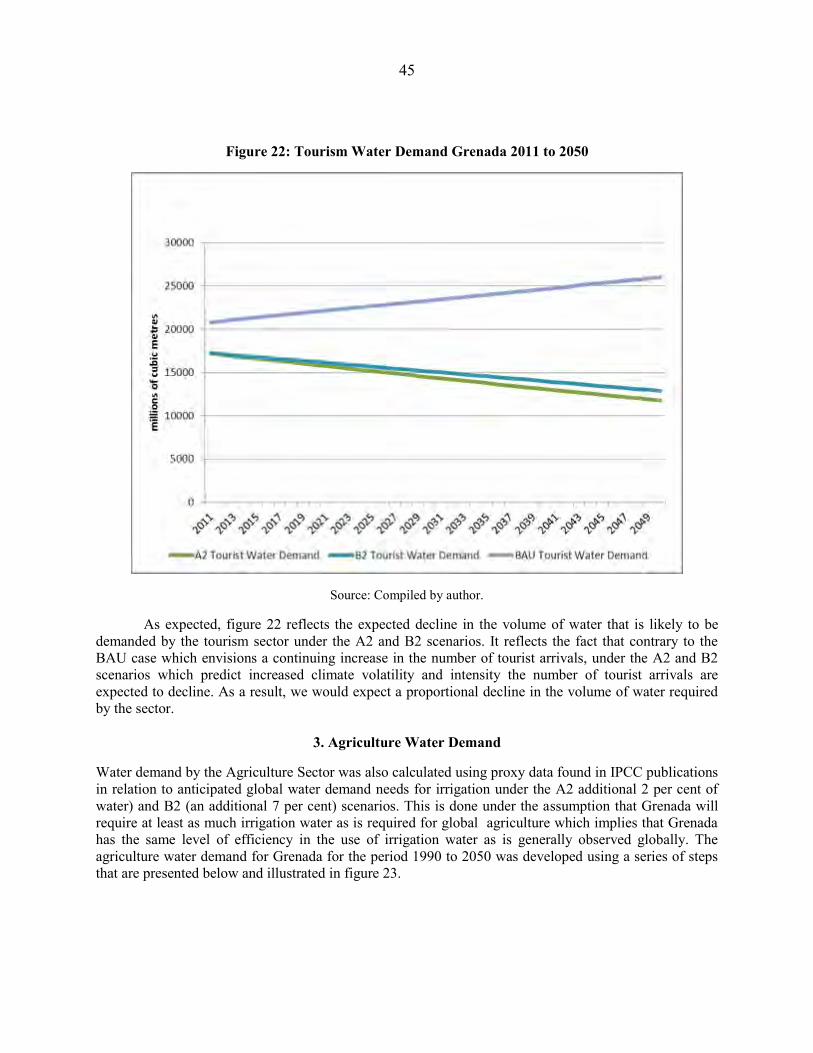
45
Figure 22: Tourism Water Demand Grenada 2011 to 2050
Source: Compiled by author.
As expected, figure 22 reflects the expected decline in the volume of water that is likely to be demanded by the tourism sector under the A2 and B2 scenarios. It reflects the fact that contrary to the BAU case which envisions a continuing increase in the number of tourist arrivals, under the A2 and B2 scenarios which predict increased climate volatility and intensity the number of tourist arrivals are expected to decline. As a result, we would expect a proportional decline in the volume of water required by the sector.
3. Agriculture Water Demand
Water demand by the Agriculture Sector was also calculated using proxy data found in IPCC publications in relation to anticipated global water demand needs for irrigation under the A2 additional 2 per cent of water) and B2 (an additional 7 per cent) scenarios. This is done under the assumption that Grenada will require at least as much irrigation water as is required for global agriculture which implies that Grenada has the same level of efficiency in the use of irrigation water as is generally observed globally. The agriculture water demand for Grenada for the period 1990 to 2050 was developed using a series of steps that are presented below and illustrated in figure 23.
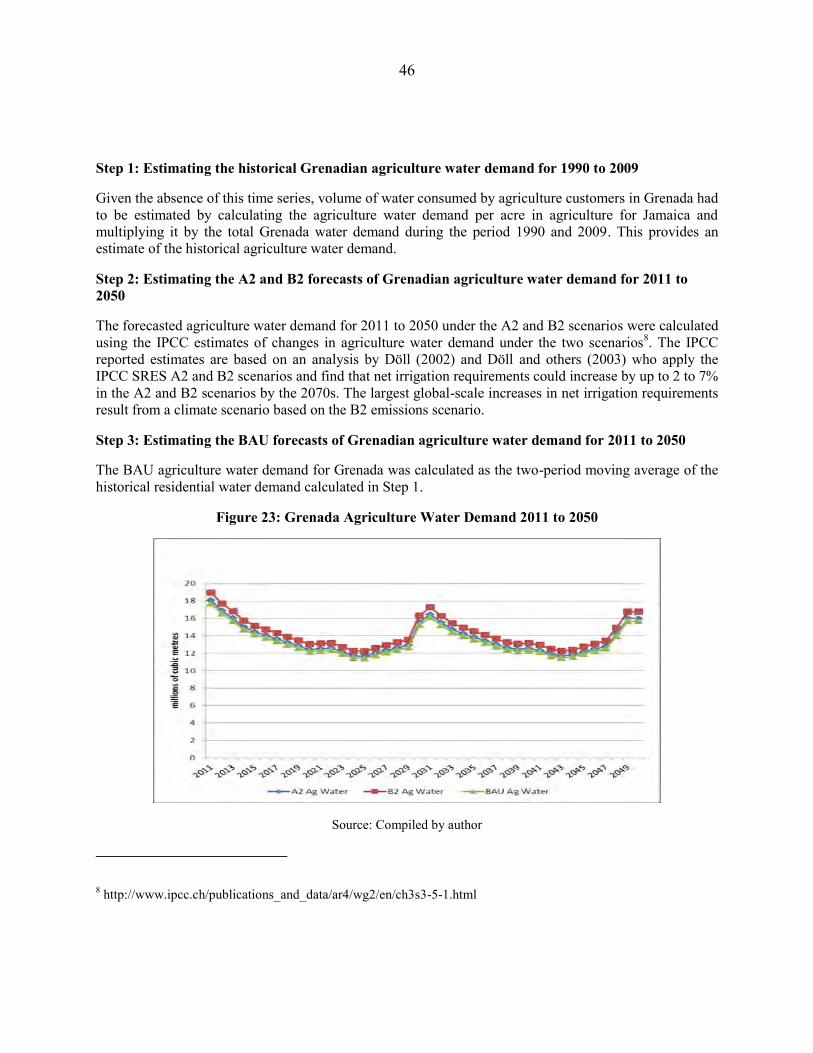
46
Step 1: Estimating the historical Grenadian agriculture water demand for 1990 to 2009
Given the absence of this time series, volume of water consumed by agriculture customers in Grenada had to be estimated by calculating the agriculture water demand per acre in agriculture for Jamaica and multiplying it by the total Grenada water demand during the period 1990 and 2009. This provides an estimate of the historical agriculture water demand.
Step 2: Estimating the A2 and B2 forecasts of Grenadian agriculture water demand for 2011 to 2050
The forecasted agriculture water demand for 2011 to 2050 under the A2 and B2 scenarios were calculated using the IPCC estimates of changes in agriculture water demand under the two scenarios8. The IPCC reported estimates are based on an analysis by Döll (2002) and Döll and others (2003) who apply the IPCC SRES A2 and B2 scenarios and find that net irrigation requirements could increase by up to 2 to 7% in the A2 and B2 scenarios by the 2070s. The largest global-scale increases in net irrigation requirements result from a climate scenario based on the B2 emissions scenario.
Step 3: Estimating the BAU forecasts of Grenadian agriculture water demand for 2011 to 2050
The BAU agriculture water demand for Grenada was calculated as the two-period moving average of the historical residential water demand calculated in Step 1.
Figure 23: Grenada Agriculture Water Demand 2011 to 2050
Source: Compiled by author
8 http://www.ipcc.ch/publications_and_data/ar4/wg2/en/ch3s3-5-1.html
47
B. CLIMATE DATA: HISTORICAL, A2 AND B2 FORECASTS
The total rainfall data was obtained from the Caribbean Institute of Meteorology and Hydrology (CIMH) for the years 1990 to 2004. The years to 2010 were estimated by the author using a two-period moving average process. Water supply data was obtained from NAWASA, CEHI, and FAO for the years 1990 to 2009. The rainfall forecasts were calculated for the two climate-based scenarios being considered in this RECCC study – A2 and B2 – using the following steps:
The temperature and rainfall climatology was calculated by calculating the average of the monthly temperature and precipitation for each month between 1990 and 2009
The anomalies that are obtained from the ECHAM model for coordinates 291-17.5 for each scenario – A2 and B2 – were used to downscale the climatology. This yielded the A2 and B2 temperature and rainfall forecasts for the period 2011 to 2050
Figure 24 indicates that the A2 and B2 climate-based scenarios both result in a higher level of rainfall than the historical data.
In contrast to the forecasts for precipitation, figure 25 indicates that temperature increases throughout the period 2011 and 2050 in all three scenarios.
Figure 24: Grenada Rainfall A2 and B2, 2011to 2050
Source: Compiled by author
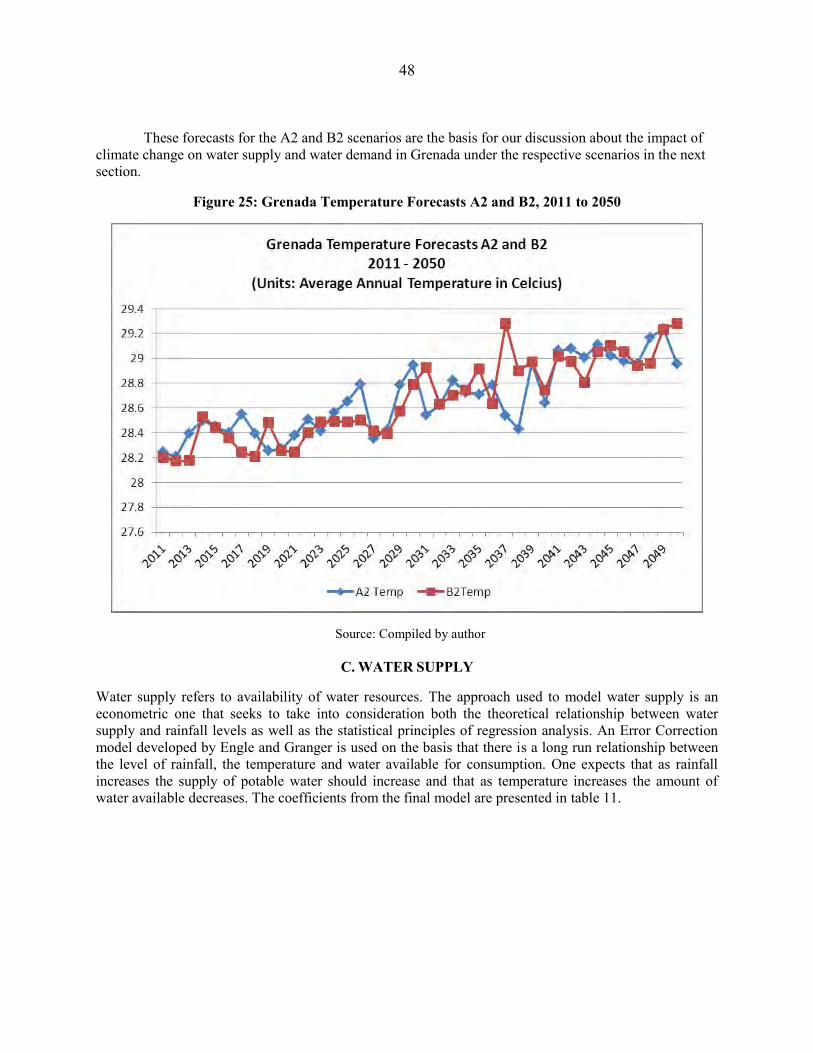
48
These forecasts for the A2 and B2 scenarios are the basis for our discussion about the impact of climate change on water supply and water demand in Grenada under the respective scenarios in the next section.
Figure 25: Grenada Temperature Forecasts A2 and B2, 2011 to 2050
Source: Compiled by author
C. WATER SUPPLY
Water supply refers to availability of water resources. The approach used to model water supply is an econometric one that seeks to take into consideration both the theoretical relationship between water supply and rainfall levels as well as the statistical principles of regression analysis. An Error Correction model developed by Engle and Granger is used on the basis that there is a long run relationship between the level of rainfall, the temperature and water available for consumption. One expects that as rainfall increases the supply of potable water should increase and that as temperature increases the amount of water available decreases. The coefficients from the final model are presented in table 11.
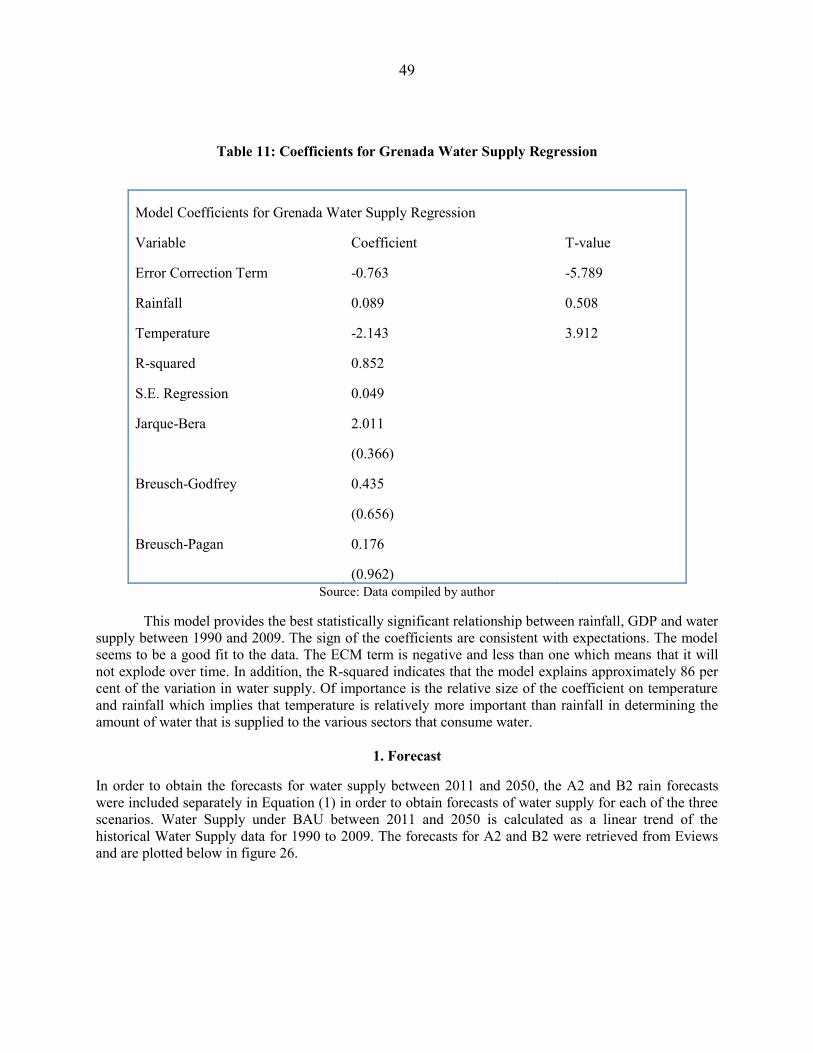
49
Table 11: Coefficients for Grenada Water Supply Regression
Model Coefficients for Grenada Water Supply Regression
Variable Coefficient T-value
Error Correction Term -0.763 -5.789
Rainfall 0.089 0.508
Temperature -2.143 3.912
R-squared 0.852
S.E. Regression 0.049
Jarque-Bera 2.011
(0.366)
Breusch-Godfrey 0.435
(0.656)
Breusch-Pagan 0.176
(0.962)
Source: Data compiled by author
This model provides the best statistically significant relationship between rainfall, GDP and water supply between 1990 and 2009. The sign of the coefficients are consistent with expectations. The model seems to be a good fit to the data. The ECM term is negative and less than one which means that it will not explode over time. In addition, the R-squared indicates that the model explains approximately 86 per cent of the variation in water supply. Of importance is the relative size of the coefficient on temperature and rainfall which implies that temperature is relatively more important than rainfall in determining the amount of water that is supplied to the various sectors that consume water.
1. Forecast
In order to obtain the forecasts for water supply between 2011 and 2050, the A2 and B2 rain forecasts were included separately in Equation (1) in order to obtain forecasts of water supply for each of the three scenarios. Water Supply under BAU between 2011 and 2050 is calculated as a linear trend of the historical Water Supply data for 1990 to 2009. The forecasts for A2 and B2 were retrieved from Eviews and are plotted below in figure 26.
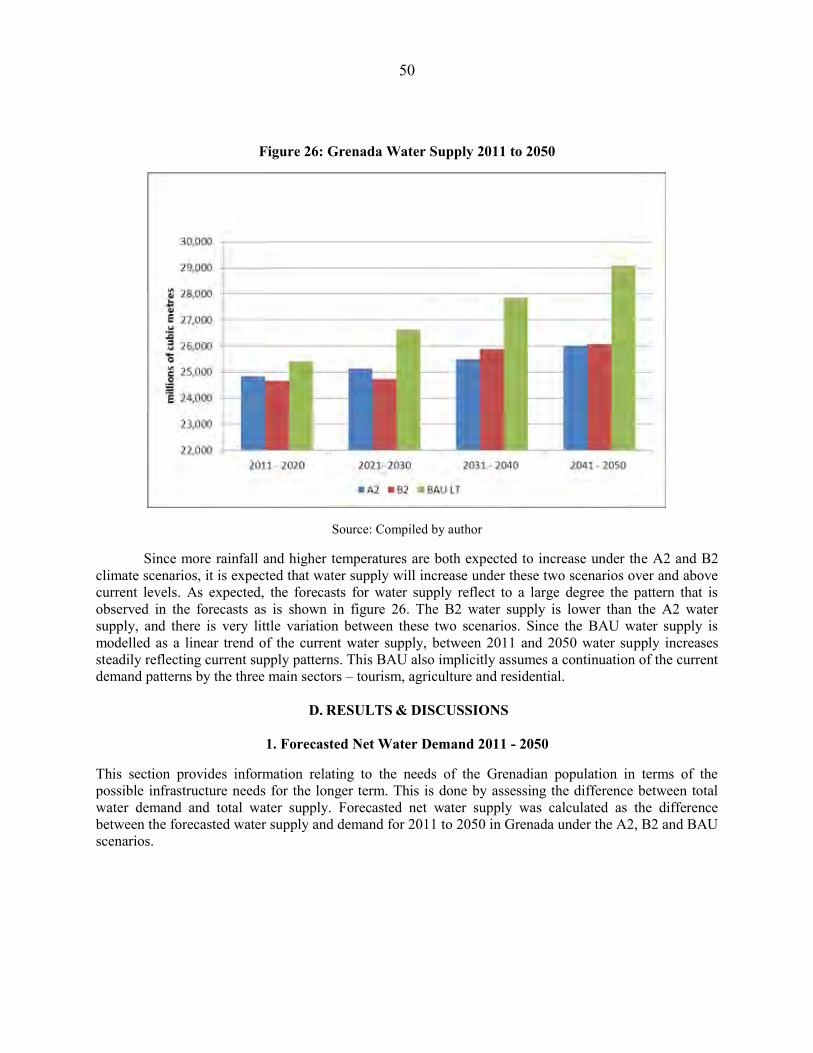
50
Figure 26: Grenada Water Supply 2011 to 2050
Source: Compiled by author
Since more rainfall and higher temperatures are both expected to increase under the A2 and B2 climate scenarios, it is expected that water supply will increase under these two scenarios over and above current levels. As expected, the forecasts for water supply reflect to a large degree the pattern that is observed in the forecasts as is shown in figure 26. The B2 water supply is lower than the A2 water supply, and there is very little variation between these two scenarios. Since the BAU water supply is modelled as a linear trend of the current water supply, between 2011 and 2050 water supply increases steadily reflecting current supply patterns. This BAU also implicitly assumes a continuation of the current demand patterns by the three main sectors – tourism, agriculture and residential.
D. RESULTS & DISCUSSIONS
1. Forecasted Net Water Demand 2011 - 2050
This section provides information relating to the needs of the Grenadian population in terms of the possible infrastructure needs for the longer term. This is done by assessing the difference between total water demand and total water supply. Forecasted net water supply was calculated as the difference between the forecasted water supply and demand for 2011 to 2050 in Grenada under the A2, B2 and BAU scenarios.
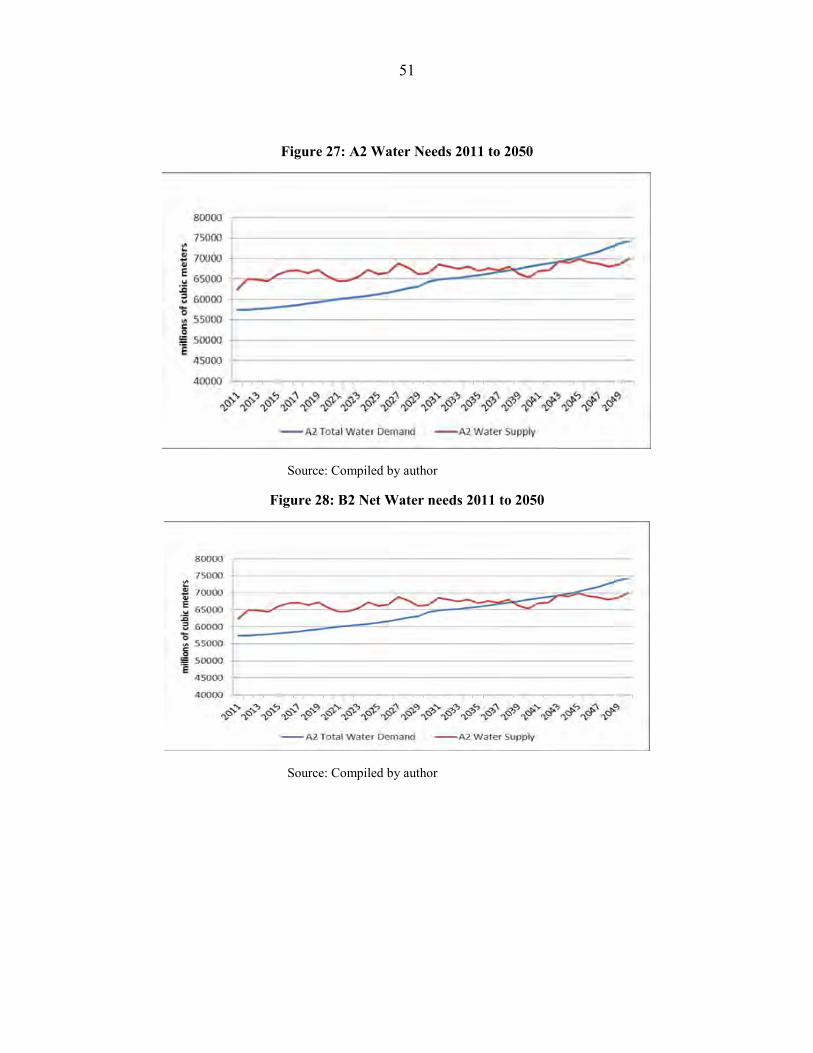
51
Figure 27: A2 Water Needs 2011 to 2050
Source: Compiled by author
Figure 28: B2 Net Water needs 2011 to 2050
Source: Compiled by author
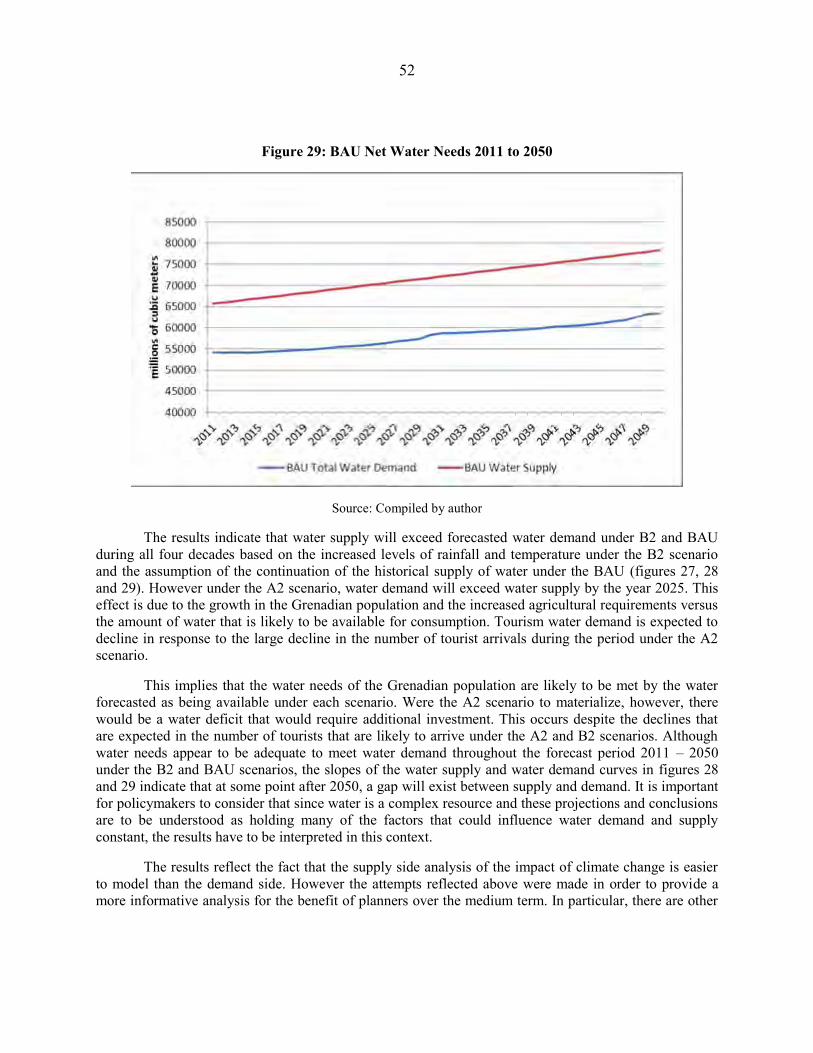
52
Figure 29: BAU Net Water Needs 2011 to 2050
Source: Compiled by author
The results indicate that water supply will exceed forecasted water demand under B2 and BAU during all four decades based on the increased levels of rainfall and temperature under the B2 scenario and the assumption of the continuation of the historical supply of water under the BAU (figures 27, 28 and 29). However under the A2 scenario, water demand will exceed water supply by the year 2025. This effect is due to the growth in the Grenadian population and the increased agricultural requirements versus the amount of water that is likely to be available for consumption. Tourism water demand is expected to decline in response to the large decline in the number of tourist arrivals during the period under the A2 scenario.
This implies that the water needs of the Grenadian population are likely to be met by the water forecasted as being available under each scenario. Were the A2 scenario to materialize, however, there would be a water deficit that would require additional investment. This occurs despite the declines that are expected in the number of tourists that are likely to arrive under the A2 and B2 scenarios. Although water needs appear to be adequate to meet water demand throughout the forecast period 2011 – 2050 under the B2 and BAU scenarios, the slopes of the water supply and water demand curves in figures 28 and 29 indicate that at some point after 2050, a gap will exist between supply and demand. It is important for policymakers to consider that since water is a complex resource and these projections and conclusions are to be understood as holding many of the factors that could influence water demand and supply constant, the results have to be interpreted in this context.
The results reflect the fact that the supply side analysis of the impact of climate change is easier to model than the demand side. However the attempts reflected above were made in order to provide a more informative analysis for the benefit of planners over the medium term. In particular, there are other
53
ecological issues and other anticipated impacts of climate change such as sea-level rise that have not been modelled in this analysis.
Sea-level rise is of particular concern for small-island developing states like Grenada that depend heavily on freshwater supplies and locate major infrastructure on the coast. SLR is anticipated to have a substantial impact on the quality of the available water resources particularly during the forecast horizon. Consider further the issues of the quality and health of these ―excess supplies‖ that are forecasted based on the analysis. It will be increasingly important for planners to consider this aspect since salt-water intrusion due to sea-level rise and contamination associated with general economic development and debris from natural disasters (Arnell (2004) and Terry (2007) which may require expensive and expansive purification and treatment plants. Although not specified as a variable in the analysis, it is important that the quality and health of the available water supplies be prioritized in the development of catchment and storage capacities. In addition, the analysis does not explicitly contend with the possible rise of new sectors that have an unforeseen impact on the demand for water. Finally, the well-known climatic differences between mainland Grenada and the outlying islands should be brought to bear on the infrastructural response to developing and locating storage infrastructure to facilitate demand.
Seasonality and ―erratic‖ patterns of rainfall are masked in the model, and those are of critical concern for water resources planning in Grenada. As discussed elsewhere in this document, variability in the incidence of rainfall as well as apparent declining totals has influenced streamflow and water availability.
Taken together, this analysis indicates the need for additional water catchment, storage and dissemination infrastructure in order to meet the demands of the Grenadian population within and beyond the next four decades. The decision to invest in additional infrastructure to facilitate water needs beyond the 2050 forecast period will depend on the time horizon of policymakers, the probability they assign to the likelihood of each scenario materializing, and the availability and opportunity cost of tax revenues available for expenditure purposes.
VI. ADAPTATION STRATEGIES
It was reported earlier in this paper that the Global Water Partnership in its policy brief indicated that the best way for countries to build the capacity to adapt to climate change would be to improve their ability to cope with today‘s climate variability (GWP, 2005).
Grenada‘s dependence on rainfall increases the country‘s vulnerability to future changes in both the occurrence and the distribution of rainfall. Low rainfall can lead to reduction in river flows and in turn a reduction in the amount of water that can be physically harvested. This means that it is unlikely that demand will be met during periods of low rainfall. The 2009-2010 drought described earlier in this paper was indicative of the stress produced from the water deficit. On the other hand, during the rainy season, lack of suitable land areas for dams and high runoff during storms result in significant loss of surface water to the sea, as well as increased levels of turbidity from accelerated soil erosion.
54
Measures that have been suggested to respond to projected changes in water resources in SIDS include:
Incentives to encourage the use of water saving devices Selecting appropriate drought tolerant vegetation Establishing river buffer zones to enhance the resilience of the river and catchment area updating national water policies Improving water resources management Revising building codes to increase opportunities for rainwater catchment and storage; preparing
water resource master plans for islands Assessing and improving the water supply system.
Globally some of the approaches taken have included the following:
Top-down (expanded irrigation systems) versus bottom-up (community-based water harvesting or allocation systems).
Policy level (integrated water management policies accounting for climate change impacts) versus operational (location and design of bridges, reservoirs and hydropower facilities) level.
Traditional (water managers would fit a drainage system in an area projected to experience more intense rainfall events with bigger pipes when replacing old ones) versus modern
A mainstreamed adaptation strategy in the water sector includes measures that address the underlying factors of vulnerability to climate change particularly at the local scale.
The following measures, as recommended by L. Nurse at the UNESCO international seminar on climate change education in 2009, can reduce some of the risks on the water sector if implemented in a timely manner:
Infrastructural - e.g. erect coastal and flood protection (SLR & flooding); adopt technologies that improve water use efficiency, e.g. trickle irrigation
Behavioural - altered habits and choices e.g. alter irrigation practices such as time of day to achieve maximum use of the resource, desist from using treated water for some non-domestic purposes
Managerial - e.g. altered farm practices such as cultivation of drought-tolerant cultivars; implementation of demand management strategies (e.g. through metering and pricing)
Government Policy - e.g. planning regulations; building codes; use of appropriate, renewable energy sources –solar, wind, bio-fuels, landfill gas (methane).
Handling these issues also requires building individual and institutional ―capacity to change‖ as new practices and procedures need to be developed and implemented.
A. INCREASING ADAPTIVE CAPACITY
Adaptive capacity is regarded as a prerequisite for the pursuit of effective adaptation strategies in order to reduce the harmful impacts of climate change. It may be influenced by a number of factors: public perception about and acceptance of exposure to risks; dependence on and relationship with natural
55
resources; technical skills and capabilities; social capital and social networks; institutional structures; decision-making and implementing authorities, and governance and political trends.
A positive aspect of adaptive capacity is the fact that it enables sectors and institutions at the same time to take advantage of opportunities and benefits from climate change, for instance longer growing seasons or increased potential for tourism (IPCC 2007: 21). According to the IPCC, the human and social capacities are viewed as key determinants of adaptive capacity on all scales. Further, it is argued that these aspects had the same relevance as income levels and technological capacity (IPCC 2007: 27).
Grenada‘s dependency on rainfall increases the country‘s vulnerability to future changes and distribution of rainfall. Low rainfall can lead to reduction in river flows and in turn a reduction in the amount of water that can be physically harvested. This will mean that it is unlikely that demand will be met during periods of low rainfall. On the other hand, during the rainy season, lack of suitable land areas for dams and high runoff during storms will result in significant loss of surface and stream water to the sea.
B. SELECTING STRATEGIES
Adaptation costs as defined in the Fourth Assessment Report of the Intergovernmental Panel on Climate Change are ―the costs of planning, preparing for, facilitating, and implementing adaptation measures, including transition costs‖, while the benefits are defined as ―the avoided damage costs or the accrued benefits following the adoption and implementation of adaptation measures‖.
The Subsidiary Body for Scientific and Technological Advice of the UNFCCC in its Synthesis report of 2010 (UNFCCC, 2010) , presented a summary of efforts undertaken to assess the costs and benefits of adaptation options, and views on lessons learned, good practices, gaps and needs. The report indicated that in some cases for adaptation, more can be achieved by using a cost-effectiveness approach – that is, selecting the options that have the lowest cost for achieving a given physical target of supplying key services. The islands of Niue and Tuvalu, for example, identified enhanced water supply and storage as the adaptation priority under the Pacific Adaptation to Climate Change project using such an approach. The aim was not to find alternative adaptation options that might yield a higher adaptation benefit but to find those options that ensure sufficient water quality and quantity for vulnerable communities.
In other cases, a risk-based approach, in which adaptation options are selected that achieve an acceptable risk level at least cost, may be more appropriate. The EU in its submission suggests that risk management approaches, including phased approaches or approaches based on ―no-regrets or win-win options‖, can be helpful in coping with uncertainty. Finally, in certain cases multi-criteria analysis may be adopted, to account for the fact that not all aspects can measured or costed. With multi-criteria analysis, a number of objectives are identified and each objective is given a weighting. Using this weighting, an overall score for each adaptation option is obtained, and the option with the highest score is selected.
The report further suggests that an assessment of the costs and benefits of adaptation options, can consider either the economic or the financial costs and benefits. Economic assessments consider the wider costs and benefits to the national economy as a whole. In contrast, financial costs are typically assessed within the budgetary framework of each of the options under consideration. For example, in its submission, the Russian Federation reported on its assessment of the financial costs of enhancing systematic observation in the country. It considered the efficiency of its hydrometeorological services by
56
assessing the costs of producing relevant hydrometeorological data and the benefits in terms of avoided damage achieved by preparatory measures that were made possible by the availability of high quality, timely forecasts. This approach is particularly applicable to Grenada which has recognised the need to improve the database for water resources management and is in the process of implementing the Water Resources Management Unit and a National Water Information System as described below.
It was also reported that Turkmenistan under the UNDP project, considered only those adaptation options that could eliminate the general risk of an expected water deficit of 5.5 km3 by 2030, following a cost-effectiveness approach. In Turkmenistan, 90 per cent of the total water resources are used for irrigation in agriculture, so the adaptation options assessed include improving water resources management, optimizing agricultural production and increasing the efficiency of irrigation systems. The total cost of adaptation options was calculated to be USD 16.1 billion between 2009 and 2030 (UNFCCC, 2010).
C. CURRENT WATER MANAGEMENT INITIATIVES IN GRENADA
As noted above Grenada‘s water resources and supply are negatively affected by extreme climate variability in the wet and dry season. During periods of drought, water demand is high and water distribution is a challenge in some areas. The drought of 2009-2010 underscored the urgency for adaptation measures to deal with existing and projected variability.
Grenada has proposed and in some instances commenced implementation of measures to improve water supply and to build sustainability and resilience in the sector.
1. Data collection, Monitoring and Analysis
Management of water resources and assessment of the impact of climate change is dependent on the availability of data in a form that can be utilised for monitoring trends and identifying anomalies. Hydrological data collection is very limited and assessment of data for computation of water balance, for example, is non-existent. The knowledge basis for decision –making and sustainable management of the existing limited water resources is inadequate.
A Drought and Precipitation Monitoring program has been established under the Caribbean Water Initiative being implemented jointly by McGill University, CIMH and three partner countries – Jamaica, Guyana and Grenada. The goal is to increase the capacity of the respective countries to implement Integrated Water Resources Management.(IWRM)
Inadequacies in the database of Grenada have been recognised and the recently drafted Water Policy has proposed establishment of the following institutional capacity building programmes. Water Resources Unit which will be charged with undertaking the gathering of data, investigations, monitoring, assessment and evaluation of water resources, water uses and demands. A National Water Information System is to be developed under the Water Policy Implementation Plan
57
2. Institutional Capacity Building
The Water Resources Unit is to be established under NAWASA until the legislative framework is put in place to transfer it to the Ministry of Agriculture, Forestry And Fisheries, Public Utilities and Energy. Among the several areas of responsibility are the following directly relevant to climate change adaptation:
Co-ordinate the development and implementation of a National Water Resources Management and Development Plan and ensure that it is reviewed on a quinquennial basis;
Coordinate water resource management initiatives, projects and programmes, including climate change and hazard mitigation.
NAWASA is to improve its water management function and included among responsibilities are the following initiatives relevant to water sector adaptation:
Undertake quality monitoring and reporting and notification of incidents and infractions of standards
Promotion of water conservation and the efficient use of water by users including the provision of rainwater harvesting schemes for community water supply
3. Infrastructure Maintenance and Improvement
The Southern Grenada Water Supply Project was commissioned in March 2011. The work involved the rehabilitation of water treatment plants at Mardi Gras, Annandale, Les Avocats, Windsor Forest, Petit Etang and Mamma Cannes. Additionally, new water lines were installed in various parts of St. David and St. George. This project is significant for improving potable water to the highest population areas in Grenada.
The project was implemented over a period of 20 months, at a cost of more than EC 22 million dollars, under the 9th European Union Development Fund. Steps have been taken to prevent wastage of water, and a metering programme has been established in the southern water district. Standpipes have been removed as household water connections were mandatory. Payment for water through metering has encouraged conservation, and the recognition of water as a commodity as opposed to a public good to be used at will. Leakage through standpipes has also been stopped (ECLAC, 2007).
Desalination
Grenada established the 1,818 m3/day Woburn Desalinization Plant in 1998 as one solution to the challenge of water deficit in the southern communities. However, due to site and sizing issues this plant is not functional. Plants were also place on Carriacou and Petit Martinique, but Carriacou has frequent mechanical difficulties and petit Martinique was wiped out by Hurricane Ivan. Some private sector entities, including hotels, also operate small desalination plants.
58
4. Land Information and Management
Sustainable Land Management
The sustainable land management project (SLM) was conceived to work toward mainstreaming sustainable land management principles into development planning. Issues of land management in Grenada play a major role in the development cornerstones of food security and export agriculture; water supply; housing and tourism (table 12). These key ingredients of development require that the Government of Grenada employ best practice to address: land policy and land information; soil and slope protection; forest cover; water supply policy and legislation; and spatial planning
Development of the project has been inspired by recognition of the deleterious effect of environmental degradation on land, livelihoods and overall economic development. The impact of Hurricanes Ivan (2004) and Emily (2005) exposed the glaring needs. The ECLAC (2005) report on the ―Macroeconomic Assessment of Damage Caused by Hurricane Emily July 2005‖ indicates that the ―passage of both Ivan and Emily unambiguously point to the need for:
Land use and urban planning, the review of building codes and standards, and the regularization of informal settlements.
Immediate restoration and recovery efforts of infrastructure installations which, if left unattended, are further exacerbated by any climatic event, however small.
Watershed rehabilitation in order to mitigate soil erosion, sediment loading of rivers and loss of water through run-offs.
Establishment of a Land Management agency has been proposed under the Sustainable Land Management project.
5. Integrated Watershed Management
The effects of Hurricanes Ivan and Emily on the upland watershed have not been well documented but after two years the impact on the vegetation is still evident (CEHI, 2007). FAO have estimated though that forested land has declined to 12% and agricultural land to 35%, only 2% of the total land area is designated as protected areas. (GOG, 2010), further the extreme drought of 2009-2010 underscored the effects of deforestation as drought impact was greatly exacerbated.
6. Forest Rehabilitation
Grenada National Forest Policy (1999) emphasizes the role of forests in maintaining biological diversity, promoting soil and water conservation, and generating income through recreation and ecotourism activities (GoG, 2011). With respect to the watershed management subsector the policy speaks to the following strategic directions:
Adoption of an integrated approach to watershed management; Conservation of all ground and surface water resources and protection from pollution and
depletion; Maximization of soil cover and prevention of deforestation, as far as possible, in all watershed
areas and minimization of soil erosion and sedimentation; and
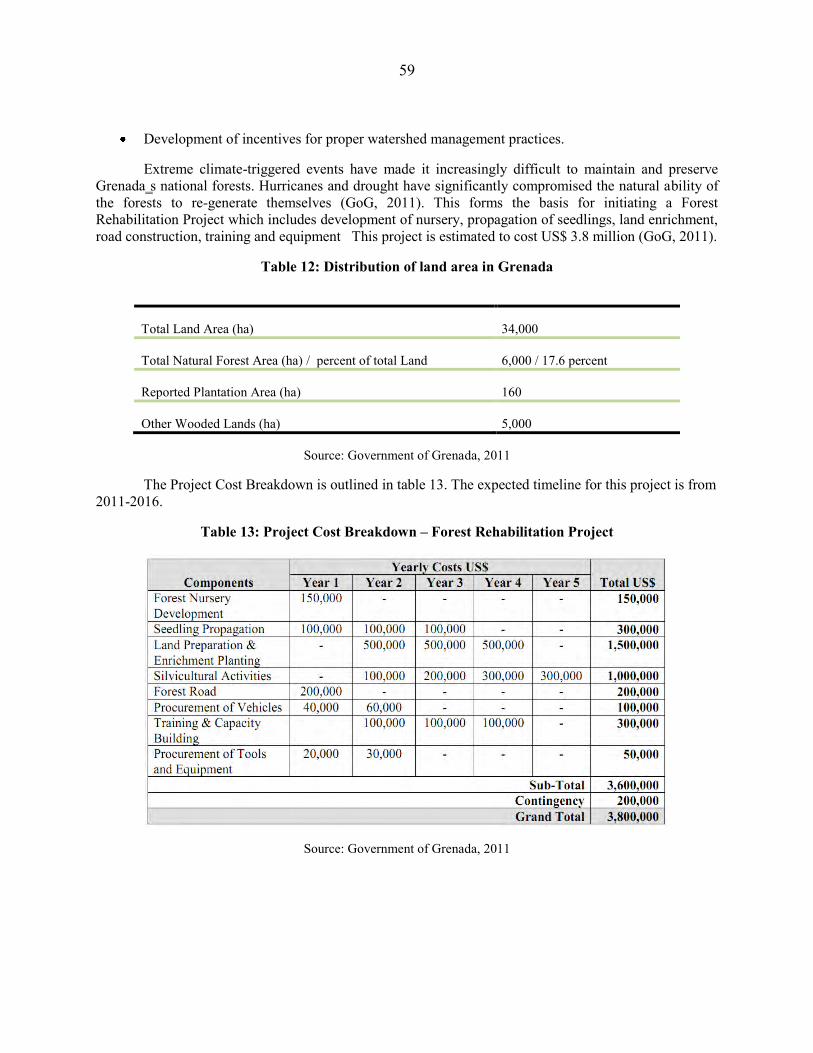
59
Development of incentives for proper watershed management practices.
Extreme climate-triggered events have made it increasingly difficult to maintain and preserve Grenada‗s national forests. Hurricanes and drought have significantly compromised the natural ability of the forests to re-generate themselves (GoG, 2011). This forms the basis for initiating a Forest Rehabilitation Project which includes development of nursery, propagation of seedlings, land enrichment, road construction, training and equipment This project is estimated to cost US$ 3.8 million (GoG, 2011).
Table 12: Distribution of land area in Grenada
Total Land Area (ha) 34,000
Total Natural Forest Area (ha) / percent of total Land 6,000 / 17.6 percent
Reported Plantation Area (ha) 160
Other Wooded Lands (ha) 5,000
Source: Government of Grenada, 2011
The Project Cost Breakdown is outlined in table 13. The expected timeline for this project is from 2011-2016.
Table 13: Project Cost Breakdown – Forest Rehabilitation Project
Source: Government of Grenada, 2011
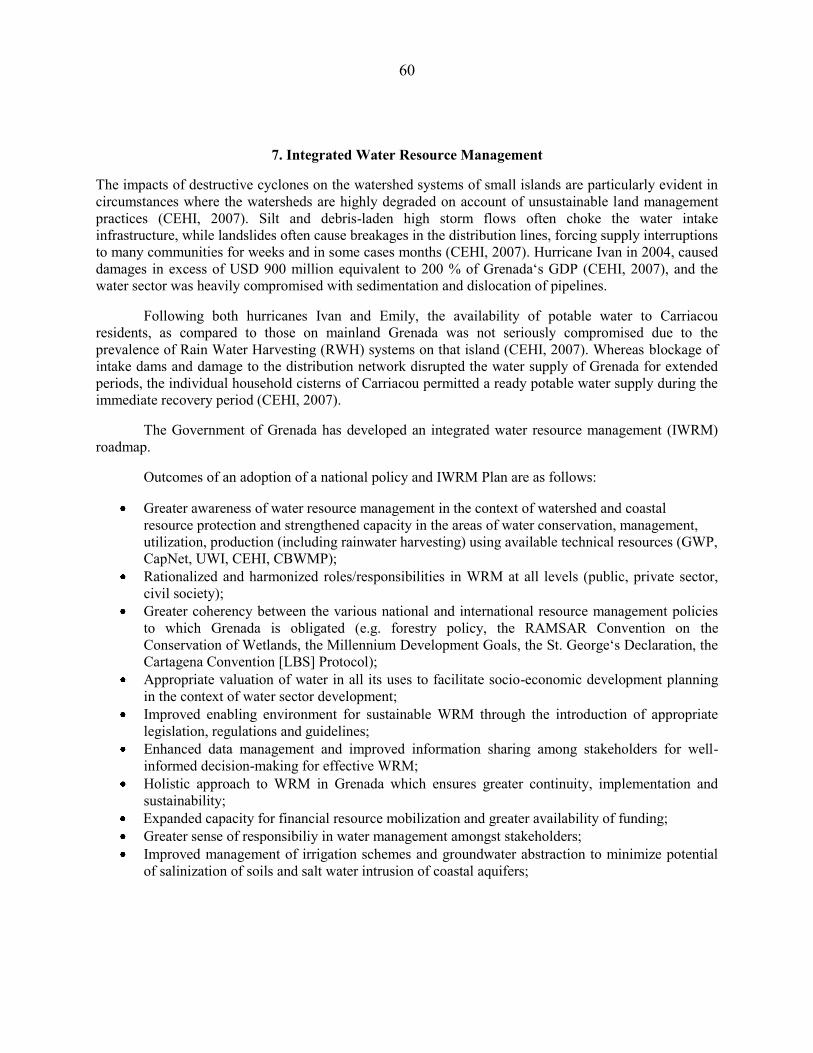
60
7. Integrated Water Resource Management
The impacts of destructive cyclones on the watershed systems of small islands are particularly evident in circumstances where the watersheds are highly degraded on account of unsustainable land management practices (CEHI, 2007). Silt and debris-laden high storm flows often choke the water intake infrastructure, while landslides often cause breakages in the distribution lines, forcing supply interruptions to many communities for weeks and in some cases months (CEHI, 2007). Hurricane Ivan in 2004, caused damages in excess of USD 900 million equivalent to 200 % of Grenada‘s GDP (CEHI, 2007), and the water sector was heavily compromised with sedimentation and dislocation of pipelines.
Following both hurricanes Ivan and Emily, the availability of potable water to Carriacou residents, as compared to those on mainland Grenada was not seriously compromised due to the prevalence of Rain Water Harvesting (RWH) systems on that island (CEHI, 2007). Whereas blockage of intake dams and damage to the distribution network disrupted the water supply of Grenada for extended periods, the individual household cisterns of Carriacou permitted a ready potable water supply during the immediate recovery period (CEHI, 2007).
The Government of Grenada has developed an integrated water resource management (IWRM) roadmap.
Outcomes of an adoption of a national policy and IWRM Plan are as follows:
Greater awareness of water resource management in the context of watershed and coastal resource protection and strengthened capacity in the areas of water conservation, management, utilization, production (including rainwater harvesting) using available technical resources (GWP, CapNet, UWI, CEHI, CBWMP);
Rationalized and harmonized roles/responsibilities in WRM at all levels (public, private sector, civil society);
Greater coherency between the various national and international resource management policies to which Grenada is obligated (e.g. forestry policy, the RAMSAR Convention on the Conservation of Wetlands, the Millennium Development Goals, the St. George‘s Declaration, the Cartagena Convention [LBS] Protocol);
Appropriate valuation of water in all its uses to facilitate socio-economic development planning in the context of water sector development;
Improved enabling environment for sustainable WRM through the introduction of appropriate legislation, regulations and guidelines;
Enhanced data management and improved information sharing among stakeholders for well-informed decision-making for effective WRM;
Holistic approach to WRM in Grenada which ensures greater continuity, implementation and sustainability;
Expanded capacity for financial resource mobilization and greater availability of funding; Greater sense of responsibiliy in water management amongst stakeholders; Improved management of irrigation schemes and groundwater abstraction to minimize potential
of salinization of soils and salt water intrusion of coastal aquifers;
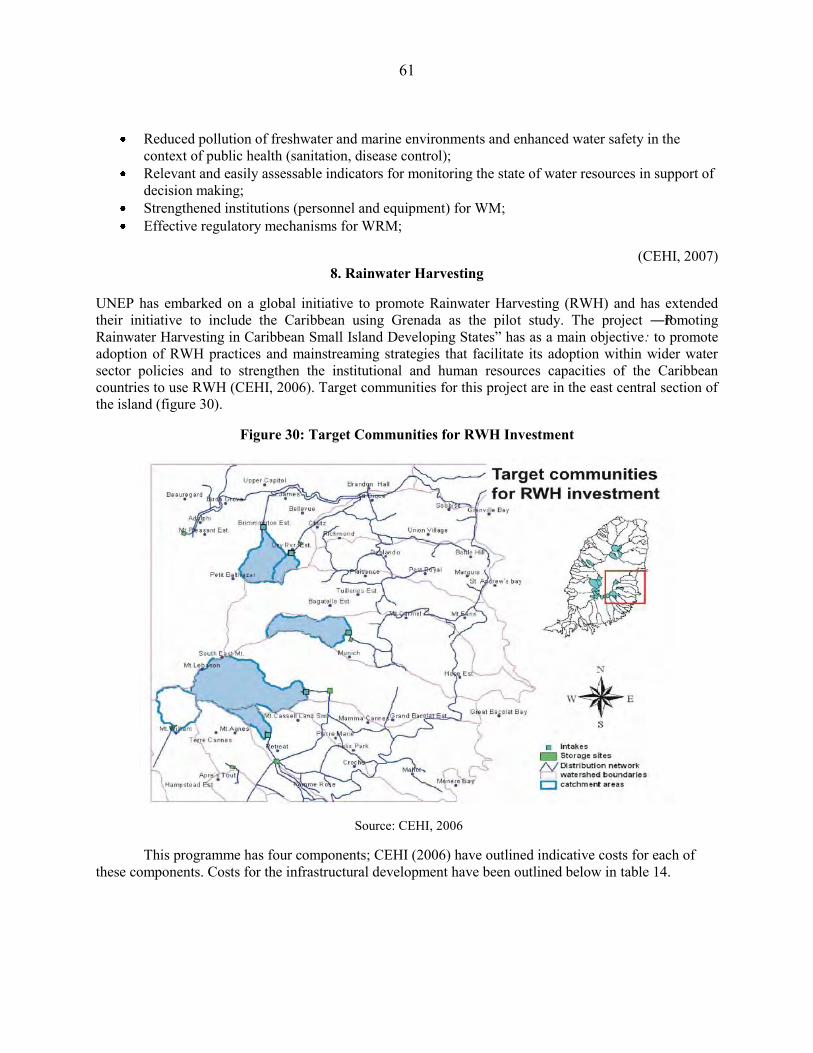
61
Reduced pollution of freshwater and marine environments and enhanced water safety in the context of public health (sanitation, disease control);
Relevant and easily assessable indicators for monitoring the state of water resources in support of decision making;
Strengthened institutions (personnel and equipment) for WM; Effective regulatory mechanisms for WRM;
(CEHI, 2007) 8. Rainwater Harvesting
UNEP has embarked on a global initiative to promote Rainwater Harvesting (RWH) and has extended their initiative to include the Caribbean using Grenada as the pilot study. The project ―Promoting Rainwater Harvesting in Caribbean Small Island Developing States‖ has as a main objective: to promote adoption of RWH practices and mainstreaming strategies that facilitate its adoption within wider water sector policies and to strengthen the institutional and human resources capacities of the Caribbean countries to use RWH (CEHI, 2006). Target communities for this project are in the east central section of the island (figure 30).
Figure 30: Target Communities for RWH Investment
Source: CEHI, 2006
This programme has four components; CEHI (2006) have outlined indicative costs for each of these components. Costs for the infrastructural development have been outlined below in table 14.
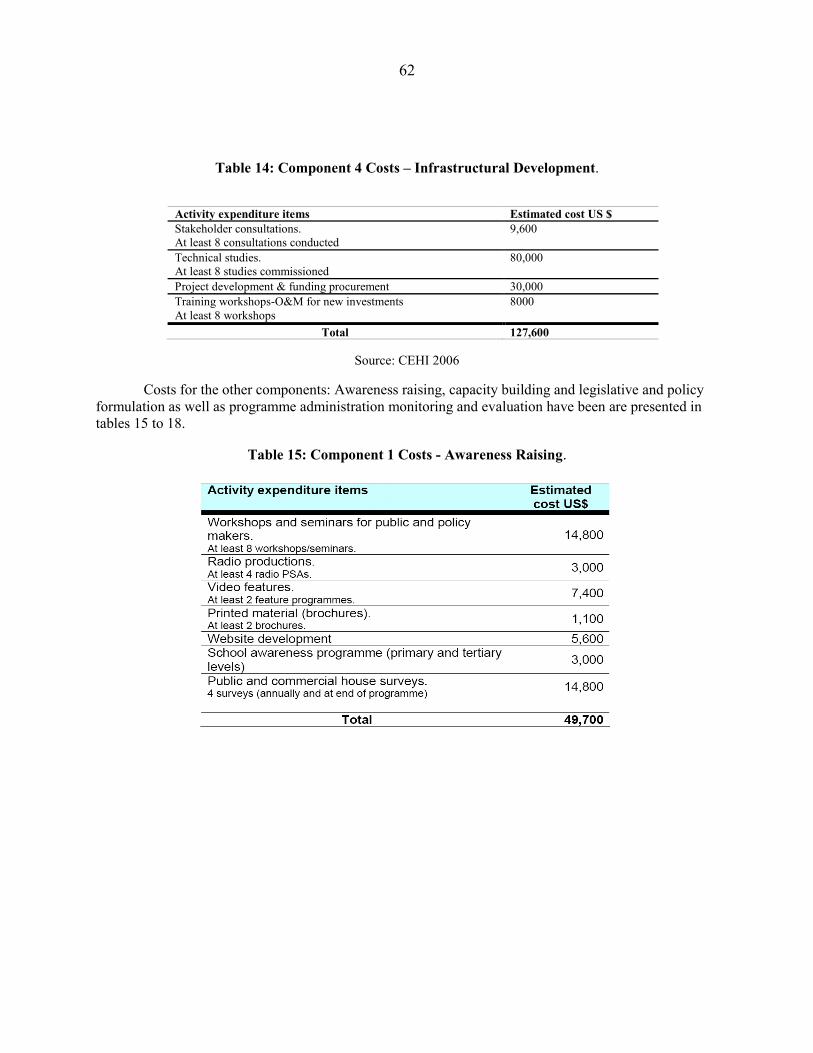
62
Table 14: Component 4 Costs – Infrastructural Development.
Activity expenditure items Estimated cost US $ Stakeholder consultations. At least 8 consultations conducted
9,600
Technical studies. At least 8 studies commissioned
80,000
Project development & funding procurement 30,000 Training workshops-O&M for new investments At least 8 workshops
8000
Total 127,600
Source: CEHI 2006
Costs for the other components: Awareness raising, capacity building and legislative and policy formulation as well as programme administration monitoring and evaluation have been are presented in tables 15 to 18.
Table 15: Component 1 Costs - Awareness Raising.
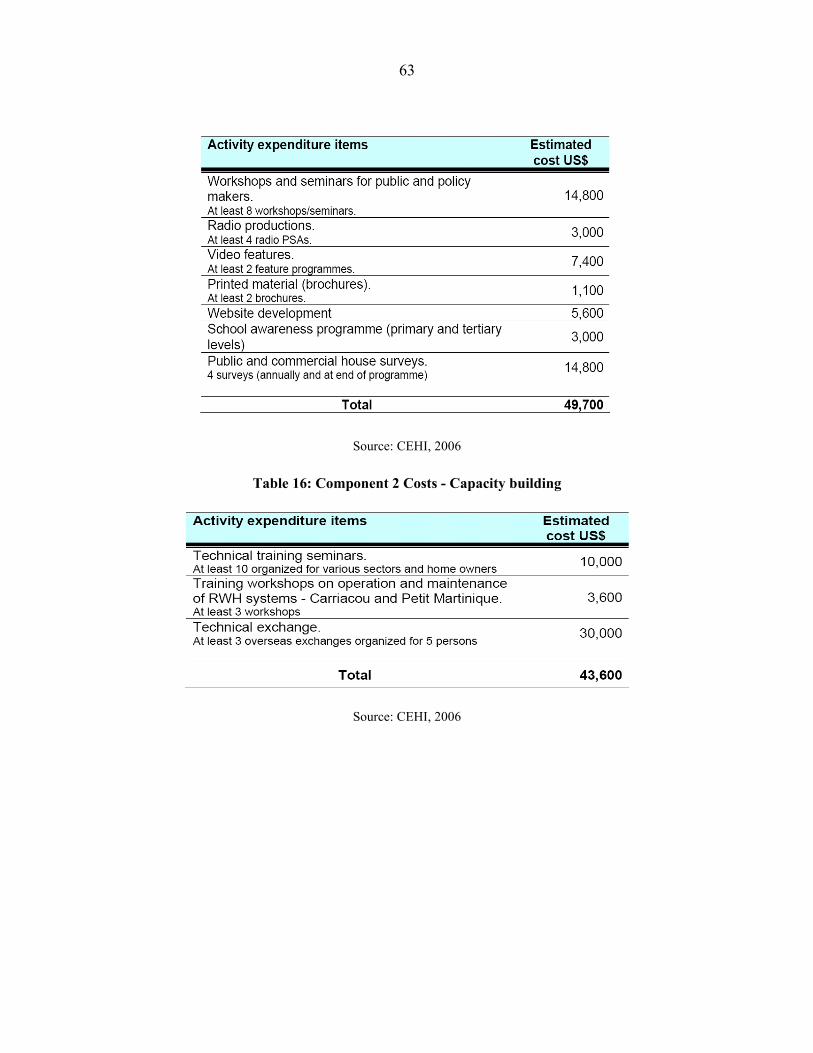
63
Source: CEHI, 2006
Table 16: Component 2 Costs - Capacity building
Source: CEHI, 2006
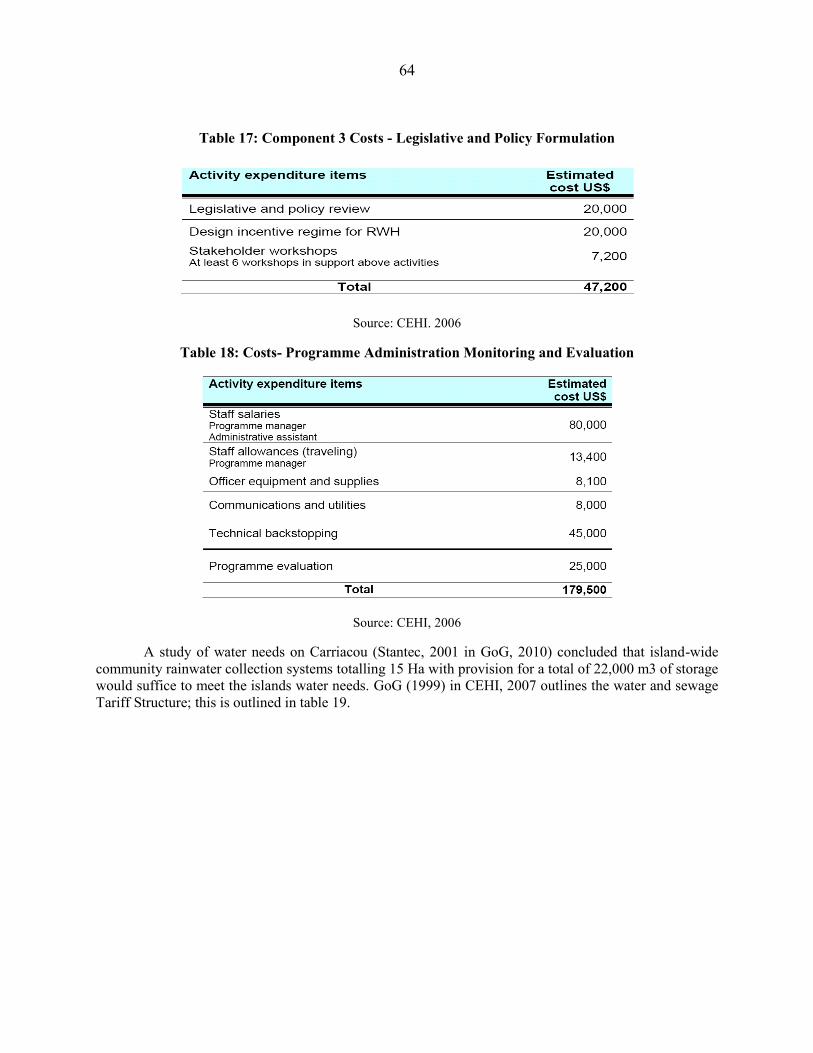
64
Table 17: Component 3 Costs - Legislative and Policy Formulation
Source: CEHI. 2006
Table 18: Costs- Programme Administration Monitoring and Evaluation
Source: CEHI, 2006
A study of water needs on Carriacou (Stantec, 2001 in GoG, 2010) concluded that island-wide community rainwater collection systems totalling 15 Ha with provision for a total of 22,000 m3 of storage would suffice to meet the islands water needs. GoG (1999) in CEHI, 2007 outlines the water and sewage Tariff Structure; this is outlined in table 19.
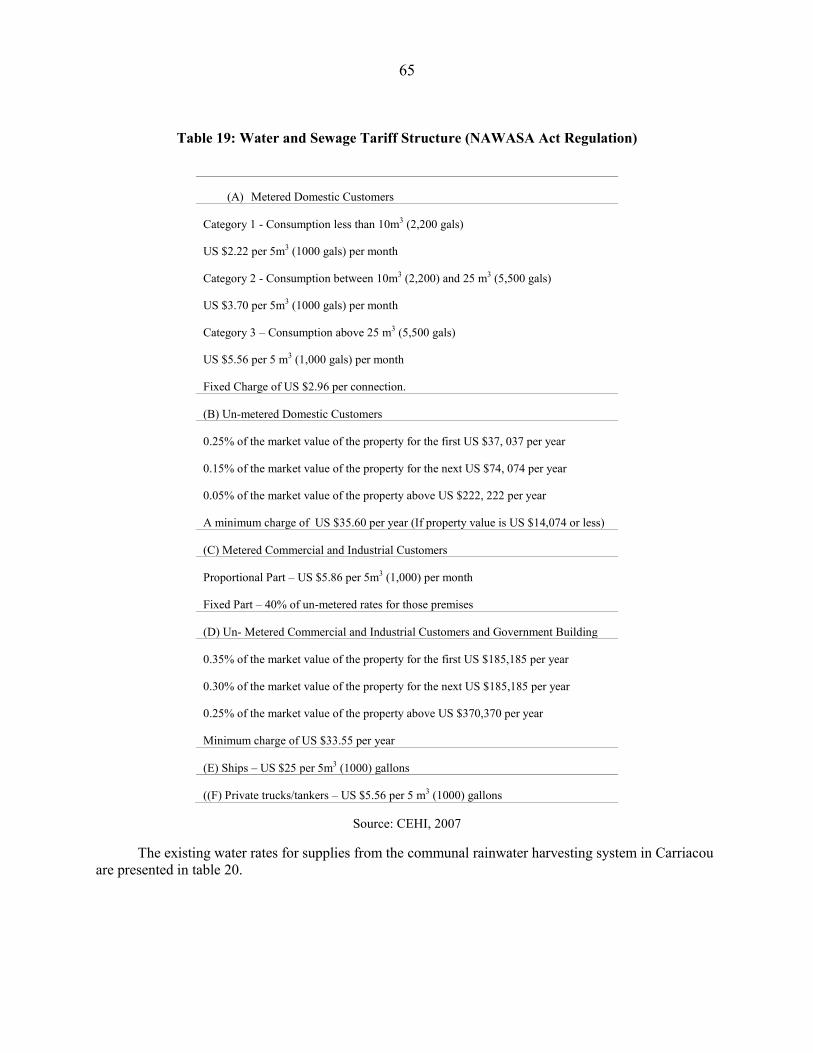
65
Table 19: Water and Sewage Tariff Structure (NAWASA Act Regulation)
(A) Metered Domestic Customers
Category 1 - Consumption less than 10m3 (2,200 gals)
US $2.22 per 5m3 (1000 gals) per month
Category 2 - Consumption between 10m3 (2,200) and 25 m3 (5,500 gals)
US $3.70 per 5m3 (1000 gals) per month
Category 3 – Consumption above 25 m3 (5,500 gals)
US $5.56 per 5 m3 (1,000 gals) per month
Fixed Charge of US $2.96 per connection.
(B) Un-metered Domestic Customers
0.25% of the market value of the property for the first US $37, 037 per year
0.15% of the market value of the property for the next US $74, 074 per year
0.05% of the market value of the property above US $222, 222 per year
A minimum charge of US $35.60 per year (If property value is US $14,074 or less)
(C) Metered Commercial and Industrial Customers
Proportional Part – US $5.86 per 5m3 (1,000) per month
Fixed Part – 40% of un-metered rates for those premises
(D) Un- Metered Commercial and Industrial Customers and Government Building
0.35% of the market value of the property for the first US $185,185 per year
0.30% of the market value of the property for the next US $185,185 per year
0.25% of the market value of the property above US $370,370 per year
Minimum charge of US $33.55 per year
(E) Ships – US $25 per 5m3 (1000) gallons
((F) Private trucks/tankers – US $5.56 per 5 m3 (1000) gallons
Source: CEHI, 2007
The existing water rates for supplies from the communal rainwater harvesting system in Carriacou are presented in table 20.
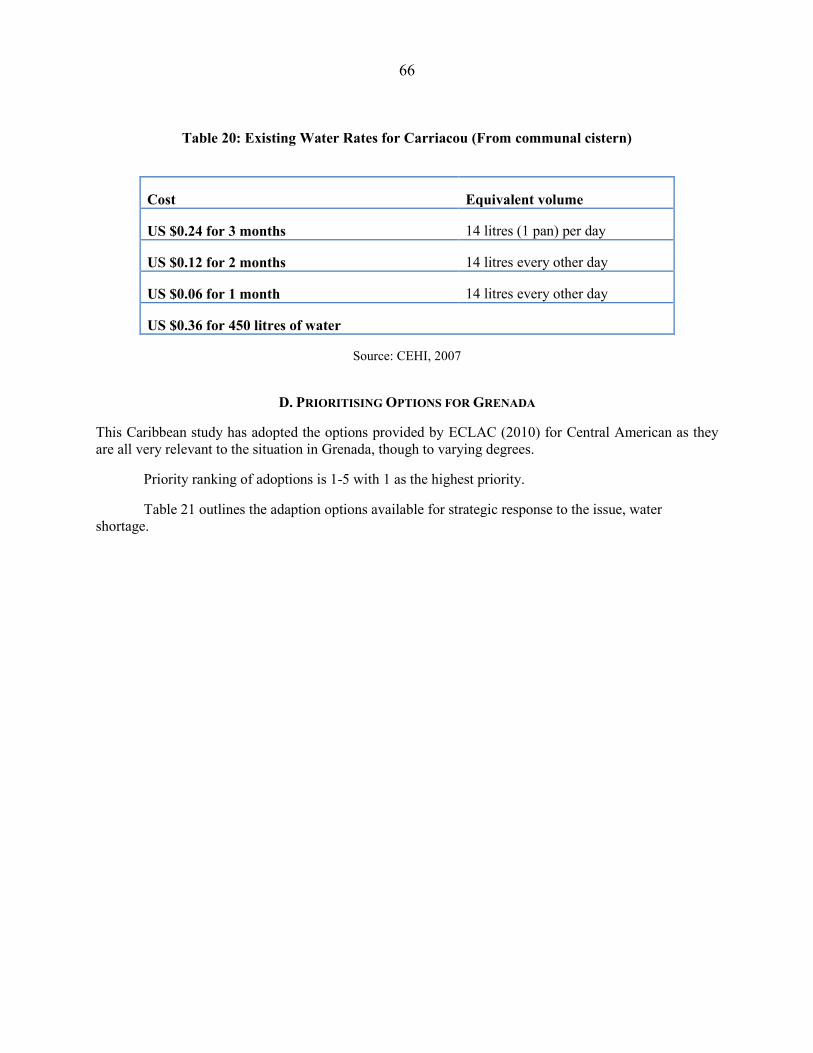
66
Table 20: Existing Water Rates for Carriacou (From communal cistern)
Cost Equivalent volume
US $0.24 for 3 months 14 litres (1 pan) per day
US $0.12 for 2 months 14 litres every other day
US $0.06 for 1 month 14 litres every other day
US $0.36 for 450 litres of water
Source: CEHI, 2007
D. PRIORITISING OPTIONS FOR GRENADA
This Caribbean study has adopted the options provided by ECLAC (2010) for Central American as they are all very relevant to the situation in Grenada, though to varying degrees.
Priority ranking of adoptions is 1-5 with 1 as the highest priority.
Table 21 outlines the adaption options available for strategic response to the issue, water shortage.
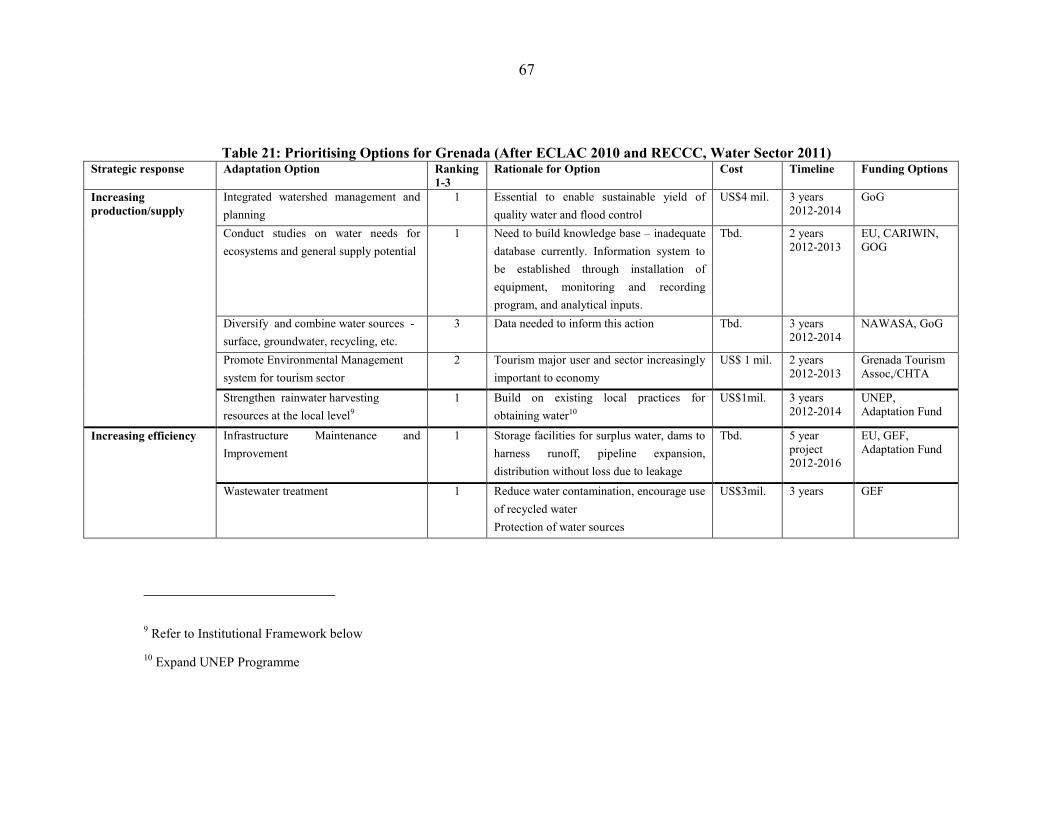
67
Table 21: Prioritising Options for Grenada (After ECLAC 2010 and RECCC, Water Sector 2011) Strategic response Adaptation Option Ranking
1-3 Rationale for Option Cost Timeline Funding Options
Increasing production/supply
Integrated watershed management and planning
1 Essential to enable sustainable yield of quality water and flood control
US$4 mil. 3 years 2012-2014
GoG
Conduct studies on water needs for ecosystems and general supply potential
1 Need to build knowledge base – inadequate database currently. Information system to be established through installation of equipment, monitoring and recording program, and analytical inputs.
Tbd. 2 years 2012-2013
EU, CARIWIN, GOG
Diversify and combine water sources - surface, groundwater, recycling, etc.
3 Data needed to inform this action Tbd. 3 years 2012-2014
NAWASA, GoG
Promote Environmental Management system for tourism sector
2 Tourism major user and sector increasingly important to economy
US$ 1 mil. 2 years 2012-2013
Grenada Tourism Assoc,/CHTA
Strengthen rainwater harvesting resources at the local level9
1 Build on existing local practices for obtaining water10
US$1mil. 3 years 2012-2014
UNEP, Adaptation Fund
Increasing efficiency
Infrastructure Maintenance and Improvement
1 Storage facilities for surplus water, dams to harness runoff, pipeline expansion, distribution without loss due to leakage
Tbd. 5 year project 2012-2016
EU, GEF, Adaptation Fund
Wastewater treatment
1 Reduce water contamination, encourage use of recycled water Protection of water sources
US$3mil. 3 years
GEF
9 Refer to Institutional Framework below
10 Expand UNEP Programme
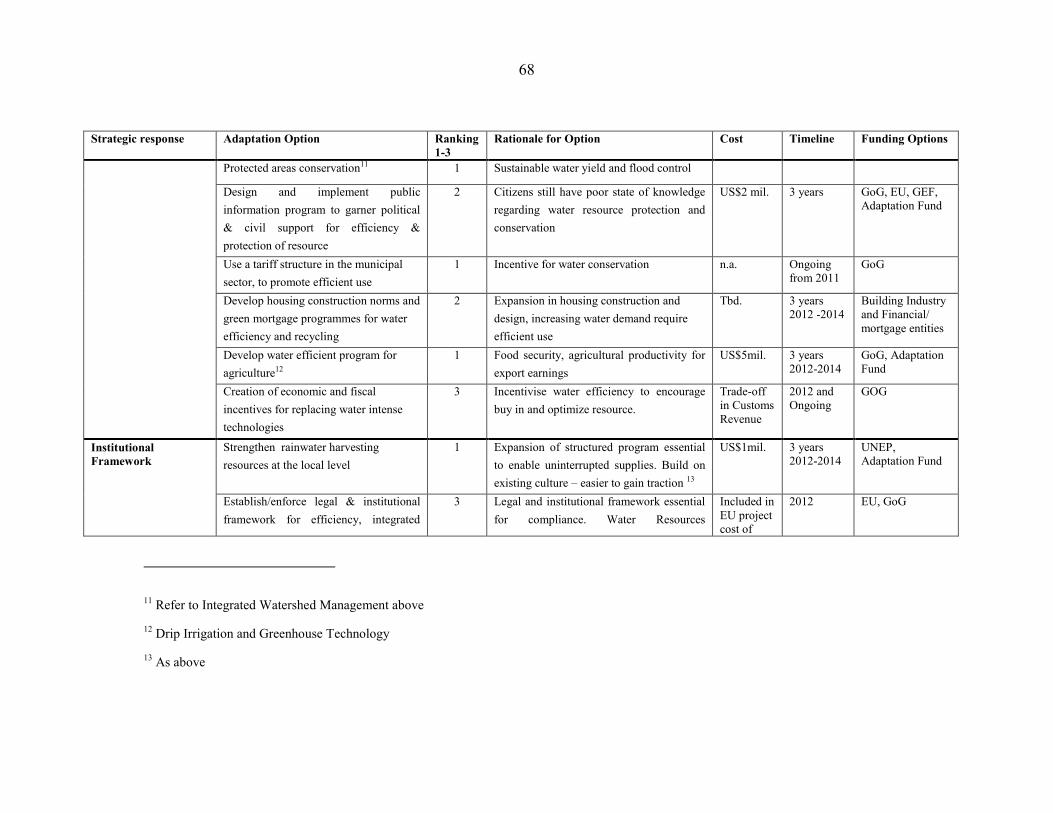
68
Strategic response Adaptation Option Ranking 1-3
Rationale for Option Cost Timeline Funding Options
Protected areas conservation11 1 Sustainable water yield and flood control
Design and implement public information program to garner political & civil support for efficiency & protection of resource
2 Citizens still have poor state of knowledge regarding water resource protection and conservation
US$2 mil. 3 years GoG, EU, GEF, Adaptation Fund
Use a tariff structure in the municipal sector, to promote efficient use
1 Incentive for water conservation n.a. Ongoing from 2011
GoG
Develop housing construction norms and green mortgage programmes for water efficiency and recycling
2 Expansion in housing construction and design, increasing water demand require efficient use
Tbd. 3 years 2012 -2014
Building Industry and Financial/ mortgage entities
Develop water efficient program for agriculture12
1 Food security, agricultural productivity for export earnings
US$5mil. 3 years 2012-2014
GoG, Adaptation Fund
Creation of economic and fiscal incentives for replacing water intense technologies
3 Incentivise water efficiency to encourage buy in and optimize resource.
Trade-off in Customs Revenue
2012 and Ongoing
GOG
Institutional Framework
Strengthen rainwater harvesting resources at the local level
1 Expansion of structured program essential to enable uninterrupted supplies. Build on existing culture – easier to gain traction 13
US$1mil. 3 years 2012-2014
UNEP, Adaptation Fund
Establish/enforce legal & institutional framework for efficiency, integrated
3 Legal and institutional framework essential for compliance. Water Resources
Included in EU project cost of
2012 EU, GoG
11 Refer to Integrated Watershed Management above
12 Drip Irrigation and Greenhouse Technology
13 As above
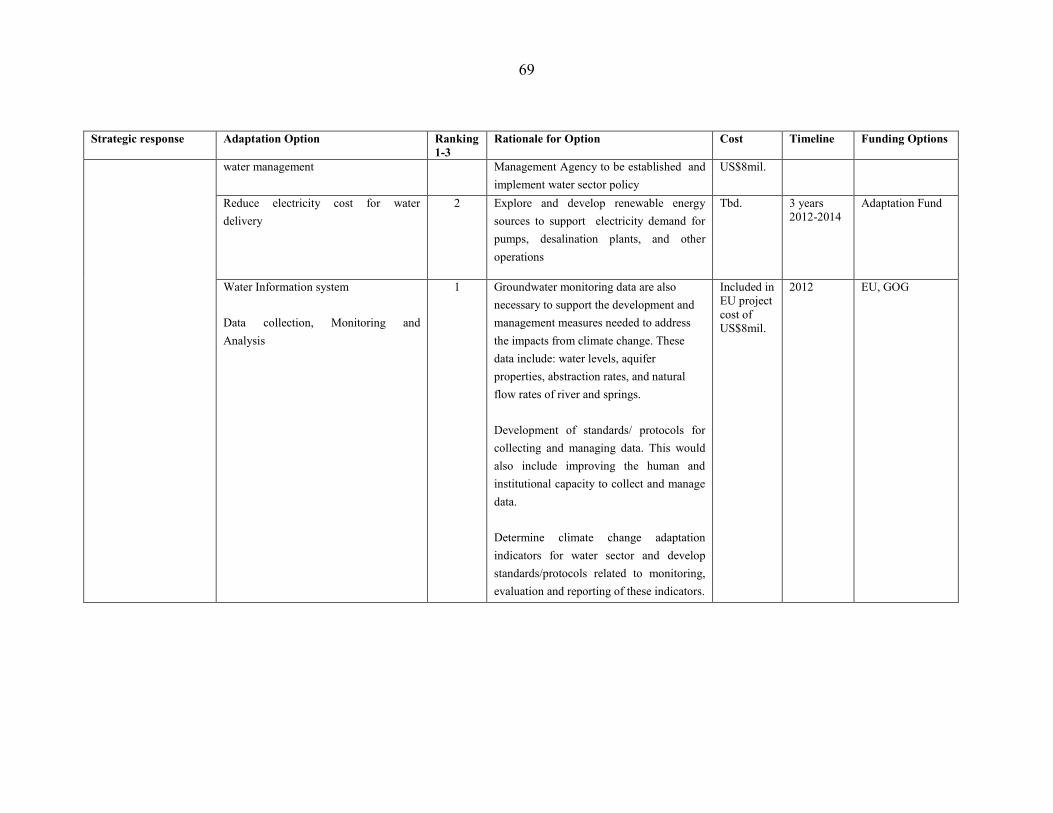
69
Strategic response Adaptation Option Ranking 1-3
Rationale for Option Cost Timeline Funding Options
water management Management Agency to be established and implement water sector policy
US$8mil.
Reduce electricity cost for water delivery
2 Explore and develop renewable energy sources to support electricity demand for pumps, desalination plants, and other operations
Tbd. 3 years 2012-2014
Adaptation Fund
Water Information system Data collection, Monitoring and Analysis
1 Groundwater monitoring data are also necessary to support the development and management measures needed to address the impacts from climate change. These data include: water levels, aquifer properties, abstraction rates, and natural flow rates of river and springs. Development of standards/ protocols for collecting and managing data. This would also include improving the human and institutional capacity to collect and manage data. Determine climate change adaptation indicators for water sector and develop standards/protocols related to monitoring, evaluation and reporting of these indicators.
Included in EU project cost of US$8mil.
2012 EU, GOG
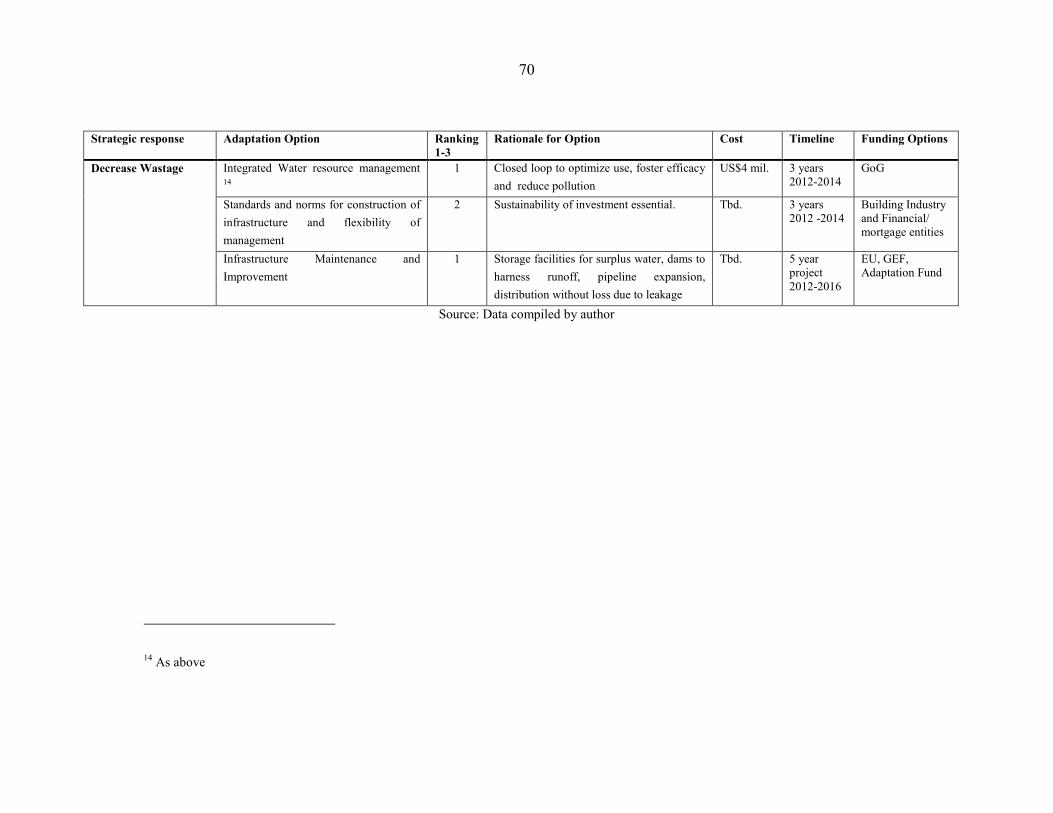
70
Strategic response Adaptation Option Ranking 1-3
Rationale for Option Cost Timeline Funding Options
Decrease Wastage
Integrated Water resource management 14
1 Closed loop to optimize use, foster efficacy and reduce pollution
US$4 mil. 3 years 2012-2014
GoG
Standards and norms for construction of infrastructure and flexibility of management
2 Sustainability of investment essential. Tbd. 3 years 2012 -2014
Building Industry and Financial/ mortgage entities
Infrastructure Maintenance and Improvement
1 Storage facilities for surplus water, dams to harness runoff, pipeline expansion, distribution without loss due to leakage
Tbd. 5 year project 2012-2016
EU, GEF, Adaptation Fund
Source: Data compiled by author
14 As above
71
E. SUMMARY PRIORITIES
Priority 1
1. Water Information system - Data collection, Monitoring and Analysis
It has been shown earlier in the report that paucity of data is a major constraining factor for decision-making and sustainable management of the water resource that is becoming increasingly variable and inadequate to meet the needs of Grenada. Data for monitoring and modelling the behavior of rainfall- runoff relationships and other parameters of water availability are not now available. The ability to plan for and manage the effects of growing variability, seasonality and intensity of hydrometeorological phenomena in Grenada requires building the database to underpin the knowledge/information platform.
2. Infrastructure Maintenance and Improvement
Build storage facilities for surplus water, and dams to harness runoff, and rainwater harvesting. Review placement of coastal infrastructure with respect to storm surge vulnerability and saline intrusion. Expand pipeline network to increase penetration especially among the poor, and effect distribution without loss due to leakage. Explore renewable energy sources to support electricity demand for pumps, desalination plants, and other operations.
3. Integrated Water resource management
This closed loop approach to water management is being promoted globally to effect optimal use of water resources and to reduce pollution. It involves protecting water sources, efficient water collection at source, treatment according to use, efficient use, wastewater collection, treatment, reuse, recycling, and reintegration into the environment. Wastewater disposal is not currently managed to facilitate large scale recycling of treated wastewater or greywater. But efforts to stimulate the hotel sector and other enterprises should be made.
4. Integrated watershed management and planning
This initiative is essential to afford sustainable yield of quality water. The Sustainable Land Management programme already being pursued should emphasise the water management imperative for watershed protection, and the required policies and investment in slope protection, forest protection and reafforestation.
5. Decentralise rainwater harvesting to strengthen resources at the local level
6. Promote and support Environmental Management system for tourism sector to foster ecoefficiency and waste management
7. Use a tariff structure in the municipal sector, to promote efficient use
72
Priority 2
1 Conduct studies on water needs for ecosystems, and general supply potential
2 Establish/enforce legal and institutional framework for efficiency, integrated water management
3 Develop water efficient program for agriculture - crop sensitivity, storage dams, soil management, drip irrigation, control of pollution from biocides
4 Design and implement public information program to garner political and civil support for efficiency and protection of resource
5 Develop housing construction norms and green mortgage programmes for water efficiency and recycling
Priority 3
Priority 3 is no less significant but in terms of timing they are suggested for implementation following priorities 1 and 2. Implementation is a function of resource availability, but it is recommended that the Government seek the funds required to integrate the adaptation measures in current or expanded water supply programming. Programs should be approached in a holistic manner and not as ―add-on‖ isolated initiatives.
Section VII examines costs of adaptation and attempts a cost effectiveness analysis.
The Tourism Master Plan identified the problem of freshwater availability as a limiting factor for projected tourism development in Grenada. (GOG, 2010)
F. OTHER PROPOSED STRATEGIES
Demand Management
Agricultural sector
G. CLIMATE CHANGE MITIGATION THROUGH THE WATER SECTOR
Energy is a major cost to water treatment and distribution. It has been suggested that renewable energy sources and particularly solar technology, be used as far as possible to provide the required power at the respective installations. Greenhouse gas emissions would be reduced, contributing to Grenada‘s obligations under the UNFCCC. Indeed it has been argued that adaptation and mitigation should proceed in tandem so as to derive optimal benefit from interventions to reduce the economic impact of climate change.
73
VII. COST BENEFIT CONSIDERATIONS
The approach taken in this section has, to a large extent, been determined by the unavailability of capital budgeting data in relation to the adaptation strategies proposed elsewhere. On the investment side costs associated with the technological solutions and related project inputs would at best be highly indicative, assuming even the use of proxy examples within the Caribbean. More challenging would be deriving an appropriate benefits stream arising from the water sector specific adaptation strategies. In short traditional cost benefit analyses were not pursued.
The approach therefore taken involves three components each addressing different though, not unrelated objectives. The first takes each of the main adaptation strategies recommended and searches through the literature to identify where relevant adaptation projects have been selected on the basis of favourable cost benefit ratios yielded. The objective being to offer a number of promising project types for further consideration and possible determination of their corresponding feasibilities for Grenada.
The second identifies some of the more recent detailed project identification studies undertaken within member states that can reasonably be considered to have relevance for Grenada. What sets them apart is that they have been proposed or implemented in other member states, each has relevancy for Grenada and therefore are likely to be reasonably replicable. Each will no doubt require some modifications and current local costs to be established. This will need to be worked out by the local water authorities. In addition, a priority list of projects is defined and an indicative cost assigned. The approach to selecting these projects and deriving their indicative costs is elaborated on below.
The third recognizes that a useful approach is to suggest a percentage of GDP that be earmarked for adaptation strategies for the Water Sector. The specific projects for funding, mainly those identified in a prioritizing list given, but some of which could be the extension or expansion of current ones, would emerge through a planning process centred on NAWASA. If this recommendation is adapted it would greatly facilitate the removal of implementation delays associated with identifying funding.
All of these approaches recognize that the precautionary principle reflected in the ―No Regrets approach‖ is most likely to offer the best protection against Climate Change. They also find support in the UNDP guiding principle for meeting the challenge of climate change, that adaptation must be seen as a continuous process.
To arrive at some indication of what this percentage allocation of GDP should be the approximate annual average water demand under climate change scenarios is first derived. Then based on indicative water production costs, the implied annual cost of water and its relation to GDP is determined and discounting methods applied. The implicit assumption being that the historic cost of water production extrapolated into the future becomes a good proxy for the magnitude of GDP resources required for meeting the water demand forecasted. The resulting financial commitment to funding is found to be consistent with the independently arrived at annual prioritized project expenditures recommended. Each of these approaches is now presented.
74
A. ADAPTATION EXPERIENCES
The recommended adaptation strategies selected from those offered in Section VI as also the matching adaptation experiences identified, meet two requirements that are important for this approach. Firstly they lend themselves to capital budgeting techniques because they present fairly determinable cost and benefit streams. Secondly they are projects that may reasonably be considered to be in potential competition with alternative water sector investments. Cost benefit analysis is essentially a tool for resource allocation; water projects that are of such a high social priority that cost benefit considerations may not be determining (restoration of damaged critical infrastructure) are not included.
Table 22 summarizes those recommended adaptation strategies that are explicit or implied in Section VI and the corresponding adaptation experiences identified in this section which suggests that these and similar projects can return a positive cost/benefit. Each is further commented on in the text.
B. PROJECT IDENTIFICATION STUDIES UNDERTAKEN, OR PROPOSED, OF RELEVANCE TO
GRENADA.
In this section some of the projects that have either been completed or at different stages of the project cycle in other member states and are recommended for replication in Grenada are summarised (see table 23). It will be recognized however that Grenada has implemented several water projects. For example, some recently completed or on-going: The eastern Main Road Improvement Maintenance Project, and the Line Replacement Road Improvement maintenance Project. These are making important contributions to the adaptation requirements of climate Change.
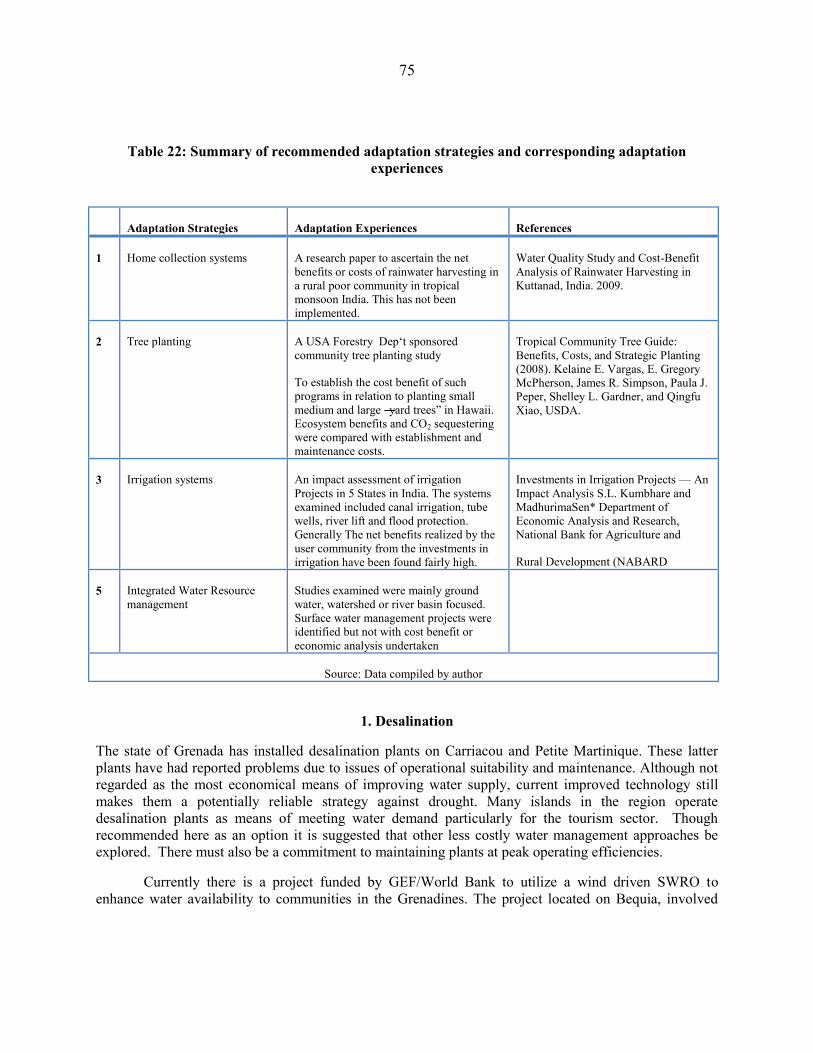
75
Table 22: Summary of recommended adaptation strategies and corresponding adaptation experiences
Adaptation Strategies Adaptation Experiences References
1 Home collection systems A research paper to ascertain the net benefits or costs of rainwater harvesting in a rural poor community in tropical monsoon India. This has not been implemented.
Water Quality Study and Cost-Benefit Analysis of Rainwater Harvesting in Kuttanad, India. 2009.
2 Tree planting A USA Forestry Dep‘t sponsored community tree planting study
To establish the cost benefit of such programs in relation to planting small medium and large ―yard trees‖ in Hawaii. Ecosystem benefits and CO2 sequestering were compared with establishment and maintenance costs.
Tropical Community Tree Guide: Benefits, Costs, and Strategic Planting (2008). Kelaine E. Vargas, E. Gregory McPherson, James R. Simpson, Paula J. Peper, Shelley L. Gardner, and Qingfu Xiao, USDA.
3 Irrigation systems An impact assessment of irrigation Projects in 5 States in India. The systems examined included canal irrigation, tube wells, river lift and flood protection. Generally The net benefits realized by the user community from the investments in irrigation have been found fairly high.
Investments in Irrigation Projects — An Impact Analysis S.L. Kumbhare and MadhurimaSen* Department of Economic Analysis and Research, National Bank for Agriculture and
Rural Development (NABARD
5 Integrated Water Resource management
Studies examined were mainly ground water, watershed or river basin focused. Surface water management projects were identified but not with cost benefit or economic analysis undertaken
Source: Data compiled by author
1. Desalination
The state of Grenada has installed desalination plants on Carriacou and Petite Martinique. These latter plants have had reported problems due to issues of operational suitability and maintenance. Although not regarded as the most economical means of improving water supply, current improved technology still makes them a potentially reliable strategy against drought. Many islands in the region operate desalination plants as means of meeting water demand particularly for the tourism sector. Though recommended here as an option it is suggested that other less costly water management approaches be explored. There must also be a commitment to maintaining plants at peak operating efficiencies.
Currently there is a project funded by GEF/World Bank to utilize a wind driven SWRO to enhance water availability to communities in the Grenadines. The project located on Bequia, involved
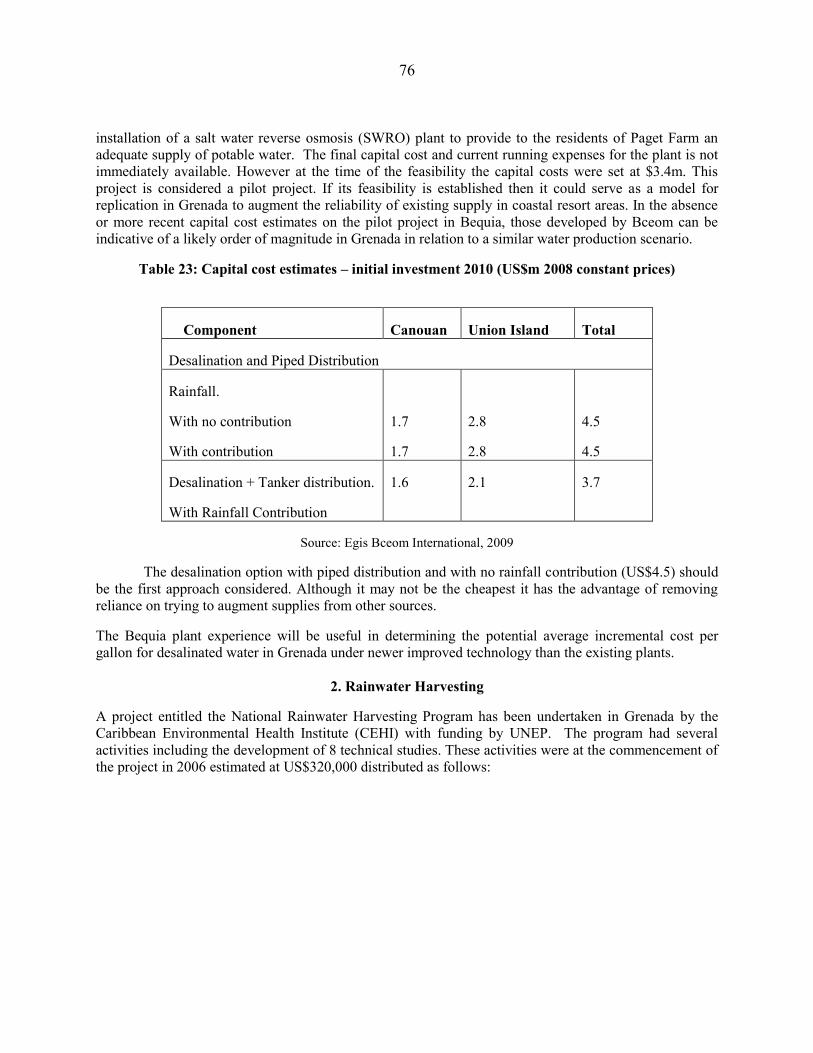
76
installation of a salt water reverse osmosis (SWRO) plant to provide to the residents of Paget Farm an adequate supply of potable water. The final capital cost and current running expenses for the plant is not immediately available. However at the time of the feasibility the capital costs were set at $3.4m. This project is considered a pilot project. If its feasibility is established then it could serve as a model for replication in Grenada to augment the reliability of existing supply in coastal resort areas. In the absence or more recent capital cost estimates on the pilot project in Bequia, those developed by Bceom can be indicative of a likely order of magnitude in Grenada in relation to a similar water production scenario.
Table 23: Capital cost estimates – initial investment 2010 (US$m 2008 constant prices)
Component Canouan Union Island Total
Desalination and Piped Distribution
Rainfall.
With no contribution
With contribution
1.7
1.7
2.8
2.8
4.5
4.5
Desalination + Tanker distribution.
With Rainfall Contribution
1.6 2.1 3.7
Source: Egis Bceom International, 2009
The desalination option with piped distribution and with no rainfall contribution (US$4.5) should be the first approach considered. Although it may not be the cheapest it has the advantage of removing reliance on trying to augment supplies from other sources.
The Bequia plant experience will be useful in determining the potential average incremental cost per gallon for desalinated water in Grenada under newer improved technology than the existing plants.
2. Rainwater Harvesting
A project entitled the National Rainwater Harvesting Program has been undertaken in Grenada by the Caribbean Environmental Health Institute (CEHI) with funding by UNEP. The program had several activities including the development of 8 technical studies. These activities were at the commencement of the project in 2006 estimated at US$320,000 distributed as follows:
77
Awareness Raising US$49.700
Capacity Building US$43,600
Legislation and Policy Formulation US$47,200
Program Administration, Monitoring and Evaluation. US$179,500
Total US$320,000
The project model lends itself to extension to other sites across the island as well as to facilitating national awareness raising and capacity building. It should be ongoing with resulting studies and projects being replicated and expanded in Grenada as well as Carriacou and Petite Martinique.
3. Water Resources Conservation and Management
A regional project entitled the Integrated Watershed and Coastal Area Management Project (GEF-IWCAM) was completed in 2010. This project was supported by the Global Environment Facility and undertaken by the Caribbean Environmental Health Institute CEHI. The overall objective of this project was to strengthen the commitment and capacity of the participating countries to implement an integrated approach to the management of watersheds and coastal areas. The long-term goal is to enhance the capacity of the countries to plan and manage their aquatic resources and ecosystems on a sustainable basis. A total of nine demonstration projects were developed in eight countries. Of the four main themes targeted, that of Water Resources Conservation and Management is considered particularly relevant to climate change adaptation in Saint Vincent and the Grenadines. St. Lucia and St. Kitts developed demonstration projects addressing these themes. The Saint Lucia project focused on protecting and valuing watershed services and the developing management incentives in the Fond Dor‘ Watershed area. The Kitts and Nevis project sought to rehabilitate and manage the Basseterre valley as a protective measure for the underlying aquifer. It is recommended that the experience and findings of these projects could be examined for their relevance to Grenada. The experience gained could be used to assist in the development and implementation of more specifically tailored demonstration projects in integrated watershed management for sustainable yield of quality water.
4. Fiscal Incentives in Support of Adaptation
The administration can be more supportive of water conservation practices through tax incentives on simple household devices that reduce water consumption. One example of where this applies is in water saving devices such as high efficiency showerheads, water-saving aerators, flapperless toilets and simple leak detectors. Supported by a public education campaign, the potential target beneficiaries are the metered customers both household and commercial. Currently import duties on such devices comprise tariff structures that average about 26.5 %. It is estimated that water saving devices can save up to 25-50% of household consumption. The cost - benefit of such an incentive will be difficult to establish, since responsiveness of demand to reduced price is difficult to measure. However the long term benefits of better conservation, in a high usage area such as domestic demand and tourism must be assumed.
78
5. Irrigation
Greenhouse technology confers many benefits to cost effective productivity. Several systems are available and some are in use in Grenada. The application of this technology to the provision of agricultural produce for the tourism sector should be explored and costed. Using an example derived from Jamaica a greenhouse covering approximately 3,000 square feet fully erected costs about US$17,000 before duties. In addition to producing the equivalent of approximately one acre of produce it confers several additional advantages: pest and disease management, significantly reduced labour costs, and a reduced water cost function because water is delivered directly to the plant on an as needed basis.
6. A list of Proposed Prioritized Projects with indicative costs
Table 24 represents an extraction of projects considered of first and second priority for which an indicative cost has been inferred. The basis of the estimated costs is not specific to Grenada. In fact, the absence of accurate cost data has necessitated this indicative approach. It is based on knowledge of the nature of adaptation solutions and their type of cost structures, but also on a sense of the practicality of attracting/sourcing external funding.
These are not large scale projects. Their gestation period need not be longer than a year from conceptualization to implementation. Little new ground is being broken and similar projects are taking place within the region. Technocrats at NAWASA are very capable of adapting each initiative to the requirements of Grenada. Importantly, the proposed investments, particularly those assigned the highest priority, must form the basis of the adaptation responses for Grenada. The precautionary principle, must apply, whereby the best alternative to the challenges presented by the uncertainties and cost of climate change is to steadily invest in measures that protect and strengthen the water sector.
In Section VII, a funding approach is suggested that, if the political will and vision obtains, can remove a major and historical stumbling block to the effectiveness of adaptation responses. This is the unavailability of funding and the stop and start approach to project implementation that characterizes and stymies water authorities within the region.
The total indicative costs for the suggested priority investments amount to US$21,000,000. These are intended to be introduced over the relatively short run of up to 4 years. Conservatively assuming this expenditure will take place over this period, and then annual average investment required would be in the order of US$5m. In the following section that looks at a recommended funding approach by setting aside a percentage of GDP for the water sector, this level of investment is used to derive an indicative NPV under the B2 scenario.
C. BUDGETARY APPROACH TO MEETING WATER DEMAND
The importance of water to the sustainability of key economic activities such as tourism and agriculture and also the critical role of quality water supply to health require that a broad perspective be adopted when considering what adaptation strategies to pursue. These strategies will need to address satisfying the average annual water demand (production) the end objective of policy while at the same time accepting that resource constraints dictate that selective and manageable solutions be identified and consistently applied as the best defense towards meeting the climate change challenge.
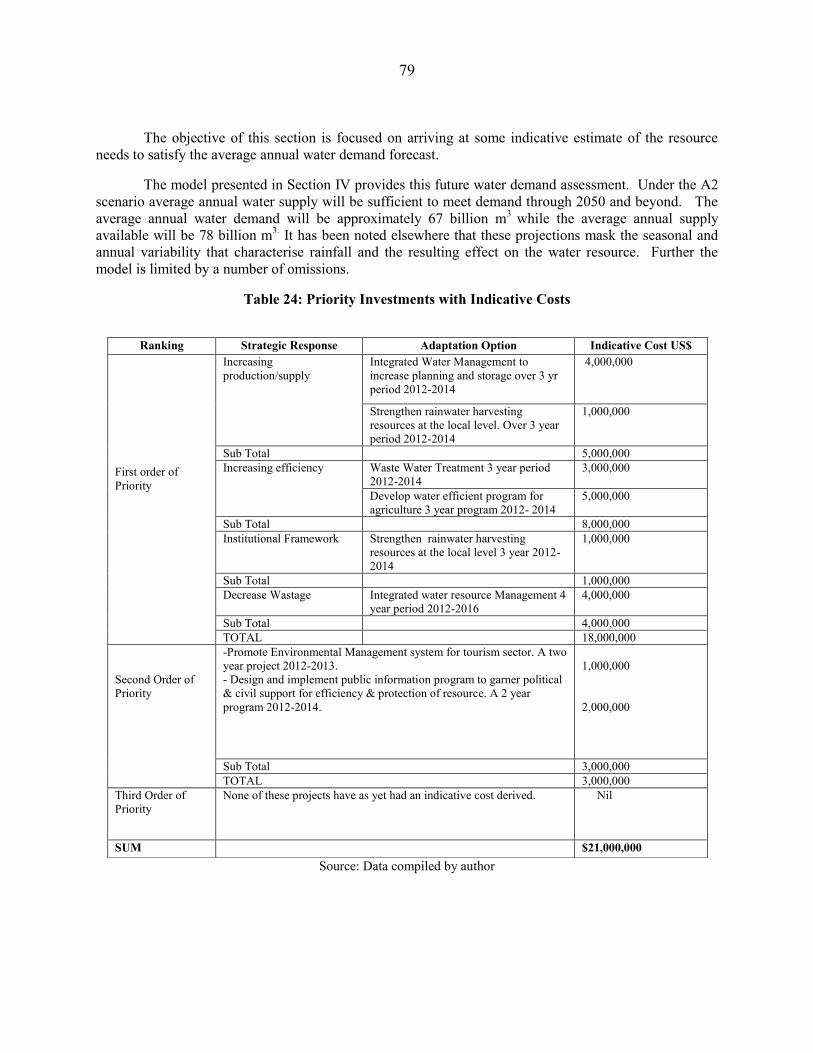
79
The objective of this section is focused on arriving at some indicative estimate of the resource needs to satisfy the average annual water demand forecast.
The model presented in Section IV provides this future water demand assessment. Under the A2 scenario average annual water supply will be sufficient to meet demand through 2050 and beyond. The average annual water demand will be approximately 67 billion m3 while the average annual supply available will be 78 billion m3. It has been noted elsewhere that these projections mask the seasonal and annual variability that characterise rainfall and the resulting effect on the water resource. Further the model is limited by a number of omissions.
Table 24: Priority Investments with Indicative Costs
Source: Data compiled by author
Ranking Strategic Response Adaptation Option Indicative Cost US$ First order of Priority
Increasing production/supply
Integrated Water Management to increase planning and storage over 3 yr period 2012-2014
4,000,000
Strengthen rainwater harvesting resources at the local level. Over 3 year period 2012-2014
1,000,000
Sub Total 5,000,000 Increasing efficiency Waste Water Treatment 3 year period
2012-2014 3,000,000
Develop water efficient program for agriculture 3 year program 2012- 2014
5,000,000
Sub Total 8,000,000 Institutional Framework Strengthen rainwater harvesting
resources at the local level 3 year 2012-2014
1,000,000
Sub Total 1,000,000 Decrease Wastage Integrated water resource Management 4
year period 2012-2016 4,000,000
Sub Total 4,000,000 TOTAL 18,000,000
Second Order of Priority
-Promote Environmental Management system for tourism sector. A two year project 2012-2013. - Design and implement public information program to garner political & civil support for efficiency & protection of resource. A 2 year program 2012-2014.
1,000,000 2,000,000
Sub Total 3,000,000 TOTAL 3,000,000
Third Order of Priority
None of these projects have as yet had an indicative cost derived. Nil
SUM $21,000,000
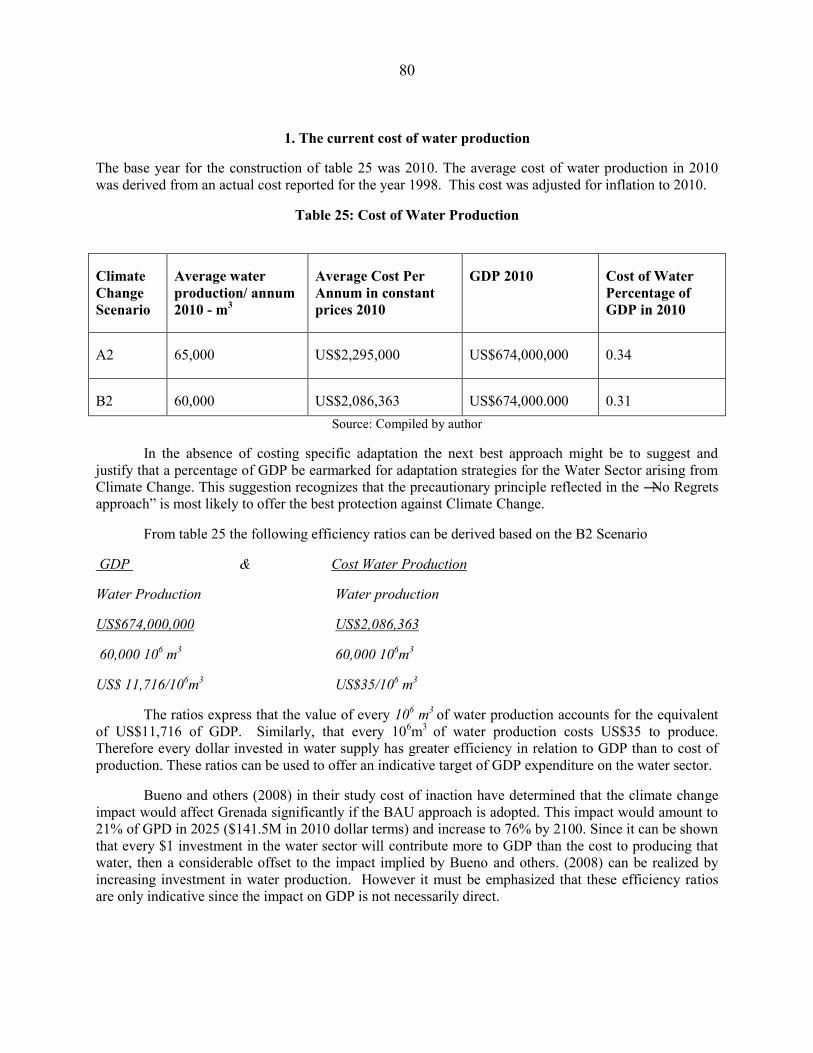
80
1. The current cost of water production
The base year for the construction of table 25 was 2010. The average cost of water production in 2010 was derived from an actual cost reported for the year 1998. This cost was adjusted for inflation to 2010.
Table 25: Cost of Water Production
Climate Change Scenario
Average water production/ annum 2010 - m3
Average Cost Per Annum in constant prices 2010
GDP 2010
Cost of Water Percentage of GDP in 2010
A2 65,000 US$2,295,000 US$674,000,000 0.34
B2 60,000 US$2,086,363 US$674,000.000 0.31 Source: Compiled by author
In the absence of costing specific adaptation the next best approach might be to suggest and justify that a percentage of GDP be earmarked for adaptation strategies for the Water Sector arising from Climate Change. This suggestion recognizes that the precautionary principle reflected in the ―No Regrets approach‖ is most likely to offer the best protection against Climate Change.
From table 25 the following efficiency ratios can be derived based on the B2 Scenario
GDP & Cost Water Production
Water Production Water production
US$674,000,000 US$2,086,363
60,000 106 m3 60,000 106m3
US$ 11,716/106m3 US$35/106 m3
The ratios express that the value of every 106 m3 of water production accounts for the equivalent of US$11,716 of GDP. Similarly, that every 106m3 of water production costs US$35 to produce. Therefore every dollar invested in water supply has greater efficiency in relation to GDP than to cost of production. These ratios can be used to offer an indicative target of GDP expenditure on the water sector.
Bueno and others (2008) in their study cost of inaction have determined that the climate change impact would affect Grenada significantly if the BAU approach is adopted. This impact would amount to 21% of GPD in 2025 ($141.5M in 2010 dollar terms) and increase to 76% by 2100. Since it can be shown that every $1 investment in the water sector will contribute more to GDP than the cost to producing that water, then a considerable offset to the impact implied by Bueno and others. (2008) can be realized by increasing investment in water production. However it must be emphasized that these efficiency ratios are only indicative since the impact on GDP is not necessarily direct.
81
A recommendation would be that over the next five years, the Government set as a policy objective steadily increasing its investment in water production consistent with moving its percentage of GDP to 0.75% or by a multiple of about 2.4 the current allocation to water production. This would amount to an investment of US$5.0M per annum. This additional expenditure could be used to finance adaptation strategies such as investment in new or improved water capacity and related adaptation strategies as indicated in the priority chart above.
This target would be reviewed against the ongoing monitoring of total water consumption needs based on the availability of better data and improved forecasting. Applying Net Present Values (NPV).
In table 26, it is estimated that in year 2010 it would have cost US$2,086,363 to produce the annual average water requirements of 60,000 106m3 corresponding to the demand for water under the B2 scenario . This scenario was chosen because it was considered the most appropriate ‗story‘ for Grenada. If the limiting assumption is made that the average annual dollar value invested in water production remains constant from 2011 through 2050 or over a 40 year investment horizon, then three corresponding net present values can be derived applying assumed discount rates of 4%, 2% and 1% (table 26).
What the NPV enables is that the projected 40 year total annual investment expenditure in water production can be expressed in terms of reducing all annual payments to the equivalent of one payment made at the outset (2011). For example, at 4% the NPV is US$41m on a total investment of $84m over the 40 year period. The NPV being a positive value confirms that it is an acceptable investment decision since the equivalent of US$41m invested in 2011 would be comparable to investing a total of $84m in smaller annual increments. As reflected in table 26 lower discount rates improve the NPV.
Nevertheless the limiting assumption applied, that the annual value of investment in water production remains constant, leads to a static and not particularly satisfactory investment strategy. The purpose in calculating the NPV is to benchmark this ‘worse case’ Government spending decision on water production so as to compare it with the NPV arising from the recommendation to link investment to a percentage of GDP (table 26).
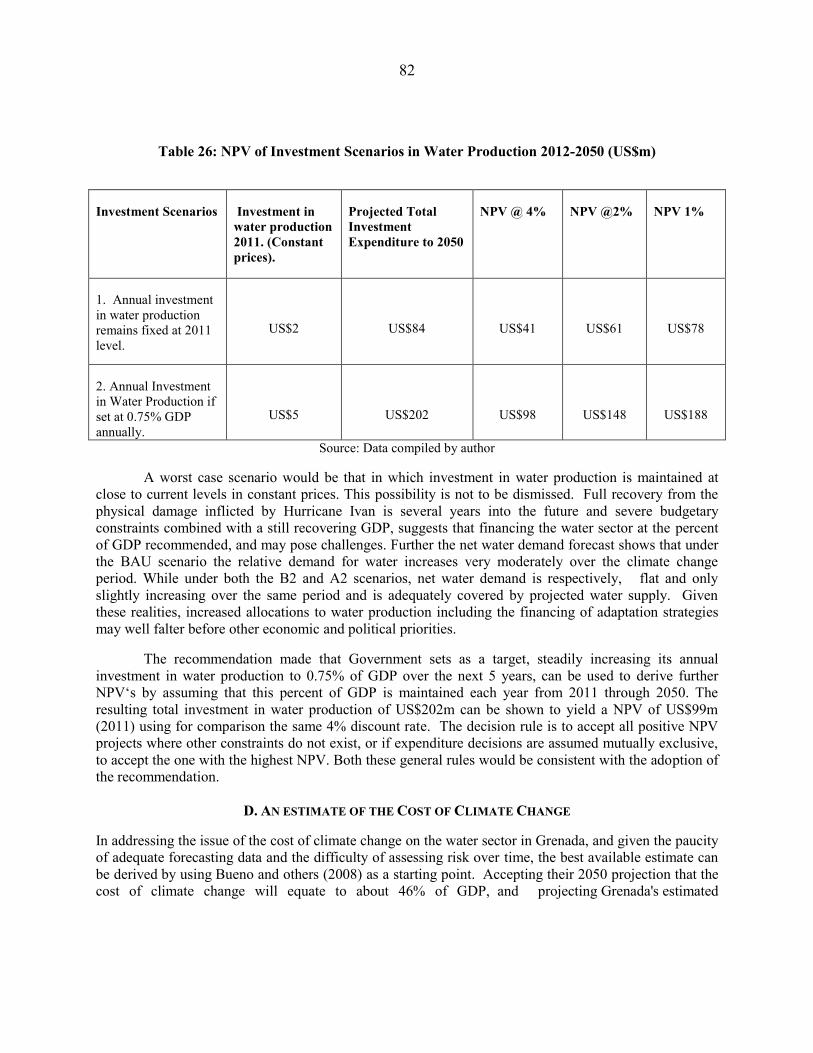
82
Table 26: NPV of Investment Scenarios in Water Production 2012-2050 (US$m)
Investment Scenarios
Investment in water production 2011. (Constant prices).
Projected Total Investment Expenditure to 2050
NPV @ 4% NPV @2% NPV 1%
1. Annual investment in water production remains fixed at 2011 level.
US$2
US$84
US$41
US$61
US$78
2. Annual Investment in Water Production if set at 0.75% GDP annually.
US$5
US$202
US$98
US$148
US$188
Source: Data compiled by author
A worst case scenario would be that in which investment in water production is maintained at close to current levels in constant prices. This possibility is not to be dismissed. Full recovery from the physical damage inflicted by Hurricane Ivan is several years into the future and severe budgetary constraints combined with a still recovering GDP, suggests that financing the water sector at the percent of GDP recommended, and may pose challenges. Further the net water demand forecast shows that under the BAU scenario the relative demand for water increases very moderately over the climate change period. While under both the B2 and A2 scenarios, net water demand is respectively, flat and only slightly increasing over the same period and is adequately covered by projected water supply. Given these realities, increased allocations to water production including the financing of adaptation strategies may well falter before other economic and political priorities.
The recommendation made that Government sets as a target, steadily increasing its annual investment in water production to 0.75% of GDP over the next 5 years, can be used to derive further NPV‘s by assuming that this percent of GDP is maintained each year from 2011 through 2050. The resulting total investment in water production of US$202m can be shown to yield a NPV of US$99m (2011) using for comparison the same 4% discount rate. The decision rule is to accept all positive NPV projects where other constraints do not exist, or if expenditure decisions are assumed mutually exclusive, to accept the one with the highest NPV. Both these general rules would be consistent with the adoption of the recommendation.
D. AN ESTIMATE OF THE COST OF CLIMATE CHANGE
In addressing the issue of the cost of climate change on the water sector in Grenada, and given the paucity of adequate forecasting data and the difficulty of assessing risk over time, the best available estimate can be derived by using Bueno and others (2008) as a starting point. Accepting their 2050 projection that the cost of climate change will equate to about 46% of GDP, and projecting Grenada's estimated
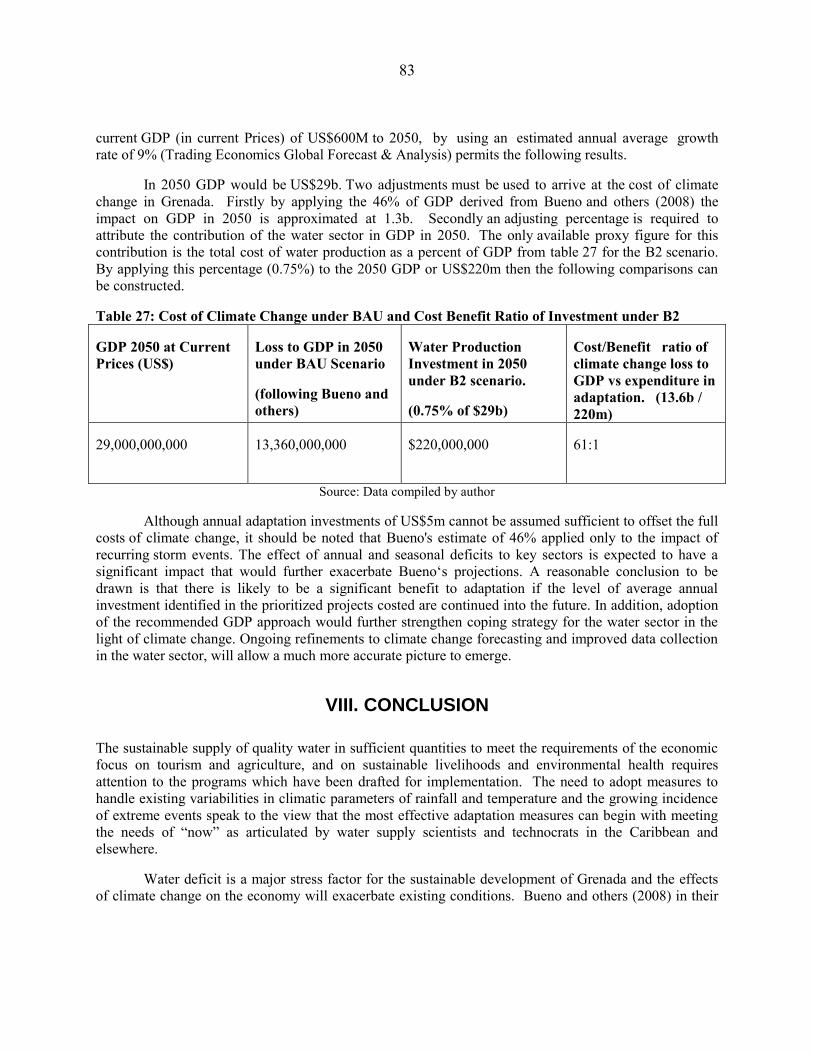
83
current GDP (in current Prices) of US$600M to 2050, by using an estimated annual average growth rate of 9% (Trading Economics Global Forecast & Analysis) permits the following results.
In 2050 GDP would be US$29b. Two adjustments must be used to arrive at the cost of climate change in Grenada. Firstly by applying the 46% of GDP derived from Bueno and others (2008) the impact on GDP in 2050 is approximated at 1.3b. Secondly an adjusting percentage is required to attribute the contribution of the water sector in GDP in 2050. The only available proxy figure for this contribution is the total cost of water production as a percent of GDP from table 27 for the B2 scenario. By applying this percentage (0.75%) to the 2050 GDP or US$220m then the following comparisons can be constructed.
Table 27: Cost of Climate Change under BAU and Cost Benefit Ratio of Investment under B2
GDP 2050 at Current Prices (US$)
Loss to GDP in 2050 under BAU Scenario
(following Bueno and others)
Water Production Investment in 2050 under B2 scenario.
(0.75% of $29b)
Cost/Benefit ratio of climate change loss to GDP vs expenditure in adaptation. (13.6b / 220m)
29,000,000,000 13,360,000,000 $220,000,000 61:1
Source: Data compiled by author
Although annual adaptation investments of US$5m cannot be assumed sufficient to offset the full costs of climate change, it should be noted that Bueno's estimate of 46% applied only to the impact of recurring storm events. The effect of annual and seasonal deficits to key sectors is expected to have a significant impact that would further exacerbate Bueno‘s projections. A reasonable conclusion to be drawn is that there is likely to be a significant benefit to adaptation if the level of average annual investment identified in the prioritized projects costed are continued into the future. In addition, adoption of the recommended GDP approach would further strengthen coping strategy for the water sector in the light of climate change. Ongoing refinements to climate change forecasting and improved data collection in the water sector, will allow a much more accurate picture to emerge.
VIII. CONCLUSION
The sustainable supply of quality water in sufficient quantities to meet the requirements of the economic focus on tourism and agriculture, and on sustainable livelihoods and environmental health requires attention to the programs which have been drafted for implementation. The need to adopt measures to handle existing variabilities in climatic parameters of rainfall and temperature and the growing incidence of extreme events speak to the view that the most effective adaptation measures can begin with meeting the needs of ―now‖ as articulated by water supply scientists and technocrats in the Caribbean and elsewhere.
Water deficit is a major stress factor for the sustainable development of Grenada and the effects of climate change on the economy will exacerbate existing conditions. Bueno and others (2008) in their
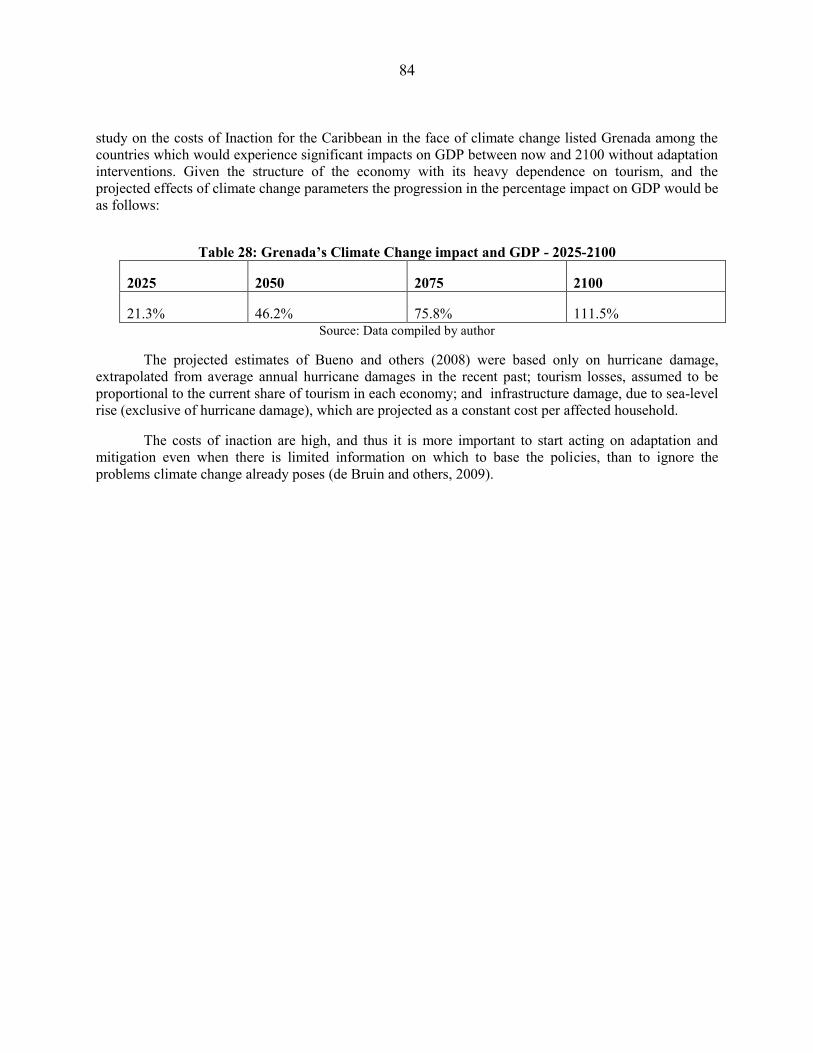
84
study on the costs of Inaction for the Caribbean in the face of climate change listed Grenada among the countries which would experience significant impacts on GDP between now and 2100 without adaptation interventions. Given the structure of the economy with its heavy dependence on tourism, and the projected effects of climate change parameters the progression in the percentage impact on GDP would be as follows:
Table 28: Grenada’s Climate Change impact and GDP - 2025-2100
2025 2050 2075 2100
21.3% 46.2% 75.8% 111.5% Source: Data compiled by author
The projected estimates of Bueno and others (2008) were based only on hurricane damage, extrapolated from average annual hurricane damages in the recent past; tourism losses, assumed to be proportional to the current share of tourism in each economy; and infrastructure damage, due to sea-level rise (exclusive of hurricane damage), which are projected as a constant cost per affected household.
The costs of inaction are high, and thus it is more important to start acting on adaptation and mitigation even when there is limited information on which to base the policies, than to ignore the problems climate change already poses (de Bruin and others, 2009).
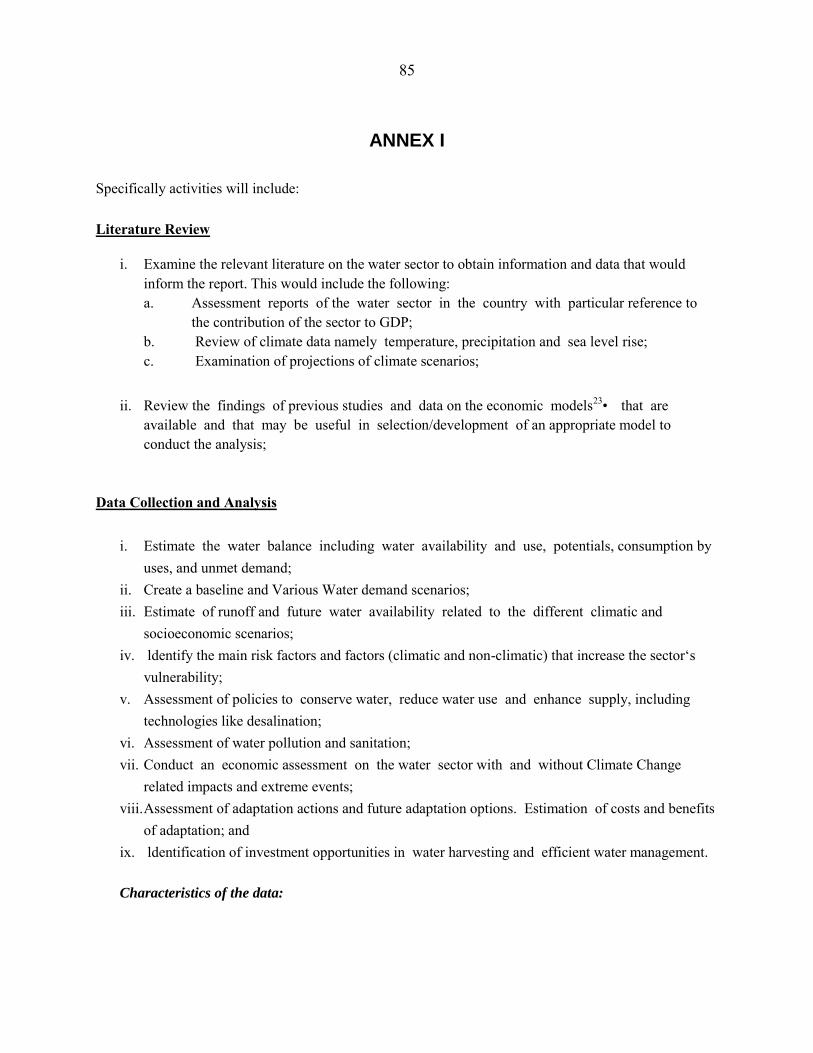
85
ANNEX I
Specifically activities will include:
Literature Review
i. Examine the relevant literature on the water sector to obtain information and data that would inform the report. This would include the following: a. Assessment reports of the water sector in the country with particular reference to
the contribution of the sector to GDP; b. Review of climate data namely temperature, precipitation and sea level rise; c. Examination of projections of climate scenarios;
ii. Review the findings of previous studies and data on the economic models23• that are available and that may be useful in selection/development of an appropriate model to conduct the analysis;
Data Collection and Analysis
i. Estimate the water balance including water availability and use, potentials, consumption by uses, and unmet demand;
ii. Create a baseline and Various Water demand scenarios; iii. Estimate of runoff and future water availability related to the different climatic and
socioeconomic scenarios; iv. ldentify the main risk factors and factors (climatic and non-climatic) that increase the sector‘s
vulnerability; v. Assessment of policies to conserve water, reduce water use and enhance supply, including
technologies like desalination; vi. Assessment of water pollution and sanitation; vii. Conduct an economic assessment on the water sector with and without Climate Change
related impacts and extreme events; viii. Assessment of adaptation actions and future adaptation options. Estimation of costs and benefits
of adaptation; and ix. ldentification of investment opportunities in water harvesting and efficient water management.
Characteristics of the data:
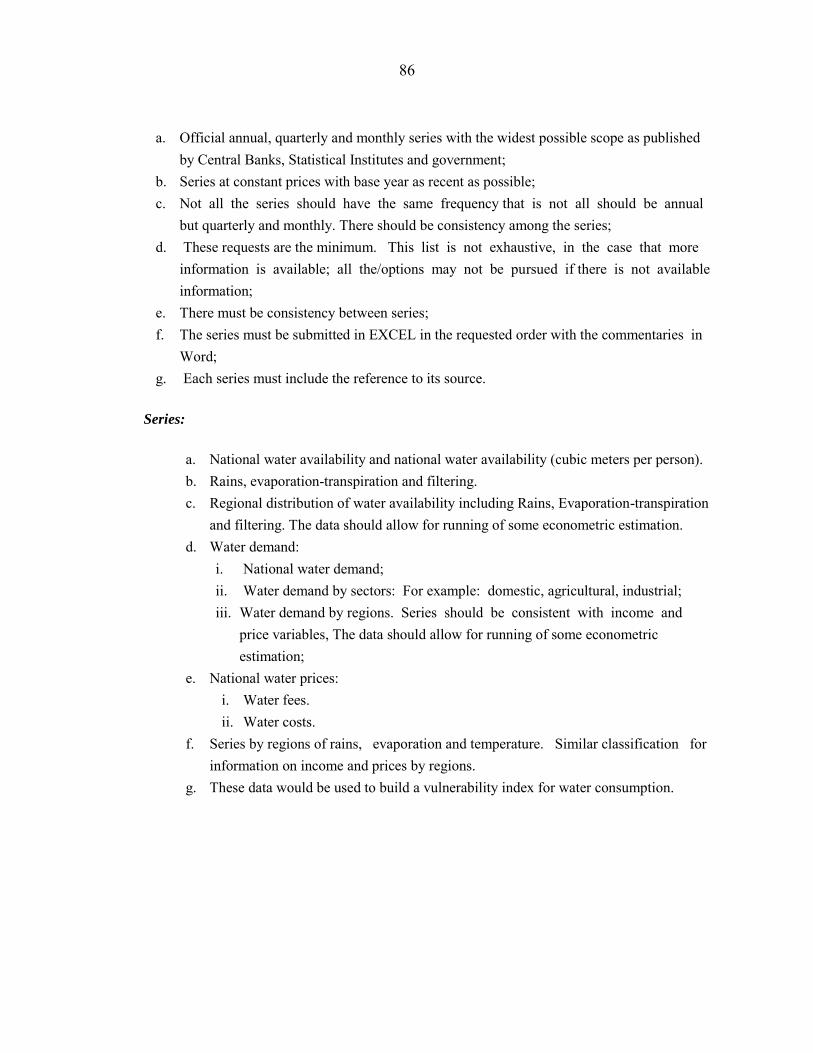
86
a. Official annual, quarterly and monthly series with the widest possible scope as published by Central Banks, Statistical Institutes and government;
b. Series at constant prices with base year as recent as possible; c. Not all the series should have the same frequency that is not all should be annual
but quarterly and monthly. There should be consistency among the series; d. These requests are the minimum. This list is not exhaustive, in the case that more
information is available; all the/options may not be pursued if there is not available information;
e. There must be consistency between series; f. The series must be submitted in EXCEL in the requested order with the commentaries in
Word; g. Each series must include the reference to its source.
Series:
a. National water availability and national water availability (cubic meters per person). b. Rains, evaporation-transpiration and filtering. c. Regional distribution of water availability including Rains, Evaporation-transpiration
and filtering. The data should allow for running of some econometric estimation. d. Water demand:
i. National water demand; ii. Water demand by sectors: For example: domestic, agricultural, industrial; iii. Water demand by regions. Series should be consistent with income and
price variables, The data should allow for running of some econometric estimation;
e. National water prices: i. Water fees. ii. Water costs.
f. Series by regions of rains, evaporation and temperature. Similar classification for information on income and prices by regions.
g. These data would be used to build a vulnerability index for water consumption.
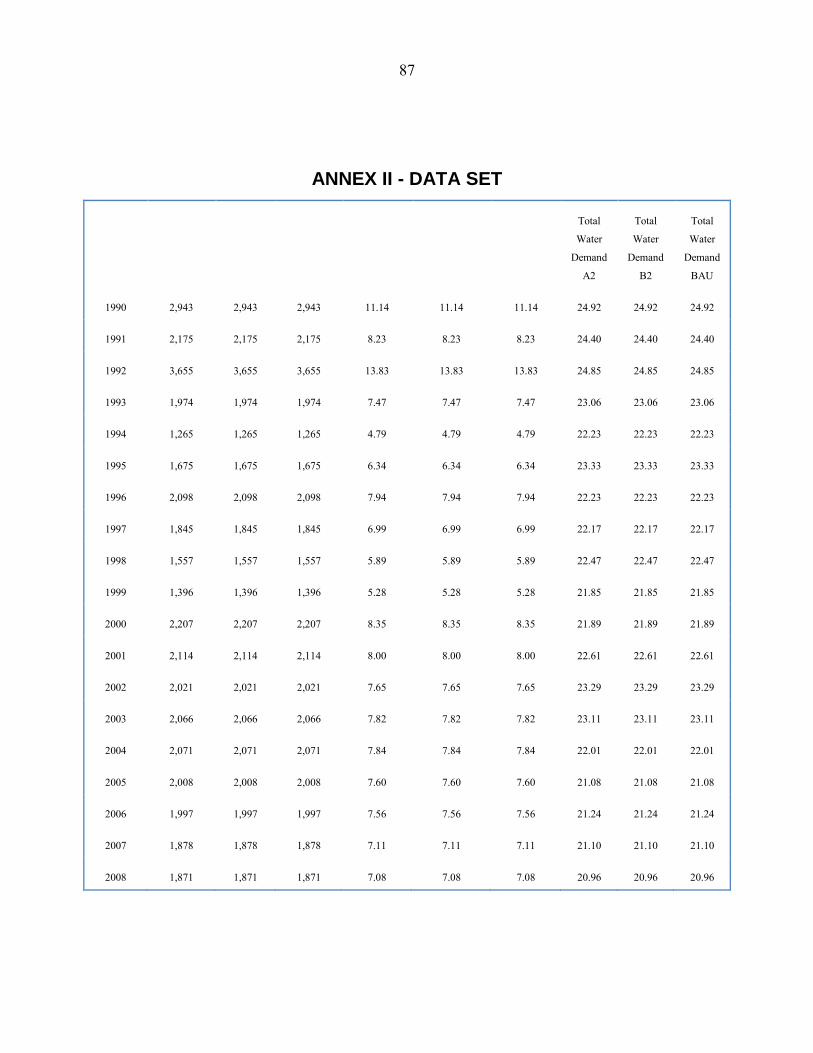
87
ANNEX II - DATA SET
Year A2 Rain B2 Rain BAU Rain A2 Water
Supply
B2 Water
Supply
BAU Water
Supply
Total
Water
Demand
A2
Total
Water
Demand
B2
Total
Water
Demand
BAU
1990 2,943 2,943 2,943 11.14 11.14 11.14 24.92 24.92 24.92
1991 2,175 2,175 2,175 8.23 8.23 8.23 24.40 24.40 24.40
1992 3,655 3,655 3,655 13.83 13.83 13.83 24.85 24.85 24.85
1993 1,974 1,974 1,974 7.47 7.47 7.47 23.06 23.06 23.06
1994 1,265 1,265 1,265 4.79 4.79 4.79 22.23 22.23 22.23
1995 1,675 1,675 1,675 6.34 6.34 6.34 23.33 23.33 23.33
1996 2,098 2,098 2,098 7.94 7.94 7.94 22.23 22.23 22.23
1997 1,845 1,845 1,845 6.99 6.99 6.99 22.17 22.17 22.17
1998 1,557 1,557 1,557 5.89 5.89 5.89 22.47 22.47 22.47
1999 1,396 1,396 1,396 5.28 5.28 5.28 21.85 21.85 21.85
2000 2,207 2,207 2,207 8.35 8.35 8.35 21.89 21.89 21.89
2001 2,114 2,114 2,114 8.00 8.00 8.00 22.61 22.61 22.61
2002 2,021 2,021 2,021 7.65 7.65 7.65 23.29 23.29 23.29
2003 2,066 2,066 2,066 7.82 7.82 7.82 23.11 23.11 23.11
2004 2,071 2,071 2,071 7.84 7.84 7.84 22.01 22.01 22.01
2005 2,008 2,008 2,008 7.60 7.60 7.60 21.08 21.08 21.08
2006 1,997 1,997 1,997 7.56 7.56 7.56 21.24 21.24 21.24
2007 1,878 1,878 1,878 7.11 7.11 7.11 21.10 21.10 21.10
2008 1,871 1,871 1,871 7.08 7.08 7.08 20.96 20.96 20.96
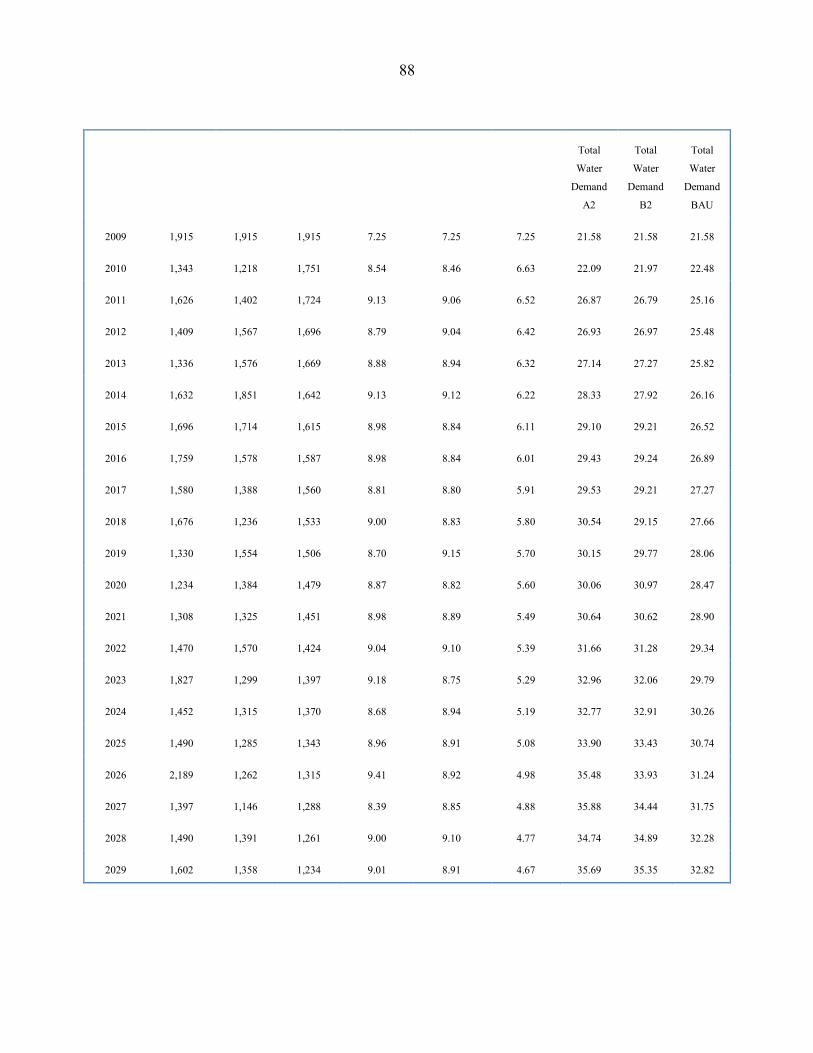
88
Year A2 Rain B2 Rain BAU Rain A2 Water
Supply
B2 Water
Supply
BAU Water
Supply
Total
Water
Demand
A2
Total
Water
Demand
B2
Total
Water
Demand
BAU
2009 1,915 1,915 1,915 7.25 7.25 7.25 21.58 21.58 21.58
2010 1,343 1,218 1,751 8.54 8.46 6.63 22.09 21.97 22.48
2011 1,626 1,402 1,724 9.13 9.06 6.52 26.87 26.79 25.16
2012 1,409 1,567 1,696 8.79 9.04 6.42 26.93 26.97 25.48
2013 1,336 1,576 1,669 8.88 8.94 6.32 27.14 27.27 25.82
2014 1,632 1,851 1,642 9.13 9.12 6.22 28.33 27.92 26.16
2015 1,696 1,714 1,615 8.98 8.84 6.11 29.10 29.21 26.52
2016 1,759 1,578 1,587 8.98 8.84 6.01 29.43 29.24 26.89
2017 1,580 1,388 1,560 8.81 8.80 5.91 29.53 29.21 27.27
2018 1,676 1,236 1,533 9.00 8.83 5.80 30.54 29.15 27.66
2019 1,330 1,554 1,506 8.70 9.15 5.70 30.15 29.77 28.06
2020 1,234 1,384 1,479 8.87 8.82 5.60 30.06 30.97 28.47
2021 1,308 1,325 1,451 8.98 8.89 5.49 30.64 30.62 28.90
2022 1,470 1,570 1,424 9.04 9.10 5.39 31.66 31.28 29.34
2023 1,827 1,299 1,397 9.18 8.75 5.29 32.96 32.06 29.79
2024 1,452 1,315 1,370 8.68 8.94 5.19 32.77 32.91 30.26
2025 1,490 1,285 1,343 8.96 8.91 5.08 33.90 33.43 30.74
2026 2,189 1,262 1,315 9.41 8.92 4.98 35.48 33.93 31.24
2027 1,397 1,146 1,288 8.39 8.85 4.88 35.88 34.44 31.75
2028 1,490 1,391 1,261 9.00 9.10 4.77 34.74 34.89 32.28
2029 1,602 1,358 1,234 9.01 8.91 4.67 35.69 35.35 32.82
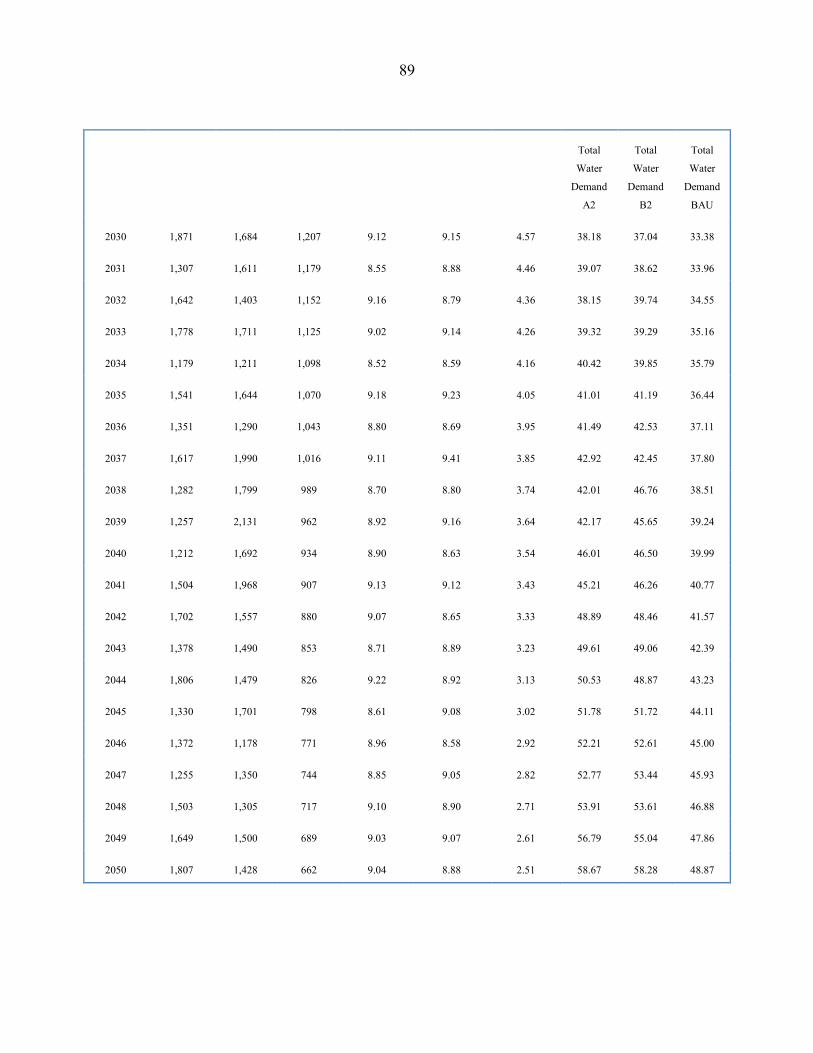
89
Year A2 Rain B2 Rain BAU Rain A2 Water
Supply
B2 Water
Supply
BAU Water
Supply
Total
Water
Demand
A2
Total
Water
Demand
B2
Total
Water
Demand
BAU
2030 1,871 1,684 1,207 9.12 9.15 4.57 38.18 37.04 33.38
2031 1,307 1,611 1,179 8.55 8.88 4.46 39.07 38.62 33.96
2032 1,642 1,403 1,152 9.16 8.79 4.36 38.15 39.74 34.55
2033 1,778 1,711 1,125 9.02 9.14 4.26 39.32 39.29 35.16
2034 1,179 1,211 1,098 8.52 8.59 4.16 40.42 39.85 35.79
2035 1,541 1,644 1,070 9.18 9.23 4.05 41.01 41.19 36.44
2036 1,351 1,290 1,043 8.80 8.69 3.95 41.49 42.53 37.11
2037 1,617 1,990 1,016 9.11 9.41 3.85 42.92 42.45 37.80
2038 1,282 1,799 989 8.70 8.80 3.74 42.01 46.76 38.51
2039 1,257 2,131 962 8.92 9.16 3.64 42.17 45.65 39.24
2040 1,212 1,692 934 8.90 8.63 3.54 46.01 46.50 39.99
2041 1,504 1,968 907 9.13 9.12 3.43 45.21 46.26 40.77
2042 1,702 1,557 880 9.07 8.65 3.33 48.89 48.46 41.57
2043 1,378 1,490 853 8.71 8.89 3.23 49.61 49.06 42.39
2044 1,806 1,479 826 9.22 8.92 3.13 50.53 48.87 43.23
2045 1,330 1,701 798 8.61 9.08 3.02 51.78 51.72 44.11
2046 1,372 1,178 771 8.96 8.58 2.92 52.21 52.61 45.00
2047 1,255 1,350 744 8.85 9.05 2.82 52.77 53.44 45.93
2048 1,503 1,305 717 9.10 8.90 2.71 53.91 53.61 46.88
2049 1,649 1,500 689 9.03 9.07 2.61 56.79 55.04 47.86
2050 1,807 1,428 662 9.04 8.88 2.51 58.67 58.28 48.87
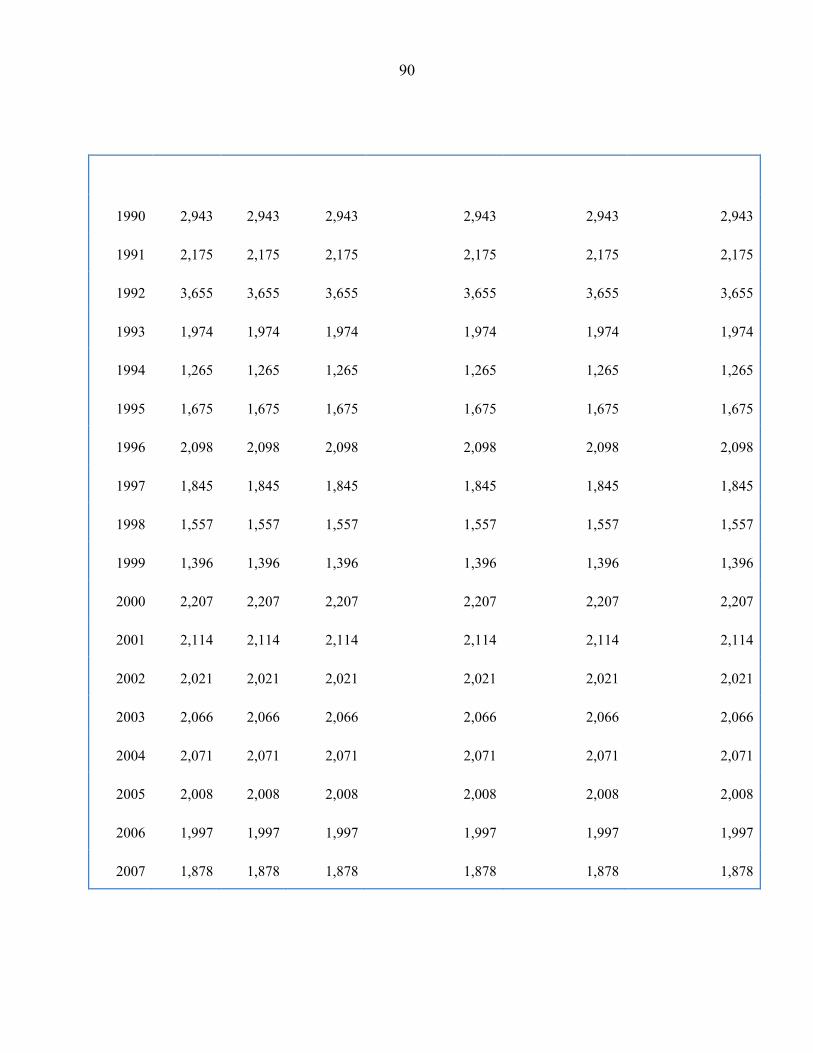
90
Year A2 Rain B2 Rain BAU Rain A2 Water Supply B2 Water Supply BAU Water Supply
1990 2,943 2,943 2,943 2,943 2,943 2,943
1991 2,175 2,175 2,175 2,175 2,175 2,175
1992 3,655 3,655 3,655 3,655 3,655 3,655
1993 1,974 1,974 1,974 1,974 1,974 1,974
1994 1,265 1,265 1,265 1,265 1,265 1,265
1995 1,675 1,675 1,675 1,675 1,675 1,675
1996 2,098 2,098 2,098 2,098 2,098 2,098
1997 1,845 1,845 1,845 1,845 1,845 1,845
1998 1,557 1,557 1,557 1,557 1,557 1,557
1999 1,396 1,396 1,396 1,396 1,396 1,396
2000 2,207 2,207 2,207 2,207 2,207 2,207
2001 2,114 2,114 2,114 2,114 2,114 2,114
2002 2,021 2,021 2,021 2,021 2,021 2,021
2003 2,066 2,066 2,066 2,066 2,066 2,066
2004 2,071 2,071 2,071 2,071 2,071 2,071
2005 2,008 2,008 2,008 2,008 2,008 2,008
2006 1,997 1,997 1,997 1,997 1,997 1,997
2007 1,878 1,878 1,878 1,878 1,878 1,878
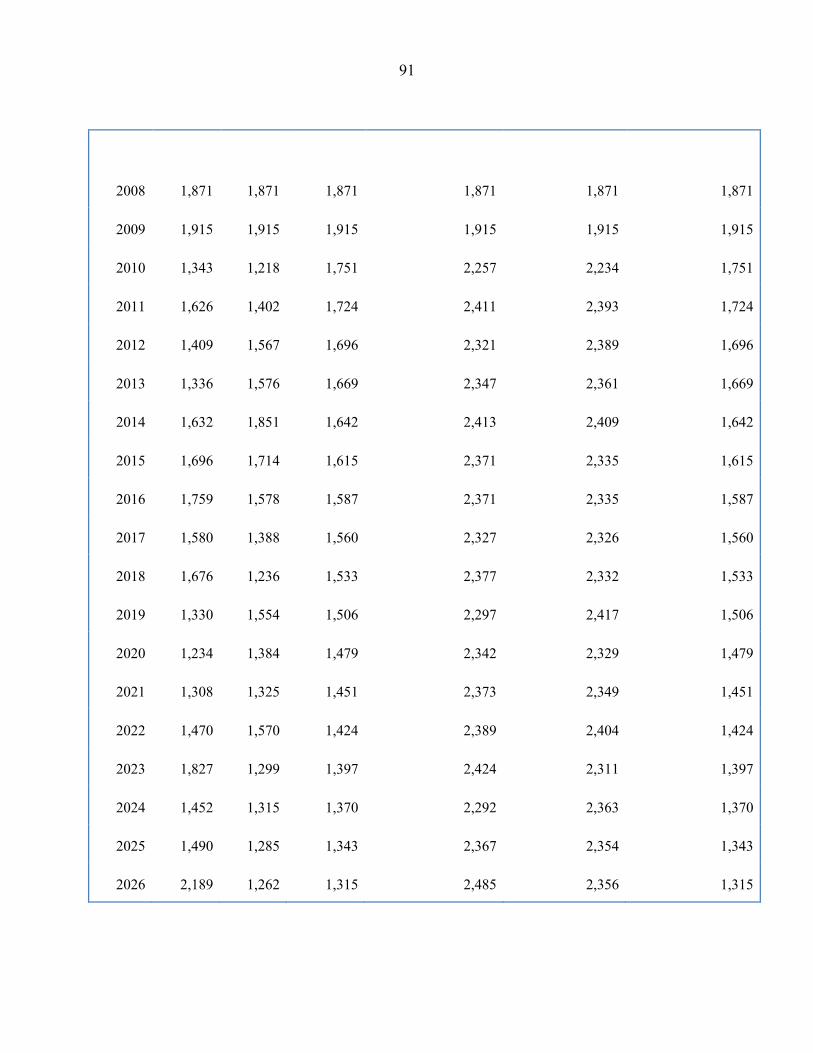
91
Year A2 Rain B2 Rain BAU Rain A2 Water Supply B2 Water Supply BAU Water Supply
2008 1,871 1,871 1,871 1,871 1,871 1,871
2009 1,915 1,915 1,915 1,915 1,915 1,915
2010 1,343 1,218 1,751 2,257 2,234 1,751
2011 1,626 1,402 1,724 2,411 2,393 1,724
2012 1,409 1,567 1,696 2,321 2,389 1,696
2013 1,336 1,576 1,669 2,347 2,361 1,669
2014 1,632 1,851 1,642 2,413 2,409 1,642
2015 1,696 1,714 1,615 2,371 2,335 1,615
2016 1,759 1,578 1,587 2,371 2,335 1,587
2017 1,580 1,388 1,560 2,327 2,326 1,560
2018 1,676 1,236 1,533 2,377 2,332 1,533
2019 1,330 1,554 1,506 2,297 2,417 1,506
2020 1,234 1,384 1,479 2,342 2,329 1,479
2021 1,308 1,325 1,451 2,373 2,349 1,451
2022 1,470 1,570 1,424 2,389 2,404 1,424
2023 1,827 1,299 1,397 2,424 2,311 1,397
2024 1,452 1,315 1,370 2,292 2,363 1,370
2025 1,490 1,285 1,343 2,367 2,354 1,343
2026 2,189 1,262 1,315 2,485 2,356 1,315
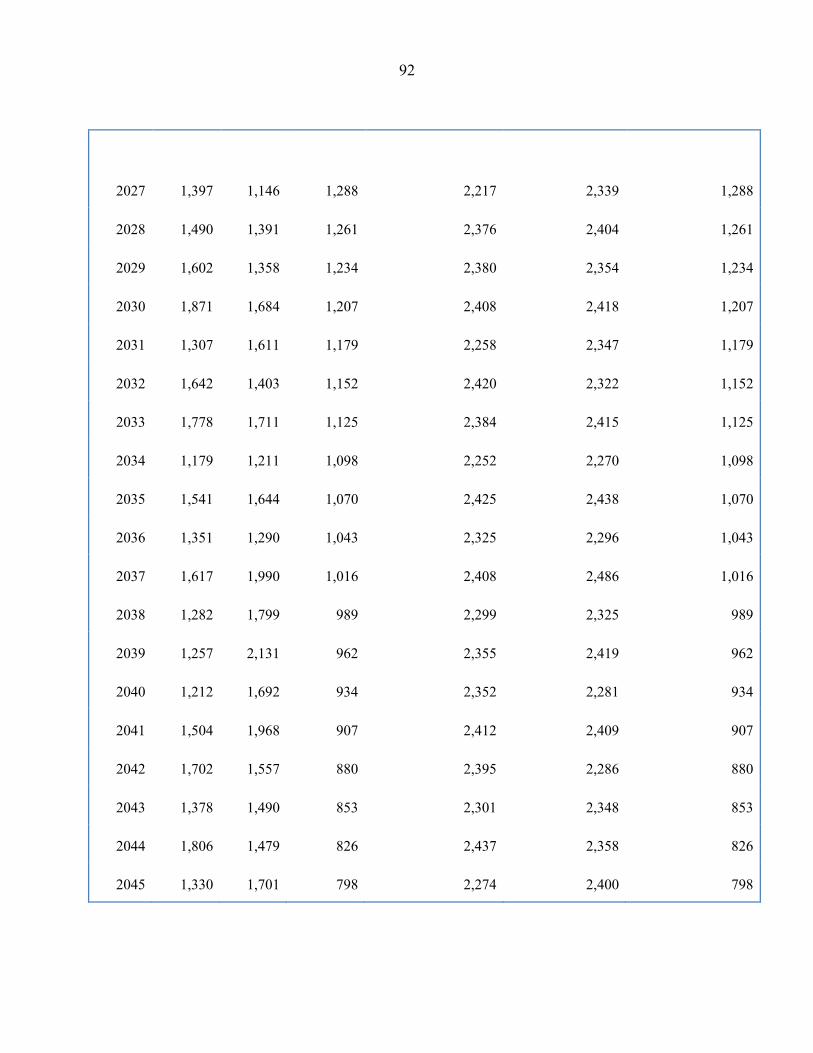
92
Year A2 Rain B2 Rain BAU Rain A2 Water Supply B2 Water Supply BAU Water Supply
2027 1,397 1,146 1,288 2,217 2,339 1,288
2028 1,490 1,391 1,261 2,376 2,404 1,261
2029 1,602 1,358 1,234 2,380 2,354 1,234
2030 1,871 1,684 1,207 2,408 2,418 1,207
2031 1,307 1,611 1,179 2,258 2,347 1,179
2032 1,642 1,403 1,152 2,420 2,322 1,152
2033 1,778 1,711 1,125 2,384 2,415 1,125
2034 1,179 1,211 1,098 2,252 2,270 1,098
2035 1,541 1,644 1,070 2,425 2,438 1,070
2036 1,351 1,290 1,043 2,325 2,296 1,043
2037 1,617 1,990 1,016 2,408 2,486 1,016
2038 1,282 1,799 989 2,299 2,325 989
2039 1,257 2,131 962 2,355 2,419 962
2040 1,212 1,692 934 2,352 2,281 934
2041 1,504 1,968 907 2,412 2,409 907
2042 1,702 1,557 880 2,395 2,286 880
2043 1,378 1,490 853 2,301 2,348 853
2044 1,806 1,479 826 2,437 2,358 826
2045 1,330 1,701 798 2,274 2,400 798
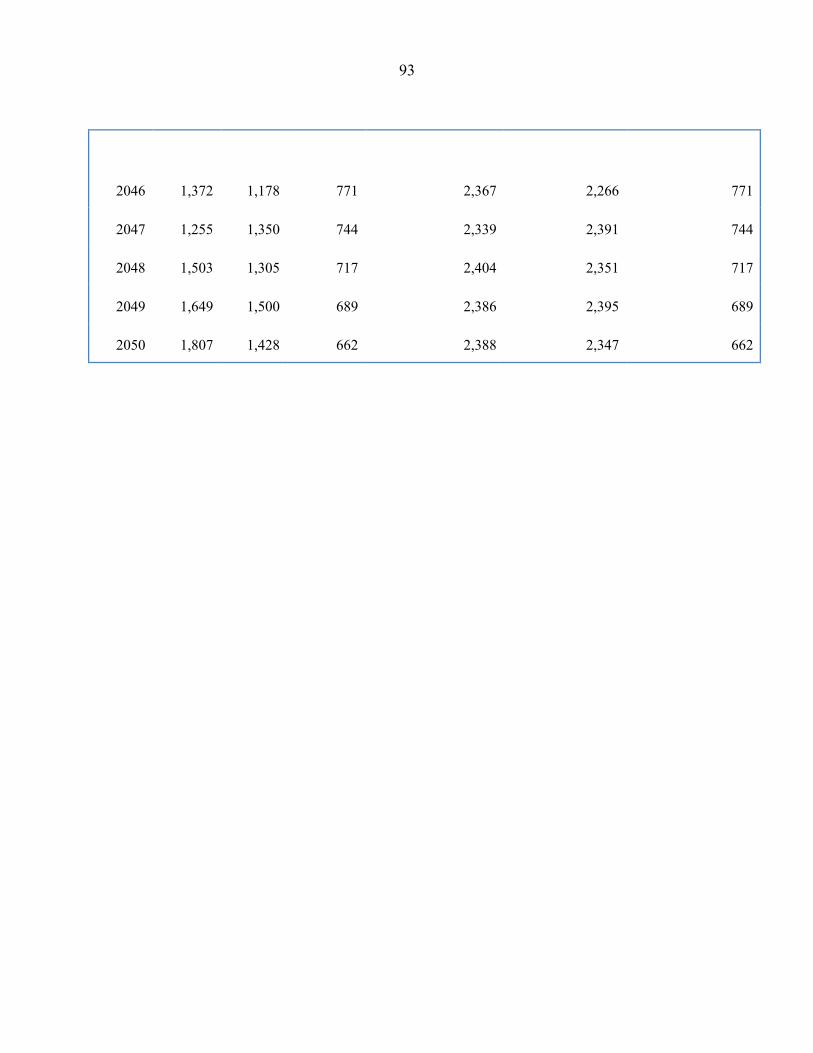
93
Year A2 Rain B2 Rain BAU Rain A2 Water Supply B2 Water Supply BAU Water Supply
2046 1,372 1,178 771 2,367 2,266 771
2047 1,255 1,350 744 2,339 2,391 744
2048 1,503 1,305 717 2,404 2,351 717
2049 1,649 1,500 689 2,386 2,395 689
2050 1,807 1,428 662 2,388 2,347 662
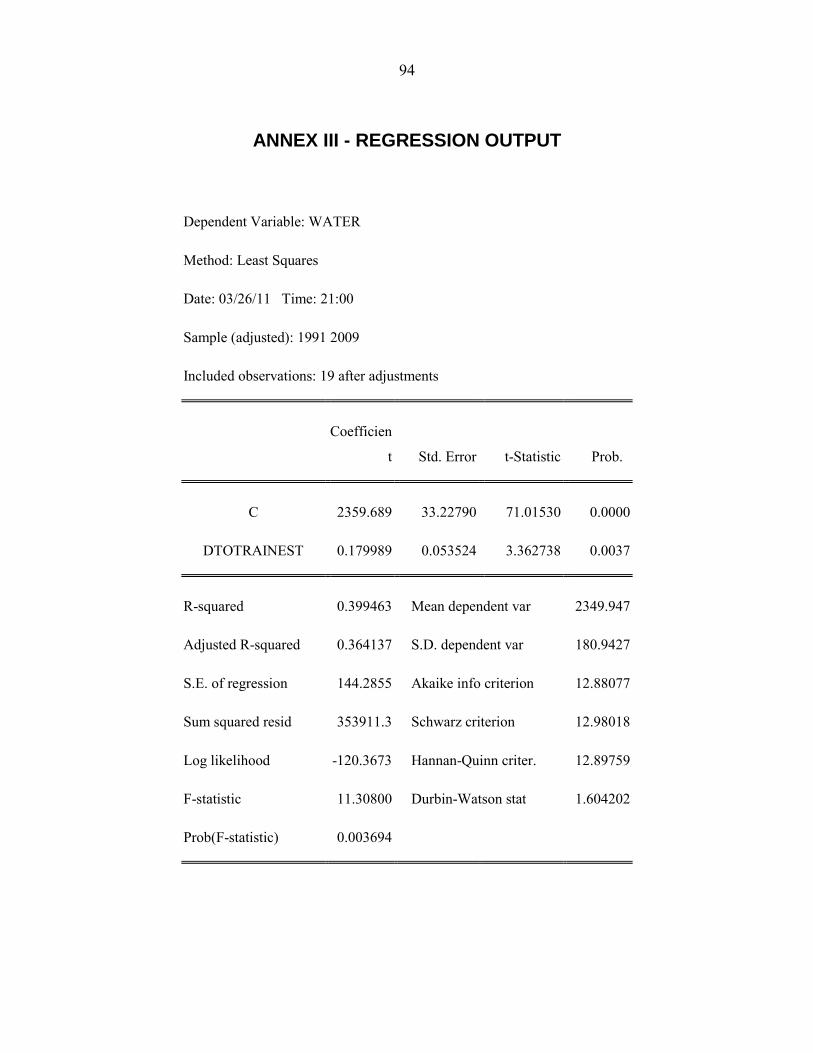
94
ANNEX III - REGRESSION OUTPUT
Dependent Variable: WATER
Method: Least Squares
Date: 03/26/11 Time: 21:00
Sample (adjusted): 1991 2009
Included observations: 19 after adjustments
Coefficien
t Std. Error t-Statistic Prob.
C 2359.689 33.22790 71.01530 0.0000
DTOTRAINEST 0.179989 0.053524 3.362738 0.0037
R-squared 0.399463 Mean dependent var 2349.947
Adjusted R-squared 0.364137 S.D. dependent var 180.9427
S.E. of regression 144.2855 Akaike info criterion 12.88077
Sum squared resid 353911.3 Schwarz criterion 12.98018
Log likelihood -120.3673 Hannan-Quinn criter. 12.89759
F-statistic 11.30800 Durbin-Watson stat 1.604202
Prob(F-statistic) 0.003694
95
REFERENCES
Alcubilla, R.G., Lund, J.R., (2006), ―Derived willingness-to-pay for household water use with price and probabilistic supply‖. Journal of Water Resources Planning and Management. Vol 132 (6), 424–433
Arbués, F., García-Valiñas, M., Martínez-Espiñeira, R. (2003), ―Estimation of residential water demand: a state-of-the-art review‖. Journal of Socio-Economic Vol 32 81-102. Elsevier Science Inc.
Arbués, F., Barberán, R., Villanúa, I., (2000), Water price impact on residential water demand in the city of Zaragoza. A dynamic panel data approach. Paper presented at the 40th European Congress of the European Regional Studies Association (ERSA) in Barcelona, Spain, 30–31 August.
Arnell, N. W. (2004), Climate change and global water resources: SRES emissions and socio-economic scenarios. Global Environmental Change, 14, 31-52.
Arnell, N. (2009), Cost of Adaptation in the water sector. In Assessing the Costs of adaptation to climate Change
Asian Development Bank. (2010), Economic Valuation of Regional Climate Change Impacts in the Water Sector. [online] < http://www.adb.org/Documents/events/2010/Economics-Climate-Change-PRC/CRodgers-eco-valuation.pdf>[Retrieved 18 January 2011]
Bakker, M., and Schaik, H. (2010), Perspectives on water and climate change adaptation: Climate change adaptation in the water sector – Financial issues. [online]< http://worldwatercouncil.org/fileadmin/wwc/Library/Publications_and_reports/Climate_Change/PersPap_11._Financial_Issues.pdf>[Retrieved 11 January 2011]
Bates, B. C., Kundzewicz, Z. W., Wu, S., & Palutikof, J. P. (Eds.). (2008), Climate change and water (Technical Paper of the Intergovernmental Panel on Climate Change, IPCC Secretariat). Geneva, Switzerland: IPCC.
Bell, D., and R.C. Griffin. (2005), ―Determinants of Demand for Water Used in Texas Communities.‖
Annual Meeting of the Western Agricultural Economics Association. San Francisco, California.
Bynoe M. Undated. The Methodological Approach to the Review of the Economic of Climate Change Study in the Caribbean (Draft). Caribbean Community Climate Change Centre (CCCCC).
Bueno, R. et. al. (2008), The Caribbean and Climate Change: The Costs of Inaction. Website: http://ase.tufts.edu/gdae/Pubs/rp/Caribbean-full-Eng-lowres.pdf.
CARICOM Office of Trade Negotiators (OTN). (2010), Export Bulletin. Special Bulletin of the Office of Trade Negotiations (OTN) ISSUE # 4 February 2010. [online]<www.crmn.org> [Retrieved: 15 September 2010]
CARICOM Secretariat. (2010), CARICOM Regional Statistics. [online]< http://www.caricomstats.org/Files/Databases/National_Accounts/Constant/GDCON.htm> [Retrieved 26 May 2011]
96
Caribbean Environmental Health Institute. (2002). Water and climate change in the Caribbean. Castries, St. Lucia: Author.
Caribbean Environmental Health Institute. (2007a). Background information. Castries, St. Lucia: Author. Taylor, M. A., Centella, A., Charlery, J., Borrajero, I., Bezanilla, A., Campbell, J., (2007). Glimpses of the future: A Briefing from PRECIS Caribbean climate change project. Belmopan, Belize: Caribbean Community Climate Change Center.
Caribbean Environmental Health Institute (CEHI). (2007), Road Map Toward Integrated Water Resources Management Planning for Grenada. [online]< http://www.iwcam.org/documents/iwrm-roadmaps/draft-iwrm-roadmap-grenada/view>[Retrieved: 17 September 2010]
Caribbean Environmental Health Institute (CEHI). (2006), Geographical Information System-Assisted Water Availability Analysis for Grenada. [online]< http://www.cehi.org.lc/Rain/print/Grenada%20RWH%20Maps.pdf> [Retrieved 8 September 2010]
Cashman, A., L. Nurse and C. John. (2010), Climate Change in the Caribbean: The Water Management Implications. The Journal of Environment Development 2010 19:42 [originally published online 19 November 2009]
Chakanda, R., Kafuwa, D., Bah, K. (2008), The effect of climate change on agricultural systems and crops production – analysis of three countries.
Chandler, J. A. (2004), ―An analysis of the economic impact of hurricanes Dennis, Floyd, and Irene on North Carolina's lodging industry‖. CHRIE Journal of Hospitality and Tourism Research, Vol 28(3), 313–325.
Christensen, J.H., B. Hewitson, A. Busuioc, A. Chen, X. Gao, I. Held, R. Jones, R.K. Kolli, W.-T. Kwon, R. Laprise, V. Magaña Rueda, L. Mearns, C.G. Menéndez, J. Räisänen, A. Rinke, A. Sarr and P. Whetton, (2007), Regional Climate Projections. In: Climate Change 2007: The Physical Science Basis. Contribution of Working Group I to the Fourth Assessment Report of the Intergovernmental Panel on Climate Change [Solomon, S., D. Qin, M. Manning, Z. Chen, M. Marquis, K.B. Averyt, M. Tignor and H.L. Miller (eds.)]. Cambridge University Press, Cambridge, United Kingdom and New York, NY, USA.
Dalhuisen, Jasper M., Raymond J. G. M. Florax, Henri L. F. M. de Groot, and Peter Nijkamp (2003), ―Price and income elasticities of residential water demand: Why empirical estimates differ‖, Land Economics Vol 79 292-308
Debruin, Kelly, Rob Dellink2, Shardul Agrawala. (2009), Economic Aspects Of Adaptation To Climate Change. Integrated Assessment Modelling Of Adaptation Costs And Benefits. OECD working paper. [online]<http://www.oecd-ilibrary.org/content/workingpaper/225282538105>
Diaz, H. and Morehouse, B. (2003), ―Climate and Water in Transboundary Contexts: An Introduction.‖
Climate and Water: Transboundary Challenges in the Americas, eds. Henry F. Diaz and Barbara J. Morehouse.pp3-24. Dordrecht: Kluwer Academia Publishers.
Döll, P., Kaspar, F., Lehner, B., (2003), ―A global hydrological model for deriving water availability indicators: model tuning and validation.‖ Journal of Hydrology Vol 270 105–134
97
Döll, P. and Siebert, S. (2002), 'Global Modelling of Irrigation Water Requirements'. Water Resources Research, Vol. 38, No. 4, 8.1-8.10, DOI 10.1029/2001WR000355.
Duchin, F. (1992), Industrial input-output analysis: implications for industrial ecology, Proceedings of the National Academy of Sciences, Vol. 89: 851-855.
ECLAC. (2010), The Economic Impacts of Climate Change in Latin America and the Caribbean. United Nations, Santiago, Chile.
Economic Commission of Latin America and the Caribbean (ECLAC). (2007), Draft Overview of the Water Profile and the Capacity of National Institutions to implement integrated Water Resources Management (Antigua and Barbuda, Dominica, Grenada. ECLAC Subregional Headquarters for the Caribbean.
Economic Commission of Latin America and the Caribbean (ECLAC). (2011), Review of the economics of climate change in the Caribbean Phase II - the water sector LC/CAR/L.260
Environmental Solutions Limited (ESL). (2008), Coastal vulnerability assessment, St. Vincent and the Grenadines. Prepared by Environmental Solutions Ltd, Kingston, Jamaica under consultancy to Chemonics International for the USAID- COTS program.
Environmental Solutions Limited (ESL). (2010), Review of Policy, Legislative and Institutional Framework and Standards for Sustainable Land Management (SLM) in Grenada. Prepared by Environmental Solutions Ltd, Kingston, Jamaica under consultancy to Grenada‘s Ministry of Agriculture and Fisheries.
Farrell, D., Moseley, L., and Nurse, L. (2007), Managing water resources in the face of climate change: A Caribbean perspective. Proceedings of the 8th Annual Sir Arthur Lewis Institute of Social and Economic Studies (SALISES) Conference, UWI, St. Augustine, Trinidad, March 26-28, 2007.
Gleick, P., Singh, A., Shi, H. (2001), Threats to the World’s Freshwater Resources. A Report of the Pacific Institute for Studies in Development, Environment, and Security, Oakland, California, in cooperation with the United Nations Environment Programme.
Gleick, P.H. and others (2000), Water: The Potential Consequences of Climate Variability and Change. A Report of the National Water Assessment Group, U.S. Global Change Research Program, U.S. Geological Survey, U.S. Department of the Interior and the Pacific Institute for Studies in Development, Environment, and Security. Oakland, California.
Global Water Pertnership. (2005), Global Water Partnership Policy on Partners. [online] < http://gwp-cacena.org/en/pdf/gwp_policy.pdf> [Retrieved 2 March 2011]
Government of Grenada (GoG). (2011), Grenada Tourism Brief.
Government of Grenada (GoG). (2010), The Official Website of the Government of Grenada. [online]< http://www.gov.gd/> [Retrieved 8 September 2010]
98
Government of Grenada (GoG). (2009). Capacity Building and Mainstreaming of Sustainable Land Management in Grenada. United Nations Development Programme (UNDP) and Global Environmental Facility (GEF)
Government of Grenada. GoG. (2007a). Grenada Draft National Climate Change Policy and Action Plan 2007-2011
Government of Grenada (GoG). (2007b). Draft National Water Policy.
Government of Grenada. GoG. (2000). Grenada’s Initial Communication to the UNFCCC. [online]< http://unfccc.int/resource/docs/natc/grnnc1.pdf.> [Retrieved 15 September 2010]
Government of Grenada (GoG). (n.d.). Grenada: Country Report on the State of Plant Genetic Resources. [online]< http://www.fao.org/docrep/013/i1500e/Grenada.pdf> [Retrieved 8 September 2010]
Grenada Board of Tourism. GBT. (n.d.), Facts and Figures. [online]<http://www.grenadagrenadines.com/discover-the-islands/facts-and-figures/#climate> [Retrieved 7 September 2010]
Griffin, R.C., 1990. Valuing urban water acquisitions. Water Resources Bulletin 26 (2), 219–225.
Griffin, R. C., and J. W. Mjelde (2000), Valuing water supply reliability, Am. J. Agric. Econ., 82, 414 – 426
Harou, J., Pulido-Velazquez, M., , D., Medellín-Azuara, J., Lund, J., Howitt, R. (2009), ―Hydro-economic models: Concepts, design, applications, and future prospects‖. Journal of Hydrology. [online] Vol 375 pp.627-643 <http://cee.engr.ucdavis.edu/faculty/lund/papers/JulienHydroEcon2009.pdf>[Retrieved 18 January 2011]
Hansen, L. Hoffman, J. Drews, C., Mielbrecht, E. (2009). ―Designing climate-smart conservation: guidance and case studies.‖ Conservation Biology Vol 24 63-69.
Hansen, Lars G. (1996), ―Water and energy price impacts on residential water demand in Copenhagen‖, Journal of Land Economics Vol 72 66-79
Hentschel, J., and Lanjouw P. (1997), Household Welfare Measurement and the Pricing of Basic Services. [online] < http://elibrary.worldbank.org/docserver/download/2006.pdf?expires=1308928057&id=id&accname=guest&checksum=AA0ED04DFFB6C2577963B534AB6067EA>[Retrieved 18 January 2011]
Höglund, Lena (1999), ―Household demand for water in Sweden with implications of a potential tax on water use‖, Water Resources Research Vol 35 3853-3863.
Hoffmann, M., Worthington, A., Higgs, H., (2005), Modelling residential water demand with fixed volumetric charging in a large urban municipality: The case of Brisbane, Australia. Discussion Papers in Economics, Finance and International Competitiveness, School of Economics and Finance, Queensland University of Technology
99
Intergovernmental Panel on Climate Change. (2007a). Climate change The physical science basis —summary for policy makers. Cambridge, UK: Cambridge University Press.
Manton, M. J., Della-Marta, P. M., Haylock, M. R., Hennessy, K. J., Nicholls, N., Chambers, L. E. (2001). Trends in extreme daily rainfall and temperature in Southeast Asia and the South Pacific, 1961-1998. International Journal of Climatology, 21, 269-284.
Jenkins, M.W., Lund, J.R., Howitt, R.E., (2003), ―Using economic loss functions to value urban water scarcity in California@. Journal American Water Works Association Vol 95 (2), 58–70 Jones, E. (2007). Water Security and Climate Change: A Disaster Risk Management Approach from the Caribbean. Presented to 60th Annual DPI/NGO Conference .United Nations, New York. September 6, 2007
Jorgensen, D., Wilcoxen, P., (1993), ―Reducing US carbon dioxide emissions: an econometric general equilibrium assessment‖. Resource Energy Economics Vol 15 7–2 Kamat, R., Rose, A,, Abler D. (1999), ―The impact of a carbon tax on the Susquehanna river basin economy‖. Energy Economics Vol 21 363–38
Leontaritis, I.J. and S.A. Billings. (1985), Input-Output Parametric Models for Non-Linear Systems. Part I and Part 11. Int. J. Control, 41(2), pp. 304-344.
Lehner, E. (1935), Report on the Possibilities of Establishing An Artesian Water Supply For The Island of Carriacou. Government Printery. Grenada.
Martínez-Espiñeira, R. (2007), An Estimation Of Residential Water Demand Using Co-Integration And Error Correction Techniques. Journal of Applied Economics. Vol X, No. 1: 161-184
Martínez-Espiñeira, R. (2002), Residential water demand in the Northwest of Spain. Environmental and Resource Economics Vol 21 pp. 161-187
Mather, J. D. (1971), Report on the Groundwater Resources of Carriacou, Grenadines.
Mente, A. (1985), Assessment of the Development Potential of Water Resources of Carriacou, Department of Regional Development, OAS.
London. Inst. Geol. Sciences Unpub. Rep WE/71/11.Mavromatis T, Jones PD. (1998), ―Comparison of climate change scenario construction methodologies for impact assessment studies‖. Agricultural and Forest Meteorology Vol 91 51-67
McSweeney, C., M. New and G. Lizcano. (Undated). UNDP Climate Change Country Profiles Grenada. [online]< http://country-profiles.geog.ox.ac.uk/index.html?country= Grenada&d1=Reports> [Retrieved 11 January 2011]
Miller, R. E. and P. D. Blair. (2009), Input-Output Analysis: Foundations and Extensions. Cambridge University Press, 2 edition. forthcoming.
Ministry of Agriculture, Forestry and Fisheries. (2009). Annual Agriculture Review - 2008. Grenada, W.I.
Ministry of Finance (MoF). (2009. a). Grenada National Report on Sustainable Development.
100
Ministry of Finance (MoF). 2009. b.), Government of Grenada Prospectus.
Mirza, M. M. Q., & Ahmad, Q. K. (Eds.). (2005), Climate change and water resources in South Asia. Leiden, Netherlands: A. A. Balkema Publishers.
Moore, W. (2011), The economic impacts of climate change on the tourism sector in Montserrat and Saint Lucia. Unpublished.
Moore, W., Harewood, L., Grosvenor, T. (2010), The Supply Side Effects of Climate Change on Tourism. Unpublished.
Natural Resource Management and Environment Department (NRMED). (2001), FAO Corporate Document Repository: Land Resources Information System in the Caribbean - Grenada. [online]<http://www.fao.org/docrep/004/y1717e/y1717e11.htm> [Retrieved 17 September 2010]
Nauges, C., and A. Thomas. (2000), ―Privately-operated Water Utilities, Municipal Price Negotiation, and Estimation of Residential Water Demand: The Case of France.‖ Land Economics Vol 76 (1) 68–85
Overmars, M., and S. Gottlieb. (2009), Perspectives on water and climate change adaptation: Adapting to climate change in water resources and water services in Caribbean and Pacific small island countries. [online]< http://www.worldwatercouncil.org/fileadmin/wwc/Library/Publications_and_reports/Climate_Change/PersPap_03._Small_Island_Countries.pdf> [Retrieved 2 March 2011]
Pangare, G., Pangare, V., Binayak, D. (2006), Springs of life, India’s water resources, Academic foundation, New Delhi.
Renwick, M. A. and R. D. Green. (2000), ―Do Residential Demand Side Management Policies Measure Up? An Analysis of Eight California Water Agencies‖. Journal of Environmental Economics and Management. Vol 40, 37-55.
Ringler, C. 2008. ―The Millennium Ecosystem Assessment: Tradeoffs between Food Security and the Environment.‖ Turkish Journal of Agriculture and Forestry. Vol 32, 3: 147-157
Rodgers, C. (2010a), Economic Valuation of Regional Climate Change impacts in the Water Sector. [online]< http://www.adb.org/Documents/events/2010/Economics-Climate-Change-PRC/CRodgers-eco-valuation.pdf> [Retrieved 8 September 2010]
Rodger, C. (2010b), Economic Impacts of Climate Change on the Water Sector: Methodological Approachesr. [online]< http://www.adb.org/Documents/events/2010/CPST-Brainstorming-Meeting/presentation-cpst-rodgers.pdf> [Retrieved 8 September 2010]
Rose, A., Cao, Y., Oladosu, G. (2000), Simulating the economic impacts of climate change in the Mid-Atlantic Region. Vol 14: p. 175–183 Department of Energy, Environmental, and Mineral Economics and Centre for Integrated Assessment. [Published 2 May 2000
Rose A, Carmichael J, Oladosu G, Abler D (1999), Modeling the economics of natural hazard impacts and policy responses using computable general equilibrium analysis. The Pennsylvania State University, University Park The Pennsylvania State University, University Park, Pennsylvania 16802, USA
101
Rosenberg, D.E., Tarawneh, T., Abdel-Khaleq, R., Lund, J.R., (2007), ―Modeling integrated water user decisions in intermittent supply systems‖. Water Resources Research, Vol 43 Shahateet, M. I. T. (2008) ―An Econometric Model for Water Sector in Jordan‖, Journal of Social Sciences, Vol. 4 No. 4, pp. 264-271
Secretariat of the Convention on Biological Diversity (SCBD). (2009), Fourth National Report of Grenada to the CDB. Website: http://www.cbd.int/doc/world/gd/gd-nr-04-en.pdf. 8th September, 2010.
Secretariat of the Convention on Biological Diversity (SCBD). (2000), Grenada National Biodiversity Strategy and Action Plan. United Nations Development Programme (UNDP),
Global Environment Facility (GEF). (2000), Website: Grenada [online]<http://www.cbd.int/doc /world/gd/gd-nbsap-01-en.pdf> [Retrieved: 8 September 2010]
Singh, A. (2010). National Environmental Summary, Grenada. United Nations Environment Programme (UNEP).
Scheraga, J., Leary, N., Goettle, R., Jorgensen, D., Wilcoxen., P. (1993), Macroeconomic modeling in the assessment of climate change impacts. IIASA Collaborative Paper Series,CP-93–2, Laxenburg
Shoven JB, and Whalley., J. (1992), Applying general equilibrium. Cambridge University Press, New York.
Smith Warner International Limited. 2006. Coastal Zone Management Report for an Integrated Coastal Zone Management Study.
Taylor, M.A., Centella, A., Charlery, J., Borrajero, I., Bezanilla, A., Campbell, J., Rivero, R., Stephenson, T. S., Whyte, F., Watson, R. (2007), Glimpses of the Future: A Briefing from the PRECIS Caribbean Climate Change Project. Caribbean Community Climate Change, Belmopan: Belize
Taylor, R., McKean, J., Young, R., (2004), ―Alternative Price Specifications for
Estimating Residential Water Demand with Fixed Fees‖. Land Economics Vol 80 (3): 463-
475.
Terry, J. P. (2007). Tropical cyclones and impacts in the South Pacific. New York: Springer.
Trotz, N. (2008), Climate Change, Water and Sanitation: A shared Responsibility. In 4th Biennial Caribbean Environmental Forum and Exhibition. [online] http://www.cehi.org.lc/Website/DOCUMENTS/conference_presentations/Neville%20Trotz.pdf [Retrieved 7 September, 2010]
Turner, K., Stavros, G., Clark, R., Brouwer, R., and J. Burke (2004), Economic valuation of water resources in agriculture, FAO, Rome
Turner, M. (2009), Grenada Protected Area System Plan Part 1. Organization of Eastern Caribbean States (OECS) Castries, St. Lucia.
102
United Nations. (2006), World population prospects: The 2006 revision population database. [online]<http://www.esa.un.org/unpp/ [Retrieved 19 June 2007]
United Nations Development Programme (UNDP). (2010), Quantification and Magnitude of Losses and Damages Resulting from the Impacts of Climate Change: Modelling the transformational impacts and costs of sea level rise in the Caribbean. Prepared by The CARIBSAVE Partnership for UNDP Barbados and the OECS for CARICOM Member States.
United Nations Environment Program. (2004), UNEP’s assistance in the implementation of the Barbados programme of action for the sustainable development of small island developing states. The Hague, Netherlands: Author.
United Nations Framework Convention on Climate Change. 2008. Feeling the heat future effects: A question of degree.[online]http://unfccc.int/essential_back-ground/feeling_the_heat/items/2905.php.[Retrieved 21 May 2008]
United Nations Framework Convention on Climate Change (UNFCCC).2010. Synthesis report on efforts undertaken to assess the costs and benefits of adaptation options, and views on lessons learned, good practices, gaps and needs. Presented by the Subsidiary Body for Scientific and Technological advice at the thirty-second session, Bonn, 31 May to 9 June 2010.
World Bank. 2000. Cities, seas and storms: Managing change in Pacific Island economies: Vol. 4: adapting to climate change. Washington, DC: Author.
Yano, T., Aydın, M., Haraguchi, T., (2007), ―Impact of climate change on irrigation demand and crop growth in a Mediterranean environment of Turkey‖, Sensors, Vol 7, 2297-2315.
Young, R.A., 2005. Determining the economic value of water: concepts and methods. Resources for the Future, Washington, DC
Zhou, Y. and R.S.J. Tol. 2005. Evaluating the costs of desalination and water transport. Water Resource. Res., 41, 1–10.
Related Documents