Middle East Spatial Technology Conference & Exhibition MEST 2009 Kingdom of Bahrain, 7 - 9 December 2009 ASSESSMENT OF THE DIGITAL TERRAIN MODELS (DTMS) DERIVED FROM AERIAL PHOTOGRAMMETRY AND AIRBORNE LIDAR SURVEYING OF A 450KM LONG HIGHWAY CORRIDOR IN YEMEN: A PRACTICAL CASE STUDY YAHIA M AL-HAIFI Assistant Professor of Engineering Surveying and Geodesy Civil Engineering Department Faculty of Engineering, Sana’a University P. O. Box: 13133, Sana’a, Yemen e-mail: [email protected] 1

Assessment of the Digital Terrain Models
Oct 22, 2014
Welcome message from author
This document is posted to help you gain knowledge. Please leave a comment to let me know what you think about it! Share it to your friends and learn new things together.
Transcript
Middle East Spatial Technology Conference & Exhibition MEST 2009
Kingdom of Bahrain, 7 - 9 December 2009
ASSESSMENT OF THE DIGITAL TERRAIN MODELS (DTMS)
DERIVED FROM AERIAL PHOTOGRAMMETRY AND AIRBORNE
LIDAR SURVEYING OF A 450KM LONG HIGHWAY CORRIDOR
IN YEMEN: A PRACTICAL CASE STUDY
YAHIA M AL-HAIFI
Assistant Professor of Engineering Surveying and GeodesyCivil Engineering DepartmentFaculty of Engineering, Sana’a UniversityP. O. Box: 13133, Sana’a, Yemene-mail: [email protected]
1

Middle East Spatial Technology Conference & Exhibition MEST 2009
Kingdom of Bahrain, 7 - 9 December 2009
ABSTRACT
This paper addresses the performance of two modern surveying techniques, Aerial Photogrammetry and Airborne Light Detection and Ranging (ALIDAR), which were applied in mapping a 450km long strategic road corridor project in Yemen Republic during the years 2004-2006. The road project was contracted in three parts. Two parts (SectionI and SectionIII) were contracted by the German DORSCH CONSULT Company, who used ALIDAR technology in their studies, and one part (SectionII) was contracted by the British HALCROW INTERNATIONAL Company, who used Aerial Photogrammetry technique in their studies. An assigned task, to verify and assess the accuracy of the submitted control and detailed topographic surveying outputs prior to taking-over all the surveying deliverables from the two contractors, was contracted with the Ministry of Public Works and Highways (MPWH) in Yemen.
The study in this paper will focus only on the checking the accuracy of the submitted DTMs related data and information. The methodology used in verifying and assessing the accuracy of the submitted DTMs was in accordance to the terms of reference (TOR) between the client and the contractors using the recommended procedures by the American Federal Geographic Data Committee (FGDC) National Standard for Spatial Data Accuracy (NSSDA) standards. The instrumentation used for checking the accuracy of the generated DTMs included Total Station and RTK GPS surveying system. The submitted DTM data and the digital imagery from both contractors showed that ALIDAR topographic coverage of the studied corridors is higher than the photogrammetric topographic coverage in terms of corridor width and topographic point density. The ALIDAR DTM data showed that the topographic and imagery covered a 500 meter corridor width, while the photogrammetry DTM data and imagery covered only a 250 meter corridor width. With respect to the topographic point density, the ALIDAR survey provided about 15 topographic points per 100 square meters, whereas the photogrammetry survey provided about 4 topographic points per 100 square meters. The discrepancy in the density of the topographic coverage from the two techniques has been reflected in the accuracy of the tested samples. The obtained check results show that the accuracy of the generated DTM from the ALIDAR technique is on average three times greater than the accuracy of the DTM generated from the aerial photogrammetric technique. The conclusions and the recommendations from those tests are presented.
KEYWORDS
Photogrammetry – ALIDAR – DTM – Accuracy – Assessment
2
Middle East Spatial Technology Conference & Exhibition MEST 2009
Kingdom of Bahrain, 7 - 9 December 2009
1 Introduction
A surveying consultation was contracted with the Ministry of Public Works and Highway (MPWK) in Sana’a, Yemen, in May 2005. The required surveying consolation was to assess and take-over the final products of the surveying works for mapping a corridor of 450km long highway project conducted over the years 2004-2006. The studied and designed road project runs from the mid north southward to the southern part on the Gulf of Aden coast crossing eight Yemeni governorates (Amran, Sana’a, Capital Sana’a Municipal, Dhamar, Ibb, Taiz, Lahj and Aden). This project is recognized locally as Amran-Aden strategic road project. The Amran-Aden strategic project was contracted by two internationally recognized contractors, the DORSCH CONSULT (German), which contracted the first and third sections (SectionI & SectionIII) of the project with total length of about 296km excluding the interchanges, and the HALCROW INERNATIONAL (British), which contracted the second section (SectionII) of the road project with a section length of about 135km excluding also the interchanges.
As will be highlighted later, the unspecified surveying technology or technologies to be used for the highway corridor mapping purpose as outlined in the TOR accompanied the signed contracts between the MPWH and the contractors had led to applying different mapping technology by each of the two contractors. Therefore, each contractor had the option to use a topographic mapping technology based on the accuracy requirements and probably on what was possible for each contractor. The DORSCH CONSULT used an Airborne Light and Detection Ranging (ALIDAR) technology while the HALCROW INERNATIONAL used an Aerial Photogrammetry technology. Consequently, the two mapping techniques yielded unmatched deliverables.
An introductory section is specified for providing general information on the Amran-Aden Strategic Road Project. The surveying consultation tasks to verify and take-over the surveying and mapping deliverables for Amran-Aden road project are introduced in section 3. The DTM requirements for highway road project studies are given in section 4 of this paper. Section 5 describes the implemented mapping technologies in studying the contracted project by the Dorsch Consult and
3
Middle East Spatial Technology Conference & Exhibition MEST 2009
Kingdom of Bahrain, 7 - 9 December 2009
Halcrow International contractors. The proposed methodologies for fulfilling the tasks of verifying and taking-over the surveying and mapping work deliverables are outlined in section 6. Assessment of the DTMs accuracy check results for the three sections and overlapping regions of Amran-Aden road project are presented in section 7. Finally, this paper is concluded in section 8 by highlighting the conclusions drawn from this work and the suggested recommendations.
Amran-Aden Strategic Road Project
Over the last decade Yemen has witnessed major investments in the infrastructure sectors including the road projects sector. The statistics published by the National Information Center (NIC) show that the paved road network has considerably increased from about 6000km in 1999 to about 13500km in 2007. This network includes urban, suburban, and inter-governorate roads ranging from rural to first order roads. The proposed Amran-Aden strategic road project is the only infrastructure dual carriage highway project to be built in Yemen, which was studied and designed during the years 2004-2006 in accordance to the international highway standards.
The strategic significance of the proposed Amran-Aden Road Project can be seen from various angles among which:
1. The inability of the existing roads to accommodate the accelerating increase in traffic volume along the regions of the proposed road project.
2. Almost 80% of the Yemeni population concentrated along the proposed road project. This can be seen clear from the population concentration map shown below in Figure 1.
3. The needs for a highway to facilitate trans-shipment of goods between Aden’s seaport and the inlands regions and vise versa.
4. The needs for enhancing the ties with the neighboring countries under the Economic and Social Commission for Western Asia (ESCWA) Al-Mashriq Road Safety Program.
It is also worth mentioning that Amran-Aden road project is the only road project mapped by modern digital mapping systems, the ALIDAR and
4

Middle East Spatial Technology Conference & Exhibition MEST 2009
Kingdom of Bahrain, 7 - 9 December 2009
aerial photogrammetry technologies. The cost for performing the surveying, mapping and design of the whole project including other non-surveying or mapping studies (e.g. environmental, traffic, hydrological, geological studies, etc.) was a grand total of $6,000,000 US Dollars.
Figure 1: Population Density in Yemen
The Surveying Consultation Tasks
The surveying consultation tasks were to apply the appropriate field and office surveying measures to:
1. Assess the submitted third order control points for future setting-out the various parts of the designs of the three parts of the studied road corridor in terms of:
I. The quality of the established control points.
II. The location of these control points with respect to the road project construction site.
III. The fulfillment of the length of distances between successive control points to the TOR, which stated that these distances should not be more than 500m.
5
Middle East Spatial Technology Conference & Exhibition MEST 2009
Kingdom of Bahrain, 7 - 9 December 2009
IV. The visibility between each control point and its precedence and the next one.
V. The visibility of the proposed road centerline with respect to the control points.
The outputs of this stage are not included in this paper as it is intended to be published in the near future.
2. Assess the quality of the submitted DTMs for the three sections of the studied road project.
DTM Requirements for Highway Corridor Mapping
Digital Terrain Model is scientifically defined as a mathematical representation of the earth surface. Terrain modeling and analyzing algorithms are beyond the scope of this paper and interested readers are referred to the relevant literature, for example (Wilson & Gallant, 2000).
To enable the assessment of the DTM generated for the study area it was necessary to stand on the surveying requirements for large scale mapping. These requirements can be looked at from the local point of view and from the international surveying community point of view.
1. The local point of view, as stated in the relevant TOR, stated that it was required to perform appropriate field and office surveying and mapping works yielding final products with a scale of 1:2000 for the horizontal and 1:200 for the vertical. The vertical accuracy of the required DTM can be inferred from the stated vertical scale:
I. As to be within one meter if the vertical accuracy is assumed to be half the DTM vertical resolution as recommended by Ghilani & Wolf (2008).
II. As a third of the contour line accuracy. If it is assumed that vertical scale equals the accuracy of the generated contour lines from the generated DTM, the accuracy of the generated DTMs was anticipated to be 0.67m.
6

Middle East Spatial Technology Conference & Exhibition MEST 2009
Kingdom of Bahrain, 7 - 9 December 2009
2. Looking at the international surveying community point of view on the required vertical accuracy of the DTM for road project studies and design, the following requirements are sought (NJDOT, 2002).
I. The required vertical accuracy of the generated DTM from Aerial photogrammetry should be within:
a. ± 0.12m to ±0.39m for bill quantities payment at the 95% level of significance corresponding to flat to rolling terrain and rigid terrain, respectively.
b. ± 0.39m to ±0.98m for preliminary quantities at the 95% level of significance corresponding to flat to rolling terrain and rigid terrain, respectively.
II. The reported typical vertical accuracy of the generated DTM from LIDAR technology is within ± 0.15 at the 95% level of significance (U.S. Army Corps of Engineers, 2002). Therefore, LIDAR provided DTMs can not be used for pay bill quantities.
III. The American Society of Photogrammetry and Remote Sensing (ASPRS) vertical accuracy requirement for spot or digital terrain model elevation points for target 2.0m contour interval is ±0.33m, ±0.67m and ±1.0m for Class 1, Class 2 and Class 3 accuracy, respectively (U.S. Army Corps of Engineers, 2007).
Implemented Mapping Techniques by the Contractors and Final Deliverables
5.1 Implemented Mapping Techniques
As stated earlier the signed contract between the client, the Ministry of Public Works and Highways (MPWH), and the bid winner contractors, Dorsch Consult and Halcrow International, did not specify the type of surveying and mapping technique to accomplish the required task. This had led to adopting:
1. Similar technique and procedures in establishing the control surveying works using the Global Positioning System (GPS) in three stages:
7
Middle East Spatial Technology Conference & Exhibition MEST 2009
Kingdom of Bahrain, 7 - 9 December 2009
I. Verifying the accuracy of the adopted first order control points.
II. Establishing the second order control surveying to control the mapping process.
III. Establishing the third order control points for future setting-out works.
2. Different mapping technique by each contractor, where:
I. The Dorsch Consult had applied the LIDAR mapping system and digital photography to accomplish the mapping stage.
II. The Halcrow International had applied aerial photogrammetry in their mapping task.
5.2 Final Deliverables
Although it was not clearly stated in the relevant TOR what final deliverables should be handed-over to the client, the following surveying and mapping data and final products were, among final designs and reports, delivered:
5.2.1 Deliverables from Dorsch Consult
Although the total length of SectionI and SectionII corridors of Amran-Aden road project is about twice longer than the SectionII corridor length, Dorsch Consult were ten months ahead of Halcrow International in delivering the surveying , mapping and final draft reports. Starting on mid May 2005, the following were delivered:
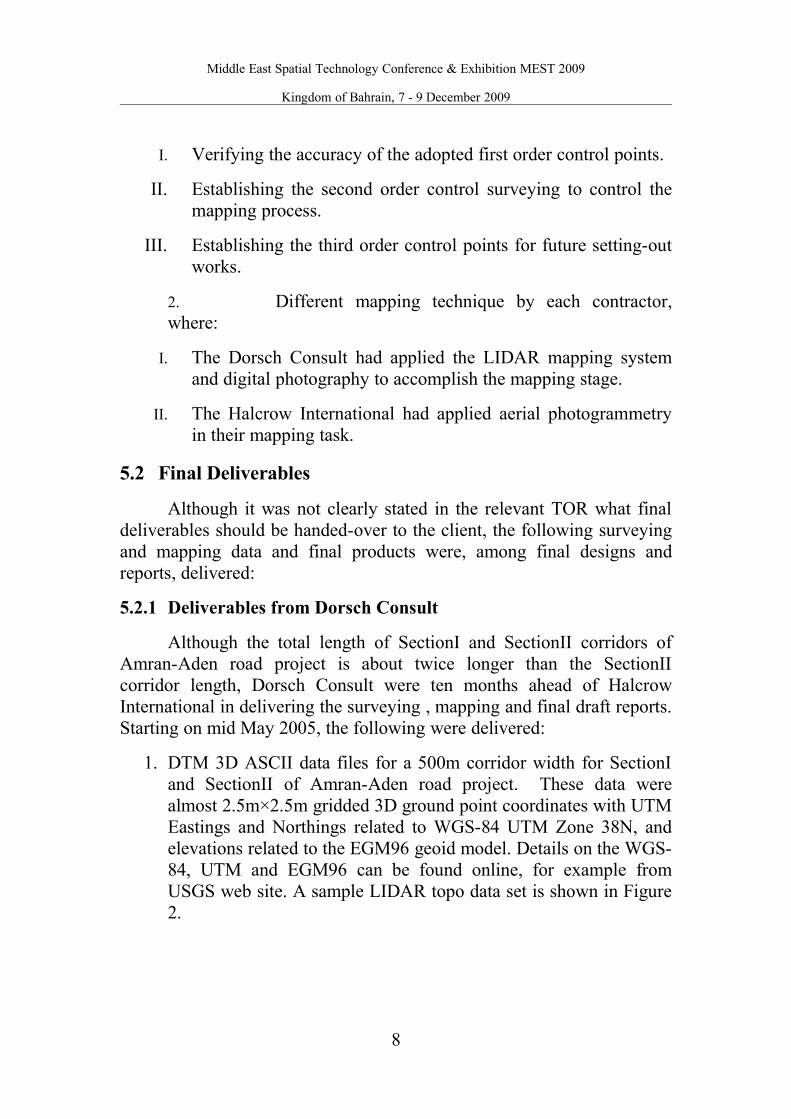
1. DTM 3D ASCII data files for a 500m corridor width for SectionI and SectionII of Amran-Aden road project. These data were almost 2.5m×2.5m gridded 3D ground point coordinates with UTM Eastings and Northings related to WGS-84 UTM Zone 38N, and elevations related to the EGM96 geoid model. Details on the WGS-84, UTM and EGM96 can be found online, for example from USGS web site. A sample LIDAR topo data set is shown in Figure 2.
8
Middle East Spatial Technology Conference & Exhibition MEST 2009
Kingdom of Bahrain, 7 - 9 December 2009
2. Geo-referenced digital orthophotos in 24 bit color ECW format, for a 500m corridor width for the above mentioned road corridor sections.
3. GPS RINEX data for 3rd order setting-out control points for SectionI & SectionIII.
4. Surveying reports of the whole study.
Deliverables from Halcrow International
The flowing deliverables were handed over by Halcrow International starting on mid April 2006:
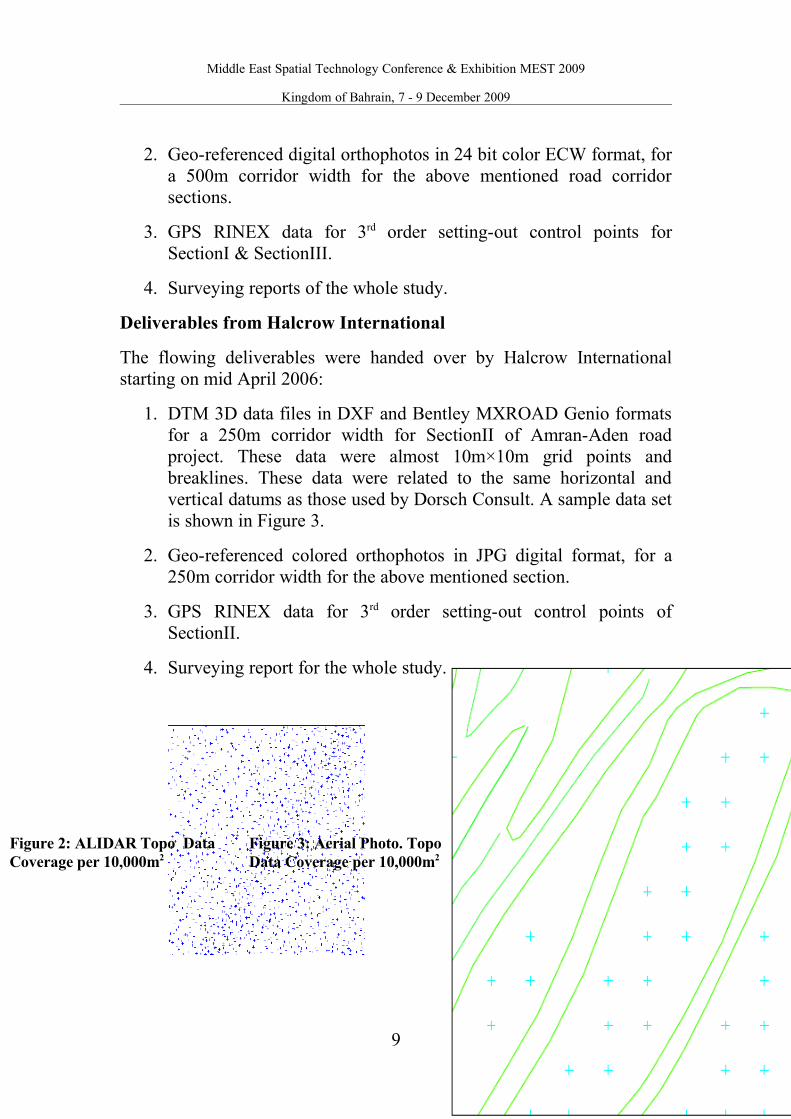
1. DTM 3D data files in DXF and Bentley MXROAD Genio formats for a 250m corridor width for SectionII of Amran-Aden road project. These data were almost 10m×10m grid points and breaklines. These data were related to the same horizontal and vertical datums as those used by Dorsch Consult. A sample data set is shown in Figure 3.
2. Geo-referenced colored orthophotos in JPG digital format, for a 250m corridor width for the above mentioned section.
3. GPS RINEX data for 3rd order setting-out control points of SectionII.
4. Surveying report for the whole study.
9
Figure 2: ALIDAR Topo Data Figure 3: Aerial Photo. TopoCoverage per 10,000m2 Data Coverage per 10,000m2

Middle East Spatial Technology Conference & Exhibition MEST 2009
Kingdom of Bahrain, 7 - 9 December 2009
10

Middle East Spatial Technology Conference & Exhibition MEST 2009
Kingdom of Bahrain, 7 - 9 December 2009
6 Adopted Methodologies for Verifying the Accuracy of the Topographical Mapping Data
When assessing the DTM quality it is common practice to consider the vertical component of the topographical data points as a critical factor that affecting the generated DTM accuracy and hence the accuracy of the computed quantities from this DTM. From a practical point of view any error or displacement in the horizontal will be reflected in the height component.
To perform the field and office checks on the accuracy of the submitted topographical mapping data, the following methodologies were adopted:
1. The field checks of random sites per each section, with an average of 8 to 10 sites per section, along the road corridor were performed using:
I. A 5 second total station TC805 from Leica, where a sample size of more than 40 points were observed and tied to the third order control points per each site. The relevant atmospheric and data reduction to the UTM corrections were applied on each site. The mathematical considerations of these corrections can be found in any relevant textbook, for example (Ghilani & Wolf, 2008).
II. A Real Time Kinematic (RTK) GPS surveying for one site in SectionII of Amran-Aden road Project. This data set was observed by the subcontractor surveying team of Halcrow International.
2. The office work to accomplish the verification process was perform in the following manners:
I. The surveyed check points were imported into the Autodesk Land Desktop 2004 project by their horizontal position coordinates only. These points were then tied by a polyline and the heights of these points were automatically extracted from the submitted DTM using the create points from a polyline vertices based on the elevations of this DTM.
11
Middle East Spatial Technology Conference & Exhibition MEST 2009
Kingdom of Bahrain, 7 - 9 December 2009
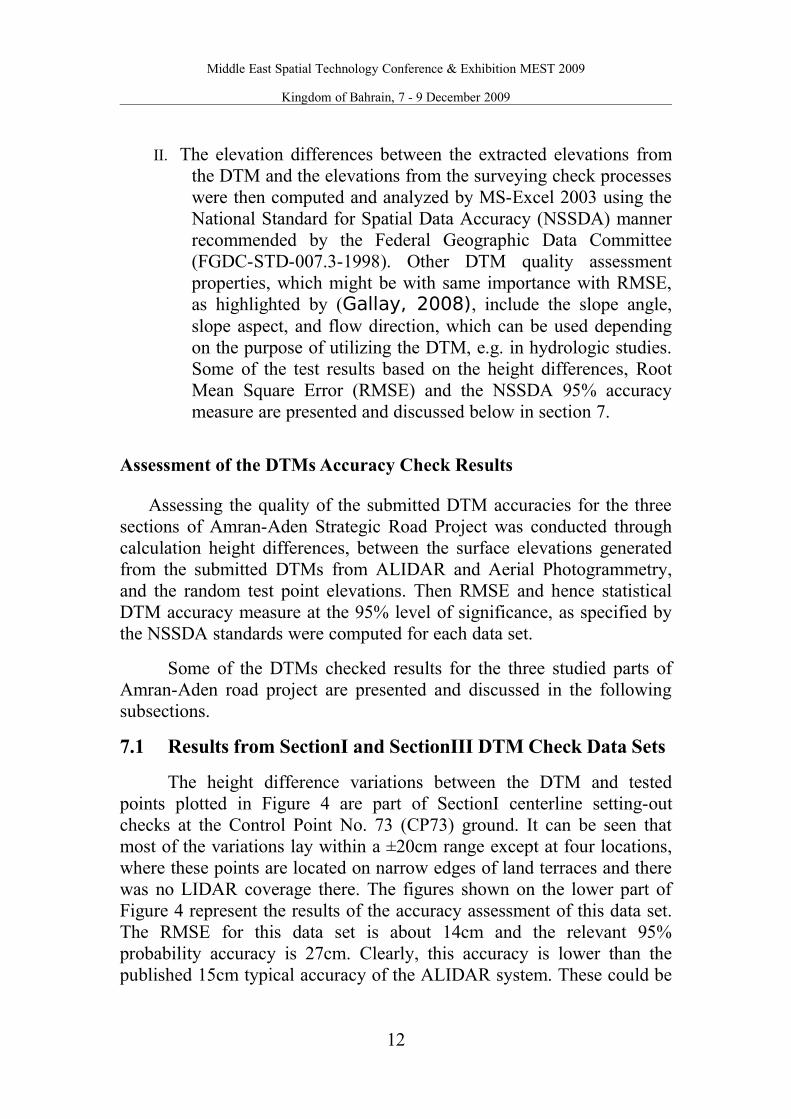
II. The elevation differences between the extracted elevations from the DTM and the elevations from the surveying check processes were then computed and analyzed by MS-Excel 2003 using the National Standard for Spatial Data Accuracy (NSSDA) manner recommended by the Federal Geographic Data Committee (FGDC-STD-007.3-1998). Other DTM quality assessment properties, which might be with same importance with RMSE, as highlighted by (Gallay, 2008), include the slope angle, slope aspect, and flow direction, which can be used depending on the purpose of utilizing the DTM, e.g. in hydrologic studies. Some of the test results based on the height differences, Root Mean Square Error (RMSE) and the NSSDA 95% accuracy measure are presented and discussed below in section 7.
Assessment of the DTMs Accuracy Check Results
Assessing the quality of the submitted DTM accuracies for the three sections of Amran-Aden Strategic Road Project was conducted through calculation height differences, between the surface elevations generated from the submitted DTMs from ALIDAR and Aerial Photogrammetry, and the random test point elevations. Then RMSE and hence statistical DTM accuracy measure at the 95% level of significance, as specified by the NSSDA standards were computed for each data set.
Some of the DTMs checked results for the three studied parts of Amran-Aden road project are presented and discussed in the following subsections.
7.1 Results from SectionI and SectionIII DTM Check Data Sets
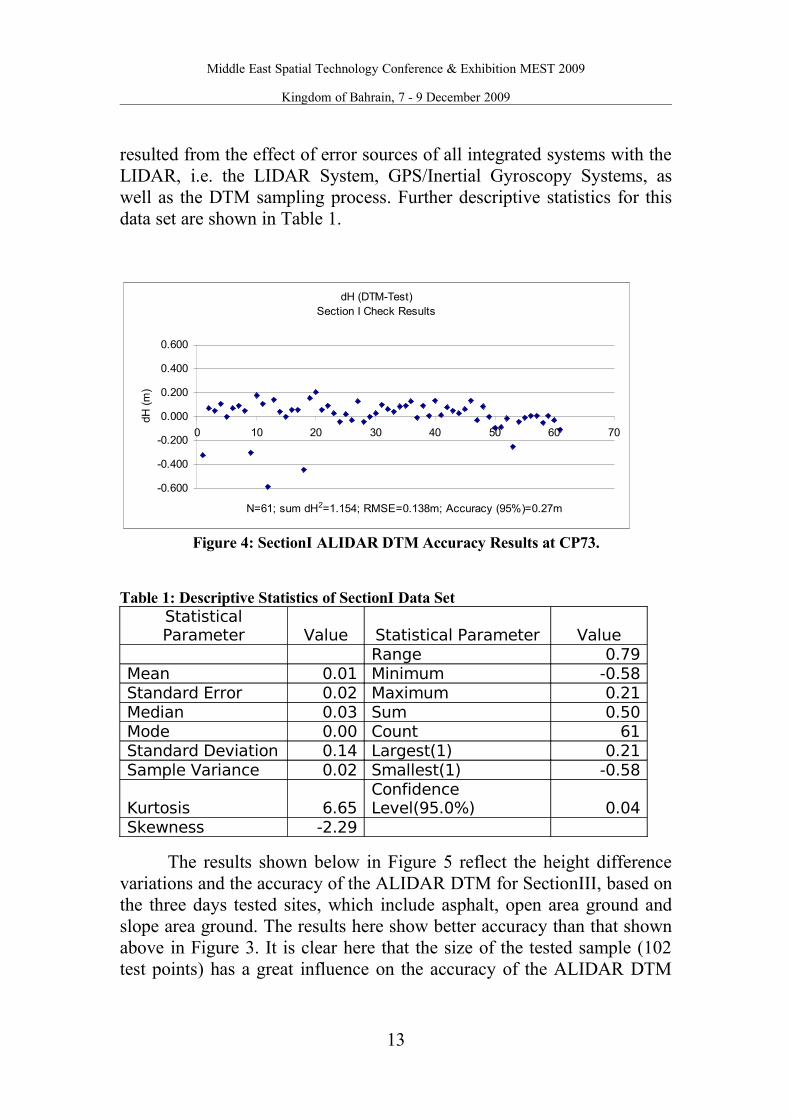
The height difference variations between the DTM and tested points plotted in Figure 4 are part of SectionI centerline setting-out checks at the Control Point No. 73 (CP73) ground. It can be seen that most of the variations lay within a ±20cm range except at four locations, where these points are located on narrow edges of land terraces and there was no LIDAR coverage there. The figures shown on the lower part of Figure 4 represent the results of the accuracy assessment of this data set. The RMSE for this data set is about 14cm and the relevant 95% probability accuracy is 27cm. Clearly, this accuracy is lower than the published 15cm typical accuracy of the ALIDAR system. These could be
12
Middle East Spatial Technology Conference & Exhibition MEST 2009
Kingdom of Bahrain, 7 - 9 December 2009
resulted from the effect of error sources of all integrated systems with the LIDAR, i.e. the LIDAR System, GPS/Inertial Gyroscopy Systems, as well as the DTM sampling process. Further descriptive statistics for this data set are shown in Table 1.
dH (DTM-Test)Section I Check Results
-0.600
-0.400
-0.200
0.000
0.200
0.400
0.600
0 10 20 30 40 50 60 70
N=61; sum dH2=1.154; RMSE=0.138m; Accuracy (95%)=0.27m
dH (
m)
Figure 4: SectionI ALIDAR DTM Accuracy Results at CP73.
Table 1: Descriptive Statistics of SectionI Data SetStatistical Parameter Value Statistical Parameter Value
Range 0.79Mean 0.01 Minimum -0.58Standard Error 0.02 Maximum 0.21Median 0.03 Sum 0.50Mode 0.00 Count 61Standard Deviation 0.14 Largest(1) 0.21Sample Variance 0.02 Smallest(1) -0.58
Kurtosis 6.65Confidence Level(95.0%) 0.04
Skewness -2.29
The results shown below in Figure 5 reflect the height difference variations and the accuracy of the ALIDAR DTM for SectionIII, based on the three days tested sites, which include asphalt, open area ground and slope area ground. The results here show better accuracy than that shown above in Figure 3. It is clear here that the size of the tested sample (102 test points) has a great influence on the accuracy of the ALIDAR DTM
13

Middle East Spatial Technology Conference & Exhibition MEST 2009
Kingdom of Bahrain, 7 - 9 December 2009
besides the higher density of the DTM sampled points (about 15 topographic points per 100 square meters).
Figure 5: SectionIII ALIDAR DTM Accuracy Results from Various Sites
Looking at the histogram plot in Figure 6 of the previous data set height differences, it can be inferred that almost 90%, 95% and 99% of the tested point height variations lay within ± 15cm, ±20cm and ±30cm, respectively. Most importantly, these variations are almost symmetrically distributed around the zero. The implication that can be inferred from this is that there is no clear bias or biases associated with ALIDAR DTM data set.
1 2 619
44
71
90 95 99 99 100
0
5
10
15
20
25
30
-0.40 -0.30 -0.20 -0.10 0.00 0.10 0.20 0.30 0.40
Section III Check ResultsdH Categories in meters
Fre
quen
cy
0
20
40
60
80
100
Frequency cumulative
Figure 6: Histogram Analysis of the SectionIII Data Sets
14
dH (DTM-Test)Section III Random Site Check Results
-0.4
-0.3
-0.2
-0.1
0.0
0.1
0.2
0.3
0.4
0 10 20 30 40 50 60 70 80 90 100 110
N=102; sum dH 2=1.38; RMSE=0.116m; Accuracy (95%)=0.23m
dH
(m
)

Middle East Spatial Technology Conference & Exhibition MEST 2009
Kingdom of Bahrain, 7 - 9 December 2009
7.2 Results from SectionII DTM Check Data Sets
The results shown in Figure 7 represent the aerial photogrammetrical DTM accuracy test conducted along the SectionII corridor at CP037 comprises two data sets. The first data set (sample points from 1 to 60) represent a data collected on both edges of an asphalt surface at 5m regular distances, while the second data set (sample points from 61 to 110) included points surveyed on the natural ground surface and at also 5m regular distances. It is clearly here, as can be seen from the distribution of the height differences between the DTM and the third order control points related ground surface elevations, that the accuracy of the submitted DTM is largely deviated from the anticipated accuracy. It can be argued here to some extent that the less density of the sampled topographical points by the aerial photogrammetry (about 15 topographic points per 100 square meters) has contributed to the degradation of the generated DTM accuracy. The inclusion of breaklines with the spot heights for SectionII DTM did not contribute positively to the relevant accuracy.
The same previous remarks apply to the RTK data set presented in Figure 8 with worse accuracy (2.08m) than that shown in Figure 7 (1.23m). Moreover, a clear vertical bias of about one meter does exist in this DTM as can be seen in Figure 8 and Table 2. Similar results were encountered with other samples that have not included in this paper work. This height bias, which could be a scale or vertical datum shift, depicts the ground surface generated from the delivered DTM as being below the generated ground surface related to the established third order ground control points. These ground control points were established by GPS rapid static survey technique and their relative accuracies were tested and found to be within the specified ±25mm accuracy standards. These GPS control surveying results will be published later in the near future.
15

Middle East Spatial Technology Conference & Exhibition MEST 2009
Kingdom of Bahrain, 7 - 9 December 2009
dH (DTM-Test)Section II Check Results At CP037A-Asphalt&Natural ground
-1.4
-1.2
-1.0
-0.8
-0.6
-0.4
-0.2
0.0
0 10 20 30 40 50 60 70 80 90 100 110
N=110; SUM dH 2=43.33; RMSE=0.63m; ACCURACY (95%)=1.23m
dH
(m
)
Figure 7: SectionII Aerial Photogrammetrical DTM Accuracy Results at CP037
dH (DTM - RTK) Section II RTK GPS Check Results (IBB Asphalt Road)
-1.8
-1.6
-1.4
-1.2
-1.0
-0.8
-0.6
-0.4
-0.2
0.0
0 10 20 30 40 50 60 70
N=61; SUM dH2=68.74; RMSE=1.06m; ACCURACY (95%)=2.08m
dH (
m)
Figure 8: SectionII Aerial Photogrammetrical DTM Accuracy Check by RTK GPS technique
It was difficult to speculate the sources of errors that led to the lower accuracy of the aerial photogrammetrically generated DTM model for SectionII of Amran-Aden road project, as it was also difficult to reject this topographical data as the obtained check results showed that the accuracy of the DTM is out of the range of the accuracy required by the 1:200 vertical accuracy requirements as per the TOR by a factor of almost three. This was due to the unclear mapping requirements attached to the relevant TOR. Although the obtained results were reported to the contractor, no clear answers or even no more investigations have been performed.
16

Middle East Spatial Technology Conference & Exhibition MEST 2009
Kingdom of Bahrain, 7 - 9 December 2009
Based on the obtained SectionII DTM assessment results, It can be stated here that the preliminary quantities estimated from the SectionII DTM are almost three times worse than those generated by the ALIDAR for SectionI and SectionIII.
Table 2: Descriptive Statistics of SectionII RTK Data SetStatistical Parameter Value Statistical Parameter Value
Range 1.64Mean -1.00 Minimum -1.77Standard Error 0.05 Maximum -0.13Median -1.03 Sum -60.70Mode -1.44 Count 61Standard Deviation 0.37 Largest(1) -0.13Sample Variance 0.14 Smallest(1) -1.77Kurtosis -0.49 Confidence Level(95.0%) 0.10Skewness 0.18
7.3 Results from Overlapping Regions
A DTM accuracy test sample was collected along overlapping region between SectionII and SectionIII at the end of SectionII corridor and the start of the SectionIII corridor (Figure 9).
Figure 9: Plan of the collected sample data points along Overlapping Region (Mawyah Asphalt Road)
17
Middle East Spatial Technology Conference & Exhibition MEST 2009
Kingdom of Bahrain, 7 - 9 December 2009
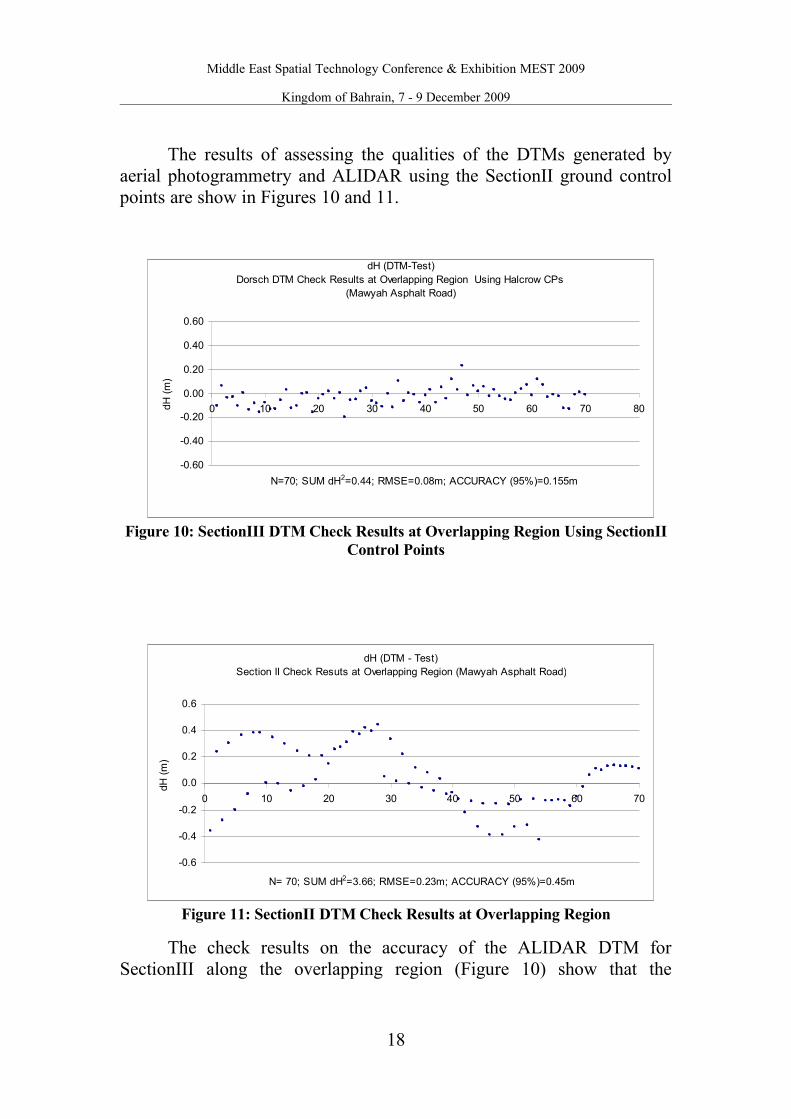
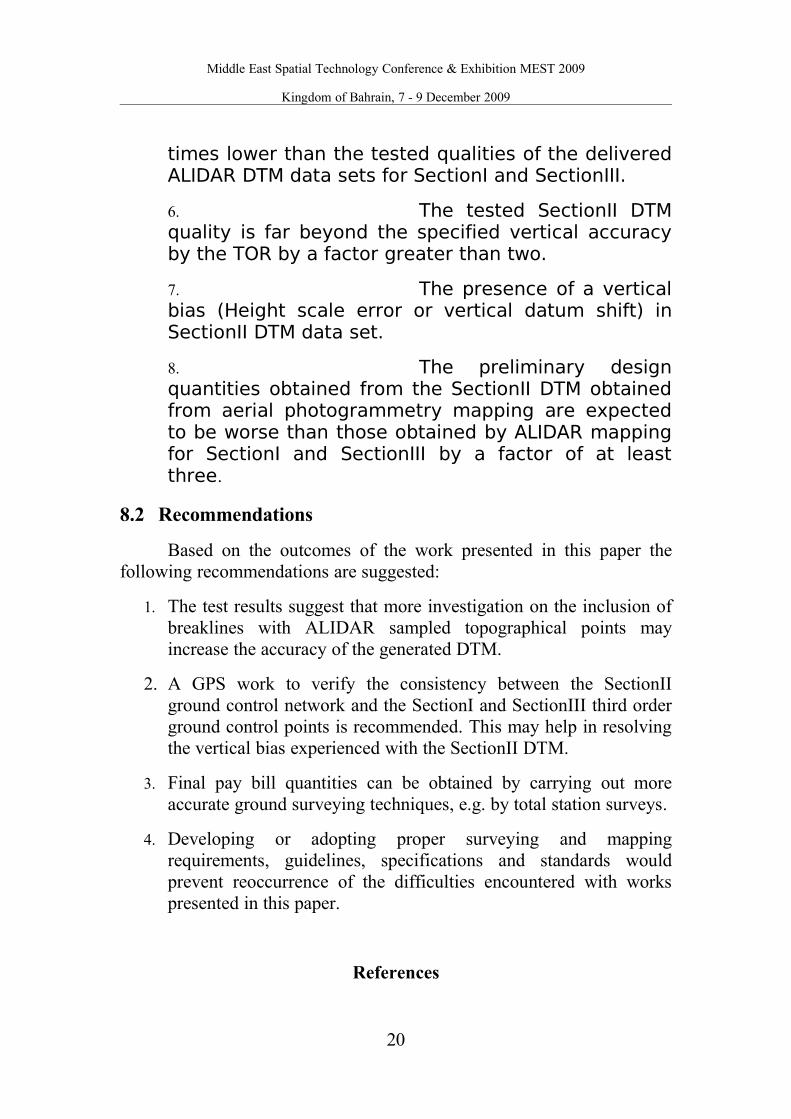
The results of assessing the qualities of the DTMs generated by aerial photogrammetry and ALIDAR using the SectionII ground control points are show in Figures 10 and 11.
-0.60
-0.40
-0.20
0.00
0.20
0.40
0.60
0 10 20 30 40 50 60 70 80
N=70; SUM dH2=0.44; RMSE=0.08m; ACCURACY (95%)=0.155m
dH (DTM-Test)Dorsch DTM Check Results at Overlapping Region Using Halcrow CPs
(Mawyah Asphalt Road)
dH (
m)
Figure 10: SectionIII DTM Check Results at Overlapping Region Using SectionII Control Points
dH (DTM - Test)Section II Check Resuts at Overlapping Region (Mawyah Asphalt Road)
-0.6
-0.4
-0.2
0.0
0.2
0.4
0.6
0 10 20 30 40 50 60 70
N= 70; SUM dH2=3.66; RMSE=0.23m; ACCURACY (95%)=0.45m
dH (
m)
Figure 11: SectionII DTM Check Results at Overlapping Region
The check results on the accuracy of the ALIDAR DTM for SectionIII along the overlapping region (Figure 10) show that the
18

Middle East Spatial Technology Conference & Exhibition MEST 2009
Kingdom of Bahrain, 7 - 9 December 2009
accuracy of the DTM is almost identical to the published ALIDAR typical mapping accuracy. This was not the case with the aerial photogrammetrically produced DTM for SectionII. The statistical analysis results shown in Figure 11 show that the accuracy of the latter DTM is almost three times worse than the former DTM over the same region.
Conclusions and Recommendations
8.1 Conclusions
The work presented in this paper has focused on assessing the vertical accuracy of the generated DTMs from ALIDAR and aerial photogrammetry mapping systems. The assessment results presented in this work show that:
1. The ALIDAR and aerial photogrammetrical DTMs data acquisition methods and the spacing sizes indicate that the terrain of SectionII was not sampled at the same spatial scales of SectionI and SectionIII.
2. The DTMs accuracy from ALIDAR data is almost as high as twice the accuracy requirement by the TOR.
3. The mapped corridor width for SectionII is almost half the mapped corridor widths for SectionI and SectionIII.
4. ALIDAR mapping for SectionI and SectionIII, with a 500m corridor width and a total of 296km corridor length, helped in handing-over surveying, mapping and final draft designs and reports ten months ahead of aerial photogrammetrical mapping of SectionII corridor with a 250m width and 135km length.
5. The tested quality of the delivered DTM data set for SectionII is almost three
19
Middle East Spatial Technology Conference & Exhibition MEST 2009
Kingdom of Bahrain, 7 - 9 December 2009
times lower than the tested qualities of the delivered ALIDAR DTM data sets for SectionI and SectionIII.
6. The tested SectionII DTM quality is far beyond the specified vertical accuracy by the TOR by a factor greater than two.
7. The presence of a vertical bias (Height scale error or vertical datum shift) in SectionII DTM data set.
8. The preliminary design quantities obtained from the SectionII DTM obtained from aerial photogrammetry mapping are expected to be worse than those obtained by ALIDAR mapping for SectionI and SectionIII by a factor of at least three.
8.2 Recommendations
Based on the outcomes of the work presented in this paper the following recommendations are suggested:
1. The test results suggest that more investigation on the inclusion of breaklines with ALIDAR sampled topographical points may increase the accuracy of the generated DTM.
2. A GPS work to verify the consistency between the SectionII ground control network and the SectionI and SectionIII third order ground control points is recommended. This may help in resolving the vertical bias experienced with the SectionII DTM.
3. Final pay bill quantities can be obtained by carrying out more accurate ground surveying techniques, e.g. by total station surveys.
4. Developing or adopting proper surveying and mapping requirements, guidelines, specifications and standards would prevent reoccurrence of the difficulties encountered with works presented in this paper.
References
20
Middle East Spatial Technology Conference & Exhibition MEST 2009
Kingdom of Bahrain, 7 - 9 December 2009
American Corps of Engineers (2007). Engineering and Design - Control and Topographic Surveying, Manual No. EM1110-1-1005, 01 January 2007, http://140.194.76.129/publications/eng-manuals/em1110-1-005/entire.pdf
American Corps of Engineers (2002). Engineering and Design – Photogrammetric mapping, Manual No. 1110-1-1000, 1 July 2002, http://140.194.76.129/publications/eng-manuals/em1110-1-000/entire.pdf
Gallay, M. (2008). Assessment of DTM quality: a case study using fine spatial resolution data from alternative sources, http://www.unigis.org/gisruk_2008/proceedings/gallay.pdf
Ghilani, D. G. & Wolf, P.R. (2008). Elementary Surveying: An Introduction to Geomatics, 12th Edition, Pearson International Edition, Pearson Education Inc., USA
National Information Center, LENGTH OF ASPHALTED AND PAVED ROADS BY GOVERNORATE (K.M) FOR 1999-2007 http://www.yemen-nic.info/contents/transportatoin/ROAD2.xls
NJDOT (2002) Minimum Guidelines for Aerial Photogrammetric Mapping, http://www.state.nj.us/transportation/eng/documents/photogrammetry/pdf/Photogrammetric.pdf
21
Related Documents