Athens Journal of Technology Engineering September 2014 181 Assessment of the ACI-DAfStb Database of Shear Tests on Slender Reinforced Concrete Beams without Stirrups for Investigations on the Shear Capacity Scatter By Filippo Sangiorgio Johan Silfwerbrand † Giuseppe Mancini ‡ The shear transfer mechanism of RC slender members without stirrups still presents very high uncertainties and the question has generated many controversies and debates since the beginning of the last century. Regrettably, until now the real causes of this problem are not yet clear to the scientific community and the issue is still important to investigate, especially nowadays that the minimizing of natural resources is of uppermost global interest. Due to the increased laboratory costs, actual studies are more and more often devoted to numerical simulations based on previous experiments. Unfortunately, it is difficult to find test results suitable for investigations on the shear capacity scatter in the available specialized literature. Therefore, the objective of this paper is to provide different adequate sets of reported test results containing tests performed on almost identical beams. The ACI-DAfStb database of shear tests on slender reinforced concrete beams without stirrups is considered and analyzed through the use of both multivariate statistical methods and clustering data mining techniques. The database was firstly visually explored by scatterplots and investigated through both univariate and correlation statistical procedures, and then processed by clustering using the k-means algorithm. Similar sets of data were collected in groups of comparable experiments. Clusters containing less than six data sets were removed. The criteria to establish the rate of similarity between each set of data were chosen according to the JCSS Probabilistic Model Code. The study has led to the formation of 13 groups of comparable experiments each group containing a number of tests between 6 and 43, performed generally by different field workers. These groups of reported test results will be of great importance both for the continuation of the authors' research and for other PhD Candidate, KTH Royal Institute of Technology, Sweden. † Professor, KTH Royal Institute of Technology, Sweden. ‡ Professor, Polytechnic University of Turin, Italy.

Welcome message from author
This document is posted to help you gain knowledge. Please leave a comment to let me know what you think about it! Share it to your friends and learn new things together.
Transcript
Athens Journal of Technology Engineering September 2014
181
Assessment of the ACI-DAfStb Database of Shear
Tests on Slender Reinforced Concrete Beams
without Stirrups for Investigations on the Shear
Capacity Scatter
By Filippo Sangiorgio
Johan Silfwerbrand†
Giuseppe Mancini‡
The shear transfer mechanism of RC slender members without
stirrups still presents very high uncertainties and the question has
generated many controversies and debates since the beginning of the
last century. Regrettably, until now the real causes of this problem
are not yet clear to the scientific community and the issue is still
important to investigate, especially nowadays that the minimizing of
natural resources is of uppermost global interest. Due to the
increased laboratory costs, actual studies are more and more often
devoted to numerical simulations based on previous experiments.
Unfortunately, it is difficult to find test results suitable for
investigations on the shear capacity scatter in the available
specialized literature. Therefore, the objective of this paper is to
provide different adequate sets of reported test results containing
tests performed on almost identical beams. The ACI-DAfStb
database of shear tests on slender reinforced concrete beams without
stirrups is considered and analyzed through the use of both
multivariate statistical methods and clustering data mining
techniques. The database was firstly visually explored by scatterplots
and investigated through both univariate and correlation statistical
procedures, and then processed by clustering using the k-means
algorithm. Similar sets of data were collected in groups of
comparable experiments. Clusters containing less than six data sets
were removed. The criteria to establish the rate of similarity between
each set of data were chosen according to the JCSS Probabilistic
Model Code. The study has led to the formation of 13 groups of
comparable experiments each group containing a number of tests
between 6 and 43, performed generally by different field workers.
These groups of reported test results will be of great importance
both for the continuation of the authors' research and for other
PhD Candidate, KTH Royal Institute of Technology, Sweden.
†Professor, KTH Royal Institute of Technology, Sweden.
‡Professor, Polytechnic University of Turin, Italy.
Vol. 1, No. 3 Sangiorgio et al.: Assessment of the ACI-DAfStb Database…
182
researchers who investigate the causes of the shear failure scatter or
develop improved shear design methods.
Introduction
Shear failures are sudden and catastrophic in nature and should be avoided
in the design process.
The shear strength of RC members without web reinforcement is a subject
that has generated many controversies and debates since the beginning of the
last century; a brief and pedagogical historical presentation was presented by
Rebeiz (1999). All the researchers that have tested the shear capacity of
reinforced concrete members without web reinforcement have observed a large
scatter in the results. Even simple members cast simultaneously of the same
concrete batch may show significant differences in the shear capacity.
Silfwerbrand (1984) measured, e.g., 15 percent in tests on overlaid concrete
beams. As far as the topic is concerned, an interesting compilation was made
by ACI and ASCE (1962). In the cited reference, it was shown that the shear
failure load can differ with 100 percent for RC beams with identical or almost
identical geometry and material data. A later review of research data performed
by Rahal (2000) from 161 beams shows that the scatter can be even 120
percent.
Shear failure is a diagonal tension phenomenon and occurs when the
principal tensile stresses exceed the diagonal tensile strength of the member.
However, as frontiersmen of the subject have stated (Kreffeld and Thurston
1966), it is difficult to determine the strength of cracked RC members because
their internal force system is not known with certainty (reinforced concrete is a
composite, nonhomogeneous, and nonisotropic material that cracks
significantly under relatively low loads). Moreover, as reported by Park and
Paulay (1975) and later confirmed by the joint ASCE-ACI Committee 445
(1998), the diagonal cracking load originating from flexure and shear is usually
much smaller than would be expected from both a principal stress analysis and
the tensile strength of concrete; this condition is largely due to the presence of
shrinkage stresses. Therefore, the shear capacity of RC members without web
reinforcements, well represented by the diagonal cracking shear strength
(Mphonde and Frantz 1984), is sensitive to both the observer’s judgment and
the location of the initial flexural cracks, and this may increase the scatter of
the values experimentally determined (Bazant and Kazemi 1991).
Unfortunately, until now the real causes of the considerable variability of
the shear capacity of reinforced concrete members without web reinforcement
are not yet clear to the scientific community and it is still important to
investigate this issue; especially nowadays that the minimizing of natural
resources is of uppermost global interest.
Since the laboratory costs have increased rapidly during recent years,
actual studies are more and more often devoted to numerical simulations based
on experiments realized several decades ago. Researchers who deal with this
Athens Journal of Technology Engineering September 2014
183
topic need reported test results containing tests on almost identical beams.
Regrettably, it is difficult and time-consuming to find suitable test cases in the
comprehensive literature on shear and shear strength capacity.
The objective of this paper is to provide different adequate sets of reported
test results containing tests performed on almost identical beams to researchers
interested in the shear mechanism of reinforced concrete members without
stirrups.
The Methodology
The ACI-DAfStb Database
The ACI-DAfStb evaluation database of shear tests on RC members
without shear reinforcement subjected to point loads and uniformly distributed
loads was considered and analysed. The “evaluation-level” database contains
784 tests on slender beams, including 40 tests on beams with uniformly
distributed loads. For each experiment, the informations provided by the shear
database are summarized in the following main categories: (1) the mechanical
properties of concrete, (2) the reinforcement area and strength, (3) the
geometrical properties of the cross-section, (4) the load, and (5) the measured
ultimate shear capacity. Each category contains different recorded variables.
For more details on the shear database, the reader is referred to Reinek et al.
(2013).
Data Analysis
Multivariate data are data with many variables; such data generally include
control variables (factors) and characteristics (responses). Multivariate data
analysis consists of a search for systematic covariance between all factors and
responses through methods that look at all the sample properties
simultaneously.
Referring to the shear database, the sets of variables including between the
mentioned categories 1 and 4 belong to factors, the remaining set of variables
comprehended in category 5 belongs to responses. For each test, the collection
of all the different variable values is visualized as a point in a multidimensional
space.
The raw database was firstly visually explored by scatterplots and
analyzed through both univariate and correlation statistics methods. Because of
both the heterogeneity of the database and its highly nonlinear structure, more
advanced linear statistical investigations were not considered at this stage.
The shear database was then processed by clustering using the k-means
algorithm (MacQueen 1967; Anderberg 1973; Jain and Dubes 1988; Kaufman
and Rousseeuw 1990). Cluster analysis divides data objects into groups
(clusters) basing only on information found in the data that describes the
objects and their relationship. The goal of this kind of analysis is that the
objects within a group be similar (or related) to one another and different from
(or unrelated to) the objects in other groups. The greater is the similarity (or
Vol. 1, No. 3 Sangiorgio et al.: Assessment of the ACI-DAfStb Database…
184
homogeneity) within a group and the greater is the difference between groups,
the better or more distinct is the clustering. K-means is a prototype-based (a
cluster is defined as a set of objects in which each object is closer to the
prototype that defines the cluster than to the prototype of any other cluster; the
prototype of a cluster is often the centroid, i.e., the mean value of all the points
in the cluster), partitional (simply division of the set of data objects into non-
overlapping clusters) clustering technique that attempts to find a user-specified
number of clusters k (Tan, Steinbach and Kumar 2006).
Cluster analysis was performed assuming just five variables (the
geometrical parameters) be representative of the similarity between the
different experimental tests; these variables are characterized by: (i) the width
of web bw, (ii) the height of beam h, (iii) the effective depth ds, (iv) the shear-
to-span ratio a/d, and (v) the area of reinforcing steel As. This quite restrictive
(but satisfactory for the aim of the study) assumption was defined basing on the
idea that researchers who deal with the shear failure scatter are interested in
tests performed on almost identical beams where the likeness mainly refers to a
visual point of view; that means that, considering constant the load
configuration, the similarity between cases can be related just to the similarity
between the geometrical parameters. Because of its simplicity, in the k-means
algorithm, the use of Euclidian distance metric was preferred.
The number of clusters k was chosen iteratively and heuristically. The final
number of clusters k was set at 89 and determined by examining and selecting a
solution that resulted in the fewest number of clusters that maintained the
standard deviation on each of the cross-section geometrical parameters (bw, h,
ds, and As) within a cluster consistent with the value given by the JCSS
Probabilistic Model Code (i.e., high internal homogeneity). The shear-to-span
ratio a/d was no taken into consideration in this case.
According to the JCSS Probabilistic Model Code, if no further information
is available, the statistical characteristics of the mentioned cross-section
geometrical parameters may be assessed by:
(1)
(2)
(3)
The choice of the JCSS Probabilistic Model Code as an external measure
for assessing the clusters quality, as reported in Vrouwenvelder (2002), is due
to the fact that it gives guidance on the modelling of the random variables in
structural engineering. The number of repetitions of the clustering process,
each with a new set of initial cluster centroid positions, was set at 250; just the
solution with the lowest value for the within-cluster sums of point-to-centroid
distances was considered. In order to assess the quality of the individuated
clusters, the within-cluster similarities and the cluster silhouettes (Rousseeuw,
1987) were calculated and plotted.
The samples reliability first was grossly examined: only clusters
containing more or equal to six data sets were considered as “Possibly Reliable
Sample” while the others were counted as “Uninteresting Background” (were
not taken into consideration for the aim of the study). Each of the n
Athens Journal of Technology Engineering September 2014
185
individuated possibly reliable samples was then visually explored by
scatterplots and analyzed through both univariate and correlation statistics
methods. As previously mentioned, the main assessment procedure consisted in
comparing the standard deviation of each of the cross-section geometrical
parameters (bw, h, ds, and As) within a cluster to the value given by the JCSS
Probabilistic Model Code as follows:
(4)
If Eq. (4) was not satisfied, the search restarted from the cluster analysis
modifying the number of the k-means partitions. All possible noise was
carefully controlled and removed. Conclusively, the treatment of each group of
comparable experiments was left to the final judgment of the authors. The
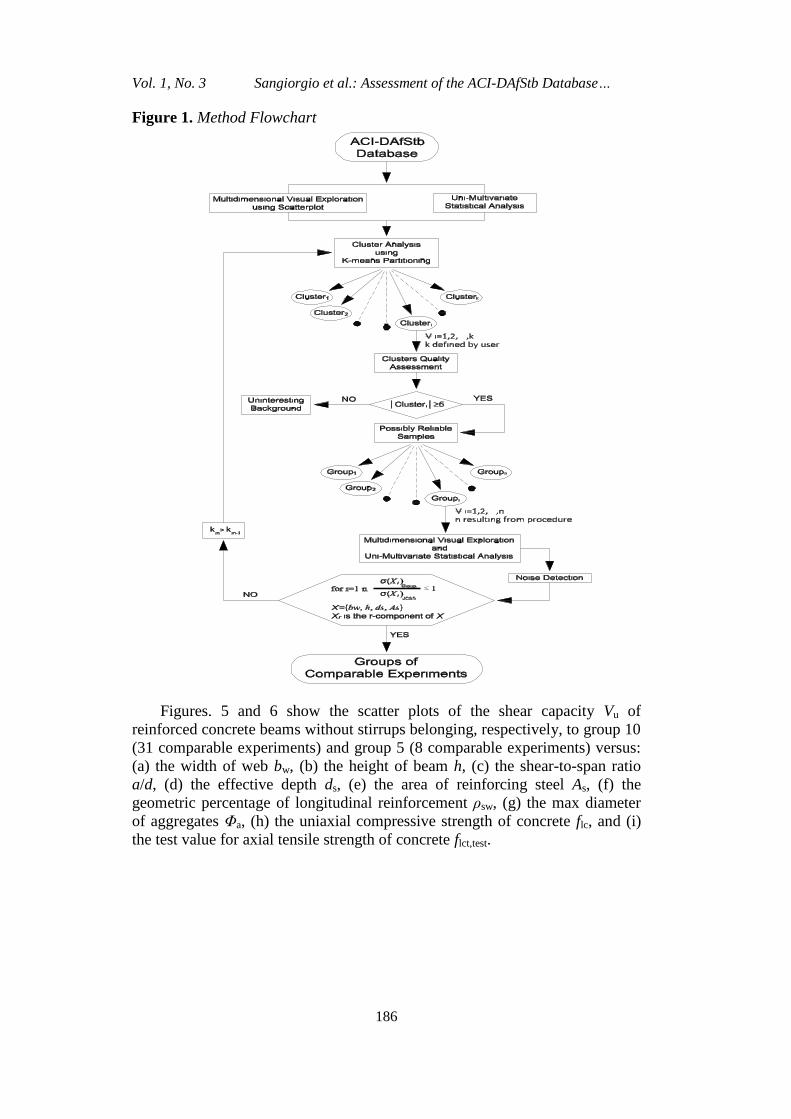
method flowchart is shown in Fig. 1. All the calculations were performed using
the MATLAB Statistics Toolbox.
Computational Results
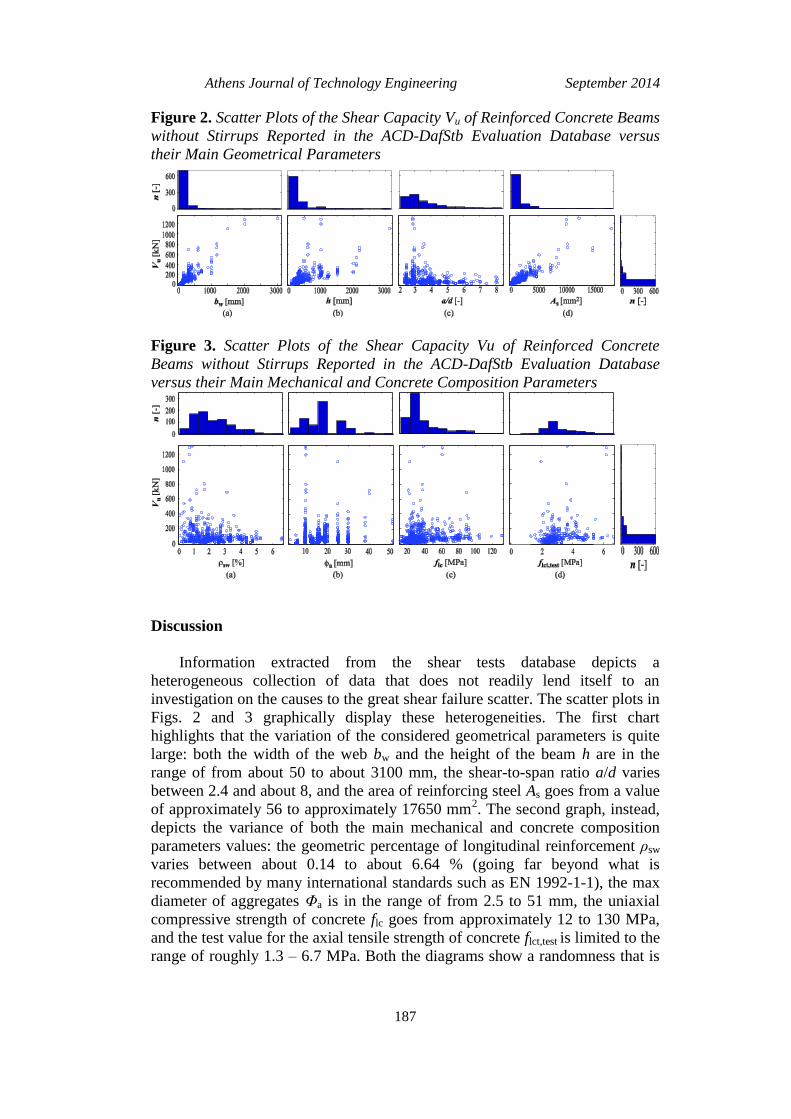
The scatter plots with marginal histograms of the shear capacity Vu of the
reinforced concrete beams without stirrups reported in the ACI-DAfStb
evaluation database with respect to their main geometrical parameters are
represented in Fig. 2. The main geometrical parameters are here summarized
in: (a) the width of web bw, (b) the height of beam h, (c) the shear-to-span ratio
a/d, and (d) the area of reinforcing steel As.
The same diagrams are again shown in Fig. 3, this time with respect to
both the main mechanical and concrete composition parameters: (a) the
geometric percentage of longitudinal reinforcement ρsw, (b) the max diameter
of aggregates Φa, (c) the uniaxial compressive strength of concrete flc, and (d)
the test value for axial tensile strength of concrete flct,test.
The number of bins m in the histograms is taken according to the
following empirical relationship (Haldar and Sankaran 2000):
(5)
where n is the number of samples. Because of its strict correlation with the
height of beam h, the effective depth ds is not shown in the mentioned scatter
plot; it was, however, considered important in the cluster analysis.
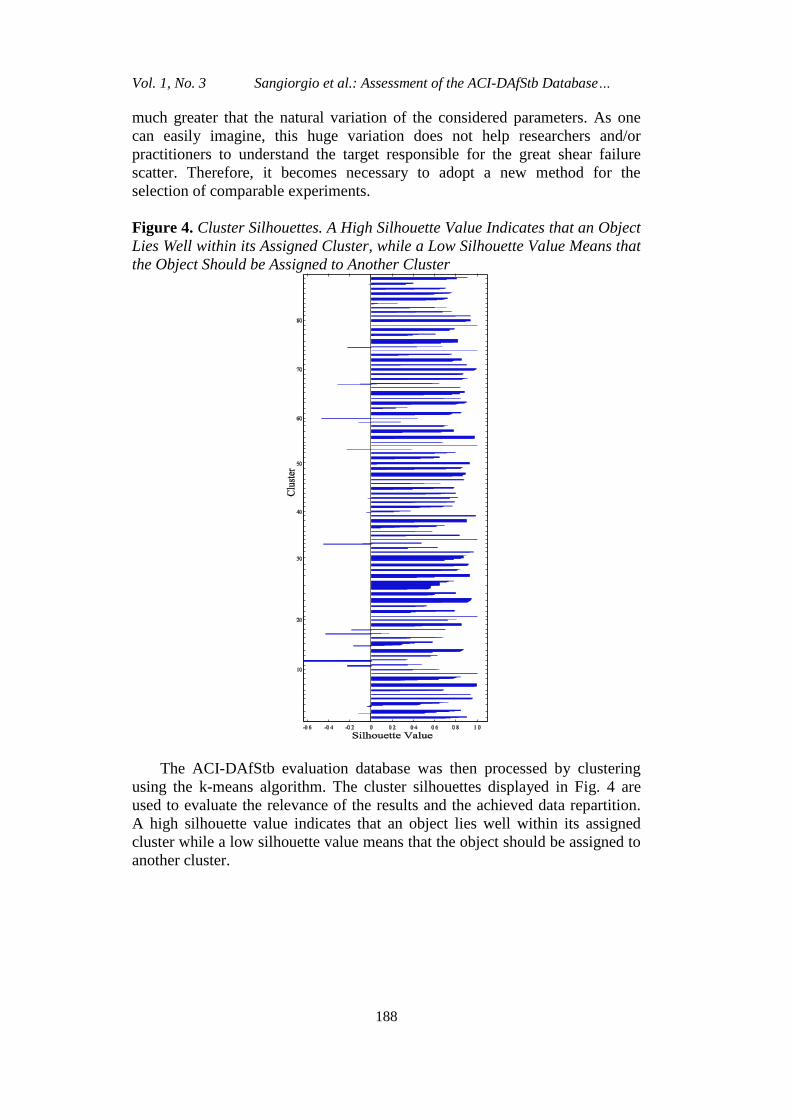
In order to visually display the clustering results, the cluster silhouettes for
the final number of 89 clusters are plotted in Fig. 4.
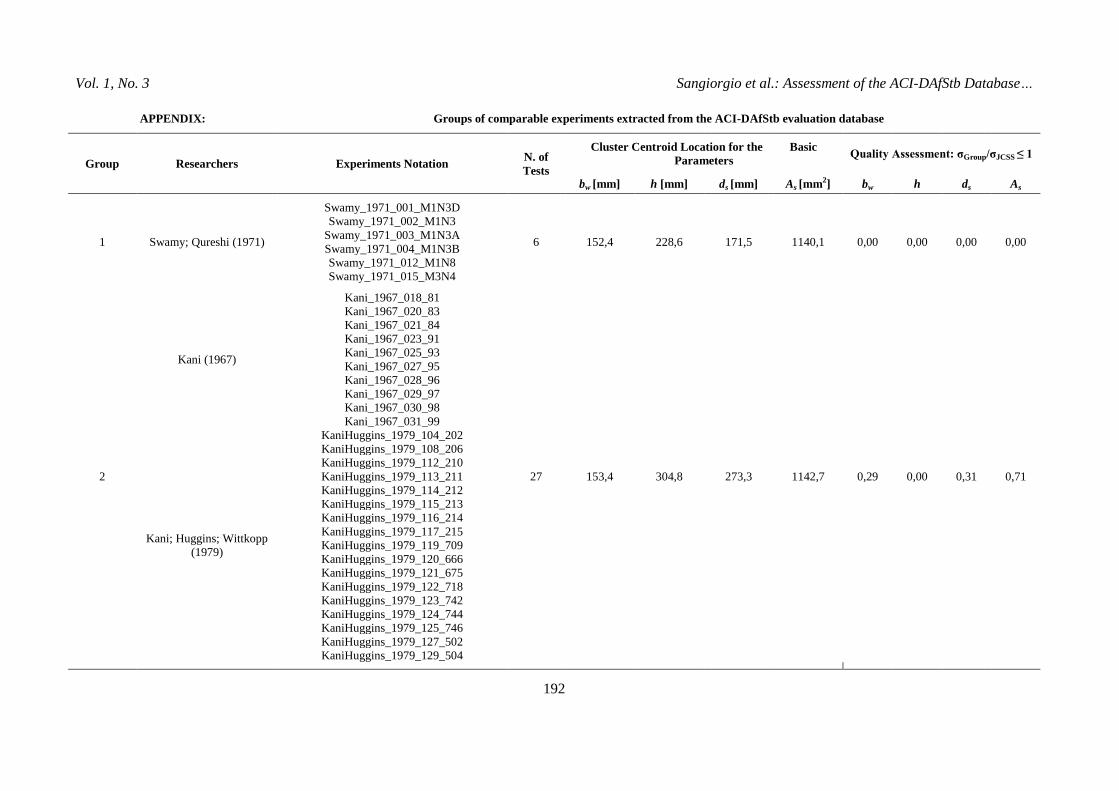
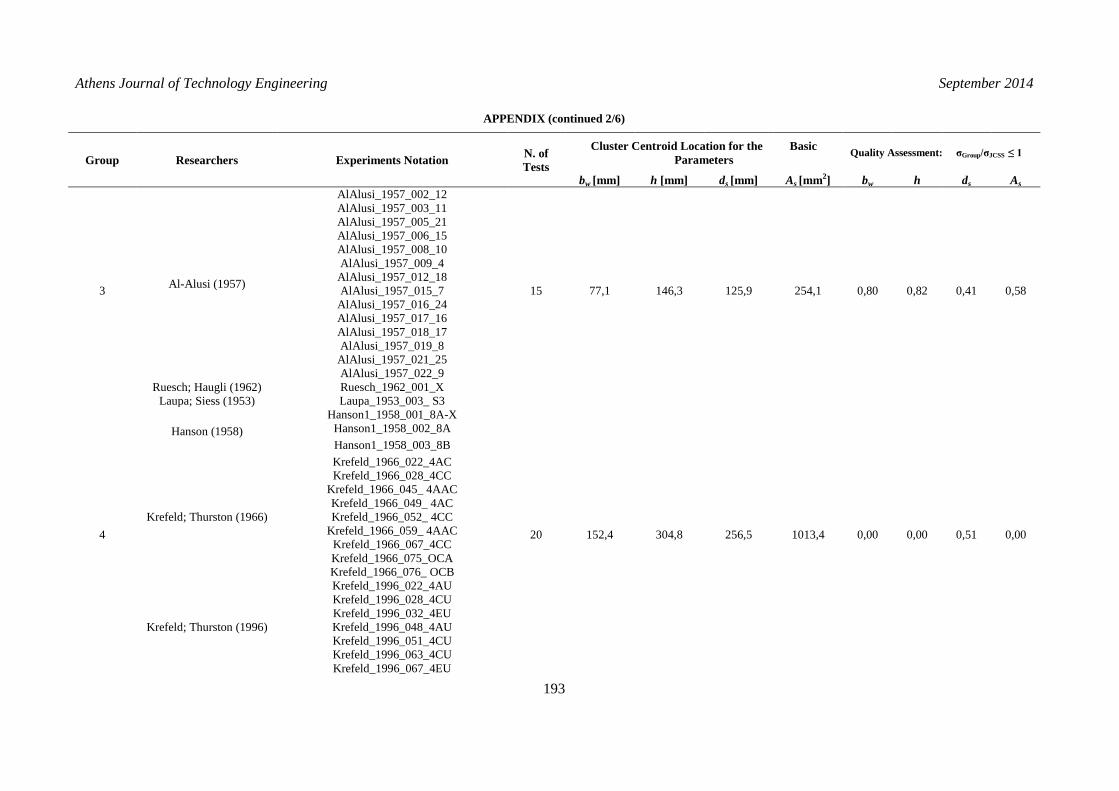
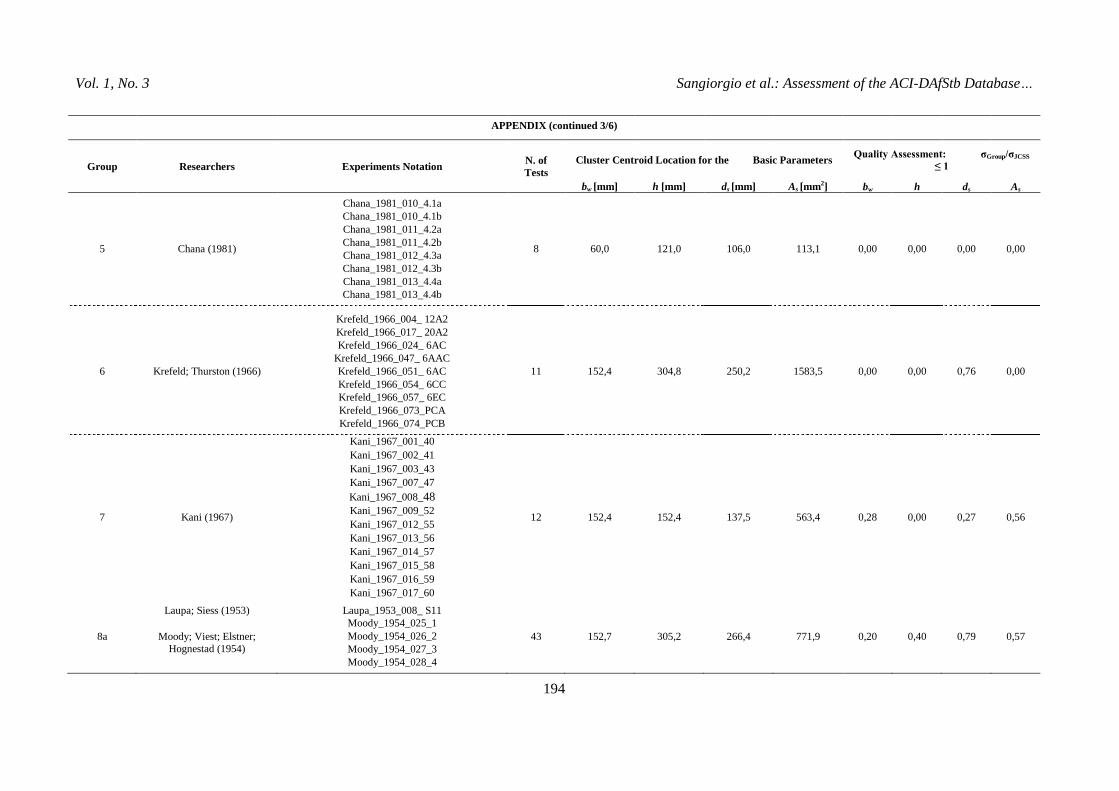
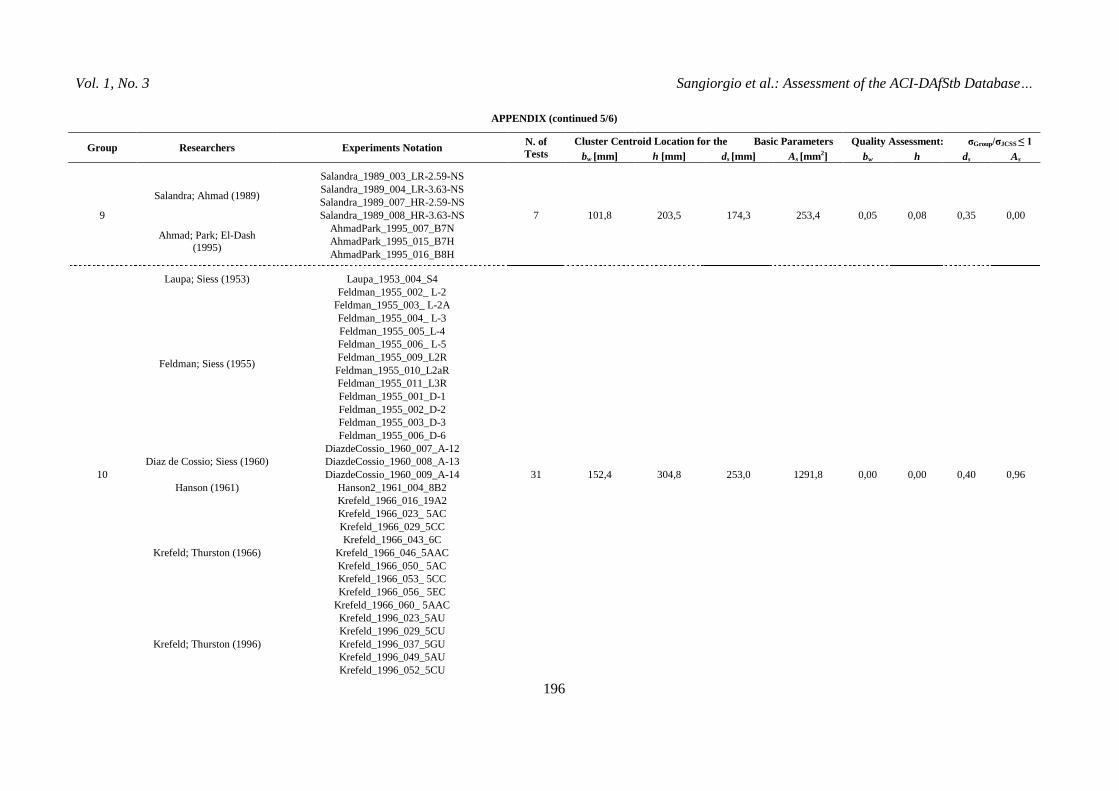
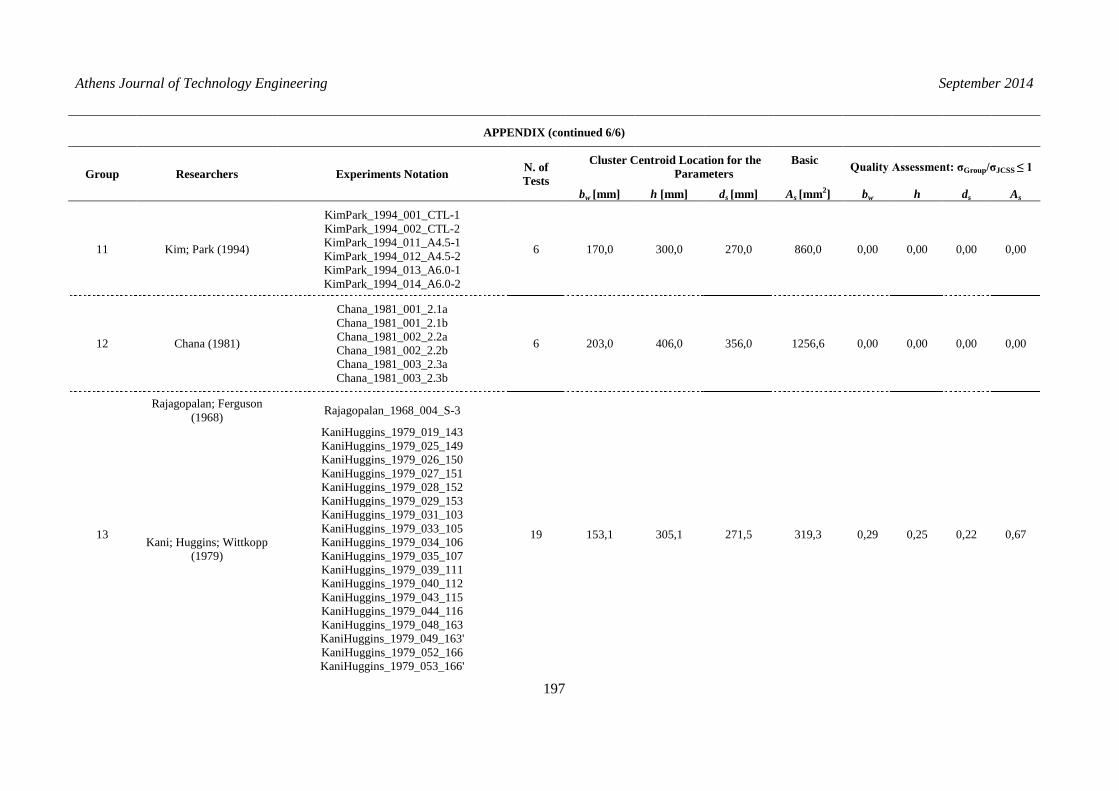
The groups’ descriptions, their statistical characteristics, and the quality
assessment criteria can be found in the Appendix. The Appendix consists of a
table in which, for each group of comparable experiments, are given: (1) the
names of the researchers who performed the tests and the reference year, (2)
the experiments notation according to the ACI-DAfStb evaluation database, (3)
the number of performed tests, (4) the mean values, or clusters centroid
location, of the cross-section geometrical parameters (bw, h, ds, and As), and (5)
the quality assessment procedure.
Vol. 1, No. 3 Sangiorgio et al.: Assessment of the ACI-DAfStb Database…
186
Figure 1. Method Flowchart
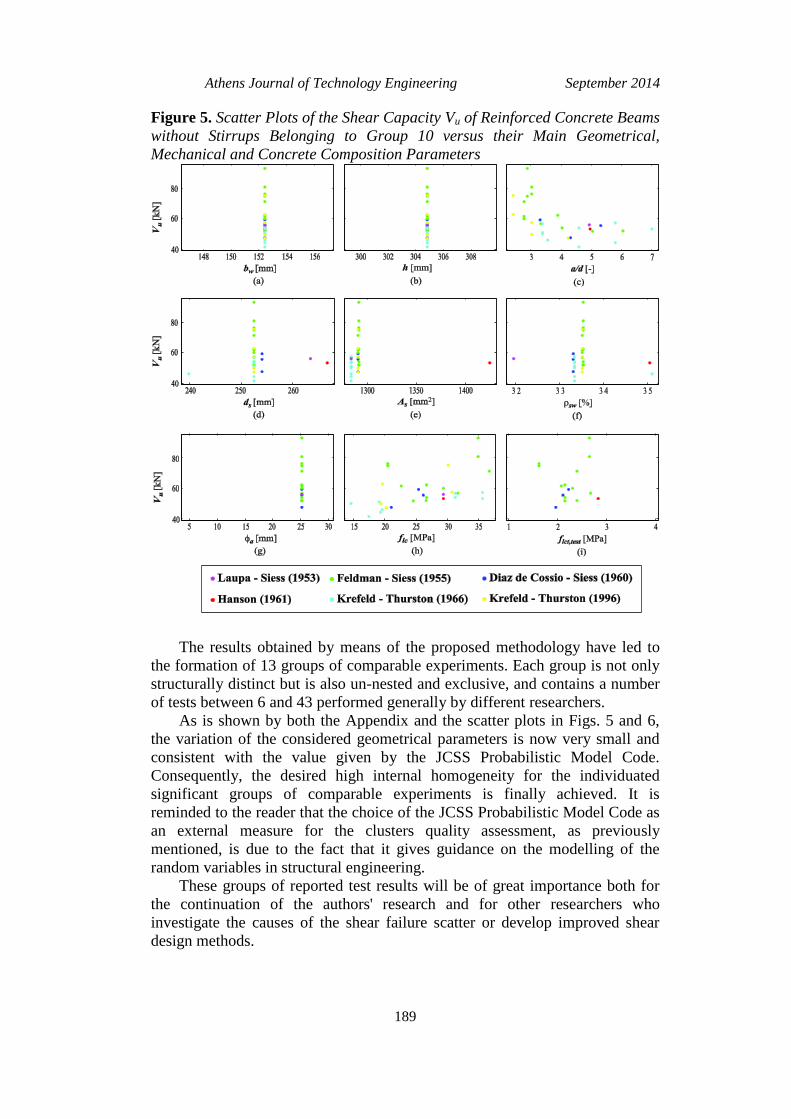
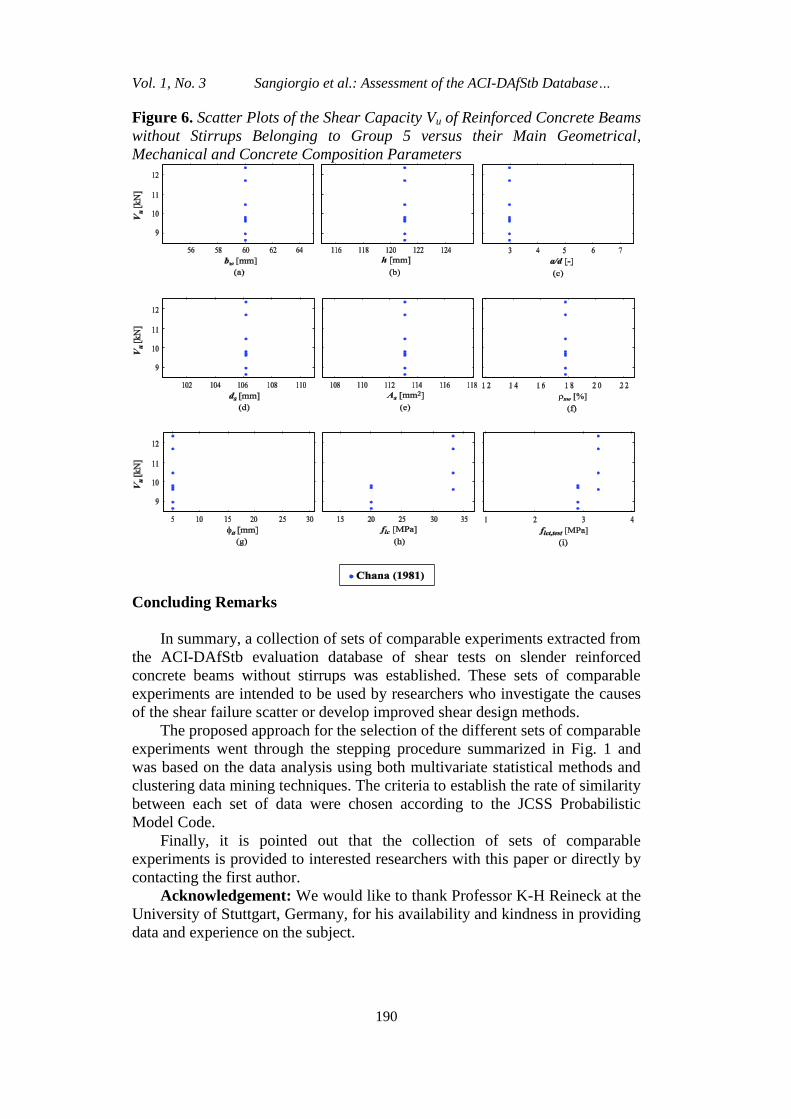
Figures. 5 and 6 show the scatter plots of the shear capacity Vu of
reinforced concrete beams without stirrups belonging, respectively, to group 10
(31 comparable experiments) and group 5 (8 comparable experiments) versus:
(a) the width of web bw, (b) the height of beam h, (c) the shear-to-span ratio
a/d, (d) the effective depth ds, (e) the area of reinforcing steel As, (f) the
geometric percentage of longitudinal reinforcement ρsw, (g) the max diameter
of aggregates Φa, (h) the uniaxial compressive strength of concrete flc, and (i)
the test value for axial tensile strength of concrete flct,test.
Athens Journal of Technology Engineering September 2014
187
Figure 2. Scatter Plots of the Shear Capacity Vu of Reinforced Concrete Beams
without Stirrups Reported in the ACD-DafStb Evaluation Database versus
their Main Geometrical Parameters
Figure 3. Scatter Plots of the Shear Capacity Vu of Reinforced Concrete
Beams without Stirrups Reported in the ACD-DafStb Evaluation Database
versus their Main Mechanical and Concrete Composition Parameters
Discussion
Information extracted from the shear tests database depicts a
heterogeneous collection of data that does not readily lend itself to an
investigation on the causes to the great shear failure scatter. The scatter plots in
Figs. 2 and 3 graphically display these heterogeneities. The first chart
highlights that the variation of the considered geometrical parameters is quite
large: both the width of the web bw and the height of the beam h are in the
range of from about 50 to about 3100 mm, the shear-to-span ratio a/d varies
between 2.4 and about 8, and the area of reinforcing steel As goes from a value
of approximately 56 to approximately 17650 mm2. The second graph, instead,
depicts the variance of both the main mechanical and concrete composition
parameters values: the geometric percentage of longitudinal reinforcement ρsw
varies between about 0.14 to about 6.64 % (going far beyond what is
recommended by many international standards such as EN 1992-1-1), the max
diameter of aggregates Φa is in the range of from 2.5 to 51 mm, the uniaxial
compressive strength of concrete flc goes from approximately 12 to 130 MPa,
and the test value for the axial tensile strength of concrete flct,test is limited to the
range of roughly 1.3 – 6.7 MPa. Both the diagrams show a randomness that is
Vol. 1, No. 3 Sangiorgio et al.: Assessment of the ACI-DAfStb Database…
188
much greater that the natural variation of the considered parameters. As one
can easily imagine, this huge variation does not help researchers and/or
practitioners to understand the target responsible for the great shear failure
scatter. Therefore, it becomes necessary to adopt a new method for the
selection of comparable experiments.
Figure 4. Cluster Silhouettes. A High Silhouette Value Indicates that an Object
Lies Well within its Assigned Cluster, while a Low Silhouette Value Means that
the Object Should be Assigned to Another Cluster
The ACI-DAfStb evaluation database was then processed by clustering
using the k-means algorithm. The cluster silhouettes displayed in Fig. 4 are
used to evaluate the relevance of the results and the achieved data repartition.
A high silhouette value indicates that an object lies well within its assigned
cluster while a low silhouette value means that the object should be assigned to
another cluster.
Athens Journal of Technology Engineering September 2014
189
Figure 5. Scatter Plots of the Shear Capacity Vu of Reinforced Concrete Beams
without Stirrups Belonging to Group 10 versus their Main Geometrical,
Mechanical and Concrete Composition Parameters
The results obtained by means of the proposed methodology have led to
the formation of 13 groups of comparable experiments. Each group is not only
structurally distinct but is also un-nested and exclusive, and contains a number
of tests between 6 and 43 performed generally by different researchers.
As is shown by both the Appendix and the scatter plots in Figs. 5 and 6,
the variation of the considered geometrical parameters is now very small and
consistent with the value given by the JCSS Probabilistic Model Code.
Consequently, the desired high internal homogeneity for the individuated
significant groups of comparable experiments is finally achieved. It is
reminded to the reader that the choice of the JCSS Probabilistic Model Code as
an external measure for the clusters quality assessment, as previously
mentioned, is due to the fact that it gives guidance on the modelling of the
random variables in structural engineering.
These groups of reported test results will be of great importance both for
the continuation of the authors' research and for other researchers who
investigate the causes of the shear failure scatter or develop improved shear
design methods.
Vol. 1, No. 3 Sangiorgio et al.: Assessment of the ACI-DAfStb Database…
190
Figure 6. Scatter Plots of the Shear Capacity Vu of Reinforced Concrete Beams
without Stirrups Belonging to Group 5 versus their Main Geometrical,
Mechanical and Concrete Composition Parameters
Concluding Remarks
In summary, a collection of sets of comparable experiments extracted from
the ACI-DAfStb evaluation database of shear tests on slender reinforced
concrete beams without stirrups was established. These sets of comparable
experiments are intended to be used by researchers who investigate the causes
of the shear failure scatter or develop improved shear design methods.
The proposed approach for the selection of the different sets of comparable
experiments went through the stepping procedure summarized in Fig. 1 and
was based on the data analysis using both multivariate statistical methods and
clustering data mining techniques. The criteria to establish the rate of similarity
between each set of data were chosen according to the JCSS Probabilistic
Model Code.
Finally, it is pointed out that the collection of sets of comparable
experiments is provided to interested researchers with this paper or directly by
contacting the first author.
Acknowledgement: We would like to thank Professor K-H Reineck at the
University of Stuttgart, Germany, for his availability and kindness in providing
data and experience on the subject.
Athens Journal of Technology Engineering September 2014
191
References
ACI-ASCE Commettee 326 1962. Shear and Diagonal Torsion. ACI Journal,
Proceedings, 59,1-3 (1962), 1-30, 277-344, and 352-396.
Anderberg, M.R. 1973. Cluster Analysis for Applications. Academic Press (1973).
ASCE-ACI Committee 445 on Shear and Torsion 1998. Recent Approaches to Shear
Design of Structural Concrete. Journal of Structural Engineering, ASCE, 124,12
(1998), 1375-1417.
Bazant, Z.P., Kazemi, M.T. 1991. Size Effect on Diagonal Shear Failure of Beams
without Stirrups. ACI Structural Journal 88,3 (1991), 268-276.
European Standard EN 1992-1-1 2004. Design of concrete structures. Part 1-1: general
rules and rules for buildings (dec-2004).
Haldar, A., Mahadevan, S. 2000. Probability, Reliability, and Statistical Methods in
Engineering Design. JOHN WILEY, New York (2000).
Jain, A.K., Dubes, R.C. 1988. Algorithms for Clustering Data. Prentice Hall (1988).
Joint Committee on Structural Safety 2000. Probabilistic Model Code. JCSS-
OSTL/DIA/VROU-10-11-2000.
Kaufman, L., Rousseeuw, P.J. 1990. Finding Groups in Data - An Introduction to
Cluster Analysis. Wiley (1990).
Kreffeld, W.J., Thurston, C.W. 1966. Studies of the Shear and Diagonal Tension
Strength of Simply Supported Reinforced Concrete Beams. ACI Journal 63,4
(1966), 451-476.
MacQueen, J.B. 1967. Some methods for classification and analysis of multivariate
observations. Proceedings of the 5th Berkeley Symposium on Mathematical
Statistics and Probability (1967), 281–297.
Mphonde, A.G., Frantz, G.C. 1984. Shear Tests of High- and Low-Strength Concrete
Beams without Stirrups. ACI Journal 81,4 (1984), 350-357.
Park, R., Paulay, T. 1975. Reinforced Concrete Structures. WILEY, New York (1975).
Rahal, K.N. 2000. Shear Strength of Reinforced Concrete: Part II – Beams Subjected
to Shear, Bending Moment, and Axial Load. ACI Structural Journal 97,2 (2000),
219-224.
Rebeiz, K.S. 1999. Shear Strength Prediction for Concrete Members. ASCE Journal of
Structural Engineering 125,3 (1999), 301-308.
Reinek, K-H., Bentz, E.C., Fitik, B., Kuchma, D.A., Bayrak, O. 2013. ACI-DAfStb
Database of Shear Tests on Slender Reinforced Concrete Beams without Stirrups.
ACI Structural Journal 110,5 (2013), 867-875.
Rousseeuw, P.J. 1987. Silhouttes: A graphical aid to the interpretation and validation
of a cluster analysis. J Comput Applied Math 20 (1987), 53–65.
Silfwerbrand, J. 1984. Samverkan mellan delvis nedbilad betongplatta och pågjutning.
Balkförsök (1984). Meddelande nr 142, institutionen för byggnadsstatik, KTH,
Stockholm, 72 s.
Tan, P.N., Steinbach, M., Kumar, V. 2006. Introduction to Data Mining. Addison-
Wesley (2006).
Vrouwenvelder, T. 2002. Reliability Based Code calibration - The use of the JCSS
Probabilistic Model Code. Joint Committee of Structural Safety, Workshop on
Code Calibration, March 21/22 (2002), Zurich.
Vol. 1, No. 3 Sangiorgio et al.: Assessment of the ACI-DAfStb Database…
192
APPENDIX: Groups of comparable experiments extracted from the ACI-DAfStb evaluation database
Group Researchers Experiments Notation N. of
Tests
Cluster Centroid Location for the Basic
Parameters Quality Assessment: σGroup/σJCSS ≤ 1
bw [mm] h [mm] ds [mm] As [mm2] bw h ds As
1 Swamy; Qureshi (1971)
Swamy_1971_001_M1N3D
6 152,4 228,6 171,5 1140,1 0,00 0,00 0,00 0,00
Swamy_1971_002_M1N3
Swamy_1971_003_M1N3A
Swamy_1971_004_M1N3B
Swamy_1971_012_M1N8
Swamy_1971_015_M3N4
2
Kani (1967)
Kani_1967_018_81
27 153,4 304,8 273,3 1142,7 0,29 0,00 0,31 0,71
Kani_1967_020_83
Kani_1967_021_84
Kani_1967_023_91
Kani_1967_025_93
Kani_1967_027_95
Kani_1967_028_96
Kani_1967_029_97
Kani_1967_030_98
Kani_1967_031_99
Kani; Huggins; Wittkopp
(1979)
KaniHuggins_1979_104_202
KaniHuggins_1979_108_206
KaniHuggins_1979_112_210
KaniHuggins_1979_113_211
KaniHuggins_1979_114_212
KaniHuggins_1979_115_213
KaniHuggins_1979_116_214
KaniHuggins_1979_117_215
KaniHuggins_1979_119_709
KaniHuggins_1979_120_666
KaniHuggins_1979_121_675
KaniHuggins_1979_122_718
KaniHuggins_1979_123_742
KaniHuggins_1979_124_744
KaniHuggins_1979_125_746
KaniHuggins_1979_127_502
KaniHuggins_1979_129_504
Athens Journal of Technology Engineering September 2014
193
APPENDIX (continued 2/6)
Group Researchers Experiments Notation N. of
Tests
Cluster Centroid Location for the Basic
Parameters Quality Assessment: σGroup/σJCSS ≤ 1
bw [mm] h [mm] ds [mm] As [mm2] bw h ds As
3 Al-Alusi (1957)
AlAlusi_1957_002_12
15 77,1 146,3 125,9 254,1 0,80 0,82 0,41 0,58
AlAlusi_1957_003_11
AlAlusi_1957_005_21
AlAlusi_1957_006_15
AlAlusi_1957_008_10
AlAlusi_1957_009_4
AlAlusi_1957_012_18
AlAlusi_1957_015_7
AlAlusi_1957_016_24
AlAlusi_1957_017_16
AlAlusi_1957_018_17
AlAlusi_1957_019_8
AlAlusi_1957_021_25
AlAlusi_1957_022_9
Ruesch; Haugli (1962) Ruesch_1962_001_X
4
Laupa; Siess (1953) Laupa_1953_003_ S3
20 152,4 304,8 256,5 1013,4 0,00 0,00 0,51 0,00
Hanson (1958)
Hanson1_1958_001_8A-X
Hanson1_1958_002_8A
Hanson1_1958_003_8B
Krefeld; Thurston (1966)
Krefeld_1966_022_4AC
Krefeld_1966_028_4CC
Krefeld_1966_045_ 4AAC
Krefeld_1966_049_ 4AC
Krefeld_1966_052_ 4CC
Krefeld_1966_059_ 4AAC
Krefeld_1966_067_4CC
Krefeld_1966_075_OCA
Krefeld_1966_076_ OCB
Krefeld; Thurston (1996)
Krefeld_1996_022_4AU
Krefeld_1996_028_4CU
Krefeld_1996_032_4EU
Krefeld_1996_048_4AU
Krefeld_1996_051_4CU
Krefeld_1996_063_4CU
Krefeld_1996_067_4EU
Vol. 1, No. 3 Sangiorgio et al.: Assessment of the ACI-DAfStb Database…
194
APPENDIX (continued 3/6)
Group Researchers Experiments Notation N. of
Tests
Cluster Centroid Location for the Basic Parameters Quality Assessment: σGroup/σJCSS
≤ 1
bw [mm] h [mm] ds [mm] As [mm2] bw h ds As
5 Chana (1981)
Chana_1981_010_4.1a
8 60,0 121,0 106,0 113,1 0,00 0,00 0,00 0,00
Chana_1981_010_4.1b
Chana_1981_011_4.2a
Chana_1981_011_4.2b
Chana_1981_012_4.3a
Chana_1981_012_4.3b
Chana_1981_013_4.4a
Chana_1981_013_4.4b
6 Krefeld; Thurston (1966)
Krefeld_1966_004_ 12A2
11 152,4 304,8 250,2 1583,5 0,00 0,00 0,76 0,00
Krefeld_1966_017_ 20A2
Krefeld_1966_024_ 6AC
Krefeld_1966_047_ 6AAC
Krefeld_1966_051_ 6AC
Krefeld_1966_054_ 6CC
Krefeld_1966_057_ 6EC
Krefeld_1966_073_PCA
Krefeld_1966_074_PCB
7 Kani (1967)
Kani_1967_001_40
12 152,4 152,4 137,5 563,4 0,28 0,00 0,27 0,56
Kani_1967_002_41
Kani_1967_003_43
Kani_1967_007_47
Kani_1967_008_48
Kani_1967_009_52
Kani_1967_012_55
Kani_1967_013_56
Kani_1967_014_57
Kani_1967_015_58
Kani_1967_016_59
Kani_1967_017_60
8a
Laupa; Siess (1953) Laupa_1953_008_ S11
43 152,7 305,2 266,4 771,9 0,20 0,40 0,79 0,57 Moody; Viest; Elstner;
Hognestad (1954)
Moody_1954_025_1
Moody_1954_026_2
Moody_1954_027_3
Moody_1954_028_4

Athens Journal of Technology Engineering September 2014
195
APPENDIX (continued 4/6)
Group Researchers Experiments Notation N. of Tests Cluster Centroid Location for the Basic Parameters Quality Assessment: σGroup/σJCSS ≤ 1
bw [mm] h [mm] ds [mm] As [mm2] bw h ds As
8b
Moody; Viest; Elstner;
Hognestad (1954)
Moody_1954_029_5
43 152,7 305,2 266,4 771,9 0,20 0,40 0,79 0,57
Moody_1954_030_6
Moody_1954_031_7
Moody_1954_033_9
Moody_1954_034_10
Moody_1954_035_11
Moody_1954_036_12
Moody_1954_037_13
Moody_1954_038_14
Moody_1954_039_15
Moody_1954_040_16
Krefeld; Thurston (1966)
Krefeld_1966_014_ 17A2
Krefeld_1966_021_ 3AC
Krefeld_1966_027_ 3CC
Krefeld_1966_035_ 3GC
Krefeld_1966_044_ 3AAC
Krefeld_1966_048_ 3AC
Krefeld_1966_062_3AC
Moayer; Regan (1974) Moayer2_1974_001_P41
Kani; Huggins; Wittkopp
(1979)
KaniHuggins_1979_058_121
KaniHuggins_1979_060_123
KaniHuggins_1979_061_124
KaniHuggins_1979_062_126
KaniHuggins_1979_067_131
KaniHuggins_1979_068_132
KaniHuggins_1979_076_27
KaniHuggins_1979_077_28
KaniHuggins_1979_078_29
KaniHuggins_1979_079_30
KaniHuggins_1979_087_182
KaniHuggins_1979_090_186
KaniHuggins_1979_095_193
KaniHuggins_1979_096_194
KaniHuggins_1979_097_195
Krefeld; Thurston (1996)
Krefeld_1996_027_3CU
Krefeld_1996_031_3EU
Krefeld_1996_035_3GU
Krefeld_1996_039_3JU
Vol. 1, No. 3 Sangiorgio et al.: Assessment of the ACI-DAfStb Database…
196
APPENDIX (continued 5/6)
Group Researchers Experiments Notation
N. of
Tests
Cluster Centroid Location for the Basic Parameters Quality Assessment: σGroup/σJCSS ≤ 1
bw [mm] h [mm] ds [mm] As [mm2] bw h ds As
9
Salandra; Ahmad (1989)
Salandra_1989_003_LR-2.59-NS
7 101,8 203,5 174,3 253,4 0,05 0,08 0,35 0,00
Salandra_1989_004_LR-3.63-NS
Salandra_1989_007_HR-2.59-NS
Salandra_1989_008_HR-3.63-NS
Ahmad; Park; El-Dash
(1995)
AhmadPark_1995_007_B7N
AhmadPark_1995_015_B7H
AhmadPark_1995_016_B8H
10
Laupa; Siess (1953) Laupa_1953_004_S4
31 152,4 304,8 253,0 1291,8 0,00 0,00 0,40 0,96
Feldman; Siess (1955)
Feldman_1955_002_ L-2
Feldman_1955_003_ L-2A
Feldman_1955_004_ L-3
Feldman_1955_005_L-4
Feldman_1955_006_ L-5
Feldman_1955_009_L2R
Feldman_1955_010_L2aR
Feldman_1955_011_L3R
Feldman_1955_001_D-1
Feldman_1955_002_D-2
Feldman_1955_003_D-3
Feldman_1955_006_D-6
Diaz de Cossio; Siess (1960)
DiazdeCossio_1960_007_A-12
DiazdeCossio_1960_008_A-13
DiazdeCossio_1960_009_A-14
Hanson (1961) Hanson2_1961_004_8B2
Krefeld; Thurston (1966)
Krefeld_1966_016_19A2
Krefeld_1966_023_ 5AC
Krefeld_1966_029_5CC
Krefeld_1966_043_6C
Krefeld_1966_046_5AAC
Krefeld_1966_050_ 5AC
Krefeld_1966_053_ 5CC
Krefeld_1966_056_ 5EC
Krefeld_1966_060_ 5AAC
Krefeld; Thurston (1996)
Krefeld_1996_023_5AU
Krefeld_1996_029_5CU
Krefeld_1996_037_5GU
Krefeld_1996_049_5AU
Krefeld_1996_052_5CU
Athens Journal of Technology Engineering September 2014
197
APPENDIX (continued 6/6)
Group Researchers Experiments Notation N. of
Tests
Cluster Centroid Location for the Basic
Parameters Quality Assessment: σGroup/σJCSS ≤ 1
bw [mm] h [mm] ds [mm] As [mm2] bw h ds As
11 Kim; Park (1994)
KimPark_1994_001_CTL-1
6 170,0 300,0 270,0 860,0 0,00 0,00 0,00 0,00
KimPark_1994_002_CTL-2
KimPark_1994_011_A4.5-1
KimPark_1994_012_A4.5-2
KimPark_1994_013_A6.0-1
KimPark_1994_014_A6.0-2
12 Chana (1981)
Chana_1981_001_2.1a
6 203,0 406,0 356,0 1256,6 0,00 0,00 0,00 0,00
Chana_1981_001_2.1b
Chana_1981_002_2.2a
Chana_1981_002_2.2b
Chana_1981_003_2.3a
Chana_1981_003_2.3b
13
Rajagopalan; Ferguson
(1968) Rajagopalan_1968_004_S-3
19 153,1 305,1 271,5 319,3 0,29 0,25 0,22 0,67 Kani; Huggins; Wittkopp
(1979)
KaniHuggins_1979_019_143
KaniHuggins_1979_025_149
KaniHuggins_1979_026_150
KaniHuggins_1979_027_151
KaniHuggins_1979_028_152
KaniHuggins_1979_029_153
KaniHuggins_1979_031_103
KaniHuggins_1979_033_105
KaniHuggins_1979_034_106
KaniHuggins_1979_035_107
KaniHuggins_1979_039_111
KaniHuggins_1979_040_112
KaniHuggins_1979_043_115
KaniHuggins_1979_044_116
KaniHuggins_1979_048_163
KaniHuggins_1979_049_163'
KaniHuggins_1979_052_166
KaniHuggins_1979_053_166'

Vol. 1, No. 3 Sangiorgio et al.: Assessment of the ACI-DAfStb Database…
198
Related Documents