Biologia 64/6: 1196—1205, 2009 Section Zoology DOI: 10.2478/s11756-009-0201-9 Assessment of running waters (Slovakia) using benthic macroinvertebrates – derivation of ecological quality classes with respect to altitudinal gradients Ferdinand Šporka 1 , Zuzana Pastuchová 1 , Ladislav Hamerlík 1 , Marcela Dobiašová 2 & Pavel Beracko 3 1 Institute of Zoology, Dept. of Hydrobiology, Slovak Academy of Sciences, Dúbravská cesta 9, SK-84506 Bratislava, Slovakia; e-mail: [email protected] 2 Slovak Hydrometeorological Institute, Jeséniova 17, SK-83315 Bratislava, Slovakia 3 Department of Ecology, Comenius University, Faculty of Natural Sciences, Mlynská dolina B2, SK-84215 Bratislava, Slovakia Abstract: A method is presented for defining the five classes of ecological quality based on a multimetric index (MMI) of macroinvertebrates, as required for implementation of the Water Framework Directive for small (catchment area 10–100 km 2 ), medium (101–1000 km 2 ) and large (> 1000 km 2 ) streams. Our method (expert judgment) allows us to overcome an absence of reference sites for some stream types. The key was selection of suitable metrics for all stream types. The whole procedure was divided into two parts. 1. Small streams with reference sites: suitable metrics were selected according to their ability to distinguish reference and monitoring sites – SI, Oligo [%], BMWP, RhiTI, Rheoindex, IBCR, % Aka+Lit+Psa [%] and EPT. Here the high-good boundary value was set as the 25 th (for metrics decreasing with increasing pollution) or 75 th percentile (for metrics increasing with increasing pollution). 2. Medium and large streams which lack reference sites: here the idea was applied that some metrics, the values of which change along an altitudinal gradient, also react to anthropogenic stress – SI, Oligo [%], BMWP, [%] metarhithral, RhiTI, Aka+Lit+Psa [%] and EPT for both medium and large streams with, in addition, IBCR and NFam for medium streams. This assumption was supported by regression analysis of altitude and metrics from small streams. Not all the metrics were related to altitude but metrics with a good ability to separate reference and monitoring sites did show a significant relationship to altitude. The boundary between high and good class for medium and large streams was set as the 95 th or 5 th percentiles. Key words: ecological quality ratio; reference status; streams; benthic invertebrates; multimetric index; Slovakia Abbreviations: SI – Saprobic index (Zelinka & Marvan 1961), Oligo [%] – proportion of individuals with a preference for oligo-saprobic conditions (scored taxa = 100%), BMWP – Biological Monitoring Working Party, RhiTI – Rhithron Type Index, IBCR – Index of Biocoenotic Region, Aka+Lit+Psa [%] – proportion of individuals with a preference for gravel, littoral and sand (scored taxa = 100%), EPT – number of Ephemeroptera, Plecoptera and Trichoptera taxa, [%] epirithral – proportion of individuals with preference for upper trout region, [%] metarhithral – proportion of individuals with a preference for the lower-trout region) (scored taxa = 100%), NFam – number of families, Rheoindex – Banning, with abundance classes. Term “scored taxa = 100%” means that only taxa for which autecological information was available were included in the metric calculation. For detailed information about individual metrics see AQEM consortium (2002). Introduction A demand to integrate various assessment systems into one common system for all Member States resulted in the EU’s Water Framework Directive – WFD (Eu- ropean Commission 2000). The EU WFD (Directive 2000/60/EC – Establishing a Framework for Commu- nity Action in the Field of Water Policy) established a framework for the protection of all kinds of water bodies. The idea of the “Reference Condition” (Hughes 1995), as a unifying concept, was embraced in order to harmonize the results obtained from different assess- ment protocols used in different countries (Furse et al. 2006). To meet the new requirements of the WFD Mem- ber States have had to adapt their national assessment programmes or develop completely new ones. For this reason various national and international projects were started in order to develop and adapt the assessment systems. Two international EU projects that focused on macrobenthic fauna as one of the biotic indicators were AQEM (Hering et al. 2004) and STAR (Furse et al. 2006). Their aims were to support the implementation of the EU WFD, to judge the existing assessment sys- tems and to derive a common system which would meet all the criteria of the WFD. For assessment purposes a multimetric approach frequently used in the USA (Bar- bour et al. 1992,) was also adopted in the AQEM/STAR c 2009 Institute of Zoology, Slovak Academy of Sciences

Welcome message from author
This document is posted to help you gain knowledge. Please leave a comment to let me know what you think about it! Share it to your friends and learn new things together.
Transcript

Biologia 64/6: 1196—1205, 2009Section ZoologyDOI: 10.2478/s11756-009-0201-9
Assessment of running waters (Slovakia) using benthicmacroinvertebrates – derivation of ecological quality classeswith respect to altitudinal gradients
Ferdinand Šporka1, Zuzana Pastuchová1, Ladislav Hamerlík1, Marcela Dobiašová2
& Pavel Beracko3
1Institute of Zoology, Dept. of Hydrobiology, Slovak Academy of Sciences, Dúbravská cesta 9, SK-84506 Bratislava, Slovakia;e-mail: [email protected] Hydrometeorological Institute, Jeséniova 17, SK-83315 Bratislava, Slovakia3Department of Ecology, Comenius University, Faculty of Natural Sciences, Mlynská dolina B2, SK-84215 Bratislava,Slovakia
Abstract: A method is presented for defining the five classes of ecological quality based on a multimetric index (MMI)of macroinvertebrates, as required for implementation of the Water Framework Directive for small (catchment area 10–100km2), medium (101–1000 km2) and large (> 1000 km2) streams. Our method (expert judgment) allows us to overcome anabsence of reference sites for some stream types. The key was selection of suitable metrics for all stream types. The wholeprocedure was divided into two parts. 1. Small streams with reference sites: suitable metrics were selected according to theirability to distinguish reference and monitoring sites – SI, Oligo [%], BMWP, RhiTI, Rheoindex, IBCR, % Aka+Lit+Psa [%]and EPT. Here the high-good boundary value was set as the 25th (for metrics decreasing with increasing pollution) or 75th
percentile (for metrics increasing with increasing pollution). 2. Medium and large streams which lack reference sites: herethe idea was applied that some metrics, the values of which change along an altitudinal gradient, also react to anthropogenicstress – SI, Oligo [%], BMWP, [%] metarhithral, RhiTI, Aka+Lit+Psa [%] and EPT for both medium and large streamswith, in addition, IBCR and NFam for medium streams. This assumption was supported by regression analysis of altitudeand metrics from small streams. Not all the metrics were related to altitude but metrics with a good ability to separatereference and monitoring sites did show a significant relationship to altitude. The boundary between high and good classfor medium and large streams was set as the 95th or 5th percentiles.
Key words: ecological quality ratio; reference status; streams; benthic invertebrates; multimetric index; Slovakia
Abbreviations: SI – Saprobic index (Zelinka & Marvan 1961), Oligo [%] – proportion of individuals with a preferencefor oligo-saprobic conditions (scored taxa = 100%), BMWP – Biological Monitoring Working Party, RhiTI – RhithronType Index, IBCR – Index of Biocoenotic Region, Aka+Lit+Psa [%] – proportion of individuals with a preference forgravel, littoral and sand (scored taxa = 100%), EPT – number of Ephemeroptera, Plecoptera and Trichoptera taxa, [%]epirithral – proportion of individuals with preference for upper trout region, [%] metarhithral – proportion of individualswith a preference for the lower-trout region) (scored taxa = 100%), NFam – number of families, Rheoindex – Banning, withabundance classes. Term “scored taxa = 100%” means that only taxa for which autecological information was availablewere included in the metric calculation. For detailed information about individual metrics see AQEM consortium (2002).
Introduction
A demand to integrate various assessment systems intoone common system for all Member States resultedin the EU’s Water Framework Directive – WFD (Eu-ropean Commission 2000). The EU WFD (Directive2000/60/EC – Establishing a Framework for Commu-nity Action in the Field of Water Policy) establisheda framework for the protection of all kinds of waterbodies. The idea of the “Reference Condition” (Hughes1995), as a unifying concept, was embraced in orderto harmonize the results obtained from different assess-ment protocols used in different countries (Furse et al.2006).
To meet the new requirements of the WFD Mem-ber States have had to adapt their national assessmentprogrammes or develop completely new ones. For thisreason various national and international projects werestarted in order to develop and adapt the assessmentsystems. Two international EU projects that focusedon macrobenthic fauna as one of the biotic indicatorswere AQEM (Hering et al. 2004) and STAR (Furse et al.2006). Their aims were to support the implementationof the EU WFD, to judge the existing assessment sys-tems and to derive a common system which would meetall the criteria of the WFD. For assessment purposes amultimetric approach frequently used in the USA (Bar-bour et al. 1992,) was also adopted in the AQEM/STAR
c©2009 Institute of Zoology, Slovak Academy of Sciences
Assessment of running waters using benthic macroinvertebrates 1197
Table 1. Summary of the number of samples from reference and monitoring sites.
Catchment size Altitude (m a.s.l.) Reference sites Monitoring sites
up to 200 m 4 21
Small streams200–500 m 55 22500–800 m 42 13above 800 m 15 0
up to 200 m 6 68Medium streams 200–500 m 2 66
500–800 m 1 16
up to 200 m 0 78Large streams 200–500 m 0 51
500–800 m 0 7
project (Hering et al. 2004, 2006; Ofenbock et al. 2004).In the Slovak Republic the preferred system for wa-
ter quality (saprobity) assessment was that proposed byZelinka & Marvan (1961) but this type of assessmentdid not take into consideration natural changes of biotaalong longitudinal gradients or differences caused bystream size and geology. With implementation of theWFD a need emerged to establish stream typology anddevelopment of an assessment system based on a mul-timetric index.Stream typology (abiotic descriptors) reflects the
natural variability of water ecosystem characteristicsthat may be expressed by the abundance and diver-sity of invertebrate communities. Furthermore, accord-ing to the findings of Lang & Reymond (1993), basedon data from Swiss rivers, the diversity of invertebratesincreases with altitude because the human populationand the impacts resulting from its activities decreaseupstream. The same results were found by Statzner& Sperling (1993). But, apart from anthropogenic im-pacts, the water biota also changes naturally alongstreams. The river continuum concept (Vannote et al.1980) perceives river systems as continuous resourcegradients of physical variables and shows patterns ofloading and transport, as well as utilization and storageof organic matter, along rivers. The influence of altitudeon zoobenthos communities has already been described,e.g., in the works of Thienemann (1912, 1925), Illies &Botosaneanu (1963), Hynes (1970), Hawkes (1975) andWard (1986), as has the major role played by temper-ature in determining the distribution and abundanceof zoobenthos along altitude gradients (Hynes at al.1970; Ward at al. 1982; Minshall et al. 1985; Ward 1985,1986).The intensity of anthropogenic activities leads to
different degrees of degradation of the water environ-ment which is, according to the WFD, described by oneof the five ecological quality classes ranging from highstatus to bad status. Setting threshold values for these5 ecological classes is based on comparisons of referenceand monitoring sites.The aim of this study was to propose a procedure
that develops a multimetric assessment system for Slo-vak streams, based on macroinvertebrates, which in-cludes definition of the threshold values for individ-
ual metrics; as well as a proposal for a multimetricindex and means of setting an Ecological Quality Ra-tio (EQR). Assessment of large streams, mainly at lowaltitudes, still remains a problem due to the lack ofreference sites. According WFD, in such cases expertjudgement should be used. In addition to assessmentof streams where reference conditions do exist, we triedto solve the problem of assessment of larger streams interms of selecting suitable metrics.
Material and methods
Data processingData were analysed from the Slovak National Monitor-ing Program of surface water quality, consisting of refer-ence and monitoring sampling sites, supplied by the SlovakHydrometeorological Institute (SHMI). Macroinvertebratesfor data analyses were collected in the spring and autumnseasons, in the years 2002–2004. The sampling method wasthat used in the AQEM/STAR projects (Hering et al. 2004;Furse et al. 2006).
Altogether, 125 samples from reference sites and 342samples from monitoring sites were analysed (Table 1).Monitoring sites included the whole range of environmen-tal stressors, from close to good to bad water quality sites.The sampling sites designated as monitoring sites that wereanalysed belong to the national surface waters quality mon-itoring in Slovakia. One of the main monitoring objectivesis the detection of anthropogenic activities and the quan-tification of their impacts on the surface water. This is whythe sampling sites were located, from a water managementpoint of view, on the important rivers (mainly medium andlarge streams), in the mouths of the rivers, below reservoirs,in tributaries and close to relevant industrial and diffusesources of pollution. The placement of the monitoring sitesis along the rivers so that they can give a picture of theconditions in the main stream and hence, indirectly, in trib-utaries – the catchment. The reference localities analysedare located on small rivers, taking into account criteria oftheir hydromorphological characteristics, land cover, waterquality, fisheries, etc.
Stream typologyThe typology of streams was adopted in the Slovak Repub-lic in April 2007. It was approved by the Ministry of theEnvironment and will be officially published in the RiverBasin Management Plan in the year 2009. The official ty-pology takes into account only three descriptors: ecoregions

1198 F. Šporka et al.
(10 – Carpathians and 12 – Hungarian lowland), the catch-ment size (small streams with area < 100 km2, mediumwith area 101–1000 km2 and large with area > 1000 km2)and altitude (< 200 m, 201–500 m, 501–800 m, > 800 m).The main problem that had to be solved was the low num-ber of reference sites on medium, and no reference sites onlarge streams. This results from the fact that such streamsflow through country with strong anthropogenic pressuresand small streams are usually situated in relatively less dis-turbed mountain and alpine areas. This is also the case inSlovakia, a mountainous country where agriculture and in-dustry is concentrated in sub-mountain and lowland areas.
For the development of the multimetric assessment sys-tem for macroinvertebrates only two abiotic typology de-scriptors have been taken into account – catchment size andaltitude, which led to 10 stream types (Table 1). Due to in-sufficient data from the reference sites it was not possible totake into consideration different types of geology and influ-ences of two ecoregions on the macroinvertebrates.
All the sites sampled were grouped into these ninestream types and in all procedures the stream types weretreated separately.
Calculation and selection of suitable metricsQuantitative data on benthic invertebrates from the refer-ence and monitoring sites were processed according to themethods of AQEM (AQEM consortium 2002) and using theprogram ASTERICS (AQEM/STAR Ecological River Clas-sification System; Furse et al. 2006). More than 200 metrics,belonging to several groups (sensitivity/tolerance metrics,composition/abundance metrics, richness/diversity metrics,and functional metrics), were calculated. Some metrics hadto be excluded because they contained too many zero val-ues or showed a very narrow range of values. Other metrics(such as IBE or BBI) were excluded because they were con-sidered not to be suitable for Slovak streams, having beendeveloped for a specific country.
When considering the small streams, an environmentalstressor gradient was represented by sites covering the rangefrom high quality to bad sites. These sites were grouped intotwo categories – unstressed (reference sites) and stressed(monitoring sites). Box-and-whisker plots were then usedto visualize this gradient. An ideal metric for our purposesshould thus be responsive to a stressor, have a low natu-ral variability, provide a response that can be distinguishedfrom natural variation and be interpretable (Hering et al.2006).
As candidate metrics for small streams those whichshowed statistically significant differences (t-test for datawith normal distribution, Mann-Whitney test for data withnon normal distribution, P < 0.05) between reference andmonitoring sites were chosen. We used the generalised lin-ear model (GLM, McCullagh & Nelder 1989) combined withPoisson distribution for characterising the change of metricsselected for small streams along an altitude gradient in ref-erence and monitoring localities. Using the type III sums ofsquares in analyses of covariance we tested the marginal sig-nificance of each factor – altitude gradient and ref./monit.locality. We modelled the response curves for both referenceand monitoring sites separately. To select the complexity ofthe fitted regression models, stepwise selection was speci-fied to be done using the F statistics based test, and thesignificance threshold value was set to P < 0.05. The re-sponse curves were modelled using the STATISTICA soft-ware package (StatSoft 2004)
For medium streams there were only a few referencesites, for large streams none (Table 1). When deciding which
metrics are suitable for characterization of medium andlarge streams the influence of altitude on macroinvertebratecommunities along the river continuum was taken into con-sideration. As candidate metrics, those that showed statis-tically significant dependence on altitude were chosen. Thispremise was tested on small streams, where both referenceand monitoring sites were available. This relationship be-tween altitude and metrics also enabled verification of de-rived threshold values between high-good classes.
The set of candidate metrics was further reduced byexcluding metrics which reacted in the same way to distur-bance of the aquatic environment and were thus redundant.Also an ability to detect different types of stressor (organicpollution, morphological and overall degradation) was takeninto consideration. Classification of the metrics with regardto the type of stressor they indicate was carried out as de-fined by Hering et al. (2004).
Setting the high – good threshold values of ecological qualityclassesThe high-good threshold value of an individual metric repre-sents the key value that separates a reference site from oth-ers. For those stream types for which sufficient data fromreference localities were available this value was set usingthe 25th or 75th percentile from the set of metric values fromreference sites. The 25th percentile was used for those met-rics whose values decrease with increasing pollution (e.g.,the BMWP score), while the 75th percentile was used forthose metrics whose values increase with increasing pollu-tion (e.g., the Saprobic index). In cases of absence or a lim-ited amount of data from reference streams the 5th or 95th
percentile of metric values from monitoring site values wereused.
Setting the threshold values of five ecological quality classesusing the Ecological Quality Ratio (EQR) and calculationof multimetric index (MMI)Since the individual metrics are expressed on differentscales, the standardizing methodological guidelines for im-plementation of the WFD, as well as the prepared EU stan-dard, introduced the so-called EQR, which enables trans-formation of metric values into a unified scale (0–1). Suchtransformation of the metric values not only simplifies as-sessment of the stream’s ecological status, and comparisonof results obtained by different metrics, but also enables oneto integrate different metrics into a multimetric index.
First, boundaries of the five quality classes were set.A principle was chosen, which allowed setting the unifiedboundaries between values of all individual metrics in thesame way. The boundary values of the metrics lay in thefollowing range of EQR:high ≥ 0.8good ≥ 0.6 < 0.8moderate ≥ 0.4 < 0.6poor ≥ 0.2 < 0.4bad < 0.2
According to the prepared CEN standard for transformationof individual metric values to the EQR values the followingFormula 1 was used:
EQR =mr − wv
rv − wv
mr – metric result; wv – worst value; rv – referencevalue.A reference value corresponds to the best value of that
metric under the reference conditions within the streamtype. The worst value corresponds to the metric value under

Assessment of running waters using benthic macroinvertebrates 1199
reference sites monitoring sites
SI
1.0
1.2
1.4
1.6
1.8
2.0
2.2
reference sites monitoring sites
Aka
+Lit+
Psa
[%]
30
40
50
60
70
80
90
100
reference sites monitoring sites
Olig
o [%
]
20
25
30
35
40
45
50
55
Fig. 1. A comparison of the three metrics SI, Aka+Lit+Psa, and oligo between the reference and the monitoring sites of small riverswithin 500 and 800 m a.s.l. The vertical lines are the threshold values, for SI = 1.5 (75% percentile of the reference sites-rs), forAka+Lit+Psa = 72% (25% percentile of rs), for Oligo = 38% (25% percentile of rs).
Table 2. Results of analyses of covariance in GLM. Decomposition of the model sum of squares into components for each factor(ref./monit. locality, altitude).
Ref./monit. locality Altitude (m a.s.l.)
Sum of squares F-Ratio P-value Sum of Squares F-Ratio P-value
SI 8.18 65.66 P < 0.05 6.28 50.38 P < 0.05Oligo [%] 7152.11 102.36 P < 0.05 1934.52 23.39 P < 0.05BMWP 147992.6 129.45 P < 0.05 7251.8 6.34 P < 0.05RhiTI 759.44 108.32 P < 0.05 370.98 52.91 P < 0.05IBCR 29.51 59.33 P < 0.05 35.33 71.02 P < 0.05Rheoindex 2.46 69.63 P < 0.05 1,89 53.43 P < 0.05Aka+Lit+Psa [%] 15886.43 72.04 P < 0.05 5883.47 26.67 P < 0.05EPT 3966.93 92.24 P < 0.05 1008.61 23.45 P < 0.05
Explanations: Small P-values indicate significant effects.
the worst attainable conditions within the stream type. Inthe case of metrics decreasing with pollution the referencevalue is the upper limit of the metric value range; the worstvalue is thus the lower limit of the metric value range; ina case of metrics increasing with pollution it is vice-versa.Because reference sites were not available for medium andlarge streams, it was not possible to derive reference valuesdirectly from the data set, but since EQR 0.8 correspondsto the 25th or 75th percentile, it was possible to completevalues for EQR and mr using Formula 2:
rv =(mr − wv) + 0.8wv
0.8
mr – metric result, which is 25th or 75th percentile; wv –worst value derived from the monitoring data.
The multimetric index was calculated, in accordancewith the prepared CEN/TC 230 N 0504, according to thegeneral approach – the multimetric index is set as a sum ofall EQR of metrics and its final value is the average valueof all metrics. The final value of EQR gives the class ofecological quality of the stream assessed. Performance of theMMI was verified on reference sites of small streams, wheretheir ecological status was known from pre-classification.
Results
Selection of candidate metricsSmall streams. Visualization of the metrics of the ref-erence and monitoring sites by box-and-whisker plotsshowed different responses of the various metrics toincreasing anthropogenic pollution (Fig. 1). Accordingto the ability of individual metrics to distinguish be-tween the reference and monitoring sites (t-test/Mann-Whitney test), and after removing redundant metrics,
the following set of metrics was selected: SI, Oligo [%],BMWP, RhiTI, Rheoindex, IBCR, Aka+Lit+Psa [%]and EPT. These metrics covered taxonomic composi-tion, ratio of sensitive/insensitive taxa and diversity.Abundance metrics showed little ability to distinguishbetween reference and monitoring sites and were there-fore not included in the multimetric index.In the generalised linear model (GLM) the type III
sums of squares have shown that two tested factors, al-titude gradient and ref./monit. locality, have highly sig-nificant effects on the selected metrics (Table 2). All 8metrics responses to altitude, however, differed in shapeof the response curves in reference and monitoring lo-calities (Fig. 2).Relationship of metrics to altitude: We assumed
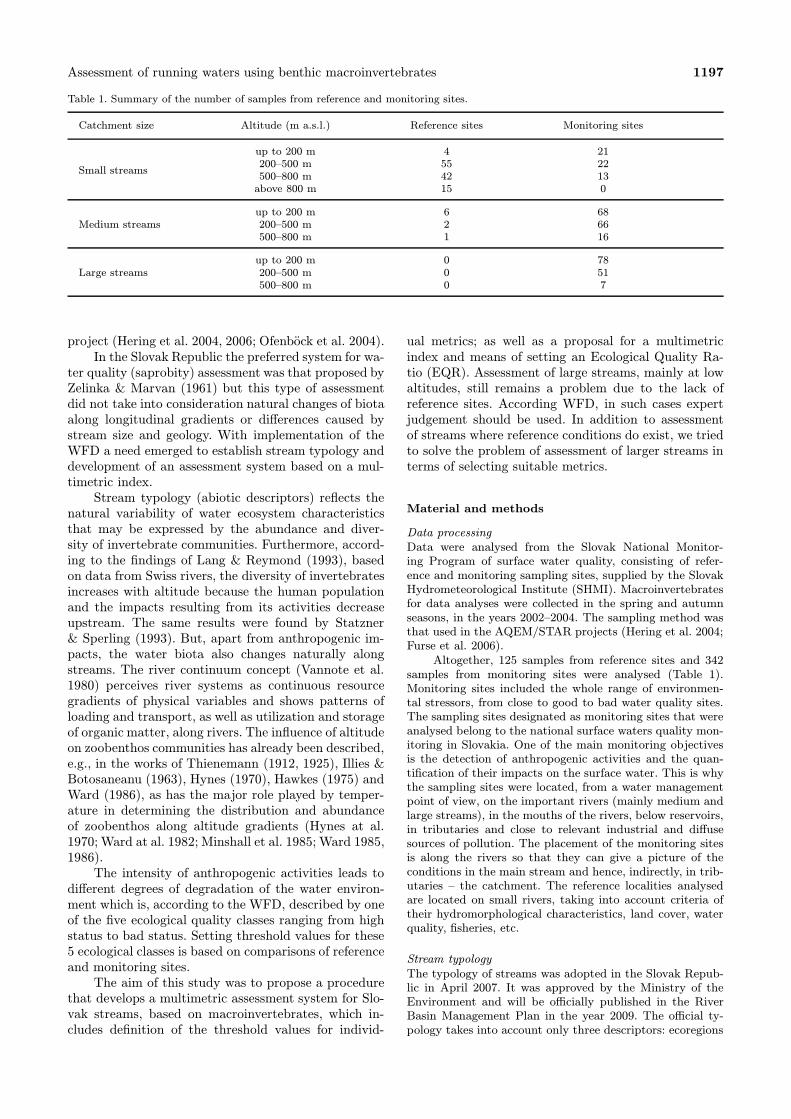
that metrics related to altitude, reflecting the naturalorganic loading increasing downstream, are also able toreflect anthropogenic organic loading and this hypoth-esis was tested on small streams. Regression analysisshowed that metrics which were not able to separatereference and monitoring sites in all altitudinal classes,also had no, or very low relationships to altitude gradi-ent (Fig. 3). All metrics chosen for the MMI calculationwere also correlated with altitude (Table 3). The re-gression plots of these metrics showed identical or verysimilar kinds of response of reference and monitoringstreams to altitude gradient, only shifted due to worsemetric values in monitoring sites (Fig. 4).Medium and large streams. The relationships of met-rics to altitude were also tested for medium and largestreams and were used for selection of suitable met-rics for the MMI calculation. Analysis showed that all

1200 F. Šporka et al.
Monit.
Refer.0 200 400 600 800 1000 1200
altitude (m a.s.l.)
0,81,01,21,41,61,82,02,22,42,62,83,03,23,43,6
SI
Monit.
Refer.0 200 400 600 800 1000 1200
altitude (m a.s.l.)
0
20
40
60
80
100
Olig
o [
%]
Monit.
Ref er.0 200 400 600 800 1000 1200
altitude (m a.s.l.)
0
2
4
6
8
10
12
14
16
18
20
Rh
it.T
I
Monit.
Ref er.0 200 400 600 800 1000 1200
altitude (m a.s.l.)
3
4
5
6
7
8
9
10
IBC
R
Monit.
Refer.0 200 400 600 800 1000 1200
altitude (m a.s.l.)
0,000
0,160
0,286
0,459
0,5850,7000,8080,9021,000
Rheoin
dex
Monit.
Refer.0 200 400 600 800 1000 1200
altitude (m a.s.l.)
0
10
20
30
40
50
60
70
80
90
100
Ak
a+
Lit+
Ps
a [
%]
Monit.
Ref er.0 200 400 600 800 1000 1200
altitude (m a.s.l.)
0
5
10
15
20
25
30
35
40
EP
T
Monit.
Ref er.0 200 400 600 800 1000 1200
altitude (m a.s.l.)
0
20
40
60
80
100
120
140
160
BM
WP
Fig. 2. Single-variable regression models of all metrics tested for reference and monitoring localities separately along the altitudegradient. All models are significant at the 95% confidence level.
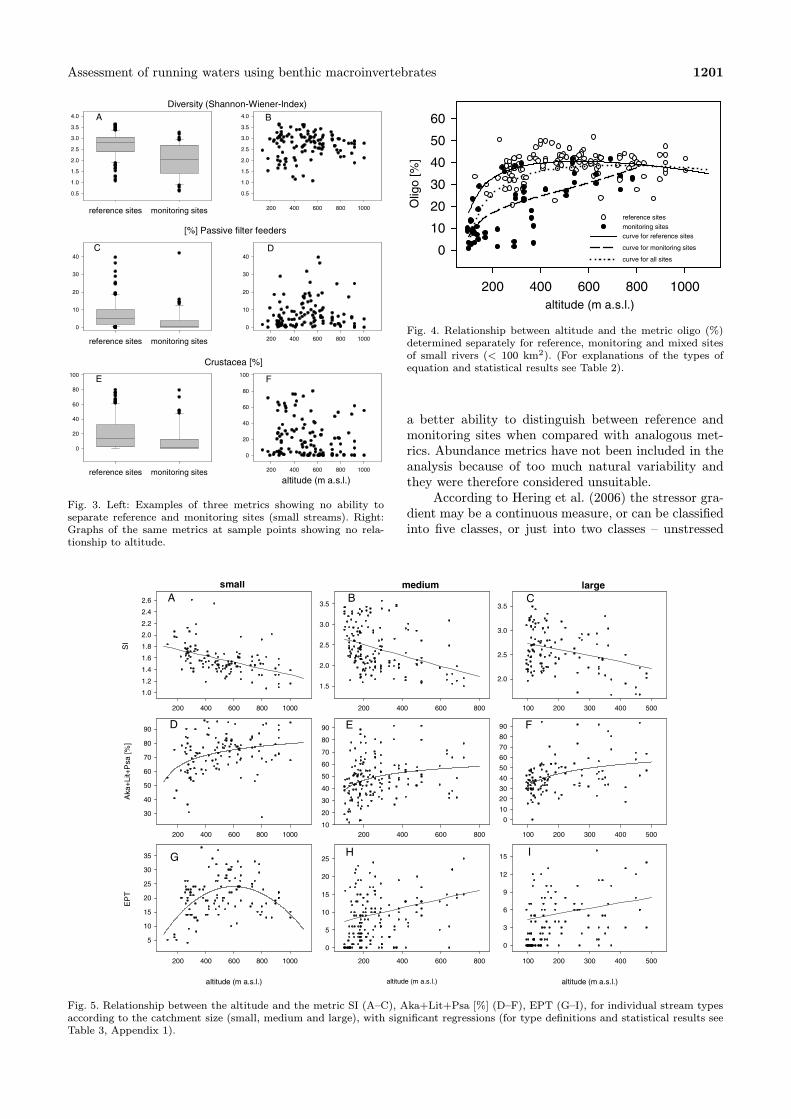
the metrics chosen for small streams were also suit-able for medium and large streams, except Rheoindex.A linear relationship of metric-altitude was recordedfor SI (Figs 5A–C) and for IBCR (Table 3). For met-rics Aka+Lit+Psa [%] a logarithmic increase was ob-served (Figs 5D–F) and for the metrics EPT, BMWPand RhiTI a characteristic non-linear relationship wasrecorded in small streams (Table 3).
Multimetric index calculationMetric boundary values for all stream types are shownin Appendix 1. Applying the multimetric index to sitesof all stream types, from 116 reference sites for smallstreams, 96 localities (83%) were assessed as high class,19 localities (16%) as good class and one locality as classmoderate. No site was assessed as bad or poor class.
From the medium streams most of the sites (38%) wereallocated into moderate and poor classes (30%). Forlarge streams most sites (45%) were assigned as poor.
Discussion
Selection of metricsThe least appropriate metrics on the list seemed to bethose of the Locomotion type group and also some bi-otic indices, such as DFSI or BBI. These indices arebased on taxa determined to genus or family level,which seemed to be insufficient for assessing the qualityof streams in Slovakia. When it was possible to choose ametric for which the taxa score = 100%, these metricswere preferred, because the percentage of unavailableinformation was removed. These metrics also showed
Assessment of running waters using benthic macroinvertebrates 1201
reference sites monitoring sites
0.5
1.0
1.5
2.0
2.5
3.0
3.5
4.0
Diversity (Shannon-Wiener-Index)
reference sites monitoring sites
0
10
20
30
40
[%] Passive filter feeders
reference sites monitoring sites
0
20
40
60
80
100
Crustacea [%]
200 400 600 800 1000
0.5
1.0
1.5
2.0
2.5
3.0
3.5
4.0
200 400 600 800 1000
0
10
20
30
40
200 400 600 800 1000
0
20
40
60
80
100
altitude (m a.s.l.)
A B
C D
E F
Fig. 3. Left: Examples of three metrics showing no ability toseparate reference and monitoring sites (small streams). Right:Graphs of the same metrics at sample points showing no rela-tionship to altitude.
altitude (m a.s.l.)
200 400 600 800 1000
Olig
o [%
]
0
10
20
30
40
50
60
reference sites monitoring sitescurve for reference sites
curve for monitoring sites
curve for all sites
Fig. 4. Relationship between altitude and the metric oligo (%)determined separately for reference, monitoring and mixed sitesof small rivers (< 100 km2). (For explanations of the types ofequation and statistical results see Table 2).
a better ability to distinguish between reference andmonitoring sites when compared with analogous met-rics. Abundance metrics have not been included in theanalysis because of too much natural variability andthey were therefore considered unsuitable.According to Hering et al. (2006) the stressor gra-
dient may be a continuous measure, or can be classifiedinto five classes, or just into two classes – unstressed
200 400 600 800 1000
SI
1.0
1.2
1.4
1.6
1.8
2.0
2.2
2.4
2.6
X Data
200 400 600 800
1.5
2.0
2.5
3.0
3.5
100 200 300 400 500
2.0
2.5
3.0
3.5
200 400 600 800 1000
Aka
+Lit+
Psa
[%]
30
40
50
60
70
80
90
200 400 600 80010
20
30
40
50
60
70
80
90
100 200 300 400 500
0
10
20
30
40
50
60
70
80
90
altitude (m a.s.l.)
200 400 600 800 1000
EP
T
5
10
15
20
25
30
35
altitude (m a.s.l.)
200 400 600 800
0
5
10
15
20
25
altitude (m a.s.l.)
100 200 300 400 500
0
3
6
9
12
15
A B C
D E F
G H I
small medium large
Fig. 5. Relationship between the altitude and the metric SI (A–C), Aka+Lit+Psa [%] (D–F), EPT (G–I), for individual stream typesaccording to the catchment size (small, medium and large), with significant regressions (for type definitions and statistical results seeTable 3, Appendix 1).

1202 F. Šporka et al.
Table 3. Relationships of individual metrics and altitude.
Acronym Metric description Stream type Equation R F value n
SI Saprobic Index (Zelinka & Marvan) small streams y = a+ bx –0.47 32.1** B116medium streams y = a+ bx –0.37 24.3** 159large streams y = a+ bx –0.58 66.4** 136
Oligo [%] Proportion of individuals with a pref-erence for oligosaprobic condition,(scored taxa = 100%)
small streams y = a+ bx2 + c/x 0.38 9.7** 116medium streams y = a+ bx 0.43 34.6** 159large streams y = a+ bx 0.74 161.5** 136
BMWP Biological Monitoring Working Party small streams y = a+ bx2 + c/x 0.53 22.4** 116medium streams y = a+ bx 0.25 10.** 159large streams y = a+ bx 0.53 51.7** 136
RHiTI Rhithron Typie Index small streams y = a+ bx2 + c/x 0.58 27.8** 116medium streams y = a+ bx 0.69 147.2** 159large streams y = a+ bx 0.83 304.8** 136
IBCR Index of Biocoenotic Region small streams y = a+ bx –0.55 49.1** 116medium streams y = a+ bx –0.55 68.2** 159large streams y = a+ bx –0.74 159.5** 136
Rheoindex Rheoindex (Banning with abundanceclasses)
small streams y = a+ b/ lnx 0.55 49.5** 116
Aka+Lit+Psa [%] Proportion of individuals with a pref-erence for gravel, littoral and sand,Proportion of individuals with a pref-erence for oligosaprobic condition,(scored taxa = 100%)
small streams y = a+ bx2 + c/x 0.36 8.6** 116medium streams y = a+ b/ lnx 0.29 14.5** 159large streams y = a+ b/ lnx 0.49 42.6** 136
EPT Number of Ephemeroptera, Ple-coptera and Trichoptera taxa
small streams y = a+ bx2 + cx/ lnx 0.48 17.6** 116medium streams y = a+ bx 0.31 14.2** 159large streams y = a+ bx 0.69 126.4** 136
[%] metarhithral Proportion of individuals with a pref-erence for the lower-trout region
medium streams y = a+ bx 0.55 68.1** 159large streams y = a+ bx 0.73 150.3** 136
NFam Number of Families medium streams y = a+ bx 0.21 7.1** 159
Explanations: Regressions were calculated for reference sites on small streams; and all sites for medium and large streams of allaltitudinal classes. Type of regression curve, R and F values are shown, n = number of the sampling sites (**P < 0.01) (see also Fig. 3,Appendix 1).
and stressed. Because pre-classification into five classeswas not possible, only two classes of site degradationwere used – reference (unstressed) sites and monitoring(stressed) sites for the small streams. Selection of suit-able metrics for small streams was also based on theability to distinguish between unstressed and stressedsites in all altitude classes.For medium and large streams, where almost no
reference sites were available, all sites formed one group– stressed sites. To select suitable metrics for thesestreams it was necessary to propose an appropriatemodel. This model comes from the idea that metrics,the values of which change along an altitudinal gradi-ent, also react to anthropogenic stress. The influence ofaltitude on zoobenthos is evident (Thienemann 1912,1925; Illies & Botosaneanu 1963; Hynes 1970; Hawkes1975; Ward 1986), reflected of course by changes in themetrics. According to Barbour et al. (1999) a metricis the “characteristic of the biota that changes in somepredictable way with increased human influence”. Thiswas also confirmed by Statzner & Sperling (1993) andLang & Reymond (1993) but also in natural streams
there are clearly continuous gradients of physical vari-ables in the system such as patterns of loading, trans-port, utilization and storage of organic matter, all ofwhich are subsequently followed by the response of theaquatic biota (Vannote et al. 1980).Our assumption was tested on small streams us-
ing regression analysis which showed that not all met-rics are related to the altitude gradient. At the sametime, all metrics that were able to separate referenceand monitoring sites for small streams did show a sig-nificant relationship to altitude. This principle was ap-plied to medium and large streams. Some differences inthe metric/altitude relationship were detected in smallstreams on the one hand and medium/large streamson the other hand. The dependence of metric valueson altitude was mostly linear in the medium and largestreams, whereas it was usually non-linear in the smallstreams. Differences between the types of curve forsmall and medium/large streams were registered withEPT, BMWP and RhiTI (Table 3, Appendix 1), wherea non-linear relationship was recorded in small streams.For example in the case of EPT, such a relationship can
Assessment of running waters using benthic macroinvertebrates 1203
be explained by the fact that the small streams at highaltitudes (above 800 m a.s.l.) are poorer in number ofspecies than the streams at lower altitudes, the highestnumbers of taxa being recorded in the small streamsat altitudes of 500–800 m a.s.l. A similar result fromstreams in Slovakia was confirmed by Krno (2003) withregard to stoneflies. Alfa-diversity of stoneflies showedthe same non-linear relationship between species rich-ness and altitude as we registered for EPT. Maximumrichness of stoneflies was registered in streams at analtitude of about 750 m a.s.l.
Setting the threshold values of ecological quality classesAccording to Hering et al. (2006) several types of def-inition of worst and best metric values and scaling arepossible. For small streams with reference sites, we de-cided to set the 25th percentile (for metric values de-creasing with pollution) or the 75th percentile (for met-ric values increasing with pollution) as the thresholdvalues between high and good status. For medium andlarge streams the 5th or 95th percentiles were used. Thisvalue corresponds to EQR = 0.8 and the rest of therange was equally distributed among the classes. Thisway of setting class boundaries was preferred becauseof the type of data available. Because satisfactory infor-mation about the degree of impairment of monitoringsites was not available, it was not possible to determinethe proportion of individual quality classes in the set ofmonitoring sites. Therefore a detailed pre-classificationwas not performed. Because streams from acid and al-kaline ground were mixed together, such parameters aspH, conductivity or nutrition content vary considerablyand we did not consider the use of physico-chemicaldata to be appropriate.
Multimetric index calculationApplication of the multimetric index/indices, in ac-cordance with the prepared standard CEN/TC 230 N0504, belongs to the basic methods of assessment of wa-ter body status. The multimetric index integrates manyattributes of the communities (metrics) in order to de-scribe and evaluate their conditions. When combiningdifferent kinds of metrics, different environmental con-ditions are taken into account and, as a result, an as-sessment becomes more reliable.Following the general approach of setting the MMI
for a site, a final EQR value was calculated as the meanvalue of EQR of all the selected metrics of that site. Theset of metrics selected for calculation of the multimet-ric index contains metrics reflecting organic pollution,degradation in stream morphology and overall degrada-tion. We decided not to use a stressor-specific approach,according to which the MMI is set separately for organicpollution, hydromorphological degradation and overalldegradation. In this case, the final values of the indicesare compared and the worst value determines the eco-logical class. Using a stressor-specific approach in ourcase would mean that fewer metrics would be used forthe calculation of scores for hydromorphological andgeneral degradation. For example, for our large streams
eight metrics were selected as suitable, but of these onlythree can detect general degradation. In cases of ex-treme values for some of these three metrics the re-sulting class may be influenced by these metrics whencomparing them with the class derived from all metrics.We therefore decided not to apply a stressor-specific ap-proach but a general approach in which the final scorerepresents an average EQR value of all metrics. Eco-logical class derived from the calculated MMI for smallreference streams supported their allocation as a ref-erence site, with one exception, when for that one sitemoderate status was assigned due to bad values of met-rics. This site should therefore be considered for exclu-sion from the reference sites. Small streams had sitesmore equally distributed among all ecological classes.Medium streams were mostly rated as “moderate” andlarge streams as “poor”, which corresponds to the realsituation that large streams suffer most from anthro-pogenic stress.From comparison of single metric boundary val-
ues for individual altitude classes, for small, mediumand large streams, it is apparent that for some metricsin small streams differences between altitudinal classesare quite small. This applies to SI, IBCR, Rheoindexand EPT. Therefore unifying boundary values for thesemetrics could be considered in the future.At the same time, we are conscious of some
weak points in our procedure. Pre-classification ofmedium/large stream sites that are missing should becarried out, so that we can verify if the 5th/95th per-centile as the high-good boundary value is suitable.Also, the way of selecting metrics for streams typeswithout reference sites is open to discussion. The wholeprocedure should be verified using the independent setof data and reference data from medium/large streamsshould be added.
Conclusions
Our study presents the procedure of multimetric indexcalculation used for Slovakian streams of currently de-fined stream types. For small streams in all altitudinalclasses reference sites were available and the selectionof metrics was based on their ability to separate themonitoring and reference sites.At the same time, we propose a model for how to
deal with MMI calculation in cases which lack referencedata. An altitude-metrics relationship was used for se-lection of the metrics for medium and large streamswhich lack reference sites. The validity of this relation-ship was tested on small streams, for which regressionanalysis showed that metrics that were able to sepa-rate monitoring and reference sites also showed a sig-nificant relationship to altitude. Metrics that were notable to separate reference and monitoring sites haveonly a small, or non-significant relationship to altitude.The final MMI was calculated following the gen-
eral approach using a mean value of EQR of all theselected metrics. Because only a few metrics would besuitable for detection of hydromorphological and gen-
1204 F. Šporka et al.
eral degradation, we thus avoided misclassification incases of extreme value of these metrics.The proposed procedure should be verified in the
future using a dataset containing new rivers and sites.
Acknowledgements
This study was performed for the purpose of the imple-mentation of WFD for running waters of Slovakia. The au-thors would like to thank the Slovak HydrometeorologicalInstitute for providing material from the Slovak NationalMonitoring Program. We also thank the reviewers for de-tailed and helpful comments on the manuscript and BrunoRossaro for stimulative suggestions on the statistics.
References
AQEM Consortium 2002. Manual for the Application of theAQEM System. 2002. A Comprehensive Method to assess Eu-ropean Streams using Benthic Macroinvertebrates, developedfor the Purpose of the Water Framework Directive. Version1.0. February 2002.
Barbour M.T., Gerritsen J., Snyder B.D. & Stribling J.B. 1999.Rapid Bioassessment Protocols for Use in Streams and Wade-able Rivers: Periphyton, Benthic Macroinvertebrates, andFish, Second Edition. EPA 841-B-99-002. U.S. EnvironmentalProtection Agency, Office of Water, Washington, D.C.
Barbour M.T., Plafkin J.L., Bradley B.P., Graves C.G. & Wis-seman R.W. 1992. Evaluation of EPA’s rapid bioassessmentbenthic metrics: metric redundancy and variability amongreference stream sites. Environ. Toxicol. Chem. 11: 437–449.
CEN/TC 230 N 0504 “Water Quality – Guidance Standard on theDesign of Multimetric Indices”. CEN/TC 230 “Water Anal-ysis”, European Committee for Standardisation, 2004–12, 11pp.
European Commission 2000. Directive 2000/60/EC of the Euro-pean Parliament and of the Council – Establishing a Frame-work for Community Action in the Field of Water Policy.Brussels, Belgium, 23 October 2000.
Furse M., Hering D., Moog O., Verdonschot P.F.M., JohnsonR.K., Brabec K., Gritzalis K., Buffagni A., Pinto P., FribergN., Murray-Bligh J., Kokes J., Alber R., Usseglio-PolateraP., Haase P., Sweeting R., Bis B., Szoszkiewicz K., SoszkaH., Springe G., Sporka F. & Krno I. 2006. The STAR project:content, objectives and approaches. Hydrobiologia 566: 3–29.DOI 10.1007/s10750-006-0067-6
Hawkes H.A. 1975. River zonation and classification, pp. 312–374.In: Whitton B.A. (ed.), River Ecology, Blackwell Sci. Publ.,Oxford.
Hering D., Feld C.K., Moog O. & Ofenbock T. 2006. Cook bookfor the development of a Multimetric Index for Biological con-dition of aquatic ecosystems: experiences from the EuropeanAQEM and STAR projects and related initiatives. Hydro-biologia 566: 311–324. DOI 10.1007/s10750-006-0087-2
Hering D., Moog O., Sandin L. & Verdonschot P.F.M. 2004.Overview and application of the AQEM assessment system.Hydrobiologia 516: 1–20. DOI 10.1023/B:HYDR.0000025255.70009.a5
Hughes R.M. 1995. Defining acceptable biological status by com-paring with reference conditions, pp. 31–47. In: Davis W.S. &Simon T.P. (eds), Biological Assessment and Criteria. Toolsfor Water Resource Planning and Decision Making, LewisPublishers, Boca Raton, FL.
Hynes H.B.N. 1970. The Ecology of Running Waters. Univ.Toronto Press, Toronto, 555 pp.
Illies J. & Botosaneanu L. 1963. Problemes et methodes de laclassification et de la zonation ecologique des eaux courantes,considerees surtout du point de vue faunistique, Verh. Int.Verein. Theor. Angew. Limnol. 12: 1–57.
Krno I. 2003. Distribution patterns and habitats of stoneflies inSlovakia, pp. 349–356. In: Giani E. (ed.), Research Update onEphemeroptera and Plecoptera, University of Perugia, Peru-gia.
Lang C. & Reymond O. 1993. Empirical relationships betweendiversity of invertebrate communities and altitude in rivers –application to biomonitoring. Aquatic Sciences 55: 188–196.DOI 10.1007/BF00877448
McCullagh P. & Nelder J.A. 1989. Generalized Linear Models.Chapman and Hall, London, 511 pp.
Minshall G.W., Petersen R.C. & Nimz C.F. 1985. Species richnessin streams of different size from the same drainage basin. Am.Nat. 125: 16–38.
Ofenbock T., Moog O., Gerritsen J. & Barbour M. 2004. A stres-sor specific multimetric approach for monitoring running wa-ters in Austria using benthic macro-invertebrates. Hydro-biologia 516: 251–268. DOI 10.1023/B:HYDR.0000025269.74061.f9
StatSoft, Inc. 2004. STATISTICA Cz [Softwarový systém naanalýzu dat], verze 7., www.StatSoft.Cz (accessed 03.05.2009)
Statzner B. & Sperling F. 1993. Potential contribution of system-specific knowledge (SSK) to stream management decisions:ecological and economic aspects. Freshwater Biol. 29: 313–342. DOI 10.1111/j.1365–2427.1993.tb00767.x
Thienemann A. 1912. Der Bergbach des Sauerlandes., Int. Rev.Gesamt. Hydrobiol. Hydrograph. Suppl. 4: 1–125.
Thienemann A. 1925. Die Binnengewasser Mitteleuropas. DieBinnengewasser 1: 1–255.
Vannote R.L., Minshall G.W., Cummins K.W., Sedell J.R. &Cushing C.E. 1980. The river continuum concept. Can. J.Fish. Aquat. Sci. 37: 130–137.
Ward J.V. 1985. Thermal characteristics of running waters. Hy-drobiologia 125: 31–46. DOI 10.1007/BF00045924
Ward J.V. 1986. Altitudinal zonation in a Rocky Mountainstream. Arch. Hydrobiol. 74: 133–199.
Ward J.V. & Stanford J.A. 1982. Thermal responses in the evolu-tionary ecology of aquatic insects., Annu. Rev. Entomol. 27:97–117. DOI 10.1146/annurev.en.27.010182.000525
Zelinka M. & Marvan P. 1961. Zur Prazisierung der biologischenKlassifikation der Reinheit fliessender Gewasser. Arch. Hy-drobiol. 57: 389–407.
Received December 12, 2008Accepted August 30, 2009

Assessment of running waters using benthic macroinvertebrates 1205
Appendix 1. Reference values and threshold values of selected metrics between individual classes (I. class – high ecological status) insmall (catchment size 10–100 km2), medium (catchment size 101–1000 km2) and large (catchment size > 1000 km2) streams.
Catchment size class Altitudeclassma.s.l.
Tresholdvalues
betweenclasses
EQR
SIop
Oligo[%]op
BMWPop;md;gd
[%]metarhithral
RhiTIop;md
IBCRop;md
Rheoindexmd
Aka+Lit+Psa
[%]op;md
EPTop;md;gd
NFamop;md;gd.
up to 200 I–II 0.8 1.7 25.4 57.5 – 6.2 4.7 0.73 43.6 5 –II–III 0.6 2.15 19.3 43.9 – 4.9 5.9 0.55 35.2 4 –III–IV 0.4 2.6 13.1 30.2 – 3.6 7 0.36 26.9 2 –IV–V 0.2 3.05 7 16.6 – 2.3 8.2 0.18 18.5 1 –
200–500 I–II 0.8 1.58 34.2 116 – 12.6 4.4 0.87 61.4 16 –II–III 0.6 2.06 25.9 86.9 – 9.7 5.6 0.65 48.4 12 –III–IV 0.4 2.54 17.5 58.2 – 6.8 6.9 0.44 35.3 8 –IV–V 0.2 3.02 9.2 29.5 – 3.9 8.1 0.22 22.2 4 –
Small streams500–800 I–II 0.8 1.5 38 128 – 13.7 4.1 0.93 72.1 19 –
II–III 0.6 2 28.7 96.8 – 10.5 5.4 0.69 56.4 14 –III–IV 0.4 2.5 19.4 65.5 – 7.4 6.6 0.46 40.6 10 –IV–V 0.2 3 10.1 34.3 – 4.2 7.9 0.23 24.9 5 –
above 800 I–II 0.8 1.4 34 98 – 12.7 4 0.95 75 15 –II–III 0.6 1.91 25.7 75 – 9.8 5.3 0.7 58.6 11 –III–IV 0.4 2.44 17.4 51 – 6.8 6.7 0.48 42.1 8 –IV–V 0.2 2.97 9.1 27 – 3.9 8 0.24 26.6 4 –
up to 200 I–II 0.8 2.33 30.5 107 22.5 7.5 5.3 – 76.7 16 23II–III 0.6 2.6 23 81 16.9 5.8 5.9 – 60.5 12 18III–IV 0.4 2.9 15.4 55 11.2 4 6.4 – 44.4 8 12IV–V 0.2 3.2 7.9 29 5.6 2.3 6.9 – 28.2 4 7
200–500 I–II 0.8 1.7 36.8 121 28.5 13.3 4.4 – 80.5 20 26Medium streams II–III 0.6 2.2 27.7 92 21.4 10.1 5.1 – 63.4 15 20
III–IV 0.4 2.6 18.6 62 14.2 6.9 5.9 – 46.2 10 14IV–V 0.2 3.1 9.5 33 7.1 3.7 6.7 – 29.1 5 8
500–800 I–II 0.8 1.5 41.9 139 37.5 15.8 3.9 – 87.5 24 28II–III 0.6 2 31.5 105 28.1 12 4.8 – 68.6 18 22III–IV 0.4 2.5 21.1 71 18.8 8.1 5.7 – 49.8 12 15IV–V 0.2 3 10.7 37 9.4 4.3 6.6 – 30.9 6 9
up to 200 I–II 0.8 2.3 17.7 57.4 18.9 5.8 5.4 – 54 11 –II–III 0.6 2.6 13.3 43.3 14.2 4.4 6.2 – 40.5 8 –III–IV 0.4 2.9 8.8 29.2 9.4 2.9 6.9 – 27 6 –IV–V 0.2 3.2 4.4 15.1 4.7 1.5 7.7 – 13.5 3 –
200–500 I–II 0.8 2.1 26.1 95.6 31.4 9.1 4.5 – 62.3 16 –Large streams II–III 0.6 2.45 19.6 72.0 23.6 6.8 5.5 – 46.7 12 –
III–IV 0.4 2.8 13 48.3 15.7 4.6 6.4 – 31.2 8 –IV–V 0.2 3.15 6.5 24.7 7.9 2.3 7.4 – 15.6 4 –
500–800 I–II 0.8 1.7 41 129 43.9 14.2 3.2 69.2 26II–III 0.6 2.15 30.8 97 32.9 10.7 4.5 51.9 20III–IV 0.4 2.6 20.5 65 22 7.1 5.8 34.6 13IV–V 0.2 3.05 10.3 33 11 3.6 7.1 17.3 7
Explanations: Names of metrics are with the stressor that they detect (according Hering et al. 2004): o p – organic pollution; m d –morphological degradation; g d. – general degradation.
Related Documents