Talanta 65 (2005) 1179–1189 Assessment of pesticide contamination in soil samples from an intensive horticulture area, using ultrasonic extraction and gas chromatography–mass spectrometry C. Gonc ¸alves a , M.F. Alpendurada a,b,∗ a Laboratory of Hydrology, Faculty of Pharmacy, University of Porto, Rua Anibal Cunha, 164/4050-047 Porto, Portugal b IAREN-Water Institute of the Northern Region, Rua Dr. Eduardo Torres, 229/4450-113 Matosinhos, Portugal Received 28 May 2004; received in revised form 16 August 2004; accepted 24 August 2004 Available online 12 October 2004 Abstract In order to reduce the amount of sample to be collected and the time consumed in the analytical process, a broad range of analytes should be preferably considered in the same analytical procedure. A suitable methodology for pesticide residue analysis in soil samples was developed based on ultrasonic extraction (USE) and gas chromatography–mass spectrometry (GC–MS). For this study, different classes of pesticides were selected, both recent and old persistent molecules: parent compounds and degradation products, namely organochlorine, organophosphorous and pyrethroid insecticides, triazine and acetanilide herbicides and other miscellaneous pesticides. Pesticide residues could be detected in the low- to sub-ppb range (0.05–7.0 g kg −1 ) with good precision (7.5–20.5%, average 13.7% R.S.D.) and extraction efficiency (69–118%, average 88%) for the great majority of analytes. This methodology has been applied in a monitoring program of soil samples from an intensive horticulture area in P´ ovoa de Varzim, North of Portugal. The pesticides detected in four sampling programs (2001/2002) were the following: lindane, dieldrin, endosulfan, endosulfan sulfate, 4,4 -DDE, 4,4 -DDD, atrazine, desethylatrazine, alachlor, dimethoate, chlorpyrifos, pendimethalin, procymidone and chlorfenvinphos. Pesticide contamination was investigated at three depths and in different soil and crop types to assess the influence of soil characteristics and trends over time. © 2004 Elsevier B.V. All rights reserved. Keywords: Ultrasonic extraction; Pesticides; Herbicides; Soil; Contamination 1. Introduction Great productivity gains can be achieved in agriculture using the adequate pesticides. Indeed, they are needed to meet the world’s demand on foodstuffs and no other alternative can compete to be used in such a large scale. Slow degradation of pesticides in the environment and extensive or inappropriate usage by farmers can lead to environmental contamination of the water, soil, air, several types of crops and indirectly to humans [1,2]. Chlorinated pesticides (OCPs) are very toxic and persis- tent compounds in the environment. Although most of them ∗ Corresponding author. Tel.: +351 22 9364210; fax: +351 22 9364219. E-mail address: [email protected] (M.F. Alpendurada). have been banned decades ago, they can still be found in the environment even in remote regions; thus, they are still of great concern [3]. The organophosphorous insecticides (OPPs) and triazine herbicides are among the most commonly used and detected pesticides around the world; thus, monitor- ing is important from an agricultural and environmental point of view [4–6]. Pesticides is a family of compounds in contin- uous evolution in terms of chemical synthesis; some of the recent chemicals such as dinitroanilines, chloroacetamides, dicarboximides, acylalanines, regarded as safer to the envi- ronment can be found in high-quantities in soils, conversely to the previously referred groups. Soil is the principal reservoir of environmental pesticides, thus representing a source from which residues can be re- leased to the atmosphere, ground water and living organisms 0039-9140/$ – see front matter © 2004 Elsevier B.V. All rights reserved. doi:10.1016/j.talanta.2004.08.057

Welcome message from author
This document is posted to help you gain knowledge. Please leave a comment to let me know what you think about it! Share it to your friends and learn new things together.
Transcript
Talanta 65 (2005) 1179–1189
Assessment of pesticide contamination in soil samples from anintensive horticulture area, using ultrasonic extraction and gas
chromatography–mass spectrometry
C. Goncalvesa, M.F. Alpenduradaa,b,∗a Laboratory of Hydrology, Faculty of Pharmacy, University of Porto, Rua Anibal Cunha, 164/4050-047 Porto, Portugal
b IAREN-Water Institute of the Northern Region, Rua Dr. Eduardo Torres, 229/4450-113 Matosinhos, Portugal
Received 28 May 2004; received in revised form 16 August 2004; accepted 24 August 2004Available online 12 October 2004
Abstract
In order to reduce the amount of sample to be collected and the time consumed in the analytical process, a broad range of analytess oil samplesw rent classeso anochlorine,o esidues coub iency( il samplesf 1/2002)w ate,c ifferent soila©
K
1
utcpuoh
t
nd instill
desonly
nitor-ointtin-f theides,envi-sely
es,e re-isms
0d
hould be preferably considered in the same analytical procedure. A suitable methodology for pesticide residue analysis in sas developed based on ultrasonic extraction (USE) and gas chromatography–mass spectrometry (GC–MS). For this study, diffef pesticides were selected, both recent and old persistent molecules: parent compounds and degradation products, namely orgrganophosphorous and pyrethroid insecticides, triazine and acetanilide herbicides and other miscellaneous pesticides. Pesticide rlde detected in the low- to sub-ppb range (0.05–7.0�g kg−1) with good precision (7.5–20.5%, average 13.7% R.S.D.) and extraction effic69–118%, average 88%) for the great majority of analytes. This methodology has been applied in a monitoring program of sorom an intensive horticulture area in Povoa de Varzim, North of Portugal. The pesticides detected in four sampling programs (200ere the following: lindane, dieldrin, endosulfan, endosulfan sulfate, 4,4′-DDE, 4,4′-DDD, atrazine, desethylatrazine, alachlor, dimethohlorpyrifos, pendimethalin, procymidone and chlorfenvinphos. Pesticide contamination was investigated at three depths and in dnd crop types to assess the influence of soil characteristics and trends over time.2004 Elsevier B.V. All rights reserved.
eywords: Ultrasonic extraction; Pesticides; Herbicides; Soil; Contamination
. Introduction
Great productivity gains can be achieved in agriculturesing the adequate pesticides. Indeed, they are needed to meet
he world’s demand on foodstuffs and no other alternative canompete to be used in such a large scale. Slow degradation ofesticides in the environment and extensive or inappropriatesage by farmers can lead to environmental contaminationf the water, soil, air, several types of crops and indirectly toumans[1,2].
Chlorinated pesticides (OCPs) are very toxic and persis-ent compounds in the environment. Although most of them
∗ Corresponding author. Tel.: +351 22 9364210; fax: +351 22 9364219.E-mail address:[email protected] (M.F. Alpendurada).
have been banned decades ago, they can still be fouthe environment even in remote regions; thus, they areof great concern[3]. The organophosphorous insectici(OPPs) and triazine herbicides are among the most commused and detected pesticides around the world; thus, moing is important from an agricultural and environmental pof view [4–6]. Pesticides is a family of compounds in conuous evolution in terms of chemical synthesis; some orecent chemicals such as dinitroanilines, chloroacetamdicarboximides, acylalanines, regarded as safer to theronment can be found in high-quantities in soils, converto the previously referred groups.
Soil is the principal reservoir of environmental pesticidthus representing a source from which residues can bleased to the atmosphere, ground water and living organ
039-9140/$ – see front matter © 2004 Elsevier B.V. All rights reserved.oi:10.1016/j.talanta.2004.08.057
1180 C. Goncalves, M.F. Alpendurada / Talanta 65 (2005) 1179–1189
[7]. In modern analytical laboratories, the classical method-ology for determination of micropollutants in solid matricesbased on agitation procedures and Soxhlet extraction[8–10]has been replaced by less time- and solvent-consuming, andoften automated techniques, which include high-pressureand/or high-temperature processes: microwave-assistedextraction (MAE)[11], supercritical fluid extraction (SFE)[12,13], accelerated solvent extraction (ASE)[14–16], orvigorous agitation like ultrasonic extraction (USE)[17,18].Recently, some attempts have been made to enlarge thesolid-phase microextraction (SPME) applications to theanalysis of solid matrices, which would be beneficial interms of simplification in sample handling, reduction insample size and solvent volume, and absence of additionalclean-up procedures[19]. Extraction of the soil samples canbe achieved by direct dipping of the fibre in a soil/waterslurry, indirect extraction in the headspace or by dilutionof the extract obtained by other liquid extraction techniquewith distilled water[19]. Although successful, only a limitednumber of references can be found reporting the analysisof OCPs[20], OPPs[21] and herbicides[19,22,23]in soilsamples, which can be attributed to some limitations interms of fibre stability or analyte release/volatility.
As common advantages of all the enhanced extractiontechniques regarded as environmentally friendly can be re-f ow-e SFEc an bes lites[ andl -t ly ofa tivity,t
ents per-se hert e tot tracea detect thefe fulfilt useo fromsU y ofs them arya tionsc atorye ted.I ctiont lly int d ex-
tract. This paper describes the development and applicationof an USE technique combined with gas chromatography andmass spectrometric detection for the analysis of OCPs, OPPs,triazines, pyrethroids, acetanilides and other miscellaneouspesticides in soil samples from an intensive horticulture areain North Portugal. This region comprises mainly two typesof soil (sand and sandy-loam); thus, their influence on thepesticides behaviour will be investigated. The implementedmonitoring program is expected to allow observing temporaltrends on pesticide contamination as well as variations ac-cording to depth in five sampling points, during two years.Results for the 2001/2002 period will be reported.
2. Experimental
2.1. Chemicals and reagents
All pesticide analytical standards of Pestanal® grade weresupplied by Riedel-de-Haen (Seelze, Germany). The OCPswere obtained as a commercial mixture (EPA 608 pesticidemix, 20 mg l−1) from Supelco (Bellefont, PA, USA). Indi-vidual pesticide stock standard solutions were prepared byexact weighing of high-purity substances in 10 ml volumet-ric flasks and filled up with an appropriate solvent as follows:p s andt s ofo mix-t henp andi ob-ts froml rdsa -H hro-m luka,B omM adi-e n). Int cialt ereu
2
usei ieswl imesh oft than4 mplesf and2 gd
erred the improved selectivity, rapidity and automation, hver, some particular drawbacks must be considered.annot handle large sample amounts and recoveries comewhat lower for markedly polar pesticides/metabo24]. ASE and SFE require expensive instrumentationaborious optimisation processes[24]. MAE can improve exraction efficiency of thermal stable pesticides particularged pollutants but on the expense of extraction selec
hus requiring a further clean-up step[25,26].The target compounds for analysis in soil and sedim
amples have traditionally been highly hydrophobic andistent contaminants like OCPs[2,3,7,17,20]and, with fewxceptions[27,28], little attention has been dedicated eito other type of pesticides or multiresidue analysis. Duhe large number of active ingredients used nowadays,nalyses of these substances require techniques for the
ion of the greatest number of compounds possible, withewest number of extraction and clean-up steps[29]. If well-stablished, ultrasonic extraction has the potential to
he requirements of a multiresidue method. The initialf ultrasonic energy as a means to extract pesticidesoil was first reported by Johnsen and Starr in 1967[17].SE is a very versatile technique due to the possibilitelecting the solvent type or solvent mixture that allowsaximum extraction efficiency and selectivity. The primdvantage of this method is the fact that several extracan be done simultaneously and no specialized laborquipment is required, although it is not easily automa
n combination with state-of-the-art separation and deteechniques good performance can be obtained, eventuahe absence of additional clean-up of the concentrate
-
yrethroids were prepared in ethyl acetate whereas OPPriazines were dissolved in methanol; individual solutionther pesticides were also made in methanol. Four group
ures at 2.0 mg l−1 concentration of each pesticide were trepared in methanol, while hexachlorobenzene (HCB)
sodrin were added to the OCPs commercial mixture toain a stock solution of 100�g l−1, in methanol. All stocktandard solutions were stored in a freezer protectedight at −18◦C. Ethyl acetate used in handling of standand soil extractions was of Pestanal® grade from Riedel-deaen whereas methanol and dichloromethane were of CaSolv and Analytical Reagent grade, respectively (Fuchs, Switzerland).n-Hexane was of SupraSolv grade frerck (Darmstadt, Germany), and acetonitrile HPLC grnt grade was supplied by Panreac (Barcelona, Spai
he filtration of extracts regular cotton wool with no spereatment and anhydrous sodium sulfate from Merck, wsed.
.2. Soil samples
An uncontaminated bulk soil sample was selected ton the optimisation and validation experiments. All studere conducted with spiked soil at 10�g kg−1 concentration
evel, except for desethylatrazine and dimethoate 10 tigher and�-chlordane 10 times lower, after evaporation
he residual solvent and aging during a period of not lessdays. Once the method was established, real soil sa
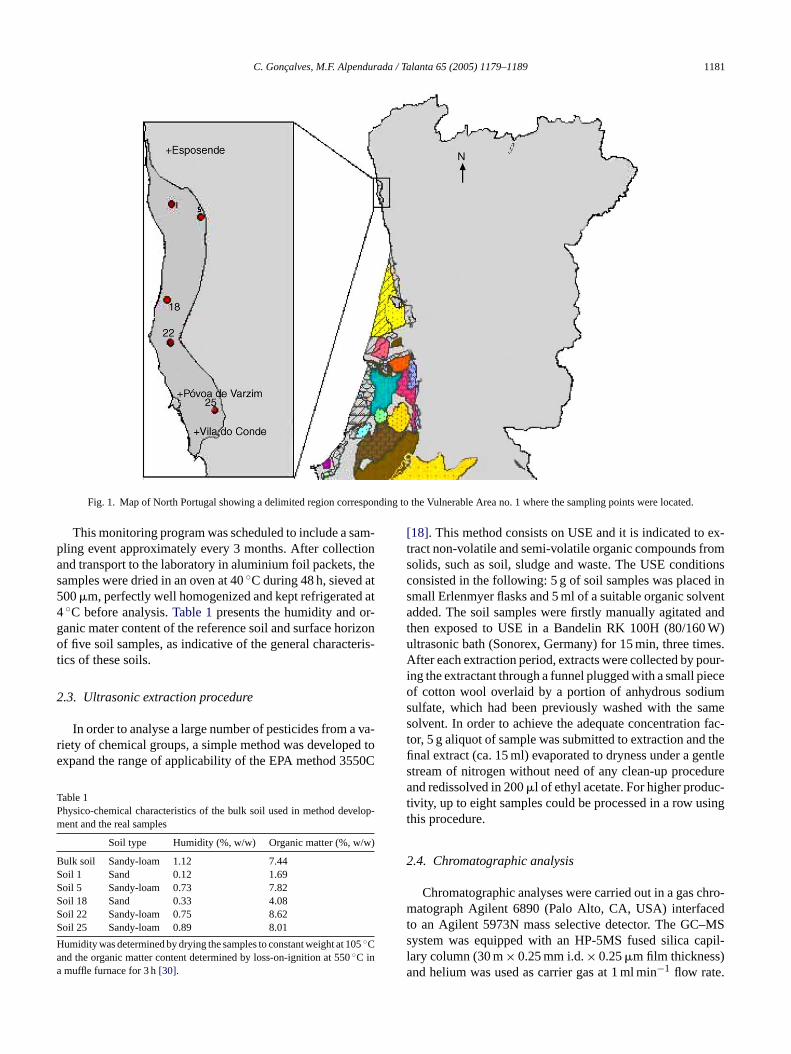
rom five sampling points at three depths (surface, 100 cm), as depicted inFig. 1, were collected in four samplinates and analysed with the USE method.
C. Goncalves, M.F. Alpendurada / Talanta 65 (2005) 1179–1189 1181
Fig. 1. Map of North Portugal showing a delimited region corresponding to the Vulnerable Area no. 1 where the sampling points were located.
This monitoring program was scheduled to include a sam-pling event approximately every 3 months. After collectionand transport to the laboratory in aluminium foil packets, thesamples were dried in an oven at 40◦C during 48 h, sieved at500�m, perfectly well homogenized and kept refrigerated at4◦C before analysis.Table 1presents the humidity and or-ganic mater content of the reference soil and surface horizonof five soil samples, as indicative of the general characteris-tics of these soils.
2.3. Ultrasonic extraction procedure
In order to analyse a large number of pesticides from a va-riety of chemical groups, a simple method was developed toexpand the range of applicability of the EPA method 3550C
Table 1Physico-chemical characteristics of the bulk soil used in method develop-ment and the real samples
Soil type Humidity (%, w/w) Organic matter (%, w/w)
Bulk soil Sandy-loam 1.12 7.44Soil 1 Sand 0.12 1.69Soil 5 Sandy-loam 0.73 7.82Soil 18 Sand 0.33 4.08Soil 22 Sandy-loam 0.75 8.62Soil 25 Sandy-loam 0.89 8.01
H 05aa
[18]. This method consists on USE and it is indicated to ex-tract non-volatile and semi-volatile organic compounds fromsolids, such as soil, sludge and waste. The USE conditionsconsisted in the following: 5 g of soil samples was placed insmall Erlenmyer flasks and 5 ml of a suitable organic solventadded. The soil samples were firstly manually agitated andthen exposed to USE in a Bandelin RK 100H (80/160 W)ultrasonic bath (Sonorex, Germany) for 15 min, three times.After each extraction period, extracts were collected by pour-ing the extractant through a funnel plugged with a small pieceof cotton wool overlaid by a portion of anhydrous sodiumsulfate, which had been previously washed with the samesolvent. In order to achieve the adequate concentration fac-tor, 5 g aliquot of sample was submitted to extraction and thefinal extract (ca. 15 ml) evaporated to dryness under a gentlestream of nitrogen without need of any clean-up procedureand redissolved in 200�l of ethyl acetate. For higher produc-tivity, up to eight samples could be processed in a row usingthis procedure.
2.4. Chromatographic analysis
Chromatographic analyses were carried out in a gas chro-matograph Agilent 6890 (Palo Alto, CA, USA) interfacedto an Agilent 5973N mass selective detector. The GC–MSs apil-l )a
umidity was determined by drying the samples to constant weight at 1◦Cnd the organic matter content determined by loss-on-ignition at 550◦C inmuffle furnace for 3 h[30].
ystem was equipped with an HP-5MS fused silica cary column (30 m× 0.25 mm i.d.× 0.25�m film thicknessnd helium was used as carrier gas at 1 ml min−1 flow rate.
1182 C. Goncalves, M.F. Alpendurada / Talanta 65 (2005) 1179–1189
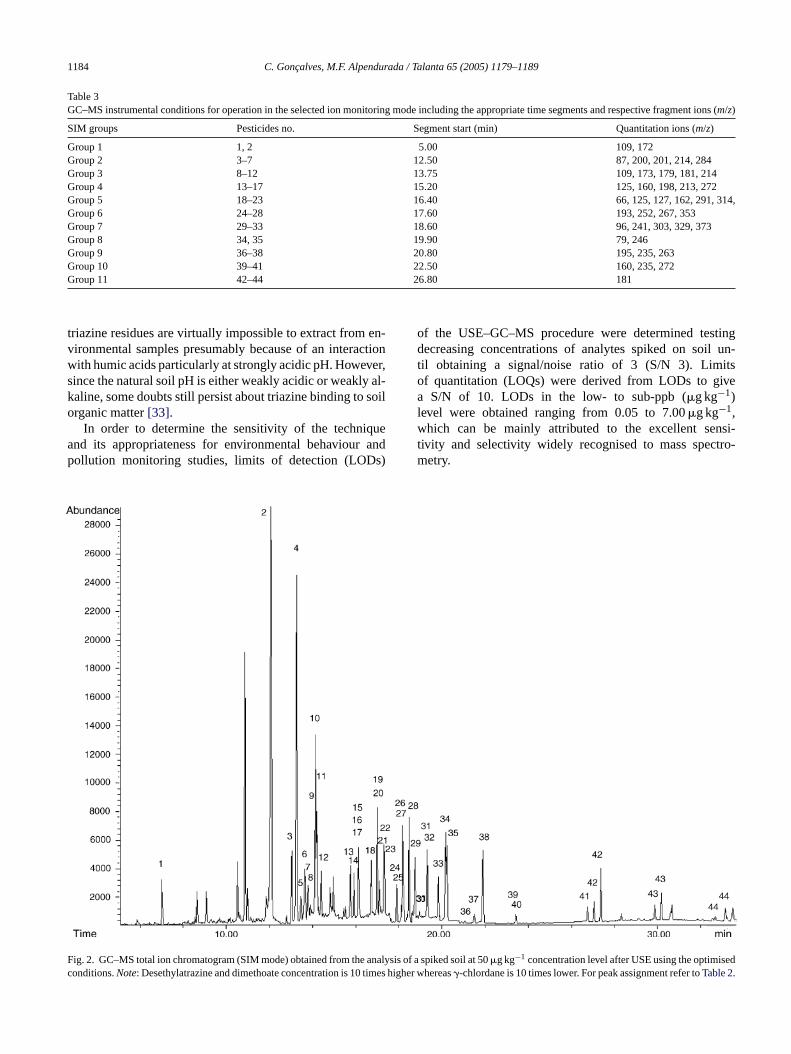
The injection port temperature was set at 250◦C and a linerwith a plug of glass wool was installed. An amount of 1�lof the concentrated extracts was injected in splitless mode,during 0.75 min. MS temperatures were: ion source, 230◦C;quadrupole, 150◦C; and transfer line, 280◦C. The 44 pesti-cides were separated with a 33.67 min oven temperature pro-gram built as follows: initial temperature 80◦C (hold 2 min),increase at 15◦C min−1 to 180◦C (hold 4 min), increase at10◦C min−1 to 230◦C (hold 5 min) and finally increase at10◦C min−1 to 290◦C (hold 5 min). Quantitation was car-ried out in the selected ion monitoring mode (SIM) select-ing characteristic fragment ions for each pesticide while,when needed, confirmation was achieved in a second analysisrecording the full scan mass spectra and requiring a minimumspectral fit of 80.
3. Results and discussion
3.1. Method development
In the early beginning of USE, Johnsen and Starr demon-strated that sonic energy could allow a very efficient extrac-tion method for the analysis of OCPs in soils, comparing theperformance of the Polytron, ultrasonic cleaner, Soxhlet ando ctionp e toa rsd nique[
flu-e sol-v tingm co-e im-p la et listo ndsa houldh Thec
anta-t eriesf reci-s itrile( s fort notr ethyla targeta hex-a e thee ttedw ex-p ctionr l ac-e par-
ticles. From the evaluation of method performance using 5 mlof ethyl acetate as extractant in ultrasonic extraction during15 min repeated three times (as described in the Section2), itwas concluded that these conditions exhibited excellent ex-traction capabilities; therefore, no further optimisation wouldbe needed.
3.2. Method performance
The USE method as described above was extensivelytested in order to assess its precision, sensitivity, selectiv-ity and completeness. The critical validation parameters werecompiled and presented inTable 2. All the results were calcu-lated based on peak areas obtained monitoring the respectivepesticide fragment ions (m/z) in SIM mode. Chromatographicdata acquisition was divided into 11 different MS segmentsin order to include the lowest number of compounds in each,this way maximising sensitivity (seeTable 3).
The precision of the technique was evaluated in terms ofrepeatability (within-day relative standard deviation, R.S.D.)by the analysis of six replicate spiked soil samples at10�g kg−1 concentration level, and in terms of intermedi-ate precision (between-day R.S.D.) at the same concentra-tion level in three non-consecutive days (results displayed inTable 2). The precision can be considered very good takingi tabil-i ke-w 5%,o nteda aphicr
l at1 ys.F s fort s andm bove1 chlo-r mptst ingt actsa prob-l lin-d ,� f thisp atrix,s e re-t thes peaka vationl is ofm thosep nedt andw ceptd ver-t essen-
ther techniques. The authors concluded that the extraerformance was comparable, differing only on the timchieve complete recoveries[17]. Also, some other authoeveloped successful methodologies based on this tech
3,4].One of the most important parameters that can in
nce extraction efficiency and selectivity in USE is theent nature, which is a critical parameter when attempultiresidue analysis. To minimize the effect of soil
xtractives on the determination of analytes as well as torove recoveries several solvents were tested:n-hexane, ethycetate, acetonitrile and dichloromethane. Since the targf pesticides includes highly apolar to mid-polar compound even degradation products the extraction solvent save polarity properties compatible with all analytes.omplete list of target pesticides can be found inTable 2.
Dichloromethane was discarded because solvent decion became difficult. Ethyl acetate gave the best recovor all analytes except one (dichorvos) and also best pion. Hexane (5.2–81.1% of ethyl acetate) and aceton14.7–81.3% of ethyl acetate) showed good propertiehe extraction of OCPs; however, hexane almost couldecover the OPPs and triazines from soil. In conclusion,cetate was the most suitable solvent for USE of thesenalytes whereas acetonitrile was only acceptable andne was unacceptable. In an attempt to further improvxtraction recovery, the soil sample was previously weith 15% NaCl aqueous solution. The salting-out effectected to occur with this strategy did not enhance extraecoveries, except for dichlorvos (32.0–122.4% of ethytate), which can be explained by water shielding of soil
nto account a non-automated procedure having a repeaty of less than 8% for the great majority of analytes. Liise, the intermediate precision was consistently below 1nly a few exceptions up to 20%. Endrin however presen anomalous result due to a decrease in chromatogresponse with time.
The recoveries were calculated on spiked soi0�g kg−1 concentration level after ageing during 4 dairst experiments gave immediately good recovery value
he organophosphorous insecticides, triazine herbicideiscellaneous pesticides; however, excessively high (a30%) recovery values were obtained for some organoine and pyrethroid pesticides. Even after some atteo find out the origin of such behaviour, namely changhe injector temperature, matching the solvent in extrnd standards and testing a higher concentration, the
em persisted essentially for the following pesticides:ane, heptachlor, dieldrin, endrin, 4,4′-DDD, �-cyhalothrin-cypermethrin and azinphos methyl. Soon the cause ohenomenon appeared to be related with the extract mince the blank extracts were free of interferences at thention time and quantitation ions of the pesticides andame concentration injected in pure solvent gave lowerreas compared to the recovery standards. This obser
ed us to perform the calculations based on the analysatrix-matched standards and the results obtained areresented inTable 2. In general, the recovery values obtai
his way were lower than the ones previously obtainedere acceptable for the majority of the compounds (exichlorvos and fenamiphos) ranging from 70 to 118%. Ne
heless, some results remained somewhat above 100%
C. Goncalves, M.F. Alpendurada / Talanta 65 (2005) 1179–1189 1183
Table 2Validation parameters of the USE–GC–(SIM)MS method used for pesticide analysis in soil samples: precision, limits of detection, recoveries and calibrationdata
Peak no. Pesticides tR (min) Quantitationion (m/z)
Repeatability(%R.S.D.)n= 6
Intermediate precision(%R.S.D.)n= 18
LOD (�g kg−1) Recovery (%R.S.D.)(10�g kg−1) n = 6
Determinationcoefficients(r2)
1 Dichlorvos 7.03 109 16.8 15.4 2.00 58 (12.4) 0.9972 Desethylatrazine 11.97 172 3.9 12.3 2.00 75 (4.6) 0.9993 Hexachlorobenzene 13.03 284 5.2 12.3 0.07 78 (7.5) 1.0004 Dimethoate 13.21 87 4.9 17.0 1.00 79 (17.2) 1.0005 Simazine 13.36 201 4.8 11.1 0.80 79 (7.0) 1.0006 Atrazine 13.54 200 5.8 11.6 0.20 78 (6.4) 0.9997 Propazine 13.68 214 5.1 11.0 0.30 78 (5.3) 0.9998 Lindane 13.90 181 13.0 19.3 0.50 86 (15.6) 0.9919 Terbuthylazine 14.03 214 4.1 11.8 0.10 79 (6.4) 0.999
10 Propyzamide 14.14 173 3.9 10.9 0.50 87 (3.5) 1.00011 Fonofos 14.17 109 4.8 12.4 2.00 88 (13.9) 0.99912 Diazinon 14.44 179 7.0 13.5 3.00 74 (10.5) 0.99913 Metribuzin 15.73 198 4.7 14.2 2.00 80 (9.6) 0.99814 Parathion-methyl 15.93 125 6.0 17.1 4.00 92 (13.7) 1.00015 Simetryn 16.04 213 9.3 16.9 2.00 69 (4.6) 0.98916 Alachlor 16.15 160 4.9 12.3 0.50 84 (6.2) 0.99917 Heptachlor 16.15 272 4.5 7.5 0.10 118 (9.2) 1.00018 Fenitrothion 16.72 125 5.7 11.8 4.00 90 (12.1) 1.00019 Malathion 17.02 127 5.5 10.8 4.00 89 (7.2) 1.00020 Metolachlor 17.08 162 7.4 11.2 0.10 94 (8.1) 0.99921 Aldrin 17.14 66 5.4 12.9 2.00 78 (11.5) 0.99922 Chlorpyrifos 17.32 314 4.7 10.4 0.05 79 (3.6) 1.00023 Parathion-ethyl 17.34 291 6.0 11.1 0.07 90 (8.0) 1.00024 Isodrin 17.93 193 5.4 10.2 1.00 78 (10.3) 1.00025 Chlorfenvinphos E 18.12 267 7.5 13.1 0.20 92 (14.5) 1.00026 Pendimethalin 18.20 252 4.6 9.5 0.30 101 (4.6) 1.00027 Heptachlor Epoxy 18.25 353 8.3 12.4 0.05 91 (5.7) 0.99928 Chlorfenvinphos Z 18.46 267 4.8 10.6 0.20 91 (10.8) 1.00029 Procymidone 18.73 96 7.6 11.5 2.00 110 (4.7) 0.99730 �-chlordane 18.95 373 7.8 11.6 0.10 97 (4.4) 1.00031 Tetrachlorvinphos 19.30 329 5.4 18.5 0.07 76 (17.0) 0.99932 Endosulfan I 19.35 241 7.1 12.6 1.00 88 (4.6) 1.00033 Fenamiphos 19.79 303 5.6 15.7 0.20 70 (19.0) 1.00034 4,4′-DDE 20.15 246 5.3 12.7 0.50 93 (3.9) 0.99935 Dieldrin 20.25 79 6.0 12.8 1.40 104 (9.2) 0.95636 Endrin 21.08 263 14.8 33.7 0.30 80 (14.0) 0.99137 Endosulfan II 21.45 195 9.3 17.4 2.00 87 (8.7) 0.99938 4,4′-DDD 21.83 235 12.2 16.7 0.50 109 (10.5) 1.00039 Endosulfan sulfate 23.38 272 9.4 20.1 0.10 90 (10.3) 1.00040 4,4′-DDT 23.40 235 10.4 17.4 7.00 115 (11.4) 0.98941 Azinphos-methyl 26.62 160 4.5 19.2 2.00 76 (14.6) 0.99842 �-cyhalothrina 27.36 181 5.6 9.2 1.00 103 (10.0) 1.00043 �-cypermethrina 30.14 181 5.7 10.8 4.00 103 (7.0) 1.00044 Deltamethrina 33.06 181 12.1 12.9 4.00 111 (9.7) 1.000
a Pyrethroid pesticides consist on a mixture of several (R, S) diastereoisomers and although for validation purposes a single peak was used, the pair wasconsidered for quantitation purposes
tially for the compounds listed above. Due to some heatingof the ultrasonic bath, the recovery of slightly volatile com-pounds like dichlorvos can be prejudiced; however, it alsohelps in the extraction of other compounds.
Influence of matrix co-extractives on the response of ana-lytes is a well-known phenomenon in pesticide residue anal-ysis, which can result in either decreased detection response[30] or increased analytical signal[2,28]. Excessively high-recovery values were observed before and explained by thephenomenon known as ‘matrix-induced chromatographic re-
sponse enhancement’ that can occur for particular pesticides,matrix types and depending on the status of the capillarycolumn[31,32].
Although recommended to improve accuracy, use ofmatrix-matched analysis is still limited due to the wide rangeof soil types and inherent organic matter content in soil sam-ples[30]. Humic substances constitute the major part of theorganic carbon present in soils and especially humic acidsplay a major role in the environmental behaviour of pesti-cides. Prosen and Zupancic-Kralj found that a fraction of
1184 C. Goncalves, M.F. Alpendurada / Talanta 65 (2005) 1179–1189
Table 3GC–MS instrumental conditions for operation in the selected ion monitoring mode including the appropriate time segments and respective fragment ions (m/z)
SIM groups Pesticides no. Segment start (min) Quantitation ions (m/z)
Group 1 1, 2 5.00 109, 172Group 2 3–7 12.50 87, 200, 201, 214, 284Group 3 8–12 13.75 109, 173, 179, 181, 214Group 4 13–17 15.20 125, 160, 198, 213, 272Group 5 18–23 16.40 66, 125, 127, 162, 291, 314,Group 6 24–28 17.60 193, 252, 267, 353Group 7 29–33 18.60 96, 241, 303, 329, 373Group 8 34, 35 19.90 79, 246Group 9 36–38 20.80 195, 235, 263Group 10 39–41 22.50 160, 235, 272Group 11 42–44 26.80 181
triazine residues are virtually impossible to extract from en-vironmental samples presumably because of an interactionwith humic acids particularly at strongly acidic pH. However,since the natural soil pH is either weakly acidic or weakly al-kaline, some doubts still persist about triazine binding to soilorganic matter[33].
In order to determine the sensitivity of the techniqueand its appropriateness for environmental behaviour andpollution monitoring studies, limits of detection (LODs)
Fc
of the USE–GC–MS procedure were determined testingdecreasing concentrations of analytes spiked on soil un-til obtaining a signal/noise ratio of 3 (S/N 3). Limitsof quantitation (LOQs) were derived from LODs to givea S/N of 10. LODs in the low- to sub-ppb (�g kg−1)level were obtained ranging from 0.05 to 7.00�g kg−1,which can be mainly attributed to the excellent sensi-tivity and selectivity widely recognised to mass spectro-metry.
ig. 2. GC–MS total ion chromatogram (SIM mode) obtained from the analysonditions.Note: Desethylatrazine and dimethoate concentration is 10 times h
is of a spiked soil at 50�g kg−1 concentration level after USE using the optimisedigher whereas�-chlordane is 10 times lower. For peak assignment refer toTable 2.
C.G
onca
lves,M
.F.Alp
en
du
rad
a/Ta
lan
ta6
5(2
00
5)
11
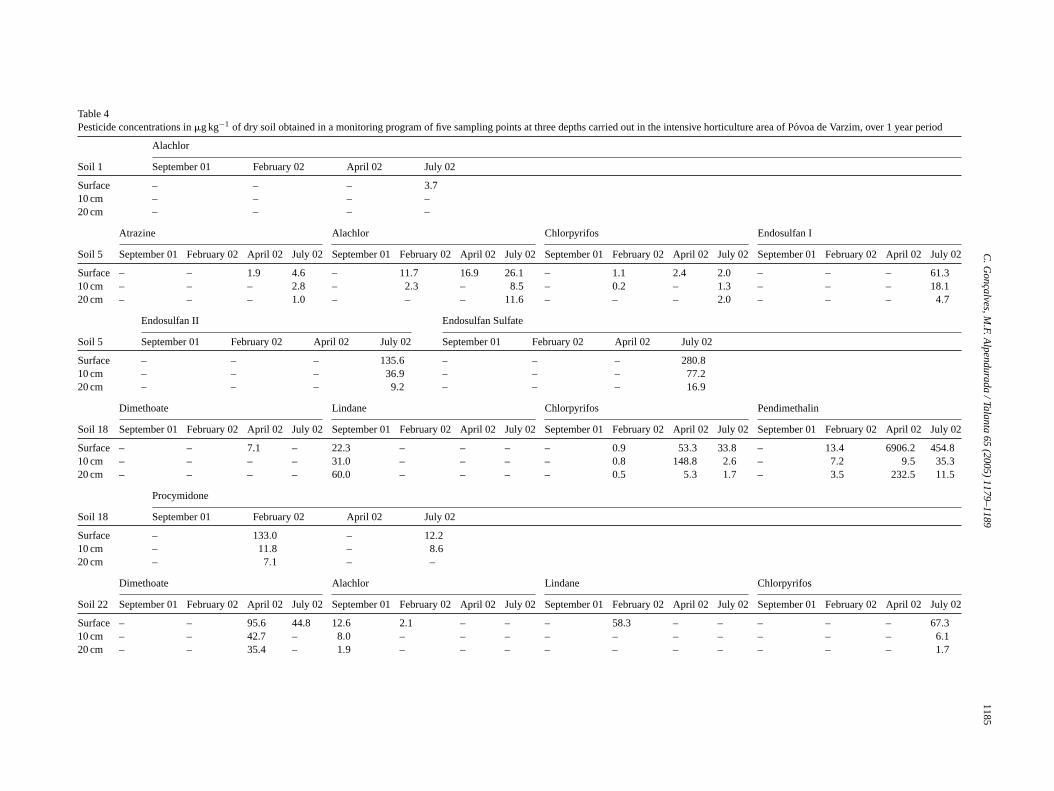
Table 4Pesticide concentrations in�g kg−1 of dry soil obtained in a monitoring program of five sampling points at three depths carried out in the intensive horticulture area of Povoa de Varzim, over 1 year period
Alachlor
Soil 1 September 01 February 02 April 02 July 02
Surface – – – 3.710 cm – – – –20 cm – – – –
Atrazine Alachlor Chlorpyrifos Endosulfan I
Soil 5 September 01 February 02 April 02 July 02 September 01 February 02 April 02 July 02 September 01 February 02 April 02 July 02 September 01 February 02 April 02 July 02
Surface – – 1.9 4.6 – 11.7 16.9 26.1 – 1.1 2.4 2.0 – – – 61.310 cm – – – 2.8 – 2.3 – 8.5 – 0.2 – 1.3 – – – 18.120 cm – – – 1.0 – – – 11.6 – – – 2.0 – – – 4.7
Endosulfan II Endosulfan Sulfate
Soil 5 September 01 February 02 April 02 July 02 September 01 February 02 April 02 July 02
Surface – – – 135.6 – – – 280.810 cm – – – 36.9 – – – 77.220 cm – – – 9.2 – – – 16.9
Dimethoate Lindane Chlorpyrifos Pendimethalin
Soil 18 September 01 February 02 April 02 July 02 September 01 February 02 April 02 July 02 September 01 February 02 April 02 July 02 September 01 February02 April 02 July 02
Surface – – 7.1 – 22.3 – – – – 0.9 53.3 33.8 – 13.4 6906.2 454.810 cm – – – – 31.0 – – – – 0.8 148.8 2.6 – 7.2 9.5 35.320 cm – – – – 60.0 – – – – 0.5 5.3 1.7 – 3.5 232.5 11.5
Procymidone
79
–1
18
91185
Soil 18 September 01 February 02 April 02 July 02
Surface – 133.0 – 12.210 cm – 11.8 – 8.620 cm – 7.1 – –
Dimethoate Alachlor Lindane Chlorpyrifos
Soil 22 September 01 February 02 April 02 July 02 September 01 February 02 April 02 July 02 September 01 February 02 April 02 July 02 September 01 February02 April 02 July 02
Surface – – 95.6 44.8 12.6 2.1 – – – 58.3 – – – – – 67.310 cm – – 42.7 – 8.0 – – – – – – – – – – 6.120 cm – – 35.4 – 1.9 – – – – – – – – – – 1.7
1186 C. Goncalves, M.F. Alpendurada / Talanta 65 (2005) 1179–1189
Tabl
e4
(Co
ntin
ue
d)
Chl
orfe
nvin
phos
Pen
dim
etha
linP
rocy
mid
one
Die
ldrin
Soi
l22
Sep
tem
ber
01F
ebru
ary
02A
pril
02Ju
ly02
Sep
tem
ber
01F
ebru
ary
02A
pril
02Ju
ly02
Sep
tem
ber
01F
ebru
ary
02A
pril
02Ju
ly02
Sep
tem
ber
01F
ebru
ary
02A
pril
02Ju
ly02
Sur
face
––
––
––
2.9
1.6
––
–11.6
279.
329
7.6
132.
943
5.3
10cm
1.4
––
––
–2.
0–
––
–9
.130
9.6
331.
725
4.7
465.
520
cm–
––
––
–2.
6–
––
––
279.
314
7.1
235.
440
7.5
End
osul
fan
IIaE
ndos
ulfa
nS
ulfa
te4,
4′ -DD
E4,
4′ -D
DD
Soi
l22
Sep
tem
ber
01F
ebru
ary
02A
pril
02Ju
ly02
Sep
tem
ber
01F
ebru
ary
02A
pril
02Ju
ly02
Sep
tem
ber
01F
ebru
ary
02A
pril
02Ju
ly02
Sep
tem
ber
01F
ebru
ary
02A
pril
02Ju
ly02
Sur
face
18.2
35.1
19.7
20.2
65.3
155.6
86.9
136.
917
.012
.67.1
22.5
4.3
7.4
2.9
9.2
10cm
13.4
18.5
20.9
21.6
67.3
104.4
109.
214
9.1
15.5
15.3
11.2
24.0
6.0
6.0
4.0
8.4
20cm
13.6
7.110
.815
.541
.738.
061
.011
1.6
12.2
10.6
10.8
20.0
3.9
3.0
3.1
6.8
Des
ethy
latr
azin
eA
traz
ine
Ala
chlo
r
Soi
l25
Sep
tem
ber
01F
ebru
ary
02A
pril
02Ju
ly02
Sep
tem
ber
01F
ebru
ary
02A
pril
02Ju
ly02
Sep
tem
ber
01F
ebru
ary
02A
pril
02Ju
ly02
Sur
face
12.2
––
–85
.44.
111
.85.2
6010
092
7.822
5.2
10.4
10cm
3.7–
–10
.842.2
11.4
–76
.183
41.0
300.
25.
930
0.3
20cm
––
––
8.27.
2–
3.8
2985
.08.
37.
411
.9a
Alth
ough
endo
sulfa
nIw
asde
tect
edin
soil
22it
coul
dno
tbe
quan
tified
,thu
son
lyth
een
dosu
lfan
IIis
omer
was
repo
rted
.
Method calibration was then conducted using spiked soilstandards at different calibration levels: 1.0, 5.0, 10, 50, and100�g kg−1 and the blank, injected in triplicate. The determi-nation coefficients presented inTable 2confirm the excellentlinearity between analytical signal and analyte concentration.It should be noted, however, that since the data treatment wascarried out in the MSD ChemStation, Data Analysis Appli-cation ver. G1701DA (Agilent Technologies, Palo Alto, CA,USA) replicates at each concentration level were first aver-aged and then applied a linear regression. This way, coeffi-cients of determination (r2) appear somehow better (roundedto three decimal places) even though the remaining linear re-gression coefficients are the same as keeping replicates sepa-rate.Fig. 2shows a chromatogram of a 50�g kg−1 spiked soilstandard where the peaks have been numbered as assigned inTable 2.
From the chromatographic point of view the method pre-sented herein does not require a clean-up step of the soilextracts which was evident from the absence of interferingpeaks in the blanks and uncontaminated samples. Thougha few matrix peaks exist they do not hamper identifica-tion and quantitation of pesticides. Chromatographic reso-lution was not also affected for a long period of time. Theonly shortcoming exists when calculating recoveries, whichwould probably benefit of injecting a cleaner extract. Nev-e uiva-l careh soilm
3
s in-c atersV for2 ry 3m idest fate.T soilw entc ers. Ap ed inS
sedh Newc soila l stan-d
arer
aset rted.S oil 5w tiona pyri-
rtheless, calibration with matrix-matched standards eqent to real soil samples minimizes errors and specialas only to be taken when analysing quite differentatrices.
.3. Monitoring program
The present method was applied to real soil sampleluded in a monitoring program of soil and groundwamples from an intensive horticulture area in Povoa dearzim, North Portugal. This program will be extendedyears with a sampling schedule approximately eveonths. The main objective was to identify the pestic
hat were contaminating the soil, their quantities andhe location of sampling points was selected to includeith different composition, from sand to loam, and differrops such as vegetables, potatoes, corn, grass and othre-treatment of all samples was employed as describection2.Results from only four sampling dates will be discus
ere: September 2001, February, April and July 2002.alibration curves were created every time before thenalyses of each sampling event, and blanks and controards at 10�g kg−1 level were analysed ensemble.
Pesticide concentrations in soils over 1 year periodeported inTable 4.
Results below the method quantitation limits or in the che pesticide identity could not be confirmed are not repoampling point no. 1 was a very low contaminated site. Sas moderately contaminated with the herbicide formulatrazine and alachlor. There were found traces of chlor
C. Goncalves, M.F. Alpendurada / Talanta 65 (2005) 1179–1189 1187
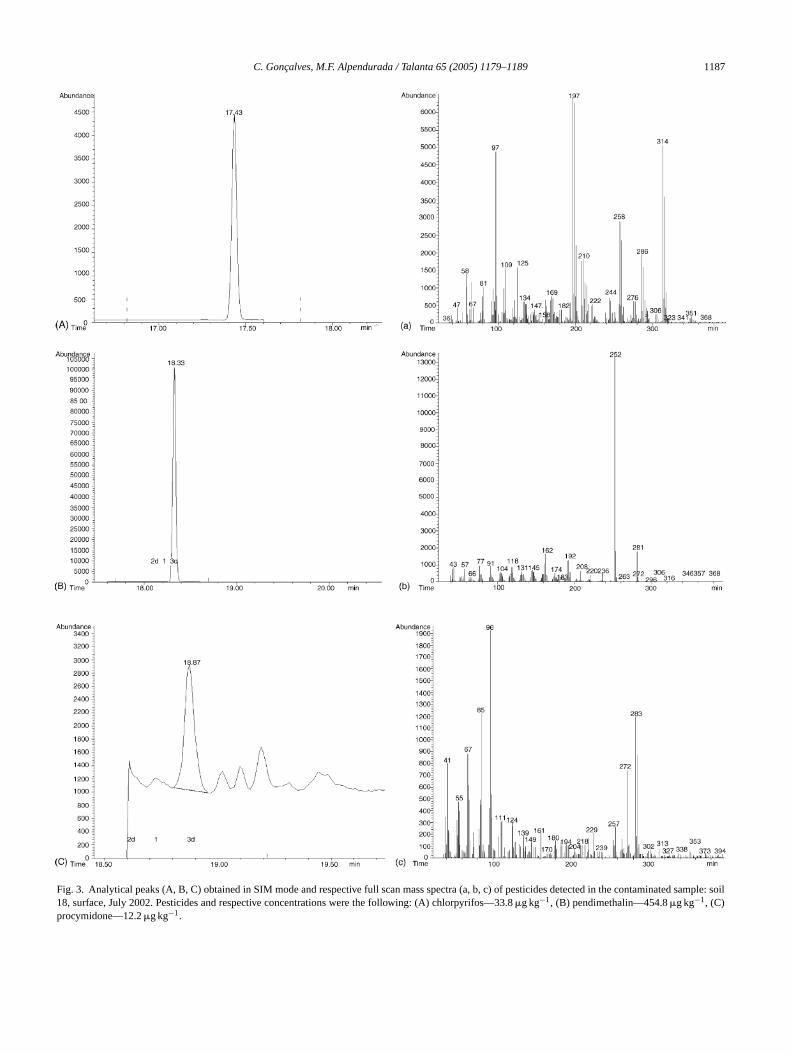
Fig. 3. Analytical peaks (A, B, C) obtained in SIM mode and respective full scan mass spectra (a, b, c) of pesticides detected in the contaminated sample: soil18, surface, July 2002. Pesticides and respective concentrations were the following: (A) chlorpyrifos—33.8�g kg−1, (B) pendimethalin—454.8�g kg−1, (C)procymidone—12.2�g kg−1.
1188 C. Goncalves, M.F. Alpendurada / Talanta 65 (2005) 1179–1189
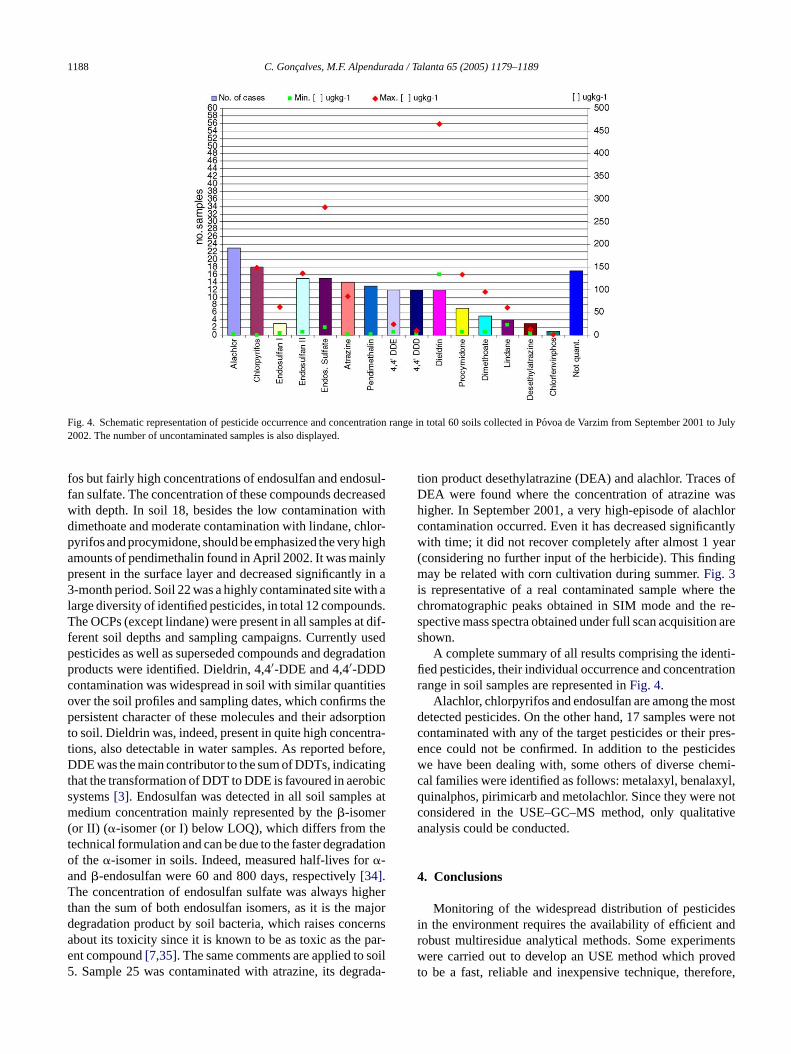
Fig. 4. Schematic representation of pesticide occurrence and concentration range in total 60 soils collected in Povoa de Varzim from September 2001 to July2002. The number of uncontaminated samples is also displayed.
fos but fairly high concentrations of endosulfan and endosul-fan sulfate. The concentration of these compounds decreasedwith depth. In soil 18, besides the low contamination withdimethoate and moderate contamination with lindane, chlor-pyrifos and procymidone, should be emphasized the very highamounts of pendimethalin found in April 2002. It was mainlypresent in the surface layer and decreased significantly in a3-month period. Soil 22 was a highly contaminated site with alarge diversity of identified pesticides, in total 12 compounds.The OCPs (except lindane) were present in all samples at dif-ferent soil depths and sampling campaigns. Currently usedpesticides as well as superseded compounds and degradationproducts were identified. Dieldrin, 4,4′-DDE and 4,4′-DDDcontamination was widespread in soil with similar quantitiesover the soil profiles and sampling dates, which confirms thepersistent character of these molecules and their adsorptionto soil. Dieldrin was, indeed, present in quite high concentra-tions, also detectable in water samples. As reported before,DDE was the main contributor to the sum of DDTs, indicatingthat the transformation of DDT to DDE is favoured in aerobicsystems[3]. Endosulfan was detected in all soil samples atmedium concentration mainly represented by the�-isomer(or II) (�-isomer (or I) below LOQ), which differs from thetechnical formulation and can be due to the faster degradationof the �-isomer in soils. Indeed, measured half-lives for�-aT ighert ajord ernsa par-e soil5 rada-
tion product desethylatrazine (DEA) and alachlor. Traces ofDEA were found where the concentration of atrazine washigher. In September 2001, a very high-episode of alachlorcontamination occurred. Even it has decreased significantlywith time; it did not recover completely after almost 1 year(considering no further input of the herbicide). This findingmay be related with corn cultivation during summer.Fig. 3is representative of a real contaminated sample where thechromatographic peaks obtained in SIM mode and the re-spective mass spectra obtained under full scan acquisition areshown.
A complete summary of all results comprising the identi-fied pesticides, their individual occurrence and concentrationrange in soil samples are represented inFig. 4.
Alachlor, chlorpyrifos and endosulfan are among the mostdetected pesticides. On the other hand, 17 samples were notcontaminated with any of the target pesticides or their pres-ence could not be confirmed. In addition to the pesticideswe have been dealing with, some others of diverse chemi-cal families were identified as follows: metalaxyl, benalaxyl,quinalphos, pirimicarb and metolachlor. Since they were notconsidered in the USE–GC–MS method, only qualitativeanalysis could be conducted.
4
esi andr entsw vedt fore,
nd�-endosulfan were 60 and 800 days, respectively[34].he concentration of endosulfan sulfate was always h
han the sum of both endosulfan isomers, as it is the megradation product by soil bacteria, which raises concbout its toxicity since it is known to be as toxic as thent compound[7,35]. The same comments are applied to. Sample 25 was contaminated with atrazine, its deg
. Conclusions
Monitoring of the widespread distribution of pesticidn the environment requires the availability of efficientobust multiresidue analytical methods. Some experimere carried out to develop an USE method which pro
o be a fast, reliable and inexpensive technique, there
C. Goncalves, M.F. Alpendurada / Talanta 65 (2005) 1179–1189 1189
more applicable to routine analysis than the existing conven-tional techniques. The sensitivity and precision were excel-lent, added of confirmation capabilities, however, care shouldbe taken in the calibration to encompass a similar matrix tothe samples. Although not automated, simultaneous extrac-tion of up to eight samples can be easily handled. Solventconsumption is reduced, taking into account the large num-ber of compounds analysed with a single procedure.
The above-referred method was applied in a monitoringprogram of sand- and loam-type soils from Povoa de Varzim,Portugal. The main contaminants that were identified insoils from this region comprise old persistent compounds,currently used herbicides and insecticides, and degradationproducts. In total, 19 compounds were identified. The mostubiquitous compounds were alachlor (38% of the samples),chlorpyrifos (30%), endosulfan (25%), endosulfan sulfate(25%), atrazine (23%) and pendimethalin (22%). Twenty-eight percent of the samples were not contaminated with anyof the pesticides studied. Very high contamination levels,around 7 and 60 mg kg−1, were found for pendimethalin andalachlor, respectively. Recent contamination predominantlyaffected surface layers of the soil whereas old persistent con-tamination was more dispersed in the soil profile. Since onintensive culture areas soil horizons are frequently disturbed,the understanding of the results may become difficult. Thesea yearsw icsi rentb soils.
A
c-k 99.T ndfi rki-d ofT ts onv tos,R int l-t l-e
R
A
, M.
[3] P. Manirakiza, A. Covaci, S. Andries, P. Schepens, Intern. J. Environ.Anal. Chem. 81 (2001) 25.
[4] S. Navarro, J. Oliva, A. Barba, C. Garcia, J. AOAC Int. 83 (5) (2000)1239.
[5] A.M. Carro, R.A. Lorenzo, Analyst 126 (2001) 1005.[6] D.A. Azevedo, S. Lacorte, T. Vinhas, P. Viana, D. Barcelo, J. Chro-
matogr. A 879 (2000) 13.[7] L.C. Luchini, T.B. Peres, M.M. de Andrea, J. Environ. Sci. Health
B35 (1) (2000) 51.[8] US EPA method 3540, US Government Printing Office, Washington,
USA, 1995.[9] AOAC methods 963.15, Association of Official Analytical Chemists,
USA, 1990.[10] M.D. Luque de Castro, L.E. Garcia-Ayuso, Anal. Chim. Acta 369
(1998) 1.[11] V. Lopez Avila, R. Young, J. Benedicto, P. Ho, R. Kim, Anal. Chem.
67 (1995) 2096.[12] S.B. Hawthorne, Y. Yang, D.J. Miller, Anal. Chem. 66 (1994)
2912.[13] C. Goncalves, M. de Rezende Pinto, M.F. Alpendurada, J. Liq. Chro-
matogr. Related Technol. 24 (19) (2001) 2943.[14] B.E. Richter, B.A. Jones, J.L. Ezzel, N.L. Porter, Anal. Chem. 68
(1996) 1033.[15] J. Gan, S.K. Papiernik, W.C. Koskinen, S.R. Yates, Environ. Sci.
Technol. 33 (1999) 3249.[16] A. Hubert, K.D. Wenzel, M. Manz, L. Weissflog, W. Engewald, G.
Schuurman, Anal. Chem. 72 (2000) 1294.[17] R.E. Johnsen, R.I. Starr, J. Agric. Food Chem. 20 (1967) 48.[18] U.S. EPA, Ultrasonic Extraction, Test Methods for Evaluating Solid
Waste, Method 3550C, Revision 3, US Environmental Protection
[ . 72
[[ 363
[ . 72
[ 999)
[[[[ 99)
[ AC
[ desdam,
[ an(5/6)
[ , J.
[ hro-
[ 5.[ 74)
[
re partial conclusions and the data gathered along 2ill allow a more clear understanding of pesticides dynam
n soil, as well as its prevalence and degradation. A diffeehaviour could be roughly observed in sandy and loam
cknowledgements
Fundac¸ao para Ciencia e Tecnologia (FCT) is greatly anowledged for the Ph.D. grant PRAXIS XXI/BD/21823/he authors would like to thank the IAREN for technical anancial support. We are also grateful to Prof. E.P. Mouou, Pesticide Science Laboratory, Aristotle Universityhessaloniki, for her assistance and useful commenalidation aspects of the USE–GC–MS method. A. Maegiao Agraria da Povoa de Varzim is thanked for his help
he collection of samples and Direcc¸ao Regional de Agricuura entre Douro e Minho (DRAEDM) is greatly acknowdged for the soil analyses.
eferences
[1] A. Navalon, A. Prieto, L. Araujo, J.L. Vilchez, J. Chromatogr.946 (2002) 239.
[2] I. Silgoner, R. Krska, E. Lombas, O. Gans, E. RosenbergGrasserbauer, Fresenius J. Anal. Chem. 362 (1998) 120.
Agency, Washington, D.C., November 2000.19] F. Hernandez, J. Beltran, F.J. Lopez, J.V. Gaspar, Anal. Chem
(2000) 2313.20] R-A. Doong, P-L. Liao, J. Chromatogr. A 918 (2001) 177.21] W.F. Ng, M.J.K. Teo, H.A. Lakso, Fresenius J. Anal. Chem.
(1999) 673.22] F. Hernandez, J. Beltran, F.J. Lopez, J.V. Gaspar, Anal. Chem
(2000) 2313.23] M. Moder, P. Popp, R. Eisert, J. Pawliszyn, Anal. Chem. 363 (1
680.24] F.E. Ahmed, TrAC Trends. Anal. Chem. 20 (11) (2001) 649.25] L. Sun, H.K. Lee, J. Chromatogr. A 1014 (2003) 165.26] G. Shen, H.K. Lee, J. Chromatogr. A 985 (2003) 167.27] P. Mogadati, J.B. Louis, J.D. Rosen, J. AOAC Int. 82 (3) (19
705.28] E. Papadopoulou-Mourkidou, J. Patsias, A. Kotopoulou, J. AO
Int. 80 (2) (1997) 447.29] D. Barcelo, M.-C. Hennion, Trace Determination of Pestici
and their Degradation Products in Water, Elsevier, Amster1997.
30] C. Molins, E.A. Hogendoorn, H.A.G. Heusinkveld, A.C. vBeuzekom, P. van Zoonen, R.A. Baumann, Chromatographia 48(1998) 450.
31] H. Mol, M. Althuizen, H. Janssen, C. Cramers, U. BrinkmanHigh Resolut. Chromatogr. 19 (1996) 69.
32] D.D. Erney, T.M. Pawlowski, C.F. Poole, J. High Resolut. Cmatogr. 20 (1997) 375.
33] H. Prosen, L. Zupancic-Kralj, Chromatographia 51 (2000) S1534] D.K.R. Stewart, K.G. Cairns, J. Agric. Food Chem. 22 (19
984.35] WHO, Environmental Health Criteria: Endosulfan, 1984.
Related Documents