is publication is made possible by the generous support of the American people through the United States Agency for International Development (USAID) under the terms of the Cooperative Agreement AID-OAA-A-11-00031 (e SPRING Project), managed by the John Snow Research and Training Institute, Inc. (JSI) . e contents are the responsibility of JSI, and do not necessarily reflect the views of USAID or the United States Government. Assessment of Nutrition Assessment, Counseling, and Support (NACS) Services in Southwestern Uganda July 2013

Welcome message from author
This document is posted to help you gain knowledge. Please leave a comment to let me know what you think about it! Share it to your friends and learn new things together.
Transcript

This publication is made possible by the generous support of the American people through the United States Agency for International Development (USAID) under the terms of the Cooperative Agreement AID-OAA-A-11-00031 (The SPRING Project), managed by the John Snow Research and Training Institute, Inc. (JSI) .
The contents are the responsibility of JSI, and do not necessarily reflect the views of USAID or the United States Government.
Assessment of Nutrition Assessment, Counseling, and Support (NACS) Services in Southwestern Uganda
July 2013

ACKNOWLEDGEMENTSThe Strengthening Partnerships, Results and Innovations in Nutrition Globally (SPRING) project team would like to express our thanks to the individuals who contributed to the development, pre-testing and finalization of the tools that were used for this assessment. The data collectors, data analysts, and all those who reviewed this report are particularly recognized for their involvement and contributions.
We would also like to extend thanks to the Ministry of Health and the NACS Technical Working Group members for their leadership and continued support throughout the preparatory stages of the assessment, data collection and validation of the findings.
Finally, special thanks go to the district and sub-county officials, medical directors and superintendents, health center in-charges, and health workers in Mbarara, Ibanda, Sheema, Ntungamo, Rukungiri, Kanungu, Kabale, Kisoro and Bushenyi districts. Your contributions and support are greatly appreciated.
RECOMMENDED CITATIONNekatebeb H, Mokori A, Kappos K, Pomeroy A, Kyenkya M, D’Agostino A, and Wamuyu, MG. 2013. Report on Findings from an Assessment of Nutrition Assessment, Counseling, and Support (NACS) Services in Southwestern Uganda. Washington DC: USAID/ Strengthening Partnerships, Results and Innovations in Nutrition Globally (SPRING) Project.
ABOUT SPRINGThe Strengthening Partnerships, Results, and Innovations in Nutrition Globally Project, SPRING, is a five-year USAID-funded Cooperative Agreement to strengthen global and country efforts to scale up high impact nutrition practices and policies and improve maternal and child nutrition outcomes. The project is managed by the John Snow Research & Training Institute, Inc., with partners, Helen Keller International, the Manoff Group, Save the Children, and the International Food Policy Research Institute. SPRING provides state-of-the-art technical support and focuses on the prevention of stunting and maternal and child anemia in the first 1,000 days of life.
DISCLAIMERThis assessment is made possible by the generous support of the American people through the United States Agency for International Development (USAID) under the terms of the Cooperative Agreement AID-OAA-A-11-00031 (The SPRING Project), managed by the John Snow Research & Training Institute, Inc. (JSI). The contents are the responsibility of JSI, and do not necessarily reflect the views of USAID or the United States Government.
Cover photo: Kristen Kappos, courtesy of the SPRING Project, September 2012
June 2013 III
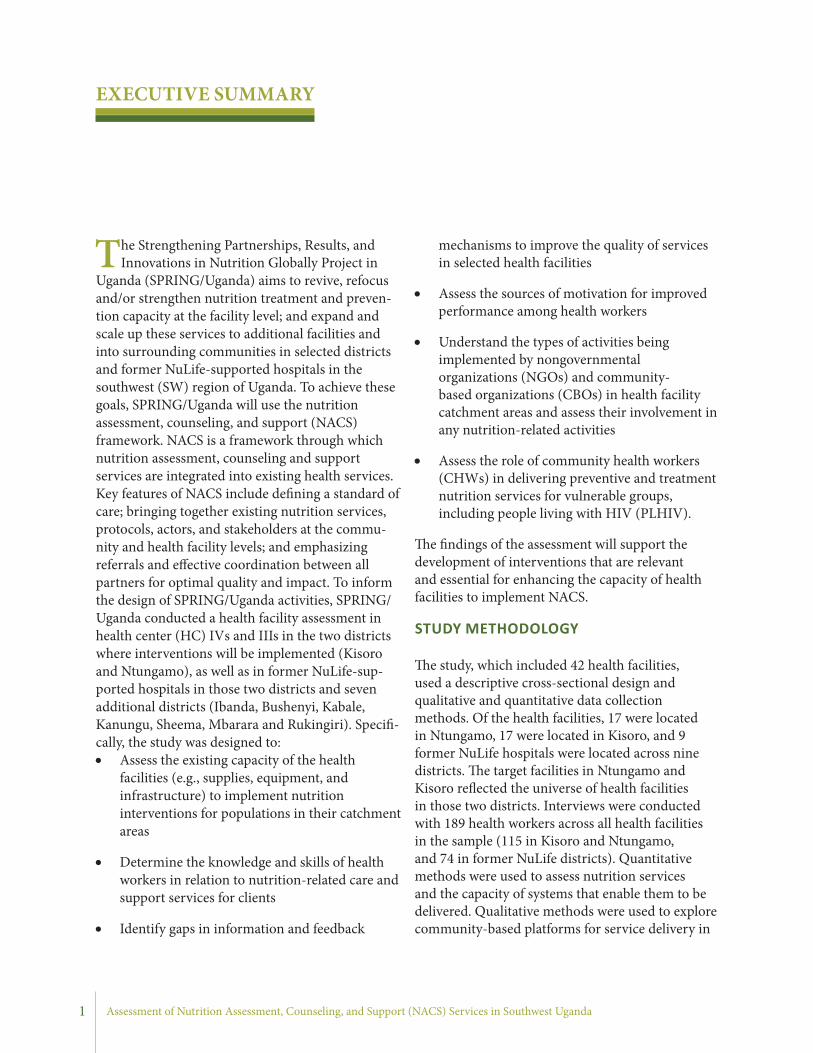
EXECUTIVE SUMMARY .............................................................................................................................................................. 1
CHAPTER I: INTRODUCTION .................................................................................................................................................... 8
1.1 NUTRITION SITUATION IN UGANDA ................................................................................................................................ 8
1.2 HIV AND AIDS IN UGANDA ................................................................................................................................................... 8
1.3 RESPONSES TO NUTRITION AND AIDS CRISES IN UGANDA .................................................................................... 8
1.4 SPRING IN UGANDA ................................................................................................................................................................. 9
1.5 RATIONALE FOR THE ASSESSMENT .................................................................................................................................. 10
1.6 OBJECTIVES ................................................................................................................................................................................ 10
CHAPTER 2: METHODOLOGY ................................................................................................................................................. 11
2.1 DESIGN ......................................................................................................................................................................................... 11
2.2 STUDY AREAS ............................................................................................................................................................................ 11
2.3 DATA COLLECTION METHODS ........................................................................................................................................... 11
2.4 SAMPLING OF STUDY SITES AND PARTICIPANTS ....................................................................................................... 13
2.5 DATA ANALYSIS ........................................................................................................................................................................ 14
2.6 QUALITY ASSURANCE AND CONTROL PLAN ............................................................................................................... 15
2.7 ETHICAL CONSIDERATIONS ................................................................................................................................................ 15
2.8 IMPLEMENTATION OF THE ASSESSMENT AND THE MANAGEMENT PLAN ..................................................... 16
2.9 STUDY LIMITATIONS .............................................................................................................................................................. 16
CHAPTER 3: KEY FINDINGS ..................................................................................................................................................... 17
3.1 HEALTH FACILITIES ................................................................................................................................................................ 17
3.2 HEALTH WORKFORCE ........................................................................................................................................................... 19
3.3 BASIC INFRASTRUCTURE...................................................................................................................................................... 23
3.4 HEALTH WORKERS NUMBERS AND TRAINING ........................................................................................................... 26
3.5 NUTRITION ASSESSMENT ..................................................................................................................................................... 28
3.6 NUTRITION STATUS CLASSIFICATION ............................................................................................................................ 31
3.7 NUMBER OF DAYS NUTRITIONAL ASSESSMENT AVAILABLE .................................................................................. 32
3.8 DOCUMENTATION OF NUTRITION INFORMATION .................................................................................................. 33
3.9 EQUIPMENT AND TOOLS FOR NUTRITION ASSESSMENT ....................................................................................... 37
3.10 NUTRITION COUNSELING ................................................................................................................................................... 38
3.11 PROTOCOLS AND COUNSELING MATERIALS .............................................................................................................. 43
3.12 NUTRITION SUPPORT: ESSENTIAL NUTRITION SUPPLIES AND DRUGS ............................................................. 45
3.13 FREQUENCY OF MEETINGS HELD BY HEALTH FACILITIES ..................................................................................... 53
3.14 USE OF HEALTH MANAGEMENT INFORMATION SYSTEM (HMIS) ....................................................................... 53
Table of Contents

IV
TABLE OF CONTENTS
3.15 QUALITY ASSURANCE SYSTEM AND QUALITY IMPROVEMENT ACTIVITIES .................................................. 56
3.16 TYPES OF INCENTIVES PROVIDED TO HEALTH WORKERS .................................................................................... 60
3.17 PROVISION OF TECHNICAL SUPPORT SUPERVISION TO HEALTH WORKERS ................................................. 63
3.18 AREAS OF FOCUS FOR NGOS AND CBOS ........................................................................................................................ 65
3.19 AVAILABILITY OF COMMUNITY HEALTH WORKERS ................................................................................................ 67
3.20 HEALTH SERVICES PROVIDED BY THE COMMUNITY-BASED HEALTH WORKERS OR VOLUNTEERS .... 68
3.21 PREVENTIVE HEALTH TOPICS COVERED BY COMMUNITY-BASED HEALTH VOLUNTEERS ..................... 69
3.22 REFERRAL LINKAGES BETWEEN FACILITIES AND COMMUNITIES ...................................................................... 70
3.23 TRAINING RECEIVED BY COMMUNITY HEALTH VOLUNTEERS .......................................................................... 71
3.24 BENEFICIARIES OF THE TRAINING CONDUCTED BY HEALTH FACILITIES ...................................................... 73
3.25 TRAINING OF VHTS ................................................................................................................................................................ 73
3.26 MEETING BETWEEN HEALTH FACILITIES AND COMMUNITY-BASED HEALTH WORKERS ....................... 73
3.27 INTER-FACILITY CLIENT REFERRALS .............................................................................................................................. 73
3.28 PROPORTION OF HEALTH FACILITIES WITH SYSTEMS FOR INDIVIDUAL CLIENT APPOINTMENTS ..... 75
3.29 AVAILABILITY OF COMMUNITY HEALTH WORKERS ................................................................................................ 75
3.30 HEALTH SERVICES PROVIDED BY COMMUNITY-BASED HEALTH WORKERS OR VOLUNTEERS .............. 77
3.31 PREVENTIVE HEALTH TOPICS COVERED BY COMMUNITY-BASED HEALTH VOLUNTEERS ..................... 77
3.32 REFERRAL LINKAGES BETWEEN FACILITIES AND COMMUNITIES ...................................................................... 78
3.33 TRAINING RECEIVED BY COMMUNITY HEALTH VOLUNTEERS .......................................................................... 78
3.34 MEETING BETWEEN HEALTH FACILITIES AND COMMUNITY-BASED HEALTH WORKERS ....................... 78
3.35 INTER-FACILITY CLIENT REFERRALS .............................................................................................................................. 78
CHAPTER 4: SUMMARY OF KEY FINDINGS AND DISCUSSION ..................................................................................... 80
4.1 HEALTH WORKFORCE ........................................................................................................................................................... 80
4.2 BASIC INFRASTRUCTURE...................................................................................................................................................... 80
4.3 NUTRITION CAPACITY .......................................................................................................................................................... 81
4.4 NACS SERVICES ......................................................................................................................................................................... 81
4.5 DOCUMENTATION OF NUTRITION DATA/INFORMATION ..................................................................................... 84
4.6 QUALITY ASSURANCE AND IMPROVEMENT ................................................................................................................ 84
4.7 SUPPORTIVE MANAGEMENT FOR HEALTH CARE PROVIDERS ............................................................................. 85
4.8 METHODS TO SOLICIT CLIENTS’ OPINIONS ................................................................................................................. 85
4.9 COMMUNITY-BASED SERVICES .......................................................................................................................................... 86
4.10 REFERRAL LINKAGES ............................................................................................................................................................. 86
CHAPTER 5: CONCLUSION ...................................................................................................................................................... 87
WORKS CITED ............................................................................................................................................................................ 88
APPENDIX 1: LIST OF COUNSELING BEST PRACTICES TRACKED IN FACILITY ASSESSMENT ................................ 89
Assessment of Nutrition Assessment, Counseling, and Support (NACS) Services in Southwest Uganda

VJune 2013
Abbreviations and Acronyms
AIDS acquired immunodeficiency syndromeANC antenatal careART antiretroviral therapyBFHI Baby Friendly Hospital InitiativeBMI body mass index CBO community-based organizationCHW community health workerEGPAF Elizabeth Glaser Pediatric AIDS Foundation EID early infant diagnosisENA essential nutrition actionsEPI Expanded Program on ImmunizationHC health centerHIV human immunodeficiency virusHMIS health management information systemIFA iron and folic acidIMAM integrated management of acute malnutritionIMCI integrated management of childhood illnessIYCF infant and young child feedingJSI JSI Research & Training Institute, Inc.MOH Ministry of Health (Uganda)MUAC mid-upper arm circumferenceNACS nutrition assessment, counseling, and supportNGO nongovernmental organizationOB/GYN obstetrician and gynecologistOPD outpatient departmentPEPFAR U.S. President’s Emergency Plan for AIDS ReliefPLHIV people living with HIVPMTCT prevention of mother-to-child transmissionQA quality assuranceQI quality improvementRUTF ready-to-use therapeutic foodSPRING Strengthening Partnerships, Results and Innovations in Nutrition GloballySW SouthwestTB tuberculosisUSAID U.S. Agency for International DevelopmentWASH water, sanitation, and hygieneVHT village health teamYCC young child clinics
ABBREVIATIONS AND ACRONYMS
1 Assessment of Nutrition Assessment, Counseling, and Support (NACS) Services in Southwest Uganda
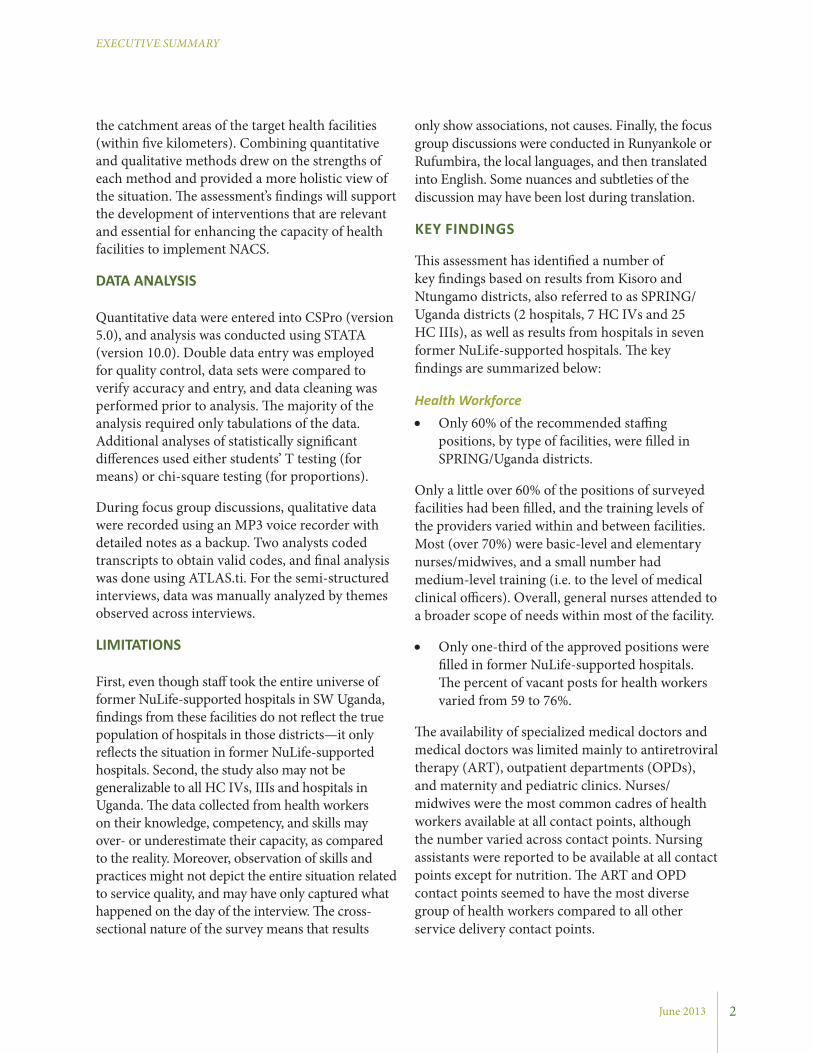
EXECUTIVE SUMMARY
The Strengthening Partnerships, Results, and Innovations in Nutrition Globally Project in
Uganda (SPRING/Uganda) aims to revive, refocus and/or strengthen nutrition treatment and preven-tion capacity at the facility level; and expand and scale up these services to additional facilities and into surrounding communities in selected districts and former NuLife-supported hospitals in the southwest (SW) region of Uganda. To achieve these goals, SPRING/Uganda will use the nutrition assessment, counseling, and support (NACS) framework. NACS is a framework through which nutrition assessment, counseling and support services are integrated into existing health services. Key features of NACS include defining a standard of care; bringing together existing nutrition services, protocols, actors, and stakeholders at the commu-nity and health facility levels; and emphasizing referrals and effective coordination between all partners for optimal quality and impact. To inform the design of SPRING/Uganda activities, SPRING/Uganda conducted a health facility assessment in health center (HC) IVs and IIIs in the two districts where interventions will be implemented (Kisoro and Ntungamo), as well as in former NuLife-sup-ported hospitals in those two districts and seven additional districts (Ibanda, Bushenyi, Kabale, Kanungu, Sheema, Mbarara and Rukingiri). Specifi-cally, the study was designed to:• Assess the existing capacity of the health
facilities (e.g., supplies, equipment, and infrastructure) to implement nutrition interventions for populations in their catchment areas
• Determine the knowledge and skills of health workers in relation to nutrition-related care and support services for clients
• Identify gaps in information and feedback
mechanisms to improve the quality of services in selected health facilities
• Assess the sources of motivation for improved performance among health workers
• Understand the types of activities being implemented by nongovernmental organizations (NGOs) and community-based organizations (CBOs) in health facility catchment areas and assess their involvement in any nutrition-related activities
• Assess the role of community health workers (CHWs) in delivering preventive and treatment nutrition services for vulnerable groups, including people living with HIV (PLHIV).
The findings of the assessment will support the development of interventions that are relevant and essential for enhancing the capacity of health facilities to implement NACS.
STUDY METHODOLOGY
The study, which included 42 health facilities, used a descriptive cross-sectional design and qualitative and quantitative data collection methods. Of the health facilities, 17 were located in Ntungamo, 17 were located in Kisoro, and 9 former NuLife hospitals were located across nine districts. The target facilities in Ntungamo and Kisoro reflected the universe of health facilities in those two districts. Interviews were conducted with 189 health workers across all health facilities in the sample (115 in Kisoro and Ntungamo, and 74 in former NuLife districts). Quantitative methods were used to assess nutrition services and the capacity of systems that enable them to be delivered. Qualitative methods were used to explore community-based platforms for service delivery in
EXECUTIVE SUMMARY
2June 2013
the catchment areas of the target health facilities (within five kilometers). Combining quantitative and qualitative methods drew on the strengths of each method and provided a more holistic view of the situation. The assessment’s findings will support the development of interventions that are relevant and essential for enhancing the capacity of health facilities to implement NACS.
DATA ANALYSIS
Quantitative data were entered into CSPro (version 5.0), and analysis was conducted using STATA (version 10.0). Double data entry was employed for quality control, data sets were compared to verify accuracy and entry, and data cleaning was performed prior to analysis. The majority of the analysis required only tabulations of the data. Additional analyses of statistically significant differences used either students’ T testing (for means) or chi-square testing (for proportions).
During focus group discussions, qualitative data were recorded using an MP3 voice recorder with detailed notes as a backup. Two analysts coded transcripts to obtain valid codes, and final analysis was done using ATLAS.ti. For the semi-structured interviews, data was manually analyzed by themes observed across interviews.
LIMITATIONS
First, even though staff took the entire universe of former NuLife-supported hospitals in SW Uganda, findings from these facilities do not reflect the true population of hospitals in those districts—it only reflects the situation in former NuLife-supported hospitals. Second, the study also may not be generalizable to all HC IVs, IIIs and hospitals in Uganda. The data collected from health workers on their knowledge, competency, and skills may over- or underestimate their capacity, as compared to the reality. Moreover, observation of skills and practices might not depict the entire situation related to service quality, and may have only captured what happened on the day of the interview. The cross-sectional nature of the survey means that results
only show associations, not causes. Finally, the focus group discussions were conducted in Runyankole or Rufumbira, the local languages, and then translated into English. Some nuances and subtleties of the discussion may have been lost during translation.
KEY FINDINGS
This assessment has identified a number of key findings based on results from Kisoro and Ntungamo districts, also referred to as SPRING/Uganda districts (2 hospitals, 7 HC IVs and 25 HC IIIs), as well as results from hospitals in seven former NuLife-supported hospitals. The key findings are summarized below:
Health Workforce• Only 60% of the recommended staffing
positions, by type of facilities, were filled in SPRING/Uganda districts.
Only a little over 60% of the positions of surveyed facilities had been filled, and the training levels of the providers varied within and between facilities. Most (over 70%) were basic-level and elementary nurses/midwives, and a small number had medium-level training (i.e. to the level of medical clinical officers). Overall, general nurses attended to a broader scope of needs within most of the facility.
• Only one-third of the approved positions were filled in former NuLife-supported hospitals. The percent of vacant posts for health workers varied from 59 to 76%.
The availability of specialized medical doctors and medical doctors was limited mainly to antiretroviral therapy (ART), outpatient departments (OPDs), and maternity and pediatric clinics. Nurses/midwives were the most common cadres of health workers available at all contact points, although the number varied across contact points. Nursing assistants were reported to be available at all contact points except for nutrition. The ART and OPD contact points seemed to have the most diverse group of health workers compared to all other service delivery contact points.

EXECUTIVE SUMMARY
3 Assessment of Nutrition Assessment, Counseling, and Support (NACS) Services in Southwest Uganda
Basic Infrastructure• Basic infrastructure index showed a decreasing
trend by type of facilities in SPRING/Uganda districts.
The survey looked at selected basic infrastructure indicators relevant to nutrition services. Accordingly, the result of the survey showed a higher index for hospitals (3.7) compared to HC IVs (2.9) and HC IIIs (1.0). When this is disaggregated by infrastructure indicators, for example, all of the assessed the hospitals had an uninterrupted water supply while only 71% and 80% of the HC IVs and HC IIIs, respectively, reported an uninterrupted water supply.
As the availability of water affects quality of health and nutrition services, understanding the status of health facilities in this regard is relevant while developing nutrition care plans to be implemented by different levels of health facilities in SPRING/Uganda intervention areas.
• Basic infrastructure index showed an average of 3.9 for all former NuLife-supported hospitals.
The result of the survey showed an average index of 3.9 with a range of 3.6 to 4.5. Almost 90% of facilities used a generator as the major source of power, 55% used a mixed means of communication with higher rate of use of facility-based communication, and 78% of these facilities reported water was “available always.”
Nutrition Capacity • Nutrition capacity in SPRING/Uganda districts
varied by qualification: health workers with a higher level of qualification were found to have a higher level of nutrition knowledge compared to those with middle- and lower-level qualifications.
Higher-level health providers receive a wide range of nutrition knowledge through pre-service training, although nurse/midwife staff lead other groups in receiving in-service training. As nutrition services are provided by a wide range of providers,
it is necessary to evaluate the existing education curricula to prepare an integrated nutrition curriculum during the basic education, together with post-graduate education for physicians, nurses, and others.
A capacity building plan should be developed at the district level to identify key practitioners implementing actual day-to-day nutrition services for better targeting of in-service training.
• Nutrition capacity in former NuLife-supported hospitals varied by qualification: health workers with middle and lower levels of qualification were found to receive more in-service training in nutrition compared to those with higher-level qualifications.
All specialized medical doctors and lab technicians reported receiving HIV-related training as in-service training. A greater proportion of nurses/midwives and nurse assistants received training on different topics, including NACS.
Nutrition Assessment, Counseling, and Support Services
Nutrition Assessment: • Methods of nutrition assessment varied by type
of health facilities and type of service contact points in SPRING/Uganda districts.
A more comprehensive nutrition assessment (dietary, clinical, anthropometric, and biochemical) across all service contact points was reported by hospitals (over 80%) compared to HC IVs (60%) and HC IIIs (40%) (mostly dietary and clinical). All facilities performed nutritional assessment relatively well at ART service contact points (90% for hospitals, 80% for HC IVs, and 55% for HC IIIs) compared to all other service contact points.
Assessing nutritional status can be relatively simple, especially basic exams (such as appraising mucosa, pallor, or goiter; inquiring about diet or night blindness; and taking weight or mid-upper arm circumference [MUAC]), and can be easily incorporated into any exam with little additional
June 2013
3. KEY FINDINGS
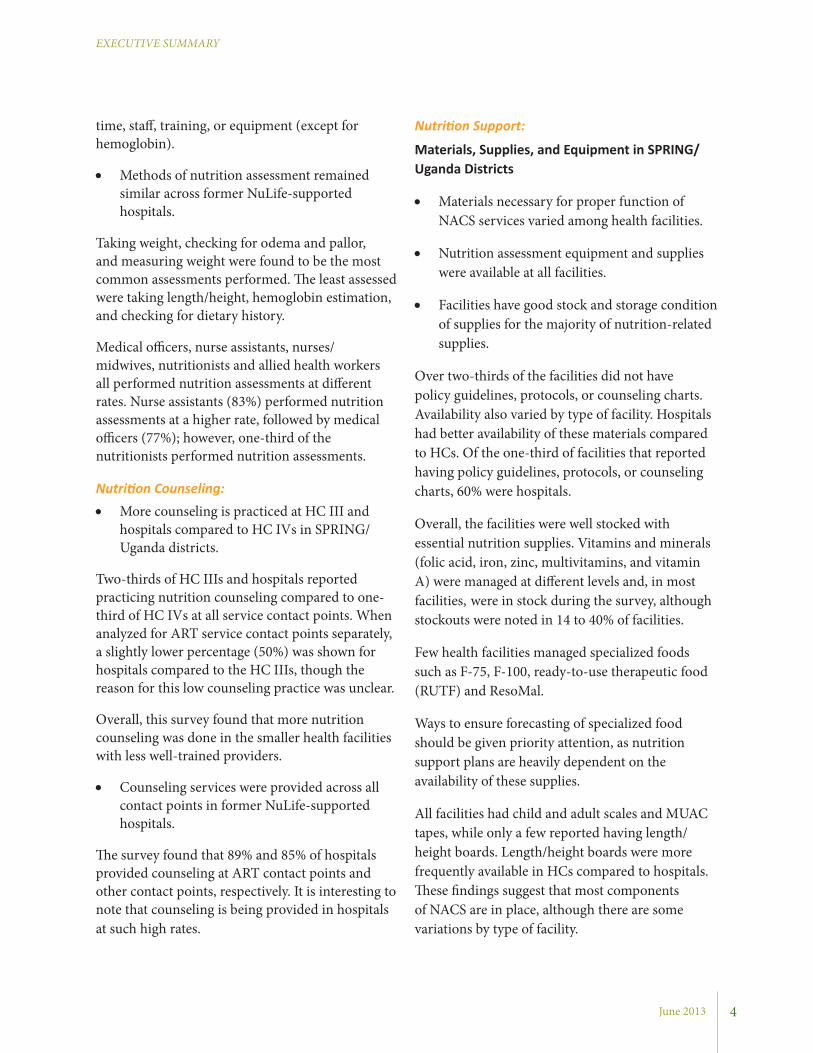
Nutrition Support:
Materials, Supplies, and Equipment in SPRING/Uganda Districts
• Materials necessary for proper function of NACS services varied among health facilities.
• Nutrition assessment equipment and supplies were available at all facilities.
• Facilities have good stock and storage condition of supplies for the majority of nutrition-related supplies.
Over two-thirds of the facilities did not have policy guidelines, protocols, or counseling charts. Availability also varied by type of facility. Hospitals had better availability of these materials compared to HCs. Of the one-third of facilities that reported having policy guidelines, protocols, or counseling charts, 60% were hospitals.
Overall, the facilities were well stocked with essential nutrition supplies. Vitamins and minerals (folic acid, iron, zinc, multivitamins, and vitamin A) were managed at different levels and, in most facilities, were in stock during the survey, although stockouts were noted in 14 to 40% of facilities.
Few health facilities managed specialized foods such as F-75, F-100, ready-to-use therapeutic food (RUTF) and ResoMal.
Ways to ensure forecasting of specialized food should be given priority attention, as nutrition support plans are heavily dependent on the availability of these supplies.
All facilities had child and adult scales and MUAC tapes, while only a few reported having length/height boards. Length/height boards were more frequently available in HCs compared to hospitals. These findings suggest that most components of NACS are in place, although there are some variations by type of facility.
time, staff, training, or equipment (except for hemoglobin).
• Methods of nutrition assessment remained similar across former NuLife-supported hospitals.
Taking weight, checking for odema and pallor, and measuring weight were found to be the most common assessments performed. The least assessed were taking length/height, hemoglobin estimation, and checking for dietary history.
Medical officers, nurse assistants, nurses/midwives, nutritionists and allied health workers all performed nutrition assessments at different rates. Nurse assistants (83%) performed nutrition assessments at a higher rate, followed by medical officers (77%); however, one-third of the nutritionists performed nutrition assessments.
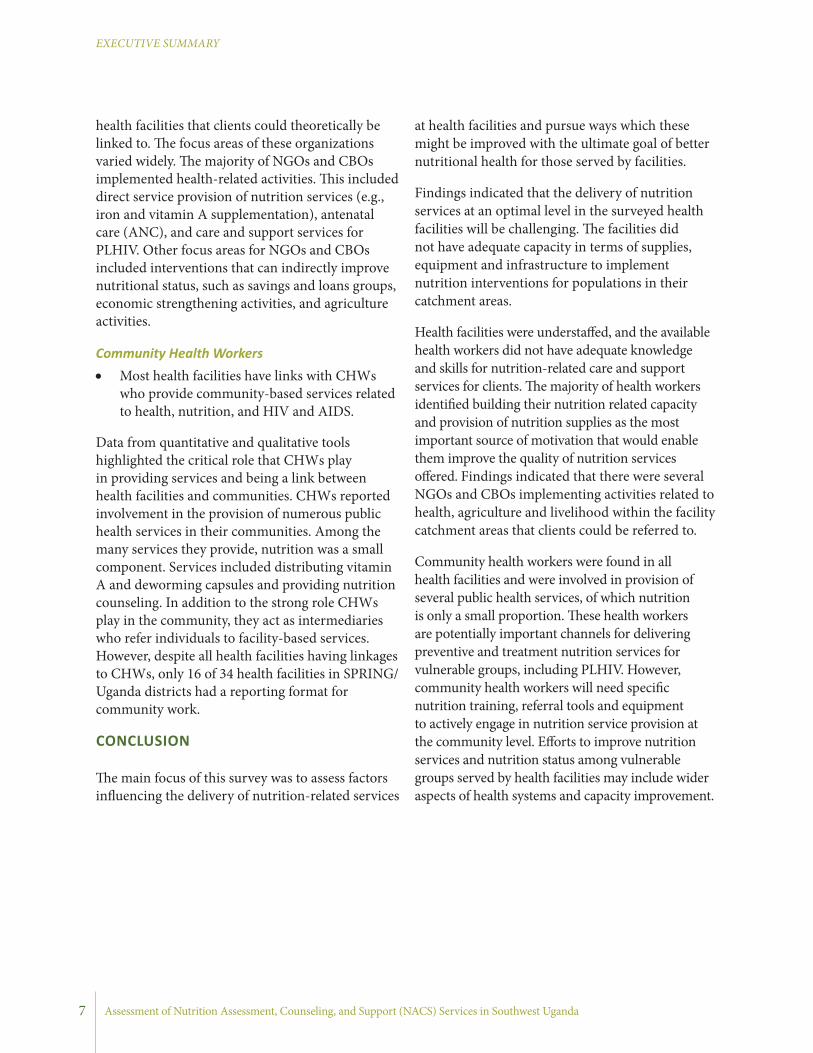
Nutrition Counseling:• More counseling is practiced at HC III and
hospitals compared to HC IVs in SPRING/Uganda districts.
Two-thirds of HC IIIs and hospitals reported practicing nutrition counseling compared to one-third of HC IVs at all service contact points. When analyzed for ART service contact points separately, a slightly lower percentage (50%) was shown for hospitals compared to the HC IIIs, though the reason for this low counseling practice was unclear.
Overall, this survey found that more nutrition counseling was done in the smaller health facilities with less well-trained providers.
• Counseling services were provided across all contact points in former NuLife-supported hospitals.
The survey found that 89% and 85% of hospitals provided counseling at ART contact points and other contact points, respectively. It is interesting to note that counseling is being provided in hospitals at such high rates.
4
EXECUTIVE SUMMARY

Assessment of Nutrition Assessment, Counseling, and Support (NACS) Services in Southwest Uganda
3. KEY FINDINGS
there was variation by service type) that when facilities recorded nutrition information, it was recorded either in patient registers, client cards, client records, or child health cards. Most clients seemed to have health cards in their possession, and providers appeared to have good recordkeeping practices in place (e.g. registries). Building on this practice, indicators needed to track performance of NACS at facilities should be defined and negotiated for incorporation.
• Nutrition assessment indicators are mostly recoded compared to nutrition counseling services in former NuLife-supported hospitals.
Among the different nutrition information gathered, MUAC, weight, length/height, and body mass index (BMI)-for-age z-scores were commonly included in records at each contact point. Documentation appeared generally weak for other services of NACS. Client cards, patient registers, and clinical reports were found to be the most common documents where nutrition information was recorded. Use of child health cards was higher for ART clinics compared to all combined services sites.
Quality Assurance and Improvement• Most facilities in the SPRING/Uganda districts
implement one (out of four) or more than one quality assurance (QA) activities.
• Most facilities in the SPRING/Uganda districts implement quality improvement (QI) activities (the 5S method) to improve quality of services.
Findings from the survey showed that QA and QI activities are being implemented in most of the health facilities assessed (100% of hospitals, 80% of HC IVs, and 88% of HC IIIs). The main QA activities at the hospital level were supervisory checklists for health system components and facility-wide review of mortality rates. Both levels of HCs (80%) used audits, medical records, and supervisory checklists for health service provision as their main QA activities. Of all health facilities assessed, 80% of HC IVs implemented the 5S
Materials, Supplies, and Equipment in Former NuLife-Supported Hospitals
• Materials supporting nutrition counseling were available in only half of the hospitals assessed
• Nutrition assessment equipment and supplies were available at all hospitals assessed
• Hospitals had good stock levels of and storage conditions for nutrition supplies.
Averaged for all services, the availability of guidelines and counseling tools was still below 50%, though use has been reported to be high for all available guidelines and tools. Availability of nutrition tools and equipment were almost uniform by contact points. More MUAC tapes were reported at all sites compared to weighing scales and measuring boards. The availability of essential nutrition supplies showed that all supplies were in stock at the day of the survey, including theraputic food supplies. A few supplies, such as F-75, F-100, and combined mineral and vitamin mixes, were identified to be minimally stocked compared to other supplies. Availability of stock almost related to the availability and use of stock cards to update status. Supplies with no stock cards were less available (F-75, F-100, zinc gluconate, Resomal, and CMV) compared with other drugs with stock cards in use.
Documentation of Nutrition Data/Information • Reported documentation of nutrition
information varied widely by service and facility type in SPRING/Uganda districts.
The survey assessed whether providers recorded nutrition information, including MUAC, length/height, weight, anthropometric indicators, hemoglobin, pallor and edema across all service contact points. For example, MUAC was recorded by 80% of hospitals, 19% of HC IVs, and 7% of HC IIIs. Weight was recorded by 10% of hospitals, 69% of HC IVs, and 44% of HC IIIs. Length/height was recorded by 20% of hospitals, and less than 10% of HC IVs and HC IIIs. Results showed (although
5
EXECUTIVE SUMMARY

June 2013
3. KEY FINDINGS
Nearly all hospitals (nine) arranged technical supportive supervision to their health workers on a monthly basis. The most common providers were facility in-charges, senior staff, and NGOs. The contents of the technical supervision were mainly focused on availability of supplies, checking records or reports, and observing and providing feedback on performance.
Methods to Solicit Clients’ Opinions• Methods used to solicit clients’ opinions varied
by the type of facility in SPRING/Uganda districts.
Systems for determining clients’ opinions were available at 50% of hospitals, 83% of HC IVs, and 65% of HC IIIs. Of the methods used to solicit opinions, 50% of hospitals used suggestion boxes, 67% of HC IVs used informal discussions with clients, and 46% of HC IIIs used official meetings with community leaders. Middle- and lower-level facilities mostly used interactive methods (meetings with community leaders and discussion with clients) to determine clients’ opinions, while none of these methods were reported by hospitals.
• Suggestion boxes are the most common way of collecting clients’ opinions in former NuLife- supported hospitals.
Half of the hospitals reported availability of a system for determining clients’ opinions. These hospitals mostly used a suggestion box as a method to collect clients’ opinions and reported making changes in their programs/services as result of feedback.
Community-Based Services• There are numerous NGOs and CBOs that
clients can be linked to for improved nutrition outcomes.
The NACS approach aims to link individuals to community-based interventions that can help improve their food security and nutritional status. The survey found that there were numerous NGOs and CBOs operating in the catchment areas of the
method (sort, set in order, shine, standardize, and sustain), while only 35% of HC IIIs and none of the hospitals did. SPRING/Uganda will build on this experience to ensure QI activities are extended to the key contact points for provision of standardized quality nutrition services.
• Different types of QA activities were reported as being implemented in former Nulife- supported hospitals.
Different types of QA activities were reported as being implemented at the hospitals. The main methods used were a supervisory checklist of health components, a facility-wide review of mortality, staff reports, and auditing of medical records. Of all hospitals, 50% had an active QA system and a committee at the time of the assessment.
Supportive Management for Health Care Providers• Supportive management systems for health
workers are fairly strong in the assessed health facilities.
Among the surveyed facilities, hospitals reported more frequent technical support on a weekly and monthly basis while most HCs reported receiving quarterly technical supervisory visits. The technical supervisory support was provided by internal and external staff in hospitals and HC IVs, while HC IIIs reported mainly having external supervision. These facilities received relatively regular supervision, which may be a result of having a routine staff supervision plan by external supervisors. Most of the interviewed facility in-charges reported that providers received job descriptions, job appraisals, and salary supplements, which they felt could motivate health workers and maintain their technical competencies. The most commonly used non-monetary incentives were granting access to medical services with discounts and arranging training opportunities.
• Supportive management systems for former NuLife-supported hospitals is strong.
6
EXECUTIVE SUMMARY
Assessment of Nutrition Assessment, Counseling, and Support (NACS) Services in Southwest Uganda
3. KEY FINDINGS
at health facilities and pursue ways which these might be improved with the ultimate goal of better nutritional health for those served by facilities.
Findings indicated that the delivery of nutrition services at an optimal level in the surveyed health facilities will be challenging. The facilities did not have adequate capacity in terms of supplies, equipment and infrastructure to implement nutrition interventions for populations in their catchment areas.
Health facilities were understaffed, and the available health workers did not have adequate knowledge and skills for nutrition-related care and support services for clients. The majority of health workers identified building their nutrition related capacity and provision of nutrition supplies as the most important source of motivation that would enable them improve the quality of nutrition services offered. Findings indicated that there were several NGOs and CBOs implementing activities related to health, agriculture and livelihood within the facility catchment areas that clients could be referred to.
Community health workers were found in all health facilities and were involved in provision of several public health services, of which nutrition is only a small proportion. These health workers are potentially important channels for delivering preventive and treatment nutrition services for vulnerable groups, including PLHIV. However, community health workers will need specific nutrition training, referral tools and equipment to actively engage in nutrition service provision at the community level. Efforts to improve nutrition services and nutrition status among vulnerable groups served by health facilities may include wider aspects of health systems and capacity improvement.
health facilities that clients could theoretically be linked to. The focus areas of these organizations varied widely. The majority of NGOs and CBOs implemented health-related activities. This included direct service provision of nutrition services (e.g., iron and vitamin A supplementation), antenatal care (ANC), and care and support services for PLHIV. Other focus areas for NGOs and CBOs included interventions that can indirectly improve nutritional status, such as savings and loans groups, economic strengthening activities, and agriculture activities.
Community Health Workers• Most health facilities have links with CHWs
who provide community-based services related to health, nutrition, and HIV and AIDS.
Data from quantitative and qualitative tools highlighted the critical role that CHWs play in providing services and being a link between health facilities and communities. CHWs reported involvement in the provision of numerous public health services in their communities. Among the many services they provide, nutrition was a small component. Services included distributing vitamin A and deworming capsules and providing nutrition counseling. In addition to the strong role CHWs play in the community, they act as intermediaries who refer individuals to facility-based services. However, despite all health facilities having linkages to CHWs, only 16 of 34 health facilities in SPRING/Uganda districts had a reporting format for community work.
CONCLUSION
The main focus of this survey was to assess factors influencing the delivery of nutrition-related services
7
EXECUTIVE SUMMARY
8May 2013
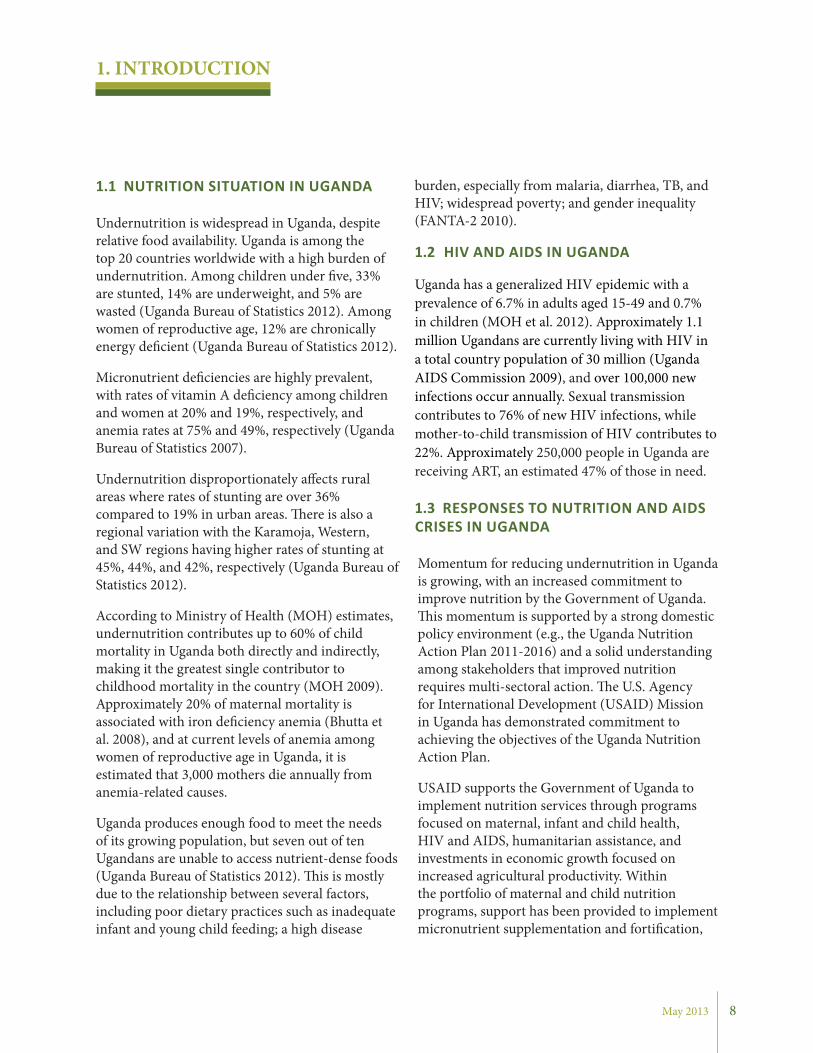
1.1 NUTRITION SITUATION IN UGANDA
Undernutrition is widespread in Uganda, despite relative food availability. Uganda is among the top 20 countries worldwide with a high burden of undernutrition. Among children under five, 33% are stunted, 14% are underweight, and 5% are wasted (Uganda Bureau of Statistics 2012). Among women of reproductive age, 12% are chronically energy deficient (Uganda Bureau of Statistics 2012).
Micronutrient deficiencies are highly prevalent, with rates of vitamin A deficiency among children and women at 20% and 19%, respectively, and anemia rates at 75% and 49%, respectively (Uganda Bureau of Statistics 2007).
Undernutrition disproportionately affects rural areas where rates of stunting are over 36% compared to 19% in urban areas. There is also a regional variation with the Karamoja, Western, and SW regions having higher rates of stunting at 45%, 44%, and 42%, respectively (Uganda Bureau of Statistics 2012).
According to Ministry of Health (MOH) estimates, undernutrition contributes up to 60% of child mortality in Uganda both directly and indirectly, making it the greatest single contributor to childhood mortality in the country (MOH 2009). Approximately 20% of maternal mortality is associated with iron deficiency anemia (Bhutta et al. 2008), and at current levels of anemia among women of reproductive age in Uganda, it is estimated that 3,000 mothers die annually from anemia-related causes.
Uganda produces enough food to meet the needs of its growing population, but seven out of ten Ugandans are unable to access nutrient-dense foods (Uganda Bureau of Statistics 2012). This is mostly due to the relationship between several factors, including poor dietary practices such as inadequate infant and young child feeding; a high disease
burden, especially from malaria, diarrhea, TB, and HIV; widespread poverty; and gender inequality (FANTA-2 2010).
1.2 HIV AND AIDS IN UGANDA
Uganda has a generalized HIV epidemic with a prevalence of 6.7% in adults aged 15-49 and 0.7% in children (MOH et al. 2012). Approximately 1.1 million Ugandans are currently living with HIV in a total country population of 30 million (Uganda AIDS Commission 2009), and over 100,000 new infections occur annually. Sexual transmission contributes to 76% of new HIV infections, while mother-to-child transmission of HIV contributes to 22%. Approximately 250,000 people in Uganda are receiving ART, an estimated 47% of those in need.
1.3 RESPONSES TO NUTRITION AND AIDS CRISES IN UGANDA
Momentum for reducing undernutrition in Uganda is growing, with an increased commitment to improve nutrition by the Government of Uganda. This momentum is supported by a strong domestic policy environment (e.g., the Uganda Nutrition Action Plan 2011-2016) and a solid understanding among stakeholders that improved nutrition requires multi-sectoral action. The U.S. Agency for International Development (USAID) Mission in Uganda has demonstrated commitment to achieving the objectives of the Uganda Nutrition Action Plan.
USAID supports the Government of Uganda to implement nutrition services through programs focused on maternal, infant and child health, HIV and AIDS, humanitarian assistance, and investments in economic growth focused on increased agricultural productivity. Within the portfolio of maternal and child nutrition programs, support has been provided to implement micronutrient supplementation and fortification,
1. INTRODUCTION

Assessment of Nutrition Assessment, Counseling, and Support (NACS) Services in Southwest Uganda
1. INTRODUCTION
9
1.4 SPRING IN UGANDA
SPRING is a USAID-funded five-year project that began October 1, 2011. It is implemented by five experienced nutrition and public health organizations: JSI Research & Training Institute, Inc. (JSI), the managing partner; Helen Keller International; the International Food Policy Research Institute; Save the Children; and the Manoff Group. SPRING facilitates the design and implementation of country-led nutrition strategies, providing targeted, state-of-the art technical support to ensure that high-quality multi-sectoral nutrition programs are taken to scale and that country capacity is increased.
In Uganda, SPRING supports the MOH and other partners to provide technical leadership and support in the development and integration of a full range of nutrition interventions into health care services, including HIV prevention, care, and support. The project focuses on increasing coverage, utilization of, and adherence to nutrition services, and improving the nutritional and health status of the general population in targeted areas. SPRING/Uganda also builds on current platforms to strengthen maternal, infant, and young child nutrition practices using materials that were developed by the former NuLife project, and by implementing a preventive nutrition strategy to reach a wide range of stakeholders and communities.
SPRING/Uganda uses the NACS approach to support nutrition through the continuum of care. NACS is a framework through which nutrition assessment, counseling and support services are integrated into existing health services. Key features of NACS include defining a standard of care; bringing together existing nutrition services, protocols, actors and stakeholders at the community and health facility levels; and emphasizing referrals and effective coordination between all partners for optimal quality and impact.
SPRING/Uganda also builds on the experiences of the former NuLife project by using the NACS approach and strengthening its implementation in SW Uganda. While several countries (including
nutrition services for PLHIV, orphans, and other vulnerable children, and improvement in infant and young child nutrition services.
In response to the HIV and AIDS crisis, the Government of Uganda, USAID, and partners have been fighting against the spread of HIV and other infectious diseases that undermine nutrition.
Through the U.S. President’s Emergency Plan for AIDS Relief (PEPFAR), Uganda has received financial assistance to support comprehensive HIV and AIDS prevention, treatment, and control programs.
HIV and AIDS activities include basic care and support, assistance to integrate TB and HIV programs, and providing high-quality clinical care for PLHIV (specifically in the management of opportunistic infections). The availability of ART for prevention of mother-to-child transmission (PMTCT) of HIV has been scaled up.
At the community level, PEPFAR links care and support activities to HIV prevention, care, and treatment centers by strengthening community- and faith-based organizations. These include awareness building among community leaders, support groups for PLHIV, home visits to families affected by HIV and AIDS, and monthly hygiene and care packets for PLHIV.
In addition, there have been efforts to integrate nutrition into HIV and AIDS care and support services at facilities. For example, NuLife, a former USAID-funded nutrition intervention project, supported the comprehensive integration of nutrition into HIV and AIDS care and treatment services in 54 health facilities (mainly hospitals).
Over three years, these health facilities assessed the nutritional status of more than 100,000 people, the majority of whom were PLHIV and children under the age of 18. Sustaining and scaling up such interventions is recognized as a priority due to the expansion of HIV treatment services with wider geographic coverage.

June 2013
2. BACKGROUND
10
Kenya and Malawi) have had success strengthening the facility component of this approach, few have been able to strengthen community facility linkages or place emphasis on prevention at the community level in such a way as to see impact (CORE Group 2012). USAID requested that SPRING/Uganda continue working in nine former NuLife-supported hospitals in SW Uganda, and scale up NACS services to HC IVs and HC IIIs in selected districts (Kisoro and Ntungamo), while providing community-wide preventive nutrition services. The health facility assessment was needed to inform the design of NACS in SW Uganda for the prevention and treatment of moderate and severe acute malnutrition among infants, young children, pregnant and lactating women, and adults (including PLHIV).
1.5 RATIONALE FOR THE ASSESSMENT
SPRING/Uganda aims to revive, refocus and/or strengthen nutrition treatment and prevention capacity at the facility level, and expand and scale up these services to additional facilities and into surrounding communities in selected districts in the SW region of Uganda. To inform the design of this work, SPRING/Uganda conducted an assessment of facilities in the two districts where interventions will take place (Kisoro and Ntungamo), as well as additional former NuLife hospitals outside those districts. The NuLife sites were included to assess the status of NACS implementation and identify ways of strengthening NACS to continue provision of treatment and preventive nutrition services. The findings of the assessment will support the development of SPRING/Uganda interventions that are relevant and essential for enhancing the capacity of health facilities to implement NACS.
1.6 OBJECTIVES
The main objective of this study was to better understand the current context related to the NACS framework programming in Kisoro and Ntungamo districts (and the former NuLife-supported hospitals) and to determine the availability of the required essential elements of nutrition services (assessment tools, counseling skills and tools, and availability of supplies such as micronutrient supplements, drugs, and therapeutic and supplementary foods) for adults and children in facilities at or above level III and at the community level.
Specific objectives included the following:
1. Assess the existing capacity of health facilities (e.g., supplies, equipment, and infrastructure) to implement nutrition interventions for populations in their catchment areas
2. Determine knowledge and skills of health workers in relation to nutrition-related care and support services for clients
3. Identify gaps in information and feedback mechanisms to improve quality of services in selected health facilities
4. Assess the sources of motivation for improved performance among health workers
5. Understand the types of activities being implemented by NGOs and CBOs in the health facility catchment areas, and assess if they are doing any nutrition-related activities;
6. Assess the role of CHWs in delivering preventive and treatment nutrition services for vulnerable groups, including PLHIV.
1. INTRODUCTION

Assessment of Nutrition Assessment, Counseling, and Support (NACS) Services in Southwest Uganda11
2.1 DESIGN
This was a descriptive cross-sectional study.
2.2 STUDY AREAS
The assessment had two distinct survey groups: the nine former NuLife-supported hospitals in SW Uganda (Table 2.1); all upper-level facilities (including all hospitals, HC IVs, and HC IIIs) in Ntungamo (Table 2.2) and Kisoro (Table 2.3) districts, where the roll-out of SPRING/Uganda activities will take place. Health facilities in the second subgroup all provided PMTCT and/or ART services with support from the Elizabeth Glaser Pediatric AIDS Foundation (EGPAF)’s Strengthening TB and AIDS Response in SW Uganda Project.
2.3 DATA COLLECTION METHODS
Both qualitative and quantitative data collection methods were utilized.
Quantitative data collection methods were used to assess nutrition services and the capacity of systems that enable them to be carried out. This included a health facility survey, a health worker survey, and an observation tool. The health facility survey covered the following topics: staff, management, patient referrals, availability of curative and care services (such as inpatient care), use of services, availability of nutrition supplies and equipment, and HIV and AIDS, ANC and nutrition services.
The health worker survey assessed knowledge, skills, practices, roles and responsibilities, and training related to HIV and AIDS, NACS, and nutrition services. The observation checklist was also used to assess the health workers’ service
2. METHODOLOGY
Former NuLife Sites
Health Facility District
Ibanda Hospital Ibanda
Ishaka Hospital Bushenyi
Itojo Hospital* Ntungamo
Kabale Regional Referral Hospital Kabale
Kambuga Hospital Kanungu
Kisoro Hospital* Kisoro
Kitagata Hospital Sheema
Mbarara Regional Referral Hospital Mbarara
Nyakibale Hospital Rukingiri*Also included in the SPRING/Uganda intervention area survey group due to geographic location.
Table 2.1: Former NuLife-Supported Hospitals for SPRING/Uganda

June 2013
delivery at key contact points at the facilities. These methods were geared at identifying whether there were existing gaps that affect the implementation of nutrition assessment, counseling, management skills, and knowledge of key nutrition and hygiene actions for improved nutrition status among infants and young children aged 0 to 24 months, pregnant and lactating women, and PLHIV.
Qualitative data collection methods were used to explore community-based platforms for service delivery in the catchment areas of the target health facilities (within five kilometers). This included semi-structured interviews with nongovernmental organizations (NGOs) and community-based organizations (CBOs); semi-structured interviews
with health facility in-charges to assess the quality of community outreach services; focus group discussions with village health teams (VHTs)1; and key informant interviews with district leaders. The semi-structured interview with facility in-charges assessed the performance of health facility community outreach services. This tool examined the types of services provided, the organizations to which they were provided, the training of community health workers, how the workers are engaged, and the best practices and challenges in implementing community outreach services. The semi-structured interviews with NGOs and CBOs assessed the organization’s activities, community mobilization, and program strategies, including linkages with health facilities with respect to
2. METHODOLOGY
Ntungamo District
Health Facility Type
Facilities with ART/PMTCT services (as per EGPAF)
County Sub-county
Butaare III PMTCT Ruhaama Ntungamo
Bwongyera III PMTCT Kajara Bwongyera
Kayonza III PMTCT Rushenyi Kayonza
Kitondo III PMTCT Kajara Ihunga
Ngoma III PMTCT Rushenyi Ngoma
Nyakyera III PMTCT Ruhaama Nyakyera
Rugarama III PMTCT Rushenyi Rugarama
Ruhaama III PMTCT Ruhaama Ruhaama
Rukoni III ART & PMTCT Kajara Kibatsi
Rweikiniro III PMTCT Rushenyi Rweikiniro
St. Francisca Rushooka III ART & PMTCT Rushenyi Kayonza
St. Lucia Kagamba III PMTCT Kajara Ihunga
Kitwe IV ART & PMTCT Ruhaama Rukoni East
Ntungamo IV ART & PMTCT Ntungamo Municipality Central division
Rubaare IV ART & PMTCT Rushenyi Rubaare
Rwashamaire IV ART & PMTCT Kajara Nyabihoko
12
1 Village health teams are groups of community health workers operating in SW Uganda. They are trained by the government to serve as the primary, village-level health contact points.
Table 2.2: Upper-Level Facilities Surveyed in Ntungamo District
Assessment of Nutrition Assessment, Counseling, and Support (NACS) Services in Southwest Uganda
3. KEY FINDINGS
essential nutrition and hygiene actions for infants and young children, pregnant and lactating mothers, and PLHIV. Focus group discussions helped to obtain information on the roles and responsibilities of community health workers to obtain information, their motivation for work, their perceptions on the quality of nutrition services provided at the health facilities, and linkages between health facilities and communities.
Combining quantitative and qualitative methods helped draw on the strengths of each method and provide a more holistic perspective of the situation.
2.4 SAMPLING OF STUDY SITES AND PARTICIPANTS
2.4.1 Facility
As stated previously, the assessment’s goal was to capture the current status of the nutrition services of two distinct survey groups: former NuLife-supported hospitals and all upper-level facilities (hospitals, HC IVs, and HC IIIs) in SPRING/Uganda’s intervention areas. All former NuLife-supported hospitals and upper-level facilities in
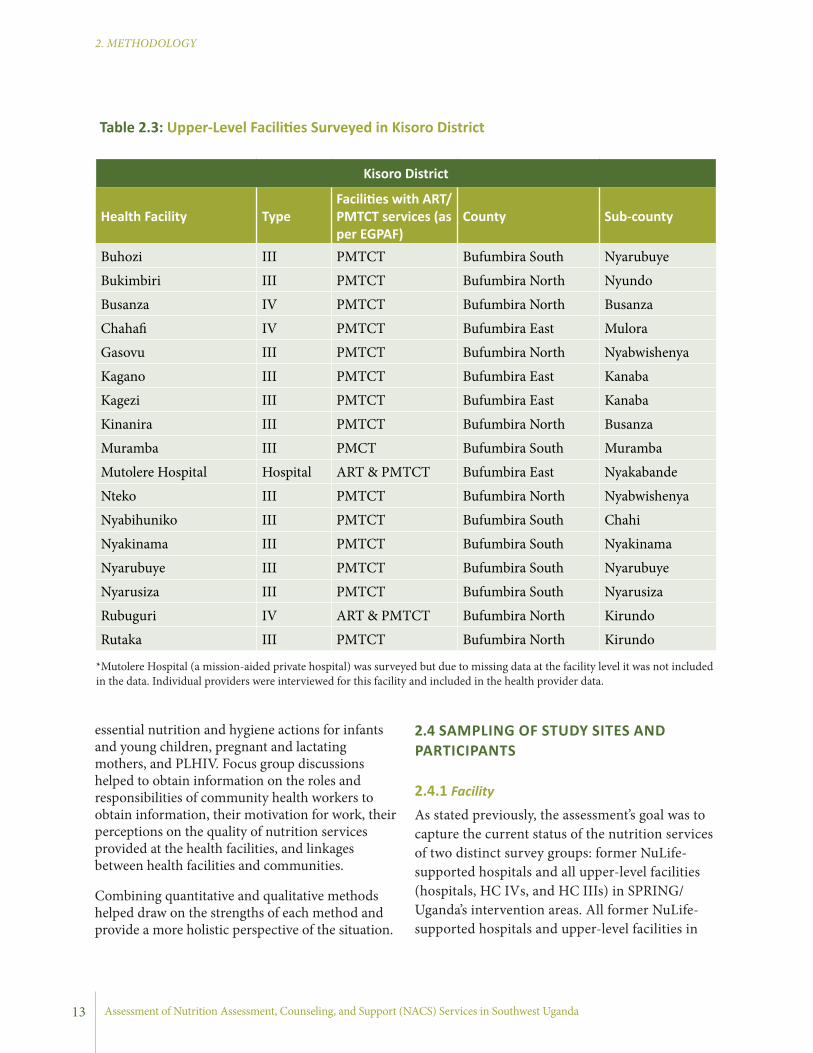
Table 2.3: Upper-Level Facilities Surveyed in Kisoro District
Kisoro District
Health Facility TypeFacilities with ART/PMTCT services (as per EGPAF)
County Sub-county
Buhozi III PMTCT Bufumbira South Nyarubuye
Bukimbiri III PMTCT Bufumbira North Nyundo
Busanza IV PMTCT Bufumbira North Busanza
Chahafi IV PMTCT Bufumbira East Mulora
Gasovu III PMTCT Bufumbira North Nyabwishenya
Kagano III PMTCT Bufumbira East Kanaba
Kagezi III PMTCT Bufumbira East Kanaba
Kinanira III PMTCT Bufumbira North Busanza
Muramba III PMCT Bufumbira South Muramba
Mutolere Hospital Hospital ART & PMTCT Bufumbira East Nyakabande
Nteko III PMTCT Bufumbira North Nyabwishenya
Nyabihuniko III PMTCT Bufumbira South Chahi
Nyakinama III PMTCT Bufumbira South Nyakinama
Nyarubuye III PMTCT Bufumbira South Nyarubuye
Nyarusiza III PMTCT Bufumbira South Nyarusiza
Rubuguri IV ART & PMTCT Bufumbira North Kirundo
Rutaka III PMTCT Bufumbira North Kirundo
*Mutolere Hospital (a mission-aided private hospital) was surveyed but due to missing data at the facility level it was not included in the data. Individual providers were interviewed for this facility and included in the health provider data.
13
2. METHODOLOGY

June 2013
3. KEY FINDINGS
the SPRING/Uganda intervention areas were selected, thus sampling was not required.
Current facility lists were obtained at the district level and were used to determine what the universe was for the intervention area group. Follow-up by data collectors ensured that all facilities were included in the survey. For all facilities, health facility in-charges were interviewed for both facility-based and community outreach services. They provided general information about the facility, management and administration, environment, feedback mechanisms, and performance of community outreach services.
For selection of additional health providers within each facility, the sampling method depended on whether the facility was a hospital or HC. The heads of departments that specialized in pediatric, nutrition, ANC, delivery and post-partum, OPD, well children, sick children, family planning, community services, infectious diseases and HIV and AIDS, and pharmaceutical services were also interviewed for information on NACS services provided to children and adults in their clinics. Selection of health workers for the study depended on their number and qualification. If, for example, a department was staffed by two or more persons of the same qualification (e.g., three nurses) one nurse was randomly selected to participate in the study. If a department was staffed by two or more persons of varied qualification (e.g., one physician, one nurse, and one midwife) all persons were interviewed.
For HC IVs and HC IIIs specifically, all health workers who were present and gave consent were interviewed. The number of health workers in a facility varied by type of health facility and therefore the targeted respondents were adjusted accordingly.
Overall, 34 observations of clients were conducted across 26 facilities. Sixteen of the observations took place in former NuLife-supported sites while 21 took place in SPRING/Uganda district facilities, for an overlap of three observations in the former NuLife-supported hospitals that are located in
SPRING/Uganda districts. The observations were done where PMTCT or ART clinics were open on the day of the survey. If the PMTCT or ART clinics were not open on the day the survey was conducted, in some instances the data collectors returned to the clinics to conduct the observations on another day. Clients for observations were randomly selected.
2.4.2 Community
The community aspects of this assessment focused on all nine districts. At the community level, semi-structured interviews were conducted with NGOs, CBOs, and CHWs operating within the health facility catchment area.
The research team prepared a list of NGOs, CBOs, and CHWs present in the catchment areas of the preselected health facilities based on a previously completed mapping exercise. The district community development officers also provided a list of all registered NGOs and CBOs operating in the districts visited. Organizations providing agriculture, nutrition, water and sanitation, health, and HIV and AIDS services were sampled for interviews. One key informant from each organization who had been at the organization for at least two years (or since the organization began, if the organization was established less than two years earlier) was interviewed.
The CHWs who were selected to participate in the study were those with experience working in nutrition and HIV and AIDS-related activities for at least two years. Health facility in-charges and community outreach in-charges identified active CHWs in the surrounding parishes and invited eight to participate in either of the two discussions held in each preselected health facility.
2.5 DATA ANALYSIS
2.5.1 Quantitative DataQuantitative data were entered by data entrants using statistical software (CSPro version 5.0). Data analysis was conducted using STATA 10.0.
14
2. METHODOLOGY
Assessment of Nutrition Assessment, Counseling, and Support (NACS) Services in Southwest Uganda
3. KEY FINDINGS
Double data entry was employed for quality control and data sets were compared to verify accuracy and entry. Data cleaning was performed prior to analysis of data and guided by pre-formulated key questions under each specific objective of the survey. The key questions were formulated to provide information capacities of facilities (in terms of infrastructure, supplies and equipment, and skilled health providers), methods for promoting quality of care, supervision mechanisms and capacity building mechanisms (coaching and mentoring). The majority of the analysis required tabulations of the data, with no weights needed as we captured the universe of facilities for our two survey groups. Additional analyses of statistically significant differences used either students’ T testing (for means) or chi-square testing (for proportions).
2.5.2 Qualitative DataFor the focus group discussions, data were recorded using an MP3 voice recorder; interviewers also took detailed notes as a backup. Transcripts of the interviews were made. Coding of the transcripts was conducted by two different people to obtain valid codes for the analysis. The final analysis was done using ATLAS.ti, and data were analyzed based on key thematic areas that described the roles and responsibilities of CHWs, their motivation for work, their perceptions of the quality of nutrition services provided at the health facilities, and linkages between health facilities and communities. For the semi-structured interviews with NGOs and CBOs, data was manually analyzed by summarizing key themes and issues observed across the interviews.
2.6 QUALITY ASSURANCE AND CONTROL PLAN
Survey teams implemented systematic quality assurance procedures to prevent unacceptable practices and to minimize errors in study design, data collection, entry, and analysis. Prior to the survey, the team made an effort to formulate the study questions and identified the best instruments
to collect the data. Interviewer’s manuals were also developed that defined each questionnaire to avoid errors in understanding, interpreting, and recording responses during data collection. The manuals were used during the training of data collectors and pretested along with survey instruments prior to the survey.
Each day, data collection was organized and followed up by team leaders to ensure that all information was captured and documented as intended. The survey lead also made an effort to ensure that the data collection team adhered to prescribed procedures to achieve the standards during the survey.
Upon completion of the survey, double data entry was employed and data sets were compared for accuracy of data entry. Data cleaning was performed to ensure consistency and completeness.
2.7 ETHICAL CONSIDERATIONS
The study’s protocol was approved by the Institutional Review Board of Makerere University School of Public Health and Uganda National Council of Science and Technology in Kampala. Letters of introduction were obtained from the MOH in Kampala.
Consent was also obtained from the district leadership (a Chief Administrative Officer) in each district visited during the assessment. Consent for the district, NGO/CBO, sub-county, health facility, and community members to participate in the study was obtained from each participant. Only those who consented took part in the study. They had the option to withdraw their participation at any time. Finally, permission was obtained from the semi-structured interview and focus group participants to be audio-recorded.
The data collected from the field was kept confidential and was only accessed by the research team. No names of informants or organizations were used without the consent or prior approval of the respondents.
15
2. METHODOLOGY

June 2013
3. KEY FINDINGS
2.9 STUDY LIMITATIONS
First, even though staff took the entire universe of former NuLife-supported sites in SW Uganda, findings from these facilities do not reflect the true population of facilities in those districts—they only reflect the situation in former NuLife-supported hospitals. Second, the study also may not be generalizable to all health facilities in Uganda.
The data collected from health workers on their knowledge, competency, and skills may over- or underestimate their capacity, as compared to the reality. Moreover, observation of skills and practices might not depict the entire situation related to quality of services, and may have only captured what happened on the day of the interview. The cross-sectional nature of the survey means results only show associations, but not causality. Finally, the focus group discussions were conducted in Runyankole or Rufumbira, and then translated into English. This may have resulted in some of the nuances and the subtleties being lost in translation.
2.8 IMPLEMENTATION OF THE ASSESSMENT AND THE MANAGEMENT PLAN
2.8.1 Recruitment and Training of the Research TeamSPRING/Uganda recruited 20 research assistants and three team leaders, all graduates in Human Nutrition, Medicine, Nursing, Community Development, and Social Sciences with experience in implementing health facility and community research. Two research assistants with experience in data entry and management were identified for transcription and data entry upon completion of the data collection phase. Research assistants understood and spoke Runyakitara and/or Rufumbira, the local languages.
The research team was trained by SPRING staff. The training consisted of a four-day classroom orientation in Kampala and a two-day field test in SW Uganda’s Mbarara and Sheema districts. The training oriented the research team to the SPRING/Uganda Project, the NACS approach, quantitative and qualitative research methods, the research protocol, and the study tools.
Facilitators led the research team through the tools to ensure that each question was well understood by each member of the team. The research team also divided into small groups to engage in mock exercises to increase familiarity and confidence in using them. The tools were refined during the training.
16
2. METHODOLOGY
The two-day pre-test further familiarized the research team with using the tools. The research team divided into three groups and visited health facilities to practice using each tool. Feedback was given by the facilitators for improving data collection methods and on the use of the tools. At the end of the training, the package of tools was refined based on the pre-test.
Assessment of Nutrition Assessment, Counseling, and Support (NACS) Services in Southwest Uganda
Objective 1: Assess the existing capacity of the health facilities (e.g., human resource supplies, equipment, and infrastructure) to implement nutrition interventions for populations in their catchment areas
3.1 HEALTH FACILITIES
3.1.1 Characteristics of the Health Facilities The summary of the features of the health facilities, the health providers who participated in the study, and the study’s geographic coverage is presented below. The section provides the number of facilities, health providers and their qualification, including volunteers and seconded staff, by survey groups. The type of health workers by key contact points and availability of basic health facility infrastructures are also presented below.
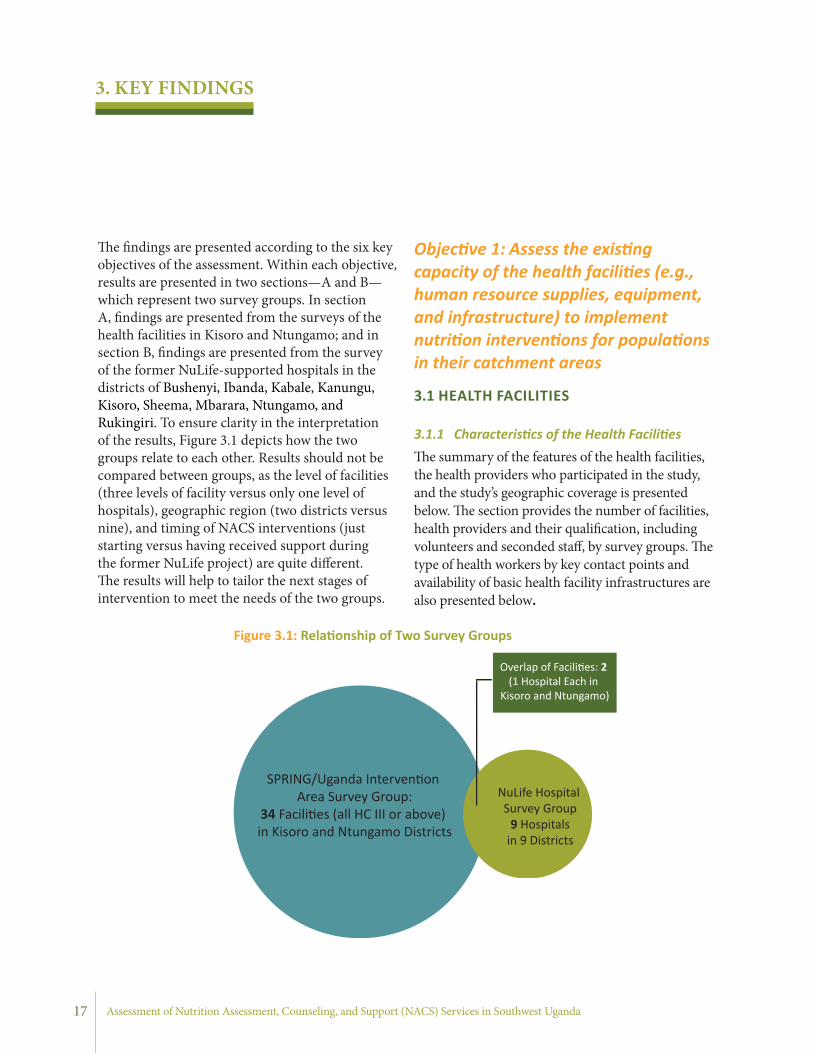
Figure 3.1: Relationship of Two Survey Groups
SPRING/Uganda Intervention Area Survey Group:
34 Facilities (all HC III or above) in Kisoro and Ntungamo Districts
NuLife Hospital Survey Group
9 Hospitalsin 9 Districts
Overlap of Facilities: 2 (1 Hospital Each in
Kisoro and Ntungamo)
17
3. KEY FINDINGS
The findings are presented according to the six key objectives of the assessment. Within each objective, results are presented in two sections—A and B—which represent two survey groups. In section A, findings are presented from the surveys of the health facilities in Kisoro and Ntungamo; and in section B, findings are presented from the survey of the former NuLife-supported hospitals in the districts of Bushenyi, Ibanda, Kabale, Kanungu, Kisoro, Sheema, Mbarara, Ntungamo, and Rukingiri. To ensure clarity in the interpretation of the results, Figure 3.1 depicts how the two groups relate to each other. Results should not be compared between groups, as the level of facilities (three levels of facility versus only one level of hospitals), geographic region (two districts versus nine), and timing of NACS interventions (just starting versus having received support during the former NuLife project) are quite different. The results will help to tailor the next stages of intervention to meet the needs of the two groups.

June 2013
3. KEY FINDINGS
A. SPRING/Uganda Districts Survey Group Results
Table 3.1 presents a summary of the facilities in the SPRING/Uganda districts. A total of 35 public facilities were surveyed in Kisoro and Ntungamo districts. The majority of facilities in Kisoro and Ntungamo districts are HC IIIs (71%). All these facilities serve approximately 2.1 million people in these two districts.2 The three hospitals serve a population of more than 1,000,000, the seven HC IVs serve an estimated population of 600,000, and the twenty-five HC IIIs serve an estimated population of 480,000.
Table 3.2 shows respondents across all types of facilities. The majority of the respondents were medical clinical officers (59%, n=20). Disaggregated by facility type, it appears that the likelihood that
the facility in-charge is a medical officer or medical clinical officer decreases as facility size decreases (from hospitals to HC IV to HC III). The facilities in the survey varied not only by size/level of facility, but also by who managed them.
Table 3.3 provides details of the types of facilities by managing authority. The majority (88%) of the health facilities were managed by the government, while NGOs and religious organizations managed 6% (n=2) each.
B. Former NuLife-Supported Hospitals Survey Goup Results
All nine of the facilities in the NuLife group were hospitals; they serve 4.5 million people in total. SPRING/Uganda will continue to work in these facilities, as part of the SPRING/Uganda intervention areas, with an approach that builds on the previous work done by NuLife and that strengthens preventive nutrition services for children, pregnant and lactating women, and PLHIV.
Table 3.4 shows respondents by technical qualification. Respondents included two obstetrician/gynecologists (OB/GYNs), three medical officers, three registered nurses, and one social worker. Table 3.5 provides details of the types
Facility Type Frequency Percent of Total Facilities
Hospital 3 9%
HC IV 7 20%
HC III 25 71%
Total 35 100%
Technical Qualification Hospital HC IV HC III Total
Medical officer 1 (50%) 1 (3%)
Medical clinical officer 6 (86%) 14 (56%) 20 (59%)
Registered nurse 4 (16%) 4 (12%)
Enrolled nurse 1 (4%) 1 (3%)
Enrolled comprehensive nurse 3 (12%) 3 (9%)
Nursing assistant 1 (4%) 1 (3%)
Medical lab technician 1 (14%) 1 (3%)
Social worker 1 (50%) 1 (3%)
Other 2 (8%) 2 (6%)
Total 2 7 25 34
Table 3.1: Upper-Level Facilities in SPRING/Uganda Districts
2 Uganda Bureau of Statistics 2007.
Table 3.2: Respondents by Facility Type, SPRING/Uganda Districts
18

Assessment of Nutrition Assessment, Counseling, and Support (NACS) Services in Southwest Uganda
3. KEY FINDINGS
the first fully-functioning Human Resource Information System on the continent was developed and launched in Uganda.
Overall, the human resource for health audit report provides the staffing situation in Uganda’s public sector as of June 2011. The percentage of filled public sector posts has increased from 38% in 2006 to 56% in 2010 and 63% in 2011 (MOH 2007, MOH 2010a, MOH 2011a). However, public sector vacancy rates remain too high. The rapid increase in the number of districts has likely contributed to high vacancy rates in the districts, as the number of health facilities has increased without an increase in human resources for health. This section of the assessment is not meant to take the place of the many comprehensive reports, assessments, and statistics available in other places. Rather, it presents some illustrative statistics that point to the current situation at key health service contact points in selected surveyed facilities in Kisoro and Ntungamo districts and former NuLife-supported hospitals.
of facilities by managing authority. The government managed the majority (67%) of the health facilities, while faith-based organizations and NGOs managed 11% and 22% respectively.
3.2 HEALTH WORKFORCE
3.2.1 Health Workforce by Contact PointsThe health workforce is one of the six building blocks of the health system. According to the 2007 WHO Framework for Action, “Strengthening Health Systems to Improve Outcomes,” a strong health workforce is one that “works in ways that are responsive, fair, and efficient to achieve the best health outcomes possible, given available resources and circumstances (i.e., there are sufficient staff, fairly distributed; they are competent, responsive and productive)” (WHO 2007). The Government of Uganda and the MOH were among the first in Africa to recognize the importance of human resources and the crisis presented by its current health system with regard to human resource numbers, distribution, and management. Perhaps
Managing Authority Hospital HC IV HC III Total
Government 2 (100%) 7 (100%) 21 (84%) 30 (88%)
NGO 0 0 2 (8%) 2 (6%)
Faith-based organization 0 0 2 (8%) 2 (6%)
Total 2 7 25 34
Table 3.3: Types of Facilities by Managing Authority, SPRING/Uganda Districts
Technical Qualification Number Percent
OB/GYN 2 22
Medical officer 3 33
Registered nurse 3 33
Social worker 1 11
Total 9 100%
Managing Authority Number Percent
Government 6 67
Faith-based organization 1 11
Private not-for-profit 2 22
Total 9 100%
Table 3.4: Respondents by Technical Qualification, Former NuLife-Supported Hospitals
Table 3.5: Facilities by Managing Authority, Former NuLife-Supported Hospitals
19

June 2013
3. KEY FINDINGS
medical doctors (pediatricians, OB/GYNs or surgeons) working at these contact points. Itojo Hospital reported one such provider in pediatric OPD, while Kisoro Hospital reported one in administration. Nursing assistants and nurses/midwives were the most common technical cadres of health workers at most of the contact points. Next were medical officers and medical clinical officers. It appears the ART services and OPD (both general and pediatric) had the most diverse provider qualifications of all the departments.
A. SPRING/Uganda Districts Survey Group Results
Table 3.6 shows the work force in each of the 13 key contact points (ANC, maternity, postnatal/family planning, young child clinics [YCCs], HIV, TB, early infant diagnosis [EID]/PMTCT, OPD, pediatric clinic/wards, community outreach, medical social workers’ departments, administration, and nutrition and integrated management of acute malnutrition (IMAM). Generally, there were very few specialized
Percentage of all Facilities with at least one provider
with Technical Qualification**
(a) A
NC
(b) M
ATER
NIT
Y
(c) P
OST
NAT
AL /
FAM
ILY
PLAN
NIN
G
(d) Y
OU
NG
CHI
LD
(e) A
RT
(f) T
B
(g) E
ID/P
MTC
T
(h) O
PD
(i) P
EDIA
TRIC
CLI
NIC
/W
ARD
(j) C
OM
MU
NIT
Y O
UTR
EACH
(k) M
EDIC
AL S
OCI
AL
WO
RKER
’S D
EPT.
(l) A
DMIN
ISTR
ATIO
N
(m) N
UTR
ITIO
N/I
MAM
(n) P
EDIA
TRIC
OPD
Specialized MD 0 0 0 0 0 0 0 0 0 0 0 1 (3%) 0 1
(3%)
Medical/MC Officer
1 (3%*)
4 (12%) 0 0 4
(12%)1
(3%)1
(3%)17
(50%)2
(6%)1
(3%) 0 1 (3%)
1 (3%)
3 (9%)
Nurse/Midwife 15 (44%)
18 (53%)
3 (9%)
4 (12%)
4 (12%)
3 (9%)
3 (9%)
17 (50%)
4 (12%)
4 (12%) 1 (3%) 1
(3%)2
(6%)4
(12%)
Nurse Assistant 8 (24%)
9 (26%)
4 (12%)
8 (24%)
3 (9%)
1 (3%)
1 (3%)
24 (71%)
3 (9%)
6 (18%) 1 (3%) 0 0 2
(6%)
Pharmacy Staff 0 0 0 0 1 (3%) 0 0 0 1
(3%) 0 0 0 0 0
Lab Staff 1 (3%) 0 0 0 2
(6%)1
(3%)2
(6%)9
(26%) 0 1 (3%) 0 0 0 4
(12%)
Nutritionist 0 0 0 0 1 (3%) 0 0 0 0 0 0 0 1
(3%) 0
Health Educator 0 0 0 1 (3%) 0 0 0 1
(3%)1
(3%)3
(9%) 1 (3%) 0 0 0
Allied Health 0 0 0 0 0 0 0 2 (6%) 0 0 1 (3%) 1
(3%) 0 1 (3%)
Other TQ 2 (6%)
1 (3%) 0 1
(3%)4
(12%)1
(3%) 0 6 (18%)
1 (3%)
5 (15%) 2 (6%) 2
(6%) 0 2 (6%)
*Percentages indicate the percent of health facilities with the categories of health workers at each service point.
**Grouped Categories, Specialized MD Includes MDs, Pediatrician, OB/GYN, Surgeon, and Other Physician Specialist; Medical/Officer includes Medical Officer and Medical Clinical Officer; Nurse/ Midwife includes Registered Nurse, Registered Midwife, Registered Comprehensive Nurse, Enrolled Nurse, Enrolled Midwife, Enrolled Comprehensive Nurse, Public Health Nurse; Nursing Assistant Stands Alone; Pharmacy Staff includes Pharmacist and Pharmacy Technician; Lab Staff includes Medical Lab Assistant, Medical Lab Technician, and Medical Lab Technologist; Nutritionist and Health Educator Both Stand Alone; and Allied Health includes Bio Statistician, Social Worker, Counselor and Catering Officer.
Table 3.6: Number of Health Workers by Type and Service Points, SPRING/Uganda Districts
20
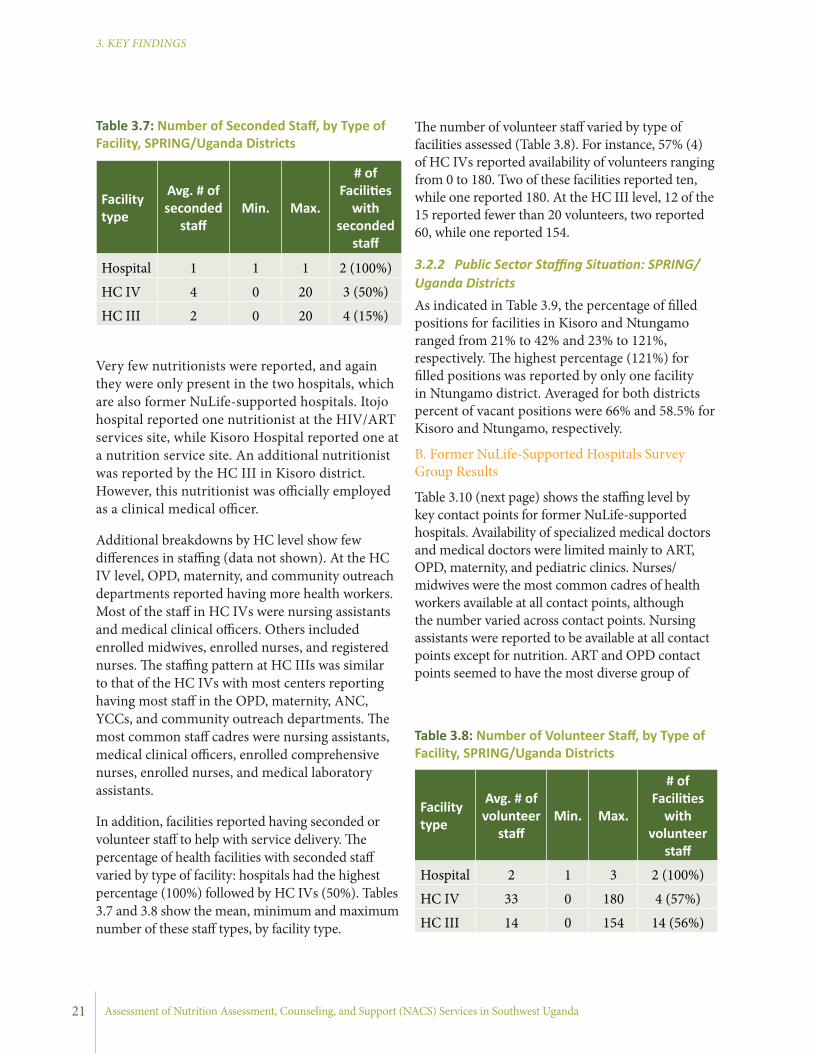
Assessment of Nutrition Assessment, Counseling, and Support (NACS) Services in Southwest Uganda
3. KEY FINDINGS
Very few nutritionists were reported, and again they were only present in the two hospitals, which are also former NuLife-supported hospitals. Itojo hospital reported one nutritionist at the HIV/ART services site, while Kisoro Hospital reported one at a nutrition service site. An additional nutritionist was reported by the HC III in Kisoro district. However, this nutritionist was officially employed as a clinical medical officer.
Additional breakdowns by HC level show few differences in staffing (data not shown). At the HC IV level, OPD, maternity, and community outreach departments reported having more health workers. Most of the staff in HC IVs were nursing assistants and medical clinical officers. Others included enrolled midwives, enrolled nurses, and registered nurses. The staffing pattern at HC IIIs was similar to that of the HC IVs with most centers reporting having most staff in the OPD, maternity, ANC, YCCs, and community outreach departments. The most common staff cadres were nursing assistants, medical clinical officers, enrolled comprehensive nurses, enrolled nurses, and medical laboratory assistants.
In addition, facilities reported having seconded or volunteer staff to help with service delivery. The percentage of health facilities with seconded staff varied by type of facility: hospitals had the highest percentage (100%) followed by HC IVs (50%). Tables 3.7 and 3.8 show the mean, minimum and maximum number of these staff types, by facility type.
The number of volunteer staff varied by type of facilities assessed (Table 3.8). For instance, 57% (4) of HC IVs reported availability of volunteers ranging from 0 to 180. Two of these facilities reported ten, while one reported 180. At the HC III level, 12 of the 15 reported fewer than 20 volunteers, two reported 60, while one reported 154.
3.2.2 Public Sector Staffing Situation: SPRING/Uganda DistrictsAs indicated in Table 3.9, the percentage of filled positions for facilities in Kisoro and Ntungamo ranged from 21% to 42% and 23% to 121%, respectively. The highest percentage (121%) for filled positions was reported by only one facility in Ntungamo district. Averaged for both districts percent of vacant positions were 66% and 58.5% for Kisoro and Ntungamo, respectively.
B. Former NuLife-Supported Hospitals Survey Group Results
Table 3.10 (next page) shows the staffing level by key contact points for former NuLife-supported hospitals. Availability of specialized medical doctors and medical doctors were limited mainly to ART, OPD, maternity, and pediatric clinics. Nurses/midwives were the most common cadres of health workers available at all contact points, although the number varied across contact points. Nursing assistants were reported to be available at all contact points except for nutrition. ART and OPD contact points seemed to have the most diverse group of
Facility type
Avg. # of seconded
staffMin. Max.
# of Facilities
with seconded
staff
Hospital 1 1 1 2 (100%)
HC IV 4 0 20 3 (50%)
HC III 2 0 20 4 (15%)
Facility type
Avg. # of volunteer
staffMin. Max.
# of Facilities
with volunteer
staff
Hospital 2 1 3 2 (100%)
HC IV 33 0 180 4 (57%)
HC III 14 0 154 14 (56%)
Table 3.8: Number of Volunteer Staff, by Type of Facility, SPRING/Uganda Districts
Table 3.7: Number of Seconded Staff, by Type of Facility, SPRING/Uganda Districts
21
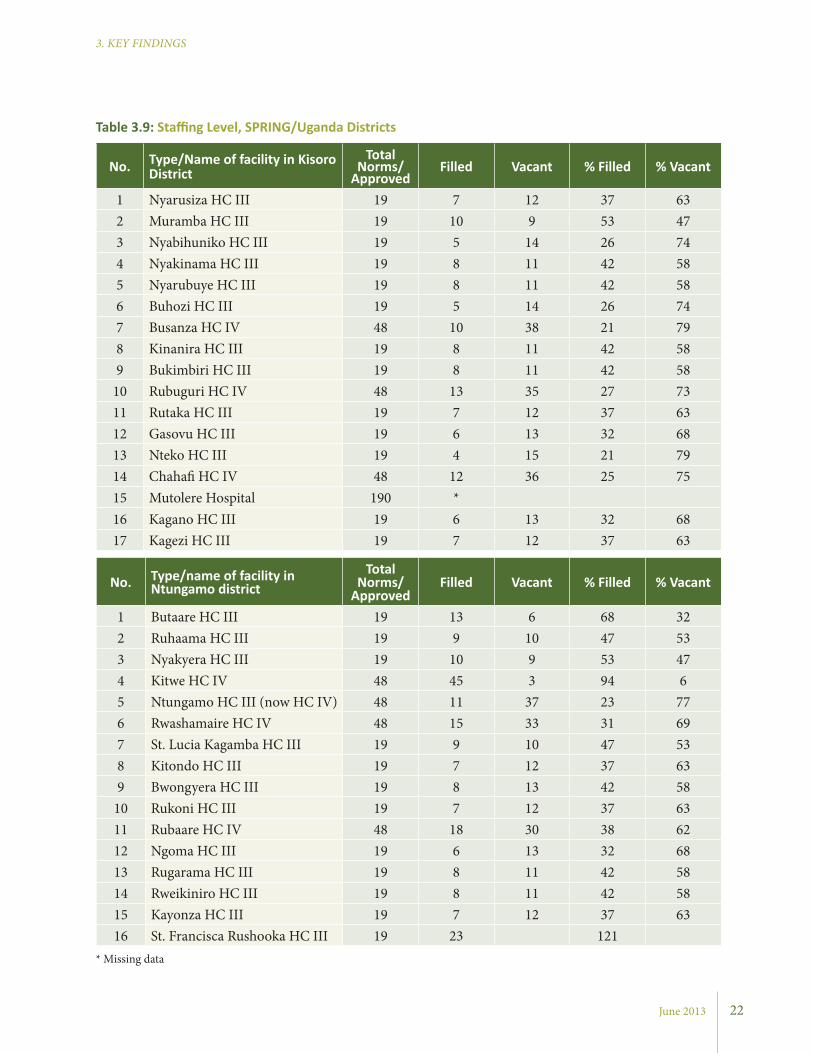
June 2013
3. KEY FINDINGS
No. Type/Name of facility in Kisoro District
Total Norms/
ApprovedFilled Vacant % Filled % Vacant
1 Nyarusiza HC III 19 7 12 37 632 Muramba HC III 19 10 9 53 473 Nyabihuniko HC III 19 5 14 26 744 Nyakinama HC III 19 8 11 42 585 Nyarubuye HC III 19 8 11 42 586 Buhozi HC III 19 5 14 26 747 Busanza HC IV 48 10 38 21 798 Kinanira HC III 19 8 11 42 589 Bukimbiri HC III 19 8 11 42 58
10 Rubuguri HC IV 48 13 35 27 7311 Rutaka HC III 19 7 12 37 6312 Gasovu HC III 19 6 13 32 6813 Nteko HC III 19 4 15 21 7914 Chahafi HC IV 48 12 36 25 7515 Mutolere Hospital 190 *16 Kagano HC III 19 6 13 32 6817 Kagezi HC III 19 7 12 37 63
* Missing data
No. Type/name of facility in Ntungamo district
Total Norms/
ApprovedFilled Vacant % Filled % Vacant
1 Butaare HC III 19 13 6 68 322 Ruhaama HC III 19 9 10 47 533 Nyakyera HC III 19 10 9 53 474 Kitwe HC IV 48 45 3 94 65 Ntungamo HC III (now HC IV) 48 11 37 23 776 Rwashamaire HC IV 48 15 33 31 697 St. Lucia Kagamba HC III 19 9 10 47 538 Kitondo HC III 19 7 12 37 639 Bwongyera HC III 19 8 13 42 58
10 Rukoni HC III 19 7 12 37 6311 Rubaare HC IV 48 18 30 38 6212 Ngoma HC III 19 6 13 32 6813 Rugarama HC III 19 8 11 42 5814 Rweikiniro HC III 19 8 11 42 5815 Kayonza HC III 19 7 12 37 6316 St. Francisca Rushooka HC III 19 23 121
Table 3.9: Staffing Level, SPRING/Uganda Districts
22
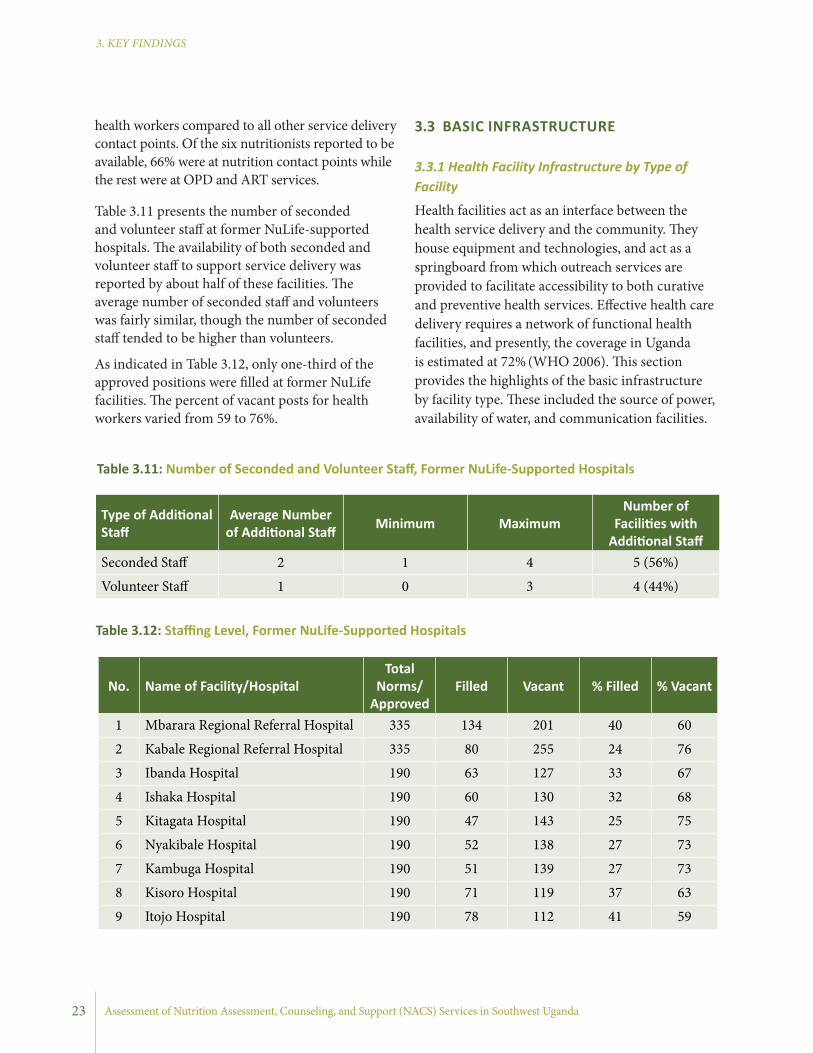
Assessment of Nutrition Assessment, Counseling, and Support (NACS) Services in Southwest Uganda
3. KEY FINDINGS
health workers compared to all other service delivery contact points. Of the six nutritionists reported to be available, 66% were at nutrition contact points while the rest were at OPD and ART services.
Table 3.11 presents the number of seconded and volunteer staff at former NuLife-supported hospitals. The availability of both seconded and volunteer staff to support service delivery was reported by about half of these facilities. The average number of seconded staff and volunteers was fairly similar, though the number of seconded staff tended to be higher than volunteers.
As indicated in Table 3.12, only one-third of the approved positions were filled at former NuLife facilities. The percent of vacant posts for health workers varied from 59 to 76%.
3.3 BASIC INFRASTRUCTURE
3.3.1 Health Facility Infrastructure by Type of Facility
Health facilities act as an interface between the health service delivery and the community. They house equipment and technologies, and act as a springboard from which outreach services are provided to facilitate accessibility to both curative and preventive health services. Effective health care delivery requires a network of functional health facilities, and presently, the coverage in Uganda is estimated at 72% (WHO 2006). This section provides the highlights of the basic infrastructure by facility type. These included the source of power, availability of water, and communication facilities.
Type of Additional Staff
Average Number of Additional Staff Minimum Maximum
Number of Facilities with
Additional StaffSeconded Staff 2 1 4 5 (56%)
Volunteer Staff 1 0 3 4 (44%)
Table 3.11: Number of Seconded and Volunteer Staff, Former NuLife-Supported Hospitals
No. Name of Facility/HospitalTotal
Norms/Approved
Filled Vacant % Filled % Vacant
1 Mbarara Regional Referral Hospital 335 134 201 40 60
2 Kabale Regional Referral Hospital 335 80 255 24 76
3 Ibanda Hospital 190 63 127 33 67
4 Ishaka Hospital 190 60 130 32 68
5 Kitagata Hospital 190 47 143 25 75
6 Nyakibale Hospital 190 52 138 27 73
7 Kambuga Hospital 190 51 139 27 73
8 Kisoro Hospital 190 71 119 37 63
9 Itojo Hospital 190 78 112 41 59
Table 3.12: Staffing Level, Former NuLife-Supported Hospitals
23

June 2013
3. KEY FINDINGS
% of Facilities
with At Least
One Provider
with Technical
Qualification
(a) ANC
(b) MATERNITY
(c) POSTNATAL/FAMILY PLANNING
(d) YOUNG CHILD
(e) ART
(f) TB
(g) EID/PMTCT
(h) OPD
(i) PEDIATRIC CLINIC/WARD
(j) COMMUNITY OUTREACH
(k) MEDICAL SOCIAL WORKER’S DEPT.
(l) INISTRATION
(m) NUTRITION/IMAM
(n) PEDIATRIC OPD
Specialized M
D1
(11%)
2 (22%
)0
01
(11%)
00
1 (11%)
1 (11%
)0
02
(22%)
01
(11%)
Medical/M
C
Offi
cer0
5 (56%
)0
07
(78%)
01
(11%)
8 (89%)
8 (89%
)3
(33%)
2 (22%
)3
(33%)
2 (22%
)4
(44%)
Nurse/M
idwife
7 (78%
)9
(100%)
8 (89%
)5
(56%)
7 (78%
)3
(33%)
5 (56%
)9
(100%)
9 (100%
)3
(33%)
3 (33%
)4
(44%)
2 (22%
)4
(44%)
Nurse
Assistant
4 (44%
)5
(56%)
3 (33%
)2
(22%)
4 (44%
)3
(33%)
2 (22%
)3
(33%)
5 (56%
)1
(11%)
1 (11%
)0
01
(11%)
Pharmacy Staff
1 (11%
)0
00
1 (11%
)0
04
(44%)
1 (11%
)0
00
00
Lab Staff0
00
02
(22%)
00
7 (78%
)0
00
00
0
Nutritionist
00
00
1 (11%
)0
01
(11%)
00
00
4 (44%
)0
Educator0
00
00
00
00
02
(22%)
00
0
Allied H
ealth 0
00
03
(33%)
00
2 (22%
)0
04
(44%)
3 (33%
)0
0
Other
00
00
00
01
(11%)
1 (11%
)0
01
(11%)
01
(11%)
Table 3.10: Type of Health Workers and Services, Form
er NuLife-Supported Hospitals
*Grouped C
ategories, Specialized Medical D
octors Includes MD
s, Pediatrician, OB/G
YN, Surgeon, and O
ther Physician Specialist; Medical/M
edical Clinical O
fficer
includes Medical O
fficer A
nd Medical C
linical Offi
cer; Nurse/M
idwife includes Registered N
urse, Registered Midw
ife, Registered Com
prehensive Nurse, Enrolled N
urse, Enrolled M
idwife, Enrolled C
omprehensive N
urse, Public Health N
urse; Nursing A
ssistant Stands Alone; Pharm
acy Staff includes Pharmacist and Pharm
acy Technician; Lab Staff includes M
edical Lab Assistant, M
edical Lab Technician, and Medical Lab Technologist; N
utritionist and Health Educator both stand alone; and A
llied Health
includes Bio Statistician, Social Worker, C
ounselor and Catering O
fficer
24

Assessment of Nutrition Assessment, Counseling, and Support (NACS) Services in Southwest Uganda
3. KEY FINDINGS
A. SPRING/Uganda Districts Survey Group Results
Table 3.13 shows the availability of selected basic infrastructures by type of facility. Regarding source of power, hospitals mainly depended on a generator (100%), while the HC IV facilities used solar energy, paraffin oil, and a generator as primary sources of power. Many of the HC IIIs reported using solar energy as their major source of power (50%). In terms of communication, the majority of facilities used personal mobile phones as their
Main source of power Hospital HC IV HC III Total
Solar 0 2 (33%) 12 (50%) 14 (44%)
Hydro electric 2 (100) 4 (67%) 4 (17%) 10 (31%)
Gas 0 0 1 (4%) 1 (3%)
Paraffin 0 0 7 (29%) 7 (22%)
Total 2 6 24 32
Primary means of communication Hospital HC IV HC III Total
Telephone (Landline) 0 0 0 0
Facility-owned mobile 0 0 3 (12%) 3 (9%)
Personal mobile phone 2 6 (86%) 20 (80%) 28 (82%)
Other 0 1 (14%) 2 (8%) 3 (9%)
Total 2 7 25 34
Water always available Hospital HC IV HC III Total
No 0 2 (29%) 5 (20%) 7 (21%)
Yes 2 (100%) 5 (71%) 20 (80%) 27 (79%)
Total 2 7 25 34
Incinerator available* Hospital HC IV HC III Total
No 2 (100%) 7 (100%) 19 (80%) 28 (85%)
Yes 0 0 5 (21%) 5 (15%)
Total 2 7 24 33
Table 3.13: Available Infrastructure, by Type of Facility, SPRING/Uganda Districts
Average Min. Max.
Hospital 3.7 3.7 3.7
HC IV 2.9 0.2 5
HC III 0.9 0 3.7
All 1.5 0 5
Table 3.14: Index of Availability of Basic Facility Infrastructure, SPRING/Uganda Districts*
*Totals reduced due to missing data
*Index includes a number of infrastructure indicators, including power source, water source, and infrastructure available on-site. The index scores range from 0 (worst) to 5 (best).
25
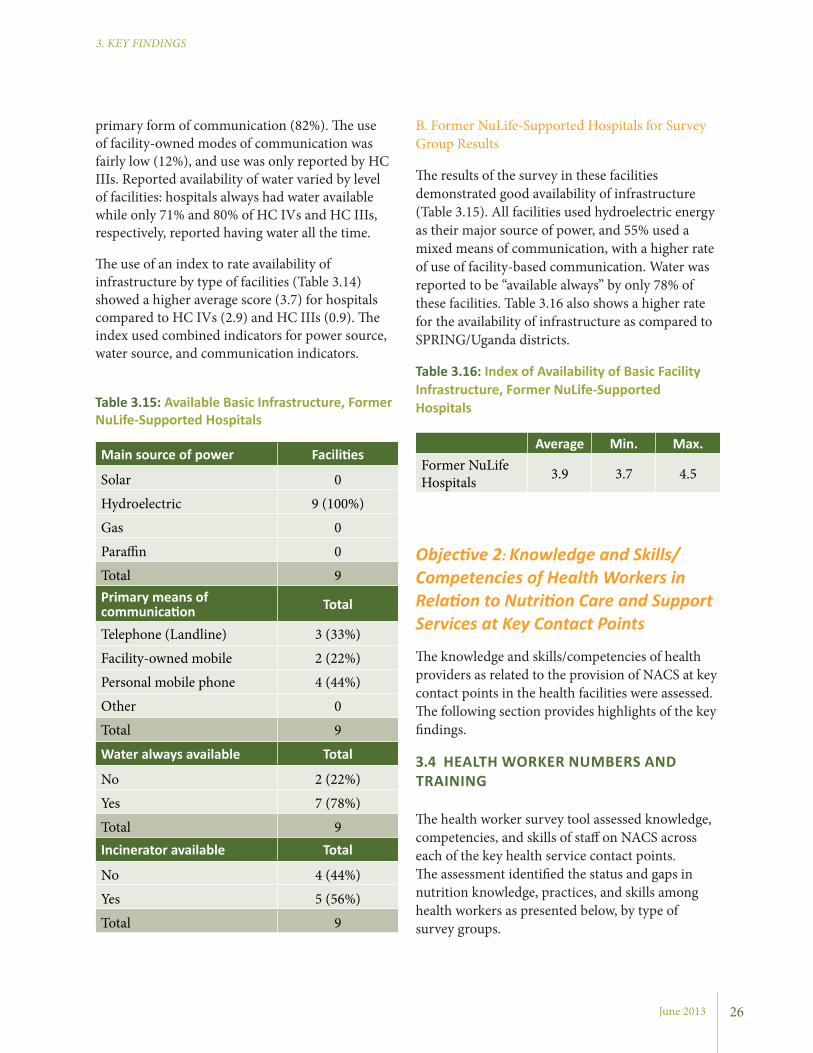
June 2013
3. KEY FINDINGS
primary form of communication (82%). The use of facility-owned modes of communication was fairly low (12%), and use was only reported by HC IIIs. Reported availability of water varied by level of facilities: hospitals always had water available while only 71% and 80% of HC IVs and HC IIIs, respectively, reported having water all the time.
The use of an index to rate availability of infrastructure by type of facilities (Table 3.14) showed a higher average score (3.7) for hospitals compared to HC IVs (2.9) and HC IIIs (0.9). The index used combined indicators for power source, water source, and communication indicators.
B. Former NuLife-Supported Hospitals for Survey Group Results
The results of the survey in these facilities demonstrated good availability of infrastructure (Table 3.15). All facilities used hydroelectric energy as their major source of power, and 55% used a mixed means of communication, with a higher rate of use of facility-based communication. Water was reported to be “available always” by only 78% of these facilities. Table 3.16 also shows a higher rate for the availability of infrastructure as compared to SPRING/Uganda districts.
Table 3.16: Index of Availability of Basic Facility Infrastructure, Former NuLife-Supported Hospitals
Average Min. Max.Former NuLife Hospitals 3.9 3.7 4.5
Objective 2: Knowledge and Skills/Competencies of Health Workers in Relation to Nutrition Care and Support Services at Key Contact Points
The knowledge and skills/competencies of health providers as related to the provision of NACS at key contact points in the health facilities were assessed. The following section provides highlights of the key findings.
3.4 HEALTH WORKER NUMBERS AND TRAINING
The health worker survey tool assessed knowledge, competencies, and skills of staff on NACS across each of the key health service contact points. The assessment identified the status and gaps in nutrition knowledge, practices, and skills among health workers as presented below, by type of survey groups.
Main source of power Facilities
Solar 0
Hydroelectric 9 (100%)
Gas 0
Paraffin 0
Total 9Primary means of communication Total
Telephone (Landline) 3 (33%)
Facility-owned mobile 2 (22%)
Personal mobile phone 4 (44%)
Other 0
Total 9
Water always available Total
No 2 (22%)
Yes 7 (78%)
Total 9Incinerator available Total
No 4 (44%)
Yes 5 (56%)
Total 9
26
Table 3.15: Available Basic Infrastructure, Former NuLife-Supported Hospitals
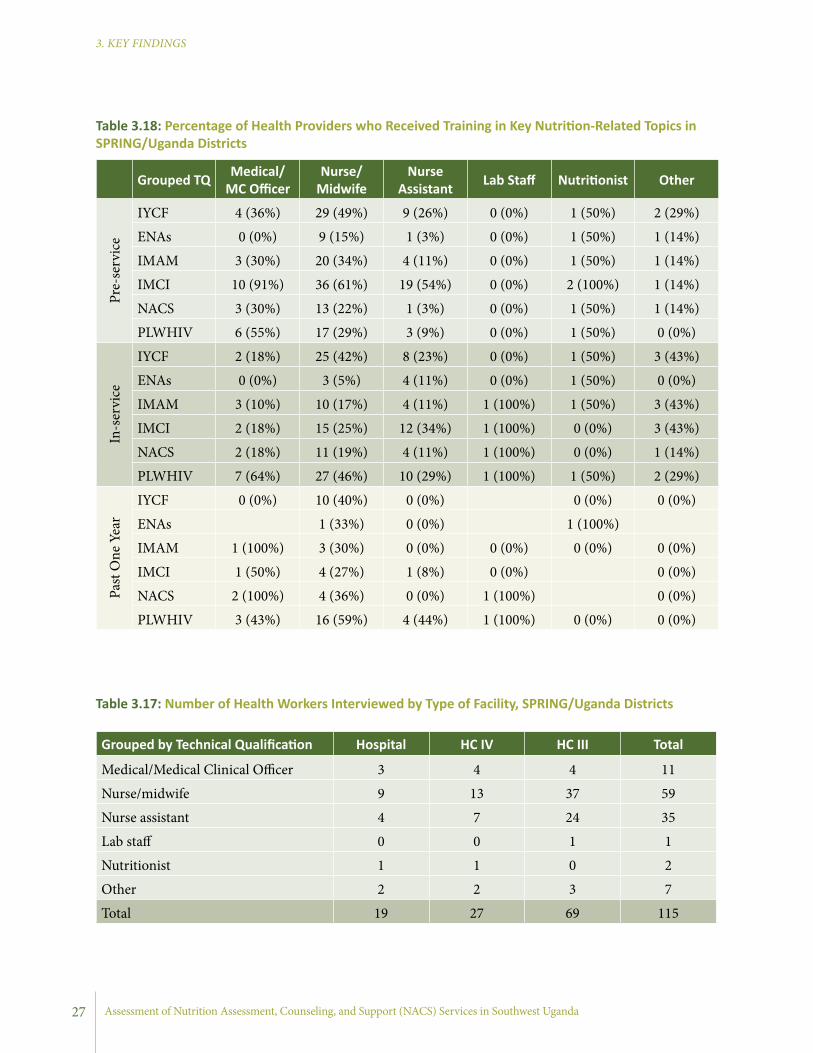
Assessment of Nutrition Assessment, Counseling, and Support (NACS) Services in Southwest Uganda
3. KEY FINDINGS
Grouped by Technical Qualification Hospital HC IV HC III Total
Medical/Medical Clinical Officer 3 4 4 11
Nurse/midwife 9 13 37 59
Nurse assistant 4 7 24 35
Lab staff 0 0 1 1
Nutritionist 1 1 0 2
Other 2 2 3 7
Total 19 27 69 115
Grouped TQ Medical/MC Officer
Nurse/Midwife
Nurse Assistant Lab Staff Nutritionist Other
Pre-
serv
ice
IYCF 4 (36%) 29 (49%) 9 (26%) 0 (0%) 1 (50%) 2 (29%)
ENAs 0 (0%) 9 (15%) 1 (3%) 0 (0%) 1 (50%) 1 (14%)
IMAM 3 (30%) 20 (34%) 4 (11%) 0 (0%) 1 (50%) 1 (14%)
IMCI 10 (91%) 36 (61%) 19 (54%) 0 (0%) 2 (100%) 1 (14%)
NACS 3 (30%) 13 (22%) 1 (3%) 0 (0%) 1 (50%) 1 (14%)
PLWHIV 6 (55%) 17 (29%) 3 (9%) 0 (0%) 1 (50%) 0 (0%)
In-s
ervi
ce
IYCF 2 (18%) 25 (42%) 8 (23%) 0 (0%) 1 (50%) 3 (43%)
ENAs 0 (0%) 3 (5%) 4 (11%) 0 (0%) 1 (50%) 0 (0%)
IMAM 3 (10%) 10 (17%) 4 (11%) 1 (100%) 1 (50%) 3 (43%)
IMCI 2 (18%) 15 (25%) 12 (34%) 1 (100%) 0 (0%) 3 (43%)
NACS 2 (18%) 11 (19%) 4 (11%) 1 (100%) 0 (0%) 1 (14%)
PLWHIV 7 (64%) 27 (46%) 10 (29%) 1 (100%) 1 (50%) 2 (29%)
Past
One
Yea
r
IYCF 0 (0%) 10 (40%) 0 (0%) 0 (0%) 0 (0%)
ENAs 1 (33%) 0 (0%) 1 (100%) IMAM 1 (100%) 3 (30%) 0 (0%) 0 (0%) 0 (0%) 0 (0%)
IMCI 1 (50%) 4 (27%) 1 (8%) 0 (0%) 0 (0%)
NACS 2 (100%) 4 (36%) 0 (0%) 1 (100%) 0 (0%)
PLWHIV 3 (43%) 16 (59%) 4 (44%) 1 (100%) 0 (0%) 0 (0%)
Table 3.17: Number of Health Workers Interviewed by Type of Facility, SPRING/Uganda Districts
Table 3.18: Percentage of Health Providers who Received Training in Key Nutrition-Related Topics in SPRING/Uganda Districts
27
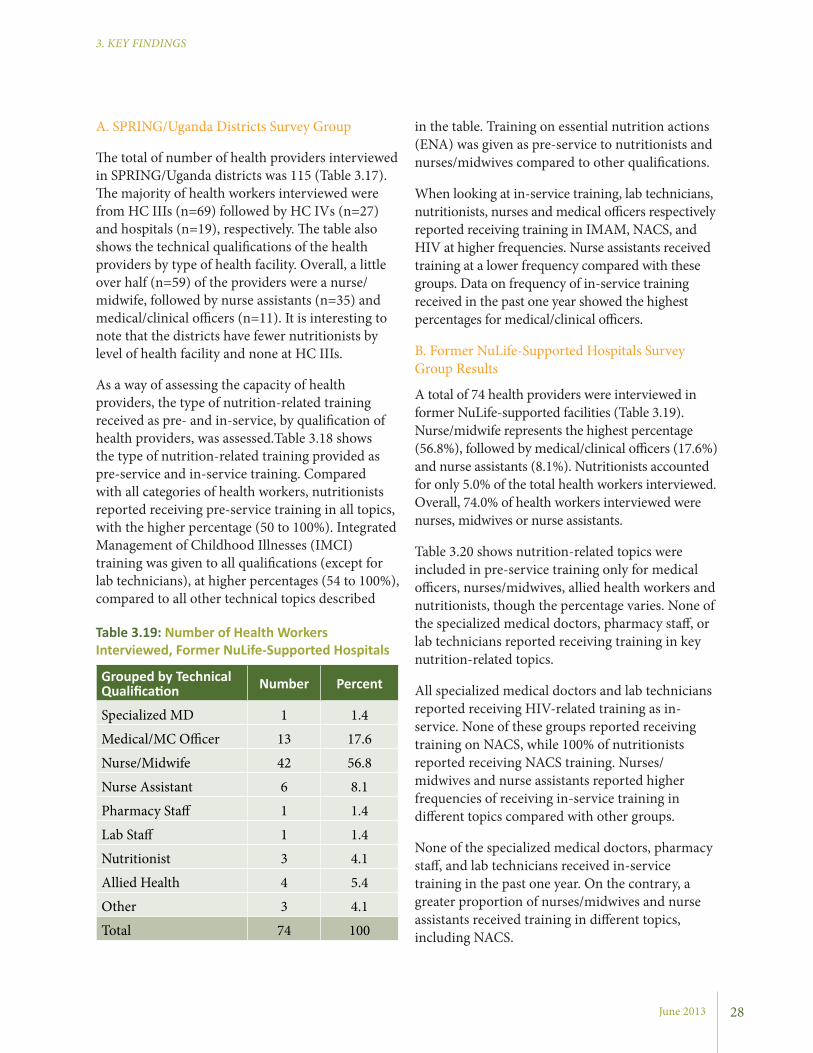
June 2013
3. KEY FINDINGS
in the table. Training on essential nutrition actions (ENA) was given as pre-service to nutritionists and nurses/midwives compared to other qualifications.
When looking at in-service training, lab technicians, nutritionists, nurses and medical officers respectively reported receiving training in IMAM, NACS, and HIV at higher frequencies. Nurse assistants received training at a lower frequency compared with these groups. Data on frequency of in-service training received in the past one year showed the highest percentages for medical/clinical officers.
B. Former NuLife-Supported Hospitals Survey Group Results
A total of 74 health providers were interviewed in former NuLife-supported facilities (Table 3.19). Nurse/midwife represents the highest percentage (56.8%), followed by medical/clinical officers (17.6%) and nurse assistants (8.1%). Nutritionists accounted for only 5.0% of the total health workers interviewed. Overall, 74.0% of health workers interviewed were nurses, midwives or nurse assistants.
Table 3.20 shows nutrition-related topics were included in pre-service training only for medical officers, nurses/midwives, allied health workers and nutritionists, though the percentage varies. None of the specialized medical doctors, pharmacy staff, or lab technicians reported receiving training in key nutrition-related topics.
All specialized medical doctors and lab technicians reported receiving HIV-related training as in-service. None of these groups reported receiving training on NACS, while 100% of nutritionists reported receiving NACS training. Nurses/midwives and nurse assistants reported higher frequencies of receiving in-service training in different topics compared with other groups.
None of the specialized medical doctors, pharmacy staff, and lab technicians received in-service training in the past one year. On the contrary, a greater proportion of nurses/midwives and nurse assistants received training in different topics, including NACS.
A. SPRING/Uganda Districts Survey Group
The total of number of health providers interviewed in SPRING/Uganda districts was 115 (Table 3.17). The majority of health workers interviewed were from HC IIIs (n=69) followed by HC IVs (n=27) and hospitals (n=19), respectively. The table also shows the technical qualifications of the health providers by type of health facility. Overall, a little over half (n=59) of the providers were a nurse/midwife, followed by nurse assistants (n=35) and medical/clinical officers (n=11). It is interesting to note that the districts have fewer nutritionists by level of health facility and none at HC IIIs.
As a way of assessing the capacity of health providers, the type of nutrition-related training received as pre- and in-service, by qualification of health providers, was assessed.Table 3.18 shows the type of nutrition-related training provided as pre-service and in-service training. Compared with all categories of health workers, nutritionists reported receiving pre-service training in all topics, with the higher percentage (50 to 100%). Integrated Management of Childhood Illnesses (IMCI) training was given to all qualifications (except for lab technicians), at higher percentages (54 to 100%), compared to all other technical topics described
28
Grouped by Technical Qualification Number Percent
Specialized MD 1 1.4
Medical/MC Officer 13 17.6
Nurse/Midwife 42 56.8
Nurse Assistant 6 8.1
Pharmacy Staff 1 1.4
Lab Staff 1 1.4
Nutritionist 3 4.1
Allied Health 4 5.4
Other 3 4.1
Total 74 100
Table 3.19: Number of Health Workers Interviewed, Former NuLife-Supported Hospitals

Assessment of Nutrition Assessment, Counseling, and Support (NACS) Services in Southwest Uganda
3. KEY FINDINGS
(dietary/feeding history, checking for pallor and other signs for malnutrition/nutrient deficiencies).
A. SPRING/Uganda Districts Survey Group Results
The findings indicated nutrition assessment, using MUAC, height/length, weight, edema, pallor, hemoglobin estimation, and dietary history, varied by contact points and health facility levels. Table 3.21 shows the results by type of facility. At the hospital level, the most common assessments reported were taking weight, checking for edema, and taking dietary history at all service points.
3.5 NUTRITION ASSESSMENT
Nutrition assessment is the act of gathering, analyzing, and interpreting information from dietary, biochemical, anthropometric, and clinical methods. Dietary methods assess the risk of inadequate energy intake; biochemical methods assess functional disturbances; anthropometric methods assess body composition; and clinical methods deal with identifying clinical signs and symptoms. The most common nutrition assessment practices at the facility level include anthropometric (weight, height/length, and MUAC) and clinical
Grouped TQ
Specialized MD
Medical/MC Officer
Nurse/Midwife
Nurse Assistant
Pharmacy Staff Lab Staff Nutritionist Allied
Health Other
Pre-
serv
ice
IYCF 0 (0%) 4 (31%) 12 (29%) 0 (0%) 0 (0%) 0 (0%) 1 (33%) 0 (0%) 0 (0%)
ENAs 0 (0%) 1 (8%) 4 (10%) 0 (0%) 0 (0%) 0 (0%) 1 (33%) 1 (25%) 0 (0%)
IMAM 0 (0%) 1 (8%) 5 (12%) 1 (17%) 0 (0%) 0 (0%) 0 (0%) 1 (25%) 0 (0%)
IMCI 0 (0%) 10 (77%) 23 (55%) 3 (50%) 0 (0%) 0 (0%) 1 (33%) 3 (50%) 1 (33%)
NACS 0 (0%) 2 (17%) 2 (5%) 0 (0%) 0 (0%) 0 (0%) 1 (33%) 1 (25%) 0 (0%)
PLWHIV 0 (0%) 3 (23%) 2 (5%) 0 (0%) 0 (0%) 0 (0%) 1 (33%) 1 (25%) 0 (0%)
In-s
ervi
ce
IYCF 0 (0%) 4 (31%) 25 (60%) 2 (33%) 0 (0%) 0 (0%) 2 (67%) 2 (50%) 2 (67%)
ENAs 0 (0%) 0 (0%) 5 (12%) 3 (50%) 1 (100%) 0 (0%) 1 (33%) 1 (25%) 0 (0%)
IMAM 0 (0%) 5 (42%) 17 (40%) 2 (33%) 0 (0%) 0 (0%) 2 (67%) 1 (25%) 2 (67%)
IMCI 0 (0%) 10 (77%) 13 (31%) 3 (50%) 0 (0%) 0 (0%) 1 (33%) 1 (25%) 0 (0%)
NACS 0 (0%) 5 (38%) 14 (33%) 1 (17%) 1 (100%) 0 (0%) 0 (0%) 0 (0%) 0 (0%)
PLWHIV 1 (100%) 8 (62%) 19 (45%) 4 (67%) 0 (0%) 1 (100%) 2 (67%) 1 (50%) 1 (33%)
Past
one
Yea
r
IYCF 0 (0%) 7 (29%) 1 (50%) 0 (0%) 1 (50%) 0 (0%)
ENAs 0 (0%) 2 (67%) 0 (0%) 1 (100%) 0 (0%) IMAM 2 (40%) 6 (35%) 2 (100%) 1 (50%) 0 (0%) 0 (0%)
IMCI 3 (30%) 3 (23%) 0 (0%) 0 (0%) 0 (0%) NACS 3 (60%) 4 (29%) 0 (0%) 0 (0%)
PLWHIV 0 (0%) 2 (25%) 3 (16%) 1 (25%) 0 (0%) 0 (0%) 1 (50%) 0 (0%)
Table 3.20: Percentage of Health Providers Who Received Training in Key Nutrition Related Topics in Former NuLife-Supported Hospitals
29
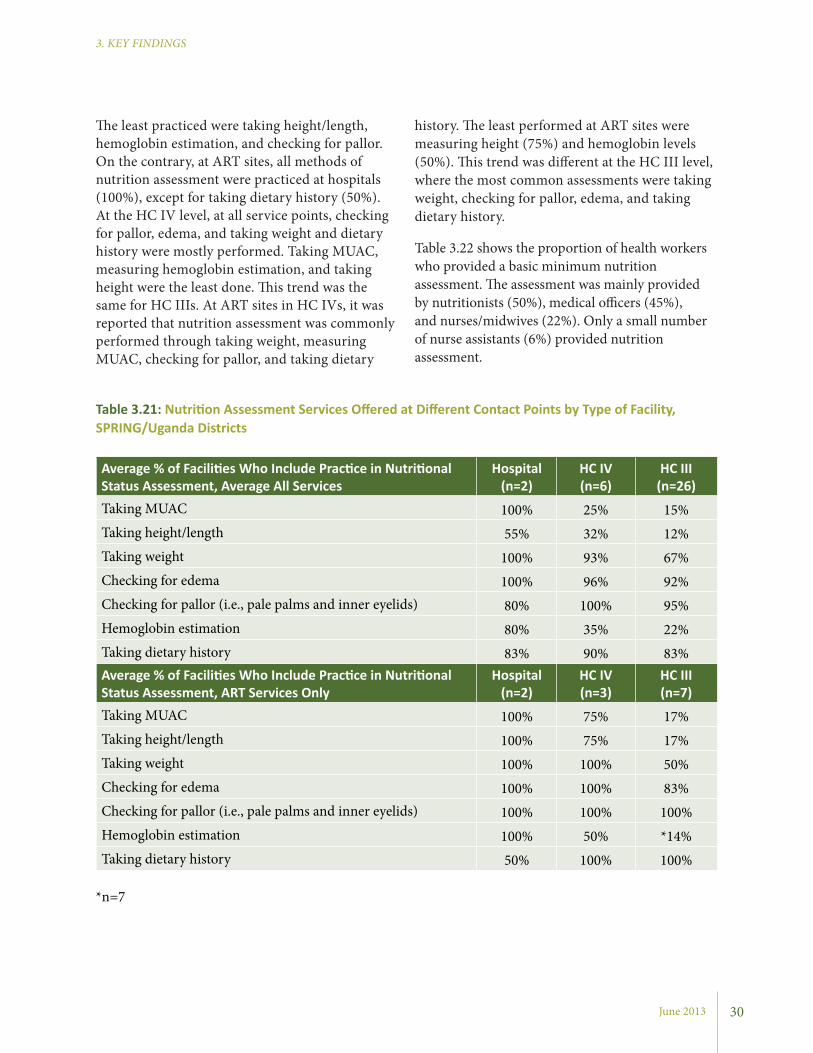
June 2013
3. KEY FINDINGS
history. The least performed at ART sites were measuring height (75%) and hemoglobin levels (50%). This trend was different at the HC III level, where the most common assessments were taking weight, checking for pallor, edema, and taking dietary history.
Table 3.22 shows the proportion of health workers who provided a basic minimum nutrition assessment. The assessment was mainly provided by nutritionists (50%), medical officers (45%), and nurses/midwives (22%). Only a small number of nurse assistants (6%) provided nutrition assessment.
The least practiced were taking height/length, hemoglobin estimation, and checking for pallor. On the contrary, at ART sites, all methods of nutrition assessment were practiced at hospitals (100%), except for taking dietary history (50%). At the HC IV level, at all service points, checking for pallor, edema, and taking weight and dietary history were mostly performed. Taking MUAC, measuring hemoglobin estimation, and taking height were the least done. This trend was the same for HC IIIs. At ART sites in HC IVs, it was reported that nutrition assessment was commonly performed through taking weight, measuring MUAC, checking for pallor, and taking dietary
Grouped TQ
Specialized MD
Medical/MC Officer
Nurse/Midwife
Nurse Assistant
Pharmacy Staff Lab Staff Nutritionist Allied
Health Other
Pre-
serv
ice
IYCF 0 (0%) 4 (31%) 12 (29%) 0 (0%) 0 (0%) 0 (0%) 1 (33%) 0 (0%) 0 (0%)
ENAs 0 (0%) 1 (8%) 4 (10%) 0 (0%) 0 (0%) 0 (0%) 1 (33%) 1 (25%) 0 (0%)
IMAM 0 (0%) 1 (8%) 5 (12%) 1 (17%) 0 (0%) 0 (0%) 0 (0%) 1 (25%) 0 (0%)
IMCI 0 (0%) 10 (77%) 23 (55%) 3 (50%) 0 (0%) 0 (0%) 1 (33%) 3 (50%) 1 (33%)
NACS 0 (0%) 2 (17%) 2 (5%) 0 (0%) 0 (0%) 0 (0%) 1 (33%) 1 (25%) 0 (0%)
PLWHIV 0 (0%) 3 (23%) 2 (5%) 0 (0%) 0 (0%) 0 (0%) 1 (33%) 1 (25%) 0 (0%)
In-s
ervi
ce
IYCF 0 (0%) 4 (31%) 25 (60%) 2 (33%) 0 (0%) 0 (0%) 2 (67%) 2 (50%) 2 (67%)
ENAs 0 (0%) 0 (0%) 5 (12%) 3 (50%) 1 (100%) 0 (0%) 1 (33%) 1 (25%) 0 (0%)
IMAM 0 (0%) 5 (42%) 17 (40%) 2 (33%) 0 (0%) 0 (0%) 2 (67%) 1 (25%) 2 (67%)
IMCI 0 (0%) 10 (77%) 13 (31%) 3 (50%) 0 (0%) 0 (0%) 1 (33%) 1 (25%) 0 (0%)
NACS 0 (0%) 5 (38%) 14 (33%) 1 (17%) 1 (100%) 0 (0%) 0 (0%) 0 (0%) 0 (0%)
PLWHIV 1 (100%) 8 (62%) 19 (45%) 4 (67%) 0 (0%) 1 (100%) 2 (67%) 1 (50%) 1 (33%)
Past
one
Yea
r
IYCF 0 (0%) 7 (29%) 1 (50%) 0 (0%) 1 (50%) 0 (0%)
ENAs 0 (0%) 2 (67%) 0 (0%) 1 (100%) 0 (0%) IMAM 2 (40%) 6 (35%) 2 (100%) 1 (50%) 0 (0%) 0 (0%)
IMCI 3 (30%) 3 (23%) 0 (0%) 0 (0%) 0 (0%) NACS 3 (60%) 4 (29%) 0 (0%) 0 (0%)
PLWHIV 0 (0%) 2 (25%) 3 (16%) 1 (25%) 0 (0%) 0 (0%) 1 (50%) 0 (0%)
Average % of Facilities Who Include Practice in Nutritional Status Assessment, Average All Services
Hospital (n=2)
HC IV (n=6)
HC III (n=26)
Taking MUAC 100% 25% 15%Taking height/length 55% 32% 12%Taking weight 100% 93% 67%Checking for edema 100% 96% 92%Checking for pallor (i.e., pale palms and inner eyelids) 80% 100% 95%Hemoglobin estimation 80% 35% 22%Taking dietary history 83% 90% 83%Average % of Facilities Who Include Practice in Nutritional Status Assessment, ART Services Only
Hospital (n=2)
HC IV (n=3)
HC III (n=7)
Taking MUAC 100% 75% 17%Taking height/length 100% 75% 17%Taking weight 100% 100% 50%Checking for edema 100% 100% 83%Checking for pallor (i.e., pale palms and inner eyelids) 100% 100% 100%Hemoglobin estimation 100% 50% *14%Taking dietary history 50% 100% 100%
Table 3.21: Nutrition Assessment Services Offered at Different Contact Points by Type of Facility, SPRING/Uganda Districts
30
*n=7
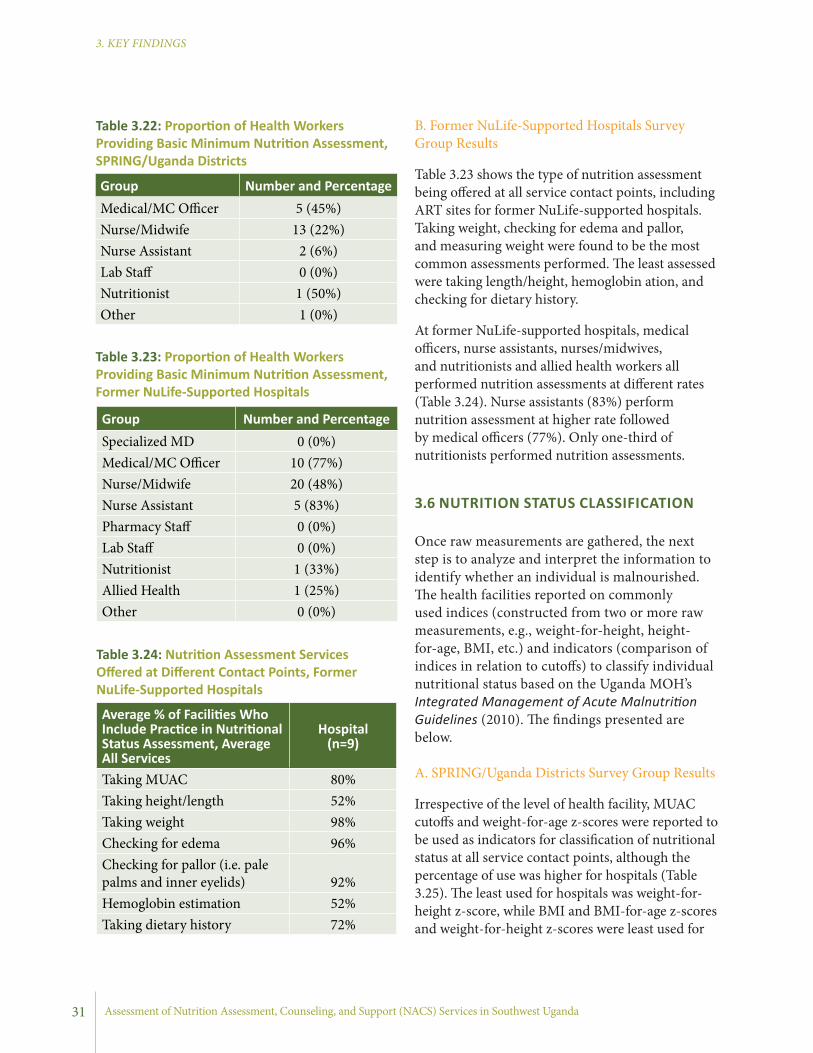
Assessment of Nutrition Assessment, Counseling, and Support (NACS) Services in Southwest Uganda
3. KEY FINDINGS
B. Former NuLife-Supported Hospitals Survey Group Results
Table 3.23 shows the type of nutrition assessment being offered at all service contact points, including ART sites for former NuLife-supported hospitals. Taking weight, checking for edema and pallor, and measuring weight were found to be the most common assessments performed. The least assessed were taking length/height, hemoglobin ation, and checking for dietary history.
At former NuLife-supported hospitals, medical officers, nurse assistants, nurses/midwives, and nutritionists and allied health workers all performed nutrition assessments at different rates (Table 3.24). Nurse assistants (83%) perform nutrition assessment at higher rate followed by medical officers (77%). Only one-third of nutritionists performed nutrition assessments.
3.6 NUTRITION STATUS CLASSIFICATION
Once raw measurements are gathered, the next step is to analyze and interpret the information to identify whether an individual is malnourished. The health facilities reported on commonly used indices (constructed from two or more raw measurements, e.g., weight-for-height, height-for-age, BMI, etc.) and indicators (comparison of indices in relation to cutoffs) to classify individual nutritional status based on the Uganda MOH’s Integrated Management of Acute Malnutrition Guidelines (2010). The findings presented are below.
A. SPRING/Uganda Districts Survey Group Results
Irrespective of the level of health facility, MUAC cutoffs and weight-for-age z-scores were reported to be used as indicators for classification of nutritional status at all service contact points, although the percentage of use was higher for hospitals (Table 3.25). The least used for hospitals was weight-for-height z-score, while BMI and BMI-for-age z-scores and weight-for-height z-scores were least used for
Group Number and PercentageMedical/MC Officer 5 (45%)Nurse/Midwife 13 (22%)Nurse Assistant 2 (6%)Lab Staff 0 (0%)Nutritionist 1 (50%)Other 1 (0%)
Table 3.22: Proportion of Health Workers Providing Basic Minimum Nutrition Assessment, SPRING/Uganda Districts
Average % of Facilities Who Include Practice in Nutritional Status Assessment, Average All Services
Hospital (n=9)
Taking MUAC 80%Taking height/length 52%Taking weight 98%Checking for edema 96%Checking for pallor (i.e. pale palms and inner eyelids) 92%Hemoglobin estimation 52%Taking dietary history 72%
Group Number and PercentageSpecialized MD 0 (0%)Medical/MC Officer 10 (77%)Nurse/Midwife 20 (48%)Nurse Assistant 5 (83%)Pharmacy Staff 0 (0%)Lab Staff 0 (0%)Nutritionist 1 (33%)Allied Health 1 (25%)Other 0 (0%)
Table 3.23: Proportion of Health Workers Providing Basic Minimum Nutrition Assessment, Former NuLife-Supported Hospitals
Table 3.24: Nutrition Assessment Services Offered at Different Contact Points, Former NuLife-Supported Hospitals
31

June 2013
3. KEY FINDINGS
Average % of Facilities Who Use Indicators to Classify Malnutrition, Average All Services
Hospital (n=2)
HC IV (n=7)
HC III (n=25)
MUAC cutoffs 100% 25% 18%Weight-for-height Z scores 37% 19% 3%Weight-for-age Z scores 63% 40% 31%BMI-for-age Z Scores 100% 5% 0%BMI cutoffs 100% 4% 1%
% of Facilities Who Use Indicators to Classify Malnutrition, ART Services Only
Hospital (n=2)
HC IV (n=4)
HC III (n=6)
MUAC cutoffs 100% 100% 17%Weight-for-height Z scores 100% 25% 0%Weight-for-age Z scores 100% 50% 17%BMI-for-age Z Scores 0% 25% 0%BMI cutoffs 0% 0% 25%*
Table 3.25: Types of Nutrition Indicators Used for Classification of Nutritional Status by Type of Facilities, SPRING/Uganda Districts
*only 5 HC IIIs provided data on this question
both types of HCs. At ART service contact points, it should be noted that hospitals reported use of weight-for-height z-score for classification, though it was not the most used method for assessing nutritional status. Use of MUAC and weight-for-age z-scores were the most used indicators for classification of nutritional status at both HCs, though the practice of classifying nutritional status was generally lower for these facilities compared to hospitals.
During the assessment, data collectors observed some health workers conducting nutrition assessments. Over half of the health workers weighed clients and recorded their weight; however, very few health workers measured height, measured MUAC, or asked about food and liquid intake in the previous day (Table 3.26).
B. Former NuLife-Supported Hospitals Survey Group Results
Former NuLife-supported hospitals commonly used MUAC cut-offs to classify nutritional status (76%). However, it is important to note that the practice of classifying nutritional assessment was lower compared to nutrition assessment. Taking weight and height were reported by over 90% (Table 3.27) of these facilities, while only 20% reported using weight-for-height z-scores for classification of nutritional status.
In the former NuLife-supported hospitals, nearly all health workers weighed clients and recorded the weight (Table 3.28). Nearly two-thirds of health workers also measured MUAC, but very few measured height/length of the client or asked about food and liquid intake in the previous day.
32
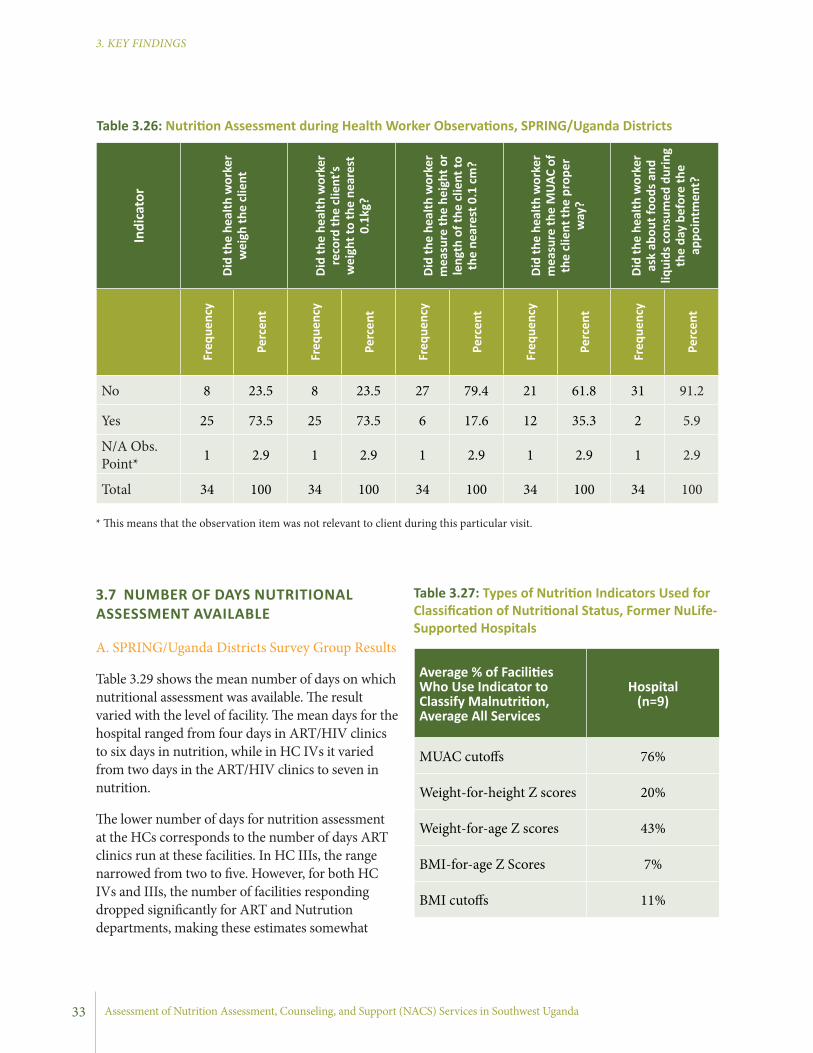
Assessment of Nutrition Assessment, Counseling, and Support (NACS) Services in Southwest Uganda
3. KEY FINDINGS
3.7 NUMBER OF DAYS NUTRITIONAL ASSESSMENT AVAILABLE
A. SPRING/Uganda Districts Survey Group Results
Table 3.29 shows the mean number of days on which nutritional assessment was available. The result varied with the level of facility. The mean days for the hospital ranged from four days in ART/HIV clinics to six days in nutrition, while in HC IVs it varied from two days in the ART/HIV clinics to seven in nutrition.
The lower number of days for nutrition assessment at the HCs corresponds to the number of days ART clinics run at these facilities. In HC IIIs, the range narrowed from two to five. However, for both HC IVs and IIIs, the number of facilities responding dropped significantly for ART and Nutrution departments, making these estimates somewhat
Indi
cato
r
Did
the
heal
th w
orke
r w
eigh
the
clie
nt
Did
the
heal
th w
orke
r re
cord
the
clie
nt’s
wei
ght t
o th
e ne
ares
t 0.
1kg?
Did
the
heal
th w
orke
r m
easu
re th
e he
ight
or
leng
th o
f the
clie
nt to
th
e ne
ares
t 0.1
cm
?
Did
the
heal
th w
orke
r m
easu
re th
e M
UAC
of
the
clie
nt th
e pr
oper
w
ay?
Did
the
heal
th w
orke
r as
k ab
out f
oods
and
liq
uids
con
sum
ed d
urin
g th
e da
y be
fore
the
appo
intm
ent?
Freq
uenc
y
Perc
ent
Freq
uenc
y
Perc
ent
Freq
uenc
y
Perc
ent
Freq
uenc
y
Perc
ent
Freq
uenc
y
Perc
ent
No 8 23.5 8 23.5 27 79.4 21 61.8 31 91.2
Yes 25 73.5 25 73.5 6 17.6 12 35.3 2 5.9
N/A Obs. Point* 1 2.9 1 2.9 1 2.9 1 2.9 1 2.9
Total 34 100 34 100 34 100 34 100 34 100
Table 3.26: Nutrition Assessment during Health Worker Observations, SPRING/Uganda Districts
* This means that the observation item was not relevant to client during this particular visit.
Average % of Facilities Who Use Indicator to Classify Malnutrition, Average All Services
Hospital (n=9)
MUAC cutoffs 76%
Weight-for-height Z scores 20%
Weight-for-age Z scores 43%
BMI-for-age Z Scores 7%
BMI cutoffs 11%
Table 3.27: Types of Nutrition Indicators Used for Classification of Nutritional Status, Former NuLife-Supported Hospitals
33

June 2013
3. KEY FINDINGS
seemed fairly constant by service points (five days) except for ART sites which reported an average of four days per week (Table 3.30). This shows that the basic nutrition assessment is part of ongoing services and is being delivered nearly on a daily basis, though the survey did not look at the quality of nutrition services being provided.
Indi
cato
r
Did
the
heal
th
wor
ker w
eigh
the
clie
nt
Did
the
heal
th
wor
ker r
ecor
d th
e cl
ient
’s w
eigh
t to
the
near
est 0
.1kg
?
Did
the
heal
th
wor
ker m
easu
re
the
heig
ht o
r len
gth
of th
e cl
ient
to th
e ne
ares
t 0.1
cm
?
Did
the
heal
th
wor
ker m
easu
re
the
mid
dle
uppe
r ar
m c
ircum
fere
nce
(MUA
C) o
f the
clie
nt
the
prop
er w
ay?
Did
the
heal
th
wor
ker a
sk a
bout
fo
ods a
nd li
quid
s co
nsum
ed d
urin
g th
e da
y be
fore
the
appo
intm
ent?
Freq
uenc
y
Perc
ent
Freq
uenc
y
Perc
ent
Freq
uenc
y
Perc
ent
Freq
uenc
y
Perc
ent
Freq
uenc
y
Perc
ent
No 1 6 2 13 13 81 6 38 16 100Yes 15 94 14 88 3 19 10 63 0 0Total 16 100 16 100 16 100 16 100 16 100
Table 3.28: Nutrition Assessment During Health Worker Observations, Former NuLife-Supported Hospitals
Average Number of Days Nutritonal Assessment is Available
Hospital (n=2)
HC IV (n=3)
HC III (n=7)
Pediatric OPD 5* 4 5
ART 4 2* 2*
ANC 5 4 2Young Child Clinic 5* 2 2
Nutrition 6 7* 5*
*Significantly fewer than total number of facilities answered this question
Table 3.29: Number of Days Nutrition Assessments were Offered, by Type of Facility, SPRING/Uganda Districts
unreliable. This may be due to the fact that these services were not commonly offered at this level.
B. Former NuLife-Supported Hospitals Survey Group Sites
The average days for nutritional assessment offered
Table 3.30: Number of Days Nutrition Assessments were Offered, Former NuLife-Supported Hospitals
Average Number of Days Nutritional Assessment is Available
Hospital (n=9)
Pediatric OPD 5
ART 4
ANC 5
Young Child Clinic 5
Nutrition 5
34
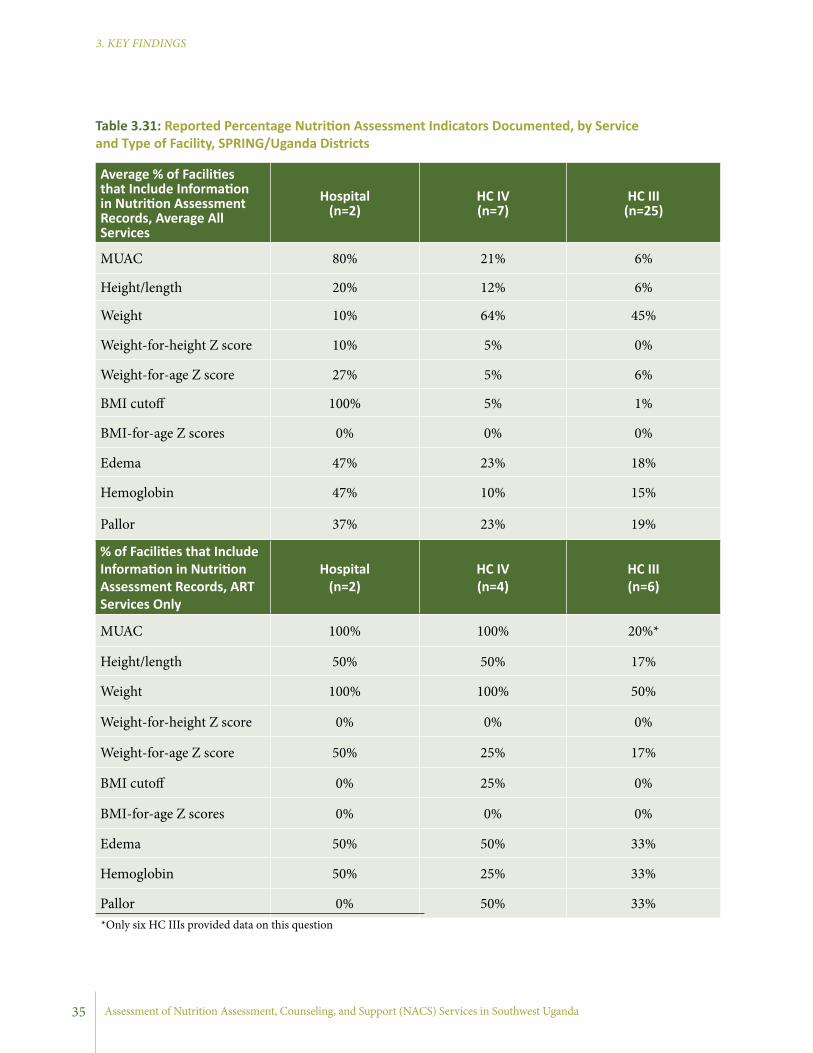
Assessment of Nutrition Assessment, Counseling, and Support (NACS) Services in Southwest Uganda
3. KEY FINDINGS
Average % of Facilities that Include Information in Nutrition Assessment Records, Average All Services
Hospital (n=2)
HC IV (n=7)
HC III (n=25)
MUAC 80% 21% 6%
Height/length 20% 12% 6%
Weight 10% 64% 45%
Weight-for-height Z score 10% 5% 0%
Weight-for-age Z score 27% 5% 6%
BMI cutoff 100% 5% 1%
BMI-for-age Z scores 0% 0% 0%
Edema 47% 23% 18%
Hemoglobin 47% 10% 15%
Pallor 37% 23% 19%
% of Facilities that Include Information in Nutrition Assessment Records, ART Services Only
Hospital (n=2)
HC IV (n=4)
HC III (n=6)
MUAC 100% 100% 20%*
Height/length 50% 50% 17%
Weight 100% 100% 50%
Weight-for-height Z score 0% 0% 0%
Weight-for-age Z score 50% 25% 17%
BMI cutoff 0% 25% 0%
BMI-for-age Z scores 0% 0% 0%
Edema 50% 50% 33%
Hemoglobin 50% 25% 33%
Pallor 0% 50% 33%
Table 3.31: Reported Percentage Nutrition Assessment Indicators Documented, by Service and Type of Facility, SPRING/Uganda Districts
*Only six HC IIIs provided data on this question
35

June 2013
3. KEY FINDINGS
0
20
40
60
80
100
HC III (n=25)HC IV (n=5)Hospital (n=1)
Patient registers
Client cards
Clinic reports
Clinic reports
Perc
enta
ge
Figure 3.2: Percent of Facilities Reporting Nutrition Documentation in Pediatric OPDs, by Type of Facility, SPRING/Uganda Districts
Figure 3.3: Percent of Facilities Reporting Nutrition Documentation in ANC, by Type of Facility, SPRING/Uganda Districts
0
20
40
60
80
100
HC III (n=25)HC IV (n=5)Hospital (n=1)
Patient registers
Client cards
Clinic reports
Clinic reports
Perc
enta
ge
36

Assessment of Nutrition Assessment, Counseling, and Support (NACS) Services in Southwest Uganda
3. KEY FINDINGS
cards. At YCCs, nutrition information was mostly recorded in patient registers and client cards. Client and child health cards were widely used at HCs.
B. Former NuLife-Supported Hospitals Survey Group Results
The practice of including indicators in records was relatively rarer compared to undertaking a nutritional asessment (Table 3.32). Among the different nutrition information gathered, MUAC, weight, length/height, and BMI-for-age z-scores were commonly included in records at each contact point.
Table 3.33 presents results on use of documents for registering nutrition information in the former NuLife-supported hospitals. Documentation seems generally weak for other services compared to ART services. Client cards, patient registers, and clinical reports were found to be the most common documents where nutrition information was recorded. Use of child health cards was higher for ART clinics compared to all combined services sites.
3.8 DOCUMENTATION OF NUTRITION INFORMATION
A. SPRING/Uganda Intervention Areas Survey Results
Documentation of nutrition services was requested, but so few HCs responded at ART service contact points that results may not be representative for ART services. Reported documentation of nutrition information varied widely by service and facility type (Table 3.31). For all services, hospitals responded that weight, MUAC, BMI, edema, and hemoglobin were commonly recorded, while at HC IVs and HC IIIs weight, edema, and pallor were recorded often. Moreover, Figures 3.2, 3.3, and 3.4 show that place for nutrition documentation varied with the level of health facilities and type of services. Hospitals and HCs recorded nutrition information in all four records at pediatric OPD (patient register, client card, clinic record, and child health cards), while at ANC clinics documentation was mostly limited to patient registers and client
Figure 3.4: Percent of Facilities Reporting Use of Nutrition Documentation in Young Child Clinics, by Type of Facility, SPRING/Uganda Districts
0
20
40
60
80
100
HC III (n=25)HC IV (n=5)Hospital (n=1)
Patient registers
Client cards
Clinic reports
Clinic reports
Perc
enta
ge
37
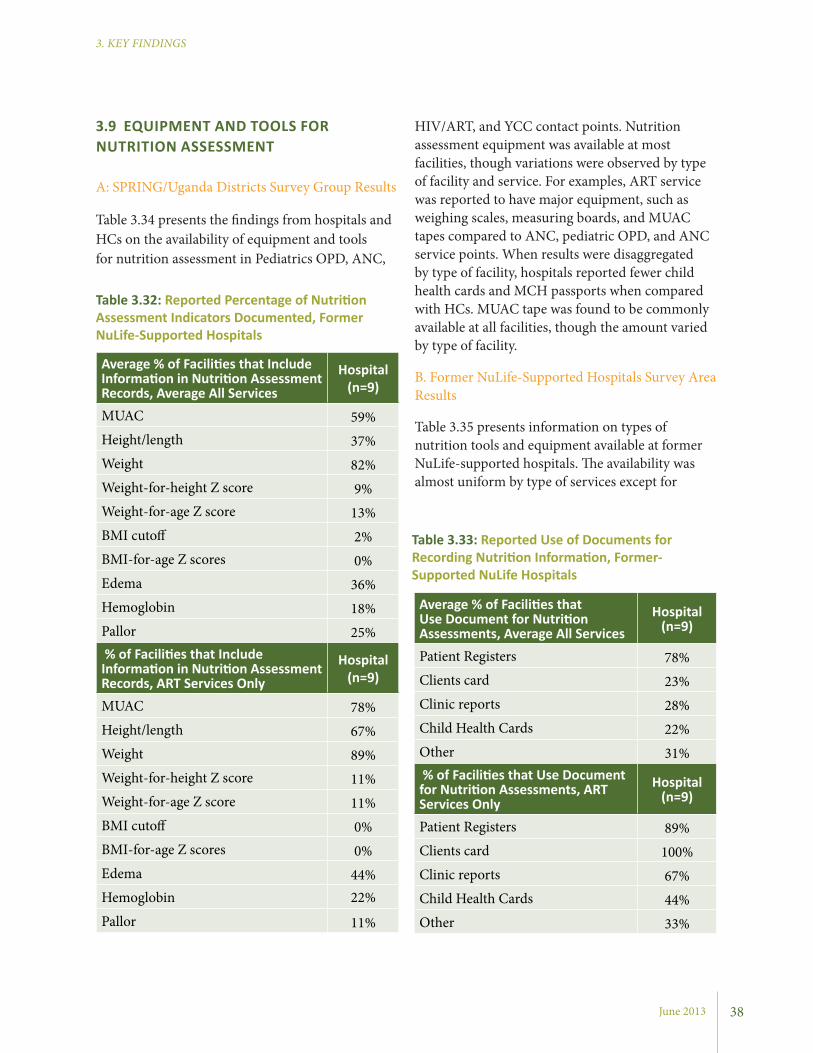
June 2013
3. KEY FINDINGS
HIV/ART, and YCC contact points. Nutrition assessment equipment was available at most facilities, though variations were observed by type of facility and service. For examples, ART service was reported to have major equipment, such as weighing scales, measuring boards, and MUAC tapes compared to ANC, pediatric OPD, and ANC service points. When results were disaggregated by type of facility, hospitals reported fewer child health cards and MCH passports when compared with HCs. MUAC tape was found to be commonly available at all facilities, though the amount varied by type of facility.
B. Former NuLife-Supported Hospitals Survey Area Results
Table 3.35 presents information on types of nutrition tools and equipment available at former NuLife-supported hospitals. The availability was almost uniform by type of services except for
3.9 EQUIPMENT AND TOOLS FOR NUTRITION ASSESSMENT
A: SPRING/Uganda Districts Survey Group Results
Table 3.34 presents the findings from hospitals and HCs on the availability of equipment and tools for nutrition assessment in Pediatrics OPD, ANC,
Average % of Facilities that Include Information in Nutrition Assessment Records, Average All Services
Hospital (n=9)
MUAC 59%Height/length 37%Weight 82%Weight-for-height Z score 9%Weight-for-age Z score 13%BMI cutoff 2%BMI-for-age Z scores 0%Edema 36%Hemoglobin 18%Pallor 25% % of Facilities that Include Information in Nutrition Assessment Records, ART Services Only
Hospital (n=9)
MUAC 78%Height/length 67%Weight 89%Weight-for-height Z score 11%Weight-for-age Z score 11%BMI cutoff 0%BMI-for-age Z scores 0%Edema 44%Hemoglobin 22%
Pallor 11%
Average % of Facilities that Use Document for Nutrition Assessments, Average All Services
Hospital (n=9)
Patient Registers 78%Clients card 23%Clinic reports 28%Child Health Cards 22%Other 31% % of Facilities that Use Document for Nutrition Assessments, ART Services Only
Hospital (n=9)
Patient Registers 89%Clients card 100%Clinic reports 67%Child Health Cards 44%Other 33%
Table 3.32: Reported Percentage of Nutrition Assessment Indicators Documented, Former NuLife-Supported Hospitals
Table 3.33: Reported Use of Documents for Recording Nutrition Information, Former-Supported NuLife Hospitals
38

Assessment of Nutrition Assessment, Counseling, and Support (NACS) Services in Southwest Uganda
3. KEY FINDINGS
Pediatric OPD
Infa
nt/P
edia
tric
Sc
ale
Adul
t wei
ghin
g Sc
ale
Leng
th b
oard
Stad
iom
eter
(for
ad
ults
)
MUA
C ta
pes:
ad
ults
MUA
C ta
pes:
ch
ildre
n
Child
hea
lth c
ards
Mot
hers
Pas
spor
t /
MCH
Pas
spor
t, AN
C Ca
rd
Mean Available: Hospitals 1 1 50 50
Mean Available: HC IV 1.7 1 0.7 0.3 0 1.7 183
Mean Available: HC III 1.8 1.2 0.8 0.7 1.9 4.1 110 23
ART
Mean Available: Hospitals 1 2 1 1 11 17.5
Mean Available: HC IV 1.67 1.67 1.33 1 3 7.25 200
Mean Available: HC III 1 0.25 0.33 0.25 0 27.67 66.67 0.5
ANC
Mean Available: Hospitals 1 1 3 1 91
Mean Available: HC IV 1.33 1.25 0.5 0.5 0 2 66.67
Mean Available: HC III 1.26 0.89 0.25 0.54 1.67 1.5 94.38 12.2
YCC
Mean Available: Hospitals 2 2 4
Mean Available: HC IV 1.57 0.33 0.33 0 0 30.33 205.71 500
Mean Available: HC III 1.43 0.63 0.8 0.17 0 1.6 121.95 7.5
A. SPRING/Uganda Districts Survey Group Results
Survey findings revealed that counseling services were provided to clients visiting hospitals and HCs evaluated in this study (Table 3.36). Counseling was reported to be provided at all services and ART contact points in fairly similar rates by type of facilities. Table 3.36 also shows that only about one-third of facilities reported having a space for documenting counseling. The use of the available space in the records for documenting counseling services offered to the clients were generally poor in hospitals (50%) and in HC IVs (67%) compared
MUAC tape. More MUAC tapes were reported at all sites compared to weighing scales and measuring boards. Interestingly, more child health cards and MCH passports were reported in these facilities compared to hospitals at SPRING/Uganda districts.
3.10 NUTRITION COUNSELING
Nutrition counselling focuses on key messages for the promotion of optimum IYCF, maternal nutrition and HIV and nutrition, and is offered continuously at all visits and service contact points.
Table 3.34: Availability of Equipment and Tools for Assessment of Nutrition Status at Pediatric OPD, SPRING/Uganda Districts
*N/A treated as missing
39
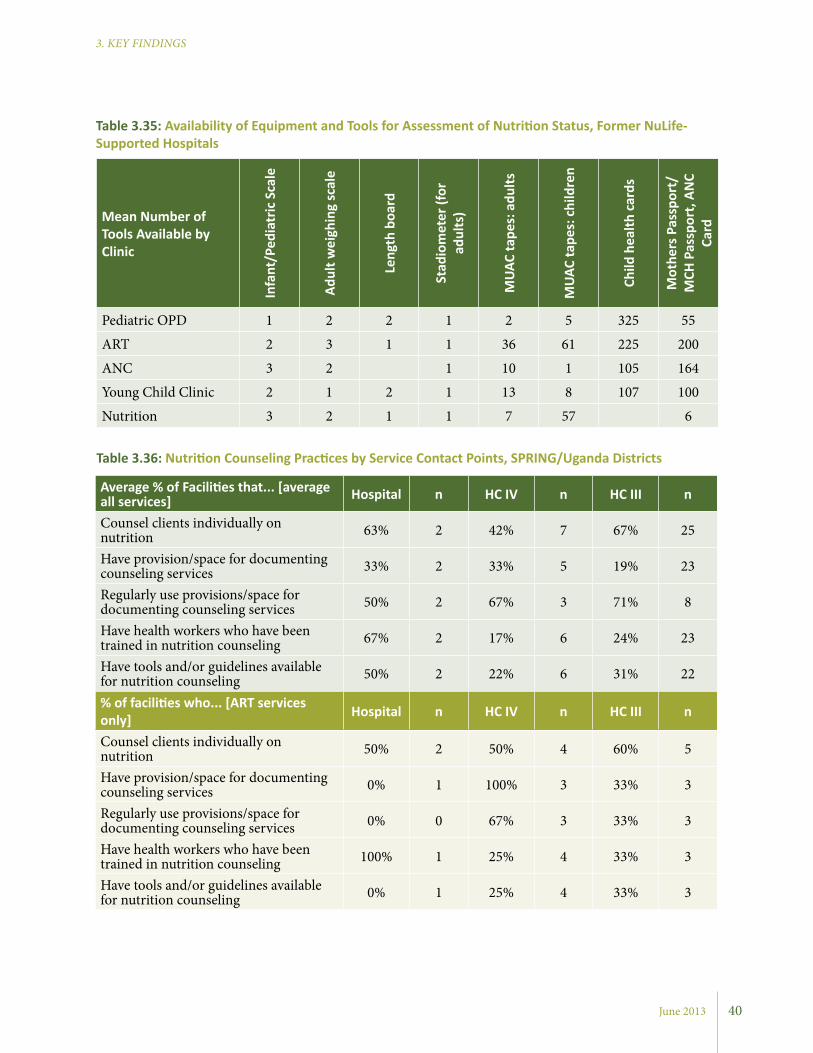
June 2013
3. KEY FINDINGS
Mean Number of Tools Available by Clinic
Infa
nt/P
edia
tric
Sca
le
Adul
t wei
ghin
g sc
ale
Leng
th b
oard
Stad
iom
eter
(for
ad
ults
)
MUA
C ta
pes:
adu
lts
MUA
C ta
pes:
chi
ldre
n
Child
hea
lth c
ards
Mot
hers
Pas
spor
t/
MCH
Pas
spor
t, AN
C Ca
rd
Pediatric OPD 1 2 2 1 2 5 325 55
ART 2 3 1 1 36 61 225 200
ANC 3 2 1 10 1 105 164
Young Child Clinic 2 1 2 1 13 8 107 100
Nutrition 3 2 1 1 7 57 6
Table 3.35: Availability of Equipment and Tools for Assessment of Nutrition Status, Former NuLife-Supported Hospitals
Average % of Facilities that... [average all services] Hospital n HC IV n HC III n
Counsel clients individually on nutrition 63% 2 42% 7 67% 25
Have provision/space for documenting counseling services 33% 2 33% 5 19% 23
Regularly use provisions/space for documenting counseling services 50% 2 67% 3 71% 8
Have health workers who have been trained in nutrition counseling 67% 2 17% 6 24% 23
Have tools and/or guidelines available for nutrition counseling 50% 2 22% 6 31% 22
% of facilities who... [ART services only] Hospital n HC IV n HC III n
Counsel clients individually on nutrition 50% 2 50% 4 60% 5
Have provision/space for documenting counseling services 0% 1 100% 3 33% 3
Regularly use provisions/space for documenting counseling services 0% 0 67% 3 33% 3
Have health workers who have been trained in nutrition counseling 100% 1 25% 4 33% 3
Have tools and/or guidelines available for nutrition counseling 0% 1 25% 4 33% 3
Table 3.36: Nutrition Counseling Practices by Service Contact Points, SPRING/Uganda Districts
40

Assessment of Nutrition Assessment, Counseling, and Support (NACS) Services in Southwest Uganda
3. KEY FINDINGS
Number of practices observed 0 1 4 7 9 11 12 13 14
Number of health workers 2 2 1 1 3 2 4 3 3Percent 9.52 9.52 4.76 4.76 14.29 9.52 19.05 14.29 14.29
Table 3.37: Number of Counseling Best Practices Conducted by Observed Health Workers, SPRING/Uganda Districts
*This means that the observation item was not relevant to the client who was being observed. **This means that the observation item was not relevant to the client during this particular visit.
Indicator
No YesN/A Pop.
Group*
N/A Obs.
Point**Total
Preg
nant
wom
en Adhering to daily intake of one tablet of iron/folic acid for six months
Frequency 5 13 5 11 34
Percent 14.7 38.2 14.7 32.4 100
Counseling on possible (and side effects from iron/folic acid supplements and ways of minimizing the side effects
Frequency 13 5 5 11 34
Percent 38.2 14.7 14.7 32.4 100
Preg
nant
wom
en in
3rd
tr
imes
ter
Initiating breastfeeding within one hour after delivery
Frequency 5 1 10 18 34
Percent 14.7 2.9 29.4 52.9 100
Breastfeeding exclusively for six monthsFrequency 4 2 10 18 34
Percent 11.8 5.9 29.4 52.9 100
Continuing breastfeeding during illnessFrequency 5 1 10 18 34
Percent 14.7 2.9 29.4 52.9 100
Lact
ating
mot
hers How to sustain exclusive breastfeeding for
six months
Frequency 3 5 12 14 34
Percent 8.8 14.7 35.3 41.2 100
Eating two extra meals each day to maintain their health and that of their babies
Frequency 6 2 12 14 34
Percent 17.6 5.9 35.3 41.2 100
Child
ren
unde
r tw
o
Increasing the frequency of breastfeeding during and after illness
Frequency 4 6 11 13 34
Percent 11.8 17.6 32.4 38.2 100
Continuing breastfeeding even when mother is sick
Frequency 3 7 11 13 34
Percent 8.8 20.6 32.4 38.2 100
Table 3.38: Key Practices Mentioned during Observed Counseling Sessions, SPRING/Uganda Districts
41
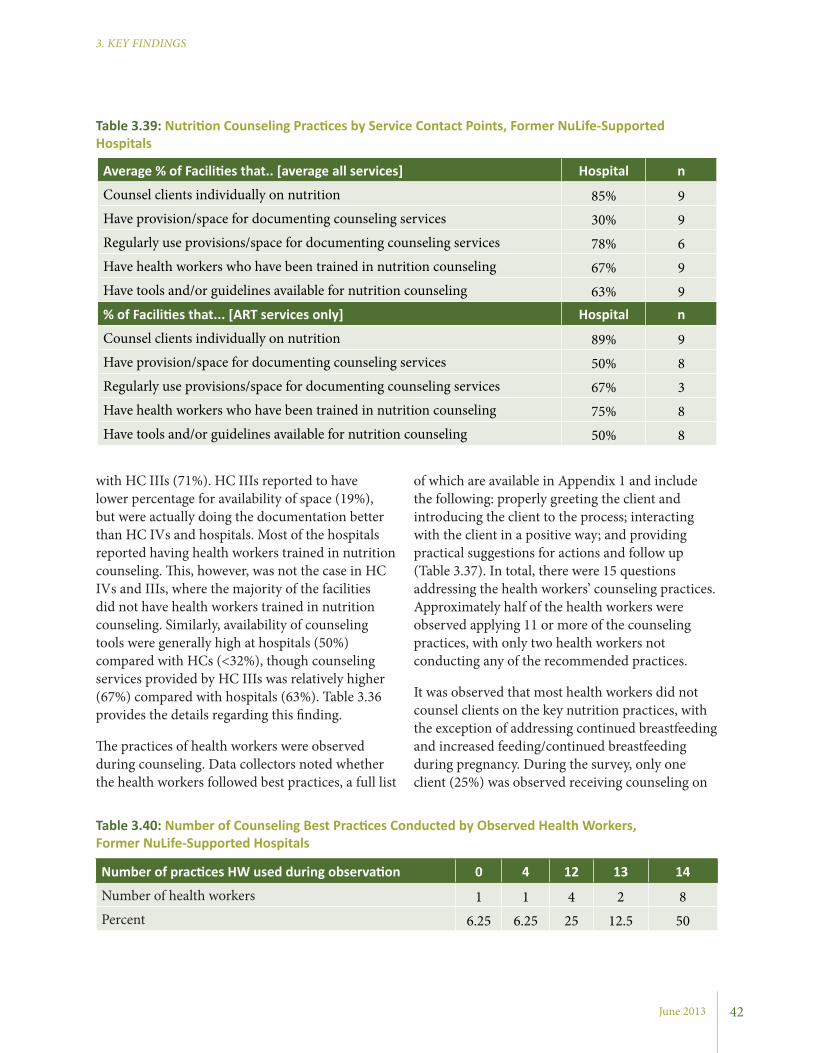
June 2013
3. KEY FINDINGS
of which are available in Appendix 1 and include the following: properly greeting the client and introducing the client to the process; interacting with the client in a positive way; and providing practical suggestions for actions and follow up (Table 3.37). In total, there were 15 questions addressing the health workers’ counseling practices. Approximately half of the health workers were observed applying 11 or more of the counseling practices, with only two health workers not conducting any of the recommended practices.
It was observed that most health workers did not counsel clients on the key nutrition practices, with the exception of addressing continued breastfeeding and increased feeding/continued breastfeeding during pregnancy. During the survey, only one client (25%) was observed receiving counseling on
with HC IIIs (71%). HC IIIs reported to have lower percentage for availability of space (19%), but were actually doing the documentation better than HC IVs and hospitals. Most of the hospitals reported having health workers trained in nutrition counseling. This, however, was not the case in HC IVs and IIIs, where the majority of the facilities did not have health workers trained in nutrition counseling. Similarly, availability of counseling tools were generally high at hospitals (50%) compared with HCs (<32%), though counseling services provided by HC IIIs was relatively higher (67%) compared with hospitals (63%). Table 3.36 provides the details regarding this finding.
The practices of health workers were observed during counseling. Data collectors noted whether the health workers followed best practices, a full list
Average % of Facilities that.. [average all services] Hospital n
Counsel clients individually on nutrition 85% 9Have provision/space for documenting counseling services 30% 9Regularly use provisions/space for documenting counseling services 78% 6Have health workers who have been trained in nutrition counseling 67% 9Have tools and/or guidelines available for nutrition counseling 63% 9% of Facilities that... [ART services only] Hospital n
Counsel clients individually on nutrition 89% 9Have provision/space for documenting counseling services 50% 8Regularly use provisions/space for documenting counseling services 67% 3Have health workers who have been trained in nutrition counseling 75% 8Have tools and/or guidelines available for nutrition counseling 50% 8
Table 3.39: Nutrition Counseling Practices by Service Contact Points, Former NuLife-Supported Hospitals
Table 3.40: Number of Counseling Best Practices Conducted by Observed Health Workers, Former NuLife-Supported Hospitals
Number of practices HW used during observation 0 4 12 13 14
Number of health workers 1 1 4 2 8Percent 6.25 6.25 25 12.5 50
42
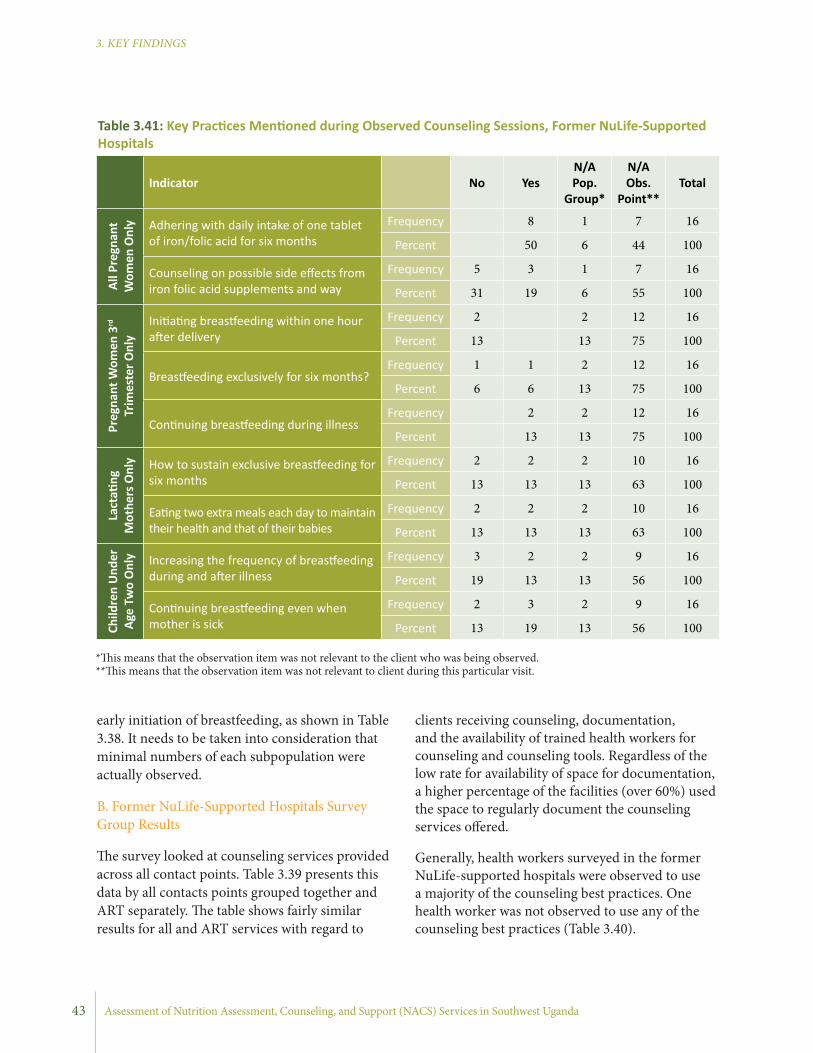
Assessment of Nutrition Assessment, Counseling, and Support (NACS) Services in Southwest Uganda
3. KEY FINDINGS
clients receiving counseling, documentation, and the availability of trained health workers for counseling and counseling tools. Regardless of the low rate for availability of space for documentation, a higher percentage of the facilities (over 60%) used the space to regularly document the counseling services offered.
Generally, health workers surveyed in the former NuLife-supported hospitals were observed to use a majority of the counseling best practices. One health worker was not observed to use any of the counseling best practices (Table 3.40).
early initiation of breastfeeding, as shown in Table 3.38. It needs to be taken into consideration that minimal numbers of each subpopulation were actually observed.
B. Former NuLife-Supported Hospitals Survey Group Results
The survey looked at counseling services provided across all contact points. Table 3.39 presents this data by all contacts points grouped together and ART separately. The table shows fairly similar results for all and ART services with regard to
Indicator
No YesN/A Pop.
Group*
N/A Obs.
Point**Total
All P
regn
ant
Wom
en O
nly Adhering with daily intake of one tablet
of iron/folic acid for six monthsFrequency 8 1 7 16
Percent 50 6 44 100
Counseling on possible side effects from iron folic acid supplements and way
Frequency 5 3 1 7 16
Percent 31 19 6 55 100
Preg
nant
Wom
en 3
rd
Trim
este
r Onl
y
Initiating breastfeeding within one hour after delivery
Frequency 2 2 12 16
Percent 13 13 75 100
Breastfeeding exclusively for six months?Frequency 1 1 2 12 16
Percent 6 6 13 75 100
Continuing breastfeeding during illnessFrequency 2 2 12 16
Percent 13 13 75 100
Lact
ating
M
othe
rs O
nly How to sustain exclusive breastfeeding for
six monthsFrequency 2 2 2 10 16
Percent 13 13 13 63 100
Eating two extra meals each day to maintain their health and that of their babies
Frequency 2 2 2 10 16
Percent 13 13 13 63 100
Child
ren
Und
er
Age
Two
Onl
y Increasing the frequency of breastfeeding during and after illness
Frequency 3 2 2 9 16
Percent 19 13 13 56 100
Continuing breastfeeding even when mother is sick
Frequency 2 3 2 9 16
Percent 13 19 13 56 100
*This means that the observation item was not relevant to the client who was being observed. **This means that the observation item was not relevant to client during this particular visit.
Table 3.41: Key Practices Mentioned during Observed Counseling Sessions, Former NuLife-Supported Hospitals
43
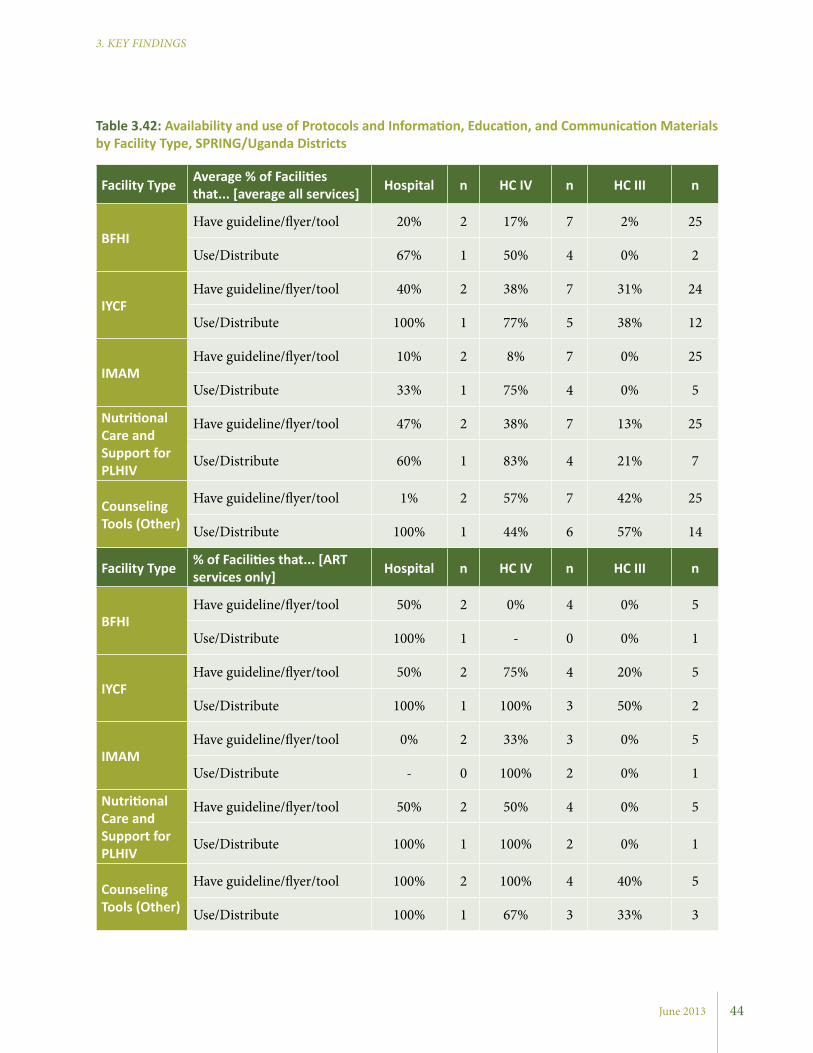
June 2013
3. KEY FINDINGS
Facility Type Average % of Facilities that... [average all services] Hospital n HC IV n HC III n
BFHIHave guideline/flyer/tool 20% 2 17% 7 2% 25
Use/Distribute 67% 1 50% 4 0% 2
IYCFHave guideline/flyer/tool 40% 2 38% 7 31% 24
Use/Distribute 100% 1 77% 5 38% 12
IMAMHave guideline/flyer/tool 10% 2 8% 7 0% 25
Use/Distribute 33% 1 75% 4 0% 5
Nutritional Care and Support for PLHIV
Have guideline/flyer/tool 47% 2 38% 7 13% 25
Use/Distribute 60% 1 83% 4 21% 7
Counseling Tools (Other)
Have guideline/flyer/tool 1% 2 57% 7 42% 25
Use/Distribute 100% 1 44% 6 57% 14
Facility Type % of Facilities that... [ART services only] Hospital n HC IV n HC III n
BFHIHave guideline/flyer/tool 50% 2 0% 4 0% 5
Use/Distribute 100% 1 - 0 0% 1
IYCFHave guideline/flyer/tool 50% 2 75% 4 20% 5
Use/Distribute 100% 1 100% 3 50% 2
IMAMHave guideline/flyer/tool 0% 2 33% 3 0% 5
Use/Distribute - 0 100% 2 0% 1
Nutritional Care and Support for PLHIV
Have guideline/flyer/tool 50% 2 50% 4 0% 5
Use/Distribute 100% 1 100% 2 0% 1
Counseling Tools (Other)
Have guideline/flyer/tool 100% 2 100% 4 40% 5
Use/Distribute 100% 1 67% 3 33% 3
Table 3.42: Availability and use of Protocols and Information, Education, and Communication Materials by Facility Type, SPRING/Uganda Districts
44
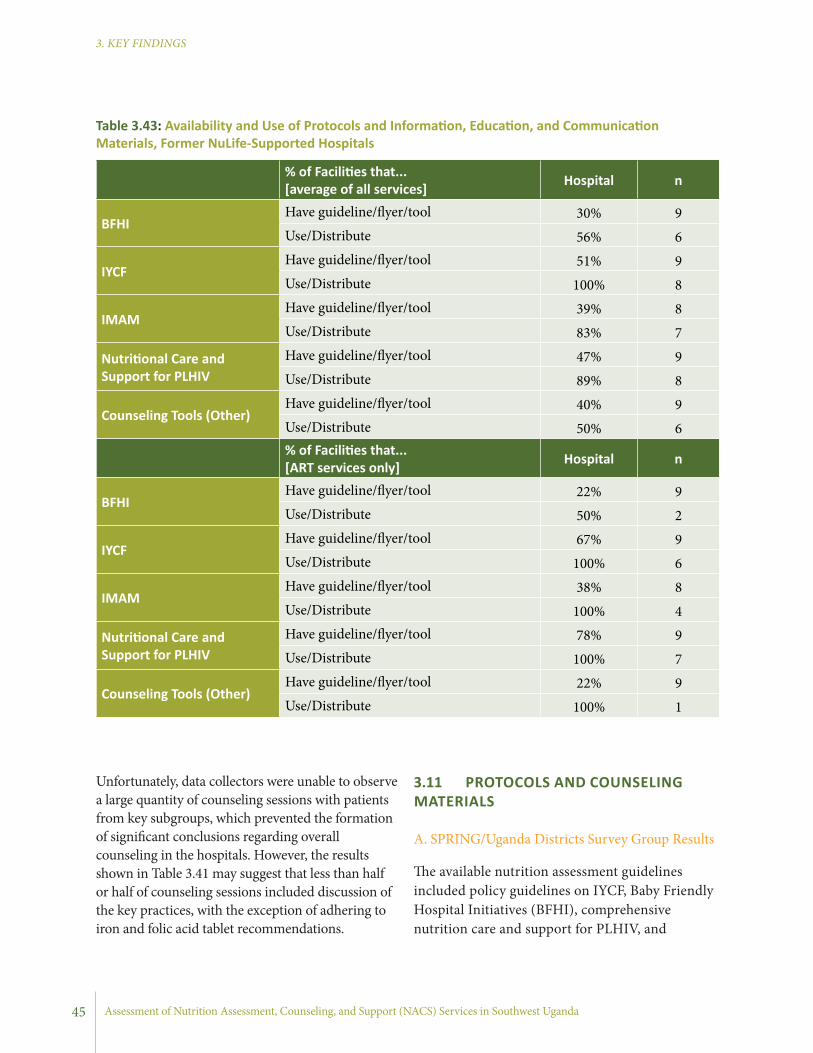
Assessment of Nutrition Assessment, Counseling, and Support (NACS) Services in Southwest Uganda
3. KEY FINDINGS
% of Facilities that... [average of all services] Hospital n
BFHIHave guideline/flyer/tool 30% 9Use/Distribute 56% 6
IYCFHave guideline/flyer/tool 51% 9Use/Distribute 100% 8
IMAMHave guideline/flyer/tool 39% 8Use/Distribute 83% 7
Nutritional Care and Support for PLHIV
Have guideline/flyer/tool 47% 9Use/Distribute 89% 8
Counseling Tools (Other)Have guideline/flyer/tool 40% 9Use/Distribute 50% 6% of Facilities that... [ART services only] Hospital n
BFHIHave guideline/flyer/tool 22% 9Use/Distribute 50% 2
IYCFHave guideline/flyer/tool 67% 9Use/Distribute 100% 6
IMAMHave guideline/flyer/tool 38% 8Use/Distribute 100% 4
Nutritional Care and Support for PLHIV
Have guideline/flyer/tool 78% 9Use/Distribute 100% 7
Counseling Tools (Other)Have guideline/flyer/tool 22% 9Use/Distribute 100% 1
Table 3.43: Availability and Use of Protocols and Information, Education, and Communication Materials, Former NuLife-Supported Hospitals
Unfortunately, data collectors were unable to observe a large quantity of counseling sessions with patients from key subgroups, which prevented the formation of significant conclusions regarding overall counseling in the hospitals. However, the results shown in Table 3.41 may suggest that less than half or half of counseling sessions included discussion of the key practices, with the exception of adhering to iron and folic acid tablet recommendations.
3.11 PROTOCOLS AND COUNSELING MATERIALS
A. SPRING/Uganda Districts Survey Group Results
The available nutrition assessment guidelines included policy guidelines on IYCF, Baby Friendly Hospital Initiatives (BFHI), comprehensive nutrition care and support for PLHIV, and
45
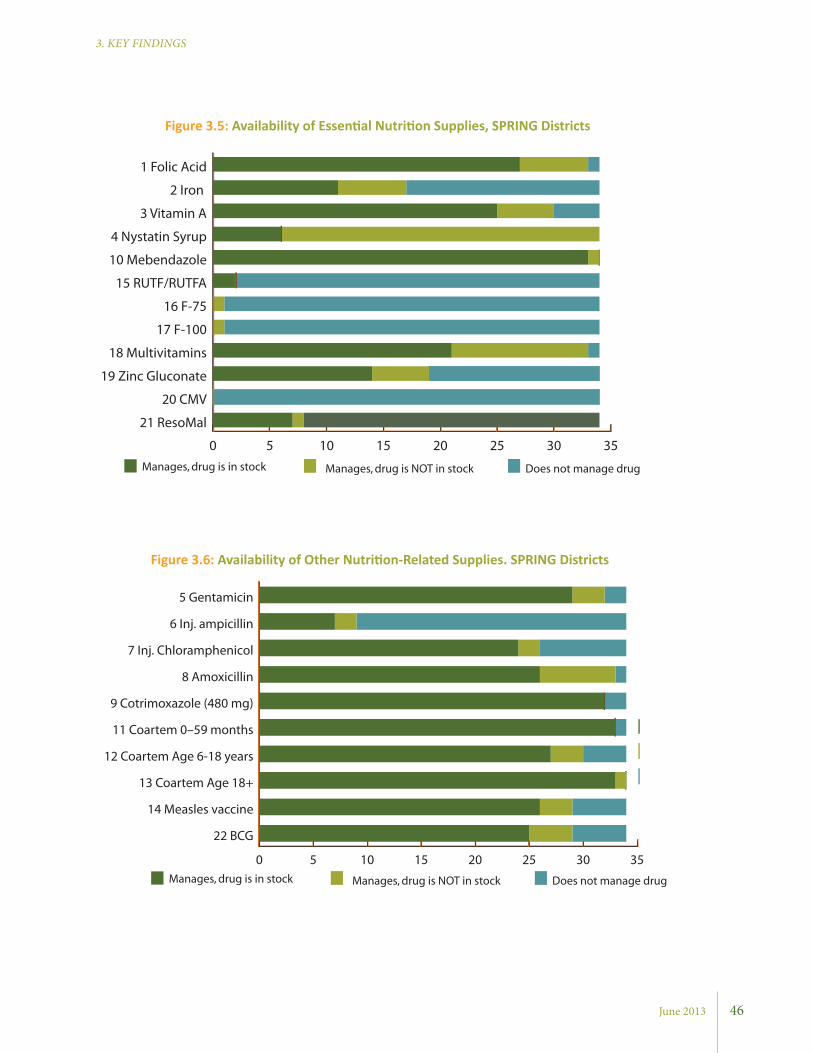
June 2013
3. KEY FINDINGS
0 5 10 15 20 25 30 35
21 ResoMal
20 CMV
19 Zinc Gluconate
18 Multivitamins
17 F-100
16 F-75
15 RUTF/RUTFA
10 Mebendazole
4 Nystatin Syrup
3 Vitamin A
2 Iron
1 Folic Acid
Manages, drug is in stock Manages, drug is NOT in stock Does not manage drug
Figure 3.5: Availability of Essential Nutrition Supplies, SPRING Districts
Figure 3.6: Availability of Other Nutrition-Related Supplies. SPRING Districts
0 5 10 15 20 25 30 35
22 BCG
14 Measles vaccine
13 Coartem Age 18+
12 Coartem Age 6-18 years
11 Coartem 0–59 months
9 Cotrimoxazole (480 mg)
8 Amoxicillin
7 Inj. Chloramphenicol
6 Inj. ampicillin
5 Gentamicin
Manages, drug is in stock Manages, drug is NOT in stock Does not manage drug
46
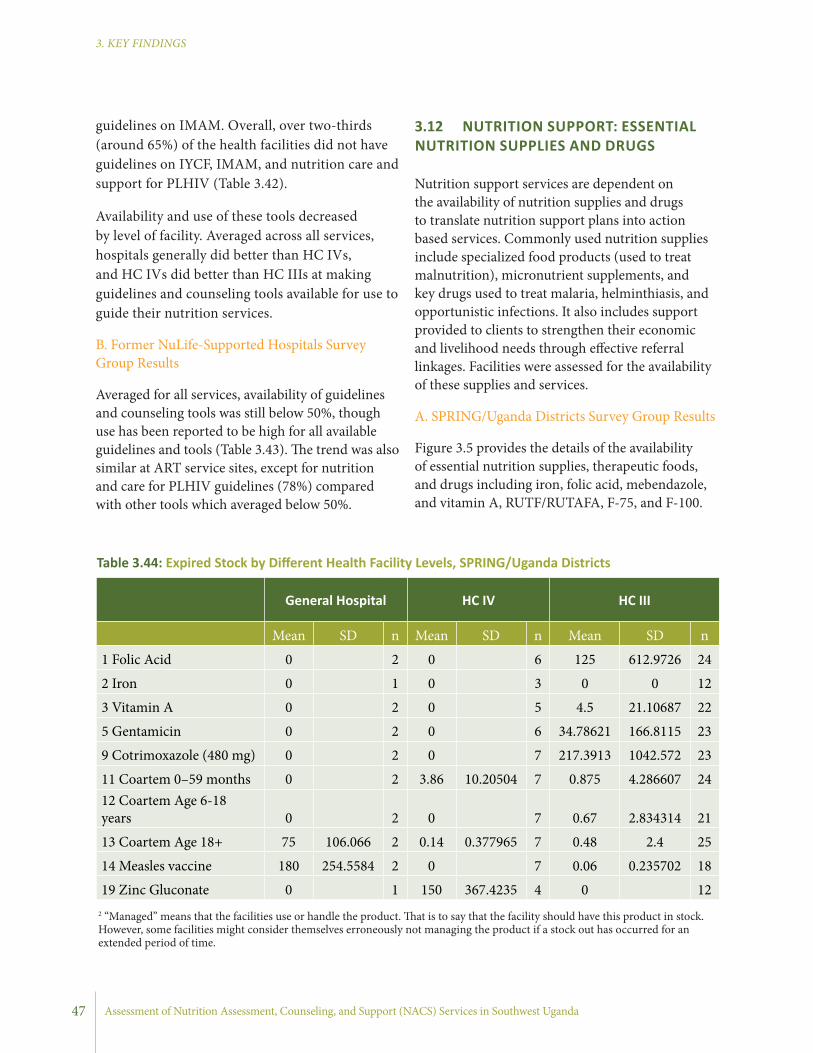
Assessment of Nutrition Assessment, Counseling, and Support (NACS) Services in Southwest Uganda
3. KEY FINDINGS
3.12 NUTRITION SUPPORT: ESSENTIAL NUTRITION SUPPLIES AND DRUGS
Nutrition support services are dependent on the availability of nutrition supplies and drugs to translate nutrition support plans into action based services. Commonly used nutrition supplies include specialized food products (used to treat malnutrition), micronutrient supplements, and key drugs used to treat malaria, helminthiasis, and opportunistic infections. It also includes support provided to clients to strengthen their economic and livelihood needs through effective referral linkages. Facilities were assessed for the availability of these supplies and services.
A. SPRING/Uganda Districts Survey Group Results
Figure 3.5 provides the details of the availability of essential nutrition supplies, therapeutic foods, and drugs including iron, folic acid, mebendazole, and vitamin A, RUTF/RUTAFA, F-75, and F-100.
General Hospital HC IV HC III
Mean SD n Mean SD n Mean SD n
1 Folic Acid 0 2 0 6 125 612.9726 24
2 Iron 0 1 0 3 0 0 12
3 Vitamin A 0 2 0 5 4.5 21.10687 22
5 Gentamicin 0 2 0 6 34.78621 166.8115 23
9 Cotrimoxazole (480 mg) 0 2 0 7 217.3913 1042.572 23
11 Coartem 0–59 months 0 2 3.86 10.20504 7 0.875 4.286607 2412 Coartem Age 6-18 years 0 2 0 7 0.67 2.834314 21
13 Coartem Age 18+ 75 106.066 2 0.14 0.377965 7 0.48 2.4 25
14 Measles vaccine 180 254.5584 2 0 7 0.06 0.235702 18
19 Zinc Gluconate 0 1 150 367.4235 4 0 12
Table 3.44: Expired Stock by Different Health Facility Levels, SPRING/Uganda Districts
guidelines on IMAM. Overall, over two-thirds (around 65%) of the health facilities did not have guidelines on IYCF, IMAM, and nutrition care and support for PLHIV (Table 3.42).
Availability and use of these tools decreased by level of facility. Averaged across all services, hospitals generally did better than HC IVs, and HC IVs did better than HC IIIs at making guidelines and counseling tools available for use to guide their nutrition services.
B. Former NuLife-Supported Hospitals Survey Group Results
Averaged for all services, availability of guidelines and counseling tools was still below 50%, though use has been reported to be high for all available guidelines and tools (Table 3.43). The trend was also similar at ART service sites, except for nutrition and care for PLHIV guidelines (78%) compared with other tools which averaged below 50%.
47
2 “Managed” means that the facilities use or handle the product. That is to say that the facility should have this product in stock. However, some facilities might consider themselves erroneously not managing the product if a stock out has occurred for an extended period of time.
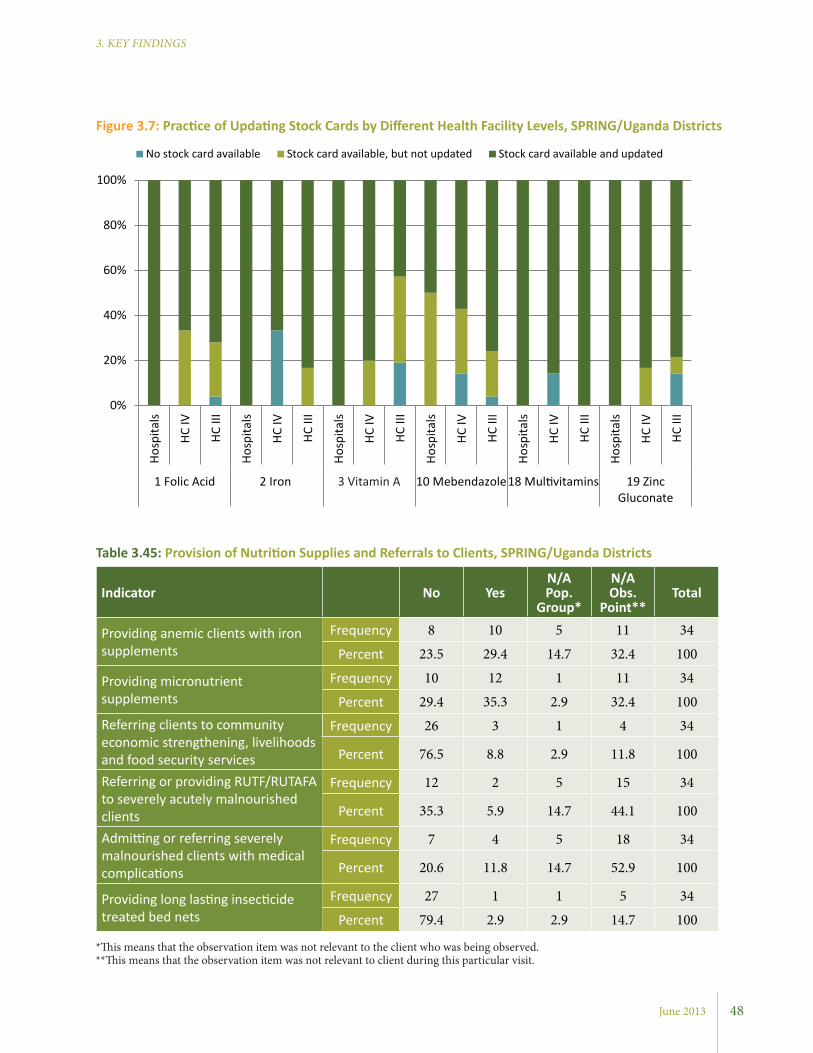
June 2013
3. KEY FINDINGS
Indicator No YesN/A Pop.
Group*
N/A Obs.
Point**Total
Providing anemic clients with iron supplements
Frequency 8 10 5 11 34
Percent 23.5 29.4 14.7 32.4 100
Providing micronutrient supplements
Frequency 10 12 1 11 34
Percent 29.4 35.3 2.9 32.4 100Referring clients to community economic strengthening, livelihoods and food security services
Frequency 26 3 1 4 34
Percent 76.5 8.8 2.9 11.8 100
Referring or providing RUTF/RUTAFA to severely acutely malnourished clients
Frequency 12 2 5 15 34
Percent 35.3 5.9 14.7 44.1 100
Admitting or referring severely malnourished clients with medical complications
Frequency 7 4 5 18 34
Percent 20.6 11.8 14.7 52.9 100
Providing long lasting insecticide treated bed nets
Frequency 27 1 1 5 34
Percent 79.4 2.9 2.9 14.7 100
Table 3.45: Provision of Nutrition Supplies and Referrals to Clients, SPRING/Uganda Districts
Figure 3.7: Practice of Updating Stock Cards by Different Health Facility Levels, SPRING/Uganda Districts
*This means that the observation item was not relevant to the client who was being observed. **This means that the observation item was not relevant to client during this particular visit.
0%
20%
40%
60%
80%
100%
Hosp
itals
HC IV
HC II
I
Hosp
itals
HC IV
HC II
I
Hosp
itals
HC IV
HC II
I
Hosp
itals
HC IV
HC II
I
Hosp
itals
HC IV
HC II
I
Hosp
itals
HC IV
HC II
I
1 Folic Acid 2 Iron 3 Vitamin A 10 Mebendazole18 Multivitamins 19 ZincGluconate
No stock card available Stock card available, but not updated Stock card available and updated
48

Assessment of Nutrition Assessment, Counseling, and Support (NACS) Services in Southwest Uganda
3. KEY FINDINGS
Indicator No YesN/A Pop.
Group*
N/A Obs.
Point**Total
Providing doses of IPT during the 4th to 6th month of pregnancy
Frequency 2 13 6 13 34
Percent 5.9 38.2 17.6 38.2 100
Providing pregnant women with iron/folic acid for 6 months (1 tablet/day)
Frequency 3 13 5 13 34
Percent 8.8 38.2 14.7 38.2 100
Providing pregnant women with one 500 mg dose of Mebendazole during pregnancy
Frequency 2 13 6 13 34
Percent 5.9 38.2 17.6 38.2 100
Table 3.46: Provision of Nutrition Supplies and Referrals to Pregnant Women, SPRING/Uganda Districts
*This means that the observation item was not relevant to the client who was being observed. **This means that the observation item was not relevant to client during this particular visit.
Overall, the facilities were well stocked with essential nutrition supplies. Vitamins and minerals (folic acid, iron, zinc, multivitamins, and vitamin A) were all managed4 at different levels and were in stock during the survey in most facilities.
Stockouts were noted in 14-40% of health facilities. Iron tablets were less managed compared to other vitamins and minerals. Among the facilities that manage iron tablets, stockouts were present in nearly half of those facilities. Few facilities manage RUTF/RUTAFA, F-75 and F-100.
The availability of other nutrition-related supplies was also assessed. These drugs are commonly used to treat acute malnutrition with medical complications during in-patient care. In general, there was a higher rate of managing these supplies than there was with the essential nutrition supplies. Among the facilities that manage these supplies, stockouts were fairly minimal (Figure 3.6).
3.12.1 Expired SuppliesThe assessment also sought to identify expired drugs in the drug stores. The findings indicated fewer supplies expired at hospitals and HC IVs compared to HC IIIs. Hospitals showed expired
stocks of Coartem for ages 18 and over and the measles vaccine. HC IVs had expired stock of Coartem for 0-59 months and zinc gluconate, while HC IIIs showed expired stock of all supplies listed under Table 3.44, except for iron and zinc gluconate.
The practice of updating stock cards was also assessed for key essential nutrition supplies by health facilities (Figure 3.7).
Hospitals made much more consistent use of stock cards, with cards available and updated for all supplies except for mebendazole where one of the hospitals had not updated the card. HCs did not perform as well as hospitals, though the majority of the HCs reported availablity of updated stock cards. Exceptionally, HC IIIs did well for folic acid, iron,
Mean SD n
Vitamin A 22.2 666. 7 9
Coartem Age 6-18 years 18.8 53.0 8
Coartem Age 18+ 73.3 146.3 9
Table 3.47: Expired Stock, Former NuLife Hospitals
49
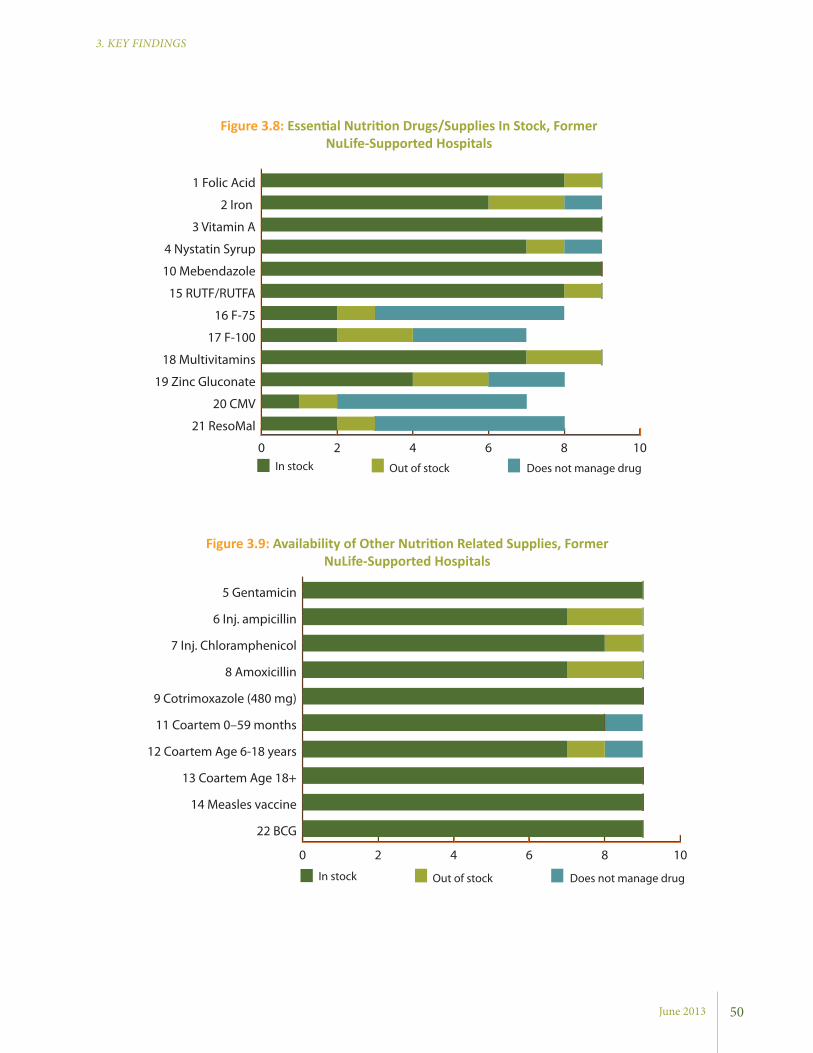
June 2013
3. KEY FINDINGS
Figure 3.8: Essential Nutrition Drugs/Supplies In Stock, Former NuLife-Supported Hospitals
Figure 3.9: Availability of Other Nutrition Related Supplies, Former NuLife-Supported Hospitals
0 2 4 6 8 10
22 BCG
14 Measles vaccine
13 Coartem Age 18+
12 Coartem Age 6-18 years
11 Coartem 0–59 months
9 Cotrimoxazole (480 mg)
8 Amoxicillin
7 Inj. Chloramphenicol
6 Inj. ampicillin
5 Gentamicin
In stock Out of stock Does not manage drug
0 2 4 6 8 10
21 ResoMal
20 CMV
19 Zinc Gluconate
18 Multivitamins
17 F-100
16 F-75
15 RUTF/RUTFA
10 Mebendazole
4 Nystatin Syrup
3 Vitamin A
2 Iron
1 Folic Acid
In stock Out of stock Does not manage drug
50

Assessment of Nutrition Assessment, Counseling, and Support (NACS) Services in Southwest Uganda
3. KEY FINDINGS
Indicator No YesN/A Pop.
Group*
N/A Obs.
Point**Total
Providing anemic clients with iron supplements
Frequency 4 8 4 16
Percent 25 50 25 100
Providing micronutrient supplements
Frequency 3 8 5 16
Percent 19 50 31 100Referring clients to community economic strengthening, livelihoods and food security services
Frequency 13 3 16
Percent 81 19 100
Referring or providing RUTF/RUTAFA to severely acutely malnourished clients
Frequency 5 2 1 8 16
Percent 31 13 6 50 100
Admitting or referring severely malnourished clients with medical complications
Frequency 2 4 1 9 16
Percent 13 25 6 56 100
Providing long lasting insecticide treated bed nets
Frequency 16 16
Percent 100 100
Table 3.48: Provision of Nutrition Supplies and Referrals to Clients, SPRING/Uganda Districts
*This means that the observation item was not relevant to the client who was being observed. **This means that the observation item was not relevant to the client during this particular visit.
Figure 3.10: Practice of Updating Stock Cards, Former NuLife-Supported Hospitals
0%
10%
20%
30%
40%
50%
60%
70%
80%
90%
100%
No stock card available Stock card available, but not updated Stock card available and updated
1 Fo
lic A
cid
2 Iro
n
3 Vi
tam
in A
4 N
ysta
tin S
yrup
10 M
eben
dazo
le
15 R
UTF
/RU
TAFA
16 F
-75
17 F
-100
18 M
ultiv
itam
ins
19 Z
inc
Gluc
onat
e
20 C
MV
21 R
esoM
al
51
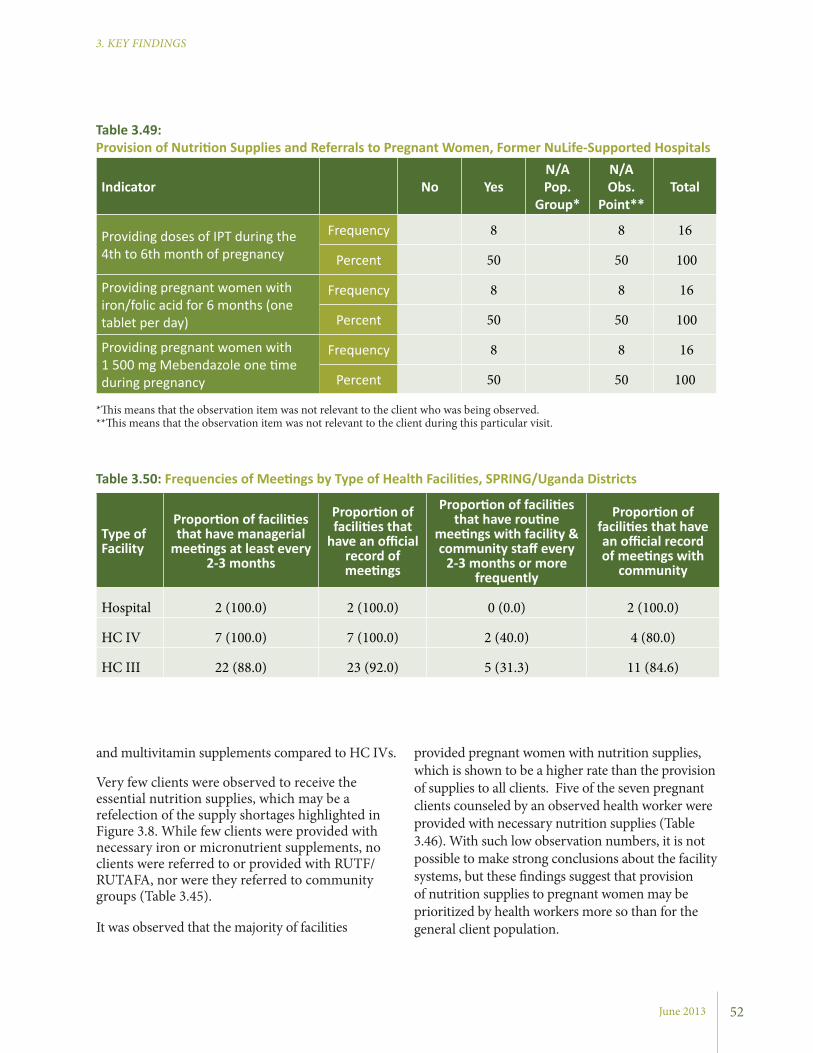
June 2013
3. KEY FINDINGS
provided pregnant women with nutrition supplies, which is shown to be a higher rate than the provision of supplies to all clients. Five of the seven pregnant clients counseled by an observed health worker were provided with necessary nutrition supplies (Table 3.46). With such low observation numbers, it is not possible to make strong conclusions about the facility systems, but these findings suggest that provision of nutrition supplies to pregnant women may be prioritized by health workers more so than for the general client population.
and multivitamin supplements compared to HC IVs.
Very few clients were observed to receive the essential nutrition supplies, which may be a refelection of the supply shortages highlighted in Figure 3.8. While few clients were provided with necessary iron or micronutrient supplements, no clients were referred to or provided with RUTF/RUTAFA, nor were they referred to community groups (Table 3.45).
It was observed that the majority of facilities
Indicator No YesN/A Pop.
Group*
N/A Obs.
Point**Total
Providing doses of IPT during the 4th to 6th month of pregnancy
Frequency 8 8 16
Percent 50 50 100
Providing pregnant women with iron/folic acid for 6 months (one tablet per day)
Frequency 8 8 16
Percent 50 50 100
Providing pregnant women with 1 500 mg Mebendazole one time during pregnancy
Frequency 8 8 16
Percent 50 50 100
Table 3.49: Provision of Nutrition Supplies and Referrals to Pregnant Women, Former NuLife-Supported Hospitals
*This means that the observation item was not relevant to the client who was being observed. **This means that the observation item was not relevant to the client during this particular visit.
Type of Facility
Proportion of facilities that have managerial
meetings at least every 2-3 months
Proportion of facilities that
have an official record of meetings
Proportion of facilities that have routine
meetings with facility & community staff every
2-3 months or more frequently
Proportion of facilities that have an official record of meetings with
community
Hospital 2 (100.0) 2 (100.0) 0 (0.0) 2 (100.0)
HC IV 7 (100.0) 7 (100.0) 2 (40.0) 4 (80.0)
HC III 22 (88.0) 23 (92.0) 5 (31.3) 11 (84.6)
Table 3.50: Frequencies of Meetings by Type of Health Facilities, SPRING/Uganda Districts
52
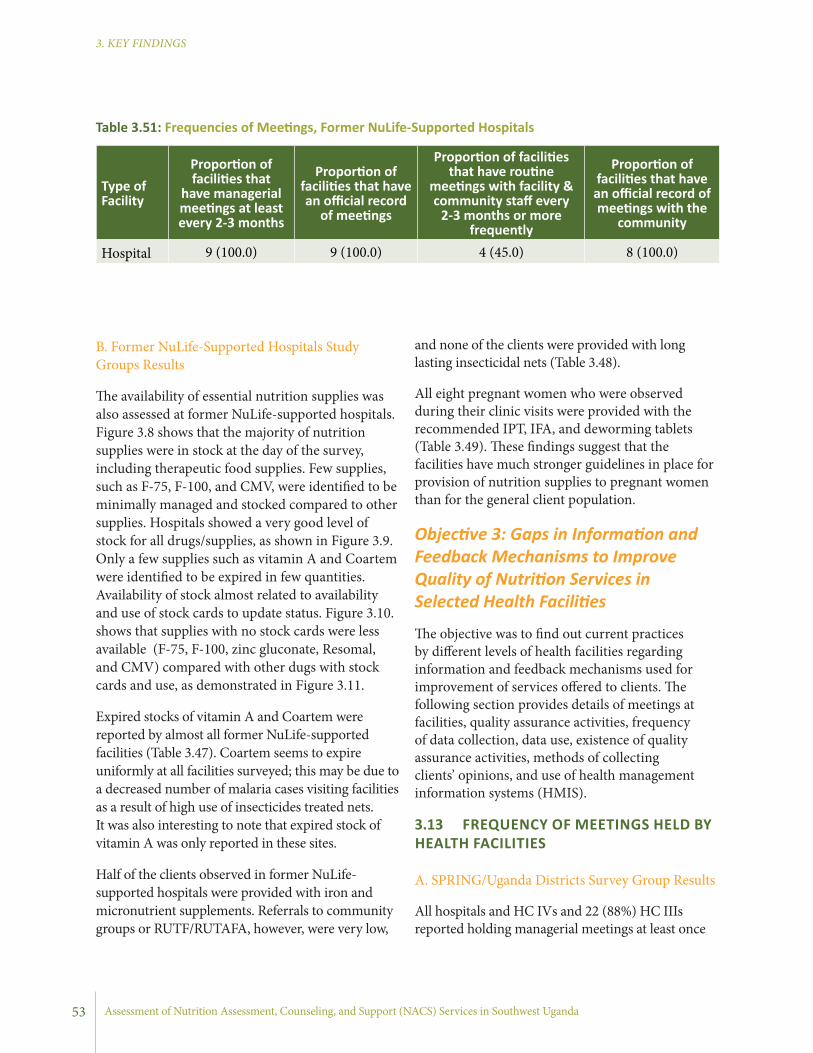
Assessment of Nutrition Assessment, Counseling, and Support (NACS) Services in Southwest Uganda
3. KEY FINDINGS
and none of the clients were provided with long lasting insecticidal nets (Table 3.48).
All eight pregnant women who were observed during their clinic visits were provided with the recommended IPT, IFA, and deworming tablets (Table 3.49). These findings suggest that the facilities have much stronger guidelines in place for provision of nutrition supplies to pregnant women than for the general client population.
Objective 3: Gaps in Information and Feedback Mechanisms to Improve Quality of Nutrition Services in Selected Health Facilities
The objective was to find out current practices by different levels of health facilities regarding information and feedback mechanisms used for improvement of services offered to clients. The following section provides details of meetings at facilities, quality assurance activities, frequency of data collection, data use, existence of quality assurance activities, methods of collecting clients’ opinions, and use of health management information systems (HMIS).
3.13 FREQUENCY OF MEETINGS HELD BY HEALTH FACILITIES
A. SPRING/Uganda Districts Survey Group Results
All hospitals and HC IVs and 22 (88%) HC IIIs reported holding managerial meetings at least once
B. Former NuLife-Supported Hospitals Study Groups Results
The availability of essential nutrition supplies was also assessed at former NuLife-supported hospitals. Figure 3.8 shows that the majority of nutrition supplies were in stock at the day of the survey, including therapeutic food supplies. Few supplies, such as F-75, F-100, and CMV, were identified to be minimally managed and stocked compared to other supplies. Hospitals showed a very good level of stock for all drugs/supplies, as shown in Figure 3.9. Only a few supplies such as vitamin A and Coartem were identified to be expired in few quantities. Availability of stock almost related to availability and use of stock cards to update status. Figure 3.10. shows that supplies with no stock cards were less available (F-75, F-100, zinc gluconate, Resomal, and CMV) compared with other dugs with stock cards and use, as demonstrated in Figure 3.11.
Expired stocks of vitamin A and Coartem were reported by almost all former NuLife-supported facilities (Table 3.47). Coartem seems to expire uniformly at all facilities surveyed; this may be due to a decreased number of malaria cases visiting facilities as a result of high use of insecticides treated nets. It was also interesting to note that expired stock of vitamin A was only reported in these sites.
Half of the clients observed in former NuLife-supported hospitals were provided with iron and micronutrient supplements. Referrals to community groups or RUTF/RUTAFA, however, were very low,
Type of Facility
Proportion of facilities that
have managerial meetings at least every 2-3 months
Proportion of facilities that have an official record
of meetings
Proportion of facilities that have routine
meetings with facility & community staff every
2-3 months or more frequently
Proportion of facilities that have an official record of meetings with the
community
Hospital 9 (100.0) 9 (100.0) 4 (45.0) 8 (100.0)
Table 3.51: Frequencies of Meetings, Former NuLife-Supported Hospitals
53
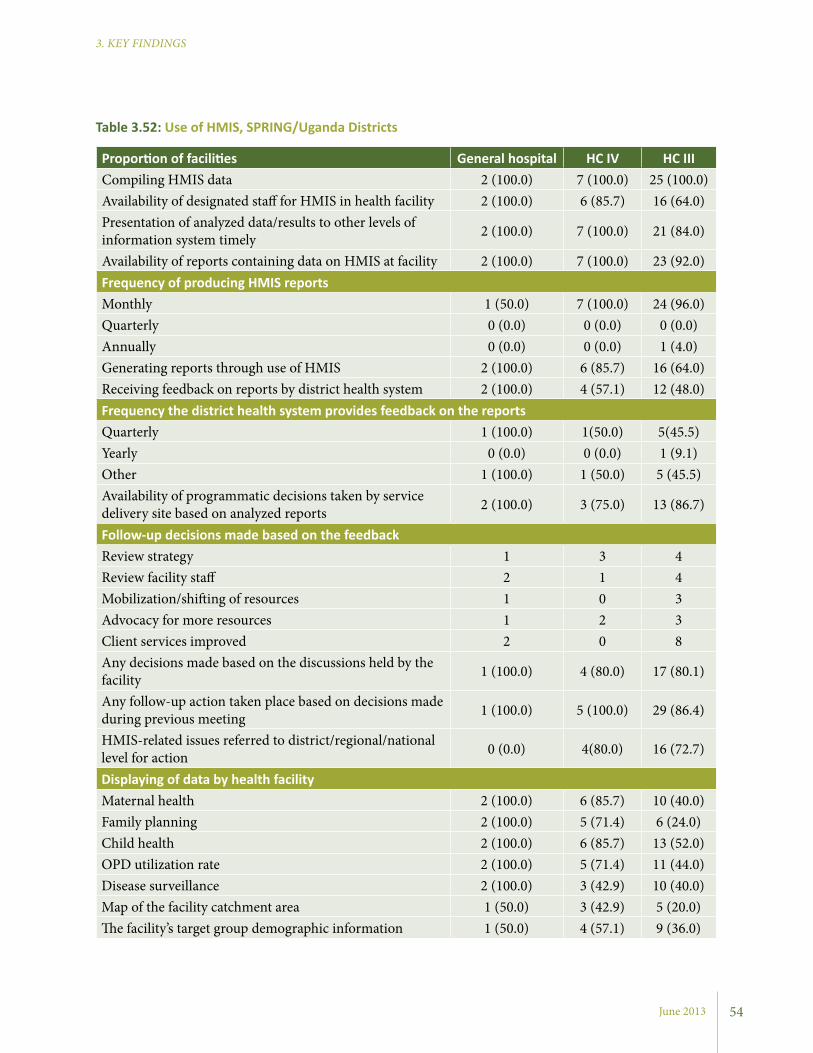
June 2013
3. KEY FINDINGS
Proportion of facilities General hospital HC IV HC IIICompiling HMIS data 2 (100.0) 7 (100.0) 25 (100.0)Availability of designated staff for HMIS in health facility 2 (100.0) 6 (85.7) 16 (64.0)Presentation of analyzed data/results to other levels of information system timely 2 (100.0) 7 (100.0) 21 (84.0)
Availability of reports containing data on HMIS at facility 2 (100.0) 7 (100.0) 23 (92.0)Frequency of producing HMIS reportsMonthly 1 (50.0) 7 (100.0) 24 (96.0)Quarterly 0 (0.0) 0 (0.0) 0 (0.0)Annually 0 (0.0) 0 (0.0) 1 (4.0)Generating reports through use of HMIS 2 (100.0) 6 (85.7) 16 (64.0)Receiving feedback on reports by district health system 2 (100.0) 4 (57.1) 12 (48.0)Frequency the district health system provides feedback on the reportsQuarterly 1 (100.0) 1(50.0) 5(45.5)Yearly 0 (0.0) 0 (0.0) 1 (9.1)Other 1 (100.0) 1 (50.0) 5 (45.5)Availability of programmatic decisions taken by service delivery site based on analyzed reports 2 (100.0) 3 (75.0) 13 (86.7)
Follow-up decisions made based on the feedbackReview strategy 1 3 4Review facility staff 2 1 4Mobilization/shifting of resources 1 0 3Advocacy for more resources 1 2 3Client services improved 2 0 8Any decisions made based on the discussions held by the facility 1 (100.0) 4 (80.0) 17 (80.1)
Any follow-up action taken place based on decisions made during previous meeting 1 (100.0) 5 (100.0) 29 (86.4)
HMIS-related issues referred to district/regional/national level for action 0 (0.0) 4(80.0) 16 (72.7)
Displaying of data by health facilityMaternal health 2 (100.0) 6 (85.7) 10 (40.0)Family planning 2 (100.0) 5 (71.4) 6 (24.0)Child health 2 (100.0) 6 (85.7) 13 (52.0)OPD utilization rate 2 (100.0) 5 (71.4) 11 (44.0)Disease surveillance 2 (100.0) 3 (42.9) 10 (40.0)Map of the facility catchment area 1 (50.0) 3 (42.9) 5 (20.0)The facility’s target group demographic information 1 (50.0) 4 (57.1) 9 (36.0)
Table 3.52: Use of HMIS, SPRING/Uganda Districts
54

Assessment of Nutrition Assessment, Counseling, and Support (NACS) Services in Southwest Uganda
3. KEY FINDINGS
Proportion of Facilities … General hospital
Compiling HMIS data 9 (100.0)Availability of designated staff for HMIS in health facility 9 (100.0)Presentation of analyzed data/results to other levels of information system timely 9 (100.0)Availability of reports containing data on HMIS at facility 9 (100.0)Frequency of producing HMIS reportsMonthly 4 (45.0)Quarterly 0 (0.0)Annually 0 (0.0)Generating reports through use of HMIS 9 (100.0)Receiving feedback on reports by district health system 9 (100.0)Frequency the district health system provides feedback on the reportsQuarterly 9 (100.0)Yearly 0 (0.0)Other 5 (55.0)Availability of programmatic decisions taken by service delivery site based on analyzed reports 9 (100.0)Follow-up decisions made based on the feedbackReview strategy 4 (45.0)Review of facility staff 9 (100.0)Mobilization/shifting of resources 5 (55.0)Advocacy for more resources 5 (55.0)Client services improved 5 (55.0)Any decisions made based on the discussions held by the facility 9 (100.0)Any follow-up action taken place based on decisions made during previous meeting 9 (100.0)HMIS related issues referred to district/regional/national level for action 0 (0.0)Displaying of data by health facilityMaternal health 9 (100.0)Family Planning 9 (100.0)Child health 9 (100.0)OPD utilization rate 9 (100.0)Disease surveillance 9 (100.0)Map of the facility catchment area 5 (55.0)The facility’s target group demographic information 5 (55.0)
Table 3.53: Use of HMIS, Former NuLife-Supported Hospitals
55

June 2013
3. KEY FINDINGS
information system and had reports available, while only 84% of HC IIIs presented their data and had reports on HMIS available. In terms of frequency of producing HMIS reports, all the facilities produced the reports monthly except one hospital and one HC III. All hospitals and HC IVs and 48% of HC IIIs reported receiving feedback on the reports submitted to the district health system. Most of the facilities had made programmatic decisions based on the analyzed reports.
The main follow-up actions based on the feedback received were improving client services and reviewing strategy for better service delivery. No hospitals and only about three-quarters of HC IVs and HC IIIs referred HMIS-related issues to the district, regional, or national level for appropriate action. The health facilities also displayed the data for internal and public consumption by different topics. The most displayed topics were child health, maternal health, and OPD utilization rates. Just less than half (48.8%) of the facilities had their target group’s demographic information displayed.
B. Former NuLife-Supported Hospitals Survey Area Reports
As presented in Table 3.53, all hospitals compiled HMIS data, had designated staff for HMIS, and presented analyzed data to other levels of information system. In terms of frequency of producing HMIS reports, all hospitals produced the
in the past 2-3 months (Table 3.50). All hospitals and HC IVs had records of the management meetings regularly maintained. Nearly all of the HC IIIs (23 facilities, or 92%) had official records of the management meetings regularly maintained. None of the hospitals reported routine meetings with community members (at least every 2-3 months), while 40% of HC IVs and 31% of HC IIIs reported such meetings. Almost all the facilities had an official record of meetings held with community members.
B. Former NuLife-Supported Hospitals Survey Area Reports
All hospitals reported holding managerial meetings at least every two to three months, and had records of the management meetings regularly maintained (Table 3.51). With regard to meetings with the community staff, only 45% of the hospitals reported having routine meetings. All reported having official records of the management meetings regularly maintained.
3.14 USE OF HMIS
A. SPRING/Uganda Districts Survey Group Results
As illustrated in Table 3.52, all assessed health facilities compile HMIS data. Most facilities had designated staff for HMIS, though only 64% of HC IIIs had such staff. Similarly, all hospitals and HC IVs presented their data to other levels of
Proportion of Facilities that… Type of Facility
General hospital HC IV HC III
Use a supervisory checklist for health system components 2 (100.0) 1(14.3) 18 (75.0)
Use a supervisory checklist for health service provision 1 (50.0) 4 (50.0) 15 (62.5)
Use a facility-wide review of mortality 2 (100.0) 5 (71.5) 6 (25.0)
Audit medical records or service registers 1 (50.0) 5 (83.3) 19 (89.1)
Have a Quality Assurance Committee or staff reports 1 (50.0) 3 (42.9) 3 (12.5)
Use other quality assurance methods 0 (0.0) 1 (50.0) 3 (20.0)
Table 3.54: QA Activities by Type of Health Facility, SPRING/Uganda Districts
56

Assessment of Nutrition Assessment, Counseling, and Support (NACS) Services in Southwest Uganda
3. KEY FINDINGS
Hospital HC IV HC III
Individual membersInternal to facility 1 (50.0) 5 (71.4) 16 (69.6)External to facility 0 (0.0) 0 (0.0) 2 (8.7)Both internal and external 0 (0.0) 0 (0.0) 3 (13.0)Not active with QA 1 (50.0) 1 (14.3) 2 (8.7)
Individual supervisorsInternal to facility 0 (0.0) 1 (14.3) 1 (4.6)External to facility 0 (0.0) 3 (42.9) 17 (77.3)Both internal and external 1 (50.0) 1 (14.3) 2 (9.1)Not active with QA 0 (0.0) 2 (28.6) 2 (9.1)
Management committeeInternal to facility 2 (100.0) 0 (0.0) 1 (4.4)External to facility 0 (0.0) 2 (28.6) 16 (69.6)Both internal and external 0 (0.0) 3 (42.9) 5 (21.7)Not active with QA 0 (0.0) 2 (28.6) 1 (4.4)
QA committeeInternal to facility 1 (50.0) 0 (0.0) 1 (4.4)External to facility 0 (0.0) 2 (28.6) 3 (13.0)Both internal and external 0 (0.0) 0 (0.0) 1 (4.4)Not active with QA 1 (50.0) 5 (71.4) 17 (73.9)
Special QA staffInternal to facility 0 (0.0) 0 (0.0) 0 (0.0)External to facility 0 (0.0) 1 (14.3) 1 (4.4)Both internal and external 2 (100.0) 1 (14.3) 0 (0.0)Not active with QA 0 (0.0) 4 (57.1) 17 (73.9)
Table 3.56: Staff Responsible for QA Activities, SPRING/Uganda Districts
57
Proportion of Facilities that…
Use a supervisory checklist of health system components 6 (66.7)Use a supervisory checklist of health service provision 4 (44.4)Use a facility-wide review of mortality 7 (77.8)Audit medical records or service registers 6 (66.7)Have a Quality Assurance Committee or staff reports 8 (88.9)Other quality assurance methods 5 (83.3)
Table 3.55: QA Activities, Former NuLife-Supported Hospitals
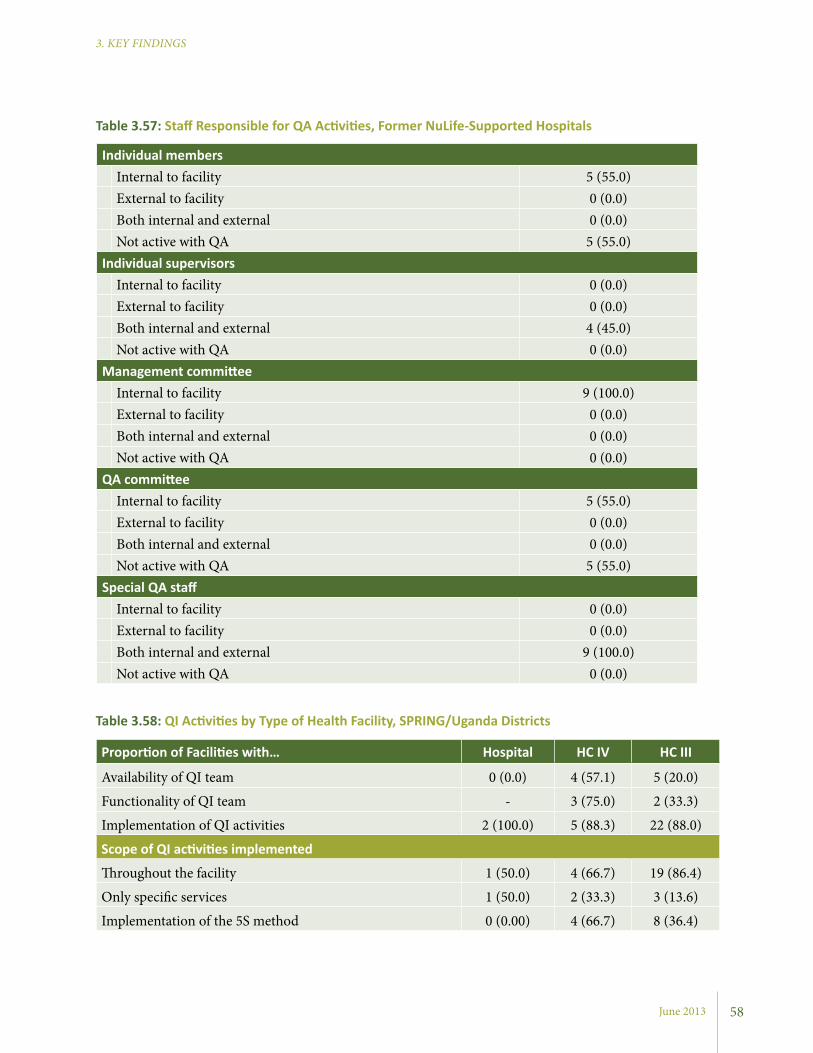
June 2013
3. KEY FINDINGS
Table 3.57: Staff Responsible for QA Activities, Former NuLife-Supported Hospitals
Individual membersInternal to facility 5 (55.0)External to facility 0 (0.0)Both internal and external 0 (0.0)Not active with QA 5 (55.0)
Individual supervisorsInternal to facility 0 (0.0)External to facility 0 (0.0)Both internal and external 4 (45.0)Not active with QA 0 (0.0)
Management committeeInternal to facility 9 (100.0)External to facility 0 (0.0)Both internal and external 0 (0.0)Not active with QA 0 (0.0)
QA committeeInternal to facility 5 (55.0)External to facility 0 (0.0)Both internal and external 0 (0.0)Not active with QA 5 (55.0)
Special QA staffInternal to facility 0 (0.0)External to facility 0 (0.0)Both internal and external 9 (100.0)Not active with QA 0 (0.0)
58
Proportion of Facilities with… Hospital HC IV HC III
Availability of QI team 0 (0.0) 4 (57.1) 5 (20.0)
Functionality of QI team - 3 (75.0) 2 (33.3)
Implementation of QI activities 2 (100.0) 5 (88.3) 22 (88.0)
Scope of QI activities implemented
Throughout the facility 1 (50.0) 4 (66.7) 19 (86.4)
Only specific services 1 (50.0) 2 (33.3) 3 (13.6)
Implementation of the 5S method 0 (0.00) 4 (66.7) 8 (36.4)
Table 3.58: QI Activities by Type of Health Facility, SPRING/Uganda Districts
Assessment of Nutrition Assessment, Counseling, and Support (NACS) Services in Southwest Uganda
3. KEY FINDINGS
59
3 In Uganda, the MOH recommends that QI interventions in health facilities begin with the 5S method as a foundation for QI (MOH 2011b). The objectives of the 5S methods are improved productivity, improved work environment/infrastructure maintenance, and improved health and safety.
3.15.2 QA Personnel
A. SPRING/Uganda Districts Survey Groups Re-sultsIn most facilities where a QA system was active, individual members responsible for QA were internal to the facility. However, most of the supervisors and management committees responsible for QA included external personnel. Hospitals were the only facilities with management committee personnel internal to the facility. A large number of facilities reported having QA committees or teams as not active: two hospitals (50%), five HC IVs (83%), and 17 HC IIIs (71%). The notably highest proportion of the resources responsible for QA activities were external to the health facilities assessed. However, there were instances in which both internal and external resources were involved in the provision of QA activities in the facilities. Details are provided in Table 3.56.
B. Former NuLife-Supported Hospitals Survey Area Reports
Of all hospitals, 50% had an active QA system and a committee at the time of the assessment (Table 3.57). For these hospitals, individual members were responsible for QA and were internal to the facility. All hospitals had management committee personnel who were internal to the facility, but used both internal and external staff as special QA staff to support QA activities.
3.15.3 QI ActivitiesResults in Table 3.58 show most of the facilities do not have a QI team. Specifically, none of the hospitals and only a small proportion of HCs had quality improvement teams. Of these teams, only 67% and 43% were functional in the HC IVs and
reports quarterly and reported receiving feedback on the reports submitted to the district health system.
Moreover, all hospitals reported programmatic decisions taken based on the analyzed reports. The main follow-up actions based on the feedback received were discussions at the facility level and implementation of follow-up actions. The hospitals also displayed HMIS information in the areas of child health, maternal health, family planning, and OPD utilization rate.
3.15 QA SYSTEM AND QI ACTIVITIES
QA refers to the planned and systematic activities implemented with the view that quality requirements for services are fulfilled. It is the systematic measurement, comparison with a standard, monitoring of processes, and an associated feedback loop to prevent error. The study assessed the functionality of the system and identified key improvement activities being implemented by facilities as summarized below.
3.15.1 QA ActivitiesA. SPRING/Uganda Districts Survey Groups Results
Table 3.54 shows quality assurance activities being implemented in health facilities. The main activities were an audit of medical records or service registers, use of a supervisory checklist for health system components, and the use of a supervisory checklist for health service provision. The use of supervisory checklists for health service provision and auditing medical records were the most frequently cited quality assurance measures at all facilities.
B. Former NuLife-Supported Hospitals Survey Area Reports
Different types of QA activities were reported as being implemented at the hospitals (Table 3.55). The main methods used were the use of a supervisory checklist of health components, a facility-wide review of mortality rates, staff reports, and auditing of medical records.
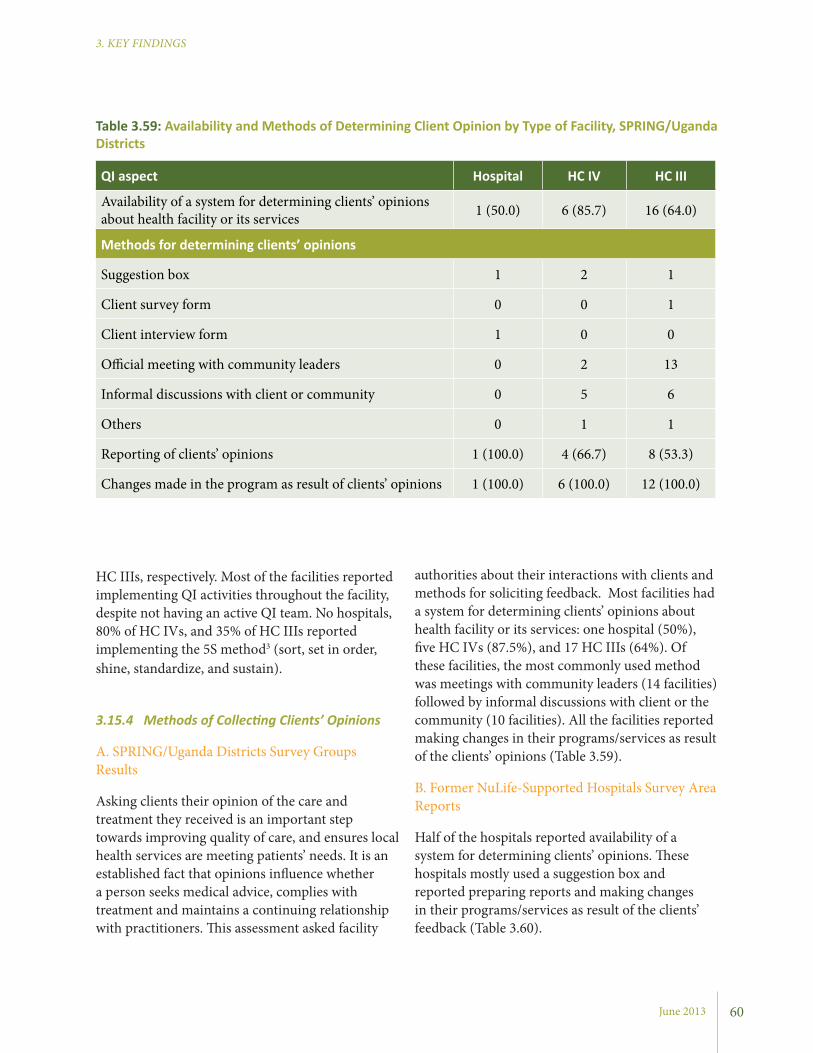
June 2013
3. KEY FINDINGS
authorities about their interactions with clients and methods for soliciting feedback. Most facilities had a system for determining clients’ opinions about health facility or its services: one hospital (50%), five HC IVs (87.5%), and 17 HC IIIs (64%). Of these facilities, the most commonly used method was meetings with community leaders (14 facilities) followed by informal discussions with client or the community (10 facilities). All the facilities reported making changes in their programs/services as result of the clients’ opinions (Table 3.59).
B. Former NuLife-Supported Hospitals Survey Area Reports
Half of the hospitals reported availability of a system for determining clients’ opinions. These hospitals mostly used a suggestion box and reported preparing reports and making changes in their programs/services as result of the clients’ feedback (Table 3.60).
HC IIIs, respectively. Most of the facilities reported implementing QI activities throughout the facility, despite not having an active QI team. No hospitals, 80% of HC IVs, and 35% of HC IIIs reported implementing the 5S method3 (sort, set in order, shine, standardize, and sustain).
3.15.4 Methods of Collecting Clients’ Opinions
A. SPRING/Uganda Districts Survey Groups Results
Asking clients their opinion of the care and treatment they received is an important step towards improving quality of care, and ensures local health services are meeting patients’ needs. It is an established fact that opinions influence whether a person seeks medical advice, complies with treatment and maintains a continuing relationship with practitioners. This assessment asked facility
QI aspect Hospital HC IV HC III
Availability of a system for determining clients’ opinions about health facility or its services 1 (50.0) 6 (85.7) 16 (64.0)
Methods for determining clients’ opinions
Suggestion box 1 2 1
Client survey form 0 0 1
Client interview form 1 0 0
Official meeting with community leaders 0 2 13
Informal discussions with client or community 0 5 6
Others 0 1 1
Reporting of clients’ opinions 1 (100.0) 4 (66.7) 8 (53.3)
Changes made in the program as result of clients’ opinions 1 (100.0) 6 (100.0) 12 (100.0)
Table 3.59: Availability and Methods of Determining Client Opinion by Type of Facility, SPRING/Uganda Districts
60

Assessment of Nutrition Assessment, Counseling, and Support (NACS) Services in Southwest Uganda
3. KEY FINDINGS
Figure 3.11: Priority Actions that Improve NACS Provision by Health Facility, SPRING/Uganda Districts
Figure 3.12: Priority Actions that Improve NACS Provision, Former NuLife-Supported Hospitals
0 20 40 60 80 100
Other
More opportunities for promotion
Better incentives
Better facility infrastructure
Less workload (more sta�)
Better quality equipment/supplies
More supplies/stock
More knowledge/training
More support from supervisor
Hospitals (n=2) HC IV (n=6) HC III (n=25)
Percentage
0 20 40 60 80 100
Other
More opportunities for promotion
Better incentives
Better facility infrastructure
Less workload (more sta�)
Better quality equipment/supplies
More supplies/stock
More knowledge/training
More support from supervisor
Percentage
61
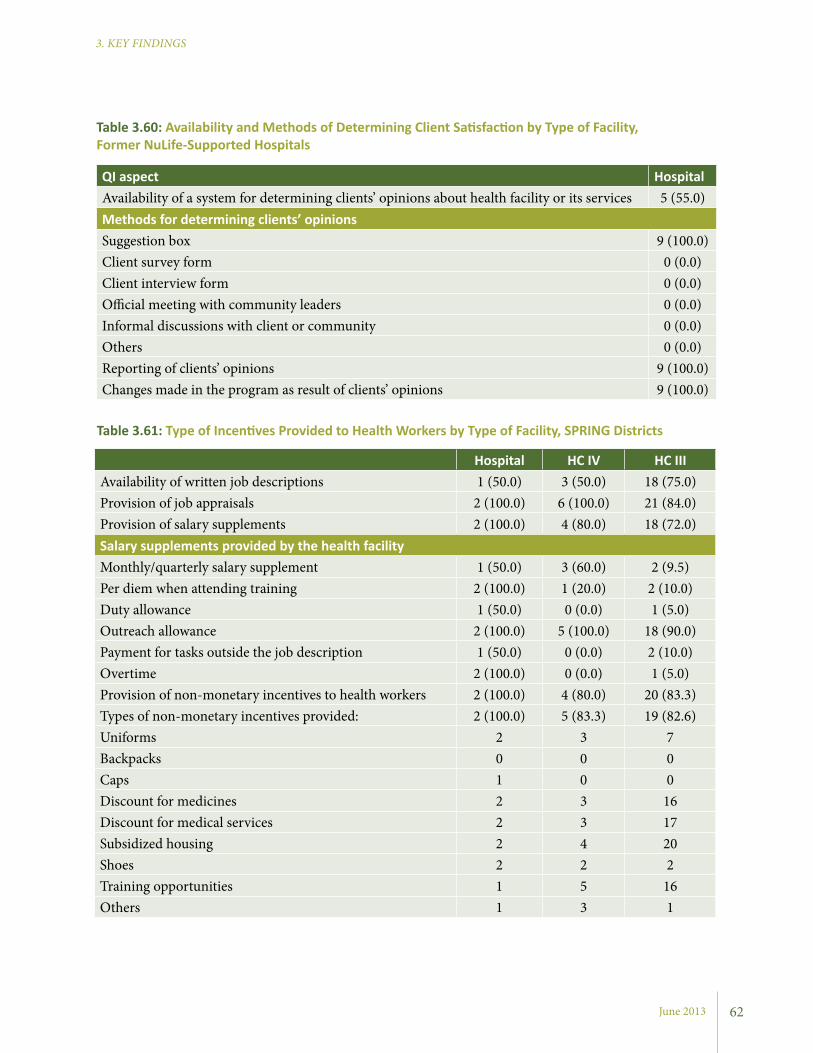
June 2013
3. KEY FINDINGS
QI aspect HospitalAvailability of a system for determining clients’ opinions about health facility or its services 5 (55.0)Methods for determining clients’ opinionsSuggestion box 9 (100.0)Client survey form 0 (0.0)Client interview form 0 (0.0)Official meeting with community leaders 0 (0.0)Informal discussions with client or community 0 (0.0)Others 0 (0.0)Reporting of clients’ opinions 9 (100.0)Changes made in the program as result of clients’ opinions 9 (100.0)
Table 3.60: Availability and Methods of Determining Client Satisfaction by Type of Facility, Former NuLife-Supported Hospitals
Hospital HC IV HC IIIAvailability of written job descriptions 1 (50.0) 3 (50.0) 18 (75.0)Provision of job appraisals 2 (100.0) 6 (100.0) 21 (84.0)Provision of salary supplements 2 (100.0) 4 (80.0) 18 (72.0)Salary supplements provided by the health facilityMonthly/quarterly salary supplement 1 (50.0) 3 (60.0) 2 (9.5)Per diem when attending training 2 (100.0) 1 (20.0) 2 (10.0)Duty allowance 1 (50.0) 0 (0.0) 1 (5.0)Outreach allowance 2 (100.0) 5 (100.0) 18 (90.0)Payment for tasks outside the job description 1 (50.0) 0 (0.0) 2 (10.0)Overtime 2 (100.0) 0 (0.0) 1 (5.0)Provision of non-monetary incentives to health workers 2 (100.0) 4 (80.0) 20 (83.3)Types of non-monetary incentives provided: 2 (100.0) 5 (83.3) 19 (82.6)Uniforms 2 3 7Backpacks 0 0 0Caps 1 0 0Discount for medicines 2 3 16Discount for medical services 2 3 17Subsidized housing 2 4 20Shoes 2 2 2Training opportunities 1 5 16Others 1 3 1
Table 3.61: Type of Incentives Provided to Health Workers by Type of Facility, SPRING Districts
62
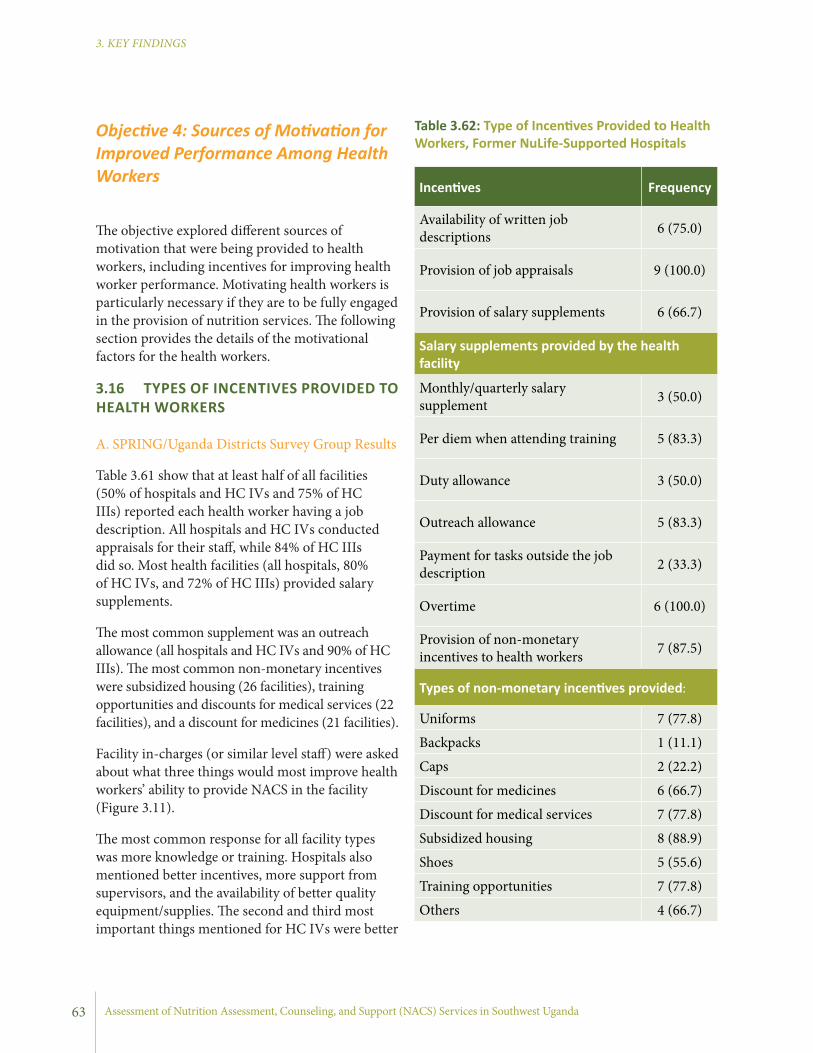
Assessment of Nutrition Assessment, Counseling, and Support (NACS) Services in Southwest Uganda
3. KEY FINDINGS
Incentives Frequency
Availability of written job descriptions 6 (75.0)
Provision of job appraisals 9 (100.0)
Provision of salary supplements 6 (66.7)
Salary supplements provided by the health facility
Monthly/quarterly salary supplement 3 (50.0)
Per diem when attending training 5 (83.3)
Duty allowance 3 (50.0)
Outreach allowance 5 (83.3)
Payment for tasks outside the job description 2 (33.3)
Overtime 6 (100.0)
Provision of non-monetary incentives to health workers 7 (87.5)
Types of non-monetary incentives provided:
Uniforms 7 (77.8)
Backpacks 1 (11.1)
Caps 2 (22.2)
Discount for medicines 6 (66.7)
Discount for medical services 7 (77.8)
Subsidized housing 8 (88.9)
Shoes 5 (55.6)
Training opportunities 7 (77.8)
Others 4 (66.7)
Table 3.62: Type of Incentives Provided to Health Workers, Former NuLife-Supported Hospitals
Objective 4: Sources of Motivation for Improved Performance Among Health Workers
The objective explored different sources of motivation that were being provided to health workers, including incentives for improving health worker performance. Motivating health workers is particularly necessary if they are to be fully engaged in the provision of nutrition services. The following section provides the details of the motivational factors for the health workers.
3.16 TYPES OF INCENTIVES PROVIDED TO HEALTH WORKERS
A. SPRING/Uganda Districts Survey Group Results
Table 3.61 show that at least half of all facilities (50% of hospitals and HC IVs and 75% of HC IIIs) reported each health worker having a job description. All hospitals and HC IVs conducted appraisals for their staff, while 84% of HC IIIs did so. Most health facilities (all hospitals, 80% of HC IVs, and 72% of HC IIIs) provided salary supplements.
The most common supplement was an outreach allowance (all hospitals and HC IVs and 90% of HC IIIs). The most common non-monetary incentives were subsidized housing (26 facilities), training opportunities and discounts for medical services (22 facilities), and a discount for medicines (21 facilities).
Facility in-charges (or similar level staff) were asked about what three things would most improve health workers’ ability to provide NACS in the facility (Figure 3.11).
The most common response for all facility types was more knowledge or training. Hospitals also mentioned better incentives, more support from supervisors, and the availability of better quality equipment/supplies. The second and third most important things mentioned for HC IVs were better
63
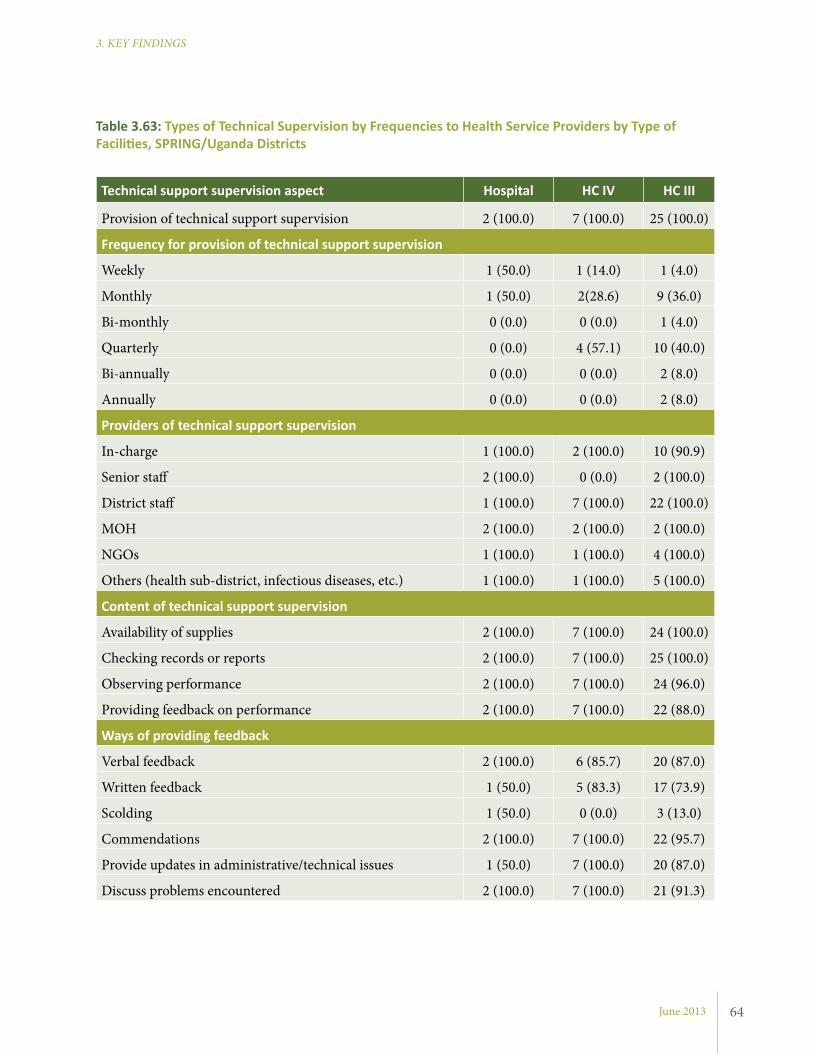
June 2013
3. KEY FINDINGS
Table 3.63: Types of Technical Supervision by Frequencies to Health Service Providers by Type of Facilities, SPRING/Uganda Districts
Technical support supervision aspect Hospital HC IV HC III
Provision of technical support supervision 2 (100.0) 7 (100.0) 25 (100.0)
Frequency for provision of technical support supervision
Weekly 1 (50.0) 1 (14.0) 1 (4.0)
Monthly 1 (50.0) 2(28.6) 9 (36.0)
Bi-monthly 0 (0.0) 0 (0.0) 1 (4.0)
Quarterly 0 (0.0) 4 (57.1) 10 (40.0)
Bi-annually 0 (0.0) 0 (0.0) 2 (8.0)
Annually 0 (0.0) 0 (0.0) 2 (8.0)
Providers of technical support supervision
In-charge 1 (100.0) 2 (100.0) 10 (90.9)
Senior staff 2 (100.0) 0 (0.0) 2 (100.0)
District staff 1 (100.0) 7 (100.0) 22 (100.0)
MOH 2 (100.0) 2 (100.0) 2 (100.0)
NGOs 1 (100.0) 1 (100.0) 4 (100.0)
Others (health sub-district, infectious diseases, etc.) 1 (100.0) 1 (100.0) 5 (100.0)
Content of technical support supervision
Availability of supplies 2 (100.0) 7 (100.0) 24 (100.0)
Checking records or reports 2 (100.0) 7 (100.0) 25 (100.0)
Observing performance 2 (100.0) 7 (100.0) 24 (96.0)
Providing feedback on performance 2 (100.0) 7 (100.0) 22 (88.0)
Ways of providing feedback
Verbal feedback 2 (100.0) 6 (85.7) 20 (87.0)
Written feedback 1 (50.0) 5 (83.3) 17 (73.9)
Scolding 1 (50.0) 0 (0.0) 3 (13.0)
Commendations 2 (100.0) 7 (100.0) 22 (95.7)
Provide updates in administrative/technical issues 1 (50.0) 7 (100.0) 20 (87.0)
Discuss problems encountered 2 (100.0) 7 (100.0) 21 (91.3)
64

Assessment of Nutrition Assessment, Counseling, and Support (NACS) Services in Southwest Uganda
3. KEY FINDINGS
Technical support supervision aspect Hospital
Provision of technical support supervision 9 (100.0)
Frequency for provision of technical support supervision
Weekly 1 (12.5)
Monthly 6 (75.0)
Bi-monthly 1 (12.5)
Quarterly 0 (0.0)
Bi-annually 0 (0.0)
Annually 0 (0.0)
Providers of technical support supervision
In-charge 6 (100.0)
Senior staff 7 (100.0)
District staff 5 (100.0)
MOH 6 (85.7)
NGOs 4 (80.0)
Others (health sub district, Infectious Diseases, etc.) 1 (100.0)
Content of technical support supervision
Availability of supplies 9 (100.0)
Checking records or reports 9 (100.0)
Observing performance 6 (66.7)
Providing feedback on performance 7 (77.8)
Ways of providing feedback
Verbal feedback 8 (88.9)
Written feedback 6 (66.7)
Scolding 2 (22.2)
Commendations 8 (88.9)
Provide updates in administrative/technical issues 7 (77.8)
Discuss problems encountered 9 (100.0)
Table 3.64: Types of Technical Supervision by Frequencies to Health Service Providers, Former NuLife-Supported Hospitals
65
June 2013
3. KEY FINDINGS
commendations (31 facilities), discussing problems (30 facilities), verbal feedback (28 facilities), and providing updates on administrative and technical issues (28 facilities). Table 3.63 provides specific details.
B. Former NuLife-Supported Hospitals Survey Group Results
Nine of the hospitals assessed (nearly all) arranged technical supportive supervision to their health workers on a monthly basis. The most common providers of the supportive supervision were facility-in-charges, senior staff, and NGOs. Technical supervision mainly focused on availability of supplies, checking records or reports, and observing and providing feedback on performance. Common ways of receiving feedback were reported to be verbal, in writing, commendations, and discussions. Table 3.64 provides more details.
Objective 5: Types of Activities being Implemented by NGOs and CBOs in the Health Facility Catchment Areas
Semi-structured interviews were conducted with representatives of NGOs and CBOs operating in the catchment areas of the health facilities. The interviews sought to better understand the types of activities organizations were implementing (including nutrition services), target populations, capacity to provide services at the community-level, and linkages with health facilities.
Interviews were conducted with seven organizations in Ntungamo and six in Kisoro.
3.18 AREAS OF FOCUS FOR NGOS AND CBOS The key areas of focus for NGOs and CBOs operating in the health facility catchment areas varied widely. However, the focus areas for the majority of the organizations were health-related. This included services for HIV care and support,
equipment/supplies and less workload (more staff). HC IIIs’ second and third most common responses were better incentives and less workload.
B. Former NuLife-Supported Hospitals Survey Group Results
According to Table 3.62, most (75%) hospitals reported giving written job descriptions, and all reported conducting job appraisals for their staff. Additionally, most hospitals provided salary supplements and per diems during training. The most common salary supplements provided were outreach allowances, overtime payment, and provision of non-monetary incentives. The most commonly provided non-monetary incentives for health workers included subsidized housing, training opportunities, discounts for medical services, discounts for medicines, and uniforms.
Facility in-charges reported the three most common activities they would recommend to improve health workers’ performance in providing NACS (Figure 3.12). The most common response was more knowledge or training followed by ensuring necessary equipment and supplies. Supervision was also mentioned as a way of motivation.
3.17 PROVISION OF TECHNICAL SUPPORT SUPERVISION TO HEALTH WORKERS
A. SPRING/Uganda Districts Survey Group Results
All health facilities provided technical support supervision to their health workers. Hospitals generally provided the supervision on a monthly basis, while it was quarterly or less often at HCs. Health facility-in-charges and district staff were the main providers of technical supportive supervision. Nearly all facilities provided supervision on the availability of supplies, checking records or reports, and observing and providing feedback on performance.
The providers of the technical support supervision offered feedback both verbally and in writing. Supervisors most often provided feedback through
66

Assessment of Nutrition Assessment, Counseling, and Support (NACS) Services in Southwest Uganda
3. KEY FINDINGS
dramas and plays, holding educational classes, demonstrating gardening techniques, organizing farmer field groups, and providing medical care.
Specific examples of work done with through or with VHTs and/or health facilities included supporting health facilities during outreach clinics, training VHTs to strengthen their knowledge and skills through coaching and mentoring, and referring community members to health facilities.
Although not reported at the interviews, NGOs usually sign a memorandum of understanding with the district through the Chief Administrative Officer authorizing them to operate within the targeted geographical areas.
At the sub-county level, the Sub-County Chief registers any organizations working or intending to work within specific areas. The organizations directly working with the health facilities always get
chronic diseases (e.g., malaria, and TB), water, sanitation and hygiene (WASH), maternal health (e.g., family planning and ANC), and child health (e.g., immunization and health education). Nutrition-specific services included RUTF/RUTAFA distribution, deworming, and iron and vitamin A supplementation. Nutrition-sensitive focus areas included agriculture and economic strengthening activities. The majority of the organizations reported providing these services on a monthly to quarterly basis.
3.18.1 Implementation StrategiesThe implementation strategies used by the participating NGOs and CBOs worked through existing community structuress and in collaboration with health facilities, VHTs, and community groups and associations. The strategies included holding workshops and trainings, promoting messaging through community
Hospital HC IV HC III
Number of facilities with links to community-based health workers or volunteers 2 7 25
Community-based health volunteers linked to health facilities
Vaccinators 0 0 6
Peer educators 1 3 3
VHTs 2 7 24
Expert clients 0 0 5
Family Support Groups 0 2 1
Number of active community-based health workers or volunteers (mean ± SD)
Vaccinators 0.0±0.0 0.0±0.0 1.1±2.4
Peer educators 0.0±0.0 2.2±2.6 0.9±3.6
VHTs 40.0±28.3 103.2±130.2 40.4±57.1
Expert clients 0.0±0.0 0.6±1.3 2.4±8.2
Family Support Groups 0.0±0.0 0.0±0.0 0.2±1.0
Table 3.65: Proportion of Health Facilities with Community-Based Health Workers or Volunteers
67

June 2013
3. KEY FINDINGS
3.18.3 Capacity Building Plan for Community-Based Service Providers Training for capacity building is coordinated by the District Health Office and health facilities, with support from organizations in the catchment areas. The beneficiaries are VHTs, village health volunteers, peer counselors, teachers, and representatives of households. The trainings are offered in a variety of areas, including HIV care and support, maternal health, child health, and chronic diseases. Nutrition education and nutrition assessment have been included in trainings.
3.18.4 Perceptions on Integration of Nutrition into Program ActivitiesNGOs and CBOs reported that they would be interested in integrating nutrition care into their ongoing activities. They were asked what support they would need to do so.
Organizations identified a need to reduce household food insecurity and malnutrition. They acknowledged they have clients who are in need of nutrition services, especially vulnerable women, but that they lack the capacity to deliver such services. To bridge this gap, organizations said they would need collaborating partners. Specifically, the following items were identified as support needed for NACS: weighing scales and height boards, food storage materials (such as granaries), seeds, therapeutic foods, medicine, and skilled persons in nutrition.
Table 3.66: Types of Nutrition and HIV Services Provided by CHWs
Type of Health Facility
Nutrition Screening
Refer for HIV Counseling and Testing
Home Care
Client Treatment Support
General hospital 1 (50.0) 2 (100.0) 1 (50.0) 1 (50.0)
HC IV 1 (14.3) 7 (100.0) 5 (71.4) 7 (100.0)
HC III 7 (28.0) 17 (68.0) 12 (50.0) 18 (72.0)
introduced to the health facility in-charge through the District Health Office. Any activities that are implemented through the health facility will then require being planned and coordinated with the in-charge.
The focus group discussions found that community mobilization through VHTs and religious and non-religious local leaders helped in mobilizing the community for a particular service. Providing incentives to VHTs seemed to work to keep them interested. Male involvement was also found to be beneficial for the effectiveness of programs, as was client appreciation and recognition.
The challenges were that some community members distrust community services (clients prefer health facilities to outreach services), funding, regular supervision, adequate stock of supplies, communication network, and lack of transportation. Organizations recommended strengthening community linkages, continuous capacity building for community health workers (CHWs), allowances for VHTs, improved record keeping by VHTs, and innovation for marketing services.
3.18.2 Main Stakeholders with Whom the NGOs and CBOs are WorkingThe majority of NGOs and CBOs interviewed (34 in total) reported providing services to extremely vulnerable populations, such as orphans and other vulnerable children, PLHIV, widows, and elderly people, who are most likely to suffer physically and emotionally in case of any risky situation. Only five NGOs and CBOs were not providing services to extremely vulnerable populations.
68
3 The national strategy and operational guidelines for VHTs (MOH 2011b) state that the size of the VHT depends on the number of households in a given village. On average, it should be one VHT member per 25-30 households. Each village should have an average of five VHT members.
Assessment of Nutrition Assessment, Counseling, and Support (NACS) Services in Southwest Uganda
3. KEY FINDINGS
clients for HIV counseling and testing (all hospitals and HC IVs and 18 HC IIIs). CHWs at some facilities provided home care for PLHIV, but very few facilities reported that CHWs were involved in community-based screening for malnutrition (Table 3.66).
In focus group discussions held with community-based health workers (mainly VHTs) it was observed that community-based health workers are involved in numerous public health service provisions in their communities. Nutrition, however, is only a small component of the services they provide. Regarding nutrition-specific and nutrition-sensitive services, VHTs reported providing nutrition screening (using MUAC tapes), distributing vitamin A capsules, distributing de-worming capsules, supporting health workers during immunizations, and distributing mosquito nets. One participant during a focus group discussion stated:
“I teach people about proper hygiene to prevent the spread of some diseases. We teach them to have drinking water boiled, construction of pit latrines, not sleeping with animals in the same house and also teaching people on proper drug usage... We got involved in teaching people on how to feed young children to 5 years, taking care of them in preventing them from getting diseases like malaria through sleeping under mosquito nets and also teaching pregnant women on how to feed themselves and keeping proper hygiene in their homes... We taught the people about having water and soap in pit latrines for washing hands... having backyard gardens for growing vegetables and fruits to feed children on balanced diet and have good health to prevent them from certain diseases.”
VHTs also discussed their role in providing HIV services, including visiting the homes of PLHIV, referring people for HIV testing and counseling, and promoting participation in community-based psychosocial support groups for PLHIV. One VHT
Objective 6: Roles of CHWs in Delivering Preventive and Treatment Nutrition Services and Referral Mechanisms
Community health workers, commonly referred to as VHTs, play a profound role in delivering preventive and treatment health services at the community level in Uganda. The following section provides details of the key finding on the roles of VHTs, facility-community linkages, and the reporting mechanisms used.
3.19 AVAILABILITY OF CHWS
A. SPRING/Uganda Districts Survey Group Results
All health facilities surveyed have links with community-based health workers or volunteers. This includes vaccinators, peer educators, VHTs, expert clients, and family support groups. The majority of the facilities have VHTs, peer educators, and expert clients involved in provision of health education and other related services. Among categories of community-based health workers and volunteers, VHTs had the highest number of active resource persons working with the health facilities. The mean number of active VHTs was approximately 40 in hospitals, 103 in HC IVs, and 40 in HC IIIs (Table 3.65).3
3.20 HEALTH SERVICES PROVIDED BY THE COMMUNITY-BASED HEALTH WORKERS OR VOLUNTEERS
Most health facilities reported their community-based health workers or volunteers being involved in community-based provision of services related to nutrition, HIV and AIDS, and general health. The majority of facilities reported that their community-based health workers or volunteers provided client treatment support (n=1 hospital, n=7 HC IVs, and n=18 HC IIIs) and referred
69
3. KEY FINDINGS
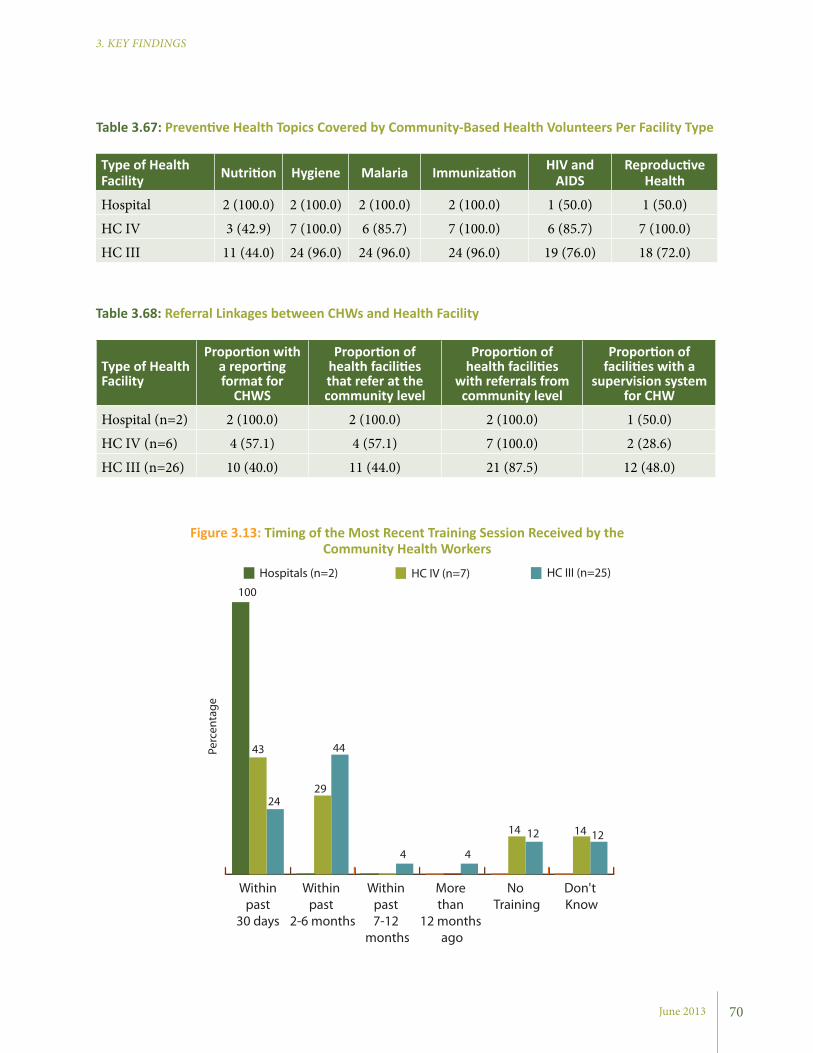
June 2013
3. KEY FINDINGS
70
Type of Health Facility Nutrition Hygiene Malaria Immunization HIV and
AIDSReproductive
Health
Hospital 2 (100.0) 2 (100.0) 2 (100.0) 2 (100.0) 1 (50.0) 1 (50.0)
HC IV 3 (42.9) 7 (100.0) 6 (85.7) 7 (100.0) 6 (85.7) 7 (100.0)
HC III 11 (44.0) 24 (96.0) 24 (96.0) 24 (96.0) 19 (76.0) 18 (72.0)
Table 3.67: Preventive Health Topics Covered by Community-Based Health Volunteers Per Facility Type
Type of Health Facility
Proportion with a reporting format for
CHWS
Proportion of health facilities that refer at the community level
Proportion of health facilities
with referrals from community level
Proportion of facilities with a
supervision system for CHW
Hospital (n=2) 2 (100.0) 2 (100.0) 2 (100.0) 1 (50.0)
HC IV (n=6) 4 (57.1) 4 (57.1) 7 (100.0) 2 (28.6)
HC III (n=26) 10 (40.0) 11 (44.0) 21 (87.5) 12 (48.0)
Table 3.68: Referral Linkages between CHWs and Health Facility
Figure 3.13: Timing of the Most Recent Training Session Received by the Community Health Workers
Don't Know
No Training
More than
12 months ago
Within past 7-12
months
Within past
2-6 months
Within past
30 days
Hospitals (n=2) HC IV (n=7) HC III (n=25)
100
43
2924
44
4 4
14 12 14 12
Perc
enta
ge
3. KEY FINDINGS
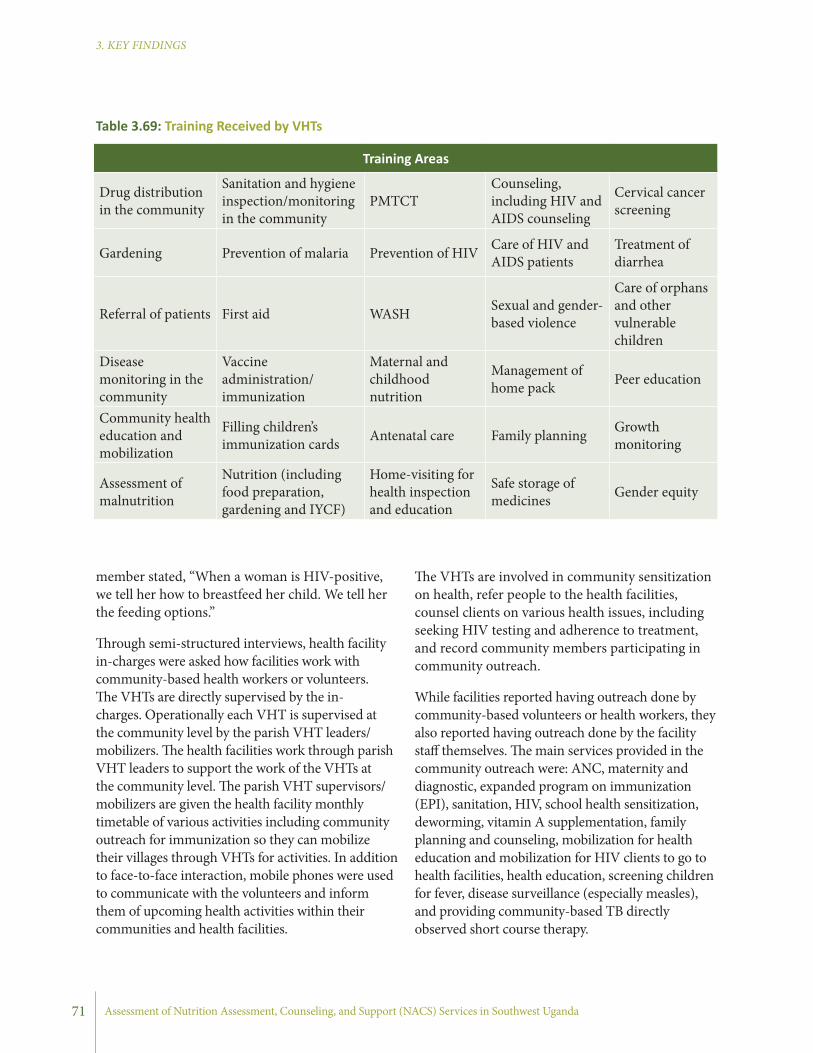
Assessment of Nutrition Assessment, Counseling, and Support (NACS) Services in Southwest Uganda
3. KEY FINDINGS
member stated, “When a woman is HIV-positive, we tell her how to breastfeed her child. We tell her the feeding options.”
Through semi-structured interviews, health facility in-charges were asked how facilities work with community-based health workers or volunteers. The VHTs are directly supervised by the in-charges. Operationally each VHT is supervised at the community level by the parish VHT leaders/mobilizers. The health facilities work through parish VHT leaders to support the work of the VHTs at the community level. The parish VHT supervisors/mobilizers are given the health facility monthly timetable of various activities including community outreach for immunization so they can mobilize their villages through VHTs for activities. In addition to face-to-face interaction, mobile phones were used to communicate with the volunteers and inform them of upcoming health activities within their communities and health facilities.
71
The VHTs are involved in community sensitization on health, refer people to the health facilities, counsel clients on various health issues, including seeking HIV testing and adherence to treatment, and record community members participating in community outreach.
While facilities reported having outreach done by community-based volunteers or health workers, they also reported having outreach done by the facility staff themselves. The main services provided in the community outreach were: ANC, maternity and diagnostic, expanded program on immunization (EPI), sanitation, HIV, school health sensitization, deworming, vitamin A supplementation, family planning and counseling, mobilization for health education and mobilization for HIV clients to go to health facilities, health education, screening children for fever, disease surveillance (especially measles), and providing community-based TB directly observed short course therapy.
Table 3.69: Training Received by VHTs
Training Areas
Drug distribution in the community
Sanitation and hygiene inspection/monitoring in the community
PMTCTCounseling, including HIV and AIDS counseling
Cervical cancer screening
Gardening Prevention of malaria Prevention of HIV Care of HIV and AIDS patients
Treatment of diarrhea
Referral of patients First aid WASH Sexual and gender-based violence
Care of orphans and other vulnerable children
Disease monitoring in the community
Vaccine administration/immunization
Maternal and childhood nutrition
Management of home pack Peer education
Community health education and mobilization
Filling children’s immunization cards Antenatal care Family planning Growth
monitoring
Assessment of malnutrition
Nutrition (including food preparation, gardening and IYCF)
Home-visiting for health inspection and education
Safe storage of medicines Gender equity
3. KEY FINDINGS
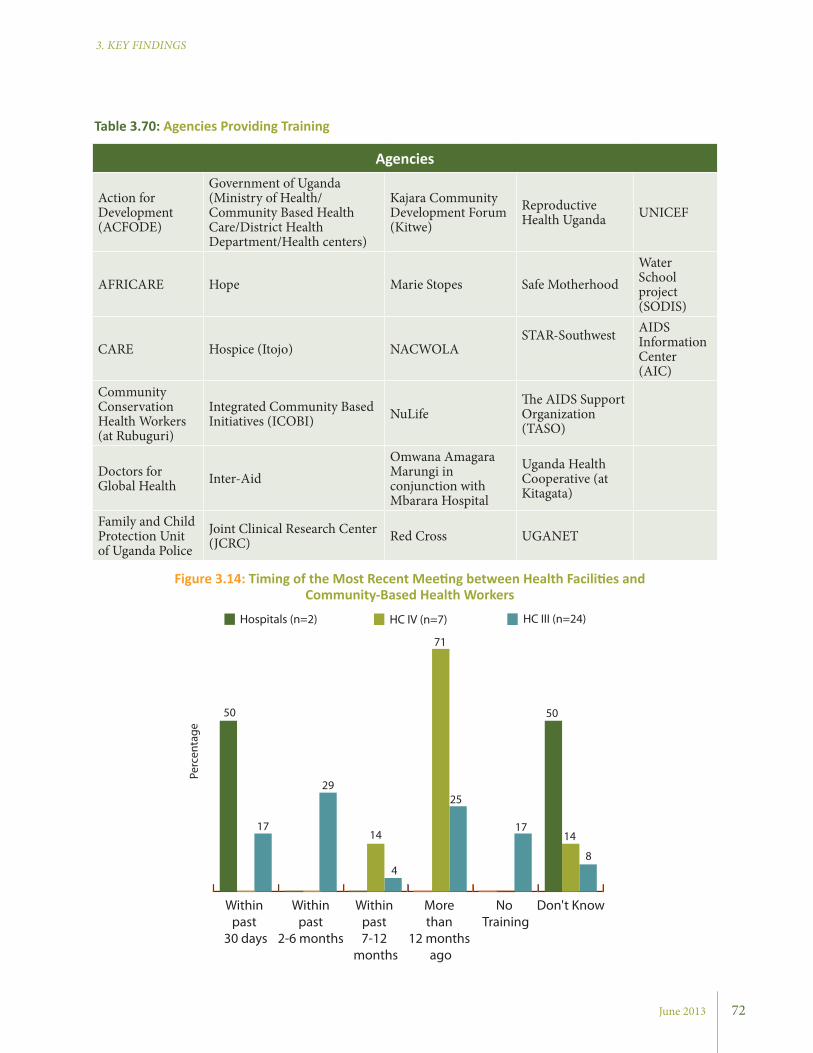
June 2013
3. KEY FINDINGS
Agencies
Action for Development (ACFODE)
Government of Uganda (Ministry of Health/Community Based Health Care/District Health Department/Health centers)
Kajara Community Development Forum (Kitwe)
Reproductive Health Uganda UNICEF
AFRICARE Hope Marie Stopes Safe MotherhoodWater School project (SODIS)
CARE Hospice (Itojo) NACWOLASTAR-Southwest AIDS
Information Center (AIC)
Community Conservation Health Workers (at Rubuguri)
Integrated Community Based Initiatives (ICOBI) NuLife
The AIDS Support Organization (TASO)
Doctors for Global Health Inter-Aid
Omwana Amagara Marungi in conjunction with Mbarara Hospital
Uganda Health Cooperative (at Kitagata)
Family and Child Protection Unit of Uganda Police
Joint Clinical Research Center (JCRC) Red Cross UGANET
Table 3.70: Agencies Providing Training
Figure 3.14: Timing of the Most Recent Meeting between Health Facilities and Community-Based Health Workers
Don't KnowNo Training
More than
12 months ago
Within past 7-12
months
Within past
2-6 months
Within past
30 days
Hospitals (n=2) HC IV (n=7) HC III (n=24)
50
17
29
14
4
71
25
17
50
14
8
Perc
enta
ge
72
3. KEY FINDINGS
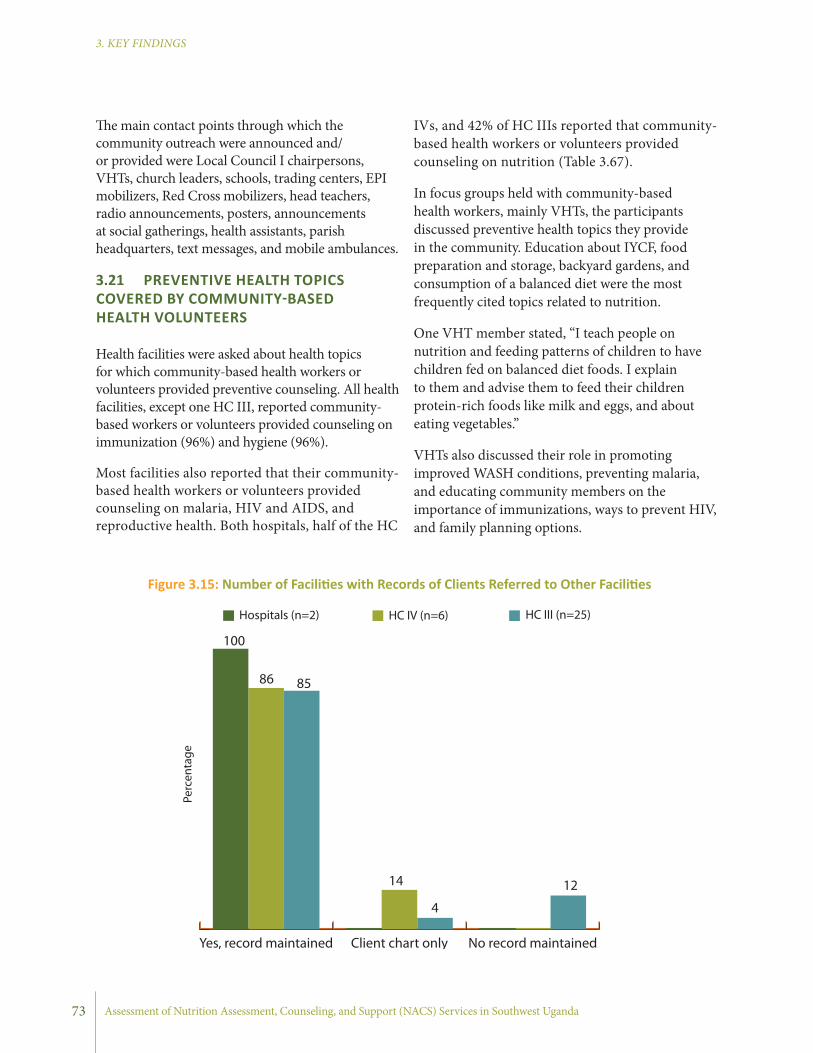
Assessment of Nutrition Assessment, Counseling, and Support (NACS) Services in Southwest Uganda
3. KEY FINDINGS
The main contact points through which the community outreach were announced and/or provided were Local Council I chairpersons, VHTs, church leaders, schools, trading centers, EPI mobilizers, Red Cross mobilizers, head teachers, radio announcements, posters, announcements at social gatherings, health assistants, parish headquarters, text messages, and mobile ambulances.
3.21 PREVENTIVE HEALTH TOPICS COVERED BY COMMUNITY-BASED HEALTH VOLUNTEERS
Health facilities were asked about health topics for which community-based health workers or volunteers provided preventive counseling. All health facilities, except one HC III, reported community-based workers or volunteers provided counseling on immunization (96%) and hygiene (96%).
Most facilities also reported that their community-based health workers or volunteers provided counseling on malaria, HIV and AIDS, and reproductive health. Both hospitals, half of the HC
73
Figure 3.15: Number of Facilities with Records of Clients Referred to Other Facilities
IVs, and 42% of HC IIIs reported that community-based health workers or volunteers provided counseling on nutrition (Table 3.67).
In focus groups held with community-based health workers, mainly VHTs, the participants discussed preventive health topics they provide in the community. Education about IYCF, food preparation and storage, backyard gardens, and consumption of a balanced diet were the most frequently cited topics related to nutrition.
One VHT member stated, “I teach people on nutrition and feeding patterns of children to have children fed on balanced diet foods. I explain to them and advise them to feed their children protein-rich foods like milk and eggs, and about eating vegetables.”
VHTs also discussed their role in promoting improved WASH conditions, preventing malaria, and educating community members on the importance of immunizations, ways to prevent HIV, and family planning options.
100
86 85
14
4
12
No record maintainedClient chart onlyYes, record maintained
Hospitals (n=2) HC IV (n=6) HC III (n=25)
Perc
enta
ge
3. KEY FINDINGS

June 2013
3. KEY FINDINGS
74
3.22 REFERRAL LINKAGES BETWEEN FACILITIES AND COMMUNITIES
The findings show that all the health facilities have linkages to the community through community-based health workers or volunteers. However, only 16 facilities have a reporting format for community work that the facility staff completes. Of all health facilities, 23 reported making referrals for clients to community-based health workers or volunteers, while 30 health facilities reported receiving referrals from the community. Only one hospital, two HC
Table 3.71: Availability and System for Referral Services by Type of Facility
Type of Health Facility
Proportion of health facilities that have forms where name and location of referral site is documented
Proportion of health facilities that have a system of feedback
Hospital 2 (100.0) 0 (0.0)HC IV 4 (57.1) 1 (14.3)HC III 12 (48.0) 5 (20.0)
Figure 3.16: Proportion of Facilities with Systems for Making Individual Client Appointments by Contact Point
IVs, and 12 HC IIIs had a system for periodic supervision of the community-based health workers or volunteers (Table 3.68).
In focus group discussions with VHTs, they discussed their role in referring community members to health facilities. VHTs stated that they refer sick people to health facilities (including sometimes escorting them to the facilities), referring people to HIV testing, encouraging men to visit facilities for safe male circumcision, and referring severely malnourished people to facilities.
3. KEY FINDINGS
HC III (n=23)HC IV (n=7)Hospital (n=2)
All ART only
90
71
86
6774
100
Perc
enta
ge

Assessment of Nutrition Assessment, Counseling, and Support (NACS) Services in Southwest Uganda
3. KEY FINDINGS
75
HospitalNumber of facilities with links with community-based health workers or volunteers 9
Community based health volunteers linked to health facilities
Vaccinators 1
Peer educators 7
VHTs 6
Expert clients 6
Family Support Groups 6
Trained Birth Attendants 1
Active community based health volunteers (mean±SD)
Vaccinators 0.5±1.0
Peer educators 3.6±3.4
VHTs 17.6.0±20.0
Expert clients 5.4±6.7
Family Support Groups 9.9±18.8
Trained Birth Attendants 3.5±7.0
Table 3.72: Proportion of Health Facilities with Community-Based Health Workers or Volunteers
3.23 TRAINING RECEIVED BY CHWS
In terms of training for CHWs, or volunteers who are linked with the health facilities, one hospital reported that training took place within the last month, while most of the HC IVs reported that a training session took place more than one year ago. HC IIIs reported the greatest variation in trainings, with 17% of facilities reporting having no trainings. Figure 3.13 provides more detail.
During focus groups it was observed that some VHTs do receive training through health facilities. One VHT member stated, “If you are an active VHT member, if trainings come up, they [the health facility] will immediately call you to attend.” “Refresher trainings” were commonly cited as a recommendation for improving VHT performance.
3.24 BENEFICIARIES OF THE TRAINING CONDUCTED BY HEALTH FACILITIES
Health facilities, through the support of district health office, the Ministry of Health and/or NGOs, conducted training on specific health issues. The trainings targeted health workers, including health facility-in-charges and laboratory staff, VHTs, peer counselors, and parish mobilizers. The type of training and the topics covered differed.
3.25 TRAINING OF VHTS
From the focus group discussions, it was noted that a majority of the VHTs have received basic training on their roles as community volunteers (Table 3.69). However, in terms of technical training, there was variation depending on the agency working with VHTs (Table 3.70).
3. KEY FINDINGS
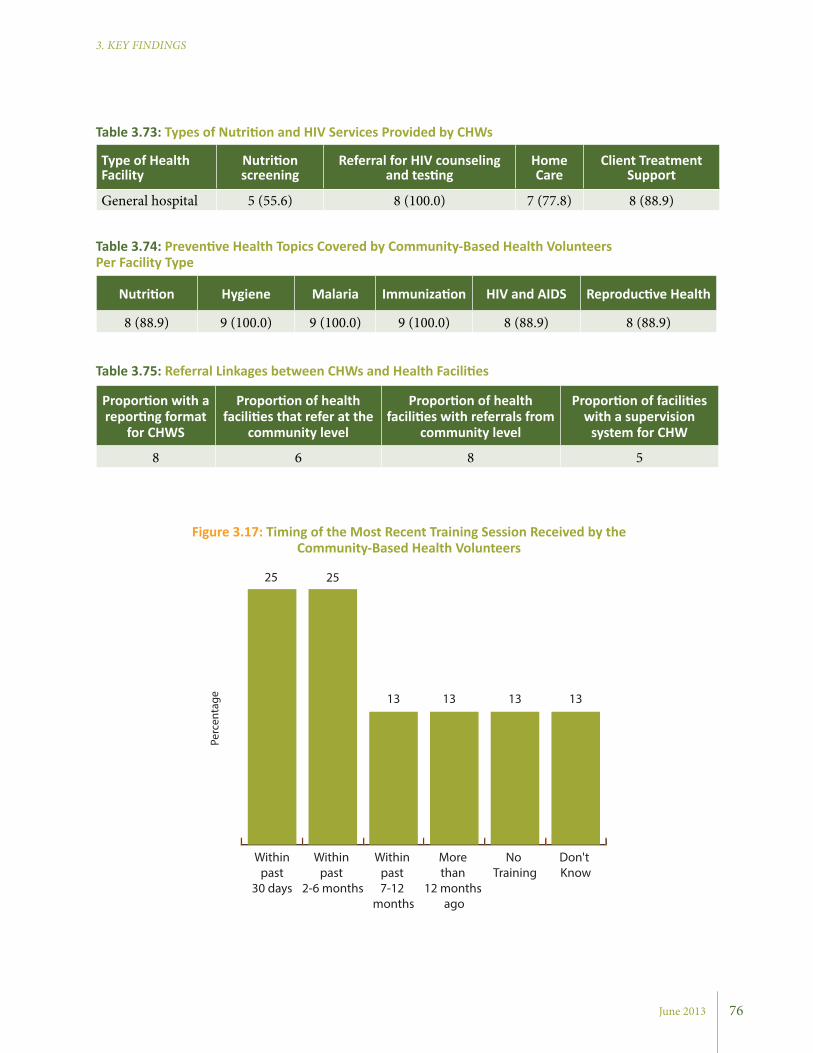
June 2013
3. KEY FINDINGS
76
Type of Health Facility
Nutrition screening
Referral for HIV counseling and testing
Home Care
Client Treatment Support
General hospital 5 (55.6) 8 (100.0) 7 (77.8) 8 (88.9)
Table 3.73: Types of Nutrition and HIV Services Provided by CHWs
Nutrition Hygiene Malaria Immunization HIV and AIDS Reproductive Health
8 (88.9) 9 (100.0) 9 (100.0) 9 (100.0) 8 (88.9) 8 (88.9)
Table 3.74: Preventive Health Topics Covered by Community-Based Health Volunteers Per Facility Type
Proportion with a reporting format
for CHWS
Proportion of health facilities that refer at the
community level
Proportion of health facilities with referrals from
community level
Proportion of facilities with a supervision
system for CHW
8 6 8 5
Table 3.75: Referral Linkages between CHWs and Health Facilities
Figure 3.17: Timing of the Most Recent Training Session Received by the Community-Based Health Volunteers
Don't Know
No Training
More than
12 months ago
Within past 7-12
months
Within past
2-6 months
Within past
30 days
13 13 13 13
25 25
Perc
enta
ge
3. KEY FINDINGS
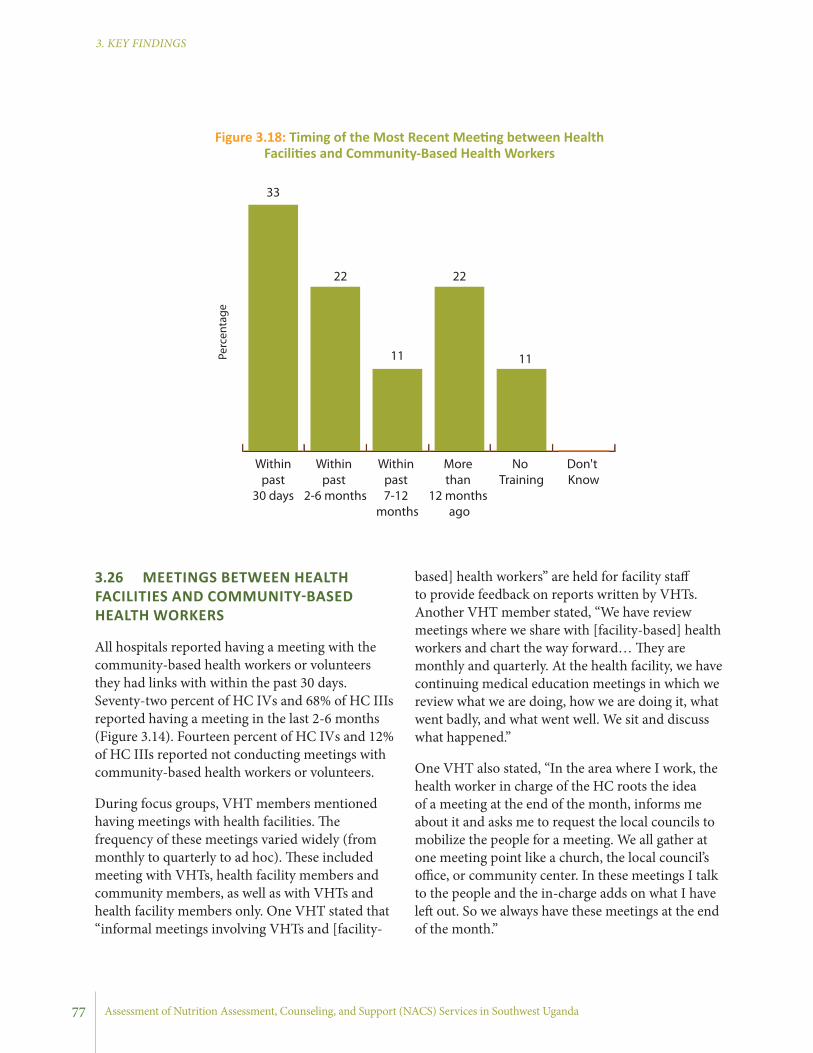
Assessment of Nutrition Assessment, Counseling, and Support (NACS) Services in Southwest Uganda
3. KEY FINDINGS
based] health workers” are held for facility staff to provide feedback on reports written by VHTs. Another VHT member stated, “We have review meetings where we share with [facility-based] health workers and chart the way forward… They are monthly and quarterly. At the health facility, we have continuing medical education meetings in which we review what we are doing, how we are doing it, what went badly, and what went well. We sit and discuss what happened.”
One VHT also stated, “In the area where I work, the health worker in charge of the HC roots the idea of a meeting at the end of the month, informs me about it and asks me to request the local councils to mobilize the people for a meeting. We all gather at one meeting point like a church, the local council’s office, or community center. In these meetings I talk to the people and the in-charge adds on what I have left out. So we always have these meetings at the end of the month.”
3.26 MEETINGS BETWEEN HEALTH FACILITIES AND COMMUNITY-BASED HEALTH WORKERS
All hospitals reported having a meeting with the community-based health workers or volunteers they had links with within the past 30 days. Seventy-two percent of HC IVs and 68% of HC IIIs reported having a meeting in the last 2-6 months (Figure 3.14). Fourteen percent of HC IVs and 12% of HC IIIs reported not conducting meetings with community-based health workers or volunteers.
During focus groups, VHT members mentioned having meetings with health facilities. The frequency of these meetings varied widely (from monthly to quarterly to ad hoc). These included meeting with VHTs, health facility members and community members, as well as with VHTs and health facility members only. One VHT stated that “informal meetings involving VHTs and [facility-
Figure 3.18: Timing of the Most Recent Meeting between Health Facilities and Community-Based Health Workers
Don't Know
No Training
More than
12 months ago
Within past 7-12
months
Within past
2-6 months
Within past
30 days
33
22
11
22
11Perc
enta
ge
77
June 2013
3. KEY FINDINGS
78
3.27 INTER-FACILITY CLIENT REFERRALS
All the health facilities reported referring clients to other facilities to get other health services. As shown in Figure 3.15, almost all the health facilities reported maintaining record of clients they refer to other facilities, except for 12% of HC IIIs.
All hospitals used pre-printed forms for referral of clients to other health facilities and had a system for receiving feedback for referrals made. However, only 57% of HC IVs and 48% of HC IIIs reported using pre-printed forms. Only six HCs had a system for receiving feedback (Table 3.71).
3.28 PROPORTION OF HEALTH FACILITIES WITH SYSTEMS FOR INDIVIDUAL CLIENT APPOINTMENTS
Most hospitals and about two-thirds of HCs reported having a system for making individual client appointments (Figure 3.16). Specifically, within the ART clinics, only 17% of HC IVs reported having such a system.
3.29 AVAILABILITY OF CHWS
All hospitals surveyed have links with community-based health workers or volunteers. This includes vaccinators, peer educators, VHTs, expert clients, family support groups, and trained birth attendants. The majority of the facilities have VHTs, peer educators, expert clients, and family support groups involved in the provision of health education and other related services. Among categories of community-based health workers and volunteers, VHTs had the highest number of active resource persons working with the health facilities. The mean number of active VHTs was 18 (Table 3.72).
3.30 HEALTH SERVICES PROVIDED BY COMMUNITY-BASED HEALTH WORKERS OR VOLUNTEERSMost health facilities reported community-based health workers or volunteers were involved in
community-based provision of services related to nutrition, HIV and AIDS, and general health. The majority of facilities reported that community-based health workers or volunteers provided client treatment support (88.9% of hospitals) and referred clients for HIV counseling and testing (100% of hospitals). Community-based health workers or volunteers at some facilities provided home care for PLHIV (77.8%), but few facilities reported that the community workers were involved in community-based screening for malnutrition (55.6%) (Table 3.73).
3.31 PREVENTIVE HEALTH TOPICS COVERED BY COMMUNITY-BASED HEALTH VOLUNTEERS
Hospitals were asked about health topics their community-based health workers or volunteers provided preventive counseling. All hospitals reported that community-based workers or volunteers provided counseling on hygiene, malaria, and immunization. Most facilities also reported that their community-based health workers or volunteers also provided counseling on nutrition (88.9%), HIV and AIDS (88.9%), and reproductive health (88.9%) (Table 3.74).
3.32 REFERRAL LINKAGES BETWEEN FACILITIES AND COMMUNITIES
Eight hospitals had a reporting format for community work that the facility staff completed. Six hospitals reported making referrals for clients to community-based health workers or volunteers, while eight hospitals reported receiving referrals from the community. Five hospitals reported having a system for periodic supervision of the community-based health workers or volunteers (Table 3.75).
3.33 TRAINING RECEIVED BY COMMU-NITY HEALTH VOLUNTEERS
In terms of trainings for CHWs or volunteers who are linked with the hospitals, 25% of hospitals reported that trainings took place within the last
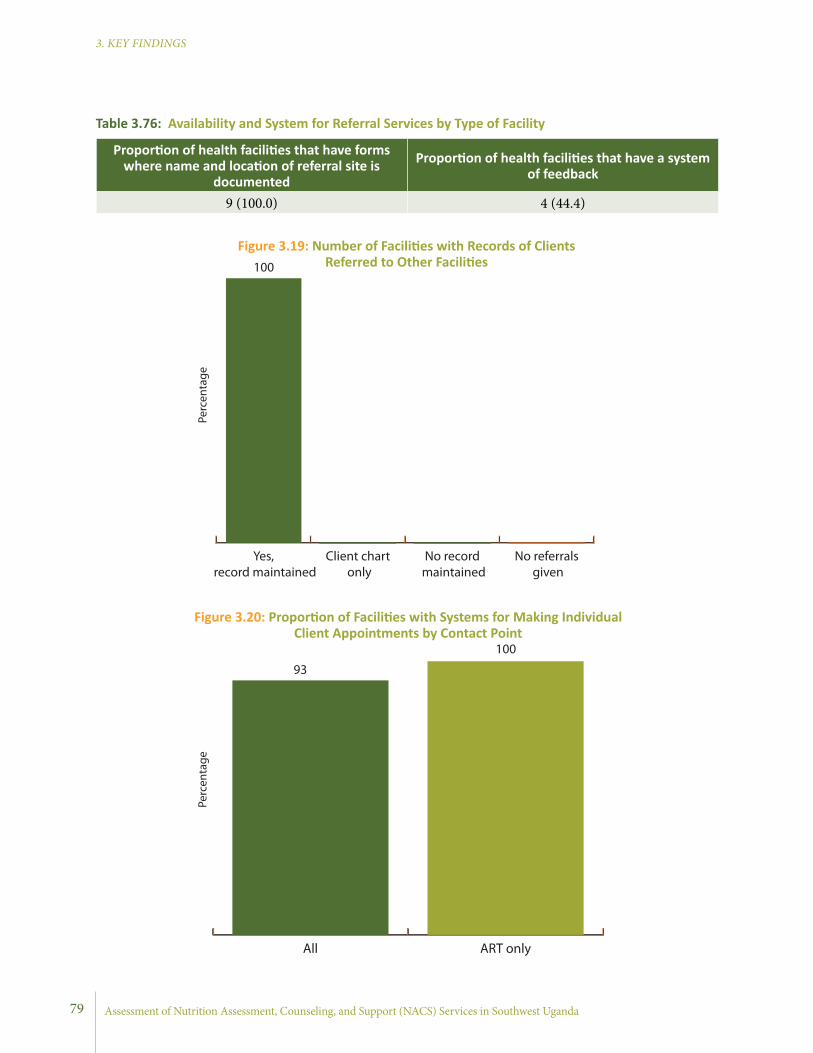
Assessment of Nutrition Assessment, Counseling, and Support (NACS) Services in Southwest Uganda
3. KEY FINDINGS
79
Proportion of health facilities that have forms where name and location of referral site is
documented
Proportion of health facilities that have a system of feedback
9 (100.0) 4 (44.4)
Table 3.76: Availability and System for Referral Services by Type of Facility
Figure 3.19: Number of Facilities with Records of Clients Referred to Other Facilities
Figure 3.20: Proportion of Facilities with Systems for Making Individual Client Appointments by Contact Point
No referrals given
No record maintained
Client chart only
Yes, record maintained
100
Perc
enta
ge
ART onlyAll
Perc
enta
ge
93
100
June 2013
3. KEY FINDINGS
4. SUMMARY OF KEY FINDINGS AND DISCUSSION
4.1 HEALTH WORKFORCE
• Only 60% of the recommended staffing positions, by type of facilities, were filled.
This study concords with current statistics and education levels of staff by health facility, even though the percent of filled positions remained low. Only a little over 60% of the positions of surveyed facilities had been filled. This, as always, is an important point due to the powerful association of quality of care with the adequate number and education level of health workers.
Training levels of providers varied within and between facilities. Most (over 70%) of basic level nurses/midwives had medium level training. Most of the nurses attended maternal and infant health services, and general nurses attended to a broader scope of needs within most of the facilities, although better trained providers benefited clients and the communities more.
The focus of NACS training should therefore target these groups. It is useful to equip general nurses and midwives with the knowledge and skills to implement NACS, as these groups carry most of the burden of service provision by facility type. This may be especially important in terms of integrating nutrition services at different contact points as these providers work across contact points.
• Only one-third of the approved positions were filled at former NuLife-supported hospitals. The percent of vacant posts for health workers varied from 59-76%.
The availability of specialized medical doctors and medical doctors was limited mainly to ART, OPD, maternity, and pediatric clinics. Nurses/ midwives were the most common cadres of health workers available at all contact points, although the number
varied across contact points. Nursing assistants were reported to be available at all contact points except for nutrition. ART and OPD contact points seemed to have the most diverse group of health workers compared to all other service delivery contact points.
4.2 BASIC INFRASTRUCTURE
• Basic infrastructure index showed a decreasing trend by type of facility in SPRING/Uganda districts.
The basic infrastructure index includes a number of indicators, including power source, water source, and infrastructure available on-site. The index scores range from 0 (worst) to 5 (best).
Health facilities act as an interface between the health service delivery and the community. They house equipment and technologies, and act as a springboard from which outreach services are provided to facilitate accessibility to both curative and preventive health services. Effective health care delivery requires a network of functional health facilities, and presently, the coverage of infrastructure in Uganda is estimated at 72%.19
However, the infrastructure assessments in this survey by no means replace a comprehensive assessment which includes medical equipment and medicines/medical supplies. The survey only looked at selected basic infrastructure indicators relevant to nutrition services. Accordingly, the results of the survey showed higher index for hospitals (3.7) compared to HC IVs (2.9) and HC IIIs (1.0). When this is disaggregated by type of infrastructure indicators, for example, 100% of the hospitals have an uninterrupted water supply while only 71% and 80% of the HCs IVs and HC IIIs, respectively, reported to have an uninterrupted water supply. As availability of water affects quality
80
Assessment of Nutrition Assessment, Counseling, and Support (NACS) Services in Southwest Uganda
3. KEY FINDINGS
of health and nutrition services, understanding the infrastructure status of health facilities is relevant while developing nutrition care plans.
• Basic infrastructure index showed an average of 3.9 for all hospitals.
The result of the survey showed an average index of 3.9, with a range of 3.6–4.5. Almost 90% of facilities used a generator as the major source of power. 55% of facilities used a mixed means of communication with higher rate of use of facility-based communication. 78% of facilities reported water was “available always.”
4.3 NUTRITION CAPACITY
• Nutrition capacity varied by qualification in SPRING/Uganda districts; health workers with a higher level of qualification were found to have a higher level of nutrition knowledge compared to those with middle and lower level qualifications.
This survey showed the capacity of health workers in nutrition by assessing the type of key nutrition-related training that they had received during pre-service and ongoing in-service training by qualification of health workers.
Higher-level health providers received a wide range of nutrition information through pre-service training. Nurse/midwife staff led other groups in in-service training.
As nutrition services are provided by a wide range of providers, it is necessary to evaluate the existing curriculum to prepare an integrated nutrition curriculum during basic education, together with post-graduate education for physicians, nurses, and others.
A capacity building plan should be developed at the district level to identify key practitioners implementing actual day-to-day nutrition services for a better targeting of in-service training.
• Nutrition capacity varied by qualification
in former NuLife-supported hospitals– health workers with middle and lower qualification levels were found to receive more in-service training in nutrition compared to those with higher level qualifications
All specialized medical doctors and lab technicians reported receiving HIV-related training as in-service training. A greater proportion of nurses/midwives and nurse assistants received training in different topics, including NACS.
4.4 NACS SERVICES
4.4.1 Nutrition Assessment: • Methods of nutrition assessment varied by
type of health facility and type of service contact point in SPRING/Uganda districts.
A more comprehensive nutrition assessment (dietary, clinical, anthropometric, and biochemical) across all service contact points was reported by hospitals (over 80%) compared to HC IVs (60%) and HC IIIs (40%) (mostly dietary and clinical). Nearly all facilities performed nutritional assessments well at ART service contact points (90% for hospitals, 80% for HC IVs, and 55% for HC IIIs) compared to all other service contact points.
It is interesting to note that nutrition assessment services are already part of ART services, although the quality needs to be strengthened as reported in the observation checklist.
It is also important to understand the context in which most nutrition assessments were conducted. Oftentimes the assessments were done to assess the state of the client’s health, and thus lacked the degree of thoroughness needed for a standard nutrition assessment. Moreover, it is likely that the quality of routine nutrition-related diagnostics, in favor of managing illness, was undermined. Improving the quality of nutrition assessments is important for timely detection, management, and prevention of malnutrition for all age groups.
4. SUMMARY AND DISCUSSION
81
June 2013
3. KEY FINDINGS
facilities. The explanation for such low performance is often associated with the shortage of time.
The challenge is how to increase the level of providers’ performance at all levels. The mechanism and willingness to strengthen counseling services might already be available; however, more negotiation is needed at the facility level for task shifting to volunteers and community workers to provide counseling after receiving appropriate training and counseling tools. It is also important to plan for ongoing mentoring and coaching services to these groups for improved quality of nutrition counseling, if facilities choose to do so.
• Counseling services are provided across all contact points in former NuLife-supported hospitals.
It was observed that 85% and 89% hospitals provided counseling at other contact points and ART contact points, respectively. It is interesting to note counseling is being provided in hospitals at such high rates.
4.4.3 Nutrition Support:
Materials, Supplies, and Equipment
• Materials necessary for proper function of NACS services varied among health facilities.
• Nutrition assessment equipment and supplies were generally available at all facilities.
• Facilities have good stock and storage conditions for supplies for the majority of nutrition related supplies.
Nutrition support is a key part of health facility services. Facilities serve a large number of clients and provide many nutrition/micronutrient-related services per year. Facilities were assessed for their capacity to properly manage nutrition-related issues, in terms of supplies/equipment, and support (guidelines, educational materials, and protocols). The materials assessed include health worker tools (policy guidelines, protocols), and education
Assessing nutritional status can be relatively simple, especially basic exams (such as appraising mucosa, pallor, or goiter, or inquiring about diet, night blindness, taking weight, and MUAC), and can be easily incorporated into any exam with little additional time, staff, training, or equipment (except for hemoglobin).
• Methods of nutrition assessment remained similar across former NuLife-supported hospitals.
Taking weight, checking for odema and pallor, and measuring weight were found to be the most common assessments performed. The least assessed were taking length/height, hemoglobin estimation, and checking for dietary history. Medical officers, nurse assistants, nurses/midwives, nutritionists and allied health workers all performed nutrition assessments at different rates. Nurse assistants (83%) perform nutrition assessment at higher rate followed by medical officers (77%). Only one-third of nutritionists performed nutrition assessments.
4.4.2 Nutrition Counseling: • More counseling is practiced at HC IIIs and
hospitals compared to HC IVs in SPRING/Uganda districts.
Two-thirds of the HC III and hospitals reported practicing nutrition counseling compared to HC IVs (33%) at all service points.
When analyzed for ART service contact points separately, a slightly lower percentage was shown for hospitals (50%) compared to the HC IIIs, though the reason for low counseling practice (50%) at the hospitals was unclear.
Overall, in this survey, more nutrition counseling was done in the smaller health facilities with less well-trained providers. It is still an interesting finding that should translate to acknowledgement of these providers as special guardians of health in their communities. However, regardless of the observed good performance at HC III, the overall performance on counseling is still low for all
4. SUMMARY AND DISCUSSION
82
Assessment of Nutrition Assessment, Counseling, and Support (NACS) Services in Southwest Uganda
3. KEY FINDINGS
were reported more frequently by HCs compared to hospitals. Availability of nutrition assessments equipment at ART clinics was better compared to ANC, YCC and OPD. Use of the available counseling tools by providers was also quite low. This could be due to a lack of awareness on the availability of these tools or a lack of interest or willingness to use the available tools.
Overall, these findings suggest that most support activities for NACS are in place, though there are some variations by type of facility. Emphasis is needed to strengthen the capacity of these facilities to make support activities available in a systematic and continuous manner to improve quality and use of nutrition services.
• Materials supporting nutrition counseling were available only in 50% of former NuLife-supported hospitals.
• Nutrition assessment equipment and supplies were available at all former NuLife-supported hospitals.
• Facilities have good stock and storage conditions of nutrition supplies in all former NuLife-supported hospitals.
Averaged for all services, availability of guidelines and counseling tools was still below 50%, though use has been reported to be high where available.Availability of nutrition tools and equipment was almost uniform by contact points. More MUAC tapes were reported at all sites compared to weighing scales and measuring boards.
The availability of essential nutrition supplies showed that all supplies were in stock on the day of the survey including theraputic food supplies. Few supplies, such as F-75, F -100, and CMV were identified to be minimaly stocked compared to other supplies. Availability of stock almost related to availability and use of stock cards to update status. Supplies with no stock cards were less available (F-75, F-100, zinc gluconate, Resomal and CMV) compared with other dugs with stock cards and use.
materials, such as posters, charts, and brochures. Over two-thirds of the facilities did not have policy guidelines, protocols or counseling charts. Availability also varied by type of facility. Hospitals had better availability of these materials for use compared to HCs.
The national guidelines and protocols were mostly developed by official health departments and disseminated to assist with nutrition management at the decentralized level. Although all facilities should have up-to-date protocols, it was found that some facilities have all, some, or none. Of the one-third of facilities that reported having policy guidelines, protocols, or counseling charts, 60% were hospitals.
In terms of key nutrition-related supplies, overall the facilities were well stocked with essential nutrition supplies. Vitamins and minerals (folic acid, iron, zinc, multivitamins, and vitamin A) were all managed at different levels and were in stock during the survey in most facilities though stock outs were noted in 14-40% of health facilities. However, few health facilities managed specialized foods such as F-75, F-100, ready-to-use therapeutic food (RUTF), and ResoMal. None of the facilities had 20 CMV in stock at the time of the survey.
In general, facilities had good storage facilities, and all supplements/medicines were protected from both the rain and sun. The majority of facilities also maintained supplies on shelves and not on the floor, where they could be reached by animals and/or water (data not reported). This practice should be appreciated and reinforced by supervisors.
In addition, ways of ensuring forecasting of specialized food should be given priority attention as operationalizing nutrition support plans is heavily dependent on the availability of these supplies. The availability of key nutrition tools and equipment was reported by all facilities, although variation exists by number and type at different service contact points.
All facilities had child and adult scales and MUAC tapes while few reported having length/height boards at time of the survey. Length/height boards
4. SUMMARY AND DISCUSSION
83
June 2013
3. KEY FINDINGS
were found to be the most common documents used to record nutrition information. Use of child health cards was higher for ART clinics compared to all combined services sites.
4.6 QUALITY ASSURANCE AND QUALITY IMPROVEMENT
• Most facilities implement one or more (out of four) quality assurance activities.
• Most facilities implement quality improvement activities (the 5S method) to improve quality of services.
Using a QI approach to integrate nutrition into HIV treatment, care, and support and other preventive health services is the focus of SPRING/Uganda’s strategy to improve the quality of nutrition services and strengthen the link between treatment and preventive nutrition services.
Findings from the survey showed that QA and QI activities are being implemented in most of the assessed health facilities (100% of hospitals, 80% of HC IVs, and 88% of HC IIIs). The main quality assurance activities at hospital level were supervisory checklists for health system components and facility-wide review of mortality. Both levels of HCs (80%) used audits, medical records, and supervisory checklists for health service provision as their main quality assurance activities. Of all health facilities assessed, 80% of HC IVs implement the 5S method, while only 35% of HC IIIs and none of the hospitals did. Most of the US Government’s implementing partners receive technical support from the HCI Project in Uganda to apply a standardized QI approach in their projects. The country has also taken steps to ensure the integration of QI activities into the NACS training manual which is being finalized for use by partners. These efforts have accounted for the availability of QI and QA activities in most of the facilities surveyed. SPRING/Uganda will build on this experience to ensure QI activities are extended to the key contact points for provision of standardized quality nutrition services.
4.5 DOCUMENTATION OF NUTRITION DATA/INFORMATION
• Reported documentation of nutrition information varied widely by service and facility type in SPRING/Uganda districts.
The survey assessed whether providers recorded nutrition information, including MUAC, length/height, weight, anthropometric indicators, hemoglobin, pallor, and edema, across all service contact points. For example, MUAC was recorded by 80% of hospitals, 19% of HC IVs, and 7% of HC IIIs. Weight was recorded by 10% of hospitals, 69% of HC IVs and 44%, of HC IIIs. Length/height was recorded by 20% of hospitals, and less than 10% of HC IVs and HC IIIs. Results showed (although there was variation by type of services) that when facilities recorded nutrition information, it was recorded either in patient registers, client cards, client records, or child health cards. Most clients seem to have health cards in their possession, and providers appeared to have good recordkeeping practices in place (i.e., marking health cards and registries). This diligence in recordkeeping should be praised and reinforced by supervisors.
Building on this practice, indicators needed to track performance of NACS at facilities should be defined and negotiated for incorporation. Good records are fundamental for monitoring progress and assuring proper practices. Recording methods should be evaluated often, and providers should be shown the results of their efforts (reports of data collected) as it can act as a motivator for providers.
• Nutrition assessment indicators are mostly recorded compared to nutrition counseling services in former NuLife-supported hospitals.
Among the different nutrition information gathered, MUAC, weight, length/height, and BMI-for-age z-scores were commonly included in records at each contact point. Documentation seems generally weak for other services of NACS. Client cards, patient registers, and clinical reports
4. SUMMARY AND DISCUSSION
84
Assessment of Nutrition Assessment, Counseling, and Support (NACS) Services in Southwest Uganda
3. KEY FINDINGS
as these facilities received supervision less often compared to higher-level facilities.
Most of the interviewed facility in-charges reported that providers received job descriptions, job appraisals, and salary supplements, which they felt could motivate health workers and maintain their technical competencies.
The most commonly used non-monetary incentives were granting access to medical services with discounts and arranging training opportunities to be continually exposed to current and new information.
• Supportive management systems for the assessed former NuLife-supported hospitals are strong.
Nearly all hospitals (n=9) arranged technical supportive supervision to their health workers on a monthly basis. The most common providers of the supportive supervision were facility-in-charges, senior staff, and NGOs. The content of the technical supervision was mainly focused on availability of supplies, checking records or reports, and observing and providing feedback on performance.
4.8 METHODS TO SOLICIT CLIENTS’ OPINIONS
• Methods used to solicit clients’ opinions varied by facility type.
Facilities were assessed for the availability of methods through which they could gather feedback and clients’ opinions. Middle- and lower-level facilities mostly used interactive methods (meetings with community leaders and discussions with clients) while none of these methods were reported for hospitals. Hospitals reported the use of suggestion box as the only method of collecting opinions. The difference in selection of methods could be attributed to the nature of lower-level health facilities, and that most preventive services are done at lower-level facilities. This often requires dialogue and discussion with communities to plan, execute, and attract clients to use preventive
• Different types of QA activities were reported as being implemented in former NuLife-supported hospitals.
The main methods used were the supervisory checklist of health components, a facility-wide review of mortality, staff reports, and auditing of medical records. Of all hospitals, 50% had an active QA system and a committee at the time of the assessment.
4.7 SUPPORTIVE MANAGEMENT FOR HEALTH CARE PROVIDERS
• Supportive management systems for health workers are fairly strong in the assessed health facilities.
The survey collected information on whether facilities had supervisory and staff development activities, which are important for supporting quality health care. Supervision has many benefits. It can help ensure that system-wide standards and protocols are followed at the facility level and can promote an organizational culture that expects that such standards and protocols are implemented. It provides an opportunity to expose staff to a wider scope of ideas and relevant experiences, including on-the-job training for some providers. It can also act as a motivator for service providers, especially if the supervisor is supportive.
Among the surveyed facilities, hospitals reported more frequent technical support on a weekly and monthly basis while most HCs reported receiving quarterly technical supervisory visits. The technical supervision support was both by internal and external staff for hospitals and HC IVs while HC IIIs reported mainly having external supervision.
It is interesting to note that these facilities received regular supervision which may be a result of having a routine staff supervision plan by external supervisors. However, it is important to develop a culture of using internal facility staff to provide supportive supervision to lower-level health facilities to increase frequency of supervision,
4. SUMMARY AND DISCUSSION
85

June 2013
3. KEY FINDINGS
services, (e.g., vaccination, ANC, etc.). Either way, these findings call for an increase in the awareness of hospital management for the need to develop a system of interaction with communities that they are serving to better understand their demands and requests for improvement of quality of services.
• Suggestion boxes are the most common way of collecting clients’ opinions in former NuLife-supported hospitals.
Half of the hospitals reported availability of a system for determining clients’ opinions. These hospitals mostly used a suggestion box as a method to collect clients’ opinions and reported making changes in their programs/services as result of the clients’ feedback.
4.9 COMMUNITY-BASED SERVICES
• There are numerous NGOs and CBOs that clients can be linked to for improved nutrition outcomes.
The NACS approach aims to link individuals to community-based interventions that can help improve food security and nutritional status. The survey found that there are numerous NGOs and CBOs operating in the catchment areas of the health facilities that clients could theoretically be linked to. The focus areas of these organizations varied widely. The majority of NGOs and CBOs
4. SUMMARY AND DISCUSSION
86
implemented health-related activities. This included direct service provision of nutrition services (e.g., iron and vitamin A supplementation), ANC, and care and support services for PLHIV. Other focus areas for NGOs and CBOs included interventions that can indirectly improve nutritional status, such as savings and loans groups, economic strengthening activities, and agriculture activities.
4.10 REFERRAL LINKAGES • Most health facilities have links with
CHWs who provide community-based services related to health, nutrition, and HIV and AIDS.
Quantitative and qualitative data highlighted the critical role that CHWs play in providing services and linking health facilities and communities. CHWs reported involvement in the provision of numerous public health services in their communities. Among the many services they provide, nutrition was a small component. Such services included distributing vitamin A and deworming capsules and providing nutrition counseling. In addition to the strong role CHWs play in the community, they are intermediaries in referring individuals in the community to facility-based services. However, despite all health facilities having linkages to CHWs, only 16 of 34 health facilities in SPRING/Uganda districts had a reporting format for community work.
Assessment of Nutrition Assessment, Counseling, and Support (NACS) Services in Southwest Uganda
3. KEY FINDINGS
Findings also indicated that there were several NGOs and CBOs implementing health, agriculture and livelihood related activities within the facility catchment areas that clients could be referred to. Additionally, community health workers were found in all health facilities and were involved in provision of several public health services, of which nutrition is only a small proportion. These health workers are potentially important channels for delivering preventive and treatment nutrition services for vulnerable groups, including PLHIV. However these community health workers will need specific nutrition training, referral tools and equipment to actively engage in nutrition service provision at the community level. Efforts to improve nutrition services and nutrition status among vulnerable groups served by health facilities may include wider aspects of health systems and capacity improvement.
5. CONCLUSION
The main focus of this survey was to assess factors influencing the delivery of nutrition-related services at health facilities and pursue ways which these might be improved with the ultimate goal of better nutritional health for those served.
Findings indicated that the delivery of nutrition services at an optimal level in the surveyed health facilities will be challenging. The facilities did not have adequate capacity in terms of supplies, equipment and infrastructure to implement nutrition interventions for populations in their catchment areas. The facilities were understaffed, and the available health workers did not have adequate knowledge and skills for nutrition-related care and support services. The majority of health workers identified building their nutrition related capacity and provision of nutrition supplies as the most important source of motivation that would enable them improve the quality of nutrition services.
87
June 2013
3. KEY FINDINGS
Works Cited
Bhutta, Z., Ahmed, T., Black, R. E., et al. 2008. “What works? Interventions for maternal and child undernutrition and survival.” The Lancet, 371: 417–40.
CORE Group. 2012. Getting the Knack of NACS: Highlights from the State of the Art (SOTA) Meeting on Nutrition Assessment, Counseling and Support (NACS), 22-23 February 2012, Washington D.C. Meeting Report. Washington, D.C.: CORE Group.
Food and Nutrition Technical Assistance II Project (FANTA-2). 2010. The Analysis of the Nutrition Situation in Uganda. Washington, DC: FANTA-2.
MOH [Ministry of Health]. 2007. Annual Health Sector Performance Report: Financial Year 2006/2007. Kampala, Uganda.
MOH. 2009. National Child Survival Strategy. Kampala, Uganda.
MOH. 2010a. Human Resources for Health Audit Report 2010. Kampala, Uganda.
MOH. 2010b. VHT Strategy and Operational Guidelines. Kampala, Uganda: Government of Uganda.
MOH. 2011a. Human Resources for Health Audit Report 2011. Kampala, Uganda: Government of Uganda.
MOH. 2011b. Health Sector Quality Improvement Framework and Strategic Plan 2010/11-2014/15. Government of Uganda: Kampala, Uganda.
88
MOH, ICF International, Centers for Disease Control and Prevention, United States Agency for International Development, World Health Organization, Uganda Bureau of Statistics, and Uganda Virus Research Institute. 2012. Uganda AIDS Indicator Survey 2011: Preliminary Report.Uganda Bureau of Statistics. 2007. Projections of Demographic Trends in Uganda, 2007-2017. Kampala, Uganda.
Uganda AIDS Commission. 2009. National HIV/AIDS Stakeholders & Services Mapping. Kampala, Uganda.
Uganda Bureau of Statistics & Macro International Inc. 2007. Uganda Demographic and Health Survey 2006. Calverton, Maryland, USA: Uganda Bureau of Statistics & Macro International Inc.
Uganda Bureau of Statistics & Macro International Inc. 2012. Uganda Demographic and Health Survey 2011. Calverton, Maryland, USA: Macro International Inc.
WHO [World Health Organization]. 2006. Health System Profile for Uganda. Geneva, Switzerland: WHO.
WHO. 2007. Everybody’s Business: Strengthening Health Systems to Improve Health Outcomes, WHO’s Framework for Action. Geneva, Switzerland: WHO.
Assessment of Nutrition Assessment, Counseling, and Support (NACS) Services in Southwest Uganda
3. KEY FINDINGS
Appendix 1: List of Counseling Best Practices Tracked in Facility Assessment
89
The following questions were answered by data collectors during client observations. They have been aggregated and reported in Tables 3.37 and 3.40.
Did the health worker greet the client?
Did the health worker greet client in a pleasant way, demonstrating caring (smiles, touches appropriately, makes acknowledging gestures)?
Did the health worker introduce her/himself to the client?
Did the health worker treat the client with respect? [To be decided based on local context.]
Did the health worker communicate in language based on the client’s knowledge, cultural values, and beliefs?
Did the health worker listen carefully and actively to the client’s concerns?
Did the health worker act empathetic and address client’s needs and concerns?
Did the health worker make eye contact when talking to the client?
Did the health worker ask open-ended questions (e.g., “How have you been since last time I saw you?”)?
Did the health worker praise and/or re-affirm things the client is doing right (e.g., “Good job - your weight has increased.”)?
Did the health worker suggest nutrition actions that were acceptable, affordable, and feasible for the client (e.g., increasing dietary intake and improving food hygiene)?
Did the health worker provide practical and realistic suggestions/recommendations to the client?
Did the health worker discuss when the client should return for a follow-up appointment?
Did the health worker give the client an opportunity to ask questions?
Did the client ask questions?

June 2013
3. KEY FINDINGS
SPRING1616 Fort Myer Drive, 16th Floor
Arlington, VA 22209Tel: 703.528.7474 • Fax: 703.528.7480
http://spring-nutrition.orgwww.facebook.com/TheSPRINGProject
Related Documents