Assessment of Modal-Pushover-Based Scaling Procedure for Nonlinear Response History Analysis of Ordinary Standard Bridges Erol Kalkan, M.ASCE 1 and Neal S. Kwong 2 Abstract: The earthquake engineering profession is increasingly utilizing nonlinear response history analyses (RHA) to evaluate seismic performance of existing structures and proposed designs of new structures. One of the main ingredients of nonlinear RHA is a set of ground motion records representing the expected hazard environment for the structure. When recorded motions do not exist (as is the case in the central United States) or when high-intensity records are needed (as is the case in San Francisco and Los Angeles), ground motions from other tectonically similar regions need to be selected and scaled. The modal-pushover-based scaling (MPS) procedure was recently developed to determine scale factors for a small number of records such that the scaled records provide accurate and efficient estimates of “true” median structural responses. The adjective “accurate” refers to the discrepancy between the benchmark responses and those computed from the MPS procedure. The adjective “efficient” refers to the record-to-record variability of responses. In this paper, the accuracy and efficiency of the MPS procedure are evaluated by applying it to four types of existing Ordinary Standard bridges typical of reinforced concrete bridge con- struction in California. These bridges are the single-bent overpass, multi-span bridge, curved bridge, and skew bridge. As compared with benchmark analyses of unscaled records using a larger catalog of ground motions, it is demonstrated that the MPS procedure provided an accurate estimate of the engineering demand parameters (EDPs) accompanied by significantly reduced record-to-record variability of the EDPs. Thus, it is a useful tool for scaling ground motions as input to nonlinear RHAs of Ordinary Standard bridges. DOI: 10.1061/(ASCE) BE.1943-5592.0000259. © 2012 American Society of Civil Engineers. CE Database subject headings: Bridges; Nonlinear analysis; Ground motion; Seismic design; History. Author keywords: Ordinary Standard bridge; Nonlinear analysis; Ground motion; Selection and scaling; Seismic design. Introduction Current highway bridge design practice in California is governed by the Seismic Design Criteria, SDC-2006 (Caltrans 2006), which allows equivalent static analysis and linear-elastic dynamic analysis for estimating the displacement demands, and pushover analysis for establishing the displacement capacities for Ordinary Standard bridges. For a bridge to be considered as an Ordinary Standard bridge, (1) the span length should be less than 90 m; (2) the bridge should be constructed with normal-weight concrete; (3) foundations must be supported on spread footings, pile caps with piles, or pile shafts; and (4) the soil is not susceptible to liquefaction or lateral spreading during strong shaking (Caltrans 2006). More than 90% of bridges in California are Ordinary Standard bridges (Mark Yashinsky, personal communication). For Ordinary Standard bridges, analysis methods on the basis of the linear-elastic assumption may be appropriate in regions having low-seismicity. In seismically active regions, near-fault static (surface displacement) and dynamic effects (long-period velocity pulses) may impart significant seismic demand to bridges and drive them into the inelastic range, invalidating the linear- elastic assumption (Goel and Chopra 2008; Kalkan and Kunnath 2006). To fully portray the “true” nonlinear behavior of bridges to near-fault ground motions, nonlinear response history analysis (RHA) may be required. Nonlinear RHAs utilize a set of ground motions representing hazard environment expected for the struc- ture. When recorded motions do not exist (as is the case in the cen- tral United States) or when high-intensity records are needed (as is the case in San Francisco and Los Angeles), ground motions from other tectonically similar regions need to be selected and modified. Most of the procedures to modify ground motion records fall into one of two categories: spectral matching (Lilhanand and Tseng 1987, 1988) and amplitude scaling (Katsanos et al. 2010). The objective of amplitude-scaling methods is to determine scale factors for a small number of records such that the scaled records provide an accurate estimate of “true” median structural responses, and, at the same time, are efficient (i.e., reduce the record-to-record variability of responses). Amplitude-scaling of re- cords was accomplished previously by scaling them to a common intensity measure, such as peak ground acceleration (PGA), effec- tive peak acceleration, Arias intensity, or effective peak velocity (Nau and Hall 1984; Kurama and Farrow 2003). These approaches were generally inaccurate and inefficient for structures responding in the inelastic range (Shome and Cornell 1998; Kurama and Farrow 2003). Scaling of records to a target value of the elastic spectral acceleration at a fundamental period provides improved results for structures whose response is dominated by their first- “mode” (Shome et al. 1998). However, this scaling method be- comes less accurate and less efficient for structures responding significantly in their higher vibration modes or far into the inelastic 1 Research Structural Engineer, U.S. Geological Survey, Menlo Park, CA 94025 (corresponding author). E-mail: [email protected] 2 Ph.D. Candidate, Univ. of California, Berkeley, CA 94709. E-mail: [email protected] Note. This manuscript was submitted on December 6, 2010; approved on April 15, 2011; published online on April 18, 2011. Discussion period open until August 1, 2012; separate discussions must be submitted for in- dividual papers. This paper is part of the Journal of Bridge Engineering, Vol. 17, No. 2, March 1, 2012. ©ASCE, ISSN 1084-0702/2012/2-272– 288/$25.00. 272 / JOURNAL OF BRIDGE ENGINEERING © ASCE / MARCH/APRIL 2012

Welcome message from author
This document is posted to help you gain knowledge. Please leave a comment to let me know what you think about it! Share it to your friends and learn new things together.
Transcript

Assessment of Modal-Pushover-Based ScalingProcedure for Nonlinear Response HistoryAnalysis of Ordinary Standard Bridges
Erol Kalkan, M.ASCE1 and Neal S. Kwong2
Abstract: The earthquake engineering profession is increasingly utilizing nonlinear response history analyses (RHA) to evaluate seismicperformance of existing structures and proposed designs of new structures. One of the main ingredients of nonlinear RHA is a set of groundmotion records representing the expected hazard environment for the structure. When recorded motions do not exist (as is the case in thecentral United States) or when high-intensity records are needed (as is the case in San Francisco and Los Angeles), ground motions from othertectonically similar regions need to be selected and scaled. The modal-pushover-based scaling (MPS) procedure was recently developed todetermine scale factors for a small number of records such that the scaled records provide accurate and efficient estimates of “true” medianstructural responses. The adjective “accurate” refers to the discrepancy between the benchmark responses and those computed from the MPSprocedure. The adjective “efficient” refers to the record-to-record variability of responses. In this paper, the accuracy and efficiency of theMPS procedure are evaluated by applying it to four types of existing Ordinary Standard bridges typical of reinforced concrete bridge con-struction in California. These bridges are the single-bent overpass, multi-span bridge, curved bridge, and skew bridge. As compared withbenchmark analyses of unscaled records using a larger catalog of ground motions, it is demonstrated that the MPS procedure provided anaccurate estimate of the engineering demand parameters (EDPs) accompanied by significantly reduced record-to-record variability of theEDPs. Thus, it is a useful tool for scaling ground motions as input to nonlinear RHAs of Ordinary Standard bridges. DOI: 10.1061/(ASCE)BE.1943-5592.0000259. © 2012 American Society of Civil Engineers.
CE Database subject headings: Bridges; Nonlinear analysis; Ground motion; Seismic design; History.
Author keywords: Ordinary Standard bridge; Nonlinear analysis; Ground motion; Selection and scaling; Seismic design.
Introduction
Current highway bridge design practice in California is governedby the Seismic Design Criteria, SDC-2006 (Caltrans 2006), whichallows equivalent static analysis and linear-elastic dynamic analysisfor estimating the displacement demands, and pushover analysis forestablishing the displacement capacities for Ordinary Standardbridges. For a bridge to be considered as an Ordinary Standardbridge, (1) the span length should be less than 90 m; (2) the bridgeshould be constructed with normal-weight concrete; (3) foundationsmust be supported on spread footings, pile caps with piles, or pileshafts; and (4) the soil is not susceptible to liquefaction or lateralspreading during strong shaking (Caltrans 2006). More than 90%of bridges in California are Ordinary Standard bridges (MarkYashinsky, personal communication).
For Ordinary Standard bridges, analysis methods on thebasis of the linear-elastic assumption may be appropriate in regionshaving low-seismicity. In seismically active regions, near-faultstatic (surface displacement) and dynamic effects (long-periodvelocity pulses) may impart significant seismic demand to bridges
and drive them into the inelastic range, invalidating the linear-elastic assumption (Goel and Chopra 2008; Kalkan and Kunnath2006). To fully portray the “true” nonlinear behavior of bridgesto near-fault ground motions, nonlinear response history analysis(RHA) may be required. Nonlinear RHAs utilize a set of groundmotions representing hazard environment expected for the struc-ture. When recorded motions do not exist (as is the case in the cen-tral United States) or when high-intensity records are needed (as isthe case in San Francisco and Los Angeles), ground motions fromother tectonically similar regions need to be selected and modified.Most of the procedures to modify ground motion records fall intoone of two categories: spectral matching (Lilhanand and Tseng1987, 1988) and amplitude scaling (Katsanos et al. 2010).
The objective of amplitude-scaling methods is to determinescale factors for a small number of records such that the scaledrecords provide an accurate estimate of “true” median structuralresponses, and, at the same time, are efficient (i.e., reduce therecord-to-record variability of responses). Amplitude-scaling of re-cords was accomplished previously by scaling them to a commonintensity measure, such as peak ground acceleration (PGA), effec-tive peak acceleration, Arias intensity, or effective peak velocity(Nau and Hall 1984; Kurama and Farrow 2003). These approacheswere generally inaccurate and inefficient for structures respondingin the inelastic range (Shome and Cornell 1998; Kurama andFarrow 2003). Scaling of records to a target value of the elasticspectral acceleration at a fundamental period provides improvedresults for structures whose response is dominated by their first-“mode” (Shome et al. 1998). However, this scaling method be-comes less accurate and less efficient for structures respondingsignificantly in their higher vibration modes or far into the inelastic
1Research Structural Engineer, U.S. Geological Survey, Menlo Park,CA 94025 (corresponding author). E-mail: [email protected]
2Ph.D. Candidate, Univ. of California, Berkeley, CA 94709. E-mail:[email protected]
Note. This manuscript was submitted on December 6, 2010; approvedon April 15, 2011; published online on April 18, 2011. Discussion periodopen until August 1, 2012; separate discussions must be submitted for in-dividual papers. This paper is part of the Journal of Bridge Engineering,Vol. 17, No. 2, March 1, 2012. ©ASCE, ISSN 1084-0702/2012/2-272–288/$25.00.
272 / JOURNAL OF BRIDGE ENGINEERING © ASCE / MARCH/APRIL 2012
Downloaded 06 Apr 2012 to 75.53.95.171. Redistribution subject to ASCE license or copyright. Visit http://www.ascelibrary.org

range (Mehanny 1999; Alavi and Krawinkler 2000; Kurama andFarrow 2003). To consider a higher mode response, a vector inten-sity measure (IM) of first-“mode” spectral acceleration and thespectral ratio of first-“mode” and second”-mode” have been devel-oped (Bazzurro 1998; Shome and Cornell 1999). Although thisvector IM improves accuracy, it remains inefficient for near-faultrecords with a dominant velocity pulse (Baker and Cornell 2006).
To recognize the lengthening of the apparent period of vibrationbecause of yielding of the structure, scalar IMs have been consid-ered (Mehanny 1999; Cordova et al. 2000). Alternatively, scalingearthquake records to minimize the difference between its elasticresponse spectrum and the target spectrum has been proposed(Kennedy et al. 1984; Malhotra 2003; Alavi and Krawinkler2004; Naeim et al. 2004; Youngs et al. 2007). Additional studieshave suggested that selection of ground motion records taking intoaccount the elastic spectral shape may provide improved estimatesof EDPs (Baker and Cornell 2005; Mackie and Stajadinovic 2007).The measure of spectral shape used in these studies is “epsilon,” orthe number of standard deviations the response spectral ordinatedifferentiates from a predicted median spectral value from anempirical ground motion prediction equation.
Because the preceding methods do not consider explicitly theinelastic behavior of the structure, they may not be appropriatefor near-fault sites where the inelastic deformation can be signifi-cantly larger than the deformation of the corresponding linear sys-tem. For such sites, scaling methods that are on the basis of inelasticdeformation spectrum or consider the response of the first-“mode”inelastic SDF-system are more appropriate (Shantz 2006; Luco andCornell 2007; Tothong and Cornell 2008; PEER 2009).
Kalkan and Chopra (2010, 2011b) used these concepts todevelop a modal-pushover-based scaling (MPS) procedure forselecting and scaling earthquake ground motion records in a formconvenient for evaluating existing structures and proposed designsof new structures. This procedure explicitly considers structuralstrength, determined from the first-“mode” pushover curve, and de-termines a scaling factor for each record to match a target value ofthe deformation of the first-“mode” inelastic SDF-system. TheMPS procedure for one-component of ground motion has beenextended for two horizontal components of ground motion forthree-dimensional analysis of structural systems (Reyes andChopra 2011). The MPS procedure has been proven to be accurateand efficient for low-, medium-, and high-rise symmetric planbuildings (Kalkan and Chopra 2010, 2011a, b; Reyes and Chopra2011). Here, the accuracy and efficiency of the MPS procedure arefurther evaluated for one and two components of ground motion byapplying it to four existing reinforced concrete Ordinary Standardbridges typical of reinforced concrete bridge construction inCalifornia. These bridges are single-bent overpass, multi-spanbridge, curved bridge, and skew bridge responding predominantlyin their first-“mode.”
MPS Procedure for Ordinary Standard Bridges
The existing MPS procedure, for a single horizontal component ofground motion, scales each record by a factor such that the defor-mation of the first-“mode” inelastic SDF-system—established fromthe first-“mode” pushover curve for the structure attributable tothe scaled record—matches a target value of inelastic deformation(Kalkan and Chopra 2010, 2011b). The target value of inelasticdeformation is defined as the median deformation of the first-“mode” inelastic SDF-system because of a large ensemble of un-scaled ground motions compatible with the site-specific seismichazard conditions. The target value of inelastic deformation may be
estimated by either (1) performing nonlinear RHA of the inelasticSDF-system to obtain the peak deformation attributable to eachground motion, and then computing the median of the resultingdata set; or (2) multiplying the median peak deformation of thecorresponding linear SDF-system, known from the elastic designspectrum (or uniform hazard spectrum) by the inelastic deformationratio, estimated from an empirical equation with known yield-strength reduction factor.
For first-“mode” dominated structures, scaling earthquakerecords to the same target value of the inelastic deformation of thefirst-“mode” SDF-system is shown to be sufficient (Kalkan andChopra 2010, 2011b).
Summarized subsequently is the step-by-step MPS procedurefor Ordinary Standard bridges:1. For the given site, define the target pseudo-acceleration re-
sponse spectrum either as the probabilistic seismic hazard ana-lysis (PSHA) based uniform hazard spectrum or code-baseddesign spectrum, or the median pseudo-acceleration spectrumfor a large ensemble of (unscaled) earthquake records compa-tible with the site-specific seismic hazard conditions. ForCalifornia, a web-based tool (http://dap3.dot.ca.gov/shake_stable/index.php) is available to calculate both deterministicand probabilistic design spectrum on the basis of SDC-2006.
2. Compute the frequencies ωn (periods Tn) and mode shapevectors ϕn of the first few modes of elastic vibration of thebridge.
3. Develop the base shear deck displacement Vb1 ! ud1 relationor pushover curve by nonlinear pushover analysis of the bridgesubjected to gradually increasing lateral forces with an invar-iant force distribution. The distribution of lateral forces (sn) isdetermined from the shape of the fundamental mode multipliedby tributary mass (lumped mass), that is, sn ¼ mϕn. Gravityloads are applied before starting the pushover analysis.
4. Idealize the pushover curve and select a hysteretic model forcyclic deformations, both appropriate for the bridge’s structur-al system and materials (Han and Chopra 2006; Bobadilla andChopra 2007). Determine the yield-strength reduction factorRy (equals to strength required for the bridge to remain elasticdivided by the yield-strength of the structure) from: Ry ¼M#
1!A1=Vb1y, in which M#
1 is the effective modal mass, !A1 isthe target spectral acceleration (or design acceleration) atthe first-“mode,” and Vb1y is the yield point value of base sheardetermined from the idealized pushover curve.
5. Convert the idealized pushover curve to the force-deformation(Fs1=L1 ! D1) relation of the first-“mode” inelastic SDF-system by utilizing Fs1=L1 ¼ Vb1=M#
1 and D1 ¼ ud1=ðΓ1ϕd1Þ in which L1 ¼ ϕ1mι, ϕd1 is the value of ϕ1 at the decklevel, ud1 is the deck displacement of a bridge under first-“mode” pushover, Γ1 ¼ ðϕ 0
1mιÞ=ðϕ 01mϕ1Þ and each element
of the influence vector ι is equal to unity [Fs1=L1 v’s D1 issimply the Acceleration Displacement Response Spectrum(ADRS) format].
6. For the first-“mode” inelastic SDF-system, establish the targetvalue of deformation !DI
1 from !DI1 ¼ CR !D1, in which !D1 ¼
ðT1=2πÞ2!A1; CR is determined from an empirical equation(e.g., Chopra and Chintanapakdee 2003, 2004) for the inelasticdeformation ratio corresponding to the yield-strength reductionfactor Ry, determined in Step 4 as
CR ¼ 1þ!ðLR ! 1Þ!1 þ
"aRbyþ c
#"T1
Tc
#d$!1
ð1Þ
in which, the limiting value of CR at Tn ¼ 0 is given byLR as
JOURNAL OF BRIDGE ENGINEERING © ASCE / MARCH/APRIL 2012 / 273
Downloaded 06 Apr 2012 to 75.53.95.171. Redistribution subject to ASCE license or copyright. Visit http://www.ascelibrary.org
LR ¼ 1Ry
"1þ
Ry ! 1α
#ð2Þ
in which a = post-yield stiffness ratio of the inelastic SDF-system and Tc = period separating the acceleration andvelocity-sensitive regions of the target spectrum (e.g., see rightpanel in Fig. 1); the parameters in Eq. (1) are: a ¼ 61, b ¼ 2:4,c ¼ 1:5, and d ¼ 2:4. Eqs. (1) and (2) and values of their para-meters are valid for far-fault ground motions, independent of(i) earthquake magnitude and distance, and (ii) National Earth-quake Hazard Reduction Program (NEHRP) site class B, C,and D; and also for near-fault ground motions.
7. Compute the peak deformation DI1 ¼ max jD1ðtÞj of the
first-“mode” inelastic SDF-system defined by the force-deformation relation developed in Steps 4 and 5 and dampingratio ζ1. The initial elastic vibration period of the system isT1 ¼ 2πðL1D1y=Fs1yÞ1=2. For a SDF-system with known T1and ζ1, DI
1 can be computed by nonlinear RHA attributableto one of the selected ground motions €ugðtÞ multiplied by ascale factor SF, to be determined to satisfy Step 8, by solving
€D1 þ 2ζ1ω1_D1 þ Fs1D1=L1 ¼ !ðSFÞ€ugðtÞ ð3Þ
8. Compare the normalized difference between the target value ofthe deformation !DI
1 of the first-“mode” inelastic SDF-system(Step 6) and the peak deformation DI
1, determined in Step 7against a specified tolerance, ε
Δ1 ¼ j!DI1 ! DI
1j=!DI1 < ε ð4Þ
9. Determine the scale factor SF such that the scaled recordðSFÞ€ugðtÞ satisfies the criterion of Eq. (4). Because Eq. (3)is nonlinear, SF cannot be determined a priori, but requiresan iterative procedure starting with an initial guess. Startingwith SF ¼ 1, Steps 7 and 8 are implemented and repeated withmodified values of SF until Eq. (4) is satisfied. Successivevalues of SF are chosen by trial and error or by a convergencealgorithm, for example, quasi Newton iteration procedures(Nocedal and Stephen 2006). For a given ground motion, ifEq. (4) is satisfied by more than one SF, the SF closest to unity
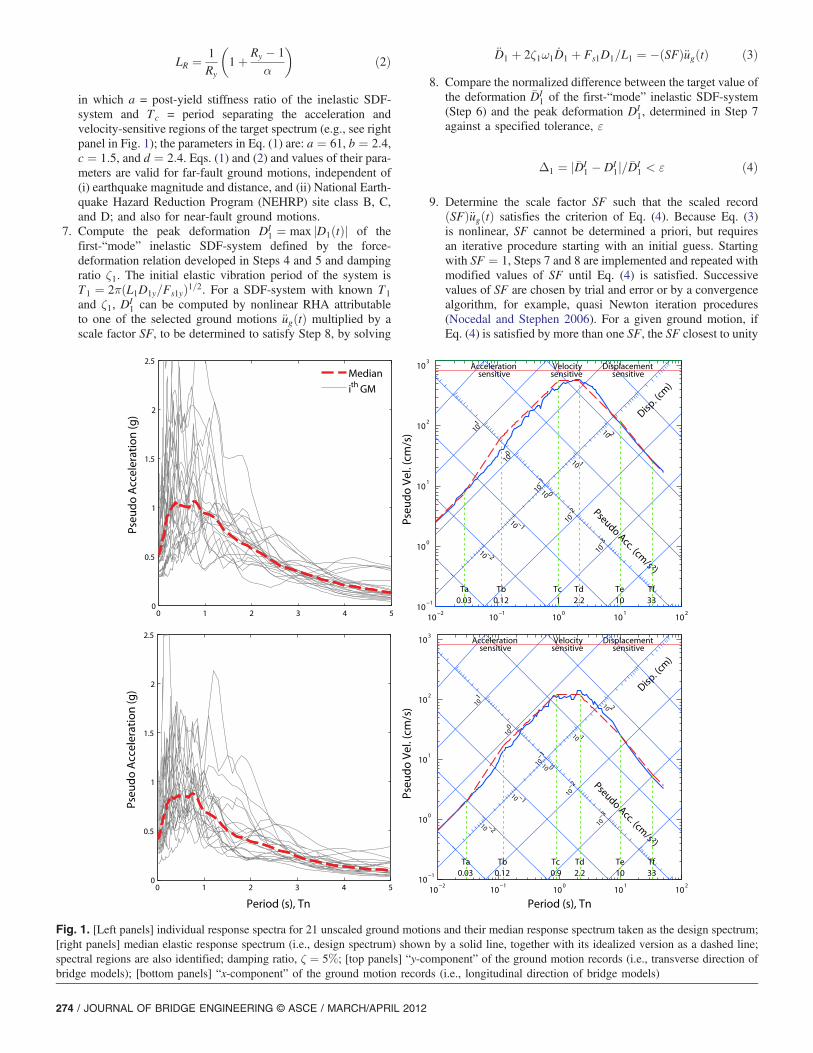
Fig. 1. [Left panels] individual response spectra for 21 unscaled ground motions and their median response spectrum taken as the design spectrum;[right panels] median elastic response spectrum (i.e., design spectrum) shown by a solid line, together with its idealized version as a dashed line;spectral regions are also identified; damping ratio, ζ ¼ 5%; [top panels] “y-component” of the ground motion records (i.e., transverse direction ofbridge models); [bottom panels] “x-component” of the ground motion records (i.e., longitudinal direction of bridge models)
274 / JOURNAL OF BRIDGE ENGINEERING © ASCE / MARCH/APRIL 2012
Downloaded 06 Apr 2012 to 75.53.95.171. Redistribution subject to ASCE license or copyright. Visit http://www.ascelibrary.org

should be taken. The rationale behind this is that the applied SFshould be limited to ensure that the scaled record does notshow characteristics that would be unrealistic for the magni-tude and distance pair to which it is referred.Repeat Steps 7 and 8 for as many records as deemed necessary
to obtain the scale factors SF for a single horizontal component ofground motion. If the structure is analyzed for bi-directional exci-tations, repeat Steps 1 through 6 to obtain a different target spec-trum, pushover curve, and SDF properties for the second horizontalcomponent of ground motion. Using these items, specific to eachhorizontal component of ground motion, repeat Steps 7 and 8 for asmany records as deemed necessary to obtain the scale factors. Notethat the scale factors will be different for each record and differentfor each component of ground motion (Reyes and Chopra 2011).This is the extended MPS procedure for two horizontal componentsof ground motion.
If the higher modes are important for a given bridge, MPSprocedure checks for second-“mode” compatibility of each scaledrecord by comparing its elastic spectral displacement response val-ues at the second-“mode” vibration period of the bridge against thetarget spectrum. This approach ensures that each scaled earthquakerecord satisfies two requirements: (1) the peak deformation of thefirst-“mode” inelastic SDF-system is close enough to the targetvalue of its inelastic deformation; and (2) the peak deformationof the second-“mode” elastic SDF-system is not far from the targetspectrum. Ground motion records satisfying these two criteriashould be used in nonlinear RHA. Further details on higher modeconsideration in MPS can be found in Kalkan and Chopra (2010,2011a, b) and Reyes and Chopra (2011).
Ground Motions Selected
A total of 21 near-fault strong earthquake ground motions werecompiled from the next generation of attenuation (NGA) projectground motion database. These motions were recorded during seis-mic events with moment magnitude 6:5 ≤ M ≤ 7:6 at closest fault
distances Rcl ≤ 12 km and belonging to NEHRP site classificationC or D. The 21 ground motions, listed in Table 1, are the mostintense records available in the NGA database considering the haz-ard conditions specified. Shown in Fig. 1 (top panels) are the 5%damped response spectra of the y-component (corresponding totransverse direction of the bridge models) of ground motions.The median spectrum is taken as the design spectrum for purposesof evaluating the MPS procedure; also shown in this figure is themedian spectrum of the ground motion ensemble as a four-way log-arithmic plot, together with its idealized version (dashed-line). Sim-ilarly, the response spectra corresponding to the x-component(corresponding to longitudinal direction of the bridge models) ofground motions are shown in Fig. 1 (bottom panels). For a particu-lar direction, the idealized spectrum is divided into three periodranges: the long-period region to the right of point d, Tn > Td ,is called the displacement-sensitive region; the short-period regionto the left of point c, Tn < Tc, is called the acceleration-sensitiveregion; and the intermediate-period region between points c and d,Tc < Tn < Td, is called the velocity-sensitive region (Chopra2007; Section 6.8). Note that the nearly constant velocity regionis unusually narrow, which is typical of near-fault ground motions.
For the single-bent overpass and multi-span bridge, only they-component of ground motion was taken into consideration forthe analyses. For the curved bridge and the skew bridge, both hori-zontal components of the 21 ground motion records were utilized.Because the 21 ground motions selected were not intense enough todrive the curved bridge model far into the inelastic range—an ob-vious requirement to test any scaling procedure—both horizontalcomponents of the 21 ground motions were amplified by a factorof 3. These amplified records were treated as “unscaled” records.
Description of Bridges and Computer Models
To cover a wide variety of reinforced concrete bridges, four types ofexisting Ordinary Standard bridges in California were considered:single-bent overpass, multi-span bridge, curved bridge, and skew
Table 1. Selected Near-Fault Ground Motion Records
No. Earthquake Year Station M Rrup (km) VS30 (m=s)
1 Tabas, Iran 1978 Tabas 7.4 2.1 7672 Imperial Valley 1979 EC Meloland overpass FF 6.5 0.1 1863 Imperial Valley 1979 El Centro array #7 6.5 0.6 2114 Superstition Hills 1987 Parachute test site 6.5 1.0 3495 Loma Prieta 1989 LGPC 6.9 3.9 4786 Erzincan, Turkey 1992 Erzincan 6.7 4.4 2757 Northridge 1994 Jensen filter plant 6.7 5.4 3738 Northridge 1994 Newhall—W Pico Canyon Rd 6.7 5.5 2869 Northridge 1994 Rinaldi receiving sta 6.7 6.5 28210 Northridge 1994 Sylmar—converter sta 6.7 5.4 25111 Northridge 1994 Sylmar—converter sta west 6.7 5.2 37112 Northridge 1994 Sylmar—Olive View med FF 6.7 5.3 44113 Kobe, Japan 1995 Port Island 6.9 3.3 19814 Kobe, Japan 1995 Takatori 6.9 1.5 25615 Kocaeli, Turkey 1999 Yarimca 7.4 4.8 29716 Chi-Chi, Taiwan 1999 TCU052 7.6 0.7 57917 Chi-Chi, Taiwan 1999 TCU065 7.6 0.6 30618 Chi-Chi, Taiwan 1999 TCU068 7.6 0.3 48719 Chi-Chi, Taiwan 1999 TCU084 7.6 11.2 55320 Chi-Chi, Taiwan 1999 TCU102 7.6 1.5 71421 Duzce, Turkey 1999 Duzce 7.2 6.6 276
JOURNAL OF BRIDGE ENGINEERING © ASCE / MARCH/APRIL 2012 / 275
Downloaded 06 Apr 2012 to 75.53.95.171. Redistribution subject to ASCE license or copyright. Visit http://www.ascelibrary.org

bridge. These bridges and their computer models are introducedbriefly in the next section. Their photos, structural drawings,material properties, and the details of their computer models inOpenSees (2009) can be found in Kalkan and Kwong (2010).
Single-Bent Overpass
The selected bridge with a two-span continuous deck and single-bent composed of two octagonal columns is representative of anovercrossing designed according to post-Northridge Caltrans spec-ifications. The bridge has stub wall abutments restrained in thelongitudinal and transverse directions as a result of end diaphragmand wing wall interaction with the soil. The column bent footingswere modeled as translational springs in each orthogonal direction.The abutments were modeled as restrained supports in the verticaldirection and as translational springs in longitudinal and transversedirections. The finite element model of the bridge is represented by3D frame elements passing through the mid-depth of the super-structure and 3D frame elements passing through the geometriccenter and mid-depth of the columns and the cap beam [Fig. 2(a)].Fiber-discretized, force-based nonlinear beam-column elements
were used to model columns; the integration along the elementis on the basis of Gauss-Lobatto quadrature rule. A fiber sectionmodel at each integration point, which in turn is associated withuniaxial material models and enforces the Bernoulli beamassumption for axial force and bending, represents the force-basedelement. Centerline dimensions were used in the element modelingfor all cases. The deck elements were assumed to remain elastic onthe basis of capacity design approach employed by the SDC-2006.The box-girder was assumed to be integral with the bent, thus fullcontinuity was employed at the superstructure-bent connection.P-Δ effects were considered at the global level.
Multi-Span Bridge
The bridge selected is representative of typical multi-span,single-frame prestressed concrete bridges built according to post-Northridge Caltrans design specifications. The bridge was modeledas an elastic superstructure sitting on nonlinear columns on an elas-tic foundation [Fig. 2(b)]. Fiber-discretized, force-based nonlinearbeam-column elements were used to model the columns, whereasthe deck elements were assumed to remain elastic. P-Δ effects were
Fig. 2. Idealized computer models of bridges
276 / JOURNAL OF BRIDGE ENGINEERING © ASCE / MARCH/APRIL 2012
Downloaded 06 Apr 2012 to 75.53.95.171. Redistribution subject to ASCE license or copyright. Visit http://www.ascelibrary.org

considered at the global level. The columns of the bridge rest onshallow foundations. Elastic springs in three translational directionswere used to model the soil effect. Seat type abutments are used atboth ends of the bridge. Spring systems were used to model thedynamic stiffness of the abutments. In the vertical direction, themovement of the bridge is vertically prevented at the abutments.
Curved Bridge
The curved bridge is representative of typical short-span pre-stressed concrete bridges built according to post-NorthridgeCaltrans design specifications. Two columns support the curveddeck. Sliding bearings support the bridge at the abutments. Thedeck was assumed to be elastic, whereas the two columns weremodeled as fiber-discretized force-based nonlinear beam-columnelements. Because of the curved nature of the deck, the corotationalgeometric transformation was employed for all elements of themodel. Corotational coordinate transformation performs a near-exact geometric transformation of element stiffness and resistingforce from the basic system to the global coordinate system. Thisapproach provides more accurate results than the conventional geo-metric transformation for large deformations because of P-Δ ef-fects. In terms of boundary conditions, the bases of the twocolumns were fixed, and the two abutments were modeled as elasticsprings.
Skew Bridge
The bridge selected is representative of typical short-span, concreteovercrossings built in late 1970s. The “skewed” single-bent is
approximately near the middle of the span. Wing walls at the abut-ments support the bridge. In the computer model, the deck wasassumed to be elastic, whereas the bent was modeled with twofiber-discretized nonlinear force-based beam-column elementsjoined by two elastic rigid beams. Because of the unsymmetricalplan, the corotational geometric transformation was employed forall elements of the model. As for the boundary conditions, the basesof the two columns at the bent were fixed. The two abutments, how-ever, were fixed in all degrees of freedom except for the translationalong the longitudinal direction and the rotation about the axis par-allel to the transverse direction of the bridge. Additionally, one ofthe abutments was free to move transversely relative to the otherabutment.
First-“Mode” SDF-system Parameters
The mode shapes of all bridges are provided in Kalkan and Kwong(2010). For the single-bent overpass, the first-“mode” (0.54 s) in-volves a transverse translation of the deck and the second-“mode”(0.52 s) involves a longitudinal translation of the superstructure.The multi-span bridge has the first-“mode” (2.47 s) in the transla-tional direction and second-“mode” (1.06 s) in the longitudinaldirection. The transverse direction is more flexible for both bridges.
For the curved bridge, the first-“mode” (0.41 s) and second-“mode” (0.34 s) involves translation in both the transverse and lon-gitudinal directions of the bridge. Because of the unsymmetricalnature of the bridge, the transverse and longitudinal directionsare coupled. For the skew bridge, the first-“mode” (0.81 s) involves
Fig. 3. First-“mode” SDF pushover curve (solid line) and its idealized bilinear model (dashed line) in transverse and longitudinal directions forsingle-bent overpass [top panels] and multi-span bridge [bottom panels]
JOURNAL OF BRIDGE ENGINEERING © ASCE / MARCH/APRIL 2012 / 277
Downloaded 06 Apr 2012 to 75.53.95.171. Redistribution subject to ASCE license or copyright. Visit http://www.ascelibrary.org

primarily translation in the longitudinal direction of the bridgewith slight movement in the transverse direction attributable toskewness, whereas the second-“mode” (0.51 s) consists primarilyof translation in the bridge’s transverse direction.
Modal pushover curves for four bridges were developed in thetransverse and longitudinal directions separately. Similar to themodal pushover analyses procedure for buildings (Chopra 2007),the distribution of lateral forces was determined from the shape ofthe fundamental transverse mode, and fundamental longitudinalmode, multiplied by tributary mass (i.e., lumped mass). For thecurved and skew bridges, the fundamental mode of the entire 3Dstructure was used in determination of the distribution of lateralforces. The pushover curves were then converted to those corre-sponding to the equivalent SDF-system using relations describedin Step 5 of the summary of the MPS procedure. For each direction,the resultant SDF pushover curves are displayed in Figs. 3 and 4with a thick solid line, whereas bilinear idealization of pushovercurves is shown in thick dashed lines. These stable bilinear curvesalso define the hysteretic force-deformation relations for eachbridge. Because stiffness and strength degradation were not ac-counted for, the unloading branch of the hysteretic curve has thesame slope with that of the initial loading branch.
Evaluation of MPS Procedure
The accuracy of the MPS procedure was evaluated by comparingthe median [defined as the geometric mean by assuming log-normal
distribution of engineering demand parameters (EDPs)] value of anEDP attributable to three sets of randomly selected seven scaledground motions against the benchmark value, defined as themedian value of the EDP attributable to the 21 unscaled groundmotions. Although the selection process was random, no more thantwo records from the same event were included in a single set sothat no single event is dominant within a set. The use of sevenground motions within a set has been shown to provide statisticallyrobust estimates from nonlinear RHAs (Reyes and Kalkan 2011).
In evaluation, a scaling procedure is considered to be accurate ifthe median values of an EDP attributable to the seven scaled groundmotions are close to benchmark value; it is considered to be effi-cient if the dispersion of an EDP attributable to the set of sevenscaled ground motions is small. Smaller dispersion in EDPs indi-cates a smaller number of analyses to obtain a given confidencelevel in the results. The median value (x̂) defined as the geometricmean and the dispersion measure (δ) of n observed values of xi arecalculated from the following expressions:
x̂ ¼ exp!Pn
i¼1 ln xin
$and δ ¼
!Pni¼1ðln xi ! ln x̂Þ2
n! 1
$1=2
ð5Þ
Benchmark Results
Fig. 5 shows the benchmark EDPs for both the single-bentoverpass and multi-span bridge together with results from individ-ual records to show the large record-to-record variability (i.e., largedispersion). EDPs adopted in this research are global response
Fig. 4. First-“mode” SDF pushover curve (solid line) and its idealized bilinear model (dashed line) in transverse and longitudinal directions for curvedbridge [top panels] and skew bridge [bottom panels]
278 / JOURNAL OF BRIDGE ENGINEERING © ASCE / MARCH/APRIL 2012
Downloaded 06 Apr 2012 to 75.53.95.171. Redistribution subject to ASCE license or copyright. Visit http://www.ascelibrary.org

parameters: peak value of deck drift ratio (i.e., deck displacement ÷height of column) and maximum column plastic rotation over theresponse histories. Only the EDPs in the transverse direction weretaken into consideration because it is the weakest direction for bothbridges. The peak values of deck drift ratios attributable to the 21unscaled ground motions range from 1 to 5%, and column plasticdeformations range from less than 0.01 rad to more than 0.05 rad.All of the excitations drive both bridges well into the inelastic range(Kalkan and Kwong 2010).
Fig. 6 shows the benchmark EDPs in the transverse direction(top panels) and in the longitudinal direction (bottom panels) forthe curved bridge, along with results from individual records toshow the large record-to-record variability. With a curved span,the terms “longitudinal” and “transverse” refer to the global xand y axes, respectively, that are adopted in the OpenSees model.The local axes for the columns are not in alignment with the globalaxes. Consequently, the column plastic rotations, recorded with re-spect to the local axes, are not in alignment with the global axes.The peak drift ratios, however, are determined with respect toglobal axes. Nevertheless, the column plastic rotations associatedwith the local axes are still referred to as transverse and longitudinalEDPs. Fig. 6 shows that EDPs in the transverse direction are gen-erally larger than those in the longitudinal direction. For peak driftratios, the median value is 1.5% in the transverse direction, whereasthe median value is 0.85% in the longitudinal direction. Similarly,for column plastic rotations, the median is 0.005 rad in the trans-verse direction, whereas the median is 0.002 rad in the longitudinaldirection.
Fig. 7 shows the benchmark EDPs in the transverse direction(top panels) and in the longitudinal direction (bottom panels) forthe skew bridge. Because of the boundary conditions for thismodel, the EDPs in the longitudinal direction are generally muchlarger than those in the transverse direction. For peak drift ratios,values in the transverse direction ranged from 0.5% to slightly morethan 1%, with a median value of 0.63%, whereas those in the
longitudinal direction ranged from 1% to more than 6%, with amedian value of 2.5%. Similarly, for column plastic rotations, val-ues in the transverse direction ranged from 0.002 rad to approxi-mately 0.01 rad, with a median value of 0.005 rad, whereas thosein the longitudinal direction ranged from 0.01 rad to more than0.06 rad, with a median value of 0.023 rad. All of the excitationsled to inelastic responses for both curved and skew bridges (Kalkanand Kwong 2010).
Fig. 5. Median values of benchmark EDPs in transverse direction de-termined by nonlinear RHA of single-bent overpass [top panels] andmulti-span bridge [bottom panels] attributable to 21 ground motions;results for individual ground motions are also included
Fig. 6. Median values of benchmark EDPs in transverse direction [toppanels] and EDPs in longitudinal direction [bottom panels] determinedby nonlinear RHA of curved bridge attributable to 21 ground motions;results for individual ground motions are also included
Fig. 7. Median values of benchmark EDPs in transverse direction [toppanels] and EDPs in longitudinal direction [bottom panels] determinedby nonlinear RHA of skew bridge attributable to 21 ground motions;results for individual ground motions are also included
JOURNAL OF BRIDGE ENGINEERING © ASCE / MARCH/APRIL 2012 / 279
Downloaded 06 Apr 2012 to 75.53.95.171. Redistribution subject to ASCE license or copyright. Visit http://www.ascelibrary.org

Target Value of Inelastic Deformation
In evaluation of the MPS procedure, the “exact” target value ofinelastic deformation !DI
1 was assumed to be unknown, and itwas estimated (Step 6 of the MPS procedure) by the CR equation(Chopra and Chintanapakdee 2003, 2004) by using post-yield stiff-ness ratio (Figs. 3 and 4) and yield-strength ratio. Yield-strengthratio Ry was determined (Step 4 of the MPS procedure) as 3.1and 3.5, respectively for the single-bent overpass and multi-spanbridge. Alternatively, “exact” target value of deformation !DI
1was computed by nonlinear RHAs of the first-“mode” inelasticSDF-system for 21 unscaled records. The term “exact” is usedin this paper in a somewhat loose sense because it is defined onthe basis of 21 ground motions. According to the random samplingtheory, this set is assumed to be a representative subset of a muchlarger population of recorded and not yet recorded ground motionsaccording to the specified hazard conditions. Fig. 8 compares theestimated target value of deformation by using the CR equationagainst its “exact” value for the single-bent overpass and multi-spanbridge; values from individual records are also included to show itslarge record-to-record variability. In this figure, the CR equationoverestimates “exact” value of !DI
1 by 12–14%.For the curved and skew bridges, which will be analyzed under
bi-directional excitations attributable to their irregular geometry,the MPS procedure will be applied to each horizontal direction sep-arately. This requires consideration of target deformation in bothhorizontal directions (Reyes and Chopra 2011). Fig. 9 (top panels)compares the estimated target value by using the CR equationagainst its “exact” value for both the y and x components of groundmotion for the curved bridge. The yield-strength ratio used in theCR equation was determined as 1.61 for the y direction. The CRvalue for the x direction is set to 1 because the force requiredfor the SDF-system, in this particular direction, to remain elasticis less than its yield force. Fig. 9 (bottom row) compares the esti-mated target value by using the CR equation against its “exact”value for both the y and x components of ground motion for theskew bridge. The yield-strength ratios were determined as 6.1and 2 for the x and y directions, respectively. It is observed thatthe target value of inelastic deformation !DI
1 is much greater inthe longitudinal direction than that in the transverse direction.For these two bridge models, the CR equation overestimates the“exact” value of !DI
1 by 9–18% in the transverse direction andby 1–3% in the longitudinal direction.
Comparisons against Benchmark Results
Both the single-bent overpass and multi-span bridge are first-“mode” dominated; the modal participation ratio for the first-“mode” is much larger than other higher modes. Thus, Steps 7and 8 of the single-component MPS procedure are implementedto determine an appropriate scale factor for each record. In thecurved and skew bridge models, the two-component MPS pro-cedure (Reyes and Chopra 2011) is implemented to determinean appropriate scale factor for each horizontal component of eachrecord. The scale factors established for all bridges are less thanthree, indicating that the original characteristics of the groundmotions are, in general, well retained. The values of scale factorsfor each bridge and for each set are reported in Kalkan andKwong (2010).
The EDPs determined by nonlinear RHAs of bridges attribut-able to three sets of seven ground motions scaled according tothe MPS procedure are compared first against the benchmarkEDPs. Figs. 10–17 exhibit the representative comparisons forthe transverse EDPs. Readers may refer to Kalkan and Kwong(2010) for the complete sets of comparisons.
To better examine the accuracy of the MPS procedure, ratios ofmedian value of EDPs from the MPS procedure to the benchmarkvalue are computed and listed in Table 2 for each bridge and foreach set of ground motions. For the single-bent overpass (Fig. 10),the maximum deviation of median value of EDPs attributable to theMPS procedure from the benchmark value is 18% for the deck driftratio and 21% for the column plastic rotation for Set 1. More ac-curate results with deviations ranging from 7–10%were obtained incase of Sets 2 and 3. For the multi-span bridge (Fig. 11), mediandeck drift ratios attributable to the MPS procedure overestimate thebenchmark value by a maximum of 14% for deck drift ratio and
Fig. 8. Peak deformation DI1 values of the first-“mode” inelastic SDF-
system for 21 ground motions for single-bent overpass [left panel] andmulti-span bridge [right panel]; “exact” target value of deformation !DI
1is identified by horizontal dashed line; horizontal continuous line in-dicates target value of deformation !DI
1 established by the CR equation
Fig. 9. Peak deformation DI1 values of the first-“mode” inelastic SDF-
system in the transverse direction [left] and in the longitudinal direction[right] for 21 ground motions for curved bridge [top panels] and skewbridge [bottom panels]; “exact” target value of deformation !DI
1 is iden-tified by horizontal dashed line; horizontal continuous line indicatestarget value of deformation !DI
1 established by the CR equation
280 / JOURNAL OF BRIDGE ENGINEERING © ASCE / MARCH/APRIL 2012
Downloaded 06 Apr 2012 to 75.53.95.171. Redistribution subject to ASCE license or copyright. Visit http://www.ascelibrary.org
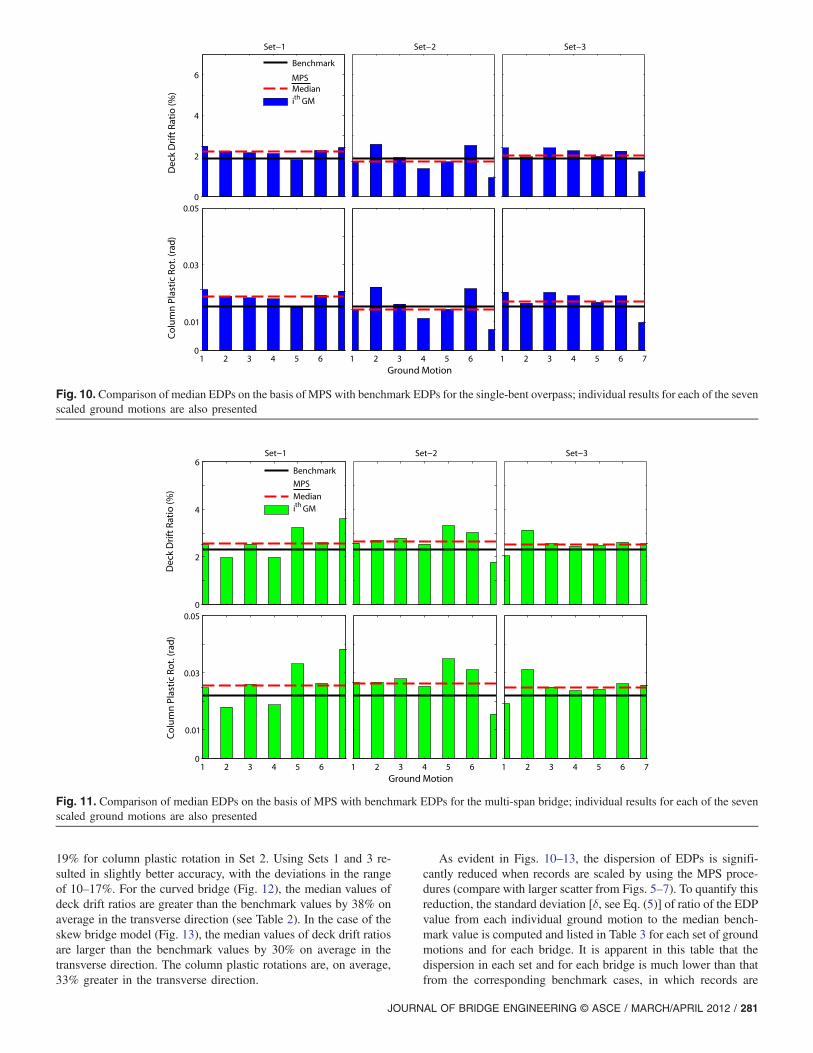
19% for column plastic rotation in Set 2. Using Sets 1 and 3 re-sulted in slightly better accuracy, with the deviations in the rangeof 10–17%. For the curved bridge (Fig. 12), the median values ofdeck drift ratios are greater than the benchmark values by 38% onaverage in the transverse direction (see Table 2). In the case of theskew bridge model (Fig. 13), the median values of deck drift ratiosare larger than the benchmark values by 30% on average in thetransverse direction. The column plastic rotations are, on average,33% greater in the transverse direction.
As evident in Figs. 10–13, the dispersion of EDPs is signifi-cantly reduced when records are scaled by using the MPS proce-dures (compare with larger scatter from Figs. 5–7). To quantify thisreduction, the standard deviation [δ, see Eq. (5)] of ratio of the EDPvalue from each individual ground motion to the median bench-mark value is computed and listed in Table 3 for each set of groundmotions and for each bridge. It is apparent in this table that thedispersion in each set and for each bridge is much lower than thatfrom the corresponding benchmark cases, in which records are
Fig. 10. Comparison of median EDPs on the basis of MPS with benchmark EDPs for the single-bent overpass; individual results for each of the sevenscaled ground motions are also presented
Fig. 11. Comparison of median EDPs on the basis of MPS with benchmark EDPs for the multi-span bridge; individual results for each of the sevenscaled ground motions are also presented
JOURNAL OF BRIDGE ENGINEERING © ASCE / MARCH/APRIL 2012 / 281
Downloaded 06 Apr 2012 to 75.53.95.171. Redistribution subject to ASCE license or copyright. Visit http://www.ascelibrary.org

unscaled but consistent with the hazard condition defined in termsof magnitude, distance, and site-condition.
For the single-bent overpass, the standard deviations (δ) ofEDPs from the unscaled records are reduced by 39–77% usingthe one-component MPS procedure. For the multi-span bridge,the reduction in δ is in the range of 33–66%. These results dem-onstrate that the one-component MPS procedure leads to scaledground motions that yield accurate estimates of median EDPs thatare accompanied with dramatically reduced dispersions relative tothe unscaled ground motions, as well.
With regard to the curved bridge, the reduction in δ for the EDPsis, on average, 50% for the transverse direction and 39% for thelongitudinal direction. For the skew bridge, the reduction in δfor the EDPs is, on average, 60% for the transverse direction,and 54% for the longitudinal direction. These results demonstratethat scaling records with the two-component MPS procedureprovides EDPs with dispersion that is significantly lower than thatobtained with unscaled ground motions.
Utilizing the “exact” value of the target inelastic deformation(i.e., median inelastic deformation value as shown in Fig. 8), in
Fig. 12. Comparison of median EDPs in transverse direction on the basis of MPS with benchmark EDPs for the curved bridge; individual results foreach of the seven scaled ground motions are also presented
Fig. 13. Comparison of median EDPs in transverse direction on the basis of MPS with benchmark EDPs for the skew bridge; individual results foreach of the seven scaled ground motions are also presented
282 / JOURNAL OF BRIDGE ENGINEERING © ASCE / MARCH/APRIL 2012
Downloaded 06 Apr 2012 to 75.53.95.171. Redistribution subject to ASCE license or copyright. Visit http://www.ascelibrary.org

the one-component MPS procedure (referred to as MPS-“exact”)further improves the accuracy as shown in Figs. 14 and 15 forthe single-bent overpass and multi-span bridge, respectively. Forthe single-bent overpass, the maximum deviation of median EDPsattributable to the MPS-“exact” procedure from the benchmarkvalue is 15% for the deck drift ratio and 16% for the column plasticrotation considering Set 2. Much better accuracy is obtained byusing Set 1, and excellent agreement with the benchmark valuesis achieved by using Set 3. For the multi-span bridge, median
values of EDPs attributable to the three sets of ground motionsperfectly match with the benchmark values (maximum deviationis only 6%).
Utilizing the “exact” value of the target inelastic deformation inboth horizontal directions of ground motion (i.e., median inelasticdeformation value as shown in Fig. 9), in the two-component MPSprocedure (referred to as MPS-“exact”) also further improves theaccuracy as shown in Figs. 16 and 17 for the curved and skewbridges. From the figures (plotted in the same scales), it is evident
Fig. 14. Comparison of median EDPs on the basis of MPS-“exact” with benchmark for the single-bent overpass; individual results for each of theseven scaled ground motions are also presented
Fig. 15. Comparison of median EDPs on the basis of MPS-“exact” with benchmark EDPs for the multi-span bridge; individual results for each of theseven scaled ground motions are also presented
JOURNAL OF BRIDGE ENGINEERING © ASCE / MARCH/APRIL 2012 / 283
Downloaded 06 Apr 2012 to 75.53.95.171. Redistribution subject to ASCE license or copyright. Visit http://www.ascelibrary.org

Fig. 16. Comparison of median EDPs in transverse direction on the basis of MPS-“exact” with benchmark EDPs for the curved bridge; individualresults for each of the seven scaled ground motions are also presented
Fig. 17. Comparison of median EDPs in transverse direction on the basis of MPS-“exact” with benchmark EDPs for the skew bridge; individualresults for each of the seven scaled ground motions are also presented
284 / JOURNAL OF BRIDGE ENGINEERING © ASCE / MARCH/APRIL 2012
Downloaded 06 Apr 2012 to 75.53.95.171. Redistribution subject to ASCE license or copyright. Visit http://www.ascelibrary.org

that the median value from each set is much closer to the bench-mark value.
Referring to Table 2 for the curved bridge, the peak drift ratiosare now only approximately 19% larger in the transverse directionand 18% larger in the longitudinal direction than the benchmarkvalue. Similarly, the column plastic rotations are, on average,56% larger in the transverse direction and 55% larger in the lon-gitudinal direction than the benchmark plastic rotations.
A similar improvement in accuracy is also observed for the skewbridge model, as shown in Table 2. The peak drift ratios are, onaverage, 19% larger in the transverse direction and, on average,23% larger in the longitudinal direction than the benchmark driftratio. The column plastic rotations are now approximately 21%greater in both directions than the benchmark plastic rotations.Similar to the curved bridge model, the discrepancies are alikein magnitude for both directions.
As shown in Table 3 for the multi-span bridge, the dispersion inEDPs is also further reduced (12%, on average, as compared withthe MPS procedure) by utilizing the “exact” value of the target in-elastic deformation for the one-component MPS procedure. Alower reduction in dispersion (3% on average) is observed inthe single-bent overpass. Similarly, the dispersion in EDPs furtherdiminished for the skew and curved bridges by utilizing the “exact”values of the target inelastic deformation in both directions for thetwo-component MPS procedure. This reduction is 5% for the skewbridge and 4% for the curved bridge.
How will these results change if a different combination ofseven ground motions was used? To answer this question system-atically, the ratio of median EDP value from a set of seven records
to benchmark value (EDP value ÷ benchmark value) was com-puted for as many sets of ground motions as possible. With 21 re-cords to choose from and 7 records used in a single set, 116,280sets were constructed. With more than 100,000 possible realiza-tions of the EDP ratios, histograms may be plotted. The distribu-tions of median EDP ratios for deck drift and column plasticrotation are shown in Fig. 18 (on the basis of MPS-“exact” ap-proach) for the single-bent overpass and multi-span bridge. Themedian results from the original randomly selected three sets ofseven records (Sets 1 through 3) are also presented. It is evidentthat the results on the basis of arbitrary Sets 1 through 3 lie withinthe 16- and 84-percentile range of the overall distribution of deckdrift ratio, in which the median and standard deviation for this dis-tribution are 0.98 and 0.08, respectively. For the multi-span bridge,the results from the three randomly selected sets also cover the 16-and 84-percentile for deck drift ratio distribution with a median anda standard deviation of 1.02 and 0.05, respectively. Similar obser-vations can be made for the plastic rotation response quantity. In all,this figure indicates that the results from the randomly selectedthree sets (Sets 1 through 3) are representative subsets of a muchlarger population.
Conclusions
On the basis of four Ordinary Standard bridges in California, theaccuracy and efficiency of the MPS procedure (both one- and two-component versions) are assessed by comparing the median valuesof the EDPs attributable to three sets of seven scaled records against
Table 2. Comparison of EDP Ratios Considering MPS and MPS-“Exact” for Four Bridges and for Three Sets of Seven Ground Motion Records
Single-bent overpass
MPS MPS-“exact”
EDP ratio (MPS median ÷ benchmark) Set 1 Set 2 Set 3 Set 1 Set 2 Set 3
Deck drift 1.18 0.93 1.08 1.08 0.85 1.00Column plastic rotation 1.21 0.93 1.10 1.10 0.84 1.01
Multi-span bridge
MPS MPS-“exact”
EDP ratio (MPS median ÷ benchmark) Set 1 Set 2 Set 3 Set 1 Set 2 Set 3
Deck drift 1.12 1.14 1.10 1.04 1.00 1.02Column plastic rotation 1.17 1.19 1.13 1.06 1.00 1.04
Curved bridge
MPS MPS-“exact”
EDP ratio (MPS median ÷ benchmark) Set 1 Set 2 Set 3 Set 1 Set 2 Set 3
Deck drift (Trans) 1.32 1.48 1.35 1.16 1.26 1.14Column plastic rotation (trans) 1.99 2.25 1.91 1.57 1.74 1.38Deck drift (long) 1.29 1.42 1.29 1.15 1.27 1.12Column plastic rotation (long) 1.79 2.09 1.67 1.53 1.80 1.32
Skew bridge
MPS MPS-“exact”
EDP ratio (MPS median ÷ benchmark) Set 1 Set 2 Set 3 Set 1 Set 2 Set 3
Deck drift (trans) 1.34 1.30 1.25 1.22 1.20 1.14Column plastic rotation (trans) 1.37 1.35 1.28 1.22 1.25 1.15Deck drift (long) 1.20 1.30 1.29 1.14 1.27 1.27Column plastic rotation (long) 1.24 1.25 1.24 1.17 1.24 1.22
JOURNAL OF BRIDGE ENGINEERING © ASCE / MARCH/APRIL 2012 / 285
Downloaded 06 Apr 2012 to 75.53.95.171. Redistribution subject to ASCE license or copyright. Visit http://www.ascelibrary.org

the benchmark values. The one-component MPS procedure wasapplied to the single-bent overpass and multi-span bridge, whereasthe two-component MPS procedure was applied to the curved andskew bridges. The efficiency of the MPS scaling procedure wasevaluated by computing the dispersion of the responses to the sevenscaled ground motions in each set and comparing it with that from
the benchmark cases. This evaluation of the MPS procedures hasled to the following conclusions:1. Even for the most intense near-fault ground motions, which
represent severe tests, the one-component MPS method witha small number of records estimates the median value of seis-mic demands to a good degree of accuracy for bridges having
Table 3. Comparison of Dispersion Measures (δ) Considering MPS and MPS-“Exact” for Four Bridges and for Three Sets of Seven Ground Motion Records
Single-bent overpass
Benchmark
MPS MPS-“exact”
Dispersion measure (δ) Set 1 Set 2 Set 3 Set 1 Set 2 Set 3
Deck drift 0.52 0.12 0.31 0.22 0.13 0.29 0.21Column plastic rotation 0.56 0.13 0.34 0.24 0.14 0.32 0.23
Multi-span bridge
Benchmark
MPS MPS-“exact”
Dispersion measure (δ) Set 1 Set 2 Set 3 Set 1 Set 2 Set 3
Deck drift 0.40 0.26 0.21 0.14 0.21 0.17 0.14Column plastic rotation 0.45 0.30 0.27 0.16 0.28 0.22 0.15
Curved bridge
Benchmark
MPS MPS-“exact”
Dispersion measure (δ) Set 1 Set 2 Set 3 Set 1 Set 2 Set 3
Deck drift (trans) 0.51 0.29 0.29 0.28 0.29 0.31 0.24Column plastic rotation (trans) 1.15 0.46 0.46 0.56 0.49 0.47 0.55Deck drift (long) 0.47 0.31 0.31 0.27 0.31 0.29 0.24Column plastic rotation (long) 1.08 0.60 0.70 0.57 0.54 0.67 0.52
Skew bridge
Benchmark
MPS MPS-“exact”
Dispersion measure (δ) Set 1 Set 2 Set 3 Set 1 Set 2 Set 3
Deck drift (trans) 0.47 0.16 0.20 0.19 0.15 0.17 0.17Column plastic rotation (trans) 0.57 0.30 0.19 0.23 0.27 0.12 0.20Deck drift (long) 0.95 0.47 0.39 0.39 0.47 0.38 0.38Column plastic rotation (long) 0.71 0.40 0.27 0.33 0.40 0.29 0.32
Fig. 18. Distribution of median EDP ratios (EDP value ÷ benchmark value) on the basis of MPS-“exact” for the single-bent overpass and multi-spanbridge for more than 100,000 sets of seven ground motion records; median results from randomly selected three sets of seven records (sets 1 through3) are also shown using vertical dashed lines; results from the three randomly selected sets cover the 16- and 84-percentile for EDP ratio distributions
286 / JOURNAL OF BRIDGE ENGINEERING © ASCE / MARCH/APRIL 2012
Downloaded 06 Apr 2012 to 75.53.95.171. Redistribution subject to ASCE license or copyright. Visit http://www.ascelibrary.org

regular geometry. The maximum discrepancy is 18% of thebenchmark value for the single-bent overpass and 14% ofthe benchmark value for the multi-span bridge. The averagediscrepancies of 12% in deck drift ratios and 14% in columnplastic rotations for both bridges are achieved. This demon-strates the accuracy of the one-component MPS method.
2. Considering bidirectional ground excitation, the two-componentMPS procedure overestimates seismic demands for bridges withirregular geometries. For the curved bridge model, the averagediscrepancies in column plastic rotations are larger than thosefor peak drift ratios. The average discrepancy for peak drift ratiosis 38% in the transverse direction and 33% in the longitudinaldirection. For the skew bridge model, however, the average dis-crepancies for peak drift ratios are smaller, as such 30% in thetransverse direction and 26% in the longitudinal direction.
3. The dispersion (or record-to-record variability) in the EDPsattributable to seven scaled records around the median is muchsmaller when records are scaled by both the one-componentand two-component MPS procedures as compared with the un-scaled records. This implies stability in the EDPs estimatedfrom records that are scaled according to the MPS proceduresrelative to those obtained from unscaled records. Despite highlevels of inelastic action and irregular geometries, the MPSprocedures can reduce the scatter in estimates by 50% on aver-age. These observations indicate the efficiency of the MPS pro-cedures. It should be noted that smaller dispersion in EDPsindicates a smaller number of analyses to obtain a given con-fidence level in the EDPs.
4. Utilizing “exact” target value of inelastic deformation furtherimproves the accuracy but slightly improves the efficiency.This improvement in accuracy depends, however, on theprecision involved in estimating the “exact” target value of in-elastic deformation. Although the additional reduction in dis-persion is approximately 12% for the multi-span bridge, it isless than 5% for all other bridge models.As shown in this paper for the Ordinary Standard bridges, the
MPS procedures were accurate and efficient enough in reducing thenumber of records needed to provide stable estimates of peakdisplacement and plastic rotation demands from nonlinear RHAof geometrically regular bridges to levels practical for typicalbridge design offices. Because of complex response behavior ofgeometrically irregular bridges, the MPS-“exact” procedure utiliz-ing the exact value of target inelastic deformation provides moreaccurate results as compared with the MPS procedure utilizing es-timated value of target inelastic deformation. All reported results inthis paper are on the basis of stable force-deformation relations.Although not expected, adopting other hysteretic model may alterthe results achieved regarding either the accuracy or the efficiencyof the procedure.
Data and Resources
Readers are referred to the MPS procedure website http://nsmp.wr.usgs.gov/ekalkan/MPS/index.html for further details on assess-ment of the one- and two-component MPS methods, and alsofor accessing MatLAB codes for scaling ground motion recordsusing the MPS and MPS-“exact” methods.
Acknowledgments
The first author would like to acknowledge the generous supportof the Earthquake Engineering Research Institute for providinghim the 2008 EERI/FEMA NEHRP Professional Fellowship in
EarthquakeHazardReduction to pursue a research study ondevelop-ing “Practical Guidelines to Select and Scale Earthquake Recordsfor Nonlinear Response History Analysis of Structures”; this paperis a sequel to this previous work. We also wish to acknowledge theinsightful comments of Anil K. Chopra and generous support ofSungchil Lee, Maria Feng, Sashi K. Kunnath, and Emrah Erduranwith OpenSees models. Lastly, thanks to Juan Carlos Reyes,Toorak Zokaie, Farzin Zareian, and two anonymous reviewersfor their valuable comments and suggestions, which helped toimprove the technical quality of this paper.
Notation
The following symbols are used in this paper:!An = target pseudo-spectral acceleration;CR = ratio of peak deformations of inelastic and corresponding
elastic SDF systems for systems with known yield-strength reduction factor;
Dn = peak deformation of elastic SDF system;!Dn = target value of nth mode elastic deformation;
DnðtÞ = deformation of SDF system;DI
1 = peak deformation of inelastic SDF system;!DI1 = first-“mode” target value of inelastic spectral
displacement;D1;y = yield deformation of inelastic SDF system;Fs1 = system resisting force under first-“mode” pushover;M = moment magnitude of earthquake;m = mass matrix of MDF system;M# = effective modal mass;n = mode sequence number;
Rrup = closest distance to coseismic rupture plane;Ry = yield-strength reduction factor;s#n = load vector of modal pushover analysis;SF = ground motion scaling factor;Tc = period separating acceleration and velocity-sensitive
regions of the spectrum;Tn = elastic natural vibration period;ud1 = deck displacement of a bridge under first-“mode”
pushover;€ug = earthquake ground acceleration;
Vb1 = base shear under first-“mode” pushover;Vb1y = global yield strength under first-“mode” pushover;VS30 = average shear-wave velocity within 30 m depth from
surface;α = ratio of post-yield and initial stiffness;Γ = modal participation factor;ζ = damping ratio;ι = influence vector; andϕ = mode shape vector.
References
Alavi, B., and Krawinkler, H. (2000). “Consideration of near-fault groundmotion effects in seismic design.” Proc. of the Twelfth World Conf. onEarthquake Eng., International Association for Earthquake Engineering(IAEE), Tokyo, Japan.
Alavi, B., and Krawinkler, H. (2004). “Behavior of moment-resisting framestructures subjected to near-fault ground motions.” Earthquake Eng.Struct. Dyn., 33(6), 687–706.
Baker, J. W., and Cornell, C. A. (2005). “A vector-valued ground motionintensity measure consisting of spectral acceleration and epsilon.”Earthquake Eng. Struct. Dyn., 34(10), 1193–1217.
Baker, J. W., and Cornell, C. A. (2006). “Spectral shape, epsilon andrecord selection.” Earthquake Eng. Struct. Dyn., 35(9), 1077–1095.
JOURNAL OF BRIDGE ENGINEERING © ASCE / MARCH/APRIL 2012 / 287
Downloaded 06 Apr 2012 to 75.53.95.171. Redistribution subject to ASCE license or copyright. Visit http://www.ascelibrary.org

Bazzurro, P. (1998). “Probabilistic seismic demand analysis.” Ph.D. thesis,Dept. of Civil and Env. Eng., Stanford Univ., CA (Available onlineat ⟨https://blume.stanford.edu/rms-thesis/probabilistic-seismic-demand-analysis⟩ (June 2008).
Bobadilla, H., and Chopra, A. K. (2007). Modal pushover analysis forseismic evaluation of reinforced concrete special moment resistingframe buildings, EERC/2007-01, Earthquake Engineering ResearchCenter, Univ. of California, Berkeley, CA.
California Dept. of Transportation. (2006). “Seismic design criteria:Version 1.4.” Sacramento, CA. ⟨http://www.dot.ca.gov/hq/esc/techpubs/manual/othermanual/other-engin-manual/seismic-design-criteria/sdc.html⟩.
Chopra, A. K. (2007). Dynamics of structures: Theory and applications toEarthquake Engineering, Prentice Hall, Englewood Cliffs, NJ.
Chopra, A. K., and Chintanapakdee, C. (2003). “Inelastic deformationratios for design and evaluation of structures: Single-degree-of-freedombilinear systems.” Report No. UCB/EERC-2003/09, Earthquake Engi-neering Research Center, Univ. of California, Berkeley, CA.
Chopra, A. K., and Chintanapakdee, C. (2004). “Inelastic deformationratios for design and evaluation of structures: Single-degree-of-freedombilinear systems.” J. Struct. Eng., 130(9), 1309–1319.
Cordova, P. P., Deierlein, G. G., Mehanny, S. S. F., and Cornell, C. A.(2000). “Development of a two-parameter seismic intensity measureand probabilistic assessment procedure.” Proc. of the 2nd U.S.–JapanWorkshop on Performance-Based Seismic Design Methodology forReinforced Concrete Building Structures, PEER Report 2000/10,Pacific Earthquake Engineering Research Center (PEER), Univ. of Cal-ifornia, Berkeley, CA, 187–206.
Goel, R. K., and Chopra, A. K. (2008). “Estimating seismic demandsfor ‘ordinary’ bridges crossing fault-rupture zones, Report no. UCB/EERC-2008/01, Earthquake Engineering Research Center, Univ. ofCalifornia, Berkeley.
Han, S. W., and Chopra, A. K. (2006). “Approximate incremental dynamicanalysis using the modal pushover analysis procedure.” EarthquakeEng. Struct. Dyn., 35(15), 1853–1873.
Kalkan, E., and Chopra, A. K. (2010). “Practical guidelines to select andscale earthquake records for nonlinear response history analysis ofstructures.” USGS Open File Report No: 2010-1068, ⟨http://pubs.usgs.gov/of/2010/1068/⟩ (Mar. 03, 2011).
Kalkan, E., and Chopra, A. K. (2011a). “Evaluation of modal pushover-based scaling of one component of ground motion: Tall buildings.”Earthquake Spectra ⟨http://nsmp.wr.usgs.gov/ekalkan/PDFs/Papers/J33_Kalkan_Chopra.pdf⟩ (March 2011).
Kalkan, E., and Chopra, A. K. (2011b). “Modal-pushover-based groundmotion scaling procedure.” J. Struct. Eng., 137(3), 298–310.
Kalkan, E., and Kunnath, S. K. (2006). “Effects of fling-step and forwarddirectivity on the seismic response of buildings.” Earthquake Spectra,22(2), 367–390.
Kalkan, E., and Kwong, N. S. (2010). “Documentation for assessmentof modal pushover-based scaling procedure for nonlinear responsehistory analysis of ‘ordinary standard’ bridges: U.S. Geological SurveyOpen-File Report 2010-10, ⟨http://pubs.usgs.gov/of/2010/1328/of2010-1328.pdf⟩ (March 2011).
Katsanos, E. I., Sextos, A. G., and Manolis, G. D. (2010). “Selection ofearthquake ground motion records: A state-of-the-art review from astructural engineering perspective.” Soil Dyn. Earthquake Eng., 30(4),157–169.
Kennedy, R. P. et al. (1984). “Engineering characterization of groundmotion-task 1: Effects of characteristics of free-field motion on struc-tural response.” NUREG/CR-3805, U.S. Regulatory Commission,Washington, D.C.
Kurama, Y., and Farrow, K. (2003). “Ground motion scaling methods fordifferent site conditions and structure characteristics.” Earthquake Eng.Struct. Dyn., 32(15), 2425–2450.
Lilhanand, K., and Tseng, W. S. (1987). “Generation of synthetic timehistories compatible with multiple-damping design response spectra.”Transactions of the 9th Int. Conf. on Structural Mechanics in Reactor
Technology, International Association for Structural Mechanics inReactor Technology, Raleigh, NC, 105–110.
Lilhhand, K., and Tseng, W. S. (1988). “Development and application ofrealistic earthquake time histories compatible with multiple dampingdesign spectra.” Proc. of the Ninth World Conf. Earthquake Engineer-ing, Vol. 2, International Association for Earthquake Engineering(IAEE), Tokyo, Japan, 819–824.
Luco, N., and Cornell, A. C. (2007). “Structure-specific scalar intensitymeasures for near-source and ordinary earthquake ground motions.”Earthquake Spectra, 23(2), 357–392.
Mackie, K. R., and Stajadinovic, B. (2007). “Three-dimensional groundmotion scaling for highway bridges.” Proc. of the 9th Canadian Conf.on Earthquake Engineering, Canadian Association for EarthquakeEngineering (CAEE), Ottawa.
Malhotra, P. K. (2003). “Strong-motion records for site-specific analysis.”Earthquake Spectra, 19(3), 557–578.
Mehanny, S. S. F. (1999). “Modeling and assessment of seismic perfor-mance of composite frames with reinforced concrete columns and steelbeams.” Ph.D. thesis, Dept. of Civil and Environmental EngineeringStanford Univ., Stanford, California.
Naeim, F., Alimoradi, A., and Pezeshk, S. (2004). “Selection and scalingof ground motion time histories for structural design using geneticalgorithms.” Earthquake Spectra, 20(2), 413–426.
Nau, J., and Hall, W. (1984). “Scaling methods for earthquake responsespectra.” J. Struct. Eng., 110(7), 1533–1639.
Nocedal, J., and Stephen, J. W. (2006). “Numerical optimization.” SpringerSeries in Operations Research, 2nd Ed., Springer, New York.
OpenSees. (2009). Open Source finite element platform for earthquakeengineering simulations. Pacific Earthquake Engineering Center,Univ. of California, Berkeley.
PEER Ground Motion Selection and Modification Working Group. (2009).“Evaluation of ground motion selection and modification methods: Pre-dicting median interstory drift response of buildings.” C. B. Haselton,ed., PEER Report 2009/01, Univ. of California, Berkeley.
Reyes, J. C., and Chopra, A. K. (2011). “Modal pushover-based scalingof two components of ground motion records for nonlinear RHA ofbuildings.” Earthquake Spectra, in press.
Reyes, J. C., and Kalkan, E. (2011). “Required number of ground motionrecords for ASCE/SEI 7 ground motion scaling procedure.” U.S. Geo-logical Survey Open-File Report 2011-1, p. 34, ⟨http://pubs.usgs.gov/of/2010/1328/of2010-1328.pdf⟩ (March 2011).
Shantz, T. J. (2006). “Selection and scaling of earthquake records fornonlinear dynamic analysis of first-‘mode’ dominant bridge structures.”Proc. of the 8th U.S. National Conf. on Earthquake Engineering,Earthquake Engineering Research Institute, Oakland, CA.
Shome, N., and Cornell, A. C. (1998). “Normalization and scalingaccelerograms for nonlinear structural analysis.” Proc. of the SixthU.S. National Conf. on Earthquake Engineering, Earthquake Engineer-ing Research Institute, Oakland, CA.
Shome, N., and Cornell, C. A. (1999). “Probabilistic seismic demandanalysis of nonlinear structures.” Reliability of Marine StructuresProgram, Report no. RMS-35, Dept. of Civil and EnvironmentalEngineering, Stanford Univ., Stanford, CA.
Shome, N., Cornell, C. A., Bazzurro, P., and Carballo, J. E. (1998). “Earth-quakes, records and nonlinear responses.” Earthquake Spectra, 14(3),469–500.
Tothong, P., and Cornell, A. C. (2008). “Structural performance assessmentunder near-source pulse-like ground motions using advanced groundmotion intensity measures.” Earthquake Eng. Struct. Dyn., 37(7),1013–1037.
Youngs, R., Power, M., Wang, G., Makdisi, F., and Chin, C. C. (2007).“Design ground motion library (DGML)—Tool for selecting timehistory records for specific engineering applications (abstract).”SMIP07 Seminar on Utilization of Strong-Motion Data, CaliforniaGeological Survey, Sacramento, CA, 109–110.
288 / JOURNAL OF BRIDGE ENGINEERING © ASCE / MARCH/APRIL 2012
Downloaded 06 Apr 2012 to 75.53.95.171. Redistribution subject to ASCE license or copyright. Visit http://www.ascelibrary.org
Related Documents