Assessment of Materials Management Options for the Massachusetts Solid Waste Master Plan Review Final Report Appendices Submitted to: Massachusetts Department of Environmental Protection Contract EQEH193 Submitted by: Tellus Institute Boston, MA In Partnership with: Cascadia Consulting Group & Sound Resource Management December 2008

Welcome message from author
This document is posted to help you gain knowledge. Please leave a comment to let me know what you think about it! Share it to your friends and learn new things together.
Transcript

Assessment of Materials Management Options for
the Massachusetts Solid Waste Master Plan Review
Final Report Appendices
Submitted to:
Massachusetts Department of Environmental Protection
Contract EQEH193
Submitted by:
Tellus Institute
Boston, MA
In Partnership with:
Cascadia Consulting Group
&
Sound Resource Management
December 2008

Disclaimer
This report was prepared by the Tellus Institute, a not-for-profit research and policy
organization under a contract with the Massachusetts Department of Environmental
Protection. The report (including its summary and analysis of information) is entirely the
work of the Tellus Institute and its subcontractors on this project. The opinions expressed
in this report are those of the Tellus Institute and do not necessarily reflect MassDEP
policies.

Materials Management Options for MA Solid Waste Master Plan Review Final Report
Assessment of Materials Management Options for the
Massachusetts Solid Waste Master Plan Review
Appendices
Appendix 1: Waste Reduction Experience in Other Jurisdictions: Detailed
Review
Appendix 2: Documentation for the Morris Environmental Benefits
Calculator Model
Appendix 3: Morris Environmental Benefits Calculator – Detailed
Modeling Results
Appendix 4: References


Materials Management Options for MA Solid Waste Master Plan Review Final Report
APPENDIX 1
Waste Reduction Experience in Other Jurisdictions
Detailed Review


Materials Management Options for MA Solid Waste Master Plan Review Final Report
1
Resource Productivity Improvements
Overview
Numerous programs in jurisdictions throughout the U.S. and abroad are aimed at
improving resource productivity (also called eco-efficiency) from manufacturers and
business service providers. These include:
� Pollution Prevention (P2)
� Lean Manufacturing
� Green Permitting
� Light-weighting
� Industrial Ecology
� Technological Advances
- Miniaturization and Dematerialization
- Micro- and Nano-Technology
These efforts are all aimed at impacting private sector behavior through education,
technical assistance, incentives, and/or regulation, and have considerable overlap with the
subsequent sections of this report. In this section, therefore, we describe only a few
programs related to resource productivity improvements.
In addition to the direct benefits of utilizing less material and energy per unit of output,
these practices also produce indirect benefits by reducing the related “external” costs of
pollution that result in environmental degradation and public health impacts. While these
costs are generally not reflected in the price of such goods or services (see section 5 on
economic incentives), their reduction is an important societal benefit.
Program Descriptions
California Integrated Waste Management Board
In November 2001, the CIWMB adopted a Strategic Plan highlighting: sustainability,
product stewardship, energy recovery, environmental justice, safe disposal of waste, and
the promotion of a zero-waste philosophy. Zero-waste strives to maximize waste
reduction and use the most effective processing or manufacturing practices to optimize
efficiency and conserve natural resources. It promotes both front-end (e.g., waste
prevention and reuse) and back-end (e.g., recycling) methods as well as using waste to
generate energy. Obviously, it is the Board’s front-end reduction efforts that are most
relevant to MA DEP’s efforts.

Materials Management Options for MA Solid Waste Master Plan Review Final Report
2
Part of CIWMB’s strategy is to promote best business practices in product manufacturing
and handling by:
� Partnering with other State agencies to create cross-media approaches to working
with business to assist in achieving zero waste.
� Partnering with trade associations to promote cost-beneficial source reduction and
related manufacturing improvement opportunities (through improved
technologies, packaging efficiencies, best business practices, etc.).
� Creating model programs that are self-sustaining and transferable to others.
� Evaluating long-term benefits of pilot programs or models.
CIWMB’s efforts have resulted in significant waste prevention and diversion reduced
amounts disposal since 1989, as measured by the Board’s disposal reporting system.
While the Board’s work that has contributed to waste prevention has focused on a variety
of programs and waste streams—edible food rescue, organics diversion, California
Materials Exchange (CalMAX), Waste Reduction Awards Program (WRAP), and green
building—CIWMB’s packaging redesign efforts are most relevant in terms of this
section of the report on improving resource productivity. The idea of efficient packaging
and waste reduction in packaging in California began with the Shipping and Distribution
Partnership, a voluntary effort created to encourage businesses to adopt more efficient
packaging and distribution systems that save money while preventing waste and
improving operations. As elsewhere, packaging related waste comprises approximately
one third of the state’s solid waste.
In addition to direct elimination or reduction of packaging, the Board promotes designing
refillable or reusable packages, and producing recyclable packages and packages made of
recyclable material. CIWMB’s packaging redesign initiative focuses on preventing or
reusing (or recycling) five key materials:
� Composites
� Paper
� Plastic
� Steel/Metal
� Wood
MN Pollution Control Agency
The MN PCA’s Pollution Prevention and Sustainability Program comprises an agency-
wide staff effort to utilize regulatory flexibility as an incentive for businesses to pursue
pollution prevention and waste reduction. The program’s goals are to reduce the use of
toxics and encourage the reuse of materials by promoting long-term process
improvements and the adoption of best management practices for waste reduction.

Materials Management Options for MA Solid Waste Master Plan Review Final Report
3
Program efforts to date have focused principally on toxics prevention. Key program
elements include:
� Waste reduction/reuse
� Regulatory innovation
� Deconstruction
� Product responsibility/stewardship
� Design for the environment
Note that these elements of MN PCA Pollution Prevention and Sustainability Program
span several of the strategy categories in this report, including Regulatory Requirements.
It is described here because its major thrust is to increase resource productivity.
Challenges
Among the most significant challenges facing governments attempting to encourage
resource productivity improvements in the manufacturing and service sectors are: the
inertia of existing production systems and the significant costs to companies of modifying
them; a lack of awareness and/or willingness among businesses to alter existing practices;
the fact that long-term environmental and health consequences of product life-cycles are
not reflected in their price; the reliance on voluntary programs where regulatory authority
does not exist or does not enjoy adequate political support; dematerialization
technologies (e.g., micro- and nano-technology) that have not yet been proven or
commercialized; and a lack consumer education and demand for products and services
that generate less waste. Many of these challenges relate to and are further discussed in
the other sections of this report.
Assessment
There is a vast array of existing and emerging public sector programs aimed at
encouraging and facilitating resource productivity improvements throughout the
manufacturing and service sectors. Experience with some of these—pollution prevention
and light-weighting, for example—have already proven to be effective in preventing
waste, while other emerging approaches such as industrial ecology and dematerialization
through micro- and nano-technology, hold enormous promise but the potential role for
government efforts remains unclear and deserves further attention. Initiatives to promote
product stewardship, Design for Environment (DfE) approaches, and purchasing of
environmentally preferable products (EPP), described in later sections, will also result in
resource productivity improvements.

Materials Management Options for MA Solid Waste Master Plan Review Final Report
4
Alternative Business Models
Overview
Over the past quarter of a century businesses in the U.S. and around the world have
become increasingly concerned with the environmental impacts of their products and
services. Driven by a combination of factors—more stringent environmental regulations,
growing demand for “green” products among consumers, and a recognition that
preventing waste and pollution can save money and improve a company’s image—new
business models have emerged that reduce waste and prevent toxic pollution. These
alternative models include:
Design for Environment (DfE)
There are three main approaches governments take to promote DfE in industry: (1)
voluntary programs where agencies provide information and possibly technical assistance
or procurement preferences; (2) regulatory requirements in which mandatory take-back
provisions or material bans are imposed; or (3) a combination of these.1 The best way to
measure the effectiveness of DfE initiatives would be to track product design changes in
industry. Unfortunately, it is difficult to sort out the many causal factors that often
accompany product design changes, and there are few documented examples of specific
product changes clearly attributable to DfE efforts. Note that most DfE programs focus
on reducing or eliminating toxic materials as opposed to preventing solid waste.
Supply Chain Management
Supply chain management approaches recognize that waste prevention and other
environmental improvements can often be most efficiently implemented if the whole
product chain, or system, is involved. Supply chain management addresses the
performance of materials, components, and goods and services that an organization buys
and uses. Ideally, supply chain management identifies the most significant waste
prevention opportunities by considering the entire product system and working
cooperatively with suppliers to prevent such waste. This often involves the use of life-
cycle assessment (LCA) tools. There are three dimensions to environmental supply chain
management: (1) the supply chain through a network of upstream and downstream
linkages; (2) the environmental impacts of materials and energy inputs and outputs; and
(3) the management of the business organization.
Product Stewardship
Product stewardship is a product-centered approach to waste prevention and
environmental protection. Also known as extended product responsibility (EPR), product
stewardship requires those in the product life cycle—manufacturers, retailers, users, and
1 Given the important role of government regulation in promoting Design for Environment efforts in the
business sector, many of the DfE programs are closely related to the programs described under Regulatory
Requirements.

Materials Management Options for MA Solid Waste Master Plan Review Final Report
5
disposers—to share responsibility for reducing the environmental impacts of products. As
such product stewardship is distinct from and goes beyond manufacturer-centered
extended producer responsibility approaches. It recognizes that waste reduction and other
environmental improvements will be enhanced by going beyond producers acting alone,
to include retailers, consumers, and the existing waste management infrastructure. Note
that product stewardship approaches and the key stakeholders will vary from one product
system to another. Note that in the program descriptions that follow, we have not
included EPR, as these programs are described in section 6, Regulatory Requirements.
Leasing and “Servicizing”
Servicizing refers to selling a service or function rather than a product, and can include
operating leases and trade-ins. Actual ownership of the product remains with the supplier,
and customers generally pay for use and maintenance of the product. Servicizing can
therefore be thought of as very closely related to or a type of extended product
responsibility. Some servicizing examples include carpet leasing, office equipment
leasing, outsourcing of onsite chemical management, and office furniture supply and
maintenance.
Potential customer benefits include:
� Environmental and cost savings without much effort on customer's behalf.
� Allows customer to focus on their primary areas of business.
� Maintenance and ultimate disposal is the supplier's responsibility.
� Product(s) are managed by the supplier, who best knows the product, liabilities,
and waste reduction opportunities.
� Optional shared savings incentivizes both customer and supplier to reduce and
recycle. Proving your products meet certain codes or policy is a good way to
establish market niche.
In servicizing relationships, the vendor may function as much as a partner, problem-
solver, and information resource as the product provider. Servicizing has inherent
incentives to maximize and recapture the end-of-life value of products and equipment.
Program Descriptions
Design for Environment (DfE) Programs
� The European Union’s Restrictions on Hazardous Substances (RoHS)
Directive is perhaps the most far-reaching regulatory approaches to DfE to date.
It requires manufacturers to replace mercury, lead, hexavalent chromium, and
other heavy metals in a variety of products, including:
- Large household appliances: refrigerators, washers, stoves, air
conditioners

Materials Management Options for MA Solid Waste Master Plan Review Final Report
6
- Small household appliances: vacuum cleaners, hair dryers, coffee makers,
irons
- Computing & communications equipment: computers, printers, copiers,
phones
- Consumer electronics: TVs, DVD players, stereos, video cameras
- Lighting: lamps, lighting fixtures, light bulbs
- Power tools: drills, saws, nail guns, sprayers, lathes, trimmers, blowers
- Toys and sports equipment: videogames, electric trains, treadmills
- Automatic dispensers: vending machines, ATM machines
The following products are currently exempted from RoHS compliance:
- Large stationary industrial tools
- Control and monitoring equipment
- National security use and military equipment
- Medical devices
- Some light bulbs and some batteries
- Spare parts for electronic equipment in the market before July 1, 2006.
Other countries that are working on their own version of RoHS:
- RPCEP (Regulation for Pollution Control of Electronic Products):
China
Effective July 1, 2006
- GPSSI (Japan Green Procurement Survey Standardization Initiative):
Japan
Effective July 1, 2006
- SB20 (Electronic Waste Recycling Act of 2003): California, USA
Goes into effect January 1, 2007
- Adopting the EU RoHs Directive: Australia, Canada, Korea, Taiwan
� EU’s Waste Electronic and Electrical Equipment (WEEE) Directive mandates
aggressive reuse and recycling targets of 65-75% for certain products. Producers
must comply with these requirements if they want to sell their products in Europe.
WEEE Directive 2002/96/EC mandates the treatment, recovery and recycling of
electric and electronic equipment (prior to the WEEE Directive, 90% was
landfilled). All applicable products in the EU market since August 13, 2006 must
pass WEEE compliance and carry the "Wheelie Bin" sticker.
� In the packaging arena, Germany’s mandatory Packaging Ordinance and the
associated Green Dot Program has resulted in design changes for beverage

Materials Management Options for MA Solid Waste Master Plan Review Final Report
7
packaging in Germany and elsewhere in Europe. On the voluntary side, the U.S.
EPA’s DfE Program and the UK’s Waste Minimization and Resources Action
Programme (WRAP) cite design changes by manufacturers.
Supply Chain Management
Most government efforts on supply chain management have focused on educating and
providing technical assistance to private sector businesses. Trainings have been organized
at the state and regional level, often with support from U.S. EPA. In addition, many
government bodies, at all levels, are directly influencing their suppliers through
environmental requirements, primarily through green procurement programs. In many
states (including MA, as well as MN, NY, WA) these programs have expanded greatly in
recent years from an initial focus on office supplies and equipment to virtually all goods
and services a state requires.
Challenges
Product stewardship/EPR initiatives as well as Design for Environment programs based
on a mandatory approach are challenged by the same political obstacles that many other
regulatory programs face in building support among diverse interests. Managing supply
chain issues is extremely complex and there are a number of issues that will affect the
growth of supply chain management as a tool for meeting business objectives and
improving environmental performance. Companies often have diverse suppliers that can
range from multinationals to small and medium size enterprises. Another challenge is
designing adequate incentives (internally and externally) and insuring that waste
prevention and other environmental requirements are met and that data is reliable.
Overcoming these and other issues will affect the extent to which supply chain
management approaches are used in the future. The emerging servicizing model is still
relatively new and unfamiliar to many producers and consumers, and requires both
additional analytical work on the costs and benefits to producers and consumers, as well
as considerable public education.
Assessment
It is important to note that the degree to which DfE approaches are relevant varies by
product type, with packaging, electronics, beverage container, carpet, and vehicles
already showing considerable promise in various jurisdictions, both in Europe and the
U.S. The range of DfE experience indicates that incentives are key for getting
manufacturers to redesign their products to reduce waste, toxicity, or other environmental
impacts. These incentives can be in the form of take-back requirements or material bans
on the regulatory side, or through preferential tax treatment, public procurement, and/or
financial or technical support. Experience in Europe and elsewhere has shown that if
producers are required to bear the full cost of managing their discarded products they will
have a direct incentive to account for such costs in their decisions about product design
and marketing. For example, Germany’s mandatory Packaging Ordinance and the
associated Green Dot Program have resulted in design changes for beverage packaging in

Materials Management Options for MA Solid Waste Master Plan Review Final Report
8
Germany and elsewhere in Europe. On the voluntary side, the U.S. EPA’s DfE Program
and the UK’s Waste Minimization and Resources Action Programme (WRAP) cite
design changes by manufacturers.
Many government bodies, at all levels, are influencing their suppliers through
environmental requirements, primarily through green procurement programs. Expansion
and additional promotion of environmental purchasing activities and tools can further this
effort. In addition, there is a role for technical assistance and incentives for small business
to apply greening-the-supply-chain techniques, as individually they often lack the buying
power and resources to influence suppliers. To the extent possible, standardizing
environmental purchasing criteria (a la Energy Star) beyond an individual municipality or
even state would ease the burden on manufacturers and suppliers for meeting such
criteria.
To date public policy has played little role in promoting servicizing. There are however, a
number of possible government policy initiatives that could help realize the potential
environmental gains associated with product-based services. Policies that incorporate the
social costs of materials extraction and disposal into the purchase price of products are
likely to have two effects: (1) building further market demand for decoupling ownership
from product use; and (2) building demand for lifecycle management as an explicit
component of service offerings. Such policies include, for example: removal of virgin
material and disposal subsidies, or tax policy which favors producer, not customer,
ownership of durable goods. Government can also play an important role as convener and
facilitator of stakeholder processes to explore these and additional policy initiatives and
forms of technical assistance. While EPR/servicizing policies have received their share of
criticism, they have focused the attention of businesses on providing environmentally
beneficial end-of-life services.

Materials Management Options for MA Solid Waste Master Plan Review Final Report
9
Public Education and Awareness
Overview
Education and awareness-building activities are intrinsically tied to and reinforce the
other waste prevention and reuse strategy elements. Increased concern by policymakers
and the public over local and global environmental impacts of consumption is reflected in
a host of public education and action campaigns to address the demand side of the
equation. These efforts go well beyond the common practice of informing citizens about
the benefits of household practices such as grasscycling and backyard composting, to far-
reaching initiatives that promote sustainable consumption opportunities by consumers
and communities. Such efforts focus on building consumer demand for more
environmentally friendly or preferable products and growing the “sustainable lifestyle”
movement (including the simplicity movement). Techniques include the full range of
media, from radio and television including public service announcements, to newspapers
and other printed materials including transit posters and bill stuffers, to the internet.
Techniques such as Community-based social marketing (CBSM),2 which MA DEP has
employed on a limited basis, have emerged as particularly effective ways for reaching
and educating targeted audiences and encouraging specific behavior change towards
waste prevention and other goals.
Several jurisdictions in the U.S. have strong demand-side programs built around public
education and awareness. In the following section particular emphasis is given to
programs related to education and promotion of green building practices, an important
focus of waste prevention efforts. In addition, the European Union and its members are
world leaders in the sustainable consumption arena. Their experience is highlighted later
in this section.
Program Descriptions
Washington State Beyond Waste Program
Washington’s Beyond Waste Program explicitly takes on “the substantial task of
redefining American consumerism and culture.” It views waste as inefficient resource
use, and adopts a materials flow framework to help identify, evaluate and prioritize
activities and sectors that produce significant waste flows in terms of volume and/or
toxicity. The program aims to minimize material and waste flows through efficient use of
resources, recovering material for high-value reuse, and incorporating “cradle-to-cradle”
design. The Beyond Waste Program has established long-term (30-year) goals and five-
year milestones, and has identified 64 specific actions to move Washington towards this
vision. Three broad strategies have focused on:
2 Community-based social marketing comprises five steps: selecting behaviors, identifying barriers,
developing strategies, conducting a pilot, and broad scale implementation. It is used primarily to try and
change environmentally-harmful behaviors among residents and businesses.

Materials Management Options for MA Solid Waste Master Plan Review Final Report
10
� Making green building practices mainstream. Goals include increasing
awareness, knowledge and access to green building resources, developing and
implementing incentives for green design and construction and removing
disincentives, and maximizing reuse and recycling of construction and demolition
(C&D) materials. The plan calls for the following specific actions:
- Adopt LEED standards for all new state buildings
- Make residential Built GreenTM program available to all residents
- Technical assistance to builders re: LEED and Built GreenTM programs
- State procurement guidelines should require green building materials
- Support deconstruction industry through grants, pilots, training
- Work with local governments to ensure adequate C&D processing
capacity (especially for concrete, gypsum, wood)
- Intensify work with national partners on building material product
stewardship
- Educate architects and contractors about designing buildings for less waste
and deconstruction
� Establishing an organics recovery cycle. Actions include increasing the
residential and commercial organics recovery programs and resolving statutory
and regulatory barriers.
� Reducing hazardous waste in the industrial sector. Actions include sector
focused reduction plans (mercury, PBDE), providing incentives to businesses to
adopt sustainability practices, and encouraging waste haulers to become materials
brokers.
King County, Washington
King County has an expansive public education around waste prevention, including:
� Green Building Program
Provides tools and assistance to promote high recycling and reuse rates. Examples
of tools include jobsite waste guidelines, a waste management template, sample
waste recycling specifications, a directory of local construction waste recyclers.
Assistance includes presentations to jobsite workers, site visits and assessments,
and research about recycling and reuse options.
- Prevent Jobsite Waste
- Design Specifications & Waste Management Plans (includes examples of
design specifications that use specific language to address expectations for
waste reduction)
- Construction, Demolition, and Land-clearing Debris Recycling

Materials Management Options for MA Solid Waste Master Plan Review Final Report
11
� EcoConsumer (Gateway Program)
- Promotes conscientious purchasing choices
- EcoConsumer TV Ads; Featured Resources for TV Ads
- EcoConsumer Columns in The Seattle Times
- Other public outreach (radio interviews and public presentations)
- Waste Calculator (similar to eco-footprint calculator)
- Links (to directories, guides, household tips and green lifestyle advice)
� Waste Prevention Resources
- Waste prevention tips and information on reducing junk mail, and the
National Waste Prevention Coalition (including Waste Prevention Forum)
- Waste free holidays (business partners)
- Northwest Yard Days
- EcoDeals.org (Website featuring high-performance products and services,
descriptions, coupons, etc.)
City of Seattle
Seattle has long been known as a leader in waste prevention and reuse.
� Education and Technical Assistance - Seattle Public Utilities, the agency
responsible for managing the City’s solid waste, has a robust education and
technical assistance program that promotes home composting, grasscycling, and
natural gardening.”
� “Use It Again, Seattle!” is the City’s popular way of keeping reusable items out
of the landfill. Residents can drop off their unwanted but reusable items free of
charge. Items are first made available to local charity partners. Remaining items
are then made available to the public. While until this year Use It Again events
were held at the neighborhood level, SPU found this to be expensive and is
currently piloting a similar effort at a single location -- one of the City’s major
recycling and disposal stations.
� The Resource Venture initiative provides free educational materials, technical
assistance and training to help businesses reduce waste and prevent pollution. It
also has a strong green building program with an emphasis on preventing C&D
waste.
U.S. Green Building Council – Leadership in Energy and Environmental Design
Through its Leadership in Energy and Environmental Design (LEED) program, the
USGBC has been very successful in raising awareness of the benefits of green building.
Its successful development and broad dissemination of LEED standards are having a
transformative impact in the commercial sector, with thousands of buildings nationwide

Materials Management Options for MA Solid Waste Master Plan Review Final Report
12
pursuing LEED certification, and USGBC is attempting to do the same for housing with
the recently released LEED Home Program (Draft). Like its predecessors, LEED Home is
a certification program for green homes, with a point system for different levels of green
(Certified, Silver, Gold, Platinum).
� LEED Home places considerable emphasis on resource use and recognizes the
important driver that house size is:
- 24 of 108 total points for Materials and Resources use
- Home size emphasized due to relationship to materials & energy use
whereby up to 10 points are awarded for smaller than national average
home size and larger than average homes are penalized by point
deductions
- Up to 2 points each for material efficient framing and reduced job-site
waste generation
- Points also available for improving durability of the building envelope,
components and systems through appropriate design and materials
selection and installation
California Integrated Waste Management Board
CIWMB has an extensive education and technical assistance program and provides
residents and businesses with a wide range of materials to promote waste reduction and
reuse. The elements of the Board’s program include educational materials concerning:
� Business Waste Reduction Resources Index
� Beyond Waste Prevention
� Construction and Demolition
� Environmentally Preferable Purchasing—Green Lodging
� Organics (biosolids, food scrap management, home gardening, grasscycling,
greenscaping, sustainable commercial landscaping, etc.)
� Packaging
� Paper Reduction Information Resources
� Reuse
� Waste Prevention Information Exchange (very extensive on-line directory of
informational resources organized by prevention and reuse topic)
Alameda County, CA
Alameda County’s Business Assistance Program is designed to prevent waste, boost
resource efficiency and materials recovery, and enhance markets for recyclables. The
program targets businesses, public agencies and institutions and includes commercial,
industrial and office environments. The program includes:

Materials Management Options for MA Solid Waste Master Plan Review Final Report
13
� Comprehensive environmental assessments and financial (grants) and technical
assistance to implement waste prevention practices.
� Marketing campaign to prevent transport marketing waste, through promoting
reusable shipping containers and other methods.
In addition, the Alameda County Organics Program provides educational workshops and
tours, (Bay-Friendly Gardening), and coordination with the Master Composter project
and the Compost and Worm Bin Distribution program to support on-site composting and
waste prevention. Achievements include the diversion of over 16,000 tons of material
from residential programs and 22,000 tons from commercial programs in 2004 (includes
on-site and centralized composting). Program has maintained a 20% participation rate for
compost bin sales.
Challenges
Several important challenges face public education and awareness campaigns for waste
prevention and reuse. There is a general reluctance on the part of businesses and citizens
to modify existing practices until they are forced to do so, either through regulation or in
response to a perceived crisis. Moreover, businesses and citizens are bombarded with
messages and advice on an ongoing basis. It is difficult to make waste prevention and
reuse rise above the myriad of other issues facing society. Educational messages
therefore need to strike a balance between urgency based on the negative consequences
of inaction, and the positive implications for citizens, businesses, and society generally of
implementing prevention activities.
Specific educational efforts may not be well coordinated with other elements and a
broader waste prevention and reuse strategy, thereby weakening their effectiveness. If
not part of an integrated strategy with clear priorities, awareness campaigns may not
identify the most important specific actions that citizens and businesses should
implement to achieve waste prevention. Since waste prevention results from a
combination of many factors, it is difficult to measure or even estimate the impact of
educational initiatives. Community-based social marketing techniques have begun to
introduce the importance of measuring the impact of educational programs, but
evaluating effectiveness remains an important challenge. This lack of evaluation data
leads to a final hurdle, that of obtaining adequate resources to maintain educational
programs.
Assessment
Waste prevention and reuse educational efforts vary widely across jurisdictions in the
U.S. and abroad, ranging from general public service announcements with vague
pronouncements about using resources wisely to specific initiatives with explicit
guidance on why and how to reduce particular wastes. All programs are built on the
premise that public education and awareness are essential elements for successful waste
prevention. Of course, the success of these programs, wherever they are located, depends
partly on an adequate ongoing level of funding.

Materials Management Options for MA Solid Waste Master Plan Review Final Report
14
The most effective programs, such as King County and Washington State, appear to be
those that: (a) are well integrated into a larger strategy; (b) identify clear priorities; (c) are
linked to quantitative and achievable waste reduction targets or goals, especially if these
were developed through an inclusive stakeholder process; (d) include a tracking
mechanism to measure success; and (e) relate to or are motivated by regulatory
requirements. The recent popularity of education programs aimed at promoting green
building is not surprising, as they meet most if not all of these criteria.
Note that in terms of placing the waste prevention education initiative within a larger
strategy, where appropriate MA DEP should look for opportunities to link the effort with
“hot” issues that have gained public attention, such as climate change or increasing
energy prices.

Materials Management Options for MA Solid Waste Master Plan Review Final Report
15
Economic Incentives
Overview
Economic instruments are a powerful tool for promoting waste prevention and reuse,
both through taxing wasteful practices and by positive financial incentives for preferred
practices. “Environmental taxes,” as they are sometimes referred to, can take the form of
point-of-sale levies, pre-disposal fees, packaging taxes, as well as alternative pricing or
contracting arrangements for waste management. Positive incentives may include tax
credits for capital investments in waste prevention technologies or processes, or direct
support or subsidy for adoption of such technologies and/or practices.
Two key programs aimed at preventing waste by altering the way waste management
services are provided and paid for are Pay-As-You-Throw (PAYT) or Variable Rate
systems, and Resource Management (RM) Contracting, primarily aimed at the business
sector. While these approaches are initially aimed downstream at the waste produced,
ultimately they promote waste reduction and reuse.
Pay-As-You-Throw (PAYT)
As the name implies, PAYT changes the way in which garbage collection and disposal
services are priced. Rather than the traditional fixed bill for unlimited collection, PAYT
systems set their charges based on the amount of waste disposed (usually per bag or can,
sometimes by weight). This approach mirrors how we pay for other utilities such as
electricity, gas, and water, and provides waste generators (households or businesses) with
an incentive to reduce the amount of waste discarded, either through waste prevention,
reuse, or recycling. While most diversion of waste from disposal results from increased
recycling rates, a significant fraction (5-10% or more) is related to waste prevention
efforts. As described below, over the past two decades PAYT programs have become
increasingly popular throughout the country.
Resource Management Contracting
RM contracting addresses an essential and often overlooked approach to waste
prevention: the contractual relationships between waste generators and waste
management service providers. Contracts are pervasive in the commercial/industrial
waste management field and directly influence the way the vast majority of businesses
manage their waste. Unlike traditional solid waste service contracts, an RM approach
compensates waste contractors based on performance in achieving the organization's
waste reduction goals rather than the volume of waste disposed. As a result, RM
contracts align the interests of generators and contractors so that they share the financial
benefits of cost-effective resource efficiency through prevention, recycling, and recovery.
RM contracting is similar to performance-based contracting that has been used in the
energy and the chemical purchasing, use, and management industries for a number of
years. Under RM contracting the contractor takes responsibility for managing a
company’s waste and is paid a set fee, at or below the company’s current waste
management costs. The contractor adopts the risk for waste management but also gains

Materials Management Options for MA Solid Waste Master Plan Review Final Report
16
financial rewards for making it more efficient. The efficiency gains are shared between
the contractor and the business.
RM contracting recognizes that waste management is not part of the core business or
expertise of most companies. Through an RM contract, the contractor provides the waste
management expertise and has a vested interest in minimizing waste.
Program Descriptions
PAYT
According to a recent inventory of state regulations and policies,3 as of 2001 at least four
states mandated some form PAYT or Variable Rate pricing: Iowa, Minnesota,
Washington, and Wisconsin, while Oregon includes PAYT as one of the options from a
menu of choices communities must select. Thirteen states gave preference in their
financial incentives or grants to communities with PAYT systems, and about 33 states
actively promote or offer education about PAYT. Leading states where PAYT is most
common include: CA, IA, MA, MI, MN, NY, OH, OR, VT, WA, and WI.
Some states (Wisconsin, Oregon and Minnesota) even have a law requiring that
communities use PAYT. PAYT is generally most effective in small cities and suburban
areas but has not worked as well in densely populated urban areas where apartment
dwellers use chutes and dumpsters for their normal disposal. Also, PAYT may not be as
well-suited to very rural areas where illicit dump sites are easy to find. In general, it is
most feasible where individual households' weekly trash and recycling can be readily
measured and monitored.4
RM Contracting
To date, U.S. EPA and several states (e.g., Massachusetts, Nebraska, Nevada) have done
much to test the effectiveness of RM contracting. U.S. EPA has been promoting
Resource Management contracting through its WasteWise Program and website (see
http://www.epa.gov/epaoswer/non-hw/reduce/wstewise/wrr/rm.htm), which includes an
extensive guidance document on “Resource Management: Innovative Solid Waste
Contracting Methods.” The agency has also sponsored training of businesses and waste
management firms.
MA DEP has also been a leader in promoting RM contracting practices, as it supported
pilot project assessing its potential in diverse commercial, industrial and institutional
settings. Pilot projects in MA and elsewhere have shown great promise for diverting
significant fractions (an additional 15–30%) of the commercial waste stream. Public
3 Skumatz Economic Research Associates, 2001.
4 Don Fullerton and Margaret Walls, “Trash Talk, Resources for the Future Weekly Policy Commentary,
December 3, 2007. Accessed at:
http://www.rff.org/Publications/WPC/Pages/12_03_07_Trash_Talk_Walls_Fullerton.aspx.

Materials Management Options for MA Solid Waste Master Plan Review Final Report
17
sector RM projects in other states have been implemented at the county and school
district levels.
While not a state-incentivized program, General Motors’ successful implementation of
RM contracting in several of its North American plants provides a sense of the potential
impact of RM. GM saw dramatic waste reductions, increases in recycling, and cost
savings. Raytheon has also recently implemented RM contracting in its Northeast
operations and has been monitoring its waste reduction impacts.
Challenges
A key challenge is to help create a sustainable, long-term market for RM services so
waste management companies as well as firms with procurement expertise and industrial
and commercial operations experience develop RM capabilities and become RM service
providers. To accomplish this may require additional resources from DEP to educate and
motivate both potential customers and suppliers of RM services. The goal should be to
develop and implement a critical mass of RM programs so that customers and RM
service providers will perpetuate RM contracting activity without significant further
resources from the Department.
Assessment
Over 120 MA municipalities have implemented PAYT programs, though many of the
Commonwealth’s largest cities have not yet done so. As part of MA DEP’s 2006
Revision to Solid Waste Master Plan, the Department continued its longstanding support
for Pay-As-You-Throw programs through grants and technical support for municipal
PAYT programs. Based on the vast experience in MA communities and other
jurisdictions, there may be room to expand PAYT into larger cities and refine
implementation strategies to make it even more effective.
Resource Management contracting pilots in Massachusetts and elsewhere show
significant waste reduction potential, on the order of 15-30%. RM aligns the interests of
businesses and their Resource Management contractors and shifts the incentives towards
minimizing waste. RM contracting can be applied across many industrial and commercial
sectors
While in the near term RM contractors are likely to continue to come from the waste
management and recycling industry and focus primarily on diversion and recycling, the
potential exists for transitioning RM contracting into an effective waste prevention
strategy. Such a transition will require the RM industry to mature and attract new
contractors with expertise in a range of industrial and commercial operations, including
procurement, product design, and packaging. Over time, the strategic alliances formed
may enable RM contractors to influence upstream decisions related to product design and
material choice, use, and handling, not just waste management practices. This upstream
focus will be necessary for RM contracting to achieve more significant waste reductions
and contribute to the Commonwealth’s aggressive waste prevention objectives.

Materials Management Options for MA Solid Waste Master Plan Review Final Report
18
There are strong precedents for this kind of approach in the energy and the chemicals
arenas. As a voluntary approach, there should be little opposition from industry, though
the waste management industry may be reluctant to embrace a new business model.
Moreover, waste management practices and costs generally do not receive much attention
from business managers. State educational and training efforts would need to be offered
to businesses and potential RM service providers, emphasizing the potential for win-win
outcomes. Coupled with other initiatives, RM contracting holds considerable promise as
a means to help transform business thinking from a waste management mentality to a
waste prevention and materials management approach.

Materials Management Options for MA Solid Waste Master Plan Review Final Report
19
Regulatory Requirements
Overview
A variety of regulatory requirements have been successful in achieving waste prevention
targets. Among the most effective initiatives are: extended producer responsibility (EPR)
and material or waste bans.5 These programs often lead to or are closely linked with the
alternative business models, such as Design for Environment or product stewardship,
described above. It is important to note that while it may be more difficult to gain
political support for regulatory requirements than voluntary programs, they provide a
more potent tool to government agencies for reaching significant waste prevention
targets.
As defined by the Organization for Economic Co-operation and Development (OECD),
EPR is an environmental policy approach in which a producer’s responsibility, physical
and/or financial, for a product is extended to the post-consumer stage of a product’s life
cycle. There are two key features of EPR policy: (1) the shifting of responsibility
(physically and/or economically, fully or partially) upstream to the producer and away
from municipalities, and (2) to provide incentives to producers to take environmental
considerations into the design of the product. European countries have implemented EPR
programs for many years, and have had particular success with reducing packaging
materials through fee systems and other mechanisms.6
Material or waste bans can also be powerful motivators for preventing waste,
encouraging reuse, or reducing toxicity. Bans can be focused either on product inputs or
on product disposal. Both are aimed at changing the practices of businesses and
consumers. Some programs prohibit use of certain materials in product formulation or
manufacture, such as mercury. These are generally pursued to eliminate or reduce toxic
materials and are based on an understanding that viable alternative materials exist. Thus,
these are often referred to as toxics substitution initiatives. Other programs ban the
disposal of certain types of materials, either because of their toxicity, or their high
volume in the waste stream and availability of alternative management options.
5 Mandatory requirements and specifications for governments to purchase environmentally preferable products (EPP) may also be considered a regulatory approach. For purposes of this review, since EPP
programs are often voluntary guidelines and because their direct focused is government internal behavior,
they are discussed below under Government Leadership by Example.
6 OR DEQ has produced an excellent fact sheet on International Packaging Regulations, which is available
at: http://www.deq.state.or.us/lq/pubs/docs/sw/packaging/intlpkgregulations.pdf.

Materials Management Options for MA Solid Waste Master Plan Review Final Report
20
Program Descriptions
San Francisco, California
Following a new state regulation that bans a wide range of common household hazardous
waste products from the trash, in early 2006 the San Francisco Board of Supervisors
passed an EPR Resolution that:
� Supports statewide legislation and local initiatives requiring manufacturers to take
responsibility for collecting and recycling their products at the end of their useful
life;
� Urges the California Legislature to pursue statewide extended producer
responsibility legislation targeted at universal waste.
� Advises the City’s Department of the Environment to develop EPR policies such
as leasing products rather than purchasing them, and requiring the manufacturers
of products sold to City departments to offer less toxic alternatives, and to take
responsibility for managing their products at the end of their useful life; and
� Commits the City and County of San Francisco to continue to support EPR
initiatives.
San Francisco’s EPR Resolution is one of the strongest statements to date about EPR
from a local government in the U.S. The Resolution may be on the cutting edge of a shift
in thinking among local governments, which have historically borne the responsibility for
collecting and disposing of waste. As the resolution puts it: "By covering the costs of
collection and disposal, local governments are subsidizing the production of waste
because manufacturers know that whatever they produce the local government will foot
the bill for recycling or disposal."
British Columbia Product Stewardship Programs
The BC Ministry of the Environment created an Industry Product Stewardship Business
Plan (approved in 2002), which established the framework to support the development of
the Product Stewardship Program. The program has two key features:
� Based on Extended Producer Responsibility (EPR) concepts, it places the onus for
end-of-life product management (physically and/or economically, fully or
partially) on producers and consumers rather than general taxpayers; and
� It provides incentives to producers to consider environmental impacts in the
design of products.
To support the development of new programs, an October 2004 Recycling Regulation
includes core EPR requirements for beverage containers, and includes plans to transform
electronics (e-waste), tire, and battery recycling programs into EPR programs. It also
provides a framework for inclusion of additional products in the EPR program by
regulation, without the need for new legislation.

Materials Management Options for MA Solid Waste Master Plan Review Final Report
21
King County, Washington
Product stewardship is an important component of King County’s 2001 Comprehensive
Solid Waste Management Plan. The Solid Waste Division promotes product stewardship
in order to:
� Reduce local government’s waste disposal costs by sharing the responsibility for
managing certain wastes with manufacturers, retailers and consumers;
� Reduce the use of toxic materials in products; and
� Conserve resources by encouraging waste prevention, reuse and recycling through
good product design.
The King County Product Stewardship and Strategies report (2002) focuses on the
county’s initial stewardship targets: electronics equipment and products containing
mercury, provides background information on policies, and describes how target products
and materials are selected. The County’s Solid Waste Division is a member of regional
and national organizations (the Northwest Product Stewardship Council, and the Product
Stewardship Institute), that work with businesses, government agencies and nonprofit
groups to promote product stewardship principles and reduce the health and
environmental impacts of consumer products.
As part of its overall strategy, the County established the Take it Back Network and
initiated the Regional Take it Back Pilot Projects (funded by grant as part of EPA’s Plug-
In To eCycling Campaign) to collect and reuse or recycle used electronics. It has also
been a key player in the development of recent WA state legislation to require the take
back of certain electronics.
Germany Packaging Ordinance and the Green Dot Program
In 1991 Germany established the Ordinance on the Avoidance of Packaging Waste
(Packaging Ordinance). The Ordinance was expanded several times, and as of 1993,
required all manufacturers—foreign and domestic—to take back and recycle or reuse all
types of consumer packaging used to contain and transport goods from the point of sale
to consumption. Manufacturers, retailers and distributors may be exempt from the
Ordinance if they participate in the Duales System Deutschland GmbH (DSD), or Dual
System of Germany. The DSD, set up in 1990 as a non-profit, collects, sorts and recycles
post-consumer packaging from households and businesses throughout Germany. This
prompted an industry initiative, the Green Dot Program, to avoid individual take-back
regulations. Participants in this system label their products with the Green Dot, which
indicates that packaging should not be returned to the manufacturer or distributor, but
instead should be collected and recycled through the DSD.
The DSD:
� Maintains over 600 companies as members.

Materials Management Options for MA Solid Waste Master Plan Review Final Report
22
� Requires its members to pay a license fee (for the Green Dot trademark) based on
the type and weight of the packaging materials (this acts as an incentive for waste
prevention).
� Requires members to adhere to certain standards for the use of certain types of
packaging materials.
� Motivated the European Union to implement the European Packaging Directive
(1994) to standardize national measures and set recovery targets for packaging.
� Is now licensed to 20 other EU countries who are trying to comply with the
Packaging Directive.
While the Packaging Ordinance has established an elaborate system for recycling
packaging materials that exists side-by-side with curbside programs, it has also provided
an important incentive to prevent waste through packaging redesign and minimization.
The Netherlands Packaging Covenant III
The Netherlands has also focused on reducing and recycling product packaging, using a
voluntary system based on a series of covenants. The first Packaging Covenant was
signed in 1991. The third Packaging Covenant (PC III) came into effect in 2002 and
expired in January 2006. It is being replaced by the Packaging, Paper and Board
Management Decree to govern waste collection, prevention and recycling. The new
approach will require producers to pay for the separate collection or post-separation of
household packaging waste. Since 1991, the PC has been successful in continuously
reducing the use and disposal of packaging material and consequently the environmental
impact of packaging waste. In the early years, reductions in packaging waste were on the
order of 6-15% per year. In the last few years, however, reductions have declined to
about 1-2% per year. The program’s monitoring system has been reviewed and altered
many times since 1991, and requires ongoing scrutiny and refinement.
Objective for prevention of packaging: The Packaging Covenant stipulated that the total
volume of packaging would not rise by more than two-thirds of the percentage increase
of GDP between the years of 1999 and 2005. This objective recognizes the need to
decouple waste generation and economic activity. The GDP grew by 10.2% during this
period, while the total volume of new packaging on the market increased by 8.8%,
exceeding the objective’s target of no more than 6.8%.
Challenges
Several challenges are associated with the implementation of regulatory requirements.
The first is political will. While mandatory programs and requirements are often
considerably more effective than voluntary ones, there is frequently resistance to new
regulations by certain stakeholders because they may require changes and potential cost
increases in established manufacturing processes or business practices. The political
power of such opponents can often inhibit the adoption of strong mandatory programs.
Implementing effective processes in which stakeholders with different interests are
engaged in the development of new regulations can be time-consuming and difficult. The

Materials Management Options for MA Solid Waste Master Plan Review Final Report
23
second challenge relates to enforcement, which is closely linked with resources and
staffing constraints on the part of governments. A lack of human and financial resources
can significantly weaken regulatory program effectiveness.
Assessment
Experience in several jurisdictions, including Massachusetts, British Columbia, Germany,
and elsewhere, has demonstrated that regulatory programs can have an important impact
on preventing waste and encouraging reuse. Germany (through the Green Dot program)
is a leader in Europe for packaging reduction and recycling. Between 1990 and 2004, the
DSD has led to a 14% decrease in per capita consumption of packaging.
The Massachusetts waste bans, combined with effective public education, have been
enormously successful in promoting home composting and preventing yard waste from
entering the waste stream. Also, regulatory requirements often spawn related product
redesign efforts by manufacturers to prevent waste and facilitate product collection and
reuse. While many programs do not systematically track their waste prevention impacts,
and it is difficult to do so, establishing reduction targets and an accepted method for
tracking progress can be an effective way to motivate businesses, consumers, and agency
staff responsible for program implementation. EPR programs offer governments a tool to
shift responsibility for end-of-life product management by internalizing the external
environmental costs of goods and services, and are a means to help reshape how society
thinks about production and consumption behavior. In the absence of national
regulations, regional efforts such as the Northwest Product Stewardship Council promote
broader adoption of EPR approaches, which may lessen the burden of multiple state-level
requirements on manufacturers.

Materials Management Options for MA Solid Waste Master Plan Review Final Report
24
Government Leadership by Example
Overview
Government leadership and involvement in waste prevention programs has a strong
bearing on program effectiveness. There are numerous reasons for governments to
champion waste prevention programs, including: demonstration that such programs are
feasible, and that governments should play a role in reducing a state’s waste generation;
incorporation of policies and tactics in the public realm that the government recommends
to others; and transfer of lessons learned and best practices with other governments.
Government leadership is demonstrated in several types of programs, including
Environmentally Preferred Procurement/Purchasing (EPP), setting regional targets for
waste prevention and reduction, and internal practices such as duplex copying and green
building.
Program Descriptions
California Integrated Waste Management Board (CIWMB)
In 1999 new California legislation (AB 75) required state agencies and large state
facilities to divert at least 25 percent of their solid waste from landfill disposal or
transformation facilities by January 1, 2002, and at least 50 percent by January 1, 2004.
Diversion was defined to include reducing potential waste by means such as source
reduction, recycling, and composting. Under the law, each state agency and large state
facility must adopt and submit an integrated waste management plan (IWMP) to the
CIWMB, which outlines the steps to be taken to achieve the mandated waste diversion
goals. The law also requires state agencies and state facilities to submit annual reports to
CIWMB regarding solid waste reduction beginning April 2002.
The CIWMB bolstered its efforts in November 2001 when it adopted a Strategic Plan
highlighting the following themes: sustainability, product stewardship, energy recovery,
environmental justice, safe disposal of waste, and the promotion of a zero-waste
philosophy. The last goal, “Zero-Waste,” is an outstanding waste prevention effort by a
public entity, and the details and objectives for meeting the goal are outlined below.
Overview of Goal 7, Zero-Waste:
� “Promote a ‘zero-waste California’ where the public, industry and government
strive to reduce, reuse or recycle all municipal solid waste materials back into
nature or the marketplace in a manner that protects human health and the
environment and honors the principles of California’s Integrated Waste
Management Act.”
� Maximize waste reduction and use the most effective processing or manufacturing
practices to optimize efficiency and conserve natural resources through both

Materials Management Options for MA Solid Waste Master Plan Review Final Report
25
front-end (e.g. source reduction) and back-end (e.g. recycling) methods as well as
by using waste to generate energy.
Goal 7 Objectives:
� Promote source reduction to minimize the amount of waste generated.
� Promote best business practices in product manufacturing and handling.
� Encourage recycling activities and new technologies in all business and
residences.
� Promote new or existing technologies and processes to address existing or
emerging waste streams.
� Work with other State agencies to promote zero-waste strategies that would
ultimately put State agencies in a position to lead by example.
San Francisco, California
San Francisco has a number of innovative City programs that promote waste reduction
and reuse through government leadership:
� Precautionary Principle - In 2003 the San Francisco Board of Supervisors
adopted a set of environmental regulations for the City and County of San
Francisco that recognizes the Precautionary Principle as the guiding model for
future legislation. This approach asks whether a given product or practice is safe,
whether it is really necessary, and whether products or practices with less
environmental impact would perform just as well.
� Green Building – The City’s Environmental Code (Chapter 7) reflects San
Francisco’s commitment to green building and requires that new municipal
buildings and significant renovations of 5,000 square feet or more meet the LEED
Silver standard. It also established the interagency Resource Efficient Building
(REB) Task Force to guide development of City green building standards and
oversee their implementation. The Department of Environment published an
extensive Green Building Compliance Guide for San Francisco Municipal
Buildings as a resource and step-by-step guide for professionals working on the
planning, design, construction, operation, and demolition of City buildings.
� Less-toxic Purchasing – San Francisco’s Environmentally Preferable Purchasing
Program works to minimize the purchase of products containing hazardous
ingredients used in the City's custodial services, fleet maintenance, and facility
maintenance in favor of using alternate products that pose less risk to City
employees and to the environment. The Program develops guidelines to determine
when the City should make purchasing changes to support the goal of using of
less harmful products, and has developed a list of environmentally preferable
practices and products for City Departments to use. This is institutionalized in the
Environmentally Preferable Purchasing Ordinance, which is Chapter 2 of the City
and County of San Francisco Environment Code.

Materials Management Options for MA Solid Waste Master Plan Review Final Report
26
Seattle
Seattle’s Paper Waste Prevention Campaign aims to reduce the environmental impact
associated with the City’s purchase, use and recycling of printer and copier paper through
reducing overall consumption of paper and other practices. Executive Order (2005) calls
for City departments to reduce paper consumption by 30% by end of 2006 and purchase
100% recycled content paper. Progress towards the 30% reduction goals is included as
part of the performance evaluations of department managers. From January to May, 2006
the City’s paper consumption fell 8-12% compared with the same period in 2004.
King County, Washington
The Green Building Ordinance in King County, adopted in 2005, charges all County
departments to incorporate the LEED rating system as the standard for all projects. The
County established a Green Building Team consisting of representatives from various
departments including Natural Resources and Parks, Transportation, Development and
Environmental Services, Finance, and Executive Services. The team has expertise in
project management, architecture, design, landscape architecture, engineering, resource
conservation and budget analysis, and promotes the use of green building practices in all
buildings that the county constructs, remodels and renovates.
Challenges
Several challenges pertain to the Government Leadership by Example programs, not the
least of which is budgeting the necessary resources to initiate and maintain programs.
There are also logistical challenges in implementing many of the above programs in
terms of ensuring that the appropriate infrastructure exists for material reuse. For
example, maximizing the reuse of C&D materials (or used office equipment) requires
adequate collection and storage infrastructure as well as creation or facilitation of ready
markets to utilize the C&D materials.
Assessment
CIWMB claims to have been extremely successful, as state agencies reported diverting
77% of their total waste by 2002, far surpassing their target of 25% waste diversion by
2002 and 50% by 2004. While some of the diversion from disposal resulted from waste
prevention and reuse, the fraction is not readily available, but it is clear that the majority
was from recycling.
Perhaps the greatest success for Government Leadership by Example programs is in the
area of EPP. Many states, including Massachusetts, have implemented aggressive green
procurement programs that have had significant impacts in promoting a whole range of
environmentally preferred products from chlorine free paper with high post-consumer
content, to building specifications requiring waste preventing building techniques. Some
states, including Massachusetts have achieved standard price contracts with suppliers of
such products that allow municipalities and other non-state public agencies to purchase
these goods and services under the same preferential terms as the state. Estimates of the

Materials Management Options for MA Solid Waste Master Plan Review Final Report
27
value of purchases under EPP programs is in the billions of dollars annually for some of
the larger states.
The green building area in particular has seen considerable success, and as states’
experience has increased many have moved from an EPP focus to an integrated design
approach in which the whole building is looked at as an integrated system from the
outset. The result is not only the prevention of significant amounts of construction waste,
but also reductions in energy and water resources, and their associated costs, used
throughout buildings’ lifecycle.

Materials Management Options for MA Solid Waste Master Plan Review Final Report
28
European Sustainable Consumption Initiatives
Overview
While technological development and innovation have significantly increased resource
efficiency and improved environmental outcomes in the U.S. and elsewhere, increased
consumption and changes in lifestyles associated with increased wealth tend to outweigh
such gains. “Sustainable consumption” initiatives in Europe are at the cutting edge of
waste prevention efforts and address deep issues concerning values and lifestyle choices.
The potential of these programs for waste reduction goes far beyond conventional
programs. They are, therefore, given special focus in this section. Here we highlight both
the broad initiatives at the EU level, as well as selected best practices at the member
country level, where much of the policy formulation and implementation activity occurs
to influence consumption habits and environmental performance. This review is not
intended to be exhaustive, as there are a myriad of local, national, and EU-wide
sustainable consumption efforts underway. Rather, it is meant to provide a clear sense of
the European framework and an understanding of selected key accomplishments in this
area.7
In 2002 at the World Summit on Sustainable Development in Johannesburg, European
Union (EU) countries pledged to advance policies for sustainable consumption and
production (SCP). The European Council followed up on this commitment in 2003 by
developing a ten-year framework. This 10-year framework, as part of the Marrakech
process (named after the location for the first International Expert Meeting in June 2003)
includes the creation of a Regional Strategy on Sustainable Consumption and Production
and an accompanying Regional Council of Government to oversee the ten-year
framework.8
Following commitments “to promote sustainable patterns of production and
consumption” made at the 2002 World Summit, the EU has developed a range of
instruments to promote sustainable consumption and production, including:
- Integrated Pollution Prevention and Control (IPPC)
- EU Eco-Management and Audit Scheme (EMAS)
- EU proposed directive on eco-design and end-use products
- Social and fair-trade labels
- Thematic strategy on waste prevention and recycling
7 It is important to note that according to the OECD, per capita solid waste generation in Europe is already
significantly lower than in the U.S. (e.g., approximately 50% less in Germany and 30% less in France).
8 Given the depth of economic and social transformation required to successfully implement SCP programs,
a number of countries in the EU, including the United Kingdom, recognize that SCP efforts have to look
well beyond ten years.

Materials Management Options for MA Solid Waste Master Plan Review Final Report
29
- Thematic strategy on the sustainable use of natural resources
- New framework for taxation of energy products and electricity
- Integrated Product Policy (IPP)
- New EU chemicals policy (REACH)
- EU Environmental Technology Action Plan.
The European Union places its sustainable consumption policies and initiatives within the
larger context of the EU’s sustainable development initiatives, including the EU’s Lisbon
Strategy of Economic and Social Renewal (2000), the Sustainable Development Strategy
(Gothenburg, 2001), and the Sixth Community Environment Action Programme (6EAP).
The primary objective of the Lisbon Strategy is to make the EU the world’s “most
competitive and dynamic knowledge-based economy” by 2010. The Sustainable
Development Strategy supplemented the Lisbon Strategy by bolstering the emphasis on
environmental protection, and the need to promote economic, social and environmental
objectives simultaneously. The 6EAP focuses on environmental goals for the EU,
including in the area of waste prevention and recycling, and lays out the key objectives,
central to which are efforts to decouple environmental pressure and economic growth.
These sustainable development policies provide a useful context for both understanding
the EU sustainable consumption efforts, and also for evaluating the transferability and
applicability of EU SCP approaches to Massachusetts.
Program Descriptions – EU Level
The initiatives that comprise the EU SCP effort fall into several categories outlined
below. In this section we highlight those that appear to be most relevant for potential use
in Massachusetts.
Resource Productivity Improvements
� EU Environmental Technology Action Plan (ETAP)
- Survey to identify technology that can effectively address environmental
problems.
- Identification of barriers that inhibit development and implementation of
these technologies.
- Development of action plan to address barriers. � The Sixth EU Framework Programme for Research and Technological
Development
- Focuses on changing industrial processes and projects to promote SCP and
highlights long-term research activities to enhance SCP objectives.

Materials Management Options for MA Solid Waste Master Plan Review Final Report
30
Alternative Business Models
� Corporate Social Responsibility
- Campaign and toolkit to raise awareness about CSR (65 national events in
25 countries).
Public Awareness and Action
� Environmental labeling
- The EU eco-label (the Flower) was introduced in 1992. A current initiative
is in the midst of broadening the range of eco-label criteria. � Report on Sustainable Household Consumption in Europe
- European Environment Agency drafted a contribution to the next “State of
the environment and outlook” report, describing sustainable household
consumption in Europe including past trends and future projections.
Economic Incentives
� Economic Instruments
- Environmentally-related taxes (energy, water, etc.)
- State aid for environmental purposes.
- Trade policies and preferential tariffs
Regulatory Requirements9
� Integrated Product Policy (IPP)
- Improve existing mechanisms (the IPP “toolbox”) to make them more
product-focused, and optimize the synergies between mechanisms.
- Target products with the greatest potential for improvement and enhance
their environmental performance.
Government Leadership by Example
� Public Procurement Policies
- Commission Communication about the possibilities for basing public
procurement policies on environmental and social factors.
9 Through an earlier regulatory initiative, the European Commission’s Landfill Directive (Council Directive
99/31/EC) set aggressive reduction targets for municipal biodegradable waste going to landfills (reaching
65% reduction by 2013). This serves as another incentive for EU countries to pursue SCP and other waste
prevention strategies.

Materials Management Options for MA Solid Waste Master Plan Review Final Report
31
- Handbook on Green Procurement—provides detail on items in the
Commission Communication and gives specific examples on how to
incorporate environmental considerations into public procurement
policies.
- In 2004, adoption of public procurement Directives that establish
guidelines for adopting environmental and social considerations into
procurement policies. � Analytical Tools
- Indicators: developed by the Commission in order to track progress on
meeting SCP and sustainable development goals. Task force created an
indicator framework with ten themes including SCP. The indicators will
be revised periodically.
Program Descriptions – National Level
Key sustainable consumption programs in Europe at the national level include:
� Austria: Eco-efficiency Action Programme
� Finland: National Programme on Sustainable Consumption and Production
� Germany: National Process of Sustainable Consumption and Production
� United Kingdom: Government Framework for Sustainable Consumption and
Production, and the UK National Resource and Waste Forum
Several other European countries have also introduced sustainable consumption efforts in
recent years, including Hungary’s Network for Sustainable Consumption and Production,
but there is little information to date on the effectiveness of these efforts.
Finland National Programme on Sustainable Consumption and Production
Based on the work of a multistakeholder advisory committee comprising government,
business, environmental and consumer interests, in June 2005 Finland released its
National Programme to promote sustainable consumption and production. The key
objectives of the Programme are to increase the efficiency of the usage of materials and
energy through all stages of product life cycles, and to promote environmental education
and the development and adoption of environmental technologies. Finland’s Programme
recognized that its key challenges included: high usage levels of natural resources,
significant harmful environmental impacts outside of Finland due to Finnish consumption
and production patterns, and high greenhouse gas emissions.
The committee's proposals include 73 specific measures, and acknowledged that new
kinds of policy instruments will be required to reach the proposed targets, including
financial incentives such as taxation schemes that encourage eco-efficiency, and leading
by example in the public sector regarding public works and purchasing policies.

Materials Management Options for MA Solid Waste Master Plan Review Final Report
32
Importantly, the committee stressed that the quality of life should not be defined
primarily by the ownership of material goods. Its recommendations aim to encourage
innovations that improve the availability of services, communally owned goods and
rentable products. These are examples of the deep changes in lifestyles mentioned in the
overview of the European sustainable consumption initiatives, above.
To improve resource productivity, the Programme calls for support of research on
technologies and financial instruments to promote more efficient production processes
and waste prevention, special service centers to provide technical assistance to
businesses, and the development of more concrete targets for improvements in material-
and energy-efficiency, and reductions in waste. There is also a focus on promoting new
product-service concepts and environmental management systems in the construction
sector that encourage favorable waste management practices. Other elements include a
strong commitment to public sector purchasing strategies to ensure that environmental
considerations are integrated into all public sector purchases.
United Kingdom Framework for Sustainable Consumption and Production
The UK Framework for Sustainable Consumption and Production was published jointly
by the Department of Environment, Food and Rural Affairs (Defra) and the Department
of Trade and Industry (Dti) in 2003. It describes how the UK is implementing its
commitments made at the WSSD and subsequent EU meetings. The Framework focuses
on decoupling economic growth and environmental degradation, prioritizing efforts based
on the most pressing environmental threats, increasing resource efficiency in production
of goods and services, and leveraging market changes through government procurement
practices and incentives. It calls for taking a holistic approach that considers entire life-
cycles of products and services, and intervening as early as practicable in the
resource/waste flow process.
The Framework also recognizes the importance of engaging the full range of stakeholders
in devising effective SCP initiatives, and suggests that a policy package, rather than a
single instrument, is necessary. To date, the UK’s SCP efforts have included initiatives
on energy, water, vehicles, waste, and the use of economic instruments.
Efforts involving economic instruments focus on environmental taxes and are consistent
with the UK government’s view that decoupling economic growth from environmental
degradation requires policies to address externalities. The Climate Change Levy, the
landfill tax, and the aggregates levy are all attempts to reflect external costs, implement
the “polluter pays” principle, and increase resource productivity. The Aggregates Levy
introduced in 2002, for example, reduces demand for primary aggregates (sand, gravel,
and crushed rock) by increasing their cost and encourages the use of recycled and
secondary materials. The Aggregates Levy Sustainability Fund aims to reduce the
environmental impacts per ton of aggregates extraction and helps to stimulate the market
for recycled and secondary materials. Similarly, the landfill tax, introduced in 1996, has
been increased significantly over time – to £21 per ton for 2006/07 and is expected to
increase by at least £3 per ton a year until it reaches a medium to long-term rate of £35
per ton. The government is considering extending it to other methods of disposal, namely
incineration, to further promote waste prevention, reuse and recycling. In addition to

Materials Management Options for MA Solid Waste Master Plan Review Final Report
33
taxes, a number of funding programs have been established in the UK to stimulate
technological innovation to improve resource productivity.
Finally, through its new approach to “sustainable procurement” the UK government aims
to use the public sector’s significant buying power to steer the marketplace and provide
incentives for environmentally preferable products. With existing commitments regarding
procurement of paper, timber, renewable electricity and alternative fuel vehicles in place,
there is considerable room for expansion and improved coordination.
United Kingdom National Resource and Waste Forum
In 2001 the UK National Resource and Waste Forum was created. The Forum
builds cross-sectoral solutions and promotes sustainable resource and waste management.
It is open to parties committed to realizing these goals and comprises government
agencies, businesses, NGOs, and others. The Forum has established the UK Framework
for Waste Prevention to address the link between increased wealth and waste, and to
inform sustainable consumption efforts. There are three phases of this effort 1)
information gathering; 2) program development; 3) program delivery and evaluation. The
Phase 1 report (August 2003) was intended to inform policy development and focus on
priority waste streams with high potential prevention, such as organics (kitchen food
wastes), packaging (plastic, glass, paper, metal), paper (non-packaging), single-use
disposable products, white goods, electronics, and furniture. It also identified three waste
prevention components:
� Demand side: consumers and communities
� Supply side: retailers and manufacturers
� Policy side: legislative change
The Forum initially focused on addressing the demand side through a local action toolkit
with the following elements:
- Home and community composting of yard, food and other organic waste
- potentially 25-30% of household waste
- Smart shopping - how the consumer can reduce packaging waste and
single use products
- Paper waste - how householders and community groups can stop
unwanted mailings
- Product life - how the community can encourage repair and reuse of
products including resale/redistribution
- Service systems - how new businesses can be created which will reduce
disposal such as diaper laundering and hire services
The Forum is currently developing programs for the supply side including:
- Packaging workshops for the supply chain
- Eco design support for producers

Materials Management Options for MA Solid Waste Master Plan Review Final Report
34
- Re-use schemes for refillable packaging
- Measures to reduce production of unwanted mailings
- Measures to moderate growth in single use products
Policy side initiatives are also underway:
- Measures to reduce production of unwanted mailings
- Measures to moderate growth in single use products
- Grading systems to encourage life extension of high value products
Challenges
This section describes several challenges that have emerged from the European SCP
efforts. We have focused on the experience in Western Europe, rather than in Central
and Eastern Europe, as we believe the experience in the west is more applicable to
Massachusetts. Some of the primary challenges to date are as follows:
• Sensitivity around questioning lifestyles and the cultural notions equating
consumption with quality of life
• De-coupling environmental degradation and natural resources use from economic
growth
• Integrating policies intended to address SCP issues. Many such policies operate on
different timelines and with different progress indicators and therefore do not
optimize synergies between the efforts.
The first challenge listed above—reconsidering lifestyle choices and changing consumer
behavior—gets at the core of SCP efforts. Altering consumer values and lifestyles is
critical to achieving environmental stewardship beyond levels typically achieved through
waste prevention efforts. A review of SCP efforts in 2004 noted that resource use,
pollution and waste generation are all expected to continue to increase in Europe due to
increased material consumption relating to consumer trends.
The task of reducing consumption is particularly difficult because it requires targeting a
variety of variables, and it is often difficult to isolate the impacts of each variable, let
alone the interaction between them. For example, it is hard for policy analysts and
regulators to distinguish between drivers of individual consumption (affected heavily by
personal income, prices, diversity of products, etc.) and societal consumption (affected
primarily by macro-level demographic, economic, technological, institutional, socio-
cultural and environmental factors) for the purposes of tracking and reducing overall
consumption.10
In addition, it is often difficult to isolate consumption and production
10 Background Paper: European Stakeholder on Sustainable Consumption and Production. Ostend,
Belgium, November 25-26, 2004. (2.1)

Materials Management Options for MA Solid Waste Master Plan Review Final Report
35
patterns from each other; changing the design and production of products will likely
influence consumers’ purchasing patterns and create new feedback loops.11
Given the
strong cultural inclination in the U.S. towards increasing material possessions and against
strong governmental regulation and tax policies, it is reasonable to expect that the task of
altering consumer patterns and behavior will be even more difficult to address in the U.S.
than in Europe.
Assessment
In working to develop SCP policies, one must account for the fact that SCP crosses many
sectoral and topical boundaries. As such, a varied package of coherent policies—
informed by consultation with stakeholders—is critical to a successful effort. In addition,
there is a strong need to go beyond technological and efficiency-related policies to target
consumer values and lifestyle choices. A coherent package would include supply,
demand, and policy-oriented tools, with much attention given to policies targeting
producer and consumer behavior—namely, focusing on economic instruments and
education.
In examining and deciding upon economic instruments to promote SCP, there are several
important issues to consider—many of which relate to market failures. The most
prominent is the presence of externalities, and incorporating these into SCP policies. As
shown in the UK experience, this is particularly critical for decoupling economic growth
from environmental degradation. The UK has initiated a new technique for achieving
this; it has developed nine “decoupling indicators” that comprise a ‘basket of indicators’
for SCP. These indicators compare the environmental impacts of certain products,
processes or externalities with the associated GDP and/or household consumption. The
basket includes economy indicators, resource use indicators and indicators for specific
sectors. The basket will be particularly useful in tracking progress towards targets, and
helping policy makers assess the extent that various sectors still need to be decoupled.
Other issues for consideration in developing SCP-related economic tools include
imperfections in the market such as asymmetrical information, the lack of competition in
certain sectors, contractual problems that can present barriers for efficient resource use, a
shortage of appropriate skilled labor, access to capital, and methods for stimulating
innovation while shifting and restructuring the economy.
Educational efforts will help address both an inclination towards material consumption as
well as information failures that may lead consumers to harmful products. One critical
message to get across to consumers is that small lifestyle choices can have large
implications for the environment and the economy. Governments and other parties
should use information, regulation, and economic incentives to raise consumer awareness
and promote SCP. Effective examples from the UK and elsewhere include eco-labeling,
differential tax rates, and a variety of price signals.
11 Id.


Materials Management Options for MA Solid Waste Master Plan Review Final Report
APPENDIX 2
Documentation for the Morris Environmental Benefits
Calculator (MEBCalc) Model


Materials Management Options for MA Solid Waste Master Plan Review Final Report
Documentation for the Morris Environmental Benefits
Calculator (MEBCalc) Model
Draft
Prepared by:
Dr. Jeffrey Morris, Sound Resource Management
June 30, 2008

Materials Management Options for MA Solid Waste Master Plan Review Final Report
Table of Contents
1. INTRODUCTION AND SUMMARY............................................................................. 1
2. THE ECONOMIC VALUE OF POLLUTION REDUCTIONS ............................................. 5
2.a. The value of greenhouse gas (i.e., eCO2) emissions reductions..............................6
2.b. The value of human toxics (i.e., eToulene) reductions ...........................................66
2.c. The value of ecosystem toxics (i.e., e2,4-D) reductions............................................6
2.d. The value of reductions in eutrophying emissions (i.e., eN)......................................7
2.e. The value of reductions in acidifying emissions (i.e., eSO2).....................................7
3. EMISSIONS IMPACTS OF RECYCLING AND COMPOSTING ......................................... 7
3.a. The upstream pollution prevention benefits of recycling ...........................................8
3.b. Upstream and use phase pollution prevention benefits for composting ..................11
3.c. Greenhouse gas(GHG) emissions from discards management ..............................12
3.d. Emissions other than GHGs from discards management .......................................13
3.e. Summary of pollution prevention estimates for recycling and composting ..............14
4. REFERENCES ................................................................................................... 15

Materials Management Options for MA Solid Waste Master Plan Review Final Report
1
1. Introduction and Summary1
Figure 1, Schematic Detail for a Product’s Life Cycle Phases, provides a conceptual diagram
for the life cycle of a product or service. It depicts the input of energy and output of wastes
and pollution that occur over the three phases of a product’s life cycle:
• Upstream phase -- resource extraction, materials refining, and product manufacturing,
• Use phase – product use, and
• End-of-life phase – management of product discards.
The Figure 1 schematic indicates how reuse and recycling short circuit the upstream phase,
thereby conserving energy and reducing releases of waste and pollutants in the production
of goods and services. Most of this environmental value comes from pollution reductions in
the manufacture of new products made possible by the replacement of virgin raw materials
with recycled materials and the replacement of synthetic petroleum-based fertilizers with
compost.
Figure 1
Schematic Detail for a Product’s Life Cycle Phases
1 This documentation was prepared for the King County, Washington Solid Waste Division, June 2008.
Raw Materials Acquisition
Materials Manufacture
Product Manufacture
Product Use or Consumption
Final Disposition – Landfill,
Combustion, Recycle or
Reuse
Energy Energy EnergyEnergyEnergy
Wastes & Pollution
Wastes & Pollution
Wastes & Pollution
Wastes & Pollution
Reuse
Product Recycling
One or limited number of return cycles into product that is then disposed – open-loop recycling. Repeated recycling into same or similar product, keeping material from disposal – closed-loop recycling.
Wastes & Pollution

Materials Management Options for MA Solid Waste Master Plan Review Final Report
2
Composting organic materials adds environmental value in two important ways:
1) Diversion to composting prevents methane generation when materials with high
anaerobic decomposition propensities, such as food scraps, are composted rather
than landfilled.
2) Soils fortified with compost need fewer or no applications of synthetic fertilizers and
pesticides, thus preventing pollution that would otherwise be released during
production and use of fertilizers and pesticides.
To estimate the environmental value for curbside recycling and composting, Sound Resource
Management developed a comprehensive recycling and composting environmental costs and
benefits valuation model.2 The model includes a “best-of” compendium of life cycle data from
a number of environmental life cycle inventory and assessment models, including:
• US EPA’s WARM model (available on the internet at
http://www.epa.gov/climatechange/wycd/waste/calculators/Warm_home.html )
• US EPA’s MSW Decision Support Tool (available through Research Triangle Institute3)
• Carnegie Mellon University Green Design Institute’s Economic Input-Output Life Cycle
Assessment model (available on the internet at www.eiolca.net)
• US NIST BEES model (available on the internet at
http://www.bfrl.nist.gov/oae/software/bees/model.html )
• US EPA’s TRACI model (information about TRACI is available on the internet at
http://www.epa.gov/nrmrl/std/sab/traci/ )
Our model also uses life cycle data from the Consumer Environmental Index (CEI) model we
developed for the Washington State Department of Ecology4, as well as from peer-reviewed
journal articles including Morris (1996), Morris (2005), and Morris and Bagby (2008).
This model estimates pollution reductions across all three phases of product life cycles that
are caused by diverting material discards to recycling or compositing. The model takes into
account pollution emissions from collection vehicles, recyclables processing facilities,
composting facilities, disposal facilities, and shipping of processed materials to end users.
Table 1, Estimated Environmental Value per Ton Recycled or Composted, shows the
environmental value for each type of material collected by curbside recycling and composting
2 The model is reviewed in Morawski (2008). 3 See Research Triangle Institute (1999a and 1999b) 4 The CEI model is detailed in Morris et al (2007).
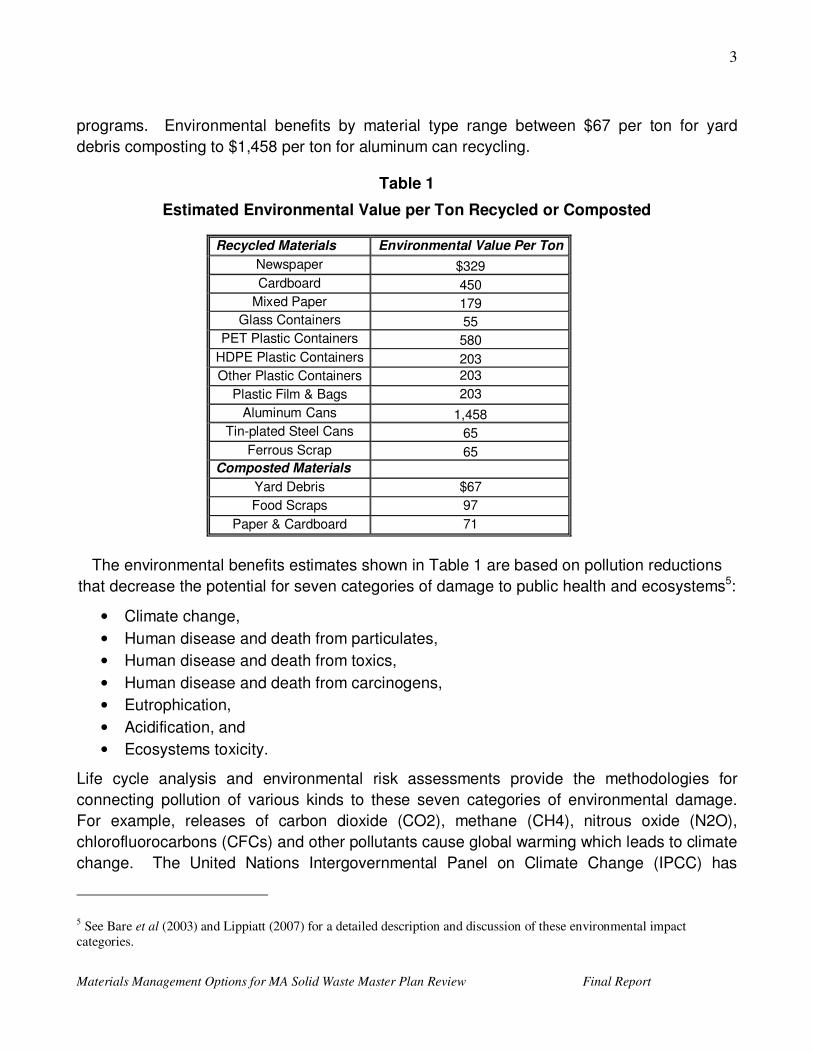
Materials Management Options for MA Solid Waste Master Plan Review Final Report
3
programs. Environmental benefits by material type range between $67 per ton for yard
debris composting to $1,458 per ton for aluminum can recycling.
Table 1
Estimated Environmental Value per Ton Recycled or Composted
Recycled Materials Environmental Value Per Ton
Newspaper $329
Cardboard 450
Mixed Paper 179 Glass Containers 55
PET Plastic Containers 580
HDPE Plastic Containers 203
Other Plastic Containers 203
Plastic Film & Bags 203
Aluminum Cans 1,458
Tin-plated Steel Cans 65
Ferrous Scrap 65 Composted Materials
Yard Debris $67
Food Scraps 97
Paper & Cardboard 71
The environmental benefits estimates shown in Table 1 are based on pollution reductions
that decrease the potential for seven categories of damage to public health and ecosystems5:
• Climate change,
• Human disease and death from particulates,
• Human disease and death from toxics,
• Human disease and death from carcinogens,
• Eutrophication,
• Acidification, and
• Ecosystems toxicity.
Life cycle analysis and environmental risk assessments provide the methodologies for
connecting pollution of various kinds to these seven categories of environmental damage.
For example, releases of carbon dioxide (CO2), methane (CH4), nitrous oxide (N2O),
chlorofluorocarbons (CFCs) and other pollutants cause global warming which leads to climate
change. The United Nations Intergovernmental Panel on Climate Change (IPCC) has
5 See Bare et al (2003) and Lippiatt (2007) for a detailed description and discussion of these environmental impact
categories.

Materials Management Options for MA Solid Waste Master Plan Review Final Report
4
conducted and reviewed scientific data to determine the strength of each pollutant relative to
carbon dioxide in causing global warming. For example, over a hundred year time frame
methane is 23 times and nitrous oxide 296 times more harmful than CO2. Based on these
global warming potential factors we can aggregate the emissions of all greenhouse gas
pollutants into a single indicator quantity for global warming potential. This quantity is CO2
equivalents (herein denoted eCO2).
Similar scientific efforts enable us to express the quantity of pollutant releases in terms of a
single indicator quantity for the other six categories of environmental damage. This greatly
simplifies reporting and analysis of different levels of pollution. By categorizing pollution
impacts into a handful of categories, the environmental costs and benefits model is able to
reduce the complexity of following trends for hundreds of pollutants. This simplifies life for
policy makers. The trade-off is that we have to sort through complex pollutant aggregation
and weighting methodologies. As described in SRMG’s report on our development of a
Consumer Environmental Index (CEI) for the Washington State Department of Ecology, a
“best-of” methodology is in development by the United Nations Environment Program and the
Society of Environmental Toxicologists and Chemists.6 Until that study is released, the
environmental valuation model relies on the methodologies used in US EPA’s TRACI (Tool
for the Reduction and Assessment of Chemical and other environmental Impacts) model and
the Lawrence Berkeley National Laboratory’s CalTOX model.7, 8
The methodology for aggregating pollutants into environmental impact categories yields total
pollution reductions in terms of an indicator pollutant for each impact category. These
indicators are:
• Climate change – carbon dioxide equivalents (eCO2),
• Human health-particulates – particulate matter less than 2.5 microns equivalents
(ePM2.5),
• Human health-toxics – toluene equivalents (eToluene),
• Human health-carcinogens – benzene equivalents (eBenzene),
• Eutrophication – nitrogen equivalents (eN),
• Acidification – sulfur dioxide equivalents (eSO2), and
• Ecosystems toxicity – herbicide 2,4-D equivalents (e2,4-D).
6 See Morris et al (2007). 7 Bare (2002) and Bare et al (2003). 8 See a description of the CalTOX model, references, and downloadable manual and software at
http://eetd.lbl.gov/IED/ERA/caltox/index.html .

Materials Management Options for MA Solid Waste Master Plan Review Final Report
5
Given the estimated pollutant reductions for each category of environmental impact, the
environmental costs and benefits model attaches a monetary value to those reductions.
Monetization provides a method for evaluating trade-offs between the seven types of
environmental impacts, and is a standard approach within the field of environmental
economics. The difficulty, as discussed in Morris et al (2007), is that monetization is
controversial, especially regarding the issue of placing a dollar value on human and non-
human lives. Nevertheless, monetization allows us to compare environmental benefits to
monetary costs and benefits for recycling and composting.
The final step in estimating an environmental value for recycling and composting is, then, to
determine a dollar value for the damage to public health and/or ecosystems caused by each
of the indicator pollutants. The following list shows these estimated damage valuations and
their sources.
• eCO2 -- $36 per ton based on greenhouse gas offset valuation used by Seattle City
Light.
• ePM2.5 -- $10,000 per ton based on Eastern Research Group (2006).
• eToluene -- $118 per ton based on Morris and Bagby (2008).
• eBenzene -- $3,030 per ton based on Eastern Research Group (2006).
• eN -- $4 per ton based on Morris and Bagby (2008).
• eSO2 -- $661 per ton based on average of 2005 ($690), 2006 ($860) and 2007 ($433)
spot prices in EPA's annual acid rain allowance auction.
• e2,4-D -- $3,280 per ton based on Morris and Bagby (2008).
The next section of this report discusses in more detail the monetization of pollution
reductions. The following section explains the estimates of pollution emissions impacts from
recycling and composting that we developed for the environmental costs and benefits model.
References cited in this report, as well as the models and websites listed above, provide the
interested reader with access to the considerable body of literature that we used in
developing the model.
2. The Economic Value of Pollution Reductions
The final step in estimating an economic value for the environmental benefits of recycling and composting is to determine a dollar value for the damages to public health and ecosystems from pollution. The introduction listed an economic cost for each of the seven types of environmental damages that we have included in our analysis of the environmental costs and benefits of recycling and composting. In this section we explain the estimates for five of the impacts.
Materials Management Options for MA Solid Waste Master Plan Review Final Report
6
2.a. The value of greenhouse gas (i.e., eCO2) emissions reductions
There is a very wide range of costs for greenhouse gas emissions and valuations for the benefits of reductions in those emissions. The low end for valuations is the trading price for voluntary greenhouse gas emission reductions. Operating much as the markets in sulfur dioxide emissions permits do, several markets are available for trading voluntary greenhouse gas emissions reduction pledges. One of these is the Chicago Climate Exchange (CCX). Trading values on the CCX for CO2 reductions have been between $1 and $4 per ton of carbon dioxide over the past several years. Values on European carbon markets have been ten times higher than trading prices on the CCX due to the mandatory CO2 emissions caps imposed on European greenhouse gas generators.
The upper end of the range for estimated costs of climate change is found in recent studies such as the review of the economics of climate change conducted by Nicholas Stern (2007). That study determined that a reasonable estimate for the cost of current greenhouse gas emissions was $85 per metric ton, based on the risk of catastrophic environmental impacts in the future if substantial reductions in greenhouse gas emissions are not implemented today.
We used $36 per ton for the cost of greenhouse gas emissions in this analysis because it is in the middle of the range between carbon dioxide market values for voluntary emissions reductions and estimated costs of severe climate change impacts if today’s emissions levels are not substantially reduced. This also is the estimate used by Seattle City Light to reflect the potential costs of CO2 emissions from electricity production.
2.b. The value of human toxics (i.e., eToulene) reductions
As with the valuation of the costs of greenhouse gas emissions, there is a wide range in the estimated costs for emissions of pollutants that are toxic to humans. Eastern Research Group (2006) found estimates ranging up to $2,700 per ton of eToluene for the human health costs of toxic air pollutant emissions. Our very conservative estimate of monetary costs for toxic air emissions is based on a peer-reviewed study on the health effects of atmospheric emissions of mercury. That study was sponsored by the Northeast States for Coordinated Air Use Management (NESCAUM) and conducted by scientists at the Harvard Center for Risk Analysis (Rice and Hammitt 2005). The study evaluated neurological and possible cardiovascular health impacts from exposure to methyl mercury through fish consumption, where atmospheric releases of mercury result in depositions of mercury in water bodies within and bordering the U.S. These depositions lead to increases in methyl mercury concentrations in fish.
The NESCAUM study evaluated three main health effects from methyl mercury exposure – neurological decrements associated with intrauterine exposure, myocardial effects associated with adult exposure, and elevated childhood blood pressure and cardiac rhythm effects associated with In Utero exposure. We used the economic cost estimated in the study for only the first effect. The decrease in cognitive ability as a result of intrauterine exposure to methyl mercury is well documented and understood, whereas research on the other two health effects is not yet as extensive or thoroughly peer-reviewed.

Materials Management Options for MA Solid Waste Master Plan Review Final Report
7
The NESCAUM study’s neurotoxicity health cost estimate for exposure to methyl mercury from consumption of fish that have bioaccumulated that toxin as a result of mercury air pollution is $10.5 million in year 2000 dollars per ton of mercury emitted to the atmosphere. Inflating that estimate to current dollars and converting the cost to toluene emissions, the indicator substance for human toxicity, yields $118 per ton of eToluene for the cost of pollutant emissions that are toxic to human health. This is the value we have attributed to reductions in human toxicity that are caused by diverting material resources from disposal to recycling and composting.
2.c. The value of ecosystem toxics (i.e., e2,4-D) reductions
We estimated the toxicity cost to plants and wildlife from application of a pound of 2,4-D herbicide at $1.64. This is an updated estimate from Joe Kovach, Integrated Pest Management Program at Ohio State University, based on his research originally reported in Kovach et al (1992) on putting an environmental price to pesticide use.9 The estimate includes costs for impacts on fish, birds, bees and beneficial arthropods, but not the estimated costs developed by Kovach for impacts on human health as a result of groundwater contamination. That human health cost is captured in the human toxicity potential impact category.
2.d. The value of reductions in eutrophying emissions (i.e., eN)
In soil or waterways, the addition of large quantities of mineral nutrients, such as nitrogen and phosphorous, results in generally undesirable shifts in the number of species in ecosystems and a reduction in ecological diversity. In water, it tends to increase algae growth, which can lead to lack of oxygen and therefore death of species such as fish. Our estimate of the impact cost of releases of nutrifying compounds is based on EPA’s cost-effectiveness analysis for the NPDES regulation on effluent discharges from concentrated animal feeding operations. That analysis estimated that costs up to $4.41 per Mg of nitrogen removed from wastewater effluents were economically advantageous (US EPA 2002, p. E-9).
2.e. The value of reductions in acidifying emissions (i.e., eSO2)
We base the value of acidification reductions at $661 per ton. This is the average of 2005 ($690), 2006 ($860) and 2007 ($433) spot prices in EPA's annual acid rain sulfur dioxide emissions permit allowances auction under the Clean Air Act.
3. Emissions Impacts of Recycling and Composting
This section details the impact of recycling and composting on pollutant emissions. First, we discuss the upstream environmental benefits of recycling. Next we outline the upstream and use phase benefits of composting. Then this section of our report covers the greenhouse gas
9 Pesticide wash-off may be higher in a hilly urban environment than in a flat agricultural field. To the extent that Kovach
relied on agricultural crop studies, his estimate of the cost to non-target plants and wildlife may underestimate the cost of
pesticide applications in an urban environment.

Materials Management Options for MA Solid Waste Master Plan Review Final Report
8
impacts of recycling, composting, and disposal collection, hauling and facility operations. Last, we cover the other pollution impacts besides climate change of recycling, composting and disposal facility operations.
Upstream recycling emissions estimates come from the Decision Support Tool (DST) developed for assessing the cost and environmental burdens of integrated solid waste management strategies by North Carolina State University (NCSU) in conjunction with Research Triangle Institute (RTI) and the US Environmental Protection Agency (US EPA).10 The Municipal Solid Waste Life-Cycle Database (Database), prepared by RTI with the support of US EPA during DST model development, provides estimates for environmental emissions from solid waste management practices.11 Upstream and use phase emissions estimates for composting are based on analyses and data discussed in Morris and Bagby (2008) and Morris et al (2007).
Waste material specific greenhouse gas emissions estimates for waste management activities are based on US EPA’s latest WARM (WAste Reduction Model) software and report.12 Estimates of other pollutant emissions are from the RTI/EPA/NCSU DST. The methodology for aggregating numerous emissions into impact categories is discussed in Morris (2005) and Morris and Bagby (2008).
3.a. The upstream pollution prevention benefits of recycling
Table 2, Estimated Upstream Emissions Reductions per Ton Recycled, shows the upstream emissions reductions that result when recycled materials are used in place of virgin raw materials to produce new products. For example, upstream reductions in greenhouse gases, shown as carbon dioxide equivalents (eCO2), range from 798 pounds per ton of glass recycled into new glass containers to 19,953 pounds per ton of aluminum cans recycled into new aluminum can sheet. As a second example, upstream reductions in emissions toxic to human health, shown as Toluene equivalents (eToluene), range from 367 pounds per ton of glass to 11,986 pounds per ton of aluminum cans.13
10 (RTI 1999a), (RTI 1999b), (Barlaz 2003a), and (Barlaz 2003b).
11 Both the DST and its Database are intended to be available for sale to the public by RTI. Contact Keith Weitz at
[email protected] for further information on public release dates for the DST and the Database.
12 See EPA (2006) for a detailed description of the data and methods that support the WARM model.
13 Upstream emissions estimates for human toxics and carcinogens and ecosystems toxics that are available for virgin- and
recycled-content steel production are limited to just three specific pollutants. This compares with scores of toxics and
carcinogenic pollutant emissions reported for other recycled materials. For this reason, we do not estimate upstream
impacts for tin can and ferrous scrap recycling.

Materials Management Options for MA Solid Waste Master Plan Review Final Report
9
Table 2
Estimated Upstream Emissions Reductions per Ton Recycled (pounds of emissions reductions per ton recycled)
Climate
Change
Human Health
- Particulates
Human Health
- Toxics
Human Health-
Carcinogens
Eutrophica-
tion Acidification
Ecosystems
Toxicity
(eCO2) (ePM2.5) (eToluene) (eBenzene) (eN) (eSO2) (e2,4-D)
Recycled Materials
Newspaper 7,630.4 4.5 2,849.8 0.9 -0.3 26.0 7.0
Cardboard 4,770.6 14.5 4,405.4 0.9 0.1 23.0 7.4
Mixed Paper 6,682.9 3.2 466.6 0.0 0.5 16.7 0.6Glass Containers 797.5 4.2 366.5 0.5 0.1 4.4 1.1
PET Containers 3,574.8 4.7 7,895.1 7.3 1.8 65.3 0.7
HDPE Containers 2,814.0 2.2 2,336.1 2.3 0.7 18.2 0.2
Other Plastic Containers* 2,814.0 2.2 2,336.1 2.3 0.7 18.2 0.2Plastic Film/Bags* 2,814.0 2.2 2,336.1 2.3 0.7 18.2 0.2
Aluminum Cans 19,953.0 37.9 11,986.4 5.8 2.9 222.0 78.4
Tin Cans 2,098.3 6.1 0.1 4.8
Other Ferrous 2,098.3 6.1 0.1 4.8
*Emissions for other containers, film and bags are assumed to be the same as for HDPE containers.
Upstream pollutant emissions reductions tend to be highly correlated with upstream energy savings engendered by recycling. This correlation is due to the pollution intensive nature of most energy sources. Figure 2, Comparative Energy Usage for Virgin- vs. Recycled-Content Products, provides a graphical display of upstream energy savings from closed-loop recycling.14
Figure 2
Comparative Energy Usage for Virgin- vs. Recycled-Content Products
0
60
120
180
Aluminum
Sheet
PET Pellets HDPE
Pellets
Newsprint Cardboard Steel Bar Glass
Containers
Millio
n B
tus P
er
To
n . Additional Energy for
Virgin-ContentRecycled-Content
14 Figure 2 is based on EPA, NCSU and RTI (2003), Morris (1996), and Morris (2005).

Materials Management Options for MA Solid Waste Master Plan Review Final Report
10
We can use the close correlation between upstream energy usage and upstream environmental impacts to provide perspective on the positive upstream environmental benefits of recycling compared with recycling’s collection, processing and hauling impacts.
Figure 3, Total Life Cycle Energy Usage per Ton Collected – Curbside Recycling Versus Landfill Disposal with Landfill Gas Energy Recovery, shows energy usage over the life cycle of the typical ton of materials collected curbside for recycling. The bars in the graph compare energy usage for recycling a ton of curbside materials against energy usage when a ton of curbside recyclables is thrown in the garbage and sent to a landfill where landfill gases are collected and used to generate electricity.15
Figure 3 shows that manufacturing products using a ton of curbside recycled materials requires 10.4 million Btus. Collecting, processing and hauling those recycled materials to the manufacturers requires an additional 0.9 million Btus. Total energy used is 11.3 million Btus per ton recycled.
By contrast, manufacturing products using virgin raw materials uses 23.3 million Btus to extract raw materials, refine those resources into manufacturing feedstocks, and use the feedstocks to produce the same basket of goods that the recycled materials produce. Garbage collection, transfer and landfilling uses 0.8 million Btus, while the energy recovered from the landfill gases produced when the ton of recyclables decomposes anaerobically is 1.7 million Btus. This is a net usage of 22.4 million Btus per ton collected for the landfill disposal life cycle, nearly double the energy usage of the recycling life cycle.
15 See Morris (2005) for derivation of this figure.

Materials Management Options for MA Solid Waste Master Plan Review Final Report
11
Figure 3
Total Life Cycle Energy Usage per Ton Collected Curbside Recycling Versus Landfill Disposal with Landfill Gas Energy Recovery
Besides the substantial energy conservation from recycling, the other conclusion to note from Figure 3 is that the 0.9 million Btus of energy used to collect and process a ton of curbside recyclables and then haul that processed material to market is an order of magnitude smaller than the 12.0 million Btus conserved by producing products from recycled materials rather than virgin resources. Also, the energy required to handle a ton of curbside recyclables is only about 12% larger than the energy needed to collect and landfill a ton of garbage.
The same sort of relationships between the upstream impacts of the recycling versus disposal life cycles, and between upstream versus collection/processing/hauling stages for recycling’s life cycle that hold for energy usage also turn out to be true for climate change, human health, acidification, eutrophication and ecosystems toxicity impacts. The exact relationships vary by impact category. However, the two generalizations holds:
• Recycling beats disposal by a substantial margin for all types of environmental impacts, and,
• The environmental costs of recycling trucks and processing facilities are very small compared with recycling’s upstream environmental benefits.
-25.0
-20.0
-15.0
-10.0
-5.0
0.0
5.0
10.0
15.0
20.0
25.0
Curbside
Recycling Life
Cycle Energy
Detail
Net Curbside
Recycling Life
Cycle Energy
Usage
Landfill
Disposal Life
Cycle Energy
Detail
Net Landfill
Disposal Life
Cycle Energy
Usage
Million B
tus P
er
Ton C
ollecte
d .
Net EnergyImpact
LFG EnergyRecoveryOffsetLandfilling
VirginContentMfg.Recycled
ContentMfg.Shipping
Processing
Collection
Recycling
with Closed
Loop
Recycled-
Content
Manufacturing
Discards Landfilling
with LFG Energy
Recovery

Materials Management Options for MA Solid Waste Master Plan Review Final Report
12
For example, recycled-content manufacturing produces 0.8 tons of carbon dioxide equivalents, while virgin-content manufacturing releases 3.3 tons, over four times as much eCO2. Recycling collection, processing, and hauling operations release 0.2 tons eCO2 per ton. In comparison, garbage collection and disposal operations release just over 1.0 tons eCO2 per ton.
3.b. Upstream and use phase pollution prevention benefits for composting
According to Morris and Bagby (2008) and other studies referenced there, compost produced from yard debris, food scraps and compostable paper and cardboard can substantially reduce use of pesticides and synthetic fertilizers on lawns and gardens. There are as yet no systematic empirical data on the average amount of pesticide and fertilizer use reductions associated with home lawn and garden compost applications. However, one can make a reasonable argument that compost use on lawns and gardens may be associated with a 50% or more reduction in pesticides and synthetic fertilizer use. For example, the home owner who purchases compost for application on his lawn or garden presumably makes that purchase as a substitute for synthetic fertilizers and synthetic fertilizer-herbicide products.
Table 3, Estimated Upstream and Use Phase Emissions Reductions per Ton Composted, shows the pollution that is prevented when production and use of pesticides and synthetic fertilizers on lawns and gardens is reduced by 50%. These reductions are engendered by homeowners switching to a more natural lawn and garden maintenance program as a result, in part, of their decision to use compost in place of synthetic fertilizers.16
Table 3
Estimated Upstream and Use Phase Emissions Reductions per Ton Composted (pounds of emissions reductions per ton composted)
Environmental Impact Indicator Pollutant Emissions Reduction
Climate Change eCO2 1,072.3 Human Health - Particulates ePM2.5 0.5
Human Health – Toxics eToluene 287.0 Human Health – Carcinogens eBenzene 0.3
Eutrophication eN 5.3 Acidification eSO2 2.3
Ecosystems Toxicity E2,4-D 4.9
16 Estimates of emissions from production and use of pesticides and synthetic fertilizers are based on Morris and Bagby
(2008), Morris et al (2007) and the CEI model, and the Carnegie Mellon Economic Input Output – Life Cycle Analysis
model described in Cicas et al (2006) and available on the Internet at www.eiolca.net.

Materials Management Options for MA Solid Waste Master Plan Review Final Report
13
3.c. Greenhouse gas(GHG) emissions from discards management
Table 4, Estimated Greenhouse Gas Emissions from Discards Management, shows the carbon dioxide equivalent emissions from collection, transfer, and landfill disposal of recyclable and compostable materials, as well as from collection and recycling or composting of those materials. Collection trucks and transfer, disposal, recycling and composting facility operations result in differing amounts of GHG emissions, depending on the types and energy intensity of equipment used for these different components of a solid waste management system. But the handling of different types of waste material on a collection truck or by equipment at a given type of facility tends to yield the same amount of greenhouse gas (GHG) emissions irrespective of material type.17 This is why the estimates for GHG emissions from recycling systems are the same across all recycled material types shown in Table 4. Also, as shown in Table 4, compostable materials all have the same GHG emissions when composted, and their GHG emissions are different than the GHG emissions for materials that are recycled.
However, materials have different decomposition characteristics in the landfill, causing differing amounts of carbon sequestration, methane generation, and energy recovery potential. This accounts for the differences in GHG emissions shown in the Disposal eCO2 Emissions column of Table 4. For example, disposal of yard debris and compostable paper/cardboard in a landfill that collects 75% of generated landfill gases and uses those gases to generate electricity actually decreases GHG emissions.18 For those materials the carbon sequestered in the landfill plus the electrical energy grid offset from the collected methane outweigh the climate change impact of the methane that is not captured by the landfill’s gas collection system.
Food scraps, on the other hand, generate more GHGs in the form of methane than the portion of their carbon sequestered in a landfill plus the greenhouse gas emissions avoided from energy generated by the collected methane. This makes food scraps a net GHG generator, even in landfills that are highly efficient at recovering energy from landfill gases.
Energy generated from landfill gases provides a GHG credit as a result of the emissions avoided that would otherwise be generated in electrical power plants that feed the electricity grid in the Northwest. Natural gas is the source of incremental energy on the Northwest grid, and the GHG emissions from this fossil fuel are avoided when electricity is generated from collected landfill gases.19
17 See EPA/NCSU/RTI (2003), EPA (2006), and RW Beck (2007) for data used to calculate the estimates shown in Table 4. 18 There is some disagreement regarding the efficiency of the typical landfill gas collection system and of the theoretical
limit to landfill gas capture possibilities. For example, see Anderson (2007). This comparison of carbon sequestration
versus fugitive methane emissions is based on 75% methane capture efficiency, the default value in EPA’s WARM model
for calculating GHG emissions from waste management systems. 19 RW Beck (2007).

Materials Management Options for MA Solid Waste Master Plan Review Final Report
14
The emissions from composting facility operations include a credit for carbon sequestered in soils where the compost is used. The estimate of soil carbon sequestration is from EPA’s WARM model, as discussed in EPA (2006). The carbon sequestration credit is larger than the CO2 emissions from collection and compost facility operations. This accounts for the negative values for composting emissions in the Composting eCO2 Emissions column of Table 4.
Table 4
Estimated Greenhouse Gas Emissions from Discards Management (pounds of carbon dioxide emissions per ton collected)
Disposal eCO2
Emissions
Recycling eCO2
Emissions
Composting eCO2
Emissions
Recycled Materials
Newspaper -2,482.4 210.5
Cardboard -736.3 210.5
Mixed Paper -914.2 210.5
Glass Containers 88.2 210.5
PET Plastic Containers 88.2 210.5
HDPE Plastic Containers 88.2 210.5
Other Plastic Containers 88.2 210.5
Plastic Film & Bags 88.2 210.5
Aluminum Cans 88.2 210.5
Tin-plated Steel Cans 88.2 210.5
Ferrous Scrap 88.2 210.5
Composted Materials
Yard Debris -1,083.9 -440.8
Food Scraps 540.9 -440.8
Paper & Cardboard -914.2 -440.8
3.d. Emissions other than GHGs from discards management
Table 5, Estimated Emissions Other Than GHGs from Discards Management, shows emissions for the other six environmental impact categories from collection, transfer, and landfill disposal of recyclable and compostable materials, as well as from collection and recycling or composting of those materials. Collection, transfer, and recycling or composting facility operations result in the same amount of emissions irrespective of material type. At this point in time available research does not distinguish emissions by material type for collection, transfer, recycling and composting facility operations.20
However, there are emissions associated with use of internal combustion engines to generate electricity from collected landfill gas. Table 5 includes these emissions in the
20 See EPA/NCSU/RTI (2003) for data used to calculate the estimates shown in Table 5.

Materials Management Options for MA Solid Waste Master Plan Review Final Report
15
column Disposal Emissions – Degradables, where degradables include paper, cardboard, yard debris and food scraps. These are the materials that generate landfill gases. The other column for disposal emissions in Table 5 reflects garbage collection, transfer and landfill operations for glass, metals and plastics – i.e., materials that do not degrade in the landfill.
Table 5
Estimated Emissions Other Than GHGs from Discards Management (pounds of emissions per ton managed)
Environmental Impact Indicator Pollutant
Disposal Emissions - Degradables
Disposal Emissions –
Non-Degradables
Recycling Emissions
Composting Emissions
Human Health – Particulates
ePM2.5 0.9 0.04 0.4 0.06
Human Health – Toxics eToluene 455.7 3.3 19.6 48.9 Human Health –
Carcinogens eBenzene 0.00008 0.0001 0.0004 0.0008
Eutrophication eN 0.1 0.09 0.03 0.2 Acidification eSO2 3.9 0.2 1.7 0.4
Ecosystems Toxicity E2,4-D 0.4 0.02 0.05 0.9
3.e. Summary of pollution prevention estimates for recycling and composting
Table 6 summarizes emissions reductions per ton recycled or composted by material type and impact category. The table indicates that aluminum can recycling has the highest environmental benefits across all environmental impact categories, except for carcinogenic impacts on human health where PET plastics recycling provides the top environmental benefit.
Rankings below the top spot vary depending on impact category. For example, mixed paper recycling has the second best climate change benefits, due to the high GHG reductions associated with recycling the high grade papers that are included in mixed paper collected from households. Cardboard is in second place for particulate and ecosystem toxics emissions reductions. Plastic PET containers are in second place for human toxics, eutrophication and acidification emissions reductions.
Among the composted materials shown in Table 6, food scraps provide the greatest climate change emissions reductions benefits. Neither the upstream emissions reduction benefits of composting, nor the non-GHG emissions from discards management for the composted materials, vary by material type. Thus, the emissions reductions for environmental impacts other than climate change are the same for all three composted materials.

Materials Management Options for MA Solid Waste Master Plan Review Final Report
16
Table 6
Estimated Emissions Reductions per Ton Recycled or Composted (pounds of emissions reductions per ton recycled or composted)
Climate
Change
Human Health
- Particulates
Human Health
- Toxics
Human Health-
Carcinogens
Eutrophica-
tion Acidification
Ecosystems
Toxicity
(eCO2) (ePM2.5) (eToluene) (eBenzene) (eN) (eSO2) (e2,4-D)
Recycled Materials
Newspaper 4,937.4 4.9 3,286.0 0.9 -0.2 28.2 7.3
Cardboard 3,823.8 15.0 4,841.5 0.9 0.2 25.2 7.7
Mixed Paper 5,558.2 3.6 902.8 0.0 0.6 18.9 0.9
Glass Containers 675.2 3.8 350.2 0.5 0.1 2.9 1.1
PET Containers 3,452.5 4.3 7,878.8 7.3 1.8 63.8 0.7
HDPE Containers 2,691.6 1.8 2,319.9 2.3 0.7 16.7 0.2
Other Plastic Containers* 2,691.6 1.8 2,319.9 2.3 0.7 16.7 0.2
Plastic Film/Bags* 2,691.6 1.8 2,319.9 2.3 0.7 16.7 0.2
Aluminum Cans 19,830.7 37.5 11,970.2 5.8 2.9 220.4 78.4
Tin Cans 1,975.9 5.7 0.2 3.3
Other Ferrous 1,975.9 5.7 0.2 3.3
Composted Materials
Yard Debris 429.1 1.3 739.1 0.3 5.2 5.8 4.5
Food Scraps 2,053.9 1.3 739.1 0.3 5.2 5.8 4.5
Compostable Paper 598.9 1.3 739.1 0.3 5.2 5.8 4.5
Pounds of Emissions Reductions/(Increase) Per Ton Recycled/Composted
*Emissions for other containers, film and bags are assumed to be the same as for HDPE containers.
Materials Management Options for MA Solid Waste Master Plan Review Final Report
17
4. References
Anderson, Peter N. (2007), Comments to the California Air Resources Board on Landfills’ Responsibility for Anthropogenic Greenhouse Gases and the Appropriate Response to Thos Facts. Center for a Competitive Waste Industry, St. Paul, MN.
Bare, Jane C. (2002), Developing a Consistent Decision-Making Framework by Using the U.S. EPA's TRACI, U.S. Environmental Protection Agency, Cincinnati, OH.
Bare, Jane C., Gregory A. Norris, David W. Pennington and Thomas McKone (2003), TRACI: The Tool for the Reduction and Assessment of Chemical and Other Environmental Impacts. Journal of Industrial Ecology 6(3-4): 49-78.
Barlaz M et al (2003a): Comparing Recycling, Composting and Landfills. BioCycle 44, 9, 60-66.
Barlaz M et al (2003b): Evaluating Environmental Impacts of Solid Waste Management Alternatives. BioCycle 44, 10, 52-56.
Cicas, Gyorgyi, H.S. Matthews, and C. Hendrickson (2006), The 1997 Benchmark Version of the Economic Input-Output Life Cycle Assessment (EIO-LCA) Model, Green Design Institute, Carnegie Mellon University, Pittsburgh, PA.
Eastern Research Group (2006), Draft Report: Cost Benefit Analysis for Six "Pure" Methods for Managing Leftover Latex Paint - Data, Assumptions and Methods. Prepared for the Paint Product Stewardship Initiative.
EPA, North Carolina State University, and Research Triangle Institute (2003). Municipal Solid Waste Life-Cycle Database for the Decision Support Tool on Municipal Solid Waste Management. Research Triangle Park, NC.
EPA (2006), Solid Waste Management and Greenhouse Gases – A Life-Cycle Assessment of Emissions and Sinks, 3rd edition, Environmental Protection Agency, Washington, D.C.
Kovach J, Petzoldt C, Degni J, Tette J (1992): A Method to Measure the Environmental Impact of Pesticides. Integrated Pest Management Program Cornell University, New York State Agricultural Experimentation Station, Geneva, NY (Available through Online Publications of the New York State IPM Program at http://www.nysipm.cornell.edu/publications ).
Morawski, Clarissa, The New “Eco-Currency”: New model monetizes environmental benefits and reveals new cost savings in waste diversion, Solid Waste & Recycling, December/January 2008.
Morris, Jeffrey (1996), Recycling versus incineration: an energy conservation analysis. Journal of Hazardous Materials 47 277-293.

Materials Management Options for MA Solid Waste Master Plan Review Final Report
18
Morris, Jeffrey (2005), Comparative LCAs for Curbside Recycling Versus Either Landfilling or Incineration with Energy Recovery. International Journal of Life Cycle Assessment 10(4) 273-284.
Morris, Jeffrey, H. Scott Matthews, Frank Ackerman, Michelle Morris and Rock Hlavka (2007), The Washington State Consumer Environmental Index (CEI) – A Summary of the Development of a Tool to Understand and Support Consumer Choices That Have Preferable Environmental Outcomes. Prepared for the Washington State Department of Ecology, July 31, 2007.
Morris, Jeffrey, and Jennifer Bagby (2008). Measuring Environmental Value for Natural Lawn and Garden Care Practices. International Journal of Life Cycle Assessment, 13(3) 226-234.
Research Triangle Institute (1999a), A Decision Support Tool for Assessing the Cost and Environmental Performance of Integrated Municipal Solid Waste Management Strategies: Users Manual, Draft EPA/xxx-R-99-xxx.
Research Triangle Institute (1999b), Application of Life-Cycle Management to Evaluate Integrated Municipal Solid Waste Management Strategies, Draft EPA/xxx-R-99-xxx.
Rice, Glenn, and James K. Hammitt (2005): Economic Valuation of Human Health Benefits of Controlling Mercury Emissions from U.S. Coal-Fired Power Plants. Prepared for Northeast States Coordinated Air Use Management (NESCAUM) by the Harvard Center for Risk Analysis, Boston, MA
RW Beck (2007), Comparative Evaluation of Waste Export and Conversion Technologies Disposal Options – Internal Draft. Prepared for King County Department of Natural Resources and Parks Solid Waste Division, May 2007.
Stern, Nicholas (2007). The Economics of Climate Change: The Stern Review, Cambridge University Press, Cambridge, England and New York, NY.
US Environmental Protection Agency, Office of Research and Development (2002): Economic Analysis of the Final Revisions to the National Pollutant Discharge Elimination System Regulation and the Effluent Guidelines for Concentrated Animal Feeding Operations. EPA-812-R-03-002, December 2002, Washington, DC.
Weber, Christopher L., and H. Scott Matthews (2007). Embodied environmental emissions in U.S. international trade. Environmental Science and Technology, forthcoming.

Materials Management Options for MA Solid Waste Master Plan Review Final Report
APPENDIX 3
Detailed Modeling Results


Materials Management Options for MA Solid Waste Master Plan Review Final Report
1
Figure A-1
Figure A-2

Materials Management Options for MA Solid Waste Master Plan Review Final Report
2
Figure A-3
Figure A-4
Figure A-5

Materials Management Options for MA Solid Waste Master Plan Review Final Report
3
Figure A-6
Figure A-7

Materials Management Options for MA Solid Waste Master Plan Review Final Report
4
Figure A-8
Figure A-9

Materials Management Options for MA Solid Waste Master Plan Review Final Report
5
Figure A-10
Figure A-11

Materials Management Options for MA Solid Waste Master Plan Review Final Report
6
Figure A-12
Figure A-13

Materials Management Options for MA Solid Waste Master Plan Review Final Report
7
Figure A-14
Figure A-15

Materials Management Options for MA Solid Waste Master Plan Review Final Report
8
Figure A-16
Figure A-17

Materials Management Options for MA Solid Waste Master Plan Review Final Report
9
Figure A-18

Materials Management Options for MA Solid Waste Master Plan Review Final Report
10
Figure A-19
Figure A-20

Materials Management Options for MA Solid Waste Master Plan Review Final Report
11
Figure A-21
Figure A-22

Materials Management Options for MA Solid Waste Master Plan Review Final Report
12
Figure A-23
Figure A-24
Figure A-25

Materials Management Options for MA Solid Waste Master Plan Review Final Report
13
Figure A-26
Figure A-27

Materials Management Options for MA Solid Waste Master Plan Review Final Report
14
Figure A-28
Figure A-29

Materials Management Options for MA Solid Waste Master Plan Review Final Report
15
Figure A-30


Materials Management Options for MA Solid Waste Master Plan Review Final Repor
APPENDIX 4
References


Materials Management Options for MA Solid Waste Master Plan Review Final Report
1
Works Cited in Literature Review
AEA Technology. Waste Management Options and Climate Change: Final Report to the
European Commission. 2000.
Alternative Resources, Inc., conducted for Los Angeles County. Conversion Technology
Evaluation Report, Phase II Assessments. Concord, Mass.: October 2007.
California Integrated Waste Management Board. Draft Conversion Technologies Report
to the Legislature. 2005.
www.ciwmb.ca.gov/organics/Conversion/Events/CTWorkshop/DraftReport.pdf, accessed
May-June 2008.
City of Los Angeles, Bureau of Sanitation. Technical Study Documents: Anaerobic
Digestion (Spain),
http://www.lacity.org/san/solid_resources/strategic_programs/alternative_tech/PDF/Anae
robicDigestionFacility_Spain.pdf, accessed May-June 2008.
European Commission, Integrated Pollution Prevention & Control. Reference Document
on the Best Available Techniques for Waste Incineration – Executive Summary. 2006.
http://ec.europa.eu/environment/waste/studies/climate_change.pdf, accessed June 2008.
McKinnon-Rutherford, Kristen. Debunking the Myths of Incineration. 2007.
National Research Council. Waste Incineration and Public Health. Washington, D.C.:
National Academy Press, 2000.
R.W. Beck. Comparative Evaluation of Waste Export and Conversion Technologies
Disposal Options, Draft Report, prepared for King County, WA Department of Natural
Resources and Parks, May 2007.
RenoSam and Rambell. The Most Efficient Waste Management System in Europe: Waste
to Energy in Denmark. 2006.
Repa, Edward W., Ph.D., National Solids Waste Management Association. NSWMA’s
2005 Tip Fee Survey. NSWMA Research Bulletin 05-3, March 2005.
http://wastec.isproductions.net/webmodules/ webarticles/articlefiles/463-
Tipping%20Fee%20Bulletin%202005.pdf, accessed May-June 2008.
San Luis Obispo County. Comparison of Environmental Burdens: Recycling, Disposal
with Energy Recovery from Landfill Gases, and Disposal via Hypothetical Waste-to-
Energy Incineration, 2002.
URS Corporation. Evaluation of Alternative Solid Waste Processing Technologies,
conducted for the City of Los Angeles. September 2005.
Yield Renewable Energy Producers. http://yieldenergy.com/?paged=2, June 2008.

Materials Management Options for MA Solid Waste Master Plan Review Final Report
2
Zero Waste New Zealand Trust. Wasted Opportunities – A Closer Look at Landfilling &
Incineration. http://www.zerowaste.co.nz/default,33.sm, accessed May-June 2008.
Additional Sources
Alternative Resources, Inc., “Air Emissions from Existing Massachusetts Waste-to-
Energy Facilities Compared to Air Emissions from Advanced Thermal Conversion
Technologies,” memorandum dated January 14, 2008.
Bare, Jane C., Gregory A. Norris, David W. Pennington and Thomas McKone, TRACI:
The Tool for the Reduction and Assessment of Chemical and Other Environmental
Impacts. Journal of Industrial Ecology 6(3-4): 49-78. 2003
Bare, Jane C., Developing a Consistent Decision-Making Framework by Using the U.S.
EPA's TRACI, U.S. Environmental Protection Agency, Cincinnati, OH. 2002.
Binder, James, Alternative Resources, Inc., and Steven Torres, City of Taunton, MA,
“Evaluating Innovative Technology for Municipal Waste Management,” presented to the
NorthEast Waste Management Officials’ Association (NEWMOA), November 27, 2007. http://www.newmoa.org/solidwaste/cwm/webtraining/EvaluatingInnovativeTechnologyTaunton.
Blue Ridge Environmental Defense League (NC). Waste Gasification: Impacts on the
Environment and Public Health. 2002. http://www.bredl.org/wastegasification.pdf
California Department of Toxics Substances Control. CalTOX model description and
documentation. http://www.dtsc.ca.gov/AssessingRisk/caltox.cfm
Canadian Institute for Environmental Law and Policy. Ontario’s Waste Management
Challenge: Is Incineration an Option? 2007.
http://www.cielap.org/pub/pub_IncinerationOption.html
City & County of Honolulu News, City to Brief Council on Plasma Arc—Press Release,
2004. www.honolulu.gov/refs/csd/publiccom/honnews04/plasmaarcrecommendations.htm
Department for the Environment, Food, and Rural Affairs (United Kingdom). Advanced
Biological Treatment of Municipal Solid Waste. 2007.
http://www.defra.gov.uk/environment/waste/wip/newtech/pubs.htm
European Commission Integrated Pollution Prevention and Control. Reference
Document on the Best Available Techniques for Waste Incineration. 2006.
http://eippcb.jrc.es/pages/FActivities.htm
Friends of the Earth, United Kingdom, Dirty Truths: Incineration and Climate Change.
2006. http://www.foe.co.uk/resource/briefings/dirty_truths.pdf

Materials Management Options for MA Solid Waste Master Plan Review Final Report
3
Global Alliance for Incinerator Alternatives (GAIA). Burning Issues in Waste Disposal:
Incinerators in Disguise. 2006.
http://www.greenaction.org/incinerators/documents/GAIAPresentationIncineratorsInDisg
uise100907.pdf
Greenaction for Health and Environmental Justice and Global Alliance for Incinerator
Alternatives (GAIA). Incinerators in Disguise: Case Studies of Gasification, Pyrolysis,
and Plasma in Europe, Asia, and the United States. 2006.
http://www.greenaction.org/incinerators/documents/IncineratorsInDisguiseReportJune20
06.pdf
Greenaction for Health and Environmental Justice and Global Alliance for Incinerator
Alternatives (GAIA). Plasma Arc Technology for Municipal Solid Waste – Will
Florida’s Health and Environment Be Protected? 2008.
http://www.greenaction.org/incinerators/documents/GreenactionGAIAExposeOfFloridaP
lasmaArcIncineratorInDisguiseProposals030908.pdf
Hogg, Dominic, Eunomia Research, for European Commission, A Changing Climate for
Energy from Waste? Final Report to Friends of the Earth, 2006.
http://www.foe.co.uk/resource/reports/changing_climate.pdf
International Energy Agency (IEA) and Center for the Analysis & Dissemination of
Demonstrated Energy Technologies (CADDET), United Kingdom. Advance Thermal
Conversion Technologies for Energy from Solid Waste.
http://www.caddet.org/public/uploads/pdfs/Report/ar04.pdf
International Sustainable Solutions. The Alchemy of Incineration – from Waste to
Resource. 2005.
Larsen, Walker. How Green Was My Electricity? Designing Incentives to Co-optimize
Waste Management and Energy Development in New England. MIT, Department of
Urban Studies and Planning: Masters Thesis, June 2008.
Lippiatt, Barbara C., BEES 4.0 Building for Environmental and Economic Sustainability,
Technical Manual and User Guide, US Department of Commerce Technology
Administration, National Institute of Standards and Technology, Publication NISTIR
7423, May 2007.
Morawski, Clarissa. “Garbage In, Garbage Out.” Environment Watch (Durham, Ontario,
Canada: 2006).
www.durhamenvironmentwatch.org/Incinerator%20Files/GarbageInGarbageOut1.pdf
Morris, Jeffrey. “Notes about Recycling Markets.” Accessed at the Sound Resource
Management website: http://www.zerowaste.com/RecyclingMarkets.htm, June 2008.
Morris, Jeffrey. ”Comparative LCAs for curbside recycling versus either landfilling or
incineration with energy recovery,” International Journal of Life Cycle Assessment, Vol.
10, No. 4, July 2005, pp. 273-284.

Materials Management Options for MA Solid Waste Master Plan Review Final Report
4
Morris, Jeffrey. “Recycling versus incineration: An energy conservation analysis,”
Journal of Hazardous Materials, Vol. 47, Issues 1-3 (Special Issue on Energy-from-
Waste), May 1996, pp. 277-293.
Moy, Pearl. A Health Risk Comparison of Landfill Disposal and Waste-to-Energy (WTE)
Treatment of Municipal Solid Wastes in New York City (NYC). Masters Thesis.
Columbia University, Waste-to-Energy Research and Technology Council. 2005.
http://www.seas.columbia.edu/earth/wtert/sofos/Moy_ms_thesis.pdf
Murray, Robin, Greenpeace Environmental Trust, United Kingdom. Zero Waste. 2002. http://www.greenpeace.org.uk/files/pdfs/migrated/MultimediaFiles/Live/FullReport/4527.pdf
Pytlar, Theodore S., Jr., and Dvirka and Bartilucci, Consulting Engineers. Waste
Conversion Technologies: Emergence of a New Option or the Same Old Story?
Presentation to Federation of New York Solid Waste Associations, Solid Waste and
Recycling Conference. May 9, 2007. http://www.nyfederation.org/pdf2007/64_PytlarT.pdf
Research Triangle Institute et al. (National Renewable Energy Laboratory, HFH
Consultants, University of California). Draft Conversion Technologies Report to the
Legislature, Prepared for the California Integrated Waste Management Board (CIWMB).
2005. www.ciwmb.ca.gov/organics/Conversion/Events/CTWorkshop/DraftReport.pdf
Research Triangle Institute (1999a), “A Decision Support Tool for Assessing the Cost
and Environmental Performance of Integrated Municipal Solid Waste Management
Strategies: Users Manual,” Draft, U.S Environmental Protection Agency, 1999.
R.W. Beck, Inc. City of Honolulu Review of Plasma Arc Gasification and Vitrification
Technology for Waste Disposal. 2003.
http://www.envhonolulu.org/pdfs/solid_waste/arc/PlasmaArc.pdf
South Australia Government. Alternative Waste Technologies. 2006.
Tedder, Richard, Florida Department of Environmental Protection, Solid Waste Section.
Plasma Arc White Paper, Internal Briefing Document. 2007.
Tellus Institute. Waste Reduction Program Assessment and Analysis for Massachusetts,
prepared for Massachusetts Department of Environmental Protection, February 2003.
United States Environmental Protection Agency. Emission Facts, Metrics for Expressing
Greenhouse Gas Emissions: Carbon Equivalents and Carbon Dioxide Equivalents. 2005.
United States Environmental Protection Agency. Solid Waste Management and
Greenhouse Gases, A Life-Cycle Assessment of Emissions and Sinks. May 2002.
Weitz, Keith, RTI International. Waste Conversion Technologies Life Cycle Assessment,
presentation at Waste-to-Energy Research and Technology Council. Fall 2004.
Related Documents