FOCUS ISSUE: CARDIAC IMAGING State-of-the-Art Paper Assessment of Left Ventricular Function by Cardiac Ultrasound James D. Thomas, MD, Zoran B. Popovic ´, MD, PHD Cleveland, Ohio Our understanding of the physical underpinnings of the assessment of cardiac function is becoming increasingly sophisticated. Recent developments in cardiac ultrasound permit exploitation of many of these newer physical concepts with current echocardiographic machines. This review will first focus on the current approach to the assessment of cardiovascular hemodynamics by cardiac ultrasound. The next focus will be the assessment of global cardiac mechanics in systole and diastole. Finally, relationships between the cardiac structure and regional myocardial function, and the way regional function can be quantified by ultrasound, will be presented. This review also discusses the clinical impact of echocar- diography and its future directions and developments. (J Am Coll Cardiol 2006;48: 2012–25) © 2006 by the American College of Cardiology Foundation Our understanding of the physical underpinnings of the assessment of cardiac function is becoming increasingly sophisticated. Recent developments in cardiac ultrasound permit exploitation of many of newer physical concepts with current echocardiographic equipment. We will review the current approach to the assessment of cardiac function and hemodynamics by ultrasound, its clinical impact, and dis- cuss some of the future directions. Due to space limitations, we will not be able to discuss the relative role of echocar- diography versus other imaging modalities, except to note that, utilized to its fullest potential, it is the most cost- effective way of assessing overall ventricular and valvular function. Also, the incremental contribution of stress echo- cardiography will not be specifically discussed; however, the principles of the techniques discussed in this review are valid during and after exercise and pharmacologic stress, and can be applied in this arena. The reader is referred to a recent excellent review on the subject (1). CARDIAC HEMODYNAMICS We turn first to indexes of blood flow in the heart. Blood flow is governed by conservation of mass, momentum, and energy. Together these conservation laws form the basis for the echocardiographic assessment of cardiac hemodynamics. To understand the practical applications of quantitative echocardiographic methods, it is helpful to review the basis for these laws and how they relate to the empiric parameters of interest to cardiologists. Conservation of mass. Conservation of mass implies that blood can neither be created nor destroyed. Because blood is incompressible, it means that flow into any region of the heart must be matched by flow out of that region. A practical application is the continuity equation for measur- ing cardiac flow, stroke volume (SV), and cardiac output. For example, if we assume that velocity across the left ventricular outflow tract (LVOT) is constant, then instan- taneous cardiac output will be given by flow velocity (from pulsed wave [PW] Doppler) multiplied by LVOT area (2,3). Integrating the velocity throughout systole before multiplying it yields SV; multiplying SV by heart rate yields cardiac output. In practice, error may be introduced by the fact that the velocity profile across the LVOT is not flat (4) but tends to be skewed toward the septum, but even the simple calculation outlined here is reasonably accurate and should be applied routinely in clinical echocardiography to provide cardiac output. Semiautomated methods have been validated to integrate the color Doppler velocities across the LVOT to yield SV with fewer assumptions, but unfortu- nately these are not widely available (5). In the absence of shunts or regurgitation, the same SV should be obtained by measuring flow through any other structure of the heart as long as the velocity and area are measured at the same point. The tricuspid (6), pulmonary, and mitral annuli (7) are candidates for these measurements, although the LVOT is most reliable. If regurgitation or shunt flow is present, then any discrepancy in flow in different regions of the heart reflects the shunt (8,9) or regurgitant volume (RV) (10). All that is necessary is for one of the flows to reflect the net forward output of the heart. For example, if an atrial septal defect is present, LVOT SV might be 80 ml, whereas pulmonic SV might be 120 ml, in which case shunt volume would be 40 ml with a shunt fraction of 1.5:1. In the case of mitral regurgitation, mitral annular SV of 100 ml and LVOT SV of 60 ml indicate mitral RV of 40 ml. From the Department of Cardiovascular Medicine, The Cleveland Clinic Foun- dation, Cleveland, Ohio. Supported by grants from the National Institutes of Health (grant AG17479-02), the National Space Biomedical Research Institute through NASA NCC 9-58 (Houston, Texas), the Department of Defense (Ft. Dietrick, Maryland, USAMRMC grant No. 02360007), the National Institutes of Health, National Center for Research Resources, General Clinical Research Center (grant MO1 RR-018390), and by a National American Heart Association grant (0235172 N). Manuscript received March 2, 2006; revised manuscript received June 2, 2006, accepted June 19, 2006. Journal of the American College of Cardiology Vol. 48, No. 10, 2006 © 2006 by the American College of Cardiology Foundation ISSN 0735-1097/06/$32.00 Published by Elsevier Inc. doi:10.1016/j.jacc.2006.06.071

Welcome message from author
This document is posted to help you gain knowledge. Please leave a comment to let me know what you think about it! Share it to your friends and learn new things together.
Transcript
F
AFJC
Oaspcchcwdtefcpdbe
C
WfletTefo
d(NMNR
a
Journal of the American College of Cardiology Vol. 48, No. 10, 2006© 2006 by the American College of Cardiology Foundation ISSN 0735-1097/06/$32.00P
OCUS ISSUE: CARDIAC IMAGING State-of-the-Art Paper
ssessment of Left Ventricularunction by Cardiac Ultrasound
ames D. Thomas, MD, Zoran B. Popovic, MD, PHDleveland, Ohio
Our understanding of the physical underpinnings of the assessment of cardiac function isbecoming increasingly sophisticated. Recent developments in cardiac ultrasound permitexploitation of many of these newer physical concepts with current echocardiographicmachines. This review will first focus on the current approach to the assessment ofcardiovascular hemodynamics by cardiac ultrasound. The next focus will be the assessment ofglobal cardiac mechanics in systole and diastole. Finally, relationships between the cardiacstructure and regional myocardial function, and the way regional function can be quantifiedby ultrasound, will be presented. This review also discusses the clinical impact of echocar-diography and its future directions and developments. (J Am Coll Cardiol 2006;48:
ublished by Elsevier Inc. doi:10.1016/j.jacc.2006.06.071
2012–25) © 2006 by the American College of Cardiology Foundation
CbihpiFvtp(mcfbsspvLn
ssmmaflo(ndpwm
ur understanding of the physical underpinnings of thessessment of cardiac function is becoming increasinglyophisticated. Recent developments in cardiac ultrasoundermit exploitation of many of newer physical concepts withurrent echocardiographic equipment. We will review theurrent approach to the assessment of cardiac function andemodynamics by ultrasound, its clinical impact, and dis-uss some of the future directions. Due to space limitations,e will not be able to discuss the relative role of echocar-iography versus other imaging modalities, except to notehat, utilized to its fullest potential, it is the most cost-ffective way of assessing overall ventricular and valvularunction. Also, the incremental contribution of stress echo-ardiography will not be specifically discussed; however, therinciples of the techniques discussed in this review are validuring and after exercise and pharmacologic stress, and cane applied in this arena. The reader is referred to a recentxcellent review on the subject (1).
ARDIAC HEMODYNAMICS
e turn first to indexes of blood flow in the heart. Bloodow is governed by conservation of mass, momentum, andnergy. Together these conservation laws form the basis forhe echocardiographic assessment of cardiac hemodynamics.o understand the practical applications of quantitative
chocardiographic methods, it is helpful to review the basisor these laws and how they relate to the empiric parametersf interest to cardiologists.
From the Department of Cardiovascular Medicine, The Cleveland Clinic Foun-ation, Cleveland, Ohio. Supported by grants from the National Institutes of Healthgrant AG17479-02), the National Space Biomedical Research Institute throughASA NCC 9-58 (Houston, Texas), the Department of Defense (Ft. Dietrick,aryland, USAMRMC grant No. 02360007), the National Institutes of Health,ational Center for Research Resources, General Clinical Research Center (grant MO1R-018390), and by a National American Heart Association grant (0235172 N).
SManuscript received March 2, 2006; revised manuscript received June 2, 2006,
ccepted June 19, 2006.
onservation of mass. Conservation of mass implies thatlood can neither be created nor destroyed. Because blood isncompressible, it means that flow into any region of theeart must be matched by flow out of that region. Aractical application is the continuity equation for measur-ng cardiac flow, stroke volume (SV), and cardiac output.or example, if we assume that velocity across the leftentricular outflow tract (LVOT) is constant, then instan-aneous cardiac output will be given by flow velocity (fromulsed wave [PW] Doppler) multiplied by LVOT area2,3). Integrating the velocity throughout systole beforeultiplying it yields SV; multiplying SV by heart rate yields
ardiac output. In practice, error may be introduced by theact that the velocity profile across the LVOT is not flat (4)ut tends to be skewed toward the septum, but even theimple calculation outlined here is reasonably accurate andhould be applied routinely in clinical echocardiography torovide cardiac output. Semiautomated methods have beenalidated to integrate the color Doppler velocities across theVOT to yield SV with fewer assumptions, but unfortu-ately these are not widely available (5).In the absence of shunts or regurgitation, the same SV
hould be obtained by measuring flow through any othertructure of the heart as long as the velocity and area areeasured at the same point. The tricuspid (6), pulmonary, anditral annuli (7) are candidates for these measurements,
lthough the LVOT is most reliable. If regurgitation or shuntow is present, then any discrepancy in flow in different regionsf the heart reflects the shunt (8,9) or regurgitant volume (RV)10). All that is necessary is for one of the flows to reflect theet forward output of the heart. For example, if an atrial septalefect is present, LVOT SV might be 80 ml, whereasulmonic SV might be 120 ml, in which case shunt volumeould be 40 ml with a shunt fraction of 1.5:1. In the case ofitral regurgitation, mitral annular SV of 100 ml and LVOT
V of 60 ml indicate mitral RV of 40 ml.
soeedm
casQtDvttormr
p4
dlothrCistmbpnwiclpeapftlpoaqe
Fru
2013JACC Vol. 48, No. 10, 2006 Thomas and PopovicNovember 21, 2006:2012–25 LV Function by Cardiac Ultrasound
Measurement of left and right heart SV is currentlytandard clinical method to quantitate shunts. Measurementf RV is less used because it is more prone to measurementrrors, particularly because 2 large SVs are subtracted fromach other to yield a much smaller RV; this promptedevelopment of more direct approaches, such as the proxi-al convergence method.The proximal convergence method is also based on
onservation of mass. It states that all flow passing throughregurgitant valve approaches it as a series of concentric
hells of decreasing surface area and increasing velocity (11).uantifying flow through any such shell (most conveniently
he contour identified by velocity aliasing in the coloroppler display) yields the instantaneous flow through the
alve. Assuming this contour to be hemispheric in shape,hen flow Q through a contour of velocity va at radius r fromhe regurgitant orifice is 2�r2va. If the velocity through thatrifice at that instant is v0, then the important parameteregurgitant orifice area (ROA) is given by Q/v0 (12). Foritral regurgitation, this can be simplified by assuming a
egurgitant velocity of 5 m/s (reflecting a ventriculoatrial
igure 1. Principle of the conservation of mass. Instantaneous flow thro
Abbreviations and AcronymsDTI � Doppler tissue imagingEF � ejection fractionLV � left ventricle/ventricularLVOT � left ventricular outflow tractPW � pulsed waveROA � regurgitant orifice areaRV � regurgitant volumeSTI � speckle tracking imagingSV � stroke volume2(3)D � 2(3)-dimensional
egurgitation flow rate occurring through this insufficient mitral valve. To the rignderestimates the true amount of regurgitation.
ressure difference of 100 mm Hg). If aliasing velocity is set to0 cm/s, then ROA will be given simply by r2/2 (13) (Fig. 1).
In practice, the shape of proximal convergence shell mayeviate from a hemispheric one, especially during states of
ow flow (14), distortion by adjacent walls (15), and irregularrifices. Also, when regurgitation is mild, an aliasing con-our often may not be measurable, but this absence alone iselpful in reassuring one of the trivial magnitudes of theegurgitation.
onservation of energy. Energy exists in many formsnside the heart: pressure, kinetic energy of blood flow, theound of murmurs, and so on. Conservation of energy stateshat the total energy within a closed system (like the heart)ust be a constant. In practical terms, we can use the
alance between kinetic (i.e., velocity) and potential (i.e.,ressure) energy to estimate the pressure drop across ste-otic valves and other restrictive orifices. The kinetic energyithin a sample volume is given by 1/2�v2. As blood moves
nto a stenotic valve, the velocity must increase (by theontinuity equation), and as the kinetic energy increases, theocal pressure must fall. In its full form, this balance betweenotential and kinetic energy is the complete Bernoulliquation with multiple complex terms, but for flow through
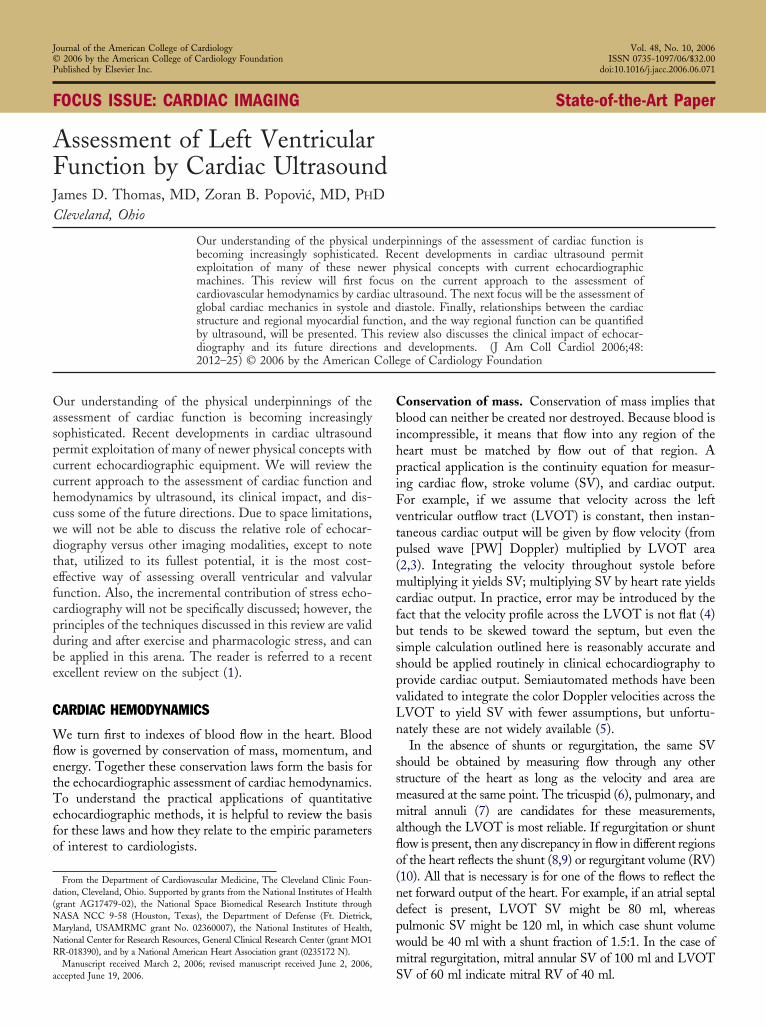
restrictive orifice with velocity measured in m/s, theressure drop in mm Hg will be given by the simplifiedormula, �p � 4v2 (16) (Fig. 2). There are many caveats tohe simplified Bernoulli equation: 1) it does not apply toong tunnel-like stenoses where viscosity contributes to theressure drop (17); 2) it does not apply to non-restrictiverifices because most of the pressure drop is used inccelerating the bulk of the blood through the valve and isuantified by the inertial term of the complete Bernoulliquation (18,19); and 3) it may overestimate the net
the shell outlined by the proximal isovelocity surface is identical to the
ugh ht, the same valve shows a highly asymmetric regurgitation jet whose area
ppistBnrotroCvmoBt�itFctipptt
C
Tbt
EffidtmcdoactpecmoLrifiedutavv2gvaA
F al arel
2014 Thomas and Popovic JACC Vol. 48, No. 10, 2006LV Function by Cardiac Ultrasound November 21, 2006:2012–25
ressure drop through bileaflet prosthetic valves, where theressure energy decrease as the kinetic energy rises is notrretrievably lost, but rather partially recovered as the flowmoothly decelerates out of the prosthesis (20). Despitehese limitations, it is remarkable how well the simplifiedernoulli equation works, having been validated for stenoticative valves, prosthetic valves, valvular regurgitation, andestrictive intracardiac shunts and likely is the single devel-pment that most propelled Doppler echocardiography intohe premiere cardiac imaging modality it is today. Cur-ently, it represents the gold standard for the measurementf valve stenoses (21).onservation of momentum. If we consider flow with
elocity v through an orifice with area A, conservation ofass in fluid terms really means conservation of mass flux,
r simply flow, Q � Av. The kinetic energy flux (used in theernoulli equation) then is given by 1/2�(Av)v2. There is a
hird conserved quantity, momentum, which flux is given by(Av)v. Though less familiar to cardiologists, momentum ismportant, because it is the physical entity that best predictshe size of a regurgitant jet on color Doppler imaging (22).rom its definition, it is clear that even if jet flow remainsonstant, increasing the velocity of the jet (as by increasinghe driving pressure) will increase apparent jet size, explain-ng the importance of knowing blood pressure when inter-reting color Doppler images. Though it is theoreticallyossible to quantify the momentum across a jet cross sectiono characterize its severity (23), this is limited in practice byhe presence of high velocity turbulence within the jet.
ARDIAC MECHANICS
he echocardiographic assessment of cardiac mechanics cane divided into methods that quantify global function and
igure 2. Principle of the conservation of energy. Decrease of cross-sectioneads to a pressure decrease distal to the stenosis.
hose that assess regional contractility. i
chocardiographic assessment of global LV chamberunction: ejection fraction (EF), contractility, relaxation,lling, and end-diastolic pressure. In contrast to the fluidynamics of blood motion around the cardiovascular system,he structural mechanics principles that apply to the assess-ent of systolic and diastolic chamber function are more
omplex. Thus, one of the biggest challenges is simplyeciding how best to quantify cardiac function. From anperational point of view, adequate cardiac function is thebility of the heart to fill at a low enough pressure not toause pulmonary congestion, then deliver a sufficient quan-ity of blood to the vasculature at a high enough pressure toerfuse the tissue, and to augment this performance duringxercise. Unfortunately, there is no measurable quantity thatorresponds to this integrated functional assessment, so weust use surrogates that approximate one or another aspect
f cardiac function.V volumes and EF. The most common functional sur-
ogate is LVEF, the percentage of chamber volume ejectedn systole, which is well measured by echocardiography. Therst step in calculating LVEF is correct visualization ofndocardial borders. Although in most cases this can beone by standard approach, it is sometimes necessary to useltrasound contrast for LV opacification; this is especiallyrue in the morbidly obese, in the presence of apical masses,nd during stress echocardiography (24). To obtain LVolumes and EF, one can use formulae that have beenalidated for M-mode measurements and single and biplane-dimensional (2D) assessments, but these are based oneometric assumptions and so work best in symmetricentricles (25–27). Methods have been developed for moreutomated estimation of EF from 2D echocardiograms.coustic quantification analyzes the intensity of the return-
a (as seen in aortic stenosis) leads to increase in velocity. Velocity increase
ng ultrasound signal to separate the ventricle into tissue and
brcCecartmocm
dparTww(3Feopsmfaaac
ecgthwvMpbeeosaCbfaBl
mvcwwnt
oettsbmpss
matee(spdtspmmhAfsni5teeewMltaoaes(4
2015JACC Vol. 48, No. 10, 2006 Thomas and PopovicNovember 21, 2006:2012–25 LV Function by Cardiac Ultrasound
lood and track LV area in real-time (28). By assumingotational symmetry, end-systolic and end-diastolic volumesan be estimated on a beat-by-beat basis, along with EF.olor kinesis extends this principle by tracking the LV
ndocardial contour frame-by-frame, allowing the timeourse of filling and ejection to be displayed (29). However,lthough these methods are very accurate in tracking theelative changes of LV volumes throughout cardiac cycle,he absolute values still need to be calibrated (30). Foraximal accuracy, particularly with ventricular aneurysms or
ther asymmetric abnormalities, 3-dimensional (3D) echo-ardiography should be used, which has an accuracy rivalingagnetic resonance imaging (31,32).Currently, there are 3 broad approaches to 3D echocar-
iography. The first is 3D reconstruction from a set of 2Dlanes obtained by either rotating or tilting the transducer,method that is time consuming and requires stable heart
ate, but can be done with conventional 2D transducers.he second approach is real-time 3D echocardiography,hich uses an array of crystals to direct ultrasound anywhereithin a pyramid of space. Despite parallel processing
typically �16:1), this often requires combining data fromto 5 cardiac cycles to obtain a full 90° � 90° 3D pyramid.inally, much of the quantitative accuracy of full 3Dchocardiography can be obtained from transducers capablef simultaneously acquiring up to 3 rotationally arrangedlanes. An important technical issue involves the number oflices from which the ventricular volume (or mass) iseasured, ranging from 2 (33) to 12 (34), with accuracy
alling when the number of planes is �4 (35). Arguinggainst too many slices is the time and effort required fornalysis. Fortunately, software is emerging that can (semi)utomatically detect endocardial borders during a cardiacycle (34,36).
There is no current consensus on when to perform 3Dchocardiography in clinical practice, although the Ameri-an Society of Echocardiography is soon to release auidelines document. This is partly due to the rapid evolu-ion of this novel technology and the absence of a compre-ensive industry-wide format in which to store the data,hich would allow more options in post-processing andisualization. The Digital Imaging and Communications in
edicine committee is pursuing such a standard, butrogress has been slow. However, because data acquisition isrief, adding little to the cost or inconvenience of anxamination, a strong case can be made for using 3Dchocardiography to document serial changes in LV (or anyther chamber) volume, particularly for clinical scenariosuch as asymptomatic mitral and aortic regurgitation, andssessment of cardiac resynchronization therapy.ontractility. Although EF is universally used, it is limitedy its sensitivity to preload and afterload, exemplified by thealse reassurance of a high EF in severe mitral regurgitationnd the low, but reversible, EF with severe aortic stenosis.ecause of this, much effort is given to developing less
oad-dependent methods to measure true contractility, the a
ost accurate of which requires continuous acquisition ofentricular pressure and volume data during sudden preloadhange. From these data, several indexes can be calculated,ith end-systolic elastance (37) and preload recruitable strokeork being the most popular. Many studies have soughton-invasive echocardiographic estimates of these parametershat can be obtained without preload intervention.
Kass et al. (38) have suggested that LV power (a productf peak systolic flow and pressure), indexed to the square ofnd-diastolic volume, accurately estimates end-systolic elas-ance, although later work suggests that this type of correc-ion is inadequate (39,40). A more direct approach by theame group estimated end-systolic elastance from a singleeat using a complex combination of non-invasive measure-ents of blood pressures, diastolic and systolic LV volumes,
re-ejection and ejection times, and EF (41,42). A similaringle-beat estimate was developed for preload recruitabletroke work.
Several other groups used empirical approaches to esti-ate end-systolic elastance echocardiographically. For ex-
mple, we have shown that systolic velocity acceleration inhe LVOT (43) and systolic strain rate (44) correlate withnd-systolic elastance. Similarly, it has been shown that thearly systolic intraventricular pressure drop along the LVOT45) correlates with end-systolic elastance (for calculation,ee the following text). Another proposed contractilityarameter is myocardial performance index, obtained byividing the sum of isovolumic contraction and relaxationimes with ejection time. However, although studies havehown its clinical value (46), its usefulness as contractilityarameter is debatable (47). Similarly, a claim that isovolu-ic acceleration by Doppler tissue imaging (DTI) is a goodarker of end-systolic elastance (48) has recently been
eavily contested (49).ssessment of regional myocardial contraction. Regional
unction is commonly assessed by dividing the LV into 17egments (recently agreed to by the echocardiographic,uclear, and magnetic resonance communities) and assign-
ng a qualitative grade to each ranging from 1 (normal) to(aneurysmal) (50). This method had changed little from
he initial descriptions of wall motion abnormalities bychocardiography (51) and is observer-dependent. How-ver, novel insights into myocardial structure and newchocardiographic modalities may dramatically change theay we assess regional function.yocardial structure and myocyte shortening. Myocytes
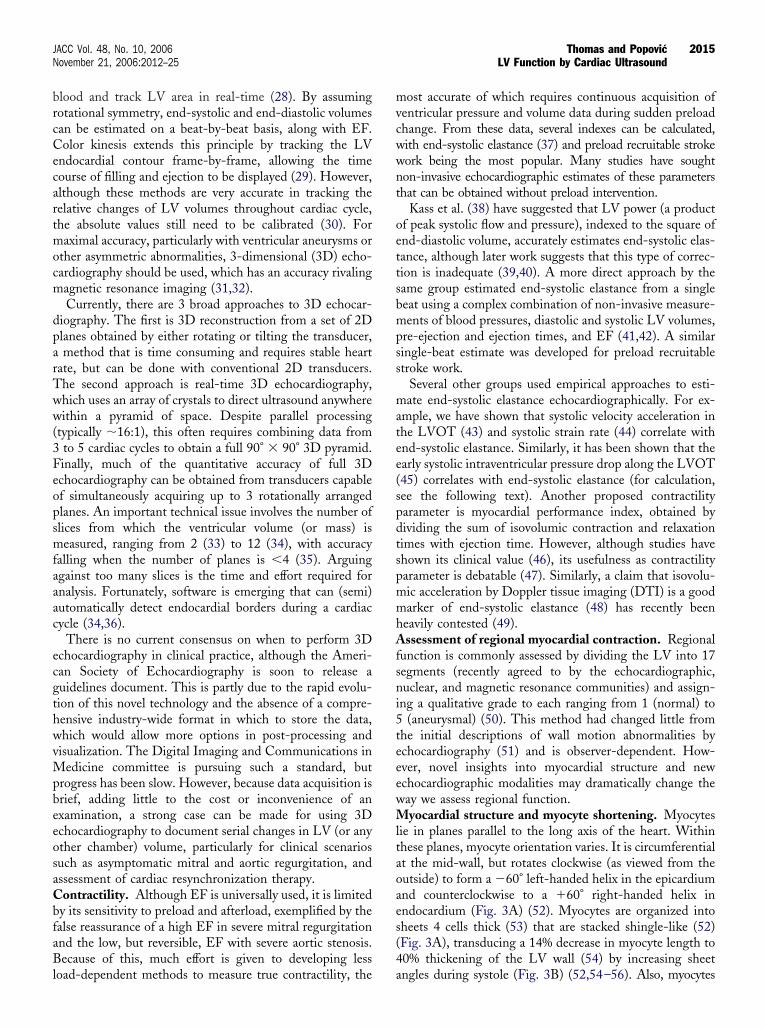
ie in planes parallel to the long axis of the heart. Withinhese planes, myocyte orientation varies. It is circumferentialt the mid-wall, but rotates clockwise (as viewed from theutside) to form a �60° left-handed helix in the epicardiumnd counterclockwise to a �60° right-handed helix inndocardium (Fig. 3A) (52). Myocytes are organized intoheets 4 cells thick (53) that are stacked shingle-like (52)Fig. 3A), transducing a 14% decrease in myocyte length to0% thickening of the LV wall (54) by increasing sheet
ngles during systole (Fig. 3B) (52,54–56). Also, myocytes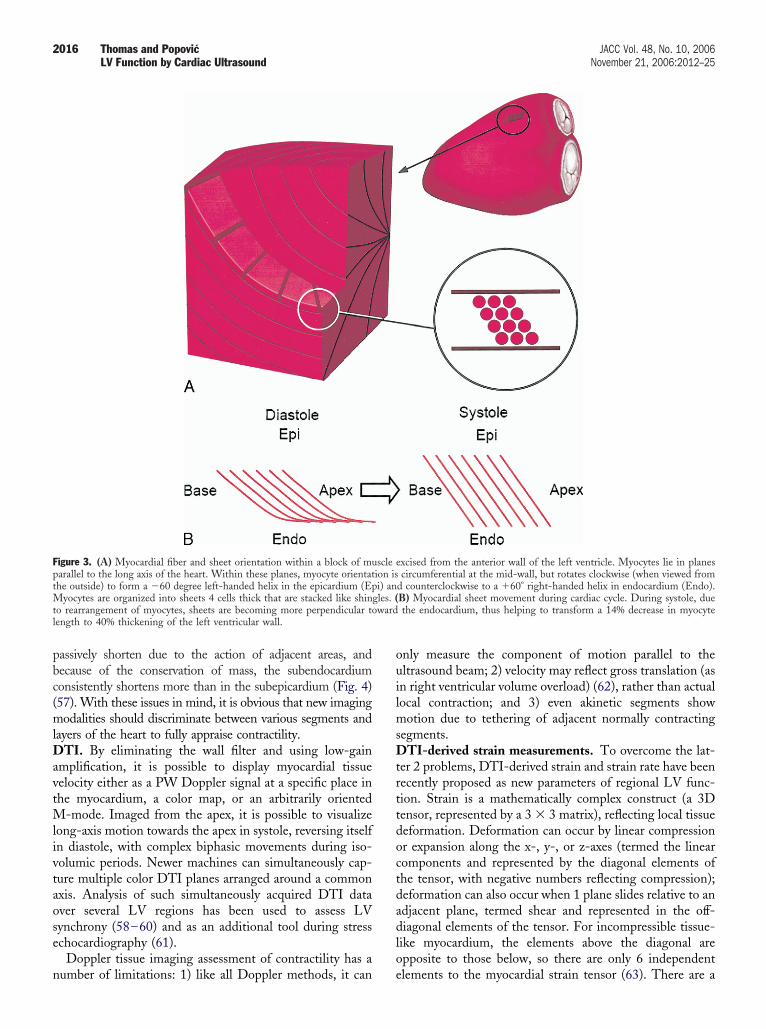
pbc(mlDavtMlivtaose
n
ouilmsDtrttdoctdadlo
FptMt wardl
2016 Thomas and Popovic JACC Vol. 48, No. 10, 2006LV Function by Cardiac Ultrasound November 21, 2006:2012–25
assively shorten due to the action of adjacent areas, andecause of the conservation of mass, the subendocardiumonsistently shortens more than in the subepicardium (Fig. 4)57). With these issues in mind, it is obvious that new imagingodalities should discriminate between various segments and
ayers of the heart to fully appraise contractility.TI. By eliminating the wall filter and using low-gain
mplification, it is possible to display myocardial tissueelocity either as a PW Doppler signal at a specific place inhe myocardium, a color map, or an arbitrarily oriented
-mode. Imaged from the apex, it is possible to visualizeong-axis motion towards the apex in systole, reversing itselfn diastole, with complex biphasic movements during iso-olumic periods. Newer machines can simultaneously cap-ure multiple color DTI planes arranged around a commonxis. Analysis of such simultaneously acquired DTI dataver several LV regions has been used to assess LVynchrony (58–60) and as an additional tool during stresschocardiography (61).
Doppler tissue imaging assessment of contractility has a
igure 3. (A) Myocardial fiber and sheet orientation within a block of muarallel to the long axis of the heart. Within these planes, myocyte orientathe outside) to form a �60 degree left-handed helix in the epicardium (Ep
yocytes are organized into sheets 4 cells thick that are stacked like shino rearrangement of myocytes, sheets are becoming more perpendicular toength to 40% thickening of the left ventricular wall.
umber of limitations: 1) like all Doppler methods, it can e
nly measure the component of motion parallel to theltrasound beam; 2) velocity may reflect gross translation (asn right ventricular volume overload) (62), rather than actualocal contraction; and 3) even akinetic segments show
otion due to tethering of adjacent normally contractingegments.
TI-derived strain measurements. To overcome the lat-er 2 problems, DTI-derived strain and strain rate have beenecently proposed as new parameters of regional LV func-ion. Strain is a mathematically complex construct (a 3Densor, represented by a 3 � 3 matrix), reflecting local tissueeformation. Deformation can occur by linear compressionr expansion along the x-, y-, or z-axes (termed the linearomponents and represented by the diagonal elements ofhe tensor, with negative numbers reflecting compression);eformation can also occur when 1 plane slides relative to andjacent plane, termed shear and represented in the off-iagonal elements of the tensor. For incompressible tissue-
ike myocardium, the elements above the diagonal arepposite to those below, so there are only 6 independent
xcised from the anterior wall of the left ventricle. Myocytes lie in planescircumferential at the mid-wall, but rotates clockwise (when viewed from
d counterclockwise to a �60° right-handed helix in endocardium (Endo).B) Myocardial sheet movement during cardiac cycle. During systole, duethe endocardium, thus helping to transform a 14% decrease in myocyte
scle eion isi) an
gles. (
lements to the myocardial strain tensor (63). There are a
mbc�o(tDvcrisobsu
hoidsi(dmsspsw
rsdSdDdctatsttmdiahsu
actsaAvtt
F ning (l .
2017JACC Vol. 48, No. 10, 2006 Thomas and PopovicNovember 21, 2006:2012–25 LV Function by Cardiac Ultrasound
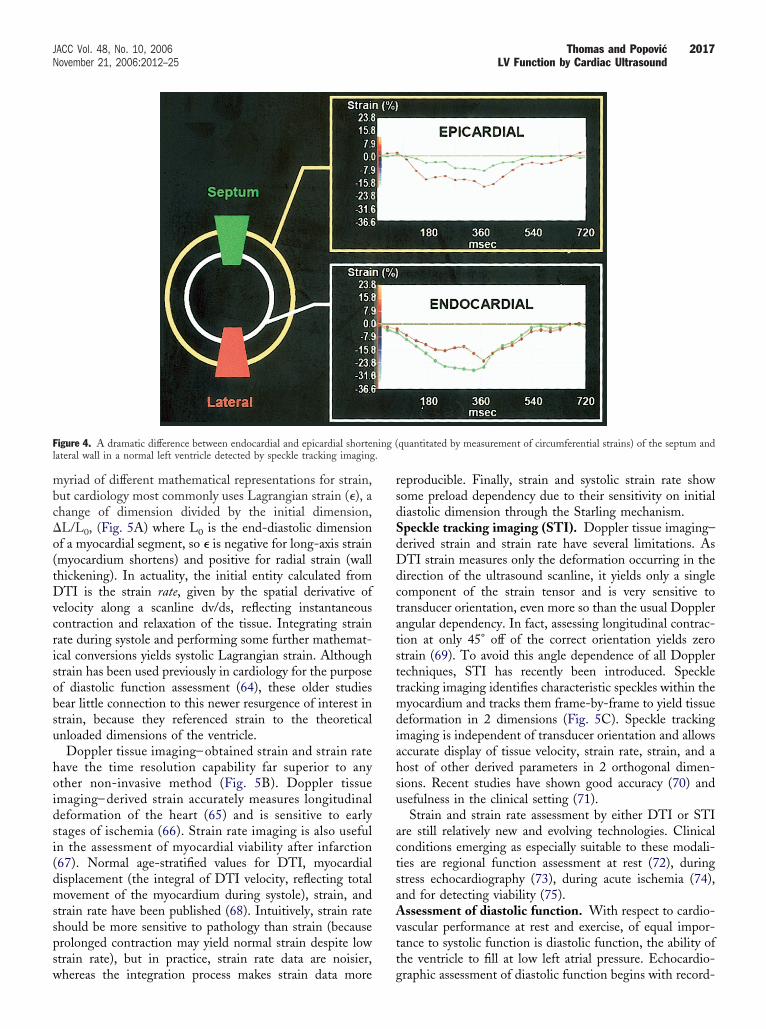
yriad of different mathematical representations for strain,ut cardiology most commonly uses Lagrangian strain (�), ahange of dimension divided by the initial dimension,L/L0, (Fig. 5A) where L0 is the end-diastolic dimensionf a myocardial segment, so � is negative for long-axis strainmyocardium shortens) and positive for radial strain (wallhickening). In actuality, the initial entity calculated fromTI is the strain rate, given by the spatial derivative of
elocity along a scanline dv/ds, reflecting instantaneousontraction and relaxation of the tissue. Integrating strainate during systole and performing some further mathemat-cal conversions yields systolic Lagrangian strain. Althoughtrain has been used previously in cardiology for the purposef diastolic function assessment (64), these older studiesear little connection to this newer resurgence of interest intrain, because they referenced strain to the theoreticalnloaded dimensions of the ventricle.Doppler tissue imaging– obtained strain and strain rate
ave the time resolution capability far superior to anyther non-invasive method (Fig. 5B). Doppler tissuemaging– derived strain accurately measures longitudinaleformation of the heart (65) and is sensitive to earlytages of ischemia (66). Strain rate imaging is also usefuln the assessment of myocardial viability after infarction67). Normal age-stratified values for DTI, myocardialisplacement (the integral of DTI velocity, reflecting totalovement of the myocardium during systole), strain, and
train rate have been published (68). Intuitively, strain ratehould be more sensitive to pathology than strain (becauserolonged contraction may yield normal strain despite lowtrain rate), but in practice, strain rate data are noisier,
igure 4. A dramatic difference between endocardial and epicardial shorteateral wall in a normal left ventricle detected by speckle tracking imaging
hereas the integration process makes strain data more g
eproducible. Finally, strain and systolic strain rate showome preload dependency due to their sensitivity on initialiastolic dimension through the Starling mechanism.peckle tracking imaging (STI). Doppler tissue imaging–erived strain and strain rate have several limitations. AsTI strain measures only the deformation occurring in the
irection of the ultrasound scanline, it yields only a singleomponent of the strain tensor and is very sensitive toransducer orientation, even more so than the usual Dopplerngular dependency. In fact, assessing longitudinal contrac-ion at only 45° off of the correct orientation yields zerotrain (69). To avoid this angle dependence of all Dopplerechniques, STI has recently been introduced. Speckleracking imaging identifies characteristic speckles within theyocardium and tracks them frame-by-frame to yield tissue
eformation in 2 dimensions (Fig. 5C). Speckle trackingmaging is independent of transducer orientation and allowsccurate display of tissue velocity, strain rate, strain, and aost of other derived parameters in 2 orthogonal dimen-ions. Recent studies have shown good accuracy (70) andsefulness in the clinical setting (71).Strain and strain rate assessment by either DTI or STI
re still relatively new and evolving technologies. Clinicalonditions emerging as especially suitable to these modali-ies are regional function assessment at rest (72), duringtress echocardiography (73), during acute ischemia (74),nd for detecting viability (75).ssessment of diastolic function. With respect to cardio-
ascular performance at rest and exercise, of equal impor-ance to systolic function is diastolic function, the ability ofhe ventricle to fill at low left atrial pressure. Echocardio-
quantitated by measurement of circumferential strains) of the septum and
raphic assessment of diastolic function begins with record-
imlhaacw
pnpnrmot
F( g (ST3
Fa
2018 Thomas and Popovic JACC Vol. 48, No. 10, 2006LV Function by Cardiac Ultrasound November 21, 2006:2012–25
ng the transmitral filling pattern via pulsed Doppler at theitral leaflet tips. Normally, the early filling wave (E) is
arger than the A-wave of atrial contraction, but with LVypertrophy and other pathologies commonly seen withging, the E/A ratio falls below 1, termed delayed relax-tion. Theoretical (76), in vitro (77), animal (78), andlinical studies have shown that the acceleration of the Eave (and for the most part its maximal velocity) is
igure 5. (A) One-, 2-, and 3-dimensional representation of linear myocTDI). (C) Two-dimensional strain obtained by speckle tracking imagin-dimensional data set.
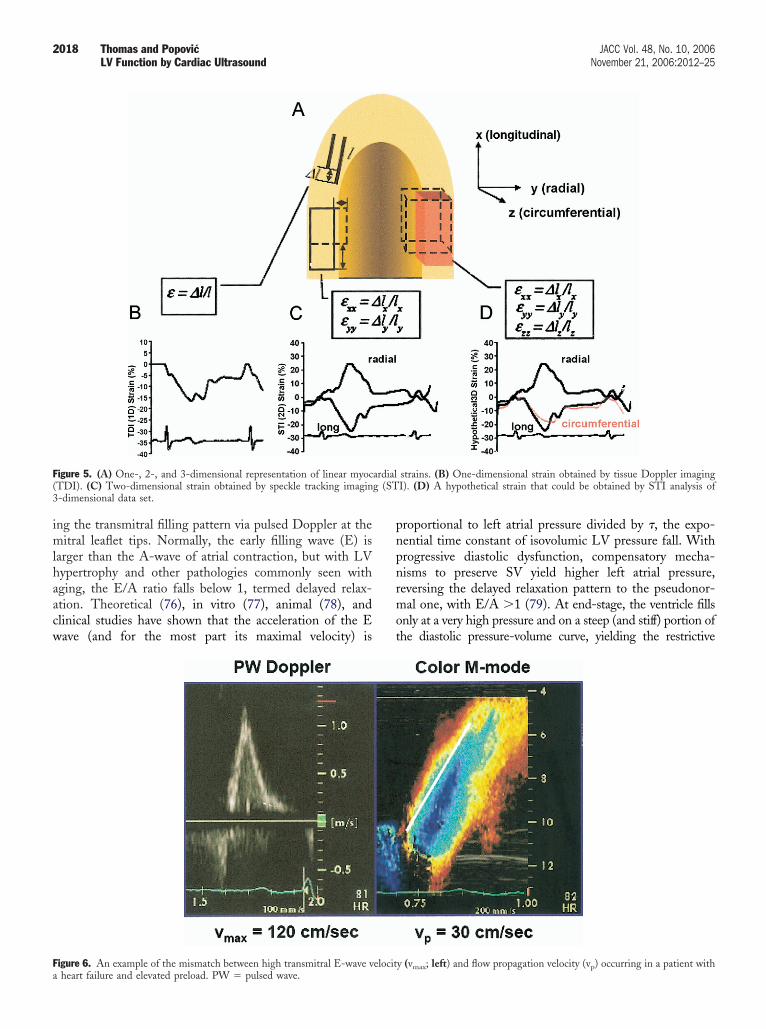
igure 6. An example of the mismatch between high transmitral E-wave velocitheart failure and elevated preload. PW � pulsed wave.
roportional to left atrial pressure divided by �, the expo-ential time constant of isovolumic LV pressure fall. Withrogressive diastolic dysfunction, compensatory mecha-isms to preserve SV yield higher left atrial pressure,eversing the delayed relaxation pattern to the pseudonor-al one, with E/A �1 (79). At end-stage, the ventricle fills
nly at a very high pressure and on a steep (and stiff) portion ofhe diastolic pressure-volume curve, yielding the restrictive
strains. (B) One-dimensional strain obtained by tissue Doppler imagingI). (D) A hypothetical strain that could be obtained by STI analysis of
ardial
y (vmax; left) and flow propagation velocity (vp) occurring in a patient with
fip
fsawrtppaw
spsfdppc
MlprapfovVdnmvopirtwflSd3(etciumrcsomc
EI
Mtq
TN
S
“
E
*
vEdrM
T
MGSNR
*
itM
2019JACC Vol. 48, No. 10, 2006 Thomas and PopovicNovember 21, 2006:2012–25 LV Function by Cardiac Ultrasound
lling pattern, with E � A, and deceleration time �150 ms, aattern with an exceedingly poor prognosis (80,81).
Pulmonary venous flow is a helpful adjunct in diastolicunction assessment. A recent review summarizes the as-essment of pulmonary venous flow (82), the most usefulspect being the size and morphology of the atrial reversalave that occurs with atrial contraction. Deep and broad
eversal waves indicate high ventricular stiffness (83), andhe difference between the duration of transmitral andulmonary venous A waves is predictive of LV end-diastolicressure (84). Worsening systolic (and diastolic) function isssociated with a diminished S wave, but this is also seenith mitral regurgitation and atrial fibrillation.Transmitral and pulmonary venous flow indexes are
ensitive to left atrial pressure (as with the normal andseudonormal filling patterns), and investigators haveought indexes less sensitive to load. For example, in heartailure, early diastolic myocardial velocity by DTI falls withelayed relaxation, but does not rise with compensatoryreload adjustment and so can distinguish normal fromseudonormal transmitral flow (85) and constrictive peri-arditis from restrictive cardiomyopathy (86).
able 1. Classification of Diastolic Dysfunction: Standard andew Criteria
DelayedRelaxation
PseudonormalFilling
RestrictiveFilling
tandard criteriaMitral inflow
E/A �1 1–2 �2DT (ms) �200 150–200 �150IVRT (ms) �100 60–100 �60
Pulmonary vein flowS/D �1 �1 �1AR (cms) �35 �35* �25*
New” criteriaVp (cm) �45 �45 �45Em (cm/s) �8 �8 �8
merging markersE/Asr (Applicable to regional function)IVPD (mm Hg) �1? �1? �1?Vuntw (rad/s) ��1? ��1? ��1?
Unless atrial mechanical failure is present.AR � pulmonary venous atrial contraction reversal velocity; DT � early left
entricular filling deceleration time; E/A � early-to-atrial ventricular filling ratio;/Asr � early-to-atrial diastolic strain rate ratio; Em � mitral annulus peak earlyiastolic velocity; IVPG; intaventricular pressure difference; IVRT � isovolumicelaxation time; S/D � systolic-to-diastolic pulmonary flow ratio; Vp � color
-mode flow propagation velocity; Vuntw � peak untwisting velocity.
able 2. Proposed Equations for Estimating Filling Pressures and
Authors Equation
ulvagh et al. (106) 46 � 0.22 IVRT � 0.10 AFF � 0.0arcia et al. (104) 5.27 � [E/Vp] � 4.6
tein et al. (102) Diastolic pressure � 4VMR-AVO2
agueh et al. (103) 1.91 � 1.24 � E/Ea
ivas-Gotz et al. (98) 0.9 � systolic pressure � e�IVRT/tau(
Only standard error of the estimate of the linear regression is reported.A � A-wave velocity; AFF � atrial filling fraction; DT � deceleration time; E
sovolumic relaxation time; LOA � limits of agreement; MAR � time from termin
he time difference between the E-wave onset recorded by standard and tissue Doppler; VMR-mode flow propagation velocity.
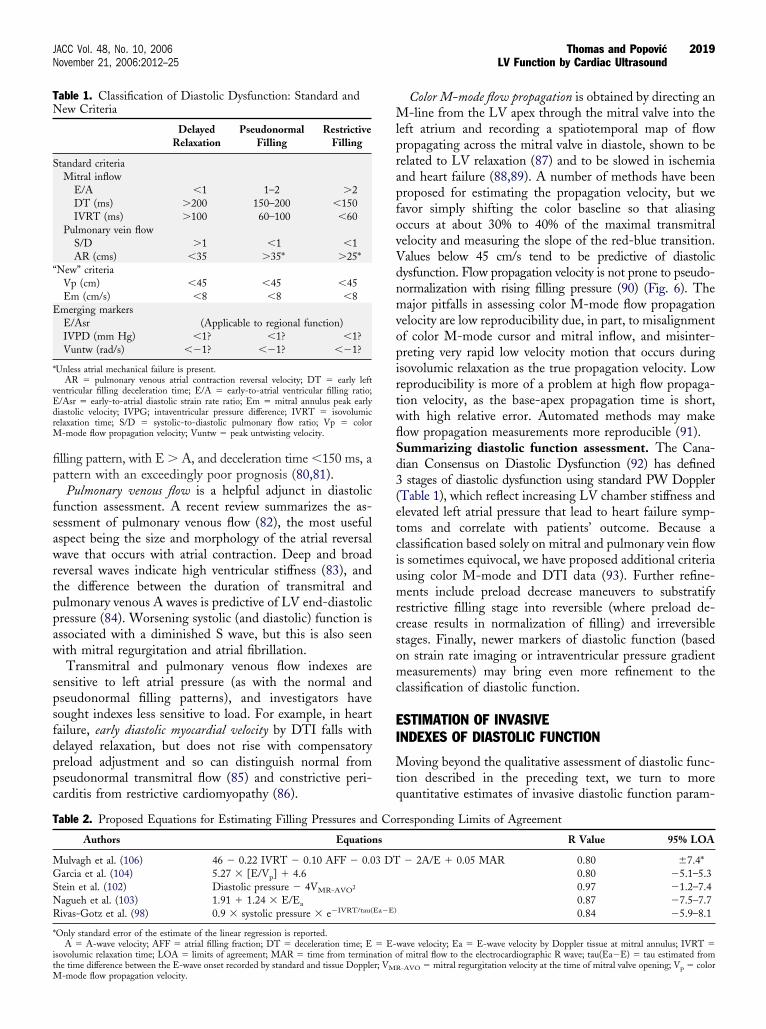
Color M-mode flow propagation is obtained by directing an-line from the LV apex through the mitral valve into the
eft atrium and recording a spatiotemporal map of flowropagating across the mitral valve in diastole, shown to beelated to LV relaxation (87) and to be slowed in ischemiand heart failure (88,89). A number of methods have beenroposed for estimating the propagation velocity, but weavor simply shifting the color baseline so that aliasingccurs at about 30% to 40% of the maximal transmitralelocity and measuring the slope of the red-blue transition.alues below 45 cm/s tend to be predictive of diastolicysfunction. Flow propagation velocity is not prone to pseudo-ormalization with rising filling pressure (90) (Fig. 6). Theajor pitfalls in assessing color M-mode flow propagation
elocity are low reproducibility due, in part, to misalignmentf color M-mode cursor and mitral inflow, and misinter-reting very rapid low velocity motion that occurs duringsovolumic relaxation as the true propagation velocity. Loweproducibility is more of a problem at high flow propaga-ion velocity, as the base-apex propagation time is short,ith high relative error. Automated methods may makeow propagation measurements more reproducible (91).ummarizing diastolic function assessment. The Cana-ian Consensus on Diastolic Dysfunction (92) has definedstages of diastolic dysfunction using standard PW Doppler
Table 1), which reflect increasing LV chamber stiffness andlevated left atrial pressure that lead to heart failure symp-oms and correlate with patients’ outcome. Because alassification based solely on mitral and pulmonary vein flows sometimes equivocal, we have proposed additional criteriasing color M-mode and DTI data (93). Further refine-ents include preload decrease maneuvers to substratify
estrictive filling stage into reversible (where preload de-rease results in normalization of filling) and irreversibletages. Finally, newer markers of diastolic function (basedn strain rate imaging or intraventricular pressure gradienteasurements) may bring even more refinement to the
lassification of diastolic function.
STIMATION OF INVASIVENDEXES OF DIASTOLIC FUNCTION
oving beyond the qualitative assessment of diastolic func-ion described in the preceding text, we turn to moreuantitative estimates of invasive diastolic function param-
rresponding Limits of Agreement
R Value 95% LOA
� 2A/E � 0.05 MAR 0.80 7.4*0.80 �5.1–5.30.97 �1.2–7.40.87 �7.5–7.70.84 �5.9–8.1
wave velocity; Ea � E-wave velocity by Doppler tissue at mitral annulus; IVRT �f mitral flow to the electrocardiographic R wave; tau(Ea�E) � tau estimated from
Co
s
3 DT
Ea�E)
� E-ation o
-AVO � mitral regurgitation velocity at the time of mitral valve opening; Vp � color
esRcrr
wipAei(dDLtL(t
FmppipomlatpE(tspditomea
Fasdtip
Famndos
2020 Thomas and Popovic JACC Vol. 48, No. 10, 2006LV Function by Cardiac Ultrasound November 21, 2006:2012–25
ters like relaxation, compliance, filling pressure, and dia-tolic suction (intraventricular pressure gradient).elaxation. The time constant of isovolumic pressure de-
ay, or tau, represents a reference invasive measure forelaxation. Tau can be estimated from the isovolumetricelaxation time (IVRT) using the simplified equation:
tau � IVRT ⁄ �ln�systolic pressure� � ln�filling pressure��
ith filling pressure measured invasively, estimated non-nvasively (see the following text), or assuming a fillingressure of 10 mm Hg for patients not in heart failure (94).lso, several other surrogates of tau can be assessed by
chocardiography. These include isovolumic relaxation timetself (95), the color M-mode flow propagation velocity96), early myocardial relaxation velocity (97), and the timeifference between the E-wave onset recorded by PWoppler and by PW DTI at the mitral annulus (98).V compliance. In vitro and theoretical analysis predicts
hat the deceleration time of the E wave is shortened by lowV operating compliance (76). Animal (99) and clinical
100) work has validated this concept, which likely explains
igure 7. A standard time/velocity map obtained by color M-mode (top);time/pressure gradient map generated from color M-mode data by
olving Euler equation (middle); and tracings of intraventricular pressureifferences obtained by integration of time/pressure gradient map (bot-om). E � peak early diastolic gradient obtained from left ventricularnflow; LV � left ventricular; LVOT � left ventricular outflow tract; S �eak systolic gradient obtained from the LVOT.
he poor prognosis of the restrictive filling pattern (80,81).la
illing pressures. Most of the numerous methods to esti-ate LV filling pressures are empirical, because there is no
hysical relationship that can be used to extract absoluteressures echocardiographic data. One exception is estimat-ng left atrial pressure by subtracting the peak LV-left atrialressure difference (obtained from continuous wave Dopplerf mitral regurgitation) from systolic blood pressure, aethod with high relative error because we must subtract 2
arge numbers, each with their own intrinsic error, to yieldsmall number (101,102). Other approaches that have some
heoretical underpinnings recognize that E velocity is pro-ortional to (left atrial pressure)/tau, whereas annular-wave (Ea) and color M-mode velocity of propagation
Vp) are assumed load-independent and inversely related toau. Thus, both E/Ea (103) and E/Vp (104) have beenhown to be linearly related to left atrial pressure. Otherroposed estimation methods have used mitral E-waveeceleration time (105), a multiple regression model that
ncorporates several predictors (106) and differences in theiming of the E-wave onset recorded by standard, aspposed to tissue, PW Doppler (98). Of interest, this lastethod is based on manipulation of a simplified tau
quation (98) (Table 2). One has to be reminded thatlthough all of the methods showed promise in initial
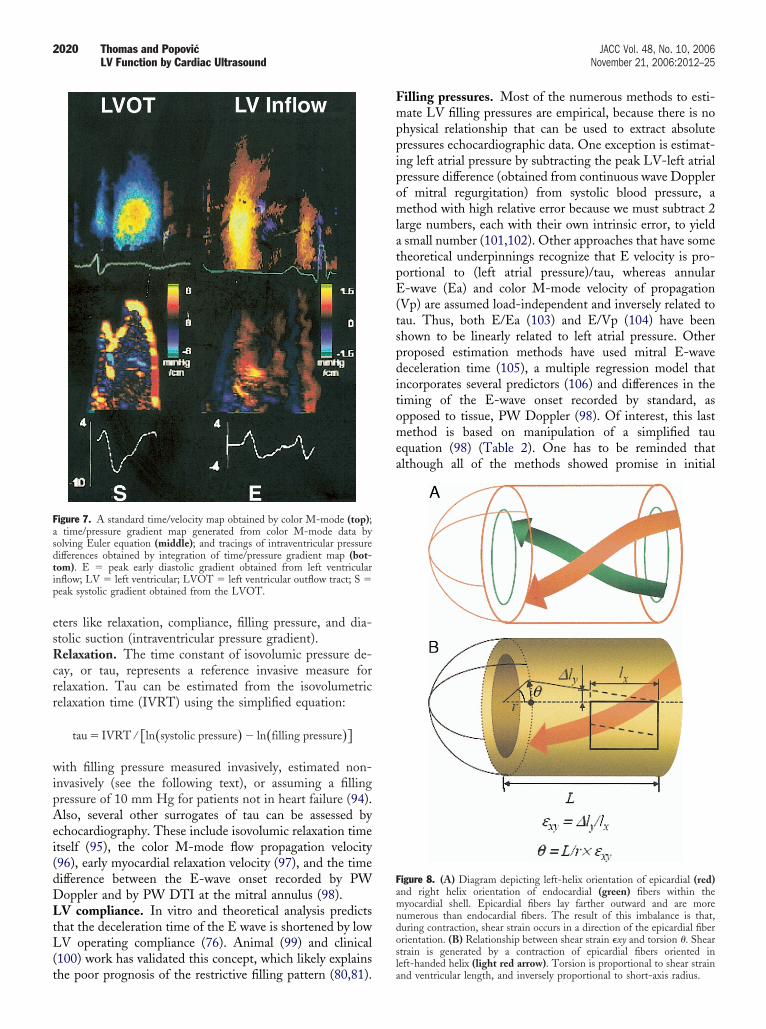
igure 8. (A) Diagram depicting left-helix orientation of epicardial (red)nd right helix orientation of endocardial (green) fibers within theyocardial shell. Epicardial fibers lay farther outward and are more
umerous than endocardial fibers. The result of this imbalance is that,uring contraction, shear strain occurs in a direction of the epicardial fiberrientation. (B) Relationship between shear strain �xy and torsion �. Sheartrain is generated by a contraction of epicardial fibers oriented in
eft-handed helix (light red arrow). Torsion is proportional to shear strainnd ventricular length, and inversely proportional to short-axis radius.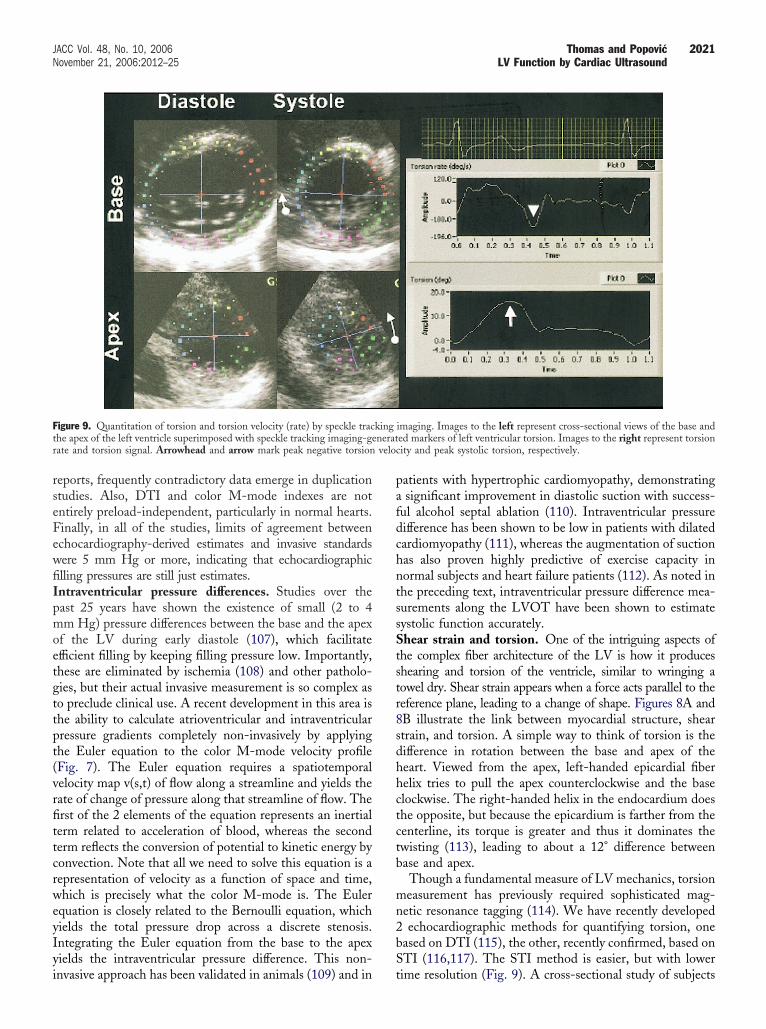
rseFewfiIpmoetgttpt(vrfittcrweyIyi
pafdchntssStstr8sdhhctctb
mn2bS
Ft neratr veloc
2021JACC Vol. 48, No. 10, 2006 Thomas and PopovicNovember 21, 2006:2012–25 LV Function by Cardiac Ultrasound
eports, frequently contradictory data emerge in duplicationtudies. Also, DTI and color M-mode indexes are notntirely preload-independent, particularly in normal hearts.inally, in all of the studies, limits of agreement betweenchocardiography-derived estimates and invasive standardsere 5 mm Hg or more, indicating that echocardiographiclling pressures are still just estimates.ntraventricular pressure differences. Studies over theast 25 years have shown the existence of small (2 to 4m Hg) pressure differences between the base and the apex
f the LV during early diastole (107), which facilitatefficient filling by keeping filling pressure low. Importantly,hese are eliminated by ischemia (108) and other patholo-ies, but their actual invasive measurement is so complex aso preclude clinical use. A recent development in this area ishe ability to calculate atrioventricular and intraventricularressure gradients completely non-invasively by applyinghe Euler equation to the color M-mode velocity profileFig. 7). The Euler equation requires a spatiotemporalelocity map v(s,t) of flow along a streamline and yields theate of change of pressure along that streamline of flow. Therst of the 2 elements of the equation represents an inertialerm related to acceleration of blood, whereas the seconderm reflects the conversion of potential to kinetic energy byonvection. Note that all we need to solve this equation is aepresentation of velocity as a function of space and time,hich is precisely what the color M-mode is. The Euler
quation is closely related to the Bernoulli equation, whichields the total pressure drop across a discrete stenosis.ntegrating the Euler equation from the base to the apexields the intraventricular pressure difference. This non-
igure 9. Quantitation of torsion and torsion velocity (rate) by speckle trache apex of the left ventricle superimposed with speckle tracking imaging-geate and torsion signal. Arrowhead and arrow mark peak negative torsion
nvasive approach has been validated in animals (109) and in t
atients with hypertrophic cardiomyopathy, demonstratingsignificant improvement in diastolic suction with success-
ul alcohol septal ablation (110). Intraventricular pressureifference has been shown to be low in patients with dilatedardiomyopathy (111), whereas the augmentation of suctionas also proven highly predictive of exercise capacity inormal subjects and heart failure patients (112). As noted inhe preceding text, intraventricular pressure difference mea-urements along the LVOT have been shown to estimateystolic function accurately.hear strain and torsion. One of the intriguing aspects of
he complex fiber architecture of the LV is how it produceshearing and torsion of the ventricle, similar to wringing aowel dry. Shear strain appears when a force acts parallel to theeference plane, leading to a change of shape. Figures 8A andB illustrate the link between myocardial structure, sheartrain, and torsion. A simple way to think of torsion is theifference in rotation between the base and apex of theeart. Viewed from the apex, left-handed epicardial fiberelix tries to pull the apex counterclockwise and the baselockwise. The right-handed helix in the endocardium doeshe opposite, but because the epicardium is farther from theenterline, its torque is greater and thus it dominates thewisting (113), leading to about a 12° difference betweenase and apex.Though a fundamental measure of LV mechanics, torsioneasurement has previously required sophisticated mag-
etic resonance tagging (114). We have recently developedechocardiographic methods for quantifying torsion, one
ased on DTI (115), the other, recently confirmed, based onTI (116,117). The STI method is easier, but with lower
imaging. Images to the left represent cross-sectional views of the base anded markers of left ventricular torsion. Images to the right represent torsionity and peak systolic torsion, respectively.
king
ime resolution (Fig. 9). A cross-sectional study of subjects
ftsbbdipfidsirh
W
WrfbmvseSscvvfzrjPPpqnvrs(rtsmbde
C
Itih
ftwa
RDFE
R
2022 Thomas and Popovic JACC Vol. 48, No. 10, 2006LV Function by Cardiac Ultrasound November 21, 2006:2012–25
rom newborn to 50 years showed maturational changes inorsion, with the heart rotating clockwise essentially as aolid body in infancy, developing the adult pattern of torsiony adolescence (118). Torsion appears to be a critical linketween systole and diastole, with elastic energy storeduring systole, then abruptly released with sudden untwist-
ng during isovolumic relaxation, generating intraventricularressure gradients and allowing filling to proceed at lowlling pressure. This is particularly important during theisproportionately shortened diastole of exercise. We havehown that the untwisting rate is highly correlated withntraventricular pressure difference at rest and exercise, aelationship that holds both in health and in presence ofypertrophic cardiomyopathy (119).
HAT TO DO WHEN?
hich of these myriad measurements should be made inoutine echocardiographic practice? No laboratory can af-ord to do all of these either in acquisition or interpretation,ut general guidelines may be offered, balancing thoseeasurements that are easiest to make and give the greatest
alue. We feel that end-diastolic and -systolic volumeshould be measured, ideally by 3D but acceptably by 2Dchocardiography and Simpson’s rule, from which EF andV can be calculated. Stroke volume should also be mea-ured directly by PW Doppler in the LVOT. Color andontinuous wave Doppler should be obtained through everyalve to seek occult stenosis or regurgitation. If stenotic,alve area should be calculated by continuity or planimetry;or mitral or tricuspid regurgitation, a proximal convergenceone should be sought and analyzed, whereas for aortic, floweversal in the aortic arch is a useful adjunct to regurgitantet appearance. Diastolic function should be assessed withW Doppler at the mitral leaflet tips and pulmonary vein,W DTI at the lateral annulus, and color M-mode flowropagation, the latter 2 of which may often be judgedualitatively (low/high, slow/fast) for a quick separation oformal from pseudonormal pattern. Left atrial area and/orolume are an indispensable part of final diastolic functioneport. Regional wall motion should be qualitatively as-essed globally and segment-by-segment, and, if available,semi)automated analysis methods may make this moreeproducible. Advanced methods like torsion and intraven-ricular pressure gradients are promising, but beyond thecope of routine clinical practice. It is hoped that ultrasoundanufacturers will develop accessible user interfaces to
ring these techniques into common practice as they haveone with previously arcane methods like the continuityquation and pressure half-times.
ONCLUSIONS
n summary, Doppler echocardiography has proven to behe most versatile cardiovascular imaging modality, provid-ng a comprehensive assessment of valvular and ventricular
emodynamics and global and regional systolic and diastolicunction. With improvements in transducer technology andhe relentless doubling of computer speed every 18 months,e can only expect ever more precise echocardiographic
ssessment of cardiac mechanics.
eprint requests and correspondence: Dr. James D. Thomas,epartment of Cardiology, Desk F-15, The Cleveland Clinicoundation, 9500 Euclid Avenue, Cleveland, Ohio 44195.-mail: [email protected].
EFERENCES
1. Marwick TH. Stress echocardiography. Heart 2003;89:113–8.2. Lewis JF, Kuo LC, Nelson JG, Limacher MC, Quinones MA.
Pulsed Doppler echocardiographic determination of stroke volumeand cardiac output: clinical validation of two new methods using theapical window. Circulation 1984;70:425–31.
3. Dittmann H, Voelker W, Karsch KR, Seipel L. Influence ofsampling site and flow area on cardiac output measurements byDoppler echocardiography. J Am Coll Cardiol 1987;10:818–23.
4. Kim WY, Poulsen JK, Terp K, Staalsen NH. A new Doppler methodfor quantification of volumetric flow: in vivo validation using colorDoppler. J Am Coll Cardiol 1996;27:182–92.
5. Sun JP, Pu M, Fouad FM, Christian R, Stewart WJ, Thomas JD.Automated cardiac output measurement by spatiotemporal integra-tion of color Doppler data. In vitro and clinical validation. Circula-tion 1997;95:932–9.
6. Meijboom EJ, Horowitz S, Valdes-Cruz LM, Sahn DJ, Larson DF,Oliveira Lima C. A Doppler echocardiographic method for calculat-ing volume flow across the tricuspid valve: correlative laboratory andclinical studies. Circulation 1985;71:551–6.
7. Pu M, Griffin BP, Vandervoort PM, Leung DY, Cosgrove DM 3rd,Thomas JD. Intraoperative validation of mitral inflow determinationby transesophageal echocardiography: comparison of single-plane,biplane and thermodilution techniques. J Am Coll Cardiol 1995;26:1047–53.
8. Kitabatake A, Inoue M, Asao M, et al. Noninvasive evaluation of theratio of pulmonary to systemic flow in atrial septal defect by duplexDoppler echocardiography. Circulation 1984;69:73–9.
9. Kurokawa S, Takahashi M, Katoh Y, Muramatsu J, Kikawada R.Noninvasive evaluation of the ratio of pulmonary to systemic flow inventricular septal defect by means of Doppler two-dimensionalechocardiography. Am Heart J 1988;116:1033–44.
10. Enriquez-Sarano M, Bailey KR, Seward JB, Tajik AJ, Krohn MJ,Mays JM. Quantitative Doppler assessment of valvular regurgitation.Circulation 1993;87:841–8.
11. Bargiggia GS, Tronconi L, Sahn DJ, et al. A new method forquantitation of mitral regurgitation based on color flow Dopplerimaging of flow convergence proximal to regurgitant orifice. Circu-lation 1991;84:1481–9.
12. Vandervoort PM, Rivera JM, Mele D, et al. Application of colorDoppler flow mapping to calculate effective regurgitant orifice area.An in vitro study and initial clinical observations. Circulation1993;88:1150–6.
13. Pu M, Prior DL, Fan X, et al. Calculation of mitral regurgitantorifice area with use of a simplified proximal convergence method:initial clinical application. J Am Soc Echocardiogr 2001;14:180–5.
14. Zhang J, Jones M, Shandas R, et al. Accuracy of flow convergenceestimates of mitral regurgitant flow rates obtained by use of multiplecolor flow Doppler M-mode aliasing boundaries: an experimentalanimal study. Am Heart J 1993;125:449–58.
15. Pu M, Vandervoort PM, Griffin BP, et al. Quantification of mitralregurgitation by the proximal convergence method using transesoph-ageal echocardiography. Clinical validation of a geometric correctionfor proximal flow constraint. Circulation 1995;92:2169–77.
16. Currie PJ, Seward JB, Reeder GS, et al. Continuous wave Dopplerechocardiographic assessment of severity of calcific aortic stenosis: asimultaneous Doppler-catheter correlative study in 100 adult pa-tients. Circulation 1985;71:1162–9.
17. Simon AC, Flaud P, Levenson J. Non-invasive evaluation ofsegmental pressure drop and resistance in large arteries in humans
2023JACC Vol. 48, No. 10, 2006 Thomas and PopovicNovember 21, 2006:2012–25 LV Function by Cardiac Ultrasound
based on a Poiseuille model of intra-arterial velocity distribution.Cardiovasc Res 1990;24:623– 6.
18. Firstenberg MS, Vandervoort PM, Greenberg NL, et al. Noninvasiveestimation of transmitral pressure drop across the normal mitral valvein humans: importance of convective and inertial forces during leftventricular filling. J Am Coll Cardiol 2000;36:1942–9.
19. Nakatani S, Firstenberg MS, Greenberg NL, et al. Mitral inertancein humans: critical factor in Doppler estimation of transvalvularpressure gradients. Am J Physiol Heart Circ Physiol 2001;280:H1340–5.
20. Vandervoort PM, Greenberg NL, Powell KA, Cosgrove DM,Thomas JD. Pressure recovery in bileaflet heart valve prostheses.Localized high velocities and gradients in central and side orificeswith implications for Doppler-catheter gradient relation in aortic andmitral position. Circulation 1995;92:3464–72.
21. Popovic AD, Thomas JD, Neskovic AN, Cosgrove DM 3rd, StewartWJ, Lauer MS. Time-related trends in the preoperative evaluation ofpatients with valvular stenosis. Am J Cardiol 1997;80:1464–8.
22. Thomas JD, Liu CM, Flachskampf FA, O’Shea JP, Davidoff R,Weyman AE. Quantification of jet flow by momentum analysis. Anin vitro color Doppler flow study. Circulation 1990;81:247–59.
23. Cape EG, Skoufis EG, Weyman AE, Yoganathan AP, Levine RA.A new method for noninvasive quantification of valvular regurgita-tion based on conservation of momentum. In vitro validation.Circulation 1989;79:1343–53.
24. Mulvagh SL, DeMaria AN, Feinstein SB, et al. Contrast echocar-diography: current and future applications. J Am Soc Echocardiogr2000;13:331–42.
25. Bellenger NG, Burgess MI, Ray SG, et al. Comparison of leftventricular ejection fraction and volumes in heart failure by echocar-diography, radionuclide ventriculography and cardiovascular mag-netic resonance; are they interchangeable? Eur Heart J 2000;21:1387–96.
26. Pombo JF, Troy BL, Russell RO Jr. Left ventricular volumes andejection fraction by echocardiography. Circulation 1971;43:480–90.
27. Teichholz LE, Kreulen T, Herman MV, Gorlin R. Problems inechocardiographic volume determinations: echocardiographic-angiographic correlations in the presence of absence of asynergy.Am J Cardiol 1976;37:7–11.
28. Yvorchuk KJ, Davies RA, Chan KL. Measurement of left ventricularejection fraction by acoustic quantification and comparison withradionuclide angiography. Am J Cardiol 1994;74:1052–6.
29. Mor-Avi V, Vignon P, Koch R, et al. Segmental analysis of colorkinesis images: new method for quantification of the magnitude andtiming of endocardial motion during left ventricular systole anddiastole. Circulation 1997;95:2082–97.
30. Chen CH, Nevo E, Fetics B, et al. Comparison of continuous leftventricular volumes by transthoracic two-dimensional digital echoquantification with simultaneous conductance catheter measurementsin patients with cardiac diseases. Am J Cardiol 1997;80:756–61.
31. Qin JX, Jones M, Shiota T, et al. Validation of real-time three-dimensional echocardiography for quantifying left ventricular vol-umes in the presence of a left ventricular aneurysm: in vitro and invivo studies. J Am Coll Cardiol 2000;36:900–7.
32. Bauer F, Jones M, Qin JX, et al. Quantitative analysis of left atrialfunction during left ventricular ischemia with and without left atrialischemia: a real-time 3-dimensional echocardiographic study. J AmSoc Echocardiogr 2005;18:795–801.
33. Mor-Avi V, Sugeng L, Weinert L, et al. Fast measurement of leftventricular mass with real-time three-dimensional echocardiography:comparison with magnetic resonance imaging. Circulation 2004;110:1814–8.
34. Jenkins C, Bricknell K, Hanekom L, Marwick TH. Reproducibilityand accuracy of echocardiographic measurements of left ventricularparameters using real-time three-dimensional echocardiography.J Am Coll Cardiol 2004;44:878–86.
35. Tanabe K, Belohlavek M, Jakrapanichakul D, Bae RY, Greenleaf JF,Seward JB. Three-dimensional echocardiography: precision and ac-curacy of left ventricular volume measurement using rotationalgeometry with variable numbers of slice resolution. Echocardiogra-phy 1998;15:575–80.
36. Corsi C, Lang RM, Veronesi F, et al. Volumetric quantification of
global and regional left ventricular function from real-time three-dimensional echocardiographic images. Circulation 2005;112:1161–70.
37. Suga H, Sagawa K. Instantaneous pressure-volume relationships andtheir ratio in the excised, supported canine left ventricle. Circ Res1974;35:117–26.
38. Kass DA, Beyar R. Evaluation of contractile state by maximalventricular power divided by the square of end-diastolic volume.Circulation 1991;84:1698–708.
39. Nakayama M, Chen CH, Nevo E, Fetics B, Wong E, Kass DA.Optimal preload adjustment of maximal ventricular power indexvaries with cardiac chamber size. Am Heart J 1998;136:281–8.
40. Segers P, Tchana-Sato V, Leather HA, et al. Determinants of leftventricular preload-adjusted maximal power. Am J Physiol HeartCirc Physiol 2003;284:H2295–301.
41. Chen CH, Fetics B, Nevo E, et al. Noninvasive single-beat deter-mination of left ventricular end-systolic elastance in humans. J AmColl Cardiol 2001;38:2028–34.
42. Kawaguchi M, Hay I, Fetics B, Kass DA. Combined ventricularsystolic and arterial stiffening in patients with heart failure andpreserved ejection fraction: implications for systolic and diastolicreserve limitations. Circulation 2003;107:714–20.
43. Bauer F, Jones J, Shiota T, et al. Left ventricular outflow tract meansystolic acceleration as a surrogate for the slope of the left ventricularend-systolic pressure-volume relationship. J Am Coll Cardiol 2002;40:1320–7.
44. Greenberg NL, Firstenberg MS, Castro PL, et al. Doppler-derivedmyocardial systolic strain rate is a strong index of left ventricularcontractility. Circulation 2002;105:99–105.
45. Yotti R, Bermejo J, Desco MM, et al. Doppler-derived ejectionintraventricular pressure gradients provide a reliable assessment of leftventricular systolic chamber function. Circulation 2005;112:1771–9.
46. Parthenakis FI, Kanakaraki MK, Kanoupakis EM, et al. Value ofDoppler index combining systolic and diastolic myocardial perfor-mance in predicting cardiopulmonary exercise capacity in patientswith congestive heart failure: effects of dobutamine. Chest 2002;121:1935–41.
47. Cheung MM, Smallhorn JF, Redington AN, Vogel M. The effects ofchanges in loading conditions and modulation of inotropic state onthe myocardial performance index: comparison with conductancecatheter measurements. Eur Heart J 2004;25:2238–42.
48. Vogel M, Schmidt MR, Kristiansen SB, et al. Validation of myocar-dial acceleration during isovolumic contraction as a novel noninvasiveindex of right ventricular contractility: comparison with ventricularpressure-volume relations in an animal model. Circulation 2002;105:1693–9.
49. Lyseggen E, Rabben SI, Skulstad H, Urheim S, Risoe C, SmisethOA. Myocardial acceleration during isovolumic contraction: relation-ship to contractility. Circulation 2005;111:1362–9.
50. Lang RM, Bierig M, Devereux RB, et al. Recommendations forchamber quantification: a report from the American Society ofEchocardiography’s Guidelines and Standards Committee and theChamber Quantification Writing Group, developed in conjunctionwith the European Association of Echocardiography, a branch of theEuropean Society of Cardiology. J Am Soc Echocardiogr 2005;18:1440–63.
51. Heger JJ, Weyman AE, Wann LS, Dillon JC, Feigenbaum H.Cross-sectional echocardiography in acute myocardial infarction:detection and localization of regional left ventricular asynergy. Cir-culation 1979;60:531–8.
52. Costa KD, Takayama Y, McCulloch AD, Covell JW. Laminar fiberarchitecture and three-dimensional systolic mechanics in canineventricular myocardium. Am J Physiol 1999;276:H595–607.
53. Arts T, Costa KD, Covell JW, McCulloch AD. Relating myocardiallaminar architecture to shear strain and muscle fiber orientation. Am JPhysiol Heart Circ Physiol 2001;280:H2222–9.
54. Chen J, Liu W, Zhang H, et al. Regional ventricular wall thickeningreflects changes in cardiac fiber and sheet structure during contrac-tion: quantification with diffusion tensor MRI. Am J Physiol HeartCirc Physiol 2005;289:H1898–907.
55. Spotnitz HM, Spotnitz WD, Cottrell TS, Spiro D, Sonnenblick EH.Cellular basis for volume related wall thickness changes in the rat leftventricle. J Mol Cell Cardiol 1974;6:317–31.
56. Harrington KB, Rodriguez F, Cheng A, et al. Direct measurement oftransmural laminar architecture in the anterolateral wall of the ovine
2024 Thomas and Popovic JACC Vol. 48, No. 10, 2006LV Function by Cardiac Ultrasound November 21, 2006:2012–25
left ventricle: new implications for wall thickening mechanics. Am JPhysiol Heart Circ Physiol 2005;288:H1324–30.
57. MacGowan GA, Shapiro EP, Azhari H, et al. Noninvasive measure-ment of shortening in the fiber and cross-fiber directions in thenormal human left ventricle and in idiopathic dilated cardiomyopa-thy. Circulation 1997;96:535–41.
58. Popovic ZB, Grimm RA, Perlic G, et al. Noninvasive assessment ofcardiac resynchronization therapy for congestive heart failure usingmyocardial strain and left ventricular peak power as parameters ofmyocardial synchrony and function. J Cardiovasc Electrophysiol2002;13:1203–8.
59. Yu CM, Chau E, Sanderson JE, et al. Tissue Doppler echocardio-graphic evidence of reverse remodeling and improved synchronicityby simultaneously delaying regional contraction after biventricularpacing therapy in heart failure. Circulation 2002;105:438–45.
60. Bax JJ, Abraham T, Barold SS, et al. Cardiac resynchronizationtherapy: part 1—issues before device implantation. J Am Coll Cardiol2005;46:2153–67.
61. Marwick TH, Case C, Leano R, et al. Use of tissue Doppler imagingto facilitate the prediction of events in patients with abnormal leftventricular function by dobutamine echocardiography. Am J Cardiol2004;93:142–6.
62. Iwasaki Y, Satomi G, Yasukochi S. Analysis of ventricular septalmotion by Doppler tissue imaging in atrial septal defect and normalheart. Am J Cardiol 1999;83:206–10.
63. D’Hooge J, Heimdal A, Jamal F, et al. Regional strain and strain ratemeasurements by cardiac ultrasound: principles, implementation andlimitations. Eur J Echocardiogr 2000;1:154–70.
64. Glantz SA, Parmley WW. Factors which affect the diastolic pressure-volume curve. Circ Res 1978;42:171–80.
65. Edvardsen T, Gerber BL, Garot J, Bluemke DA, Lima JA, SmisethOA. Quantitative assessment of intrinsic regional myocardial defor-mation by Doppler strain rate echocardiography in humans: valida-tion against three-dimensional tagged magnetic resonance imaging.Circulation 2002;106:50–6.
66. Voigt JU, Exner B, Schmiedehausen K, et al. Strain-rate imagingduring dobutamine stress echocardiography provides objective evi-dence of inducible ischemia. Circulation 2003;107:2120–6.
67. Hoffmann R, Altiok E, Nowak B, et al. Strain rate measurement byDoppler echocardiography allows improved assessment of myocardialviability in patients with depressed left ventricular function. J AmColl Cardiol 2002;39:443–9.
68. Sun JP, Popovic ZB, Greenberg NL, et al. Noninvasive quantifica-tion of regional myocardial function using Doppler-derived velocity,displacement, strain rate, and strain in healthy volunteers: effects ofaging. J Am Soc Echocardiogr 2004;17:132–8.
69. Urheim S, Edvardsen T, Torp H, Angelsen B, Smiseth OA.Myocardial strain by Doppler echocardiography. Validation of a newmethod to quantify regional myocardial function. Circulation 2000;102:1158–64.
70. Amundsen BH, Helle-Valle T, Edvardsen T, et al. Noninvasivemyocardial strain measurement by speckle tracking echocardiographyvalidation against sonomicrometry and tagged magnetic resonanceimaging. J Am Coll Cardiol 2006;47:789–93.
71. Suffoletto MS, Dohi K, Cannesson M, Saba S, Gorcsan J 3rd. Novelspeckle-tracking radial strain from routine black-and-white echocar-diographic images to quantify dyssynchrony and predict response tocardiac resynchronization therapy. Circulation 2006;113:960–8.
72. Zhang Y, Chan AK, Yu CM, et al. Strain rate imaging differentiatestransmural from non-transmural myocardial infarction: a validationstudy using delayed-enhancement magnetic resonance imaging. J AmColl Cardiol 2005;46:864–71.
73. Hanekom L, Jenkins C, Jeffries L, et al. Incremental value of strainrate analysis as an adjunct to wall-motion scoring for assessment ofmyocardial viability by dobutamine echocardiography: a follow-upstudy after revascularization. Circulation 2005;112:3892–900.
74. Skulstad H, Urheim S, Edvardsen T, et al. Grading of myocardialdysfunction by tissue Doppler echocardiography: a comparison be-tween velocity, displacement, and strain imaging in acute ischemia.J Am Coll Cardiol 2006;47:1672–82.
75. Vitarelli A, Montesano T, Gaudio C, et al. Strain rate dobutamineechocardiography for prediction of recovery after revascularization in
patients with ischemic left ventricular dysfunction. J Card Fail2006;12:268–75.76. Thomas JD, Weyman AE. Echocardiographic Doppler evaluation ofleft ventricular diastolic function. Physics and physiology. Circulation1991;84:977–90.
77. Thomas JD, Weyman AE. Doppler mitral pressure half-time: aclinical tool in search of theoretical justification. J Am Coll Cardiol1987;10:923–9.
78. Choong CY, Abascal VM, Thomas JD, Guerrero JL, McGlew S,Weyman AE. Combined influence of ventricular loading and relax-ation on the transmitral flow velocity profile in dogs measured byDoppler echocardiography. Circulation 1988;78:672–83.
79. Thomas JD, Choong CY, Flachskampf FA, Weyman AE. Analysisof the early transmitral Doppler velocity curve: effect of primaryphysiologic changes and compensatory preload adjustment. J AmColl Cardiol 1990;16:644–55.
80. Klein AL, Hatle LK, Taliercio CP, et al. Prognostic significance ofDoppler measures of diastolic function in cardiac amyloidosis. ADoppler echocardiography study. Circulation 1991;83:808–16.
81. Xie GY, Berk MR, Smith MD, Gurley JC, DeMaria AN. Prognosticvalue of Doppler transmitral flow patterns in patients with congestiveheart failure. J Am Coll Cardiol 1994;24:132–9.
82. Tabata T, Thomas JD, Klein AL. Pulmonary venous flow by Dopplerechocardiography: revisited 12 years later. J Am Coll Cardiol 2003;41:1243–50.
83. Thomas JD, Zhou J, Greenberg N, Bibawy G, McCarthy PM,Vandervoort PM. Physical and physiological determinants ofpulmonary venous flow: numerical analysis. Am J Physiol 1997;272:H2453– 65.
84. Rossvoll O, Hatle LK. Pulmonary venous flow velocities recorded bytransthoracic Doppler ultrasound: relation to left ventricular diastolicpressures. J Am Coll Cardiol 1993;21:1687–96.
85. Sohn DW, Chai IH, Lee DJ, et al. Assessment of mitral annulusvelocity by Doppler tissue imaging in the evaluation of left ventriculardiastolic function. J Am Coll Cardiol 1997;30:474–80.
86. Garcia MJ, Rodriguez L, Ares M, Griffin BP, Thomas JD, Klein AL.Differentiation of constrictive pericarditis from restrictive cardiomy-opathy: assessment of left ventricular diastolic velocities in longitu-dinal axis by Doppler tissue imaging. J Am Coll Cardiol 1996;27:108–14.
87. Brun P, Tribouilloy C, Duval AM, Iserin L, Meguira A. Leftventricular flow propagation during early filling is related to wallrelaxation: a color M-mode Doppler analysis. J Am Coll Cardiol1992;20:420–32.
88. Stugaard M, Risoe C, Ihlen H, Smiseth OA. Intracavitary fillingpattern in the failing left ventricle assessed by color M-modeechocardiography. J Am Coll Cardiol 1994;24:663–70.
89. Stugaard M, Smiseth OA, Risoe C, Ihlen H. Intraventricular earlydiastolic filling during acute myocardial ischemia: assessment bymultigated color M-mode Doppler echocardiography. Circulation1993;88:2705–13.
90. Takatsuji H, Mikami T, Urasawa K, et al. A new approach forevaluation of left ventricular diastolic function: spatial and temporalanalysis of left ventricular filling flow propagation by color M-modeDoppler echocardiography. J Am Coll Cardiol 1996;27:365–71.
91. Greenberg NL, Firstenberg MS, Cardon LA, et al. Automatedassessment of noninvasive filling pressure using color DopplerM-mode echocardiography. Comput Cardiol 2001;28:601–4.
92. Rakowski H, Appleton C, Chan KL, et al. Canadian consensusrecommendations for the measurement and reporting of diastolicdysfunction by echocardiography: from the Investigators of Consen-sus on Diastolic Dysfunction by Echocardiography. J Am SocEchocardiogr 1996;9:736–60.
93. Garcia MJ, Thomas JD, Klein AL. New Doppler echocardiographicapplications for the study of diastolic function. J Am Coll Cardiol1998;32:865–75.
94. Scalia GM, Greenberg NL, McCarthy PM, Thomas JD, Vander-voort PM. Noninvasive assessment of the ventricular relaxation timeconstant (tau) in humans by Doppler echocardiography. Circulation1997;95:151–5.
95. Thomas JD, Flachskampf FA, Chen C, et al. Isovolumic relaxationtime varies predictably with its time constant and aortic and left atrialpressures: implications for the noninvasive evaluation of ventricularrelaxation. Am Heart J 1992;124:1305–13.
96. Garcia MJ, Smedira NG, Greenberg NL, et al. Color M-modeDoppler flow propagation velocity is a preload insensitive index of left
1
1
1
1
1
1
1
1
1
1
1
1
1
1
1
1
1
1
1
1
2025JACC Vol. 48, No. 10, 2006 Thomas and PopovicNovember 21, 2006:2012–25 LV Function by Cardiac Ultrasound
ventricular relaxation: animal and human validation. J Am CollCardiol 2000;35:201–8.
97. Oki T, Tabata T, Yamada H, et al. Clinical application of pulsedDoppler tissue imaging for assessing abnormal left ventricular relax-ation. Am J Cardiol 1997;79:921–8.
98. Rivas-Gotz C, Khoury DS, Manolios M, Rao L, Kopelen HA,Nagueh SF. Time interval between onset of mitral inflow and onsetof early diastolic velocity by tissue Doppler: a novel index of leftventricular relaxation: experimental studies and clinical application.J Am Coll Cardiol 2003;42:1463–70.
99. Little WC, Ohno M, Kitzman DW, Thomas JD, Cheng CP.Determination of left ventricular chamber stiffness from the time fordeceleration of early left ventricular filling. Circulation 1995;92:1933–9.
00. Garcia MJ, Firstenberg MS, Greenberg NL, et al. Estimation of leftventricular operating stiffness from Doppler early filling deceler-ation time in humans. Am J Physiol Heart Circ Physiol 2001;280:H554 – 61.
01. Pozzoli M. Non-invasive evaluation of the hemodynamic profile inpatients with heart failure: estimation of left atrial pressure (inItalian). Ital Heart J Suppl 2000;1:1326–33.
02. Stein JH, Neumann A, Preston LM, et al. Echocardiography forhemodynamic assessment of patients with advanced heart failure andpotential heart transplant recipients. J Am Coll Cardiol 1997;30:1765–72.
03. Nagueh SF, Mikati I, Kopelen HA, Middleton KJ, Quinones MA,Zoghbi WA. Doppler estimation of left ventricular filling pressure insinus tachycardia. A new application of tissue Doppler imaging.Circulation 1998;98:1644–50.
04. Garcia MJ, Ares MA, Asher C, Rodriguez L, Vandervoort P,Thomas JD. An index of early left ventricular filling that combinedwith pulsed Doppler peak E velocity may estimate capillary wedgepressure. J Am Coll Cardiol 1997;29:448–54.
05. Giannuzzi P, Imparato A, Temporelli PL, et al. Doppler-derivedmitral deceleration time of early filling as a strong predictor ofpulmonary capillary wedge pressure in postinfarction patients withleft ventricular systolic dysfunction. J Am Coll Cardiol 1994;23:1630–7.
06. Mulvagh S, Quinones MA, Kleiman NS, Cheirif J, Zoghbi WA.Estimation of left ventricular end-diastolic pressure from Dopplertransmitral flow velocity in cardiac patients independent of systolicperformance. J Am Coll Cardiol 1992;20:112–9.
07. Ling D, Rankin JS, Edwards CH 2nd, McHale PA, Anderson RW.Regional diastolic mechanics of the left ventricle in the conscious
dog. Am J Physiol 1979;236:H323–30.08. Courtois M, Kovacs SJ, Ludbrook PA. Physiological early diastolicintraventricular pressure gradient is lost during acute myocardialischemia. Circulation 1990;81:1688–96.
09. Greenberg NL, Vandervoort PM, Firstenberg MS, Garcia MJ,Thomas JD. Estimation of diastolic intraventricular pressure gradi-ents by Doppler M-mode echocardiography. Am J Physiol HeartCirc Physiol 2001;280:H2507–15.
10. Rovner A, Smith R, Greenberg NL, et al. Improvement in diastolicintraventricular pressure gradients in patients with HOCM afterethanol septal reduction. Am J Physiol Heart Circ Physiol 2003;285:H2492–9.
11. Yotti R, Bermejo J, Antoranz JC, et al. A noninvasive method forassessing impaired diastolic suction in patients with dilated cardio-myopathy. Circulation 2005;112:2921–9.
12. Rovner A, Greenberg NL, Thomas JD, Garcia MJ. Relationship ofdiastolic intraventricular pressure gradients and aerobic capacity inpatients with diastolic heart failure. Am J Physiol Heart Circ Physiol2005;289:H2081–8.
13. Ingels NB Jr., Hansen DE, Daughters GT 2nd, Stinson EB,Alderman EL, Miller DC. Relation between longitudinal, circum-ferential, and oblique shortening and torsional deformation in the leftventricle of the transplanted human heart. Circ Res 1989;64:915–27.
14. Dong SJ, Hees PS, Siu CO, Weiss JL, Shapiro EP. MRI assessmentof LV relaxation by untwisting rate: a new isovolumic phase measureof tau. Am J Physiol Heart Circ Physiol 2001;281:H2002–9.
15. Notomi Y, Setser RM, Shiota T, et al. Assessment of left ventriculartorsional deformation by Doppler tissue imaging: validation studywith tagged magnetic resonance imaging. Circulation 2005;111:1141–7.
16. Notomi Y, Lysyansky P, Setser RM, et al. Measurement of ventric-ular torsion by two-dimensional ultrasound speckle tracking imaging.J Am Coll Cardiol 2005;45:2034–41.
17. Helle-Valle T, Crosby J, Edvardsen T, et al. New noninvasivemethod for assessment of left ventricular rotation: speckle trackingechocardiography. Circulation 2005;112:3149–56.
18. Notomi Y, Srinath G, Shiota T, et al. Maturational and adaptivemodulation of left ventricular torsional biomechanics: Doppler tissueimaging observation from infancy to adulthood. Circulation 2006;113:2534–41.
19. Notomi Y, Martin-Miklovic MG, Oryszak SJ, et al. Enhancedventricular untwisting during exercise: a mechanistic manifestation ofelastic recoil described by Doppler tissue imaging. Circulation 2006;
113:2524–33.
Related Documents