1 23 Environmental Earth Sciences ISSN 1866-6280 Environ Earth Sci DOI 10.1007/s12665-014-3431-2 Assessment of hydrogeochemistry and the quality of groundwater in 24-Parganas districts, West Bengal Neha Singh, Ravi Prakash Singh, Vikas Kamal, Ratan Sen & Saumitra Mukherjee

Welcome message from author
This document is posted to help you gain knowledge. Please leave a comment to let me know what you think about it! Share it to your friends and learn new things together.
Transcript

1 23
Environmental Earth Sciences ISSN 1866-6280 Environ Earth SciDOI 10.1007/s12665-014-3431-2
Assessment of hydrogeochemistry and thequality of groundwater in 24-Parganasdistricts, West Bengal
Neha Singh, Ravi Prakash Singh, VikasKamal, Ratan Sen & Saumitra Mukherjee

1 23
Your article is protected by copyright and
all rights are held exclusively by Springer-
Verlag Berlin Heidelberg. This e-offprint is
for personal use only and shall not be self-
archived in electronic repositories. If you wish
to self-archive your article, please use the
accepted manuscript version for posting on
your own website. You may further deposit
the accepted manuscript version in any
repository, provided it is only made publicly
available 12 months after official publication
or later and provided acknowledgement is
given to the original source of publication
and a link is inserted to the published article
on Springer's website. The link must be
accompanied by the following text: "The final
publication is available at link.springer.com”.
ORIGINAL ARTICLE
Assessment of hydrogeochemistry and the quality of groundwaterin 24-Parganas districts, West Bengal
Neha Singh • Ravi Prakash Singh • Vikas Kamal •
Ratan Sen • Saumitra Mukherjee
Received: 26 November 2013 / Accepted: 10 June 2014
� Springer-Verlag Berlin Heidelberg 2014
Abstract Hydrogeochemistry of an area helps in under-
standing the geological processes which control the
chemistry of water and play an important role in deter-
mining the suitability of groundwater for various purposes.
In the present study, an attempt has been made to under-
stand the geological processes controlling the quality of
water in a part of North and South 24-Parganas districts of
West Bengal. 39 representative groundwater samples were
collected from the study area and physico-chemical
parameters were analyzed for all the samples. Schoeller
and Durov diagram were used to understand the hydro-
chemical nature of water. Results obtained from water
chemistry were used in the interpretation of controlling
processes using different conventional graphs, and deter-
mining the quality of groundwater. Silicate weathering and
ion exchange are the dominant processes controlling the
chemistry of groundwater in the study area, where calcium
and magnesium in the water are replaced by the sodium
and potassium in the minerals from the host rock as chloro-
alkaline indices are negative at most of the places. Satu-
ration index was calculated to understand the mineralogy
of the subsurface. The groundwater is oversaturated with
iron containing minerals like Fe(OH)3, goethite, and
hematite, while undersaturated with anhydrite and gypsum.
The groundwater suitability was determined by calculating
water quality index for drinking purpose; while SAR, and
residual sodium carbonate indices for the agricultural
purpose. The groundwater in the study area is not suitable
for drinking, but can be used for other household use and in
irrigation for agriculture.
Keywords Hydrochemical facies � Silicate weathering �Ion exchange � Chloro-alkaline indices � Saturation index
Introduction
Groundwater is the major source of freshwater in many
parts of the world for meeting the requirements of domestic
and agricultural purposes. Approximately one-third of the
world’s population depend on groundwater for drinking
purpose (UNEP 1999). Due to the rapid growth of popu-
lation, urbanization and accelerated pace of industrializa-
tion, and due to inadequate supply of surface water, there
has been a tremendous increase in the demand of the
groundwater resources as fresh water. Geology of an area,
the degree of chemical weathering of various rock types,
anthropogenic factors affect the chemistry of groundwater
(Giridharan et al. 2008), and the quality of groundwater is
altered by an increase in concentration of chemical species
with its movement below the ground surface (Freeze and
cherry 1979; Kortatsi 2007).
Urban growth has led to overexploitation of ground-
water (Jameel and Sirajudeen 2006) adversely affecting its
quality and quantity. According to Central Ground Water
Board, out of 432 km3/year fresh groundwater resources in
India, 396 km3 is estimated to be utilizable. Due to the
varied utilization of land, there is a lot of variation in the
quality of groundwater from place to place. A number of
studies (Durvey et al. 1997; Dasgupta and Purohit 2001;
Khurshid et al. 2002; Subba Rao 2006) have been carried
out in different parts of India to determine the groundwater
quality with respect to drinking and irrigation purposes. An
understanding about the chemical quality of groundwater is
essential in determining its usefulness for domestic,
industrial and agricultural purposes (Mukherjee et al.
N. Singh � R. P. Singh � V. Kamal � R. Sen � S. Mukherjee (&)
School of Environmental Sciences, Jawaharlal Nehru University,
New Delhi 110067, India
e-mail: [email protected]
123
Environ Earth Sci
DOI 10.1007/s12665-014-3431-2
Author's personal copy

2005). The chemistry of groundwater depends on the
minerals present in geological formations and is also con-
trolled by many interrelated processes, and thus can be
used to understand the hydrogeological processes, the
mechanisms controlling the quality of groundwater (Zuane
1990).
West Bengal lies within the Ganga–Brahmaputra delta
basin and is one of the states, which has high contamina-
tion of arsenic in groundwater (Mukherjee et al. 2008).
Though much work has been carried out focusing the
arsenic contamination and its effect on the human health in
the study area, very limited studies have been carried out to
determine undergoing processes controlling the quality of
groundwater, hydrogeochemistry of the area and the suit-
ability of groundwater for different purposes. Groundwater
quality assessment was done in the South 24-Parganas of
West Bengal to find the suitability of groundwater for
drinking and agricultural purposes (Mukherjee et al. 2005).
In the present study, the assessment of hydrogeochemistry
of the study area has been carried out to determine the
processes controlling the groundwater chemistry. Though
the area comes under the arsenic contaminated districts of
West Bengal, an assessment of groundwater quality for
drinking purpose using water quality index, and for agri-
cultural purpose using indices like sodium adsorption ratio,
sodium percentage, residual sodium carbonate, Kelley’s
ratio, magnesium hazard, and the permeability index has
been carried out.
Study area and methods
Study area
The study area is a part of North 24-Parganas and South
24-Parganas districts of West Bengal (Fig. 1). The area lies
within the Bengal basin, a large asymmetrical pericratonic
basin in the north eastern part of India. The area has a hot
and humid climate receiving adequate rainfall from north
east and south west monsoon. The region has levees, del-
taic plains and swamp areas as major geomorphological
features. In the study area, intermediate and lower aquifers
are reported to be located at shallower depth in North
24-Parganas, while at greater depth in South 24-Parganas
Fig. 1 Study area
Environ Earth Sci
123
Author's personal copy

(Chakraborti et al. 1996). The shallow and intermediate
aquifers are found to be arsenic enriched.
In North 24-Parganas the river is slow and meandering
and the region is a part of mature delta plain, while South
24-Parganas falls in an active delta region where the for-
mation of the delta is a continuous process. Mineral
assemblage of kyanite–garnet–staurolite–biotite–tourma-
line–chlorite–hornblende–epidote in the subsurface sedi-
ments of the 24-Parganas represents highly metamorphosed
rocks. Groundwater in the intermediate aquifer contains
calcium, magnesium, bicarbonate as the major ions with
elevated concentration of iron, phosphate and arsenic
(PHED 1991; Das et al. 1995). Elangovan and Chalakh
(2006) reported the presence of major quantities of quartz
and feldspar in the XRD analysis of the sediments.
North 24-Parganas is the most populous district of West
Bengal. It is the second most and South 24-Parganas is the
sixth most populous district in India. As agriculture is the
dominating sector in both the districts, net irrigated area
reported to be 200.56 thousand ha in North 24-Parganas
and 115.73 thousand ha in South 24-Parganas. As
groundwater is the main source of freshwater supply, the
district depends on groundwater for drinking as well as
agricultural purposes. A huge amount of groundwater is
required for irrigation as rice is the main agricultural
product in this region. Thus, determining the suitability of
groundwater for drinking and agriculture purpose has been
carried out in the present study.
Sampling and sample analysis
Based on the surface manifestations of hydrogeomorpho-
logical features as inferred from satellite imagery, total 39
groundwater samples were collected from North 24-Parg-
anas and northern part of South 24-Parganas in the month
of February, 2012. The locations of the sampling sites were
recorded using Garmin GPS. Polypropylene bottles (Tar-
son: 250 and 125 ml) were acid washed, rinsed with dis-
tilled water and dried before using them for sampling
purpose. These dried bottles were carried to field in the
sampling bag, and were used during the collection of water
samples from each site. Groundwater samples were col-
lected from the hand pumps that were in working condi-
tions and were in use by the local residents. Water was
discarded for 20–25 strokes to minimize the impacts of iron
pipe, and then the bottles were rinsed two to three times
with groundwater to be sampled. Samples collected in
125 ml bottle were acidified with HNO3 to bring the pH \2
for cation and heavy metal analysis, and samples of 250 ml
bottle were preserved without acidification (Rina et al.
2013; Chetia et al. 2011). Field blank was also collected to
evaluate the contamination in the sample container. pH and
EC were measured onsite using respective electrode
(Hanna). The samples were brought to the laboratory in ice
containing Styrofoam boxes, vacuum filtered using
0.45 lm Millipore filter paper and stored at 4 �C for further
analysis.
The physical and chemical parameters were determined
by following the standard protocol given by the American
Public Health Association (APHA 2005). Bicarbonate and
chloride were analyzed using titration method, while
phosphate, sulphate, nitrate and fluoride were analyzed
using double beam UV–Vis spectrophotometer (Perkin
Elmer) following APHA. Sodium, potassium and calcium
were analyzed on Flame photometer, while other cations
were analyzed on Thermo Scientific Atomic Adsorption
Spectrophotometer (AAS). Arsenic was analyzed on AAS
using a hydride generator. Analytical accuracy of mea-
surement of ions was estimated by calculating normalized
charge balance index.
Results and discussion
The result of groundwater quality data has been given in
Table 1 in the form of minimum, maximum, and mean.
Chemical data of the groundwater samples were plot-
ted on Schoeller and Durov plot to infer hydrogeochem-
ical facies. Schoeller diagram (1955) represents variation
of major cations and anions in the groundwater samples
on a single graph. Diagram (Fig. 2) shows that calcium
and bicarbonate are the dominating ions, while the con-
centration of sodium ? potassium, chloride and sulphate
vary in all the groundwater samples. Durov diagram is
based on percentage of milliequivalent values of major
ions, and provides a better display of hydrochemical types
Table 1 Mean, maximum, and average chemical composition of
groundwater
Parameters Min Max Avg
pH 6.8 8.1 7.27
EC (lS/cm) 540 1,300.0 869.23
Na2? (ppm) 48.5 173.700 85.27
K? (ppm) 1 8.20 3.85
Mg2? (ppm) 56.79 88.61 65.39
Ca2? (ppm) 67.53 139.34 97.83
Fe2? (ppm) 0.00 15.29 2.15
As (ppb) 0.77 69.45 15.39
HCO3-(mg/l) 496.12 997.50 706.22
Cl- (mg/L) 4.74 457.45 112.63
PO43-(mg/L) 12.13 312.32 119.34
NO3- (mg/L) 0.00 18.00 2.36
SO42- (mg/L) 0.01 49.12 9.74
Dissolved silica (mg/L) 29.63 83.29 60.63
Environ Earth Sci
123
Author's personal copy

along with the values of TDS and pH. Durov (1949)
described the groundwater having 100–300 mg/L TDS, as
the simple or primary water having bicarbonates of cal-
cium and magnesium. When water of first type is enri-
ched by soluble sulphate and chloride salts of magnesium
and alkali, its mineralization get increased from 500 to
1,000 mg/L. In the Durov diagram for the groundwater
samples, the anions and cations together total 100 %.
TDS value of the groundwater samples in the present
study ranges from 400 to 800 mg/L, which indicates that
the groundwater in the study area is mainly of secondary
or transition type. Durov diagram (Fig. 3) shows that
groundwater have higher concentration of bicarbonate and
chloride anions, while alkali (Na ? K) and alkaline earth
Fig. 2 Schoeller diagram for
water samples
Fig. 3 Durov diagram for water
samples
Environ Earth Sci
123
Author's personal copy

metals (Ca ? Mg) are present nearly in equilibrium. It
may be due to the enrichment of bicarbonates of calcium
and magnesium in groundwater with sulphate and chlo-
ride salts of alkali and magnesium. pH of the groundwater
varies from 6.8 to 8.1.
The Schoeller and Durov diagram shows the dominance
of bicarbonate, chloride, alkali and alkaline metals. Thus, it
is essential to understand the hydrogeological processes
which control the groundwater chemistry. The results
obtained from the water analysis were subjected to various
conventional graphs to understand these processes in the
study area.
Hydrogeochemistry
In the scatter diagram of (Ca ? Mg) vs. (HCO3 ? SO4),
samples falling above the equiline (1:1), represent car-
bonate weathering (dissolution of calcite, dolomite, and
gypsum) and reverse ion exchange as dominant processes;
while samples falling below the equiline indicate the sili-
cate weathering and ion exchange within the area (Datta
et al. 1996; Rajmohan and Elango 2004). In the present
study, most of the samples fall below the equiline (Fig. 4)
due to an excess of bicarbonate, which indicate that silicate
weathering and ion exchange are the governing processes,
while some of the samples present above the equiline
indicate that carbonate weathering and reverse ion-
exchange processes also occur at some of the places.
However, in scatter plot of HCO3- vs. Na? (Fig. 5),
increased concentration of HCO3- compared to Na? sug-
gests that silicate weathering is the dominant process in the
study area. Atmospheric CO2 reaches to the ground in the
form of carbonic acid with rainwater, and initiates the
weathering process. Bicarbonate is the major anionic
product of the weathering process, besides the release of
various cations. A general reaction for silicate weathering
can be written as:
ðNaþ; Mg2þ; Ca2þ; KþÞ silicates þ H2CO3
! H4SiO4 þ HCO�3 þ Naþ þ Mg2þ þ Ca2þ þ Kþ þ Clays
whereas calcite dissolution can be represented as:
CaCO3 þ H2CO3 ! Ca2þ þ 2HCO�3
Depending on the availability of dissolved CO2 and
carbonic acid, the carbonate minerals, which are present on
the path, get dissolved during infiltration of rainwater.
Further concentration of HCO3- in ground water is also
increased by silicate weathering as can be inferred in the
present study from the scatter plot of HCO3 vs. Na (La-
kshmanan et al. 2003). This graph shows the excess of
bicarbonate in groundwater in comparison to sodium,
which means that the excess bicarbonate must be balanced
by other cations. The scatter plot for Ca ? Mg vs.
HCO3 ? CO3 (Fig. 6) suggests that an excess of bicar-
bonate in the water is balanced by Ca ? Mg, as nearly all
samples fall above the equiline (1:1).
The scatter plot of Ca ? Mg vs. total cations (Fig. 7)
shows an increasing contribution of alkalies to major ions
which suggest that silicate weathering plays an important
role within the study area (Subba Rao 2008) as all the
Fig. 4 Scatter plot for Ca ? Mg vs. SO4 ? HCO3
Fig. 5 Scatter plot for HCO3 vs. Na
Fig. 6 Scatter plot for Ca ? Mg vs. HCO3 ? CO3
Environ Earth Sci
123
Author's personal copy

samples fall below the equiline. In the scatter plot of
Na ? K vs. total cations (Fig. 8), all the samples are
present below the equiline and above the Na ? K/0.50 TC
line, which indicates that silicate weathering is more sig-
nificant and is the main source of cations (Stallard and
Edmond 1983). Increase in alkalies with the simultaneous
increase of Cl- ? SO4 (Fig. 9) indicates a common source
of these ions, resulting from dissolution of soil salts (Sarin
et al. 1989; Datta and Tyagi 1996). Excess of Na over K is
observed due to the greater resistance of K to chemical
weathering (Subba Rao 2008).
Besides weathering and dissolution of minerals, ion
exchange and adsorption of cations play an important role
in controlling the ion ratios in groundwater. The scatter
plot of Ca ? Mg vs. HCO3 ? SO4 suggests that ion
exchange is prevalent throughout the study area. In Na vs.
Ca scatter diagram (Fig. 10) most of the samples fall below
the equiline showing increased concentration of Ca com-
pared to Na. This further strengthens the support for ion-
exchange process in the study area. Ion-exchange process
may be responsible for higher concentration of Na in
groundwater. Most of the samples have a Na/Cl ratio
around or above 1 (Table 2) indicating that ion exchange is
prevalent throughout the study area (Kumar et al. 2006).
Ion exchange can lead to replacement of Ca in groundwater
from Na adhered on clay particles.
Changes in chemical composition of groundwater take
place during its travel in the subsurface (Sastri 1994). The
chloro-alkaline indices CAI-1 and CAI-2 indicate the ion
exchange between the groundwater and its host environ-
ment during a residence time or travel (Schoeller 1965,
1967, 1977). The chloro- alkaline indices used in evalua-
tion are calculated using the formulae:
Chloro Alkaline Indices ðCAI-1Þ ¼ ½Cl�ðNaþ KÞ�=Cl
Chloro Alkaline Indices ðCAI-2Þ¼ ½Cl�ðNaþ KÞ�=ðSO4 þ HCO3 þ CO3 þ NO3Þ
When there is cation exchange of sodium and potas-
sium from water with magnesium and calcium in the host
rock, the exchange is known as direct, when indices are
positive. If the indices are negative, the exchange is
reversed and indirect indicating chloro-alkaline disequi-
librium (Schoeller 1967; Kumar et al. 2007). Figure 11
shows that most of the samples have negative values for
both indices, which indicate an indirect base exchange
reaction, which means that Ca2? and Mg2? in the water
are exchanged with Na? and K? in the minerals from the
host rock. This explains the reason for the abundance of
alkalies in the groundwater over alkaline earth elements.
Cation exchange is possible when exchange sites such as
Fig. 7 Scatter plot for Ca ? Mg vs. TC Fig. 8 Scatter plot for Na ? K vs. total cations
Fig. 9 Scatter plot for Na ? K vs. Cl ? SO4
Fig. 10 Scatter plot for Na vs. Ca
Environ Earth Sci
123
Author's personal copy

clay minerals are present. Clay minerals are the product
of silicate weathering (Acheampong and Hess 1998; Yi-
dana et al. 2008) thus enhancing the ion-exchange process
in the study area. The chloro-alkaline index values of the
groundwater samples from the study area indicate a base
exchange reaction (chloro-alkaline disequilibrium) exist-
ing in the majority of samples (33 samples). These sam-
ples may be referred as base exchange softened water,
where the alkaline earth had been exchanged for Na?
(HCO3- [ Ca2? ? Mg2?) (Table 2). In the rest of the
samples at six sites, the values are positive, indicating
chloro-alkaline equilibrium, in which the Na? ions have
been exchanged for the alkaline earths (Ca2? ?
Mg2? [ HCO3-); these can be referred as a base
exchange hardened water (Handa 1969). In the present
study, a majority of the samples had HCO3- concentra-
tion higher than alkaline earths, indicating base exchange
softened water.
Table 2 Na/Cl, CAI-1, CAI-2
values for all groundwater
samples
S. no. Na/Cl CAI1 CAI2 Ca ? Mg/HCO3
1 0.61 0.30 0.27 1.19 Ca2?? Mg2? > HCO3-
2 0.75 0.14 0.11 1.13 Ca2?? Mg2? > HCO3-
3 0.52 0.40 0.59 1.34 Ca2?? Mg2? > HCO3-
4 1.82 -1.12 -0.32 0.96 HCO3- > Ca2?? Mg2?
5 0.62 0.27 0.24 1.05 Ca2?? Mg2? > HCO3-
6 0.64 0.24 0.17 0.87 HCO3- > Ca2?? Mg2?
7 1.32 -0.60 -0.15 0.71 HCO3- > Ca2?? Mg2?
8 1.91 -1.31 -0.25 0.78 HCO3- > Ca2?? Mg2?
9 6.09 -6.53 -0.33 0.89 HCO3- > Ca2?? Mg2?
10 2.98 -2.75 -0.37 1.12 Ca2?? Mg2? > HCO3-
11 1.25 -0.49 -0.16 0.96 HCO3- > Ca2?? Mg2?
12 1.22 -0.53 -0.13 0.83 HCO3- > Ca2?? Mg2?
13 1.14 -0.38 -0.14 0.97 HCO3- > Ca2?? Mg2?
14 2.05 -1.56 -0.21 0.81 HCO3- > Ca2?? Mg2?
15 3.97 -4.23 -0.25 0.88 HCO3- > Ca2?? Mg2?
16 4.54 -4.82 -0.23 0.85 HCO3- > Ca2?? Mg2?
17 1.25 -0.67 -0.12 1.04 Ca2?? Mg2? > HCO3-
18 1.09 -0.44 -0.08 1.00 Ca2?? Mg2? > HCO3-
19 1.58 -0.99 -0.20 0.95 HCO3- > Ca2?? Mg2?
20 15.79 -21.38 -0.22 0.76 HCO3- > Ca2?? Mg2?
21 3.42 -3.81 -0.19 0.81 HCO3- > Ca2?? Mg2?
22 2.54 -2.31 -0.19 0.84 HCO3- > Ca2?? Mg2?
23 1.94 -1.70 -0.16 0.89 HCO3- > Ca2?? Mg2?
24 1.44 -0.99 -0.12 0.86 HCO3- > Ca2?? Mg2?
25 1.30 -0.69 -0.11 0.82 HCO3- > Ca2?? Mg2?
26 0.42 0.51 0.57 1.15 Ca2?? Mg2? > HCO3-
27 1.54 -0.94 -0.15 0.86 HCO3- > Ca2?? Mg2?
28 1.48 -1.00 -0.14 0.87 HCO3- > Ca2?? Mg2?
29 2.34 -2.01 -0.33 1.25 Ca2?? Mg2? > HCO3-
30 3.35 -3.33 -0.21 0.73 HCO3- > Ca2?? Mg2?
31 2.40 -2.04 -0.21 0.75 HCO3- > Ca2?? Mg2?
32 3.76 -4.15 -0.18 0.70 HCO3- > Ca2?? Mg2?
33 1.69 -1.11 -0.21 0.78 HCO3- > Ca2?? Mg2?
34 1.05 -0.16 -0.07 0.74 HCO3- > Ca2?? Mg2?
35 1.23 -0.42 -0.15 0.75 HCO3- > Ca2?? Mg2?
36 1.27 -0.63 -0.09 0.67 HCO3- > Ca2?? Mg2?
37 1.30 -0.61 -0.15 0.99 HCO3- > Ca2?? Mg2?
38 6.63 -7.92 -0.28 0.91 HCO3- > Ca2?? Mg2?
39 2.15 -1.77 -0.24 1.18 Ca2?? Mg2? > HCO3-
Environ Earth Sci
123
Author's personal copy

Geochemical modelling
Saturation index of minerals was calculated by the USGS
geochemical code PHREEQC 3.1.2 to evaluate the degree
of equilibrium between water and the respective mineral.
Calculation of saturation indices helps in predicting the
reactive mineralogy of the subsurface from groundwater
data (Deutsch 1997). Saturation index is the logarithm of
the ratio of ion activity product (IAP) to the mineral
equilibrium constant (Ksp).
SI ¼ logIAP
Ksp
� �
A positive saturation index (SI [ 0) indicates that the
groundwater is oversaturated with respect to a particular
mineral and hence is incapable of dissolving more of the
mineral. Such index values reflect groundwater discharging
from an aquifer containing ample amounts of mineral with
sufficient resident time. A negative saturation index
(SI \ 0) indicates that the groundwater is undersaturated
with respect to particular mineral and reflect insufficient
amount of mineral for solution or short residence time.
Neutral SI indicates that the groundwater is in equilibrium
with the particular mineral phase.
Variation of the saturation index for different minerals is
shown in Fig. 12. The calculated saturation index values of
minerals by PHREEQC demonstrate that the groundwater
in the area is supersaturated with iron containing minerals
like Fe(OH)3, goethite, and hematite. The water is also
saturated with the calcite, chalcedony, dolomite, quartz.
Sepiolite, siderite, chrysotile and talc are oversaturated at
some of the places and undersaturated at some sites. The
groundwater is undersaturated with anhydrite and gypsum.
Oversaturation of hematite, goethite and Fe(OH)3 in the
study area indicates the abundance of iron minerals in the
aquifer. Groundwater gets sufficient residence time to be in
contact with these minerals and their weathering has
resulted in abundance of iron in the groundwater. Calcite,
dolomite and siderite are the carbonate minerals, while
chalcedony, quartz, sepiolite, chrysotile are the silicate
minerals. Sepiolite is a clay mineral formed of complex
magnesium silicate and is frequently found either with
gypsum or dolomite (Leguey et al. 2010). Groundwater is
undersaturated with anhydrite and gypsum, and less con-
centration of sulphate in the groundwater explains the less
dissolution of these minerals. The high concentration of
calcium in groundwater may be attributed to the dissolution
of calcite and dolomite as carbonate weathering also occurs
at some of the places (Fig. 2). Talc is hydrated magnesium
silicate which can be formed from either reaction between
dolomite and silica or the metamorphism of magnesium
minerals in the presence of carbon dioxide and water.
Oversaturation of talc in groundwater may be the result of
either process in the aquifer.
Mineral assemblage of the subsurface sediment is mainly
silicate group. Biotite is a phyllosilicate mineral containing
potassium, magnesium and iron with the silicate group.
Tourmaline is a silicate mineral with elements like iron,
magnesium, sodium, potassium, calcium. Garnets are a group
of silicate minerals in which silicate group is balanced by the
divalent cations like calcium, magnesium, and iron, and tri-
valent cations like aluminium, iron, and chromium. Staurolite
contains iron as the divalent cation in its silicate structure.
Hornblende is a mixture of calcium–iron–magnesium sili-
cate, aluminium–iron–magnesium silicate and iron–magne-
sium silicate. Epidote is also a silicate mineral with calcium,
aluminium and iron. Aquifer of the study area is composed of
mainly silicate minerals, thus the silicate weathering plays an
important role in the study area. The dissolution of the sili-
cate minerals present in the aquifer determines the chemistry
of groundwater and is responsible for increased concentration
of cations and bicarbonate in the area. Singh et al. (2013)
have tried to relate the elevated concentration of arsenic with
the process of silicate weathering and ion exchange. Goethite
forms through the weathering of various iron rich minerals in
the zone of oxidation within the soil. Oversaturation of
groundwater with goethite indicates that the mineral may
have formed in the subsurface because of the aerated zone
within the aquifer created by the fluctuation in the water
table. Arsenic was reported to be adsorbed to iron hydroxide
Fig. 11 Scatter plot for CAI-1 vs. CAI-2
Fig. 12 Plot of saturation indices (SI) of minerals
Environ Earth Sci
123
Author's personal copy

coated sand grain margins and to clay minerals (Acharyya
et al. 1999) and on the surface of grains coated with Fe
oxyhydroxides (Nickson et al. 2000). Saturation index indi-
cates the presence of iron minerals and iron oxyhydroxides
(FeOOH, goethite) in abundance in the aquifer. Thus,
weathering of these minerals helps in the release of arsenic
into the groundwater resulting in the elevated concentration
of arsenic in the groundwater.
Groundwater suitability
Groundwater chemistry can be utilized to evaluate water
quality for drinking, agricultural and industrial purposes
(Subba Rao 2006; Edmunds et al. 2002). Water quality
index has been used to assess the suitability of groundwater
for drinking purpose and due to abundance of sodium and
bicarbonate in the area indices like SAR and residual
sodium bicarbonate have been used to determine its suit-
ability for agricultural purposes.
Water quality index
Water quality index is an important tool which provides
information about the composite influence of individual
water quality parameters on the overall quality of water for
most of the domestic purposes (Mitra and Member 1998).
The water quality index is calculated to determine water
quality and its suitability for drinking purpose (Tiwari and
Mishra 1985; Naik and Purohit 2001; Avvannavar and
Shrihari 2008). WQI helps in reducing a large number of
physico-chemical variables into a single number which
expresses the overall water quality at certain locations
(Yogendra and Puttaiah 2008). WQI generates a score by
integrating complex data set and helps in understanding
water quality issues and evaluating water quality trends
(Boyacioglu 2007). In the present study, WHO recom-
mended standard for drinking water has been used and
weighted index methods developed by Tiwari and Mishra
(1985); Asadi et al. (2007) have been followed to deter-
mine the suitability of groundwater for drinking purposes.
In this study, the water quality index has been calculated
upon the basis of 14 parameters. In the first step, each
parameter has been assigned a weight (wi) between 1 and 5
according to its relative importance in determining the
overall quality of groundwater in the study area (Table 3).
In the second step, relative weight (Wi) is calculated using
the following equation:
Wi ¼ wi=Xn
i¼1
wi
where, Wi is the relative weight, wi is the weight of each
parameter, n is the number of parameters
In the third step, quality rating scale (qi) for each
parameter is calculated by:
qi ¼ ðCi=SiÞ � 100
where, qi is the quality rating, Ci is the concentration of
each chemical parameter, Si is WHO standard
Water quality index is calculated by determining SI of
each chemical parameter as per the following equation:
SIi ¼ Wi � qi
WQI ¼X
SIi
where, SI is sub-index of ith parameter.
WQI is water quality index
In the present study, maximum weight was given to arsenic
as the study area has the problem of arsenic contamination
and prolonged drinking of contaminated water may dete-
riorate the human health. Iron has been given the weigh-
tage of 4 as the higher concentration of iron in groundwater
worsen the taste and the quality for drinking purpose;
minimum weight was given to nitrate and sulphate as these
are present in very low concentration within the WHO limit
in the study area. Most of the water samples (66.7 %) fall
under the poor category, some samples (17.9 %) fall under
very poor and few samples (12.8 %) come under water
unsuitable for drinking purposes (Table 4).
The quality of water is degraded in the study area due to
higher concentration of arsenic and iron. Nearly all the
samples are unsuitable for the drinking purpose. Calcula-
tion of water quality index may be used to demarcate the
Table 3 Relative weight of chemical parameters
Chemical
parameters
WHO
Standard
Weight
(wi)
Relative
weight (Wi)
pH 8.5 3 0.081
EC 300 3 0.081
TDS 1,000 4 0.108
Na (mg/l) 200 3 0.081
K (mg/l) 12 1 0.027
Ca (mg/l) 75 3 0.081
Mg (mg/l) 50 2 0.054
Zinc (mg/l) 5 2 0.054
Iron (mg/l) 0.3 4 0.108
Arsenic (lg/l) 10 5 0.135
Sulphate (mg/l) 250 1 0.027
Nitrate (mg/l) 50 1 0.027
Chloride (mg/l) 250 3 0.081
Bicarbonate (mg/l) 120 2 0.054
R wi = 37 R Wi = 1
Environ Earth Sci
123
Author's personal copy
hand pumps suitable or unsuitable for drinking purpose
taking water chemistry into account.
SAR and sodicity index
SAR is a measure of alkali/sodium hazards to crops and is
an important parameter to determine the suitability of
groundwater for irrigation (Subramani et al. 2005) as it is
directly related to adsorption of sodium by soil. Karanth
(1987) defined SAR as:
SAR ¼ Na=ffiffiffiffiffiffiffiffiffiffiffiffiffiffiffiffiffiffiffiffiffiffiffiffiffiffiffiðCaþMgÞ=2
pwhere, all ionic concentrations are expressed in meq/l.
Groundwater having higher SAR values is generally not
suitable for irrigation. Higher deposition of sodium may
deteriorate the soil characteristics by reducing soil per-
meability and thus inhibiting the supply of water needed
for the crops. SAR is an important parameter to measure
the sodium hazard for ground water having high bicar-
bonate concentration. The SAR values range from 0.94 to
3.15. According to Richards (1954) classification, all the
samples belong to an excellent category. Replacement of
calcium and magnesium with sodium causes the damage to
soil structure by making them compact and impervious.
SAR indicates the degree to which irrigation water initiates
cation-exchange reactions in soil. The groundwater in the
study area is perfectly suitable for irrigation as all the
collected samples are in excellent category having SAR
values \10.
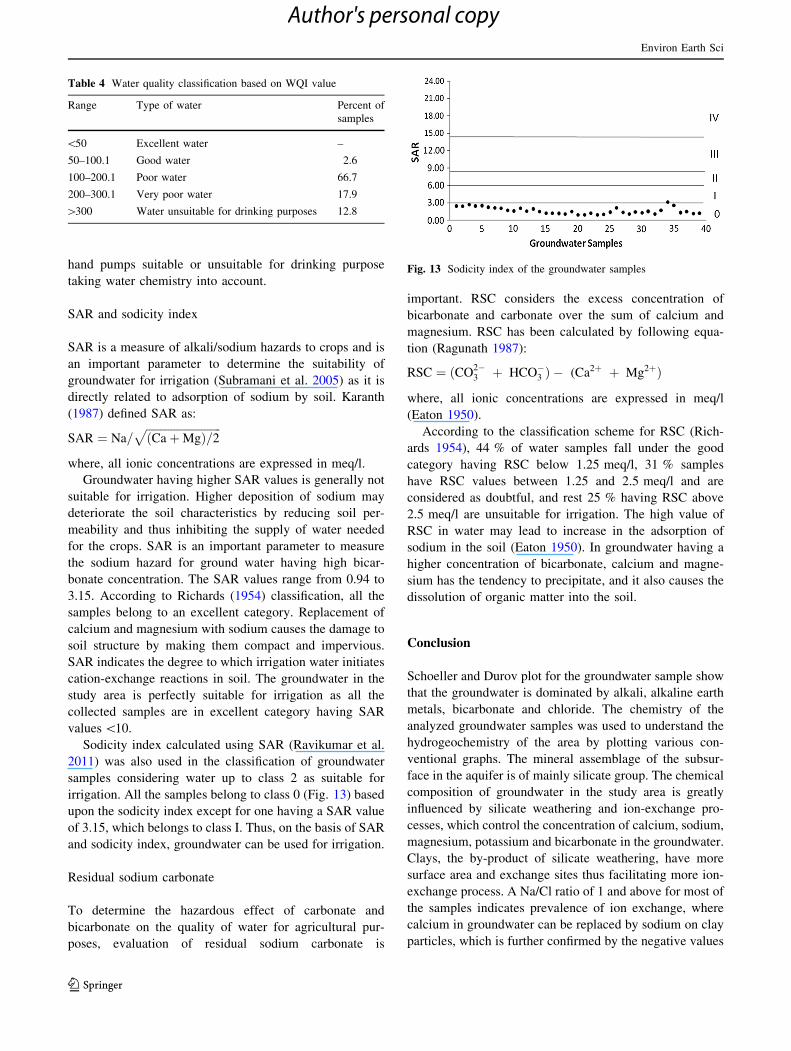
Sodicity index calculated using SAR (Ravikumar et al.
2011) was also used in the classification of groundwater
samples considering water up to class 2 as suitable for
irrigation. All the samples belong to class 0 (Fig. 13) based
upon the sodicity index except for one having a SAR value
of 3.15, which belongs to class I. Thus, on the basis of SAR
and sodicity index, groundwater can be used for irrigation.
Residual sodium carbonate
To determine the hazardous effect of carbonate and
bicarbonate on the quality of water for agricultural pur-
poses, evaluation of residual sodium carbonate is
important. RSC considers the excess concentration of
bicarbonate and carbonate over the sum of calcium and
magnesium. RSC has been calculated by following equa-
tion (Ragunath 1987):
RSC ¼ ðCO2�3 þ HCO�3 Þ � (Ca2þ þ Mg2þÞ
where, all ionic concentrations are expressed in meq/l
(Eaton 1950).
According to the classification scheme for RSC (Rich-
ards 1954), 44 % of water samples fall under the good
category having RSC below 1.25 meq/l, 31 % samples
have RSC values between 1.25 and 2.5 meq/l and are
considered as doubtful, and rest 25 % having RSC above
2.5 meq/l are unsuitable for irrigation. The high value of
RSC in water may lead to increase in the adsorption of
sodium in the soil (Eaton 1950). In groundwater having a
higher concentration of bicarbonate, calcium and magne-
sium has the tendency to precipitate, and it also causes the
dissolution of organic matter into the soil.
Conclusion
Schoeller and Durov plot for the groundwater sample show
that the groundwater is dominated by alkali, alkaline earth
metals, bicarbonate and chloride. The chemistry of the
analyzed groundwater samples was used to understand the
hydrogeochemistry of the area by plotting various con-
ventional graphs. The mineral assemblage of the subsur-
face in the aquifer is of mainly silicate group. The chemical
composition of groundwater in the study area is greatly
influenced by silicate weathering and ion-exchange pro-
cesses, which control the concentration of calcium, sodium,
magnesium, potassium and bicarbonate in the groundwater.
Clays, the by-product of silicate weathering, have more
surface area and exchange sites thus facilitating more ion-
exchange process. A Na/Cl ratio of 1 and above for most of
the samples indicates prevalence of ion exchange, where
calcium in groundwater can be replaced by sodium on clay
particles, which is further confirmed by the negative values
Fig. 13 Sodicity index of the groundwater samples
Table 4 Water quality classification based on WQI value
Range Type of water Percent of
samples
\50 Excellent water –
50–100.1 Good water 2.6
100–200.1 Poor water 66.7
200–300.1 Very poor water 17.9
[300 Water unsuitable for drinking purposes 12.8
Environ Earth Sci
123
Author's personal copy

of chloro-alkaline indices. Saturation indices calculated
using PHREEQC show that groundwater is oversaturated
with the iron bearing minerals. Presence of goethite also
indicates that the fluctuation in water table may have cre-
ated the oxidation zone in the aquifer. Silicate weathering
results in dissolution of arsenic from the surface of the
grains coated with iron hydroxide and iron oxyhydroxide
into the groundwater. Water quality index calculated to
find the suitability of groundwater for drinking purpose
shows that most of the samples fall under the poor to very
poor category. Taking account of all the parameters in the
study, groundwater was found to be unsuitable for drink-
ing. The groundwater in the study area contains higher
concentration of sodium and bicarbonate, thus suitability of
groundwater in terms of SAR and residual sodium car-
bonate was calculated for irrigation purpose. Groundwater
is suitable for irrigation in terms of SAR, but due to excess
of bicarbonate some of the samples come under the
doubtful category. Due to abundance of silicate minerals in
the subsurface sediments of the aquifer, groundwater
chemistry is controlled by silicate weathering and ion-
exchange processes and due to higher concentration of
arsenic and iron, the groundwater is unsuitable for drinking
purpose.
Acknowledgments Financial support as Senior Research fellowship
provided by the University Grant Commission is duly acknowledged.
The author is also thankful to Jawaharlal Nehru University for pro-
viding various research facilities.
References
Acharyya SK, Chackraborty P, Lahiri S, Raymahashay BC, Guha S,
Bhowmik A (1999) Arsenic poisoning in the Ganges delta. Nat
401:545
Acheampong SY, Hess JW (1998) Hydrogeological and hydrochemical
framework of the shallow groundwater system in the southern
Voltaian sedimentary basin, Ghana. J Hydrogeol 6:527–537
APHA (2005) Standard methods for the examination of water and
waste water, 21st edn. American Public Health Association,
Washington DC
Asadi SS, Vuppala P, Reddy MA (2007) Remote sensing and GIS
techniques for evaluation of groundwater quality in municipal
corporation of Hyderabad (Zone-V), India. Int J Environ Res and
Public Heal 4(1):45–52
Avvannavar SM, Shrihari S (2008) Evaluation of water quality index
for drinking purposes for river Netravathi, Mangalore, South
India. Environ Monit Assess 143:279–290
Boyacioglu H (2007) Development of a water quality index based on
a European classification scheme. Water SA 33(1):101–106
Chakraborti D, Das D, Samanta BK, Mandal BK, Chowdhury T,
Chanda CR, Chowdhury PP, Basu GK (1996) Arsenic in
groundwater in six districts of West Bengal, India. Environ
Geochem Health 18:5–15
Chetia M, Chatterjee S, Banerjee S, Nath MJ, Singh L, Srivastava RB,
Sarma HP (2011) Groundwater arsenic contamination in Brah-
maputra river basin: a water quality assessment in Golaghat
(Assam), India. Environ Monit Assess 173:371–385
Das D, Chatterjee A, Mandal BK, Samanta G, Chakraborty D,
Chanda B (1995) Arsenic in groundwater in six districts of West
Bengal, India: the biggest arsenic calamity in the world, Part 2:
Arsenic concentration in drinking water, hair, nails, urine, skin-
scale and liver tissue (biopsy) of the affected people. Anal
120:917–924
Dasgupta AM, Purohit KM (2001) Status of surface and groundwater
quality of Mandiakadar—Part II: agricultural utilities. Pollut Res
20(2):219–225
Datta PS, Tyagi SK (1996) Major ion chemistry of groundwater of
Delhi area: chemical weathering processes and groundwater flow
regime. J Geol Soc India 47:179–188
Datta PS, Bhattacharya SK, Tyagi SK (1996) 18O studies on recharge
of phreatic aquifers and groundwater flow-paths of mixing in the
Delhi area. J Hydrol 176:25–36
Deutsch WJ (1997) Groundwater geochemistry: fundamentals and
application to contamination. CRC Press, Boca Raton
Durov SA (1949) Treugolnaja forma graficeskogo vyrazenija rezul-
tatov vodnych analizov I primenenije jejo k klassifikaciji
prirodnych vod. Gidrochem.materialy 16:54
Durvey VS, Sharma LL, Saini VP, Sharma BK (1997) Handbook on
the methodology of water quality assessment. Rajasthan Agri-
culture University, India
Eaton EM (1950) Significance of carbonate in irrigation water. Soil
Sci 69:12–133
Edmunds WM, Carrillo-Rivera JJ, Cardona A (2002) Geochemical
evolution of groundwater beneath Mexico City. J Hydrol 258:1–24
Elangovan D, Chalakh ML (2006) Arsenic pollution in West Bengal.
Tech Dig 9:31–35
Freeze RA, Cherry JA (1979) Groundwater. Prentice-Hall, New
Jersey
Giridharan L, Venugopal T, Jayaprakash M (2008) Evaluation of the
seasonal variation on the geochemical parameters and quality
assessment of the groundwater in the proximity of River Cooum,
Chennai, India. Environ Monit Assess 143:161–178
Handa BK (1969) Description and classification of media for hydro-
geochemical investigations. In: Symposium on ground water
studies in arid and semiarid regions, Roorkee
Jameel A, Sirajudeen J (2006) Risk assessment of physico-chemical
contaminants in groundwater of Pettavaithalai Area, Tiruchirap-
palli, Tamilnadu, India. Environ Monit Assess 123:299–312
Karanth KR (1987) Groundwater assessment, development and
management (pp720). Tata McGraw Hill, New Delhi
Khurshid SH, Hasan N, Zaheeruddin M (2002) Water quality status
and environmental hazards in parts of Yamuna-Karwan sub-
basin of Aligarh-Mathura district, Uttar Pradesh. India. J Appl
Hydrol 14(4):30–37
Kortatsi BK (2007) Hydrochemical framework of groundwater in the
Ankobra Basin, Ghana. Aquat Geochem 13:41–74
Kumar M, Ramanathan AL, Rao MS, Kumar B (2006) Identification
and evaluation of hydrogeochemical processes in the ground-
water environment of Delhi. Environ Geol 50:1025–1039
Kumar M, Kumari K, Ramanathan AL, Saxena R (2007) A
comparative evaluation of groundwater suitability for irrigation
and drinking purposes in two intensively cultivated districts of
Punjab, India. Environ Geol 53:553–574
Lakshmanan E, Kannan R, Senthil Kumar M (2003) Major ion
chemistry and identification of hydrogeochemical processes of
ground water in a part of Kancheepuram district, Tamil Nadu.
India. Environ Geosci 10(4):157–166
Leguey S, Leon DRD, Ruiz AI, Cueva J (2010) The role of
biomineralization in the origin of sepiolite and dolomite. Am J
Sci 310:165–193
Mitra BK (1998) Spatial and temporal variation of ground water
quality in sand dune area of aomori prefecture in Japan. 2006
ASAE Annual Meeting, Paper number 062023
Environ Earth Sci
123
Author's personal copy

Mukherjee S, Kumar BA, Kortvelyessy L (2005) Assessment of
Groundwater Quality in the South 24 Parganas, West Bengal
Coast. India. J Environ Hydrol 13:15
Mukherjee A, Bromssen MV, Scanlon BR, Bhattacharya P, Fryar AE,
Hasan Md A, Ahmed KM, Chatterjee D, Jacks G, Sracek O
(2008) Hydrogeochemical comparison and effects of overlap-
ping redox zones on groundwater arsenic near the Western
(Bhagirathi sub-basin, India) and Eastern (Meghna sub-basin,
Bangladesh) margins of the Bengal Basin. J Contam Hydrol
99:31–48
Naik S, Purohit KM (2001) Studies on water quality of river
Brahmani in Sundargarh district, Orissa. Ind J Environ and
Ecoplanning 5(2):397–402
Nickson R, McArthur J, Ravenscroft P, Burgess W, Ahmed KM
(2000) Mechanism of arsenic poisoning of groundwater in
Bangladesh and West Bengal. Appl Geochem 15:403–413
PHED (1991) National drinking water mission: submission project on
arsenic pollution in groundwater in West Bengal. Final Report
by Steering Committee, Arsenic Investigation Project, Govern-
ment of West Bengal 57
Ragunath HM (1987) Groundwater. Wiley Eastern, New Delhi, p 563
Rajmohan N, Elango L (2004) Identification and evolution of
hydrogeochemical processes in the groundwater environment
in an area of the Palar and Cheyyar River Basins, Southern India.
Environ Geol 46:47–61
Ravikumar P, Somashekar RK, Angami M (2011) Hydrochemistry and
evaluation of groundwater suitability for irrigation and drinking
purposes in the Markandeya River basin, Belgaum District,
Karnataka State, India. Environ Monit Assess 173:459–487
Richards LA (1954) Diagnosis and improvement of saline alkali soils:
agriculture. vol 160, Handbook 60. US Department of Agricul-
ture, Washington, DC
Rina K, Singh CK, Datta PS, Singh N, Mukherjee S (2013)
Geochemical modelling, ionic ratio and GIS based mapping of
groundwater salinity and assessment of governing processes in
Northern Gujarat, India. Environ Earth Sci 69:2377–2391
Sarin MM, Krishnaswamy S, Dilli K, Somayajulu BLK, Moore WS
(1989) Major ion chemistry of the Ganga- Brahmaputra river
system: weathering processes and fluxes to the Bay of Bengal.
Geochim Cosmochim Acta 53:997–1009
Sastri JCV (1994) Groundwater chemical quality in river basins,
hydrogeochemical modeling. In: Lecture notes—refresher
course, School of Earth Sciences. Bharathidasan University,
Tiruchirapalli
Schoeller H (1955) Geochimie des eaux souterraines application aux
eaux de gisements de petrole; Revue Inst. Pet Et Ann Des
Combust Liq 10(181–213):219–246
Schoeller H (1965) Qualitative evaluation of groundwater resources.
In Methods and techniques of groundwater investigations and
development. UNESCO, pp 54–83
Schoeller H (1967) Geochemistry of groundwater. An international
guide for research and practice. UNESCO, Paris, pp 1–18
Schoeller H (1977) Geochemistry of groundwater. Groundwater
studies—an international guide for research and practice Ch 15.
UNESCO, Paris, pp 1–18
Singh N, Singh RP, Mukherjee S, McDonald K, Reddy KJ (2013)
Hydrogeological processes controlling the release of arsenic in
parts of 24 Parganas district, West Bengal. Environ Earth Sci.
doi:10.1007/s12665-013-2940-8
Stallard RF, Edmond JM (1983) Geochemistry of the Amazon, the
influence of geology and weathering environment on the
dissolved load. J Geophys Res 88:9671–9688
Subba Rao N (2006) Seasonal variation of groundwater quality in a
part of Guntur district, Andhra Pradesh, India. Environ Geol
49:413–429
Subba Rao N (2008) Factors controlling the salinity in groundwater in
parts of Guntur district, Andhra Pradesh, India. Environ Monit
Assess 138:327–341
Subramani T, Elango L, Damodarasamy SR (2005) Groundwater
quality and its suitability for drinking and agricultural use in
Chithar River Basin, Tamil Nadu, India. Environ Geol
47:1099–1110
Tiwari TN, Mishra MA (1985) A preliminary assignment of water
quality index of major Indian rivers. Ind J Environ Protection
5:276–279
United Nations Environment Program (UNEP) (1999) Global envi-
ronment outlook 2000. Earthscan, UK
WHO (1989) Health Guidelines for the use of wastewater in
Agriculture and Aquaculture. Report of a WHO Scientific
Group-Technical Report Series 778, Geneva: World Health
Organization. p 74
Yidana SM, Ophori D, Banoeng-Yakubo B (2008) Groundwater
availability in the shallow aquifers of the southern Voltaian
system: a simulation and chemical analysis. Environ Geol
55:1647–1657
Yogendra K, Puttaiah ET (2008) Determination of water quality index
and suitability of urban water body in Shimoga Town, Karna-
taka. In: The 12th world lake conference, pp 342–346
Zuane JD (1990) Drinking water quality: Standards and control. Van
Nostrand Reinhold, New York
Environ Earth Sci
123
Author's personal copy
Related Documents


