ASSESSMENT OF HYDROELECTRIC POTENTIALS AT THE OWU AND ERO-OMOLA FALLS IN KWARA STATE B. F. Sule K. M. Lawal K. A. Adeniran TECHNICAL REPORT NO. 7 ISBN: 978-978-915-055-7 MAY, 2011 NATIONAL CENTRE FOR HYDROPOWER RESEARCH AND DEVELOPMENT ENERGY COMMISSION OF NIGERIA UNIVERSITY OF ILORIN, ILORIN, NIGERIA

Welcome message from author
This document is posted to help you gain knowledge. Please leave a comment to let me know what you think about it! Share it to your friends and learn new things together.
Transcript

ASSESSMENT OF HYDROELECTRIC
POTENTIALS AT THE OWU AND ERO-OMOLA
FALLS IN KWARA STATE
B. F. Sule
K. M. Lawal
K. A. Adeniran
TECHNICAL REPORT
NO. 7
ISBN: 978-978-915-055-7
MAY, 2011
NATIONAL CENTRE FOR HYDROPOWER RESEARCH AND DEVELOPMENT
ENERGY COMMISSION OF NIGERIA UNIVERSITY OF ILORIN, ILORIN, NIGERIA

Assessment of Hydroelecric Potentials of Owu and Ero-omola Falls in Kwara State, Nigeria
Page 2
TABLE OF CONTENTS
1. EXECUTIVE SUMMARY 3
CHAPTER ONE
1.0 Introduction 5
1.1 General Introduction 5
1.2 Sources of Energy 6
1.3 Statement of Problem 6
1.4 Why Small Hydro 7
1.5 Aim of the Study 7
1.6 Objective of the Study 7
1.7 Physical Characteristics and Description of the Study Areas 7
1.8 Demographic Data 8
2. CHAPTER TWO
2.0 Theory of Hydropower Generation 10
2.1 Energy Production 11
2.2 Hydropower System 14
3. CHAPTER THREE
3.0 Study Approach and Technology 14
3.1 Data Collection 14
3.2 Determination of Energy Demand 14
3.3 River Stage Measurement 16
3.4 Measurement of Discharge 16
4. CHAPTER FOUR
4.0 Field Output and Data Analysis 17
4.1 Introduction 17
4.2 Instrumentation Details 17
4.3 Stream Discharge 19
4.4 Development of a Monthly Flood Rating Curve 19
4.5 Extension of Streamflow Data at Ero-omola Fall 23
4.6 Model Development 25
4.7 Determination of the Required Reservoir Capacity 28
4.8 Evaluation of Sediment Load or Sediment transport 29
5. CHAPTER FIVE
5.0 Potential Energy Assessment 31
5.1 Potential Energy Assessment of Ero-omola Fall 31
5.2 Potential Energy Assessment of Owu Fall 33
5.3 Hydropower Power Demand 34
6. CHAPTER SIX
6.0 Financial Justification 35
6.1 Introduction 35
6.2 Engineering Economics 35
6.3 Economics Analysis 35
6.4 Cost of Generation Per Kilowatt 36
6.5 Internal Rate of Return 36
6.6 Amortization Analysis 36
7. APPENDIX 1 40
APPENDIX 2 41
APPENDIX 3 48
APPENDIX 4 49
APPENDIX 5 55
APPENDIX 6 56
APPENDIX 7 57
APPENDIX 8 58
APPENDIX 9 59
APPENDIX 10 60
APPENDIX 11 61
8. REFERENCES 61
Assessment of Hydroelecric Potentials of Owu and Ero-omola Falls in Kwara State, Nigeria
Page 3
EXECUTIVE SUMMARY
1. General
The study for the assessment of potential hydropower development of Owu and Ero-omola Falls
commenced effectively by 20th
of June, 2009. Various site visits were undertaken to facilitate
gauge installation and hydraulic head survey. Gauge readers were recruited to monitor gauges,
with provision of a motorbike for the gauge reader at Owu Fall, due to long distance of site from
urban centre. Gauge readers were effectively engaged by 26th
of November, 2009 and have since
continued to monitor the gauge till date. Signboards were installed to indicate ownership of the
measuring instrument at both sites. Ero-Omola has recorded about 450 days (15 months) of
records while Owu Fall has about 217 days (7months) of records. The fewer months of records
were due to conflict between the gauges readers employed for the site. Discharge measurement
from both sites were evaluated to generate the discharge rating curves on excel programme and to
establish the minimum and the maximum water level.
2. Discharge Computation Method
There are different methods of determining river discharge. The choice of computation methods
depends upon the equipment and observational method used during the gauging, flow conditions
at the time of gauging, type of stream and the accuracy required. The arithmetic method is
preferred, because it offers sufficient accuracy and quicker to perform than other methods. For
the purpose of this report the Mean Section Method was utilized to evaluate the discharge. The
raw data is presented in the annexure to this report.
3. Hydropower Potential
a. Owu Fall with a hydraulic head of 95.5m has a potential hydro capacity of 8.81MW and annual
generating capacity of 15425.12MWh. The minimum flow available for about 100% of the time
from the flow duration curve is estimated at 9.9m3/s. Therefore a single pelton turbine is
recommended. The total amount of energy so generated can be sold to National grid is estimated
at N216,091,680.00 at N14.00/kWh. The internal rate of return was however negative. Owu Fall
has a difficult terrain with relatively low runoff but consistent runoff yield. It is therefore suitable
for only runoff river system as it is practically difficult to impound water behind the Fall. More so
the distance to the 33kva National Grid at Omu Aran is about 189km, while that of Ero-Omola is
just 48km.
b. Ero-Omola Fall with an averages discharge of 22.8m3/s and a hydraulic head of 59.4m has a
potential hydropower capacity of 8.64MW. The 100% flow rate from Ero-Omola may be
bifurcated by 3 unit draft tube into the turbines at 7m3/s each. The total annual energy was
estimated at 15137.28MWh at an economics cost of N211,921,820.00/annum using the NIPP
multi-year tariff order of N14.00/Kwh. The total amount derivable from the power generation
excluding other charges amount to about N213million with an internal rate of return (IRR) of
18.00%. This IRR although lower than the prevailing interest rate of 21% is still acceptable on the
premise that, the present commercial interest rate in Nigeria is relatively high. Ero-Omola water

Assessment of Hydroelecric Potentials of Owu and Ero-omola Falls in Kwara State, Nigeria
Page 4
year is between April to March with a two to three month break of hydrological cycle. It is
therefore necessary to provide a reservoir, sufficient enough to regulate flow for the turbines and
to provide domestic and irrigation water supply to the host communities downstream. This off
course is an additional cost to the investor. The benefit/cost ratio is however encouraging.
4. Constraints
The Centre must collaborate with State Government to see that the only access roads to Owu Fall
are rehabilitated. The deplorable condition of the road makes it un-passable during the rainy
season and make site visit difficult. The present security situation of Owu site does not encourage
installations of expensive instrument for now, due to constant vandalization, removal or theft.
5. Financial Positions
The total budgetary provision for the two sites would have been draw down completely by the end
of April 2011. It is therefore important to provide fund for the salary and wages of the gauge
readers beginning from May 2011. The budgetary provision for the two site is estimated at
N650,000.00 each, bringing the total sum required annually to about N1,300,000.00(this includes
salary and wages of gauge readers, fuelling of motorbikes, instrument maintenance, site visits
etc.). This request becomes necessary if the centre is to continue to sustain continuous and
uninterrupted data acquisition of both sites.
6. Recommendations
a. The next phase of this study is to provide detail topography of the site and to locate position of
power house, fore bay, penstocks with detail engineering drawing and subject the overall cost to
economic analysis.
b. Thereafter this report will be publicly presented to provide the necessary information to investors
to appraise and executes the project.
c. An automatic data logger should be provided at Ero-omola. This is to minimize research cost and
expenditure on data acquisition. Self-recording gauges that maintain a continuous record of stage
are based on various types of sensors. The three most commonly used types of sensors are float-
driven, pressure, and ultrasonic. In a typical installation of a float-driven, water-level sensor, the
vertical movement of a float in a stilling basin, resulting from fluctuations in water level, is
translated by a mechanical movement or an electronic signal. Ultrasonic sensors use acoustic
pulses to sense water levels either by contact or noncontact methods. Stage-discharge relations
may have to be periodically updated due to changes in the hydraulic characteristics of a stream
reach over time, caused by erosion and sedimentation, bank vegetation, and other changes. It is
therefore extremely important to make provision for continuous regular site visits, whenever the
need arises.

Assessment of Hydroelecric Potentials of Owu and Ero-omola Falls in Kwara State, Nigeria
Page 5
CHAPTER ONE
1.0 INTRODUCTION
1.1 General Introduction
Power is a very important infrastructural development of a nation. It is widely believed that
an appropriate level of energy generation has always gone hand in hand with industrialization
and economic development. Similarly a functional energy generation system often serves as
an effective tool for National Economic Development. The need for comprehensive studies of
hydropower operation of large water resources system is increasing at rapid pace because of
the increasing interest in all facets of resources use and management. Complexity of water
resource planning, design and operations studies, demand for a mathematical procedure that
will select the optimum sizes and characteristics of components to produce a desired result.
Many failures of water related projects are due to project planning on the basis of inadequate
hydrological data, due in part to two factors:
a. Data which are not accurately measured
b. Too short time series of hydrological data not allowing reliable estimates of system
performance
In the later case some scientist suggests the postponement of the project until more reliable and
accurate data are available. Although this suggestion is theoretically sound, it however lacks the
requirement and needs of engineering practice. A better way to solving the problem may be the
use of hydrological data from synoptic station within the same catchment which in combination
with available hydrological data may improve the planning results. This is the basis of the
stochastic theory approach utilized to extend flood data. The purpose of this research is to
demonstrate the value of such deficit data in the optimization process of hydropower
development. Inadequate hydrological data may lead to over or under design of the power plant.
Stochastic theory is applied in order to minimize the risk of such uncertainties. The stochastic
theory provides opportunity to forecast and extend short duration data in a planning process.
In this context we have to distinguish between two types of hydrological uncertainty.
a. The natural uncertainty due to random variation of hydro meteorological processes;
b. If hydro-power project are planned and designed on the basis of rather short time series of
observed hydrological data the danger of inaccurate solutions is high.
1.2 Sources of Energy
The three most important sources, which have become common and therefore referred to as
conventional, are:
(i) Thermal power (ii) Hydro-power (iii) Nuclear power
The other sources of power generation are also valuable but the quantum of power produced
by these sources is limited. Such other sources are: (i) Tidal power (ii) Solar energy (iii)

Assessment of Hydroelecric Potentials of Owu and Ero-omola Falls in Kwara State, Nigeria
Page 6
Geo-thermal energy (iv) Wind power (v) Magneto-hydro-dynamic plants and (VI) Biomass
Energy
The focus of this research was limited to design of potentials hydropower generation only.
Table 1.1, 1.2 and shows the status of hydropower generation and Electricity demand
Scenarios in Nigeria.
Table 1.1: Status of Hydropower Generation in Nigeria (Install Capacity)
Year Generation Capacity Actual
generation(Peak)
Losses
2005 5,880 MW 2,500 MW 57%
2009
2009(NIPP)
6,021 MW
6,814 MW
3,700 MW
----------
38%
--------
2011 (P) 11,000 MW ????
Source:Energy Commission of Nigeria
Table 1.2 Nigeria Electricity Demand Scenarios
Scenarios Demand MW
Period 2010 2015 2020 2025 2030
Reference (7%) 15,730 28,360 50,820 77,450 119,200
High Reference (10%) 15,920 30,210 58,180 107,220 192,000
Optimistic (11.5%) 16,000 31,240 70,760 137,370 250,000
Source: Energy Commission of Nigeria (2006)
1.3 Statement of Problem
Fresh water supplies, energy and environmental preservation are three of the most pressing
issues facing humanity. In Nigeria poor planning and under investment had created a huge
generation and supply deficit over time, despite improved routine maintenance for the
existing hydro infrastructures. There is a heavy reliance on public electricity supply while
demand for electricity keeps outstripping supply. The response to address irregular public
power generation and transmission failure was the importation of various brands of gasoline
generators into the country to augment supply, it is however obvious that a new approach and
fresh initiatives to development of energy producing resources and the implementation of
developmental plans has to be accelerated, if vision 2020 target is to be met.
1.4 Why Small Hydro
Hydroelectricity enjoys several advantages over most other sources of electrical power. These
include high levels of reliability, proven technology, high efficiency, very low operating and
maintenance cost, and the ability to easily adjust to load fluctuations. Hydropower project
often provide flood control and recreational benefits. Hydropower does not produce waste

Assessment of Hydroelecric Potentials of Owu and Ero-omola Falls in Kwara State, Nigeria
Page 7
products that contribute to air quality problems, acid rain, and green house gases; it is a
renewable resource that minimizes the use of other fuels (oil, gas and coal).
Poverty in Nigeria is associated with high unemployment, poor governance, corruption, lack
of accountability, and gross violation of human rights, nepotism and a skewed income
inordinate distribution. Additional factors include poor infrastructure and impaired access to
productive and financial assets by women and vulnerable groups. In the framework of the
Millennium Development Goals Report, the latest estimates revealed that over 70% of the
population lives below the International income poverty line of $1 a day. (World Bank, 2007)
A common belief is that guaranteeing a sustainable supply of affordable energy is one of the
best ways to address poverty, inequality and environmental degradation everywhere on the
planet. However, energy cannot be affordable unless its production and availability are
sustainable. Increasingly, energy sustainability amongst others also means: connecting the
entire urban and rural poor to reliable, sustainable economical sources of energy. This way we
can guarantee improved living standard for a better quality of life. (World Bank, 2007)
It is in response to these challenges, that the study was initiated
1.5 Aim of the Study
The main purpose of this study is to establish, explore and optimize the hydropower potentials
of Owu and Ero-omola Falls for the use of the rural communities.
1.6 Objectives of the Study
In achieving the main aim stated above, the following objectives are covered.
a. Installation of hydrologic instruments for data collection.
b. Collection of hydrologic data and topographical maps of the two sites and adjoining
catchments.
c. Rainfall and run-off data studies.
d. Development of flood duration curve.
e. Estimation of energy generation potential with the runoff.
f. Determination of potential hydropower generation capacity of Owu Falls.
g. Economic analysis and financial assessment of both hydropower projects.
1.7 Physical Characteristics and Description of the study Areas:
Owu Fall is located at Owa Kajola in Ifelodun LGA of Kwara State near Oro-Ago about
127km from Ilorin, the state capital (figure 1 shows the LGAs of Kwara State). The run-off is
perennial from a hill of about 95.5 m high. Owu Fall lies between Latitude North N08 20 ׳
23.2״ and N08° 2023.1 ׳
״ and between Longitude East E005° 08
׳ 34.8
״and E005° 08
׳34.7
״.

Assessment of Hydroelecric Potentials of Owu and Ero-omola Falls in Kwara State, Nigeria
Page 8
The rainfall is moderate with general annual average of about 1,250mm with maximum
rainfall occurring in the months of June and August and a low humidity of about 50%. The
Ero-Omola Fall is located along Osi- Isolo-Ajuba Road off Osi-Idofin road in Ekiti LGA,
(Araromi-Opin) about 116 km from Ilorin. The runoff is perennial and of higher unit
discharge than Owu-Falls. The height of the Fall is about 59.4m high. The catchment area of
Ero-omola Fall is about 45km2 with contribution from two rivers namely, Ero-river from
Iddo- Faboro near Ifaki in Ekiti state and Odo-Otun from Ajuba itself. Ero-Omola Falls lies
between Latitude North N08° 09 ׳34.6
״and N08°09
׳ 30.8
״ and between Longitude East E005°
14 ׳07.4
״ and E005° 14
׳ 06.7
״.
1.8 Demographic Data
Population is a major driver of energy demand. The most important determinant of energy
demand is the level of economic activity and its structure, measured by the Gross Domestic
Product (GDP). The evolution of the GDP was guided by the projections assumed in the
National Economic Empowerment and Development Strategy (NEEDS). The local
government areas within the catchment areas of the proposed project are listed in Table 1.4
along with other LGAs in Kwara State.
Table 1.3: Population of Kwara State (NPC, 2006)
LGAs MALES FEMALES POPULATION
Baruten
Kaiama
Moro
Edu
Pategi
*Ifelodun
Ilorin South
Ilorin East
Ilorin West
Asa
Oyun
Offa
*Irepodun
*Isin
*Oke-Ero
*Ekiti
Total
*Study Areas
108153
68240
55630
104944
62639
106056
104504
104402
181875
64982
48601
46266
75539
30833
29515
28402
1220581
101306
55924
53162
96525
49678
99986
104187
99908
182791
61453
45652
43408
73071
28905
28104
26448
1150508
209459
124164
108792
201469
112317
206042
208691
204310
364666
126435
94253
89674
148610
59738
57619
54850
2371089

Assessment of Hydroelecric Potentials of Owu and Ero-omola Falls in Kwara State, Nigeria
Page 9
Fig. 1:Map of Kwara State showing Local Government Areas. Owu and Ero-Omola Falls are located
in Ifelodun and Ekiti LGAs.
Assessment of Hydroelecric Potentials of Owu and Ero-omola Falls in Kwara State, Nigeria
Page 10
CHAPTER TWO
2.0 THEORY OF POWER GENERATION
2.1 Energy Production
Hydroelectric power production from a given reservoir at any time, t depends on the installed
capacity of the turbine (generators), turbine release, generating head, the number of hours of
power generation in a period, the plant factor, the efficiency of the turbine. In hydropower,
the potential energy of the Falling water is converted to mechanical energy which is used in
rotating the turbine.
The Potential energy is given as: (Loucks et al, 1981).
PE= mgh (2.1)
where m =is the mass of the Falling water
g =is the acceleration due to gravity
h =is the Falling head
A cubic meter of water, weighing 103 kg, accelerating at a rate of 9.81m/s
2 over a distance of
one meter, results in 9.81 x 10³ joules (Newton-meter) of work. The work done in one second
equals (joules per second) is of power produced in watts. Hence an average flow of tqˆ (m3/s)
Falling a height of Ht (m) in period t yields 9.81 x 10³ tqˆ Ht watts or 9.81 tqˆ Ht Kilowatts.
Multiplying by the number of hours in period t yields the kilowatt-hours of energy produced
from an average flow of tqˆ in period t. The total kilowatt-hours of energy KWHt produced in
period t, assuming 100% efficiency is (Sharma, 1979)
E=KWHt =9.81 qˆ H(seconds in period t) (2.2)
3.6 x 10³
Since the total flow qt in period t, in units of 106 m
3, equals the average flow rate tqˆ (m
3/s)
times the number of seconds in the period divided by 106, the total kilowatt-hours of energy
produced in period t given a plant efficiency of e is equals
E = KWHt = 2730qtHt (2.3)
Equation (2.3) implies that the kilowatt-hours of energy KWHt produced in period t, are
proportional to the product of the plant efficiency, the productive storage head Ht and the
flow qt through the turbine. The amount of electrical energy produced also depends on the
installed kilowatts of plant capacity P as well as on the plant factor Ft. The plant factor is a
measure of hydroelectric power plant use and is usually dictated by the characteristics of the
power system supply and demand.

Assessment of Hydroelecric Potentials of Owu and Ero-omola Falls in Kwara State, Nigeria
Page 11
The plant factor F is given as: Ft =Average load on the plan(2.4)
Installed plant capacity
The plant factor accounts for the variability in the flow rate during each period t and this
variability is pre specified by those responsible for energy production and distribution. It may
or may not vary for different period’s t. The total energy produced cannot exceed the product
of the plant factor Ft, the number of hours in the period ht and the plant capacity P, measured
in kilowatts.
KWH = ft ht P (2.5)
FIRM ENERGY = Pdesign x x 24 x 365 kWh (2.6)
= 0.2 (A reduction factor due to streamflow fluctuations)
2.2 Hydropower system.
2.2.1 The major types of hydroelectric power development are (Sharma, 1979):
a. Run-of river development
The runoff river plant are such plant that do not substantially alter the flow regime of the
river, this implies that the river is not diverted materially away from its natural course, since
no impoundment is envisaged.
b. Pondage development (Dam toe based)
Pondage developments are reservoirs developed to provides uninterrupted or balance inflow
for day to day fluctuations in the amount of inflow available for power productions. Most
often the power plant is located at the dam toe.
c. Storage development is similar to pondage development as described above.
d. Regulating development (canal Fall based)
This are the hydropower plant fed through a regulated outlet from the reservoir.
e. Pumped storage development (diversion)
The pumped storage plant as the name implies are those plants whose inflow for power
generation is augmented through a system of pumping unit.
Regulating development is proposed at Ero-omola Fall, while Owu Fall is suitable for Runoff
River plant. The proposed typical schematic design diagram for the two sites is as shown in
Figure 2.1 and 2.2: The major components in the scheme are:
a) Gross head (H). The gross head is the difference of the water level in the head race and the
water level in the tail race.( for a run-off river plant)
b) Net Head (h). The net head (or effective head) is the head available for the turbine. It is equal
to the difference of total head at the point of entry and at the point of exit of the turbine.

Assessment of Hydroelecric Potentials of Owu and Ero-omola Falls in Kwara State, Nigeria
Page 12
i. For a pelton wheel or impulse turbine,
h=H –Z –hf (2.7)
Where:
H =gross head (m)
Z= is the height of the pelton wheel exit above the tail race level and hf= is the loss of
head in the penstock.
ii. For a reaction turbine. h=H-(Vd)2
- hf(2.8)
2g-
Where Vd = is the exit velocity and other terms are as defined above.
c) Operating Head. The operating head is equal to the difference of the
water level in the forebay (or foreway) and that in the tail race.
FIGURE 2.1: OWU FALL

Assessment of Hydroelecric Potentials of Owu and Ero-omola Falls in Kwara State, Nigeria
Page 13
FIGURE 2.2: ERO-OMOLA FALL

Assessment of Hydroelecric Potentials of Owu and Ero-omola Falls in Kwara State, Nigeria
Page 14
CHAPTER THREE
3.0 STUDY APPROACH AND METHODOLOGY
3.1 Data Collection
Topographical map, Stream flow, hydraulic head and pipeline length must be estimated or
measured, before one can calculate the power that could be developed from a stream. Stream
flow is the most difficult to measure or estimate. Understanding of its sources, its fluctuations
and flow measurements is important.
3.2 Determination of Energy Demand
A constant monthly energy demand is defined from an assumed installed capacity and chosen
plant factor. The monthly energy demand as follows:
FE (t) = IC * n hours * PF(t) (3.1)
Where FE (t) is the target monthly firm energy demand (MWh) and other variables are
previously defined.
IC=installed capacity MW
N =no of operating hours
PF=Plant factor
Monthly firm energy demand was computed from the above equation: Owu Fall with installed
capacity of 8.81MW over assumed 8 hours of operation and plant factor of 0.25 is estimated
at 17.62MWh or 211.14MWh/annum, while Ero-omola Fall with installed capacity of
19.93MW over an assumed 8 hours of operations and plant factor of 0.25 is estimated at
39.86MWh or 478.32MWh/annum.
a) Population Estimate
Population is a major driver of energy demand. From the demographic data, the projected
population figure was deployed in the estimation of energy demand of the communities.
The project catchment areas comprises of about five local government areas namely;
Ekiti,Oke-ero, Isin, Irepodun, and Ifelodun LGAs with a combined population of 526,859
by the 2006 population census. This is projected to 2036 at a National population growth
rate of 2.83% and in consideration of 25 years life span of the proposed project. The
projection was achieved with the relation:
Pn =Po (1 + r)n (3.2)
526,859 X (1.0283)25
= 1,058,499

Assessment of Hydroelecric Potentials of Owu and Ero-omola Falls in Kwara State, Nigeria
Page 15
b.) Electricity Demand per Capital
The electricity demand per capital of 321.59Kwh published by Energy Commission
of Nigeria (2006) was adopted for this study.
c.) Peak Domestic Electric Load demand
Using the annual electric energy demand, load factor of 0.75, transmission and
distribution losses; approximate estimates of the peak load demand was obtained. The
highest growth scenarios gives a peak demand 0f 3157MW.(NERC, 2009)
d.) Projected Electricity Demand
In accordance with the National Energy Policy (2003), access to electricity by
household is expected to increase to 75% by year 2020 for urban centre while that of
rural was put at 55%. This study assumed an average projected electricity demand of
the community to grow by about 55% due to development of many small agro
businesses within the project area.
3.3 River Stage Measurement
The river stage is the height of the water surface above the mean sea level (msl). For
convenience, the datum was arbitrarily selected at the lowest point on the river bed. The river
stage was measured to compute the cross-sectional area of the river so that the discharge can
be determined using the OTT current metre obtained from Lower Niger River basin
Development Authority.
3.4 Measurement of Discharge
A river discharge is the rate at which water flows through a cross section and is expressed as
volume per unit time.
The following methods are commonly used for the measurement of discharge in a river.
1. Area-velocity method 2. Slope-area method
3. Salt-concentration 4. Moving-boat method
5. Electromagnetic and ultrasonic 6. Indirect methods
A relationship between stage and discharge is required to convert stage measurements to flow
rates. Measurements of head were converted to flow rates. In this report the velocity-area
method was used for measuring the discharge of both sites.
3.4.1 In this method, the discharge is determined from the area of cross section and the mean
velocity. The area of cross section of the stream is determined from the profile of the stream
bed obtained by survey.(Appendix 1) The river cross section was divided in to a suitable
number of vertical segments (or strips).About 10 segments were taken in the case of Owu,
while Ero-omola had about 15 segments. The total discharge in the river is the total sum of

Assessment of Hydroelecric Potentials of Owu and Ero-omola Falls in Kwara State, Nigeria
Page 16
various segments. The discharge in each segment is equal to the area of the segment
multiplied by the mean velocity of flow. The mean section method was used to estimate the
discharge, in this method; the segment is taken between two vertical lines on which the
velocity and depth are measured. The velocity in the segment is taken as the average of the
mean velocities V1and V2 determined at the two adjacent verticals. Similarly the depth is also
taken as the average of two depth d1and d2. Thus the discharge in the segment is given by
∆𝑄 = 𝑏 𝑑1+ 𝑑2
2
𝑉1+ 𝑉2
2 (3.3)
𝑇𝑜𝑡𝑎𝑙𝑑𝑖𝑠𝑐ℎ𝑎𝑟𝑔𝑒 𝑄 = 𝑄 (3.4)
3.4.2 Determination of Velocity (V): For the measurement of discharge, the mean velocity (V) is
required at various vertical lines as stated above. The following methods were used for the
sites.
1. Floats Method
2. Current Meter Method
both float and current metre method was undertaken on the field for accuracy checks.
a.) Floats method: In this method, a straight and uniform reach of the river was selected for the
float to travel. The time t taken by a float to travel a certain distance L is measured. There are three types of floats commonly used in practice. (i) Surface floats, (ii) Double floats (iii) Velocity rods. The
study adopted surface floats. The surface floats are generally made of wood (or any other light
material) so that they can float. Wooden discs of 7 – 15 cm diameters were used. As the surface floats travel at the water surface, they give the surface velocity. The mean velocity is usually taken as 0.85
times the surface velocity.
b.) Current Meter
A current meter is generally used for the measurement of velocity in a river. The current
meters are basically of two types.
(ii). Cup-type current meter (iii). Propeller-type current meter.
The accuracy of the cup-type current meter is about 0.3% for the velocity greater than 1 m/s. The
main disadvantage of a cup-type current meter is that its accuracy is low when there is an
appreciable vertical component of the velocity.
The basic principle of both types of current meters is the same; namely, when a current meter is
inserted in flowing water, there is an unbalanced drag on the rotating element (cup or propeller) which
starts rotating. As the velocity increases, the speed of rotation increases. The current meter is calibrated to give the velocity corresponding to different speeds of rotation. Manufacturers also
provide the calibration chart which gives the relationship between the velocity and the number of
revolutions per second. Generally, it follows a linear relationship,
𝑣 = 𝑎𝑁 + 𝑏 (3.5)
where v is the velocity at the instrument location, N is the number of revolutions per second, and a
and b are the constants of meter obtained by calibration. These constants are determined by towing the
instrument in a towing tank in the laboratory. The current meter gives the velocity (v) at a point. For
determination of the discharge in the river, the mean velocity (V) along a vertical line is required.

Assessment of Hydroelecric Potentials of Owu and Ero-omola Falls in Kwara State, Nigeria
Page 17
CHAPTER FOUR
4.0 FIELD WORK OUTPUT AND DATA ANALYSIS
4.1 Introduction
Several visits were undertaken by the research team to Ero-omola and Owu Falls project
between September 2009 and March 2011. The purpose of the visit was to obtain stage-
discharge relation and preliminary peak discharge data for the two sites. Stream flow
measurement were undertaken to determine the extent and dependability of the flow. 2 Nos.
metric steel gauges were installed at the bottom of Fall at Owu and Ero-omola site as well.
Table 4.1: Details of Gauge at Owu and Ero-omola Falls
1. Item Owu Fall Ero-omola Fall
2. Purpose River Stage River Stage
3. Type Self illuminated steel gauge Self illuminated steel gauge
4. Station Bench
Mark
+455.51m +451.60m
5. Datum Nigeria Ordinance Datum/Universal Traverse
Mercator (UTM)
Nigeria Ordinance Datum/Universal Traverse
Mercator (UTM)
6. Gauge
Elevation(m)
+480.7m +449.996m
7. Water level
(m)
+426.2m +449.8m
8. Gauge Height
(m)
3 4
9. Location N080 20’ 40’’ and E05
0 08’ 56’’ N08
0 09’ 48’’ and E05
0 13’ 09’’
10 Date
Established
12th September 2009 11
th September 2009
4.2 Instrumentation Details
An OTT current metre obtained from the Lower Niger River Basin Development Authority
was deployed for the streamflow measurement. The instrument specification is as indicated
below:
Type: Propeller Current Metres (OTT-C31-BAREL 17929)
Propeller Diameter: 125mm
Impulse: 1
Error: +/- 0.25
The calibration equation of the instrument is given as;
V = 0.2483 n +0.011 for n=< 0.59 where n revolution per seconds
V = 0.2619 n + 0.003 for n= < 9.21
Discharge measurement trials were carried out with the instrument on both sites to determine its level
of accuracy. The float method was equally carried out as a check on the calibrated instrument. The

Assessment of Hydroelecric Potentials of Owu and Ero-omola Falls in Kwara State, Nigeria
Page 18
float method involves the use of floating material moving under the drag of the river flow, so as to
evaluate or compute the speed or velocity of the river-flow. The float method trials result at Ero-
Omola Fall is as indicated in Table 4.2.The float method was carried out over a uniform distance of
5m along the stream. Stop watch was used to determine the time of travel of the float along the
stream. The computation of the discharge is as follows:
T=Time lapse (in seconds)
Velocity =Distance (L)/Time
Discharge=Area x Velocity
Table 4.2: Discharge computation of float method Trials at Ero-omola Fall from 21-26th October
2009
Distance(m) 5 5 5 5 5 5
Segment Area
(m2)
4.75 4.25 4.75 4.3 4.8 4.75
T(Time)(S) 8.43 3.55 3.38 3.67 3.85 3.29
V(m/s) 0.59 1.41 1.48 1.36 1.29 1.52
Q(m3/s=VA 2.802 5.992 7.030 5.848 6.192 7.22 35.084
The time travel by the float along subdivision of 5m segment on the stream was determined with a
stop watch. The total discharge of 35.084m3/s was obtained during the trials. Similar trials were also
carried out with the current metre. The trials result is as indicated in Table 4.3
Table 4.3: Result of Current Metre Trials at Ero-omola Fall
Date 18/10/2009 19/10/2009 20/10/2009 21/10/2009 22/10/2009
Water level(m) 1.98 1.98 1.95 1.89 1.87
Discharge 48.79 48.60 47.31 41.75 35.4
Similar trials carried out at Owu Fall are indicated in Table 4.4 and 4.5 respectively.
Table 4.4: Results of trial of float method at Owu Fall from11
th-15
th November 2009
Distance(m) 3 3 3 3 3 3
Segment Area
(m2)
6.8 6.8 6.4 5.35 6.8 6.5
T(Time)(S) 12.13 11.97 7.60 5.53 12.00 24.9
V(m/s) 0.25 0.25 0.39 0.54 0.25 0.12
Q(m3/s 1.70 1.70 2.50 2.89 1.70 0.78 11.27
Total Discharge = 11.27m3/s (November Peak)
Table 4.5Result of Current Metre Trials at Owu Fall
Date 11/9/2009 12/9/2009 13/9/2009 14/9/2009 15/9/2009
Water level(m) 0.98 0.97 0.95 0.92 0.89
Discharge 11.02 10.88 10.58 10.14 9.703
Assessment of Hydroelecric Potentials of Owu and Ero-omola Falls in Kwara State, Nigeria
Page 19
Subsequent discharge measurements were carried out each month in order to have a relatively spread
of the flood discharge throughout the year. The rating curve equations were developed from the discharge so obtained each month.
4.3 Stream Discharge
Subsequent discharge measurement at Ero-Omola and Owu Falls were computed on the bases of
arithmetic method using the current meter measurements provided. The horizontal distance across the
stream was measured from the edge of the water at one bank. Depths were measured from the water surface.
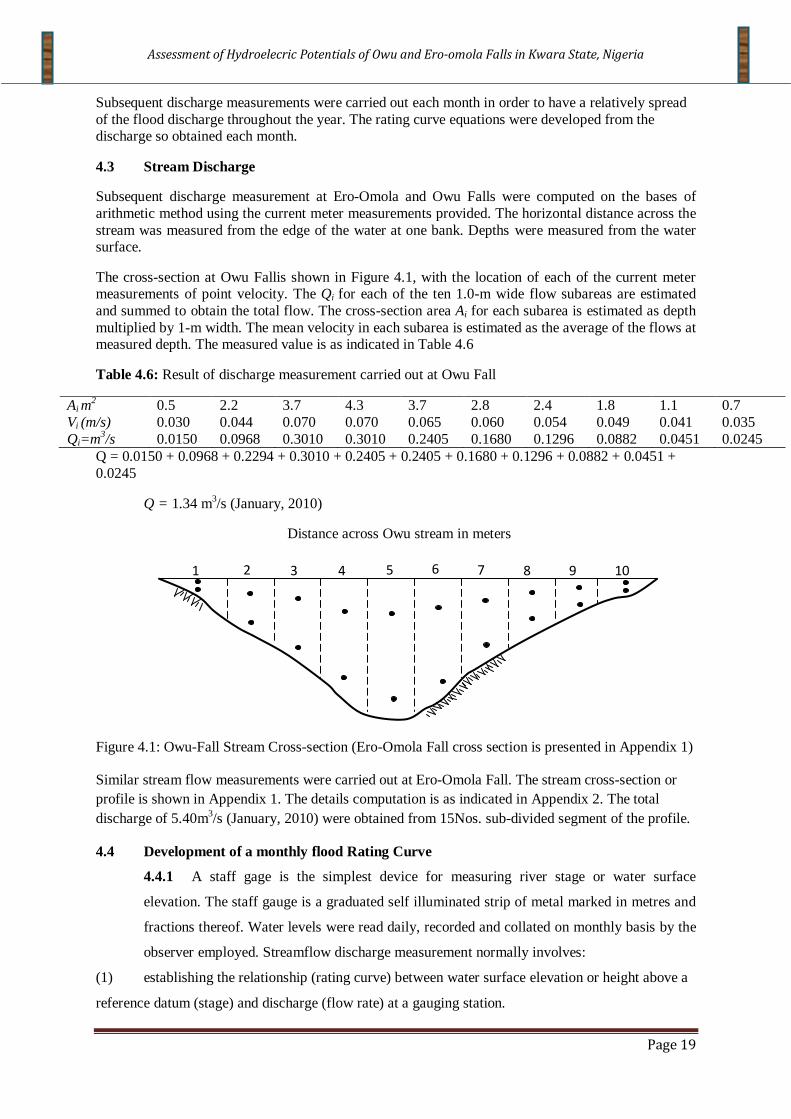
The cross-section at Owu Fallis shown in Figure 4.1, with the location of each of the current meter measurements of point velocity. The Qi for each of the ten 1.0-m wide flow subareas are estimated
and summed to obtain the total flow. The cross-section area Ai for each subarea is estimated as depth
multiplied by 1-m width. The mean velocity in each subarea is estimated as the average of the flows at measured depth. The measured value is as indicated in Table 4.6
Table 4.6: Result of discharge measurement carried out at Owu Fall
Ai m2 0.5 2.2 3.7 4.3 3.7 2.8 2.4 1.8 1.1 0.7
Vi (m/s) 0.030 0.044 0.070 0.070 0.065 0.060 0.054 0.049 0.041 0.035
Qi=m3/s 0.0150 0.0968 0.3010 0.3010 0.2405 0.1680 0.1296 0.0882 0.0451 0.0245
Q = 0.0150 + 0.0968 + 0.2294 + 0.3010 + 0.2405 + 0.2405 + 0.1680 + 0.1296 + 0.0882 + 0.0451 +
0.0245
Q = 1.34 m3/s (January, 2010)
Distance across Owu stream in meters
Figure 4.1: Owu-Fall Stream Cross-section (Ero-Omola Fall cross section is presented in Appendix 1)
Similar stream flow measurements were carried out at Ero-Omola Fall. The stream cross-section or
profile is shown in Appendix 1. The details computation is as indicated in Appendix 2. The total
discharge of 5.40m3/s (January, 2010) were obtained from 15Nos. sub-divided segment of the profile.
4.4 Development of a monthly flood Rating Curve
4.4.1 A staff gage is the simplest device for measuring river stage or water surface
elevation. The staff gauge is a graduated self illuminated strip of metal marked in metres and
fractions thereof. Water levels were read daily, recorded and collated on monthly basis by the
observer employed. Streamflow discharge measurement normally involves:
(1) establishing the relationship (rating curve) between water surface elevation or height above a
reference datum (stage) and discharge (flow rate) at a gauging station.
1 2 3 4 5 6 7 8 9 10

Assessment of Hydroelecric Potentials of Owu and Ero-omola Falls in Kwara State, Nigeria
Page 20
(2) continuously or periodically measuring stage at the gauging station
(3) transforming the record of stage into a record of discharge by applying the rating curve.
Limited numbers of discharge measurements (10Nos.) were undertaken each month for a range of
stage to define a relationship between stage and discharge at the two gauging station. The stage-
discharge relation, which is the rating curve, is then combined with continuous periodic stage
measurements to record discharge as well as stage simultaneously. The rating curve was converted to
discharge by Excel software and was subsequently extended for about 25 years. The extension
became necessary so as to ascertain the viability of the two sites for hydropower development.
For a gauge height H (m) at point of zero flow Ho ; the Discharge Q (m3/s) is related to height
H(m) as follows:
Q =K (H - Ho) n (4.1)
The rating equations (Sharma, 1979) relation is giving as:
Q = K H n (when Ho=0) (4.2)
Where
Q = Discharge (m3/s)
H = Gauge Height (m)
Ho = Zero Gauge Height (m)
n & k = Constants
This is a parabolic equation which plots as a straight line on double logarithmic graph sheet. K &n are determined using the least square method
The procedure for estimating discharge from the gauge height measurements is the Least Square Method.
4.4.2 Let Q = KHn (since Ho =0 from installation) be the function to be fitted to the given data.
Taking logarithms of both sides, we obtain the relation
log Q = log K + n log H (4.3)
which is of the form Q = a0 + a1, where Q = log Q, a0 = log K, a1 = n log H. Then k and n can be
calculated from the formulae a0 = log K and n = a1.
∑Log Q =NLog K + n∑Log H (4.4)
∑Log Q Log H = Log K ∑Log H + n ∑(Log H)2 (4.5)
Where: N = Numbers of pairs of observation
These two equations are solved simultaneously to determine constant k & n respectively for each
rating equation of each month.
The computation for January rating curve is as indicated in Table 4.7 while February to December is
presented in Appendix 3. While Owu Fall Least Square (LSM) Computation for November rating
curve is shown in Table 4.8.

Assessment of Hydroelecric Potentials of Owu and Ero-omola Falls in Kwara State, Nigeria
Page 21
Table 4.7:Ero-omola January Flood Rating Curve (LSM)
S/n H (m) Q(m3/s) LogH Log Q (Log H)2 Log Qlog H
1 0.47 6.5 -0.327902142 0.812913 0.107519815 0.266556031
2 0.47 6.5 -0.327902142 0.812913 0.107519815 0.266556031
3 0.47 5.5 -0.327902142 0.740363 0.107519815 0.242766512
4 0.46 6.4 -0.337242168 0.80618 0.11373228 0.271877882
5 0.46 6.4 -0.337242168 0.80618 0.11373228 0.271877882
6 0.45 6.3 -0.346787486 0.799341 0.120261561 -0.2772013
7 0.45 6.3 -0.346787486 0.799341 0.120261561 -0.2772013
8 0.45 6.3 -0.346787486 0.799341 0.120261561 -0.2772013
9 0.45 6.3 -0.346787486 0.799341 0.120261561 -0.2772013
10 0.45 6.3 -0.346787486 0.799341 0.120261561 -0.2772013
SUM
-3.392128194 7.975252 1.151331808 2.705640838
∑Log Q =NLog K + n∑Log H-----------------------------------------------1
∑Log Q Log H = Log K ∑Log H +n ∑(Log H)2 ----------------------2
7.975252 = 10 log K + n (-3.392128194)1
2.705640838 = (-3.392128194) log K + n (1.151331808) 2
By solving these equations simultaneously k & n are estimated thus:
K = 9.206
n = 0.491
Q = K Hn
Q = 9.206 H 0.491
(4.6)
The twelve rating equations obtained from Ero-omla records was utilized to convert the gauge
readings to streamflow data (Appendix 4). The streamflow data generated by the Owu Fall rating
equations is indicated in Appendix 5. The January rating curve is shown in Figure 4.2. While that of
Owu Fall is shown in Figure 4.3.The summary of rating curve coefficient is presented in Table 4.9

Assessment of Hydroelecric Potentials of Owu and Ero-omola Falls in Kwara State, Nigeria
Page 22
Figure 4.2:Ero-omola January Flood Rating Curve
Table 4.8: Owu Fall November Flood rating Curve
H(m) Q(m3/s) log Q log H (log H)2 logQlogH
0.27 1.986 0.298 0.103 0.011 0.0307
0.29 2.184 0.339 0.11 0.012 0.0373
0.24 1.698 0.229 0.093 0.009 0.0214
0.22 1.512 0.179 0.086 0.007 0.0154
0.21 1.42 0.152 0.083 0.007 0.0126
0.98 11.02 1.042 0.297 0.088 0.3095
0.97 10.88 1.037 0.294 0.086 0.3049
0.95 10.58 1.024 0.29 0.084 0.297
0.92 10.14 1.006 0.283 0.08 0.2847
0.89 9.703 0.987 0.276 0.076 0.2724
Total
6.293 1.915 0.46 1.5859
1.586=1.915 log k + 0.46n--------------------------------------------1
6.294=10log k +1.915n -----------------------------------------------2
by resolving above equation simultaneously we have
k=11.33
n=1.33
Ho=0
Which gives the rating equations as :
Q=11.33*H^1.33 for H> 0.20
y = -0.02ln(x) + 0.286R² = 0.997
0.325
0.33
0.335
0.34
0.345
0.35
0 0.05 0.1 0.15 0.2
GA
UG
E H
EIG
HT
LOG
H (
m)
LOG Q (m3/S)
JANUARY FLOOD RATING CURVE

Assessment of Hydroelecric Potentials of Owu and Ero-omola Falls in Kwara State, Nigeria
Page 23
Figure 4.3: Owu Flow Duration Curve
Table 4.9: Summary of Coefficient of Rating Equations.(Ero-omola)
Months K N Coefficient of
Determinant *(R2)
January 9.206 0.491 0.0463
February 9.253 0.765 0.815
March 9.089 0.934 0.9857
April 10.496 1.049 0.8318
May 10.229 1.455 0.9954
June 8.539 2.258 0.9727
July 0.610 7.789 0.9834
August 12.65 1.517 0.941
September 25.308 0.400 0.8949
0ctober 1.166 5.505 0.9285
November 17.167 2.753 0.9471
December 1.617 5.977 0.8902
*R2=This is a measure of the strength of relationship between the predictive and response variables
4.5 Extension of Streamflow Data at Ero-omola Fall
One year stream flow data generated by the rating equation at Ero-omola has to be extended in order
to fulfill other hydrological analysis requirement. In order to achieve this, the Model proposed by
Thomas and Fierring in 1962 according to McMachon and Mein (1978) was adopted. The model
utilized Markov model to represent actual stream flow when the monthly stream flow, qi, are
normally distributed and follow a first – order auto regressive model. The algorithm for the Thomas
and Fierring model is giving as:
𝑞𝑖+1 = 𝑞 𝑗+1 + 𝑏𝑗 ,𝑗+1 𝑞1𝑞 𝑗 + 𝑍𝑖+1𝑆𝑗+1 1 𝑟𝑗 ,𝑗+12
1/2 (4.7)
0
0.05
0.1
0.15
0.2
0.25
0.3
0.35
0 0.2 0.4 0.6 0.8 1 1.2
GA
UG
E H
EIG
TH (
m)
DISCHRGE Qm3/s
OWU NOVEMBER FLOOD RATING CURVE
Assessment of Hydroelecric Potentials of Owu and Ero-omola Falls in Kwara State, Nigeria
Page 24
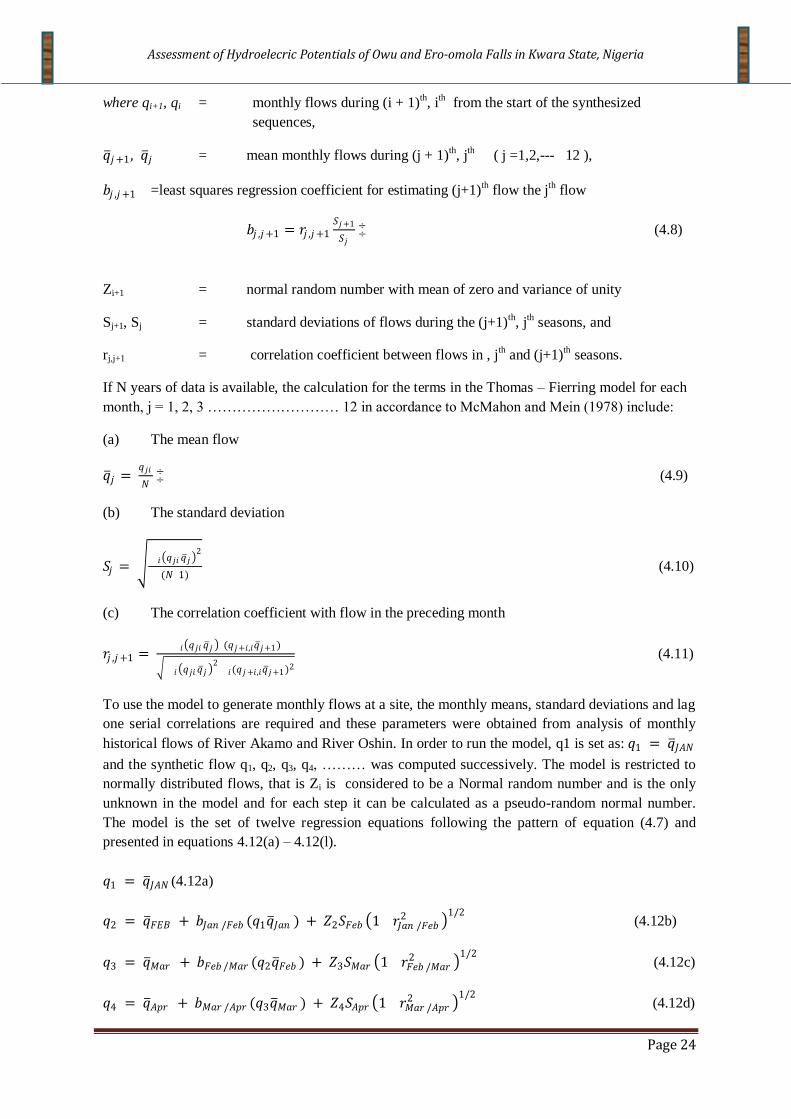
where qi+1, qi = monthly flows during (i + 1)th, i
th from the start of the synthesized
sequences,
𝑞 𝑗+1, 𝑞 𝑗 = mean monthly flows during (j + 1)th, j
th ( j =1,2,--- 12 ),
𝑏𝑗 ,𝑗+1 =least squares regression coefficient for estimating (j+1)th flow the j
th flow
𝑏𝑗 ,𝑗+1 = 𝑟𝑗 ,𝑗+1𝑆𝑗+1
𝑆𝑗÷÷ (4.8)
Zi+1 = normal random number with mean of zero and variance of unity
Sj+1, Sj = standard deviations of flows during the (j+1)th, j
th seasons, and
rj,j+1 = correlation coefficient between flows in , jth and (j+1)
th seasons.
If N years of data is available, the calculation for the terms in the Thomas – Fierring model for each
month, j = 1, 2, 3 ……………………… 12 in accordance to McMahon and Mein (1978) include:
(a) The mean flow
𝑞 𝑗 = 𝑞𝑗𝑖
𝑁 ÷÷ (4.9)
(b) The standard deviation
𝑆𝑗 = 𝑖 𝑞𝑗𝑖 𝑞 𝑗
2
(𝑁 1) (4.10)
(c) The correlation coefficient with flow in the preceding month
𝑟𝑗 ,𝑗+1 = 𝑖 𝑞𝑗𝑖 𝑞 𝑗 (𝑞𝑗+𝑖,𝑖𝑞 𝑗+1)
𝑖 𝑞𝑗𝑖𝑞 𝑗 2
𝑖(𝑞𝑗+𝑖,𝑖𝑞 𝑗+1)2
(4.11)
To use the model to generate monthly flows at a site, the monthly means, standard deviations and lag
one serial correlations are required and these parameters were obtained from analysis of monthly
historical flows of River Akamo and River Oshin. In order to run the model, q1 is set as: 𝑞1 = 𝑞 𝐽𝐴𝑁
and the synthetic flow q1, q2, q3, q4, ……… was computed successively. The model is restricted to
normally distributed flows, that is Zi is considered to be a Normal random number and is the only
unknown in the model and for each step it can be calculated as a pseudo-random normal number.
The model is the set of twelve regression equations following the pattern of equation (4.7) and
presented in equations 4.12(a) – 4.12(l).
𝑞1 = 𝑞 𝐽𝐴𝑁 (4.12a)
𝑞2 = 𝑞 𝐹𝐸𝐵 + 𝑏𝐽𝑎𝑛 /𝐹𝑒𝑏 (𝑞1𝑞 𝐽𝑎𝑛 ) + 𝑍2𝑆𝐹𝑒𝑏 1 𝑟𝐽𝑎𝑛 /𝐹𝑒𝑏2
1/2 (4.12b)
𝑞3 = 𝑞 𝑀𝑎𝑟 + 𝑏𝐹𝑒𝑏 /𝑀𝑎𝑟 (𝑞2𝑞 𝐹𝑒𝑏 ) + 𝑍3𝑆𝑀𝑎𝑟 1 𝑟𝐹𝑒𝑏 /𝑀𝑎𝑟2
1/2 (4.12c)
𝑞4 = 𝑞 𝐴𝑝𝑟 + 𝑏𝑀𝑎𝑟 /𝐴𝑝𝑟 (𝑞3𝑞 𝑀𝑎𝑟 ) + 𝑍4𝑆𝐴𝑝𝑟 1 𝑟𝑀𝑎𝑟 /𝐴𝑝𝑟2
1/2 (4.12d)

Assessment of Hydroelecric Potentials of Owu and Ero-omola Falls in Kwara State, Nigeria
Page 25
𝑞5 = 𝑞 𝑀𝑎𝑦 + 𝑏𝐴𝑝𝑟 /𝑀𝑎𝑦 (𝑞4𝑞 𝐴𝑝𝑟 ) + 𝑍5𝑆𝑀𝑎𝑦 1 𝑟𝐴𝑝𝑟 /𝑀𝑎𝑦2
1/2 (4.12e)
𝑞6 = 𝑞 𝐽𝑢𝑚 + 𝑏𝑀𝑎𝑦 /𝐽𝑢𝑛 (𝑞5𝑞 𝑀𝑎𝑦 ) + 𝑍6𝑆𝐽𝑢𝑛 1 𝑟𝑀𝑎𝑦 /𝐽𝑢𝑛2
1/2 (4.12f)
𝑞7 = 𝑞 𝐽𝑢𝑙 + 𝑏𝐽𝑢𝑛 /𝐽𝑢𝑙 (𝑞6𝑞 𝐽𝑢𝑛 ) + 𝑍7𝑆𝐽𝑢𝑙 1 𝑟𝐽𝑢𝑛 /𝐽𝑢𝑙2
1/2 (4.12g)
𝑞8 = 𝑞 𝐴𝑢𝑔 + 𝑏𝐽𝑢𝑙 /𝐴𝑢𝑔 (𝑞7𝑞 𝐽𝑢𝑙 ) + 𝑍8𝑆𝐴𝑢𝑔 1 𝑟𝐽𝑢𝑙 /𝐴𝑢𝑔2
1/2 (4.12h)
𝑞9 = 𝑞 𝑆𝑒𝑝 + 𝑏𝐴𝑢𝑔/𝑆𝑒𝑝 (𝑞8𝑞 𝐴𝑢𝑔 ) + 𝑍9𝑆𝑆𝑒𝑝 1 𝑟𝐴𝑢𝑔 /𝑆𝑒𝑝2
1/2 (4.12i)
𝑞10 = 𝑞 𝑂𝑐𝑡 + 𝑏𝑆𝑒𝑝 /𝑂𝑐𝑡 (𝑞9𝑞 𝑆𝑒𝑝 ) + 𝑍10𝑆𝑂𝑐𝑡 1 𝑟𝑆𝑒𝑝 /𝑂𝑐𝑡2
1/2 (4.12j)
𝑞11 = 𝑞 𝑁𝑜𝑣 + 𝑏𝑂𝑐𝑡 /𝑁𝑜𝑣 (𝑞10𝑞 𝑂𝑐𝑡 ) + 𝑍11𝑆𝑁𝑜𝑣 1 𝑟𝑂𝑐𝑡 /𝑁𝑜𝑣2
1/2 (4.12k)
𝑞12 = 𝑞 𝐷𝑒𝑐 + 𝑏𝑁𝑜𝑣/𝐷𝑒𝑐 (𝑞11𝑞 𝑁𝑜𝑣 ) + 𝑍12𝑆𝐷𝑒𝑐 1 𝑟𝑁𝑜𝑣/𝐷𝑒𝑐2
1/2 (4.12l)
Z is calculated for each step as a pseudo – random normal variate.
4.6 Model Development
The multiple linear regression theory is based on the assumed distribution of all variables in
accordance with the Gaussian normal distribution. Therefore, mathematical integrity requires that
each variable be transformed to a normal distribution. It has been established that logarithms of
streamflow are approximately normally distributed in most cases, however for computational
efficiency, it is convenient to establish the model from a transform logarithms of streamflow data.
The data from the two synoptic stations (Oro and Omu Aran) were converted to natural logarithms
before the data was analyzed for the determination of various model coefficient variables. The data
for Ero-omola were extended for 25 years based on the twelve model equations generated from the
analysis.
In accordance with the above basic procedure, historical streamflow data with relatively long years
of records obtained from the Lower Niger River Basin Development Authority was utilized in
extending the short data from Ero-omola. The data was obtained from the 1982 Hydrological Year
Book published by the hydrology department. The raw data and the flood hydrograph is attached in
Appendix 10 of this report.
The method of Least Square method was used to obtain the Regression Coefficient and other
statistical parameters between the short streamflow data from Ero-omola and the long historical
streamflow data from River Oshin and River Akamo. These two rivers are located between Oro and
Omuaran a similar catchment characteristics to Ero-omola. The monthly streamflow parameters
between historical streamflow and Ero-omola are shown in Table 4.9 while the equivalent
transformed data to natural logarithm is shown in Table 4.10.
In modeling the monthly streamflow data the Thomas and Fierring model based on a first order
Markov model is used and the synthetic streamflow series were calculated in Table 4.9 using
historical flow data from River Akamo and Oshin. The series of equation derived from the model is
presented in equations 4.13(a)-4.13(l) as follows:
Assessment of Hydroelecric Potentials of Owu and Ero-omola Falls in Kwara State, Nigeria
Page 26
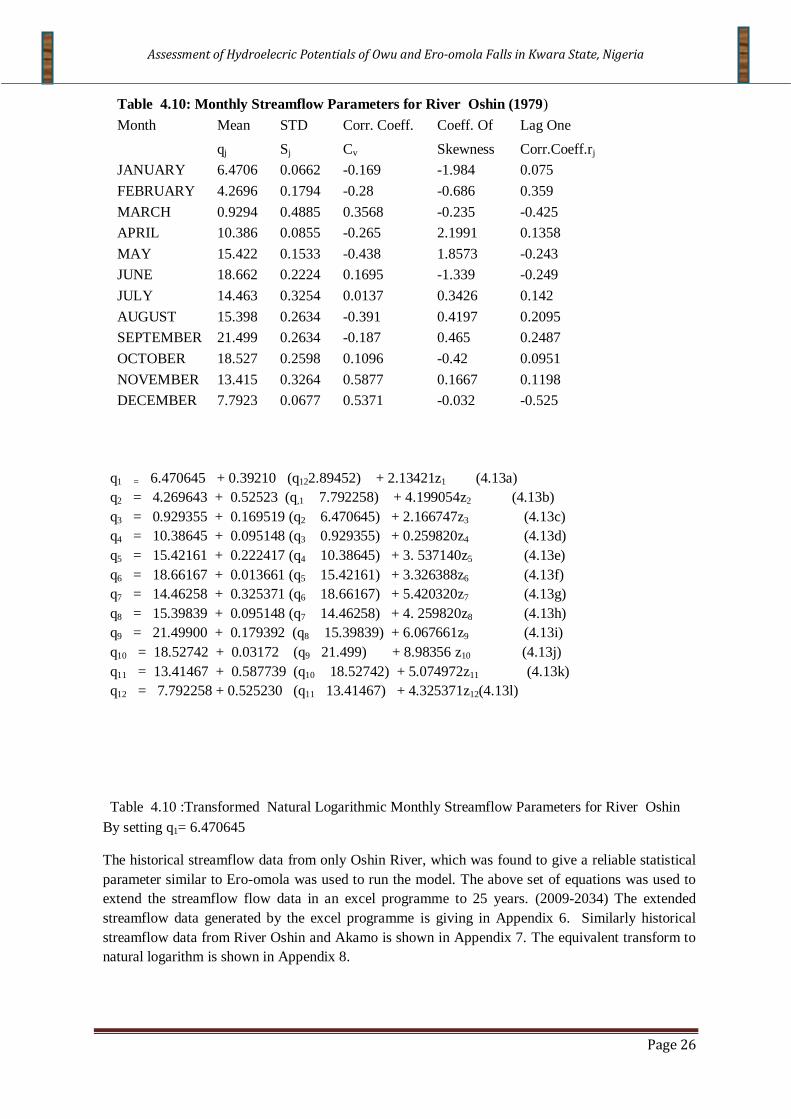
Table 4.10: Monthly Streamflow Parameters for River Oshin (1979)
Month Mean STD Corr. Coeff. Coeff. Of Lag One
qj Sj Cv Skewness Corr.Coeff.rj
JANUARY 6.4706 0.0662 -0.169 -1.984 0.075
FEBRUARY 4.2696 0.1794 -0.28 -0.686 0.359
MARCH 0.9294 0.4885 0.3568 -0.235 -0.425
APRIL 10.386 0.0855 -0.265 2.1991 0.1358
MAY 15.422 0.1533 -0.438 1.8573 -0.243
JUNE 18.662 0.2224 0.1695 -1.339 -0.249
JULY 14.463 0.3254 0.0137 0.3426 0.142
AUGUST 15.398 0.2634 -0.391 0.4197 0.2095
SEPTEMBER 21.499 0.2634 -0.187 0.465 0.2487
OCTOBER 18.527 0.2598 0.1096 -0.42 0.0951
NOVEMBER 13.415 0.3264 0.5877 0.1667 0.1198
DECEMBER 7.7923 0.0677 0.5371 -0.032 -0.525
q1 = 6.470645 + 0.39210 (q122.89452) + 2.13421z1 (4.13a)
q2 = 4.269643 + 0.52523 (q,1 7.792258) + 4.199054z2 (4.13b)
q3 = 0.929355 + 0.169519 (q2 6.470645) + 2.166747z3 (4.13c)
q4 = 10.38645 + 0.095148 (q3 0.929355) + 0.259820z4 (4.13d)
q5 = 15.42161 + 0.222417 (q4 10.38645) + 3. 537140z5 (4.13e)
q6 = 18.66167 + 0.013661 (q5 15.42161) + 3.326388z6 (4.13f)
q7 = 14.46258 + 0.325371 (q6 18.66167) + 5.420320z7 (4.13g)
q8 = 15.39839 + 0.095148 (q7 14.46258) + 4. 259820z8 (4.13h)
q9 = 21.49900 + 0.179392 (q8 15.39839) + 6.067661z9 (4.13i)
q10 = 18.52742 + 0.03172 (q9 21.499) + 8.98356 z10 (4.13j)
q11 = 13.41467 + 0.587739 (q10 18.52742) + 5.074972z11 (4.13k)
q12 = 7.792258 + 0.525230 (q11 13.41467) + 4.325371z12(4.13l)
Table 4.10 :Transformed Natural Logarithmic Monthly Streamflow Parameters for River Oshin
(1979)
Mean
STD
Corr.Coff.
Coeff.of
Lag one Corr
qj
Sj
Cv
Skewness
rj
JANUARY
1.867276
-2.7154
-0.12691
0.108505
By setting q1= 6.470645
The historical streamflow data from only Oshin River, which was found to give a reliable statistical
parameter similar to Ero-omola was used to run the model. The above set of equations was used to
extend the streamflow flow data in an excel programme to 25 years. (2009-2034) The extended
streamflow data generated by the excel programme is giving in Appendix 6. Similarly historical
streamflow data from River Oshin and Akamo is shown in Appendix 7. The equivalent transform to
natural logarithm is shown in Appendix 8.

Assessment of Hydroelecric Potentials of Owu and Ero-omola Falls in Kwara State, Nigeria
Page 27
Table 4.11 Transformed Natural Logarithmic Monthly Streamflow
Parameters for River Oshin (1979)
Month Mean STD Corr. Coeff. Coeff. Of Lag One
qj Sj Cv Skewness Corr.Coeff.rj
JANUARY 1.8673 2.715 -0.127 0.1085 0.2384
FEBRUARY 1.4515 1.718 -0.104 0.132 0.2434
MARCH -0.073 0.716 -0.107 0.1298 0.2277
APRIL 2.3405 2.459 -0.109 0.1287 0.2428
MAY 2.7358 1.875 -0.11 0.1293 0.239
JUNE 2.9265 1.503 -0.11 0.1287 0.2346
JULY 2.6716 1.123 -0.111 0.132 0.2379
AUGUST 2.7343 1.334 -0.112 0.1262 0.2394
SEPTEMBER 3.068 1.334 -0.112 0.1262 0.2403
OCTOBER 2.9193 1.348 -0.112 0.129 0.2319
NOVEMBER 2.5963 -1.12 -0.113 0.1267 0.2399
DECEMBER 2.0531 2.693 -0.114 0.1228 0.2298
Table 4.12: Monthly Streamflow Parameters for River Akamo (1981)
Month Mean STD Corr. Coeff. Coeff. Of Lag One
qj Sj Cv Skewness Corr. Coeff.rj
JANUARY 5.5168 0.3138 -0.209578889 -1.092 0.166323484
FEBRUARY 7.2808 0.1876 -0.174896707 -5.231 -0.174896707
MARCH 3.4519 0.4144 1 1.0393 0.761907351
APRIL 12.342 0.4144 0.761907351 1.0393 0.747056989
MAY 18.467 0.8012 1 0.2401 0.770461678
JUNE 22.246 0.7847 0.753907959 0.2265 0.655500363
JULY 16.596 0.4229 0.622736154 0.9587 0.229111101
AUGUST 20.552 1.0804 0.543791067 -0.346 0.675861256
SEPTEMBER 25.802 0.7272 0.554306075 -0.048 0.559931888
OCTOBER 22.35 0.9066 0.669627026 0.4298 0.736537432
NOVEMBER 18.52 1.0366 0.983150118 0.9183 -0.157603747
DECEMBER 12.635 1.178 -0.07175952 0.0267 -0.115143984
Table 4.13: Natural Logarithmic Transformed Monthly Streamflow Parameters for Akamo

Assessment of Hydroelecric Potentials of Owu and Ero-omola Falls in Kwara State, Nigeria
Page 28
River(1981)
Month Mean STD Corr. Coeff. Coeff. Of Lag One
qj Sj Cv Skewness Corr. Coeff.rj
JANUARY 1.7078 -1.159 0.094296843 0.2336 0.338208832
FEBRUARY 1.9852 -1.674 0.080529482 0.2256 0.333803756
MARCH 1.2389 -0.881 0.102455523 0.2386 0.342761931
APRIL 2.513 -0.881 0.100029495 0.2372 0.342858112
MAY 2.916 -0.222 0.0827014 0.2269 0.353779166
JUNE 3.1021 -0.242 0.068728441 0.2188 0.34791206
JULY 2.8092 -0.861 0.075363026 0.2227 0.351357211
AUGUST 3.0229 0.0773 0.120742773 0.2317 0.351461525
SEPTEMBER 3.2504 -0.319 0.095364927 0.2348 0.34791206
OCTOBER 3.1068 -0.098 0.159226005 0.2744 0.360897776
NOVEMBER 2.9188 0.0359 0.116877947 0.248 0.354409363
DECEMBER 2.5365 0.1638 0.147501602 0.2671 0.349307898
4.7Determination Of The Required Reservoir Capacity
It is imperative to make provision for compensation reservoir due to 3 months break of runoff at Ero-
omola. The regulated reservoir will then provide the needed flow of to the turbines uninterrupted
through out the year. The capacity required for a reservoir depends upon the inflow available and the
demand. If the available inflow in the river is always greater than the demand, there is no storage
required. On the other hand, if the inflow in the river is small but the demand is high, a large
reservoir capacity is required. The required capacity for the reservoir at Ero-omola was evaluated or
determined by the following methods:
1. Graphical method, using mass curves and
2.Flow-duration curves method
4.7.1 Determination of Ero-omola Reservoir Capacity
The yield from a reservoir of a given capacity can be determined by the use of the mass inflow curve.
The following procedure was used.
Table 4.14: Mass Inflow Curve Computation for Ero-omola Fall using average monthly discharge data.
Month Average Monthly Discharge Cumulative Volume
(m3/s)
(m3/s)
JAN.
6.04984
6.04984 FEB.
4.939395
10.98924
MAR.
3.755002
14.74424 APR.
12.84037
27.58461
MAY
19.64738
47.23199 JUNE
21.39122
68.62321
JULY
24.09706
92.72027 AUG.
36.95531
129.6756
SEPT.
49.07125
178.7468

Assessment of Hydroelecric Potentials of Owu and Ero-omola Falls in Kwara State, Nigeria
Page 29
OCT.
39.91781
218.6646
NOV.
32.30785
250.9725
DEC.
19.97958
270.9521
Sum 1316.955
Figure 4.4: Ero-omola Inflow Mass Curve
The maximum storage capacity computed from the mass inflow curve above is 60m3/s. The reservoir
is expected to fill up in the middle of September. Further computation is needed to convert the discharge into an inflow volume:
1 m3/ year = 1 x 365 x 24 x 60 x 60 = 31.536 x 10
6m
3
Reservoir Capacity = 31.536mcm x 60 = 1892.16mcm
Inflow volume in 2009 = 13I6.955 x 31.536mcm = 41531.49mcm
4.8 Evaluation of Sediment Load or Sediment Transport
In order to established the sediment load into the reservoir. It assumed that the reservoir capacity will
terminate when 80% of initial capacity is filled with sediment.
Average sediment inflow to River Ero is giving as 36000 tonnes (LNRBDA, 2003)
Specific weight of sediment taken from laboratory =1200kg/m3(LNRBDA, 2003)
Reservoir Capacity = 1892.16mcm
Annual Inflow = 41531.49mcm
Trap Efficiency = Sediment Deposited x 100% (US Bureau of Reclamation, 1987)
Sediment Inflow
y = 18.96xR² = 0.848
0
50
100
150
200
250
300
JAN. FEB. MAR. APR. MAY JUNE JULY AUG. SEPT. OCT. NOV. DEC.
Cu
mm
ula
tive
flo
w (
M3
/s)
Months
ERO-OMOLA INFLOW MASS CURVE

Assessment of Hydroelecric Potentials of Owu and Ero-omola Falls in Kwara State, Nigeria
Page 30
Trap Efficiency = Reservoir Capacity/Mean Annual Inflow
Trap Efficiency = 1892.16/41531.49 =0.045
Annual sediment inflow = 36000 𝑡𝑜𝑛𝑛𝑒𝑠 = 3.6 × 10⁶ 𝑘𝑔. (LNRBDA, 1999)
Volume of sediment inflow = 3.6 ×10⁶
1200= 3000 𝑚3
Annual Sediment Deposited = Trap Efficiency x Sediment inflow
=0.045 x 3000 = 135m3
Therefore, in 25years the sediment deposited will amount to 3,375m3which suggest the need
to provide sluice gate at the headworks for sediment discharge. This is to avoid a situation
where the reservoir is filled up before the expected project life of 25 years. Nevertheless, a
more details assessment is required to ascertain the useful life of the reservoir.

Assessment of Hydroelecric Potentials of Owu and Ero-omola Falls in Kwara State, Nigeria
Page 31
CHAPTER FIVE
5.0 POTENTIAL ENERGY ASSESSMENT
5.1 Potential Energy Assessment of Ero-OmolaFall
In order to evaluate potential energy at Ero-omola. Twenty years ofstreamflow record
(2009-2034) was utilised from the projected 25 years records in Appendix 6. The streamflow
data was arranged in ascending order. The percentage of exceedence and annual projected
hydropower generation potential was computed in Table 5.1. The Flow Duration Curve as well
as the Power Duration Curve plotted is shown in Figure 5.1 and 5.2
Table 5.1:Computation of Flow Duration Curve using the projected 20 years figures
No. Year Flow(m3/s) Flow in Ascending Order
P{ower=9.8 x 59.4 x F(kw)
% of time of availability
N +1 -n
%
N
1 2009 22.57 21.97
12789.18 100
2 2010 22.82 21.98
12795 95
3 2011 23.14 22.03
12824.1 90
4 2012 22.99 22.57
13138.45 85
5 2013 23.71 22.79
13266.51 80
6 2014 24.39 22.82
13283.98 75
7 2015 23.34 22.99
13382.94 70
8 2016 21.98 23.14
13470.26 65
9 2017 21.97 23.34
13586.68 60
10 2018 22.03 23.61
13743.85 55
11 2019 22.79 23.71
13802.07 50
12 2020 23.61 24.34
14168.8 45
13 2021 24.49 24.39
14197.91 40
14 2022 24.94 24.49
14256.12 35
15 2023 24.8 24.8
14436.58 30
16 2024 24.34 24.83
14454.04 25
17 2025 24.83 24.94
14518.07 20
18 2026 26.06 25.39
14780.03 15
19 2027 25.39 26.06
15170.05 10
20 2028 26.07 26.07
15175.87 5
Assessment of Hydroelecric Potentials of Owu and Ero-omola Falls in Kwara State, Nigeria
Page 32
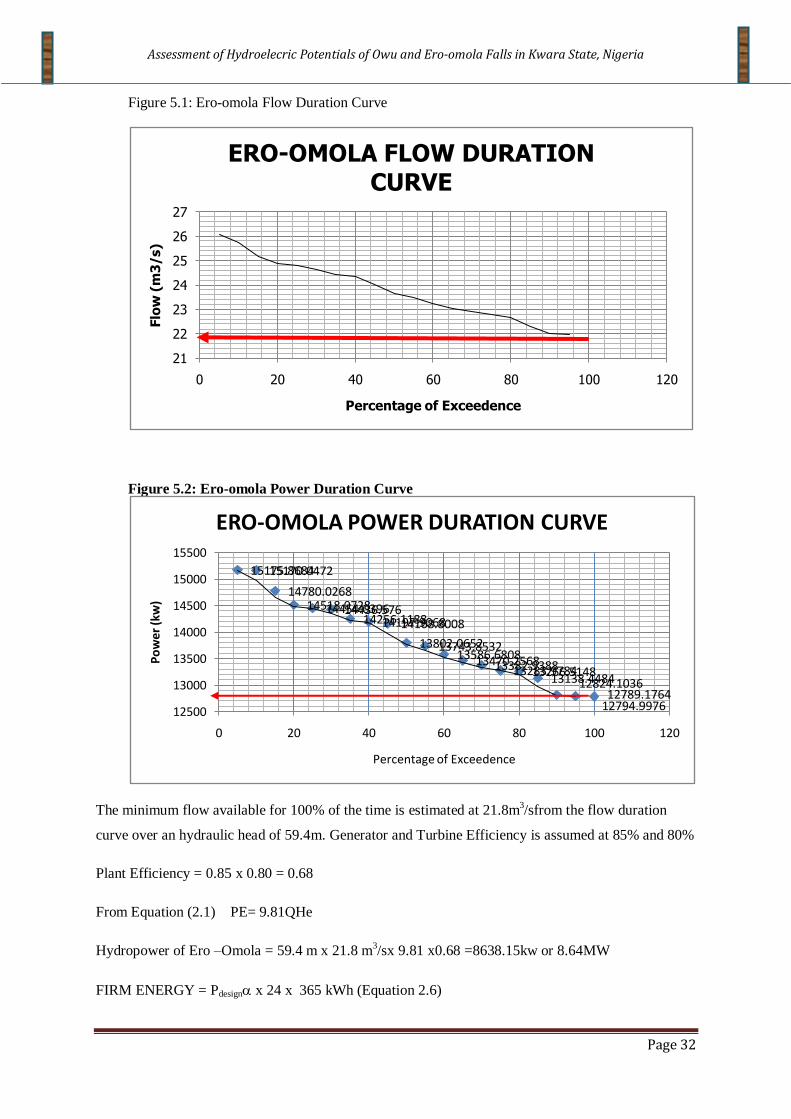
Figure 5.1: Ero-omola Flow Duration Curve
Figure 5.2: Ero-omola Power Duration Curve
The minimum flow available for 100% of the time is estimated at 21.8m3/sfrom the flow duration
curve over an hydraulic head of 59.4m. Generator and Turbine Efficiency is assumed at 85% and 80%
Plant Efficiency = 0.85 x 0.80 = 0.68
From Equation (2.1) PE= 9.81QHe
Hydropower of Ero –Omola = 59.4 m x 21.8 m3/sx 9.81 x0.68 =8638.15kw or 8.64MW
FIRM ENERGY = Pdesign x 24 x 365 kWh (Equation 2.6)
21
22
23
24
25
26
27
0 20 40 60 80 100 120
Flo
w (
m3
/s)
Percentage of Exceedence
ERO-OMOLA FLOW DURATION CURVE
12789.176412794.9976
12824.103613138.448413266.514813283.978413382.938813470.256813586.6808
13743.853213802.0652
14168.800814197.906814256.118814436.57614454.039614518.0728
14780.0268
15170.047215175.8684
12500
13000
13500
14000
14500
15000
15500
0 20 40 60 80 100 120
Po
wer
(kw
)
Percentage of Exceedence
ERO-OMOLA POWER DURATION CURVE

Assessment of Hydroelecric Potentials of Owu and Ero-omola Falls in Kwara State, Nigeria
Page 33
Annual Firm Energy = 8.64 x 24 x 365x 0.2 = 15137.28MWh (Analytical)
Also from the Power Duration Curve in Figure 5.2 the firm energy or plant capacity at 100% of time
is computed as 12794.9976kw or 12.794MW
Annual Firm Energy =12.794 x 0.68 x 24 x 365 x 0.2=15242.26MWh.(Graphical)
Using the new NIPP, Multi Year Tariff Order (MYTO) of Nigeria Regulatory Energy Commission
(Appendix 9) of N14.00/kWh. The total cost of bulk energy, excluding other charges is estimated at
15137280Kwh x N14.00/kWh = N211,921,920/Annum
5.2 Potential Energy Assessment of Owu Fall
The streamflow discharge data (Appendix 5) generated from the rating equation at owu was utilized to
develop the Flow Duration Curve (FDC) as well as Power Duration Curve (PDC). The minimum flow
available for 100% of the time from the FDC/PDC curve(Figure 5.3 and 5.4) amount to 9.9m3/s over
an hydraulic head of 95.5m. The computational procedures is shown in Table 5.2
Hydropower potentials for Owu Fall= 95.5m x 9.9m3/s x 9.81 x 0.95 = 8,811.12 kW or 8.81 MW
(with 95% efficiency plans).
Annual Firm Energy =8.81MW x 24 x 365 x 0.2 = 15435.12MWh
Using the NIPP tariff order of N14.00/Kwh. Annual energy generated is estimated at
N216,091,680.00/Annum.
Table 5.2 : Owu FDC/PDC Computation
No. Year Flow(m3/s
Flow in Ascending Order
Power=9.8 x 59.4 x F(kw)
% of time of availability
N +1 -n %
N
1 JANUARY 4.1856 10.955
3917.3133 100
2 FEBRUARY
0 91.667
3 MARCH
3.6371 10.342
3403.958 83.333
4 APRIL
3.6414 10.237
3407.9883
5 MAY
3.8497 4.1856
3602.9737 66.667 6 JUNE
3.5605 4.1856
3332.2596 58.333
7 JULY
0
8 AUGUST 10.237 3.8497
9580.4755 41.667 9 SEPTEMBER 4.1856 3.6414
3917.3133 33.333
10 OCTOBER
0
11 NOVEMBER 10.955 3.6371
10252.694 16.667
12 DECEMBER 10.342 3.5605
9679.3501 8.3333

Assessment of Hydroelecric Potentials of Owu and Ero-omola Falls in Kwara State, Nigeria
Page 34
Figure 5.3: Owu Flow Duration Curve
Figure 5.4:Owu Fall Power Duration Curve
5.3 Hydropower Water Demand
From the flow duration curve(Ero-omola) the peak hydropower demand was estimated at 21.80m3/s,
hence 7m3/s is expected to be drafted by draft tube into bifurcated penstocks making a total of 7 x 24
x 3600 x 365 =220.752 MCM or 662.256mcm for the three turbines annually.
The storage capacity required to meet the peak hydropower demand of 21.80m3/s throughout the year
is given thus;
Yearly demand = 31.536 x 21.80 = 687.48mcm
0
2
4
6
8
10
12
14
0 20 40 60 80 100 120
FLO
W (
Qm
3/S)
PERCENTAGE OF EXCEDENCE
OWU FLOW DURATION CURVE
0
2000
4000
6000
8000
10000
12000
0 20 40 60 80 100 120
PO
WER
(kw
)
PERCENTAGE OF EXCEEDENCE
OWU POWER DURATION CURVE

Assessment of Hydroelecric Potentials of Owu and Ero-omola Falls in Kwara State, Nigeria
Page 35
CHAPTER SIX
6.0 FINANCIAL JUSTIFICATION
6.1 Introduction
Economic feasibility and optimality represent just one of many considerations in the decision-
making process. However, economic analysis does play an important central role in decision-
making at many levels, in various settings. Economic evaluation of hydropower development
plans combines basic methods of engineering economics with benefit estimation procedures.
Analyses of economic costs and benefits provide important information for use, along with
various other forms of information, in making a myriad of decisions in planning, design,
operations, and other water resources engineering activities. (Printinger, 1972)
The economic objectives for comparing alternative plans may be in either of the following alternative forms:
Maximize net benefits, which are benefits less costs
Minimize cost required to provide a specified level of service
Maximize benefits derived from fixed resources.
In this study, both benefits and costs are relevant and are included in the analysis.
6.2 Engineering Economics
Engineering economics is a set of principles applied in comparing alternative plans to
determine the economically optimal design. Equivalence of kind and equivalence of time are
required so that all relevant costs and benefits of each alternative are comparable.
Equivalence of kind is achieved by expressing all benefits and costs included in the analysis
in both local and foreign currencies. Equivalence of time is achieved through discounting
techniques using compound interest formulas. Having a Naira today is worth more than
obtaining a Naira at some future time, because the Naira in hand today can be invested to
accrue interest.
6.3 Economic Analysis
Benefits and costs associated with water projects occur at various times, Initial investment
costs occurring at the beginning of the project life are associated with construction or
implementation. Operation and maintenance costs continue throughout the life of the project.
Major replacement and rehabilitation costs may occur periodically. Benefits typically accrue
over long periods of time. Time streams of benefits and costs may be converted to other
equivalent cash flows for purposes of comparison using discounting formulas, with a special
fixed discount rate. The discount rate is often linked to the concept of marginal internal rate of
return in National Integrated Power Project or National Independent Power Project industry.
If funds were committed to the project yielding the highest return first, and then to subsequent
projects in order of rate of return, the rate of return of the last project selected before funds

Assessment of Hydroelecric Potentials of Owu and Ero-omola Falls in Kwara State, Nigeria
Page 36
ran out would be the marginal internal rate of return. The discount rate used by the National
Economic Planning Department is based on the market interest rate for risk free investment,
with the limitation that the rate may not be changed too rapidly. The financial analysis in this
study shall be limited to only Ero Omola project due to its obvious advantage of Owu Fall
Project.
6.4 Hydro Power Generation Benefit
The entire benefit envisaged from this project is generation of Hydro-power electricity. The
peak power generation contemplated of the project is 8638.15kw or 8.64 MW. This power
would be utilized for electrifying five LGAs town and neighboring villages.
The total capability of hydropower generation (number of Kilowatt hour units) in a year of
90% dependability would be 15137.28MWh. With 70% load factor, the total units generated
would be 0.7 x 15137.28 = 10596.096MWh.
6.5 Cost of generation per Kilowatt
The total cost of the project, except for the equivalent cost of 48 Km. long 133 KVA High Tension
Transmission line, equipments & distribution system, which is entirely for power generation works
out to 1809 million Naira. (Abstractive Cost) With the above investment, the installed capacity to be
provided is 8638.15kw; hence the cost per kW installed capacity works out to N209,419.84\kW
6.6 Internal Rate Return.
Internal rate of return is that discount rate that makes the net present value of a net benefit or
cash flow equal zero or is the maximum interest rate that a project could pay on invested
capital, if the project is to recover its investments and operating costs and still break even. It
could also be defined as the rate of return on capital outstanding per period while it is invested
in the project.
6.6.1 Assumptions:
Reservoir capital costs are given as input data and their operation and maintenance costs are
expressed as a fraction of their capital costs. Power house, penstock and forebay costs are
based on maximum draft tubes flow. Operation and maintenance costs are a fraction of this
value. Power and imported turbines spare parts costs are determined from abstractive market
value. Present worth is obtained from the actual cost (sum of the costs of actual Capital,
operation and maintenance, power, imported turbines parts, and deficit minus the
hydroelectric power benefits). The cost abstract is presented in Table 6.1.
Assessment of Hydroelecric Potentials of Owu and Ero-omola Falls in Kwara State, Nigeria
Page 37
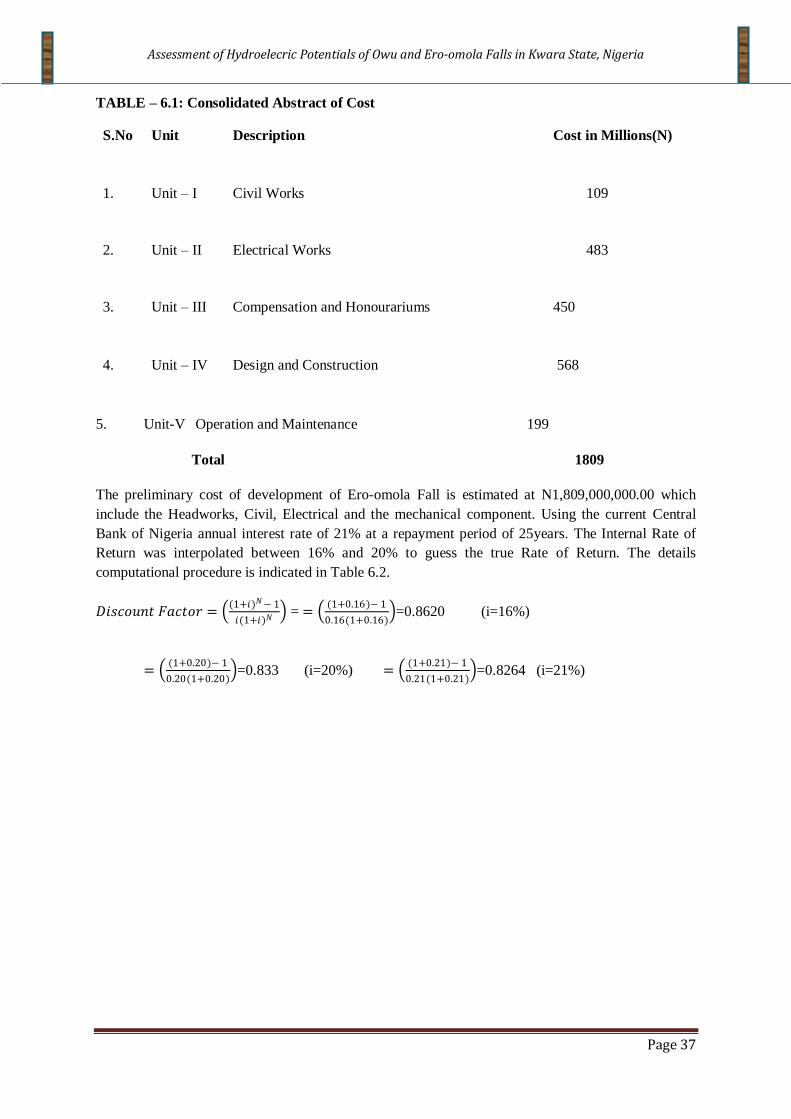
TABLE – 6.1: Consolidated Abstract of Cost
S.No Unit Description Cost in Millions(N)
1. Unit – I Civil Works 109
2. Unit – II Electrical Works 483
3. Unit – III Compensation and Honourariums 450
4. Unit – IV Design and Construction 568
5. Unit-V Operation and Maintenance 199
Total 1809
The preliminary cost of development of Ero-omola Fall is estimated at N1,809,000,000.00 which
include the Headworks, Civil, Electrical and the mechanical component. Using the current Central
Bank of Nigeria annual interest rate of 21% at a repayment period of 25years. The Internal Rate of
Return was interpolated between 16% and 20% to guess the true Rate of Return. The details
computational procedure is indicated in Table 6.2.
𝐷𝑖𝑠𝑐𝑜𝑢𝑛𝑡 𝐹𝑎𝑐𝑡𝑜𝑟 = (1+𝑖)𝑁− 1
𝑖(1+𝑖)𝑁 = =
(1+0.16)− 1
0.16(1+0.16) =0.8620 (i=16%)
= (1+0.20)− 1
0.20(1+0.20) =0.833 (i=20%) =
(1+0.21)− 1
0.21(1+0.21) =0.8264 (i=21%)

Assessment of Hydroelecric Potentials of Owu and Ero-omola Falls in Kwara State, Nigeria
Page 38
TABLE 6.2: COMPUTATION OF INTERNAL RATE OF RETURN FROM CASH FLOW (ABSTRACTIVE COST)
METHOD:INTERPOLATION METHOD
YEAR CAPITAL O & M (N)*M GROSS(N)M VALUE OF INCREMENTAL 16%D.F 16% PW 20% D.F 20% PW
COMPONENT(N)M
INCREMENTAL NET
GROSS BENEFIT
BENEFIT(N)M CASH
FLOW(N)M
1 1.09
0
1.09
-1.09
0.862 -0.94 0.833 -0.91
2 4.83
0
4.83
-4.83
0.743 -3.59 0.694 -3.35
3 5.68
0
5.68
-5.68
0.641 -3.64 0.579 -3.29
4 4.5
0
4.5
-4.5
0.552 -2.48 0.482 -2.17
5 1.99
0
1.99
-1.99
0.476 -0.95 0.402 -0.8
6 0
0.67
0.67
1
0.41 0.41 0.335 0.34
7 0
0.97
0.97
2.37
0.354 0.84 0.279 0.66
8 0
1.3
1.3
3.7
0.305 1.13 0.233 0.86
9 0
1.62
1.62
5.06
0.263 1.33 0.194 0.98
10 0
1.95
1.95
6.43
1.57 10.1 0.948 6.1
TOTAL 18.09 6.51 24.6 0.47 6.176 2.21 4.979 -1.58
(*M=million)
Interpolation Procedures: Internal Rate of Return= Lower Discount rate +Difference Between the Discount rate x Ratio of Present Worth of Incremental benefit cash flow at Lower Discount Rate
and Sum of the Incremental Net Benefit Stream Cash flow of the two Discount rate (when the signs are ignored)
Present Worth of Benefit @ 16% = 2.21 Million Present Worth of Benefit @ 20% = 1.58 Million
The Sum of the Streams at the two Discount rates Ignoring the signs=2.21+1.58=3.79
INTERNAL RATE OF RETURN =16 (4)2.21/3.79=16 + 4(0.58) = 18.62 OR 18%

Assessment of Hydroelecric Potentials of Owu and Ero-omola Falls in Kwara State, Nigeria
Page 39
The internal rate return of 18% with an abstractive cash flow analysis suggests a promising profit
outlook. Accurate Internal Rate of Return will be achieved when both structural and non-structural
design of all hydropower components is completed and the true Bill of Engineering Measurement and
Evaluation is incorporated in the Economic Analysis. The amortization of various hydropower
components at the prevailing interest rate of 21% is computed below:
6.7 Amortization Analysis
The projected hydropower cash flow is presented in Appendix 11. The cash flow indicates that Ero-
omola project is expected to grow by 5% profit beginning from year 2015. The total Kilo Watt Hour
units available annually at 90% dependability excluding Power-Station requirement is 15137.28
MWh. Taking the estimated life span of electrical works (generation), civil, operation and
maintenance and other works as 25 years. Amortization of various component of hydropower project
outlined above was computed in consideration of prevailing interest rate of 21%. The discount factor
computed at 21% interest rate is presented thus:
𝐴 = 𝐹 𝑖
(1+𝑖)𝑁− 1 = 𝐴 = 𝐹
0.21
(1+0.21)25− 1 =0.0018 (when n=25years)
1. Amortization Cost Amount(N)
(a) Electrical Works (21% Interest, 25 yrs. life)
a) (b) Civil Works. (21% Interest, 25 yrs. life)
(c) Design and Construction
(d) Compensation and Honourariums
(a) (e)Operation and Maintenance(1.5% of Total Cost)
Total
= 0.0018 x 1090000 = N1,962.00
= 0.0018 x 4830000 = N8,694.00
= 0.0018 x 5680000 =N10,224.00
= 0.0018 x 4500000 =N8,100.00
= 0.015 x 1990000 =N29,850.00
= N58,830.00

Assessment of Hydroelecric Potentials of Owu and Ero-omola Falls in Kwara State, Nigeria
Page 40
APPENDIX 1:
CROSS-SECTION OF
ERO-OMOLA STREAM

Assessment of Hydroelecric Potentials of Owu and Ero-omola Falls in Kwara State, Nigeria
Page 41
APPENDIX 2

Assessment of Hydroelecric Potentials of Owu and Ero-omola Falls in Kwara State, Nigeria
Page 42
Streamflow Discharge Computation with Current Metre (Arithmetic Method)
The calibration equation of the instrument is given as;
V = 0.2483 n +0.011 for n=< 0.59 where n revolution per seconds
V = 0.2619 n + 0.003 for n= < 9.21
Segment 1
𝑛 = 𝑟𝑒𝑣𝑜𝑙𝑢𝑡𝑖𝑜𝑛
𝑡𝑖𝑚𝑒
= 5
40 = 0.125
𝑣1 = 0.2483 × 𝑛 + 0.011
= 0.2483 × 0.125 + 0.011 = 0.034𝑚𝑙𝑠.
𝐴1 = 12 𝑏𝑑
= 12 × 3 × 0.95
= 1.43𝑚3
𝑞1 = 𝑣1𝐴1
= 0.03 × 1.43
= 0.049𝑚3/𝑠
Segment 2
𝑛 = 7
43 = 0.163
𝑉2 = 0248 × 0.163 + 0.011
= 0.043𝑚/𝑠
𝐴2 = 𝑄2 + 𝑄3
2 𝑏
= 0.095 + 1.4
2 3
= 3.53𝑚2
𝑞2 = 𝑉2𝐴2
= 0.043 × 3.53
= 0.152𝑚2/𝑠
Segment 3
𝑛 = 7
52 = 0.135
𝑣3 = 0.2483 × 0.135 + 0.011

Assessment of Hydroelecric Potentials of Owu and Ero-omola Falls in Kwara State, Nigeria
Page 43
= 0.036𝑚/𝑠
𝐴3 = (𝑄3 + 𝑄4)
2 𝑏
= (1.4 + 2.0)
2
= 5.0𝑚2
𝑞3 = 𝑉3𝐴3 = 0.184𝑚3/𝑠
𝑞3 = 0.184𝑚3/𝑠
Segment 4
𝑛 = 7
40 = 0.175
𝑣4 = 0.2483 × 0.175 + 0.011
= 0.046𝑚/𝑠
𝐴4 = (2.0 + 2.1)3
2
= 6.15𝑚2
𝑞4 = 𝑉4𝐴4
= 0.046 × 6.15
= 0.283𝑚3/𝑠
Segment 5
𝑛 = 10
55 = 0.182
𝑣5 = 0.2483 × 0.182 + 0.011
= 0.048𝑚/𝑠
𝐴5 = (2.1 + 2.3)3
2
= 6.6𝑚2
𝑞5 = 𝑉5𝐴5
= 0.048 × 6.6
= 0.317𝑚3/𝑠
Segment 6
𝑛 = 10
53 = 0.189
𝑣6 = 0.2483 × 0.189 + 0.011

Assessment of Hydroelecric Potentials of Owu and Ero-omola Falls in Kwara State, Nigeria
Page 44
= 0.049𝑚/𝑠
𝐴6 = (2.3 + 2.25)3
2
= 6.83𝑚2
𝑞6 = 𝑉6𝐴6
= 0.049 × 6.83
= 0.334𝑚3/𝑠
Segment 7
𝑛 = 10
48 = 0.208
𝑣7 = 0.2483 × 0.208 + 0.011
= 0.054𝑚/𝑠
𝐴7 = (2.25 + 2.2)3
2
= 6.68𝑚2
𝑞7 = 𝑉7𝐴7
= 0.054 × 6.68
= 0.360𝑚3/𝑠
Segment 8
𝑛1 = 15
50 = 0.3 𝑉81 = 0.2483 × 0.3 + 0.011
= 0.077𝑚/𝑠
𝑛2 = 10
50 = 0.2 𝑉82 = 0.2483 × 0.2 + 0.011
= 0.0524𝑚/𝑠
𝑉8𝑎𝑣𝑔 = 0.065𝑚/𝑠
𝐴8 = (2.2 + 2.5)3
2
= 7.05𝑚2
𝑞8 = 𝑉8𝐴8
= 0.065 × 7.0
= 0.458𝑚3/𝑠
Segment 9

Assessment of Hydroelecric Potentials of Owu and Ero-omola Falls in Kwara State, Nigeria
Page 45
𝑛1 = 15
45 = 0.33 𝑉91 = 0.2483 × 0.33 + 0.011
= 0.085𝑚/𝑠
𝑛2 = 10
48 = 0.2 𝑉92 = 0.2483 × 0.21 + 0.011
= 0.054𝑚/𝑠
𝑉9𝑎𝑣𝑔 = 0.069
𝐴9 = (09 + 010 )
2𝑏 𝐴9 =
(2.5 + 2.8)
22
= 5.3𝑚2
𝑞9 = 𝑉9𝐴9
= 0.069 × 5.3
= 0.366𝑚3/𝑠
Segment 10
𝑛1 = 15
43 = 0.35 𝑉101 = 0.2483 × 0.35 + 0.011
= 0.089𝑚/𝑠
𝑛2 = 10
46 = 0.22 𝑉102 = 0.2483 × 0.22 + 0.011
= 0.057𝑚/𝑠
𝑉10𝑎𝑣𝑔 = 0.073𝑚/𝑠
𝐴10 = (010 + 04)
2𝑏 𝐴10 =
(2.8 + 3.0)
22
= 5.8𝑚2
𝑞10 = 𝑉10𝐴10
= 0.073 × 5.8
= 0.423𝑚3/𝑠
Segment 11
𝑛1 = 20
52 = 0.38 𝑉111 = 0.2483 × 0.38 + 0.011
= 0.098𝑚/𝑠
𝑛2 = 10
40 = 0.25 𝑉111 = 0.2483 × 0.25 + 0.011
= 0.065𝑚/𝑠
𝑉11𝑎𝑣𝑔 = 0.081𝑚/𝑠
𝐴11 = (011 + 012 )
2𝑏 𝐴11 =
(3.0 + 2.95
22

Assessment of Hydroelecric Potentials of Owu and Ero-omola Falls in Kwara State, Nigeria
Page 46
= 5.95𝑚2
𝑞11 = 𝑉11𝐴1
= 0.081 × 5.95
= 0.482𝑚3/𝑠
Segment 12
𝑛1 = 20
50 = 0.40 𝑉121 = 0.2483 × 0.40 + 0.011
= 0.102𝑚/𝑠
𝑛2 = 10
42 = 0.24 𝑉122 = 0.2483 × 0.24 + 0.011
= 0.062𝑚/𝑠
𝑉12𝑎𝑣𝑔 = 0.082𝑚/𝑠
𝐴12 = (012 + 013 )
2𝑏 𝐴12 =
(2.95 + 3.1
22
= 6.05𝑚2
𝑞12 = 𝑉12𝐴12
= 0.082 × 6.05
= 0.496𝑚3/𝑠
Segment 13
𝑛1 = 20
48 = 0.42 𝑉131 = 0.2483 × 0.42 + 0.011
= 0.106𝑚/𝑠
𝑛2 = 10
46 = 0.22 𝑉132 = 0.2483 × 0.22 + 0.011
= 0.057𝑚/𝑠
𝑉13𝑎𝑣𝑔 = 0.081𝑚/𝑠
𝐴13 = (013 + 014 )
2𝑏 𝐴13 =
(3.1 + 3.2 )
22
= 6.3𝑚2
𝑞13 = 𝑉13𝐴13
= 0.081 × 6.3
= 0.51𝑚3/𝑠
Segment 14
𝑛1 = 20
52 = 0.38 𝑉141 = 0.2483 × 0.38 + 0.011

Assessment of Hydroelecric Potentials of Owu and Ero-omola Falls in Kwara State, Nigeria
Page 47
= 0.098𝑚/𝑠
𝑛2 = 15
55 = 0.27 𝑉142 = 0.2483 × 0.27 + 0.011
= 0.07𝑚/𝑠
𝑉14𝑎𝑣𝑔 = 0.084𝑚/𝑠
𝐴14 = (014 + 015 )
2𝑏
= 6.25𝑚2
𝑞13 = 𝑉14𝐴14
= 0.084 × 6.25
= 0.525𝑚3/𝑠
Segment 15
𝑛1 = 15
42 = 0.36 𝑉151 = 0.2483 × 0.36 + 0.011
= 0.091𝑚/𝑠
𝑛2 = 10
46 = 0.22 𝑉152 = 0.2483 × 0.22 + 0.011
= 0.057𝑚/𝑠
𝑉15𝑎𝑣𝑔 = 0.074𝑚/𝑠
𝐴15 = (015 + 016 )
2𝑏 𝐴9 =
(3.05 + 3.1)
22
= 6.15𝑚2
𝑞15 = 𝑉15𝐴15
= 0.074 × 6.15
= 0.46𝑚3/𝑠
Total Discharge Q
Q = 0.049 + 0.152 + 0.184 + 0.283 + 0.317 + 0.334 + 0.360 + 0.458 + 0.366 + 0.423 +
0.482 + 0.496 + -.510 + 0.525 + 0.460 = 5.40m3/s.

Assessment of Hydroelecric Potentials of Owu and Ero-omola Falls in Kwara State, Nigeria
Page 48
APPENDIX 3

Assessment of Hydroelecric Potentials of Owu and Ero-omola Falls in Kwara State, Nigeria
Page 49
APPENDIX 4

Assessment of Hydroelecric Potentials of Owu and Ero-omola Falls in Kwara State, Nigeria
Page 50
APPENDIX 4a: ERO-OMOLA DAILY GAUGE RECORDS
JA FE MA AP MA JN JL AU SE OC NO DE
1. 0.470 0.710 0.610 0.520 0.560 1.350 1.36 0.840 0.980 1.370 1.360 1.260
2. 0.470 0.690 1.360 0.520 1.320 1.320 1.340 0.810 0.970 1.350 1.350 1.240 3. 0.470 0.680 1.330 0.510 1.290 1.260 1.310 1.780 1.420 1.320 1.310 1.210
4. 0.460 1.270 1.310 0.50 1.260 1.210 1.280 1.760 1.380 1.280 1.270 1.190
5. 0.460 1.250 1.280 0.690 1.180 1.120 1.250 1.760 1.360 1.240 1.240 1.170
6. 0.460 1.230 1.250 0.670 1.130 0.940 1.210 1.710 1.320 1.460 1.210 1.140 7. 0.460 1.220 1.210 0.640 0.970 0.890 1.170 1.650 1.190 1.430 1.170 1.110
8. 0.460 1.210 1.180 0.630 0.960 0.850 1.120 1.620 1.190 1.390 1.165 0.970
9. 0.460 1.190 1.140 0.630 0.950 0.810 1.240 1.530 1.370 1.350 1.140 0.940 10. 0.460 1.430 1.110 0.620 0.980 0.780 1.210 1.480 1.340 1.310 1.120 0.910
11. 0.460 1.410 0.950 0.60 0.940 1.240 1.150 1.440 1.310 1.260 0.960 0.860
12. 0.460 1.380 0.890 0.590 0.910 1.220 1.110 1.410 1.290 1.225 0.930 0.830
13. 0.460 1.350 0.830 0.580 0.880 1.180 0.940 1.320 1.230 1.180 0.880 0.790 14. 0.460 1.330 0.780 0.560 0.870 1.130 0.920 1.170 1.890 1.130 0.880 0.750
15. 0.450 1.290 1.150 0.530 0.840 1.10 0.920 1.140 1.860 1.110 0.870 0.730
16. 0.450 1.260 1.140 0.510 0.810 0.890 0.790 0.970 1.810 0.960 0.850 0.710 17. 0.450 1.180 1.120 0.740 0.980 0.850 0.750 0.930 1.640 0.950 1.230 0.670
18. 0.450 1.120 0.880 0.710 0.960 0.970 1.560 1.590 0.930 1.190 0.630
19. 0.450 0.940 0.940 0.620 0.940 0.920 1.470 1.530 0.880 1.160 1.160 20. 0.450 0.860 0.890 0.610 0.910 0.8750 1.430 0.840 1.480 0.840 1.110 1.120
21. 0.450 0.770 0.850 0.80 0.870 1.460 1.350 0.790 1.480 1.260 0.970 0.980
22. 0.450 0.690 0.810 0.780 0.860 1.410 1.310 0.780 1.560 1.240 0.940 0.960
23. 0.450 0.650 0.760 0.940 0.840 1.380 1.260 0.780 1.510 1.210 0.910 0.940 24. 0.450 0.630 0.730 0.890 0.830 1.340 1.190 0.760 1.490 1.180 0.870
25. 0.450 0.610 0.650 0.840 0.810 1.290 1.130 1.540 1.440 1.160 0.830
26. 0.450 0.630 0.820 0.8150 1.230 1.110 1.510 1.30 1.130 27. 0.50 0.940 0.80 1.170 0.980 1.430 1.280 1.130
28. 0.580 0.780 1.140 0.970 1.370 1.250 1.110
29. 0.580 1.10 0.940 1.280 1.220 1.350 30. 0.950 0.880 1.220 1.180 1.330
31. 0.850 1.280

Assessment of Hydroelecric Potentials of Owu and Ero-omola Falls in Kwara State, Nigeria
Page 51
APPENDIX 4b: ERO-OMOLA DAILY DISCHARGE DATA GENERATED FROM
RATING EQUATIONS
JAN FEB MAR APR MAY JUNE JULY AUG SEPT OCT NOV. DEC.
6.177174 4.908227 3.220095 5.285807 4.39994 16.81515 6.69059 9.710066 25.10431 6.596982 40.0246 6.436129
6.177174 4.866968 3.580008 5.285807 15.32033 15.98317 5.961412 9.188874 25.00153 6.083954 39.21961 5.849132
6.177174 4.846234 3.526813 5.179227 14.81635 14.38943 4.997536 30.33735 29.11878 5.375985 36.10292 5.052638
6.143801 4.977332 3.491306 5.072749 14.31767 13.13217 4.172423 29.82176 28.78787 4.538261 33.14867 4.573558
6.143801 4.941396 3.437978 7.111751 13.01432 11.02913 3.468662 29.82176 28.62025 3.810526 31.03733 4.132919
6.143801 4.905325 3.384568 6.895667 12.21975 7.425568 2.692434 28.54602 28.28052 9.363992 29.01366 3.538591
6.143801 4.887238 3.313222 6.572137 9.785568 6.563412 2.07219 27.04043 27.13168 8.352634 26.44905 3.017209
6.143801 4.869116 3.25961 6.464457 9.63913 5.916092 1.47465 26.29813 27.13168 7.144881 26.13904 1.34786
6.143801 4.832767 3.187988 6.464457 9.493383 5.305987 3.258302 24.1139 28.70424 6.083954 24.62371 1.117108
6.143801 4.260239 3.134162 6.356861 9.932695 4.872554 2.692434 22.9286 28.45114 5.155574 23.45263 0.920239
6.143801 4.225299 3.845396 6.141925 9.348334 13.87884 1.811779 21.99512 28.19463 4.16139 15.34218 0.656458
6.143801 4.17267 3.736305 6.034587 8.917403 13.3785 1.375151 21.30374 28.02165 3.56359 14.05814 0.530933
6.143801 4.119771 3.626727 5.927339 8.492889 12.40842 0.376723 19.2753 27.49286 2.900073 12.07411 0.395209
6.143801 4.084351 3.535013 5.713116 8.352831 11.25274 0.31862 16.05198 32.64694 2.285048 12.07411 0.289702
6.110057 4.013134 3.205908 5.392488 7.937058 10.58941 0.31862 15.43175 32.43867 2.071102 11.70014 0.246485
6.110057 4.959381 3.187988 5.179227 7.527987 6.563412 0.097263 12.07878 32.08701 0.931326 10.9745 0.208776
6.110057 4.814538 3.152114 7.653285 9.932695 5.916092 0.064891 11.33128 30.84575 0.879158 30.35311 0.147625
6.110057 4.704389 3.718077 7.328141 9.63913 7.971455 19.47948 0 30.46609 0.781983 27.71247 0.102181
6.110057 4.365158 3.827246 6.356861 9.348334 7.073591 12.26209 0 30.00091 0.576867 25.83136 3.926227
6.110057 4.209575 3.736305 6.24935 8.917403 6.316277 9.891046 9.710066 29.60483 0.446536 22.88066 3.183363
6.110057 4.030405 3.663309 8.305489 8.352831 20.06854 6.316835 8.846894 29.60483 4.16139 15.78618 1.433073
6.110057 4.866968 3.590086 8.087812 8.213503 18.54999 4.997536 8.677568 30.23484 3.810526 14.47823 1.266908
6.110057 4.783594 3.49822 9.836372 7.937058 17.67071 3.690762 8.677568 29.84342 3.329906 13.24144 1.117108
6.110057 4.741457 3.44291 9.288251 7.79995 16.53521 2.36464 8.34228 29.68468 2.900073 11.70014 0
6.110057 4.699005 3.294663 8.741637 7.527987 15.17465 1.580367 24.35339 29.28214 2.63961 10.27818 0

Assessment of Hydroelecric Potentials of Owu and Ero-omola Falls in Kwara State, Nigeria
Page 52
SUM 78.32396 64.08454 48.59602 166.9248 241.1845 284.7805 102.4264 423.8826 726.7812 97.94532 557.6962 49.48943
MEAN 6.02492 4.92958 3.738155 12.84037 9.647381 11.39122 4.097057 16.95531 29.07125 3.917813 22.30785 1.979577
MIN 3.110057 1.699005 1.220095 5.072749 4.39994 4.872554 0.064891 0 25.00153 0.446536 10.27818 1.793888
MAX 3.177174 3.260239 2.580008 9.836372 15.32033 20.06854 19.47948 30.33735 32.64694 97.94532 40.0246 5.849132
APPENDIX 5a: OWU FALL DAILY GAUGE
READINGS
JA FE MA AP MA JN JL AU SE OC NO DE
1. 0.48 0.42 0.43 0.42 0.43 0.88 0.48 0.88
2. 0.48 0.42 0.43 0.44 0.43 0.87 0.48 0.87
3. 0.48 0.42 0.43 0.44 0.43 0.87 0.48 0.87
4. 0.48 0.42 0.43 0.44 0.43 0.89 0.48 0.89
5. 0.48 0.42 0.43 0.44 0.42 0.88 0.48 0.88
6. 0.48 0.42 0.43 0.44 0.42 0.87 0.48 0.87
7. 0.48 0.42 0.43 0.45 0.42 0.86 0.48 0.86
8. 0.48 0.42 0.43 0.45 0.42 0.86 0.48 0.865
9. 0.47 0.42 0.43 0.44 0.42 0.85 0.47 0.85
10. 0.47 0.42 0.42 0.44 0.42 0.84 0.47 0.84
11. 0.47 0.42 0.43 0.44 0.42 0.84 0.47 0.84
12. 0.47 0.42 0.43 0.44 0.42 0.63 0.47 0.83
13. 0.47 0.43 0.43 0.44 0.43 1.52 0.47 1.52
14. 0.47 0.43 0.43 0.44 0.42 1.49 0.47 1.49
15. 0.47 0.43 0.43 0.43 0.42 1.42 0.47 1.42
16. 0.47 0.43 0.42 0.43 0.42 1.3 0.47 1.3
17. 0.47 0.43 0.42 0.44 0.42 1.11 0.47 1.11
18. 0.47 0.43 0.41 0.44 0.42 0.95 0.47 0.95
19. 0.47 0.43 0.43 0.48 0.43 0.92 0.47 0.92
20. 0.47 0.43 0.41 0.48 0.43 0.83 0.47 0.83

Assessment of Hydroelecric Potentials of Owu and Ero-omola Falls in Kwara State, Nigeria
Page 53
21. 0.47 0.43 0.42 0.46 0.43 0.79 0.47 0.79
22. 0.47 0.43 0.42 0.44 0.48 0.76 0.47 0.76
23. 0.47 0.43 0.42 0.44 0.46 0.76 0.47 0.76
24. 0.47 0.43 0.44 0.44 0.46 0.74 0.47 0.74
25. 0.47 0.43 0.43 0.44 0.45 0.69 0.47 0.69
26. 0.47 0.43 0.42 0.47 0.45 0.67 0.47 0.98 0.67
27. 0.47 0.43 0.42 0.44 0.67 0.47 0.97 0.675
MEAN
NO OF
DAYS=217
APPENDIX 5b: OWU STREAMFLOW DISCHARGE DATA GENERATED FROM THE RATING
EQUATIONS
JANUARY FEBRURY MARH APRIL MAY JUNE JULY AUGUST SEPTEMBER
4.268554
3.573975 3.687593 3.573975 3.687593
9.558547 4.268554
4.268554
3.573975 3.687593 3.802086 3.687593
9.414354 4.268554
4.268554
3.573975 3.687593 3.802086 3.687593
9.414354 4.268554
4.268554
3.573975 3.687593 3.802086 3.687593
9.703281 4.268554
4.268554
3.573975 3.687593 3.802086 3.573975
9.558547 4.268554
4.268554
3.573975 3.687593 3.802086 3.573975
9.414354 4.268554
4.268554
3.573975 3.687593 3.917442 3.573975
9.270707 4.268554
4.268554
3.573975 3.687593 3.917442 3.573975
9.270707 4.268554
4.150688
3.573975 3.687593 3.802086 3.573975
9.12761 4.150688
4.150688
3.573975 3.573975 3.802086 3.573975
8.985068 4.150688
4.150688
3.573975 3.687593 3.802086 3.573975
8.985068 4.150688
4.150688
3.573975 3.687593 3.802086 3.573975
6.128481 4.150688
4.150688
3.687593 3.687593 3.802086 3.687593
19.77342 4.150688
4.150688
3.687593 3.687593 3.802086 3.573975
19.25607 4.150688
4.150688
3.687593 3.687593 3.687593 3.573975
18.06231 4.150688
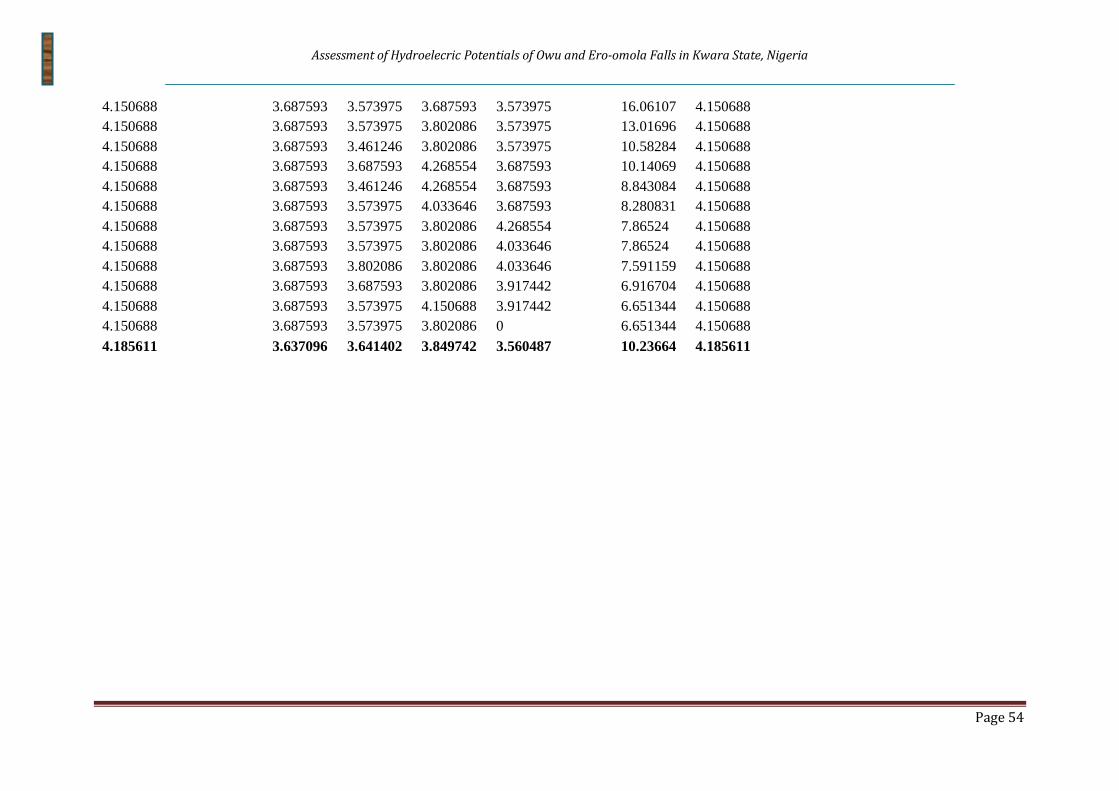
Assessment of Hydroelecric Potentials of Owu and Ero-omola Falls in Kwara State, Nigeria
Page 54
4.150688
3.687593 3.573975 3.687593 3.573975
16.06107 4.150688
4.150688
3.687593 3.573975 3.802086 3.573975
13.01696 4.150688
4.150688
3.687593 3.461246 3.802086 3.573975
10.58284 4.150688
4.150688
3.687593 3.687593 4.268554 3.687593
10.14069 4.150688
4.150688
3.687593 3.461246 4.268554 3.687593
8.843084 4.150688
4.150688
3.687593 3.573975 4.033646 3.687593
8.280831 4.150688
4.150688
3.687593 3.573975 3.802086 4.268554
7.86524 4.150688
4.150688
3.687593 3.573975 3.802086 4.033646
7.86524 4.150688
4.150688
3.687593 3.802086 3.802086 4.033646
7.591159 4.150688
4.150688
3.687593 3.687593 3.802086 3.917442
6.916704 4.150688
4.150688
3.687593 3.573975 4.150688 3.917442
6.651344 4.150688
4.150688
3.687593 3.573975 3.802086 0
6.651344 4.150688
4.185611
3.637096 3.641402 3.849742 3.560487
10.23664 4.185611

Assessment of Hydroelecric Potentials of Owu and Ero-omola Falls in Kwara State, Nigeria
Page 55
APPENDIX 5:
OWU FALL STREAM FLOW DATA

Assessment of Hydroelecric Potentials of Owu and Ero-omola Falls in Kwara State, Nigeria
Page 56
APPENDIX 6:
EXTENDED STREAMFLOW DATA
(2009-2034) AT ERO-OMOLA

Assessment of Hydroelecric Potentials of Owu and Ero-omola Falls in Kwara State, Nigeria
Page 57
APPENDIX 7:
STAGE DISCHARGE RECORDS OF
RIVER AKAMO AND OSHIN

Assessment of Hydroelecric Potentials of Owu and Ero-omola Falls in Kwara State, Nigeria
Page 58
APPENDIX 8:
STREAMFLOW DATA TRANSFORM
TO NATURAL LOGARITHM

Assessment of Hydroelecric Potentials of Owu and Ero-omola Falls in Kwara State, Nigeria
Page 59
APPENDIX 9:
PHCN TARIFFS
Assessment of Hydroelecric Potentials of Owu and Ero-omola Falls in Kwara State, Nigeria
Page 60
APPENDIX 10:
SCANED COPY OF HYDROGRAPH OF
RIVER OSIN AND AKAMO INCLUDING
THE RAW DATA AS OBTAINED FROM
THE LOWER NIGER RIVER BASIN
AUTHORITY

Assessment of Hydroelecric Potentials of Owu and Ero-omola Falls in Kwara State, Nigeria
Page 61
REFERENCES
Alayande, A.W and Bamgboye, O.A (2003), “Tail Water Recycling for Hydro-Power Generation”, Niger River. Proceedings of the 29th WEDC
International Conference. Pp 39 -41.
Linsley, R.K and Franzini, J.B (1979), “Water Resources Engineering”,
Mc Graw - Hill Book Co, New York.
Linsley, R.K, Kohler, M.A and Paulhus, J. L. H (1982), “Hydrology for
Engineers”. McGraw Hill Inc., New York., NY.
LNRB&RDA (2001), “ Review of the Engineering Study and Design of
the Tada-Shonga Flood Control Levee (Dyke) at Tada-Shonga Irrigation Project”. Design and Planning Unit, Lower Niger River Basin & Rural
Development Authority, Ilorin, Nigeria.
Liu, C. S. and Tedrew, A. C. (1973), “Multilake River System Operation
Use”. Journal of Hydraulics Division, ASCE, 99 (9), 1369 – 1381.
Loucks, D. P. (1968), “Computer Models For Reservoir Regulation”.
Journal of Sanitary Engineering Division, ASCE. 94 (SA 4), 657 –669.
Loucks, D. P., Stedinger, J.R and Haith, H. A. (1981), “Water Resource
System Planning and Analysis”. Prentice Hall, Englewood Cliffs, New Jersey.
Lund, J.R. and Guzman. J. (1999), “Derived Operating Rules for Reservoir in Series or in Parallel”. Journal of Water Resources Planning
and Management. ASCE, 125 (3), 143-153.
Marino, M. A. and Loaiciga, H.A. (1985), “Dynamic Model for Multireservoir Operation”. Water Resources Research, 21 (5), 619 – 630.
Marino, M. A. and Mohammed, B. (1984), “Reservoir Operation”.
Choice of Objective Functions. Journal of Water Resources Planning and Management Division, ASCE. 110 (1), 15 – 29.
Martin, Q.W. (1986), “Optimal Operation of Multiple Reservoir Systems”. Journal of Water Resources Planning and Management, ASCE. 109 (1),
58 – 74.
McMahon, T.A and Mein, R.G (1978), “Reservoir Capacity and Yield”.
Elsevier Scientific Publishing Company Amsterdam.
Meredith, D. D. (1975), “Optimal Operation of Multiple Reservoir System”. Journal of Hydraulic Division, ASCE. 101 (2), 299 – 312.
Michael, A.M (1985), “Irrigation Theory and Practice”. Vikas Publishing
House Ltd. New Delhi.
Mohan, S. and Diwakar, M. (1992), “Multiobjective Analysis of
Multireservoir System”. Journal of Water Resources Planning and Management Division, ASCE. 118 (4), 356 –370.

Assessment of Hydroelecric Potentials of Owu and Ero-omola Falls in Kwara State, Nigeria
Page 62
Montreal Engineering Company Limited (MEC) (1977), “Jebba
Hydroelectric Project”. Feasibility Report, Volumes I – III and VI. Motor – Columbus Consulting Engineers (1975), “Plan for Electric Power
System Development Plan”. A report submitted to NEPA. Vol. IV.
Murray, R.S (1974), “Theory and Problems of Advanced Calculus.
Schaum’s Outline Series”. MC Graw – Hill Book Company, New York.
Murray, R.S and Larry, J.S (2000), “Theory and Problems of Statistics”. Third edition. Tata Mc Graw-Hill Publishing Company Limited, New
Delhi.
Mustapha, S. and Yusuf, M. I. (1999), “A Textbook of Hydrology and
Water Resources”. Jenas Prints & Publishing Co., Abuja, Nigeria, First
edition pp. 164 – 184, 64.
Nash, G. A. (2003), “Optimization of the Operation of a two Reservoir
Hydropower System”. Ph.D. ,Thesis, Department of Civil Engineering.
The University of British Columbia, Canada.
Ogbonna, S. U. (1992), “Stream Flow Generation for Water Resources
Systems”. Theoretical basis. The Nigerian Engineer, Vol. 27 No. 3, 67 74.
Ogunlela, A. O. and Kasali, M.Y. (2002), “Evaluation of Four Methods of
Storm Hydrograph Development for An Ungauged Watershed”. Nigerian Journal of Technology and Development. Vol. 2, No 1 and 2, 15 – 24
Olagunju, S. O. (1972), “ Kainji Dam, 126 Questions, Answered”. Niger Dam Authority Cabinet Office, Lagos, Nigeria.
Olukanni, D. O. and Salami, A.W (2006), “Fitting Probability Distribution
Functions to Reservoir Inflow at Hydropower Dams in Nigeria”. Accepted for Publication in the Journal of Applied Science and Technology, Faculty
of Technology, University of Ibadan, Ibadan, Nigeria.
Opricovic, S. and Ducksten, L. (1980), “Multiobjective Optimization in
River Basin Development”. Water Resources Research, 16 (1), 14 – 20.
Overseas Development Administration (ODA) (1971), “Niger Valley Survey Appraisal Mission”. September – December, Final Report.
Oyedipe, F. P. A. (1980), “Resettlement and Social Change in New Bussa”. Ph.D. Thesis, Department of Sociology, University of Ibadan,
Ibadan, Nigeria.
Perera, B. J. C. and Codner, G. P. (1998), “Computational Improvement for Stochastic Dynamic Programming Models of Urban Water Supply
Reservoirs. Journal of the American Water Resources Association, 34(2),
267-278.
Philbrick, C. R. Jr. and Kitanidis, P. K. (1999), “Limitations of
Deterministic Optimization Applied to Reservoir Operations”. Journal of Water Resources Planning and Management Division, ASCE, 125 (3),
135-142.
Piekutowski, M.R., Litwonowicz, T. and Frowd, R. J. (1993), “Optimal Short-term Scheduling for a Large Scale Cascaded Hydro System”. IEEE
Transactions on Power Systems, 9(2), 292-298.

Assessment of Hydroelecric Potentials of Owu and Ero-omola Falls in Kwara State, Nigeria
Page 63
Quentin, W. M. (1983), “Optimal Operation of Multiple Reservoirs”.
Journal of Water Resources Planning and Management Division, ASCE. 109 (1, 58 – 73).
Reznicek, K. and Cheng, T. C. E. (1991), “Stochastic Modeling of Reservoir Operations”. European Journal of Operational Research, 50,
235-248.
Reznicek, K. K. and Simonovic, S. P. (1991), “Optimization of Short-term Operation of a Single Multipurpose Reservoir”. A goal programming
approach. Canadian Journal of Civil Engineering, 18, 397-406.
Russell, S. O. and Campbell, P. F. (1996), “Reservoir Operation Rules with
Fuzzy Programming”. Journal of Water Resources Planning and
Management. ASCE, 122(3), 165-170.
Rogers, P. P. and Fiering, M. B. (1986), “Use of Systems Analysis in
Water Management”. Water Resources Research. 22 (9), 1465 – 1585.
Roider, W. (1973), “The Farming Economy, in Kainji Lake”. A Nigerian man –made Lake. Vol. 2. Edited by Mabogunje, A. L. Published for
NISER, Ibadan.
Salami, A.W (2004a). “Prediction of the Annual Flow Regime along Asa
River Using Probability Distribution Models”. AMSE Periodical, Lyon,
France. Modelling C-2004, 65 (2),41-56. (http://www.amsemodeling.org/content_amse2004.htm)
Salami, A.W and Akpadiaha, A.A (2004), “Development of Probability
Distribution Functions for Stream Flow Downstream of Jebba Hydropower Dam”. Technical Report Submitted to the Department of
Civil Engineering, University of Ilorin, Ilorin, Nigeria.
Salami, A.W. and Ayanshola, A. M. (2006), “Causes, Impact and Control of Flood at Bacita Sugar Plantation, Bacita, Kwara State”. Journal of
Agricultural Research and Development (JARD), Faculty of Agriculture,
University of Ilorin, Ilorin. Accepted Nov. 2006
Salas, J. D., Ramirez, J.A., Burlando, P. and Pielke, R (2002), “Stochastic
Simulation of Precipitation and Stream flow Processes”. Chapter 33 in Hand book of Weather, Climate and Water. Edited by T.D Potter and B.
Colman, John Wiley & Sons.
Schwab, O.G, Fangmeier, D.D, Elliot, J.W and Frevert, K.R (1993), “Soil and Water Conservation Engineering”. Fourth edition. John Willey and
Sons, Inc. New York.
Power Generation”. The Nigerian Engineer, Vol. 27 No. 3 , 10 – 17.
“Introduction to Hydrology”. Harper and Row Publishers, New York.
Viessman, W., Knapp, J.W. and Harbough, T.E (1972), “Introduction to
Hydrology”. Intent Educational Publishers, New York.
Vogel, M.R, Tsai, Y and Limbrunner, W (1993), “The Regional
Persistence and Variability of Annual Stream Flow in the United States”.
Water Resources Research.. Vol. 34, No 12, 3445 – 3459.

Assessment of Hydroelecric Potentials of Owu and Ero-omola Falls in Kwara State, Nigeria
Page 64
Warren, V., Terence, E. H. and John, W. K. (1972), “Introduction to
Hydrology”. Second edition , Intent Educational Publishers, New York.
Weisstein, E. W. (2006), “Taylor Series, Math World”. A Wolfram Web
Resources.“http://mathworld. wolfram.com/Taylor series.html. Last modified Jan 21, 2006
Wilson, E. M. (1990), “Engineering Hydrology”. 4th edition Macmillan
Press Limited, London
Wurbs, R. A. (1993), “Reservoir System Simulation and Optimization
Models”. Journal of Water Resources Planning and Management. ASCE, 119(4), 455-472.
Yakowitz, S. (1982), “Dynamic Programming Applications in Water Resources. Water Resources Research. 18(4), 673-696.
Yeh, W. W. G. (1985), “Reservoir Management and Operations Models”. A state – of – the –art review. Water Resources Research. 21 (12), 1797 –
1818.
Yeh, W. W. G. and Becker, L. (1982), “Multiobjective Analysis of Multireservoir Operation”. Water resources research. 18 (5), 1326 – 1336.
Related Documents