1 Assessment of Human Population Carrying Capacity Prior to European Influence and Trade of the Brittany Triangle and Xeni Gwet'in Trapline Areas in the Nemiah Valley, British Columbia (the "Claim Area") Assessment by: Mathis Wackernagel, Ph.D. Executive Director Global Footprint Network Oakland, California, USA (510) 839-8879 x 105 [email protected] December 20, 2004

Welcome message from author
This document is posted to help you gain knowledge. Please leave a comment to let me know what you think about it! Share it to your friends and learn new things together.
Transcript

1
Assessment of Human Population Carrying Capacity Prior
to European Influence and Trade of the Brittany Triangle
and Xeni Gwet'in Trapline Areas in the Nemiah Valley,
British Columbia (the "Claim Area")
Assessment by:
Mathis Wackernagel, Ph.D.
Executive Director
Global Footprint Network
Oakland, California, USA
(510) 839-8879 x 105
December 20, 2004

2
Purpose of this Report
This report summarizes the findings of a study undertaken by Dr. Mathis Wackernagel to
assess the human carrying capacity of the Brittany Triangle and Xeni Gwet'in Trapline
Areas in the Nemiah Valley, British Columbia (otherwise known as the "Claim Area")
for a human population around 1800, prior to European influence and trade.
Key Conclusions By taking six different approaches of assessing the carrying capacity of the Claim Area
prior to European influence and trade, I conclude that the Claim Area supported a
human population most likely on the order of 100-1000 people. The carrying capacity of
the Claim Area was less likely to be in the range of 1,000-10,000 people, and also less
likely to be in the range of 10-100 people.
Structure of the Report The report is divided into the following sections:
1. Statement of Qualifications
2. The Geographic Area Considered
3. Background for this Analysis: “Answerability” of the Research Question and Key
Concepts
4. Limits to this Assessment
5. Assumptions
6. Results, and Six Arguments Supporting the Conclusion
7. References and Documents Reviewed
Appendix 1: Facts identified describing Xeni Gwet’in and Tsilhqot’in lifestyle
Acknowledgement
1. Statement of Qualifications
Expertise of Mathis Wackernagel, Ph.D.
Trained as an energy systems engineer and regional planner, my professional work has
centered on assessing the resource metabolism of societies. I co-developed a scientific
approach for assessing human carrying capacity. This approach, called “Ecological

3
Footprint” essentially consists of a resource accounting tool that allows researchers to
compare human demand on nature with nature’s ability to regenerate these resources. The
purpose of this tool, which is now in use worldwide, is to measure how much productive
land area is necessary to maintain a given human population’s resource consumption.
Most of my work has focused on industrial societies, primarily since the requisite data are
readily available; however, the Ecological Footprint method is applicable to any human
society. The study of energy balances – that is, examining the supply of and demand on
the regenerative capacity of ecosystems – is equally applicable to any time period,
provided that the data are available.
I currently serve as Executive Director of Global Footprint Network, an international
non-profit that seeks to continually improve the scientific methodology of the Ecological
Footprint and to standardize the way it is applied (see C.V. for details).
2. The Geographic Area Considered The total Claim Area is approximately 4,300 square kilometers. It is composed of two
overlapping areas: the Brittany Triangle, an area between the Chilko and Taseko Rivers,
which covers approximately 155,000 hectares (1,550 square kilometers); and the
Traplines area, which covers some 332,000 hectares (3,320 square kilometers).
3. Background for this Analysis: ’Answerability‘ of the Research
Question and Key Concepts Woodward and Company asked me on behalf of Chief Roger William to provide my
expert opinion on human carrying capacity in the Claim Area, and to develop an upper
estimate of the population density of the Claim Area for 1800, considering the technology
and resource management system used then by that culture. Through discussions with
Jack Woodward the question was slightly modified from “for 1800” to “before European
influences and trade.”
Because the parameters of this question are clearly defined and measurable, it can be
answered through scientific research if the relevant data is available. In other words, the
question is neither hypothetical nor conceptually speculative.
Clarifying the concept of “carrying capacity”
The research question focuses on ‘human carrying capacity.’ In the scientific literature,
and particularly in the life sciences, the idea of ‘carrying capacity’ has been defined to
mean the maximum population of a given species that can be supported over time within

4
a certain geographic region. Carrying capacity is calculated from several measures. First
is a measure of gross resource availability within a certain area – in other words, how
much food or other resources are available for a certain population to consume. The
second measure has to do with the efficiency with which the population converts these
‘raw’ resources into ‘usable’ ones. And finally, there is the demand for these resources
for each individual within the species. These three measures together can be used to
estimate the overall theoretical maximum population that can be supported.
While carrying capacity is a theoretical number, it is not hypothetical or conceptually
speculative.1 In essence, it amounts to establishing a ‘resource balance’ or ‘mass balance’
between resource availability and human consumption (for a more detailed explanation,
see box below). However, carrying capacity is often stated as a range of numbers, and not
as a single value, because it cannot always be determined with precision. As with any
science, the accuracy of certain measurements is never 100%. Nevertheless, a lack of
precision in carrying capacity does not mean that the concept is vague or ill-defined. The
idea is quite simple: The food eaten by a population must come from somewhere, and the
resources base that provides that food is limited by certain known factors.
From carrying capacity to “biological capacity”
In the case of people, it is generally more useful to talk of ‘biological capacity’ (also
termed ‘biocapacity’), as opposed to carrying capacity. Biocapacity is defined simply as
the resources available for human consumption – i.e., food, fuel and fiber. This concept is
very useful for two reasons. First, the consumption level per person can vary depending
on the quantity and quality of what people consume. For example, carrying capacity can
be effectively increased if per capita consumption goes down; and conversely, carrying
capacity can be effectively decreased if per capita consumption goes up. Given this
variability, it is therefore more practical in the course of scientific analysis to study
biocapacity itself, because it is the currency of carrying capacity.
The second reason is that people’s demand on nature is not necessarily constrained solely
by the biological capacity of the region in which they live. An animal’s immediate
surroundings or habitat are typically the basis for measuring animal carrying capacity.
Humans, however, are different from most other species in the Animal Kingdom because
humans are able to import resources from other places, thus confusing the biologist’s
conventional understanding of carrying capacity. While the globe’s overall carrying
capacity is, of course, finite, international trade can effectively alter a nation’s carrying
capacity. Thus, biocapacity is often a more useful object of study than carrying capacity.
For instance, in a series of reports I co-author, WWF (World Wide Fund for Nature)’s
Living Planet Reports, we document the biocapacity (and not carrying capacity) in 150
countries around the globe.
1 Ronald Wright provides a succinct introduction to a ecologically based history of humankind in his 2004
Massey Lectures “A Short History of Progress”. It is one that recognizes the role of biophysical limits and
its implication for the emergence and decline of civilizations. More detailed human ecologies are presented
by Diamond (1997) and Flannery (2001).

5
In the period before European influence and trade, with more limited capacity for long-
distance transportation, the imported fraction of First Nations’ overall consumption was
relatively modest, particularly in comparison with current Western standards. For the
traditional Xeni Gwet’in, there was never an option to import spices from Southeast Asia,
rice from India, fruit from New Zealand, or meat from Costa Rica. In other words, the
biocapacity of the Xeni Gwet’in’s immediate surroundings composed the primary
limitations on the population’s size. Knowing the Claim Area’s biocapacity and
estimating the First Nation’s consumption level and type of technology allows resource
scientists such as myself to estimate the maximum population number supportable in the
Claim Area.
In this report, I use the notion ‘carrying capacity of the Claim Area pre European
influence and trade’ as a short cut for ‘the number of people the Claim Area was able to
support with its biocapacity, recognizing the consumption patterns, the prevalent
technology, the resource management strategies, and the trade patterns that typified life in
the Claim Area pre European influence and trade.’
Establishing a resources balance for a human population
For any human population, the resource balance follows a simple comparison of supply
and demand:
Resource balance
Human demand for biological resources -- food, fuel, fiber, etc. (in other words,
the society’s metabolic requirements);
versus
The Claim Area’s effective supply of resources.
Effective supply of resources = product of:
Biological supply (biological productivity of the region for resources consumed
by human societies);
times
technological efficiency for taking advantage of supply, which is made up of:
a) harvest efficiency (the percentage of available biological productivity that
can be harvested from the region, given prevailing tools and technologies
available to the culture at that time) and
b) transformation efficiency (the percentage of harvested resources that are
finally consumed rather than lost in harvesting, processing, storing, and
preparing).
Box 1: Comparing supply and demand

6
There are a number of ways these aspects can be measured or estimated. The results of
different approaches will vary depending on the methodology and assumptions used, and
the quality of the available data. This is true for any scientific assessment: the scientific
method does not ensure that all approaches will yield identical findings. However, by
documenting the calculation approach and the assumptions used, the reasoning and the
calculations are reproducible, and the results testable. The same applies here: By being
explicit about assumptions and justifying each one, a transparent calculation of carrying
capacity can be built on empirical facts.
I took six different approaches to answer the question posed to me by Jack Woodward, on
behalf of his client Chief Roger William. By using this variety of approaches to answer
the research question, I generated a range of answers. In comparing the answers, I was
led to my conclusion, which is that the human population range in the Claim Area prior
to European trade and influence was most likely to be on the order of 100-1,000 people.
As with any scientific examination, reproducibility of results through independent tests
bestows greater confidence in the overall result.
4. Limits to this assessment There are a number of factors that could limit the accuracy of this carrying capacity
analysis. First, the availability of data specific to the Claim Area is limited, especially
regarding conditions prevailing at the time of the 1800 target era. Even present-day
assessments of wildlife populations and estimates of biological productivity of the Claim
Area’s ecosystems are weak and incomplete. More precise answers about the Claim
Area’s capacity to directly support people’s lives (assuming pre-European influence and
trade) would be possible with more research. It is possible that the grey literature,
including reports, thesis work, government assessments, hunting records, etc., contains
additional relevant data points. Most likely, though, this would need to be complemented
by primary research.
Second, there are a large variety of potential food sources, and details were not uniformly
available regarding relative dependence on and abundance of each of these food sources,
seasonal and annual variations in availability, frequency and timing of limiting factors
such as sudden declines in the supply of critical food sources, storage technology to
extend availability of particular foods beyond normal seasonal limits, harvest efficiency,
competition with other species for shared sources of food, and so on. I made an attempt to
circumvent these limitations by supplementing the data with reasonable estimates from
comparable land areas, and by extrapolating from what is known about the lifestyles of
similar societies.
With these caveats in mind, the findings in the following sections do not pretend to be
exact values. Nevertheless, I believe they are reasonable estimates based on the
assumptions used and the data that were available.

7
5. Assumptions
Not being an anthropologist, I used accounts from anthropologists as a starting point for
my analysis of human demand on nature. I assume that:
1. The Xeni Gwet’in and the Tsilhqot’in did not engage in large-scale, intensive
agriculture but did use burning and other plant management techniques to
perpetuate or enhance the availability of certain food plants.
2. The Xeni Gwet’in and the Tsilhqot’in had a large range of skills and indigenous
technologies for hunting (bows and arrows, fences, traps), food gathering, food
preservation, and shelter building. Not before 1700, but prior to contact with
Europeans, they had access to horses. The Xeni Gwet’in and the Tsilhqot’in did
not have guns. Neither did they have access to metal or glass containers for
preparing and preserving food. They did not have guns until the early 1800s, and
the use of guns appears not to have been widespread until the late 1800s.
3. The Xeni Gwet’in and the Tsilhqot’in practiced seasonal rounds with winter
camps close to the lakes. This translated into a seasonal use of foods (mountain
potatoes, salmon, deer).
4. There are historical records and oral histories demonstrating that the Tsilhqot’in
took action to protect their Territory against unauthorized intrusion by other First
Nations and by non-indigenous settlers. This fact meant that there would have
been an incentive to prevent population levels from dipping significantly below
the biological capacity of the region, the primary reason being that it takes people
to defend territory. The fact that the Tsilhqot’in had to defend their territory
historically suggests that they would have maximized their population size rather
than leaving biocapacity vacant. Thus, I have assumed that they utilized the full
biological capacity of their territory.
5. Considering the descriptions of the traditional diets, I assume that protein from
animal products (mainly mammal meat and fish) made up a significant portion
(roughly half) of the overall food calorie intake of the Xeni Gwet’in and the
Tsilhqot’in, complemented by plant-based carbohydrates from wild potatoes,
berries, etc.
6. Results, and Six Arguments Supporting the Conclusion
Results
I used six different approaches for assessing the carrying capacity of the Claim Area
prior to European influence and trade. All approaches consistently point to the finding
that the Claim Area supported a human population most likely on the order of 100-1000

8
people. Hence I conclude that the carrying capacity of the Claim Area prior to European
influence and trade was between 100 and 1000 people. This also means that the carrying
capacity of the Claim Area was less likely to be in the range of 1,000-10,000 people, or in
the range of 10-100 people.
Pieces of Evidence – in six segments
Data on the Claim Area’s biocapacity and on the population’s demand and its
technological efficiency are not complete. However, with data on aspects of the
ecosystems in the Claim Area and historical records of the Xeni Gwet’in and Tsilhqot’in,
crude assessments can be provided. Numerical results for quantifying the human
population size of the Claim Area were generated using five different approaches. These
diverse, simple calculations generate a range of possible results. This range indicates an
approximate number for the population size that was likely to have lived in the Claim
Area before the time of European influence and trade.
The sixth segment argues that seasonal and year to year fluctuations in the availability of
food and resources are a significant aspect when assessing population size. For human
populations, size is generally limited not by the average year but by the worst year in
terms of hunting, crop yield, and weather patterns. Similarly, a wild population is limited
by its ability to live through the harshest season.2 The population is inevitably thinned by
starvation and lack of resources, and these events occur in the resource-scarcest seasons
and resource-scarcest years.
Recognizing these various seasonal constraints posed on regionally based3 human (and
non-human) populations, diet composition and availability of one key component allows
researchers to extrapolate population size.
i) Extrapolating from Population Data of a Regional Key Species: The Wild
Horse Population
A significant portion of the Xeni Gwet’in and the Tsilhqot’in diet consisted of animal
products (Alexander et al 1985: 53). Fish was an important source of both calories and
proteins, but its availability was seasonally limited (Alexander 1985 (table2) p50). The
largest supply of fish was associated with the salmon runs. For the rest of the year, when
the salmon were not available, the consumption of animal products would be dependent
on mammals that could be hunted - in addition to resident fish populations (and
particularly ice fishing during the winter).
2 A domesticated herd may be able to reach higher carrying capacity, since forage availability is artificially
spread over the year by stocking hay for the winter. Hence, estimates of domestic animals exaggerate a
region’s capability to support wild species. 3 Regionally based populations live to a large extent off the local resources with few supplements from the
outside. In other words, that population’s metabolism is limited by the availability of local resources.

9
The wild horse population can be used as a proxy number for other large herbivores, such
as caribou, mule deer, elk and mountain goats, in order to quantify the availability of
animal protein for humans. Wild horses are well-suited for comparison with other
ungulates because their food niches overlap substantially (F. Wagner, 1978). Horses may
not use these ecological niches in the same way other ungulates do, and they may not
access the entire capacity because of landscape constraints. Nevertheless, the fact remains
that if there are more horses, there must be more available biocapacity. The horse
population can thus act as a rough barometer of grazing capacity. The horse population
number is thus proportionally related to the other non-horse ungulates living in the Claim
Area.
According to present-day observations, horses seem to represent a significant portion of
the total ungulate biomass. One indication of their relative abundance is the percentage of
times horses were sighted by automatic cameras set up by a research project of Wayne
McCrory (2002: p.v). In his research, horses were seen at about the same frequency as
moose and mule deer. Considering horses’ relative weight4 compared to other wild
ungulate species, it seems reasonable to assume that horses represent one third of the total
ungulate biomass in the Claim Area. (Note that this compares horse biomass with total
ungulate biomass, not the number of horses with the total number of ungulates. This is an
important distinction, because horses have a larger body mass than all other ungulates in
the region except moose – see footnote 3 above). With more research, a more accurate
number describing this ratio between horse and other ungulate biomass could be
calculated.
With this ungulate biomass estimate, one can estimate food availability for the local
human population. This, in turn, gives us an indication of an upper limit of the human
population size, since ungulate meat was a significant portion of the human population’s
diet. While horse meat was not a significant part of First Nations’ diets, the wild horse
population merely serves as an indication of the population of other large herbivores,
some of which were hunted by the Xeni Gwet’in and Tsilhqot’in.5
The wild horse population seems stable in its size and amounts to 75-200 individuals for
the Brittany Triangle (McCrory 20: p 36; lower estimate based on reported
‘communication from Range manager’, upper estimate of 140-200 based on McCrory’s
own estimate). This number would be Brittany Triangle’s carrying capacity for horses.
This area constitutes about one-third of the total Claim Area, but judging from the maps,
its topography and position, this Triangle is most likely the most bioproductive (highest
biomass regeneration per hectare) in the Claim Area (see also reference to bioproductive
grasslands in Silva Forest Foundation July 2002 p 16-17). Hence this horse population
4 An adult feral horse and moose may weigh 500 kg (http://www.agric.nsw.gov.au/reader/1038,
http://www.britishcolumbia.com/Wildlife/wildlife/landmammals/cw/cw_moose.html), while mule deer are
less than one third the size of horses or moose
(http://www.dto.com/hunting/species/generalprofile.jsp?speciesid=170&state=co). 5 “It is unlikely that the horse fundamentally altered basic subsistence strategies of Plateau peoples, as
gathering and fishing continued to provide the bulk of subsistence needs well into the late nineteenth
century” Walker in Sturtevant, 1998:545

10
number can be used as a starting point for estimating a “carrying capacity” for large
herbivores. The reasoning proceeds as follows:
Using the upper population estimate of 200 horses, and multiplying this number by three
to include other ungulates (based on the estimate explained above) would lead to an
estimated wild ungulate population of 600 horse equivalents. Typically, seven percent of
ungulates can be harvested by people per year while another 14 percent is harvested by
predator species (Alexander in Hayden, 1992, p 113)6. This would suggest a maximum
sustainable yield for people of 40 horse equivalents per year (7% of 600 units).
It is reasonable to assume that, for a culture living very close to the land and not wanting
to extinguish their primary food resource, hunting the ‘sustainable yield’ would be at
their upper limit. If the Xeni Gwet’in or Tsilhqot’in ever hunted at levels above the
sustainable yield, this could increase their human population on a short-term basis but
would ultimately lead to a decline in ungulate food availability and therefore human
population.
With horses and huntable ungulates having a similar metabolism for transferring primary
productivity (grass and forage) into meat, this ‘yield’ can be used as an approximate
value of the animal-based calories available for human consumption. This means that the
amount of harvestable food energy for people from large ungulates is the following:
Estimate for available animal-based calories from ungulates
500 kg per horse harvested (or per equivalent amount of ungulate)7
multiplied by
60% dressing percentage, or amount of live weight that can be eaten8
multiplied by
12,200 kj/kg of food energy9
multiplied by 40 horse equivalents per year
= 500 kg/horse* 0.6 [edible percentage] * 12,200 [kj/kg]* 40 [horse equivalents]
6 This number is consistent with an expected population dynamics of ungulates, that without carrying
capacity constraints can double every 4-5 years. 7 http://www.gov.on.ca/OMAFRA/english/livestock/horses/facts/98-093.htm
8 See http://ars.sdstate.edu/MeatSci/May99-1.htm for typical numbers
9 See: http://www.nal.usda.gov/fnic/cgi-bin/list_nut.pl (‘Beef, carcass, separable lean and fat, choice, raw’)
One kcal of food (or colloquially called ‘calorie’) is equal 4.18 kilojoules or kj; kj is the energy unit in the
metric system, calories are a measure from the imperial measurement system.

11
= 145,000,000 kj of ungulate-meat based food per year (just from the Brittany Triangle)
= 145 Gj/yr (just from the Brittany Triangle)
Box 2: Food available to humans from ungulate populations
How many people would this feed, and for how long?
The basic food requirement of a moderately active adult male is 10-15,000 kj per person
per day (Smil 1999:92). In fact, this may be a low estimate of food consumption,
considering harsh climate and high physical activity most likely necessary to maintain the
lifestyle of people living in the Claim Area before European trade and influence. Vaclav
Smil, a leading energy scholar from the University of Manitoba, cites lumberjacks
requiring 30,000 kj/day and long distance runners and skiers up to 45,000 kj/day (Smil
1999:80,92). Using 15,000 kj/person/day seems to be a reasonable low-end average
even though it is higher than recommended Western diets (2,000 diet calories is
approximately equivalent to 7,400 kj). Xeni Gwet’in and Tsilhqot’in living in the Claim
Area were more physically active compared to the more sedentary members of industrial
societies, and they also needed more food for heating their bodies than people living in
climate-controlled environments. But the average was not as high as for lumber jacks
during an active workday since people in the Claim Area did rest some days, and not all
were adult males. This caloric requirement estimate would lead to a caloric demand of
(15,000 kj/day * 365 days/year) = 5,500,000 kj/year per person. Assuming that half of the
total caloric intake comes from animal-based food, one average person’s animal-based
food demand would add up to 2,700,000 kj/yr.
In other words, huntable ungulates in the Brittany Triangle would provide animal-based
food calories for 54 people (145 million kj per year/2.7 million kj per year).
The Brittany Triangle represents only 1/3 of the surface of the Claim Area, but probably
more than 1/3 of the overall carrying capacity. Assuming that the Brittany Triangle
represents half of the Claim Area’s total biocapacity (simply because the Brittany
Triangle is more biologically productive), this would suggest an annual supply of 290
million kj of ungulate meat for human consumption. This could maintain a population
number of about 110 people (assuming all animal-based food comes from ungulates). If
Brittany Triangle was only one-third of Claim Area’s biocapacity, then this would
translate into 435 million kj of annual ungulate meat for human consumption, then 165
people that could be supported (assuming all animal-based food comes from ungulates).
Considering that meat from large herbivores is not the entire contribution to the diet, the
population number could be even higher. Ungulate meat was supplemented with a
number of other sources. Additional animal protein sources included (see Walker in
Sturtevant, 1998: p526-545 for both plant and animal species used):
mainly fish (particularly salmon during the runs, and to a lesser extent, Dolly
Varden, trout, whitefish, turbot & suckers, the last four available in lakes all year .
Fish, including salmon, was a significant food source, and the food value of these

12
local species may have been greater than that of the spawning salmon, especially
in years with poor salmon runs (Lane in Alexander et al 1985: p48).
limited amounts of non-ungulate mammals such as grizzly and black bear,
marmots, snowshoe hare and rodents, and
possibly some birds (e.g., grouse, geese);
Supplementary plant-based food included:
berries,
potato (mountain potato),
bear tooth plant, and
the cambium layer under the bark of pine trees.
Recognizing the importance of fish, but also their seasonal limitations, large herbivores
may have contributed half of the overall demand on animal-based food (and as stated
above, I assume about half of the caloric intake to be animal-based) this would double the
population estimate to about 220 to 330 people in the Claim Area. This population
number would go up to 550 to 800 people if ungulate meat would only represent 10
percent of people’s caloric intake (rather than one quarter, or 50% * 50%, as assumed
before). However, the human population number in the Claim Area would be smaller if:
dependence on ungulates was more extensive;
horse population represents a more significant portion of the total ungulate
biomass;
only a smaller percentage of the total ungulate population could be hunted;
the worst winters reduced ungulate populations to a level significantly under their
typical carrying capacity number (since it is the year with worst supply of food
that limits overall population).
Conversely, the human population estimate would get larger if:
dependence on ungulates is less extensive than assumed;
horse population represents a less significant portion of the overall ungulate
biomass.
ii) A second approach to estimating the population of huntable ungulates:
extrapolating from a key predator in the area, the wolves
The overall ungulate population can also be estimated from the size of predator
populations, since ungulate availability limits their predator’s populations. This provides
an independent check of our estimates of ungulate biomass.

13
Estimating ungulate population from wolf population:
80 wolf population in Brittany Triangle (4-7 packs of 6-12 wolves) (McCrory 2002)
240 wolf population estimate for whole Claim Area (assuming proportional
occurrence per unit of territory)
with
3716 kj/day per wolf food demand
http://animal.discovery.com/news/briefs/20040913/dogwolf.html
This adds up to:
325 million kj/yr food demand of wolves
or 33,000 kg/yr caught animals (assuming 80 percent of animals are eaten by
wolves, and ungulate are main food source of wolves)
Building on Alexander (in Hayden p113) that about 22% of the ungulate biomass can be
harvested annually by all predators, and 1/3 of that is harvested by people, it is reasonable
to assume that the other two-thirds of the 22% are shared equally between wolves and
other predators (rest bears, cougars, lynx, coyotes). In other words, this assumes that
wolves, in the Claim Area, take 50 percent of what all predators in the Claim Area take
combined.
Assuming 33,000 kg of annual harvest = 7% of total ungulate biomass translates into a
standing stock of 950 horse equivalents or 6000 mule deer equivalents of ungulate
population in the Claim Area (one animal unit is typically defined as a 1000 pound cow,
similar to the horse, a mule deer is assumed to be 80 kg heavy, on average). Or
recognizing that people may only be able to eat 60 percent rather than 80 percent of the
animal, the corresponding amount for people would be 25,000 kg/yr or 240 Gj/yr.
Assuming half of people’s diet was animal based food, and half of that from ungulates,
this would translate into a yearly demand per person of 1.4 Gj of ungulate meat. Hence
there would be sufficient resources for 180 people in the Claim Area. Assuming half of
people’s diet was animal based food, and only one fifth from ungulates, this would
translate into a yearly demand per person of 0.5 Gj of ungulate meat. Hence there would
be sufficient resources for 450 people in the Claim Area.
If wolves were eating only half the amount of ungulates, or for other reasons represented
only 1/4th
of the predator demand for ungulate meat, rather than 1/2 as assumed above for
the calculation, the population estimate for the Claim Area pre European influence and
trade would be 360 to 900 people.
Box 3: Wolf calculation

14
iii) Extrapolating from Population Data of a Species that Competes for Similar
Food Niches: The Bear Population
Rather than trying to estimate carrying capacity from a direct analysis of bioproductive
capacity (an analysis which the above question implies, but which is fraught by lack of
data on yields of all types of food plant and animal populations within the Claim Area,
rates of human harvesting of all the various food sources, and the extent of competition
for these food sources with other species), one other way to estimate human carrying
capacity of the Claim Area is to look at the population size of a species with a similar
diet, occupying similar food niches. The ecologically most similar competitor to people is
the grizzly bear, also an omnivore and top predator. This approach uses caloric
requirements to compare bear and human population sizes of the area that could be
sustained.
Grizzly bears (and, to a lesser extent, black bears), more than any other species in the
Claim Area, have diets that overlap the most with the diet spectrum of a human
population living off the land.10
Bears have different food gathering strategies, but overall
their food patterns appear to be similar to what anthropological reports identify as
traditional food sources.
Hamilton et al. (2004) suggests that in the South Chilcotin Ranges, the capability per
square km to support grizzly bears is only 58 % of the British Columbia average.
REGION AREA
Capability
Density
km
2 # bears bears/1000km
2
ALTA 13256 204 15
BABINE 14039 510 36
BLACKWATER-WEST CHILCOTIN 20630 396 19
BULKLEY-LAKES 23521 549 23
CASSIAR 36374 759 21
CENTRAL MONASHEE 6349 198 31
CENTRAL PURCELL 4619 162 35
CENTRAL ROCKIES 6923 246 36
CENTRAL SELKIRK 5681 214 38
COLUMBIA-SHUSWAP 14927 493 33
CRANBERRY 11649 405 35
EDZIZA-LOWER STIKINE 17122 396 23
FINLAY-OSPIKA 30302 721 24
FLATHEAD 3434 215 63
FRANCOIS 8087 160 20
GARIBALDI-PITT 6463 226 35
HART 19661 540 27
10
See for example http://www.nrmsc.usgs.gov/projects/igbst_BB.htm; or food habits of bears:
www.nps.gov/yell/nature/animals/bear/infopaper/info3.html).

15
HYLAND 17268 347 20
KETTLE-GRANBY 6585 167 25
KHUTZEYMATEEN 8069 475 59
KINGCOME-WAKEMAN 5442 253 46
KITLOPE-FIORDLAND 10336 370 36
KLINAKLINI-HOMATHKO 13643 152 11
KNIGHT-BUTE 6620 235 35
KWATNA-OWIKENO 10650 347 33
MOBERLY 7577 210 28
MUSKWA 36108 815 23
NATION 18128 502 28
NORTH CASCADES 9801 319 33
NORTH COAST 6776 269 40
NORTH PURCELL 5470 238 44
NORTH SELKIRK 6003 276 46
NULKI 16796 369 22
OMINECA 29171 739 25
PARSNIP 10999 487 44
QUESNEL LAKE NORTH 9100 365 40
ROBSON 20078 716 36
ROCKIES PARK RANGES 5850 184 31
ROCKY 38085 822 22
SOUTH CHILCOTIN RANGES 16125 237 15
SOUTH PURCELL 6898 198 29
SOUTH ROCKIES 8306 402 48
SOUTH SELKIRK 4074 131 32
SPATSIZI 21702 562 26
SPILLAMACHEEN 4069 148 36
SQUAMISH-LILLOOET 5689 165 29
STEIN-NAHATLATCH 7710 217 28
STEWART 11342 360 32
TAIGA 50046 128 3
TAKU 32315 650 20
TATSHENSHINI 19216 395 21
TOBA-BUTE 7606 99 13
TWEEDSMUIR 18458 323 17
UPPER SKEENA-NASS 16999 673 40
VALHALLA 3479 111 32
WELLS GRAY 12837 430 33
YAHK 2719 101 37
Total 791182 20381 26
South Chilkotin compared to Total 58%
Table 1: Bear Population capability according to Hamilton et al (2004)
Using this number, and distributing the total BC bear population present in 790,000
square kilometers of British Columbia evenly to the 4,300 square kilometers of the Claim

16
Area, yields a grizzly population within the Claim Area of 65 grizzly bears (assuming a
BC grizzly population of 16,000). With a BC black bear population of 120-160,000, we
can use the ratio between BC black bears and BC grizzlies to estimate a black bear
population for the Claim Area. This amounts to about 520 black bears.
This estimate is NOT based on actual bear occurrences, since some of the potential bear
populations do not exist. Currently, some of the potential bear population is out-crowded
by human activities. Hence, current bear counts do not represent, or cannot be used as a
proxy for, the bioproductive potential of a region. In consequence, as a proxy for
bioproductivity, I use the estimates of potential bear populations (or capability) to
support bears. These estimates are supplied by the BC government.
The above estimate for potential bear populations in the Claim Area would assume that
the concentration of bears (per km2) is the same as the average for the South Chilcotin
Ranges.
Another number for potential bear populations is quoted in Wane McCrory (2002: p33),
using BC Wildlife numbers claiming one grizzly per 140-160 square kilometers. This
would lead to 31 grizzly bears in the total Claim Area. McCrory estimates that there is at
least the same amount of black bears as brown bears in the Claim Area, hence another 31
black bears.
Food requirements of bears are 8,250 kcal/day for grizzly bears.11
This is a weighed
average over a one-year period. The corresponding number for black bears may be about
4,000 kcal/day.12
If we assume 15,000 kj/day food requirement per person (as discussed above), the bears’
overall consumption indicates a population of 100 people (based on McCrory 2002
estimate) to 720 people (based on Hamilton et al estimate).
Note that this is a rough assessment, merely based on the fact that food sources of bears
and people strongly overlap, and that they may exploit ecosystems in similar ways. It
does not look at the competition between people and bears. If competition between
people and bears for the same food sources was significant, more bears would trade off
against fewer people and vice versa.
Also, people will probably get a larger portion of their diet from ungulates. Also note that
the bear populations use here are crude estimates based on land area and not in-depth
ecosystem assessments. Nevertheless, the resulting numbers are reasonably consistent
with the other assessments herein.
11
http://7thfloormedia.com/projects/exwork/best/bearden/brown.htm 12
www.abbeyinn.com/html/smoky_mountains_black_bear_fac.html
17
iv) Extrapolating From Population Data of Harvestable Animals: The Predator
Prey Balance
Another possible approach is to extrapolate availability and demand on ungulates using
British Columbia estimates of population sizes. The table below summarizes official
population numbers from BC ministries.
body food ungulate
available
to people
Lower Upper Lower Upper weight demand based food Lower Upper
# # # # kg/unit kj/day % Gj/yr Gj/yr Gj/yr
Predators
Wolf 7,500 7,500 20 20 42 15,559 50% 56 56
Cougar 3,000 3,000 8 8 52 24,400 82% 58 58
Grizzly bear 17,000 17,000 45 45 193 34,543 10% 57 57
Black bear 120,000 160,000 318 424 182 16,748 5% 97 130
268 301
Prey
Elk 40,000 40,000 106 106 270 61 61 15
Moose 170,000 170,000 450 450 388 375 375 94
Whitetail deer 65,000 65,000 172 172 97 36 36 9
Mule deer 150,000 250,000 397 662 80 68 114 28
Caribou* 16,500 16,500 44 44 158 15 15 4
Mountain goat 50,000 50,000 132 132 71 20 20 5
575 621 155
Total Claim
AreaB.C.
annual ungulate-based food
demand
gross unglulate-based food supply
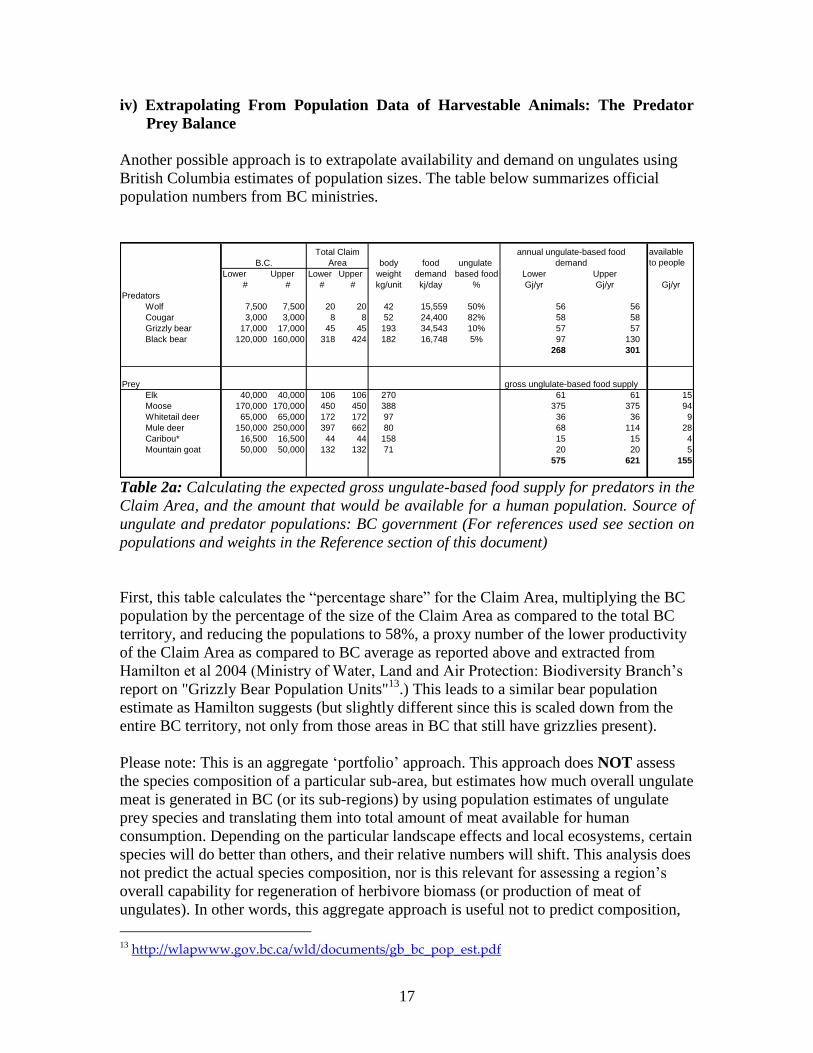
Table 2a: Calculating the expected gross ungulate-based food supply for predators in the
Claim Area, and the amount that would be available for a human population. Source of
ungulate and predator populations: BC government (For references used see section on
populations and weights in the Reference section of this document)
First, this table calculates the “percentage share” for the Claim Area, multiplying the BC
population by the percentage of the size of the Claim Area as compared to the total BC
territory, and reducing the populations to 58%, a proxy number of the lower productivity
of the Claim Area as compared to BC average as reported above and extracted from
Hamilton et al 2004 (Ministry of Water, Land and Air Protection: Biodiversity Branch’s
report on "Grizzly Bear Population Units"13
.) This leads to a similar bear population
estimate as Hamilton suggests (but slightly different since this is scaled down from the
entire BC territory, not only from those areas in BC that still have grizzlies present).
Please note: This is an aggregate ‘portfolio’ approach. This approach does NOT assess
the species composition of a particular sub-area, but estimates how much overall ungulate
meat is generated in BC (or its sub-regions) by using population estimates of ungulate
prey species and translating them into total amount of meat available for human
consumption. Depending on the particular landscape effects and local ecosystems, certain
species will do better than others, and their relative numbers will shift. This analysis does
not predict the actual species composition, nor is this relevant for assessing a region’s
overall capability for regeneration of herbivore biomass (or production of meat of
ungulates). In other words, this aggregate approach is useful not to predict composition,
13
http://wlapwww.gov.bc.ca/wld/documents/gb_bc_pop_est.pdf

18
but to predict overall productivity of meat from herbivores that can be consumed by
predators or by people.
The table 2a, above, presents the result of the analysis (Table 2b translates results in
“mule deer equivalents”). It shows that predator demand for ungulate meat is lower than
amount available. The numbers suggest that the supply of ungulate prey is about double
the expected demand from the predator population (calculated for British Columbia as a
whole – and scaled down to the Claim Area, this produces the same ratio). The fact that
the calculated ratio between supply and demand is physically possible, i.e., predators can
be supported by this prey population (calculated supply exceeds calculated demand),
gives confidence in the validity of numbers.
Claim
Area body
mule deer
equivalents in
Claim Area
Upper weight
# kg/unit #
Prey
Elk 106 270 358
Moose 450 388 2183
Whitetail deer 172 97 208
Mule deer 662 80 662
Caribou* 44 158 86
Mountain goat 132 71 117
TOTAL 3614
equivalent in moose 746 Table 2b: ungulate prey availability in the Claim Area expressed in mule deer and
mosse.
The supply of ungulate prey can then be translated into anticipated human population
size. Recognizing that people eat a smaller fraction of hunted animals than wolves or
cougars would, and recognizing that typically, as discussed above, one third of the total
regeneration rate can be harvested by people (i.e., 7 percent per year), this population
estimate suggests an availability for humans of 155 Gj of ungulate per year. This is about
54% of the lower estimate of assessment i) which suggested 290-435 Gj of ungulate meat
availability each year.
This leads to a human population estimate of 100 to 300 people for the Claim Area pre
European influence and trade.
This estimate is potentially the most robust of all the presented approaches, since it starts
from a state-wide ungulate population estimate and scales the numbers down proportional
to the territory size of the Claim Area and an estimated relative bioproductivity of the
Claim Area as compared to the BC average. Since ungulates move around, estimates
based on proportional allocations do not double count ungulate populations that move
across territories. They also make sure that the magnitude of the estimate is reasonable,
since the macro assessment averages out possible uncertainties and random estimation
errors of local population assessments.

19
v) Other approaches: comparing to current livestock densities in industrial societies
(US), and other carrying capacity estimates.
One way to estimate the ratio between available resources and population densities is to
extrapolate this ratio from the current situation in the U.S. with domesticated ungulates.
Even though current populations have more access to plant based food due to large-scale
agriculture, wealthy industrial societies have a large portion of animal-based food-intake.
Assuming that the present-day North American population eats as much animal based
food as people did in the Claim Area before European influence and trade may
underestimate the Claim Area’s population animal-based food consumption for two
reasons:
a) The portion of animal-based food may have been larger historically, as indicated by
anthropological accounts of typical diets.
b) People pre European influence and trade were physically much more active than most
people living current industrial lifestyles, leading to larger caloric requirements.
Hence, looking at the ratio of livestock units in current industrial societies per capita
provides an underestimate of amount of wildlife necessary to support a population pre
European influence and trade.
Currently, in the U.S., production and consumption of animal products is nearly identical.
Net imports are small, comparatively. (Source FAO FAOSTAT database for 2001). For
instance, the table shows, that with a population of 288 million people in the US, there
are nearly 7 chickens per person, and one cow for three people.
USA: 2001 source: FAO apps.fao.org
Livestock tons & stocks
Production Imports
Stock
Changes Exports Consumption
Live Animal
Stocks
[t/y] [t/y] [t/y] [t/y] [t/y] [head]
poultry meat 16,813,300 23,910 39,500 3,134,363 13,742,347 1,996,700,000
eggs 4,405,300 8,575 710 97,675 4,316,910 0
pigmeat 8,691,000 437,797 -26,300 643,788 8,458,709 59,138,000
bovine meat 11,983,000 1,541,042 -37,200 1,149,810 12,337,032 97,277,000
mutton & goat meat 103,000 66,778 500 3,567 166,711 8,365,000
milk 75,600,120 4,440,094 0 2,294,979 77,745,235 0
equines 5,380,000 5,380,000 5,380,000
Table 3: Production and consumption of animal products in the US for 2001

20
This amount of animal product consumption can be translated into a corresponding mule
deer population that would produce the same amount of animal products. This is done by
dividing the consumption amount (tonnes per year) by 7 percent, which is a typical
sustainable yield figure as discussed above. As shown in table below, whether including
only ungulates (but also their milk) or all animals (but excluding milk), this consumption
corresponds to 650 million tonnes of wild animal stock, or 6 billion mule deer (assuming
60 percent edible and average weight of 175 kg).14
In other words, animal product
consumption in the US corresponds to living off a wild population of 46 mule deer per
US resident. Approach i) and iv) suggest that Claim Area residents consumed animal
products at a rate corresponding to an equivalent of what a herd of 60 mule deer would
have been able to provide. Food from mammals however (excluding fish and fowl), may
have corresponded to a herd of 10-30 mule deer to sustainably meet the demand of Claim
Area residents, a number similar to the current ratio in the US.
USA: 2001
Livestock tons & stocks
Consumption Stocks
Corresponding
stock if hunted
(only ungulates but
including milk)
(assuming 7
percent annual
yield)
Corresponding
stock if hunted
including all meat
and eggs
(assuming 7
percent annual
yield)
mule deers
(assuming 60%
edible)
[t/y] [head] [t] [t] [#]
poultry meat 13,742,347 1,996,700,000 196,319,243 4,089,984,226
eggs 4,316,910 0 61,670,143 1,284,794,643
pigmeat 8,458,709 59,138,000 120,838,700 120,838,700 2,517,472,917
bovine meat 12,337,032 97,277,000 176,243,314 176,243,314 3,671,735,714
mutton & goat meat 166,711 8,365,000 2,381,586 2,381,586 49,616,369
milk 77,745,235 0 291,049,847
equines 5,380,000 5,380,000 76,857,143 76,857,143 1,601,190,476
TOTAL 667,370,589 634,310,129 13,214,794,345
people in US 288,000,000
mule deer equivalents/person 46 Table 4: Translating US animal-product consumption into an equivalent mule deer stock
that could supply this amount
If this U.S. ratio of mule deer equivalent to people was applied to the estimated ungulate
population in the Claim Area (as estimated in Approach iv), the 3600 mule deer
equivalent would feed 80 people. However, since ungulates may only represent about
half of the animal-based food intake in the diet of residents of the Claim Area pre
European influence and trade residents’ this doubles the population estimate. Hence, if
this amount of mule deer was the limiting factor of human population in the Claim Area,
it would support 160 people.
14
A smaller domesticated herd stock could generate the same amount of animal products, since they are
managed for maximizing output per unit of input. In industrial agriculture domestic animals for meat are
slaughtered once their growth slows down, while they could survive for much longer in the wild.

21
Yet another way of estimating ungulate densities is to build on grazing capacity
assessments. For instance, Silva Foundation claims that ecosystems in the Claim Area
can support ungulates at the rate of 4-6 ha per animal unit month (Silva Forest
Foundation July 2002 p 16). While it may be true that this level of grazing can be
sustained with farmed animals during the summer time, this number may be far too high
for year-long populations whose survival is not determined by what is available on
average over a year, but what is available during the food scarcest part of the year, i.e.,
during the winter.
Using this high year average estimate would lead to a population of 6,000 animal units of
ungulates, or 36,000 mule deer equivalents. This number is unlikely high and inconsistent
with observed numbers of ungulates in the Claim Area. By averaging out supply over the
year, rather than having ungulate populations limited by the worst times in the year, it
may be physically possible to maintain such a population. But this would require
collecting hay for the winter and transferring food from more abundant summer to food
scarce winter. Hence this estimate of ‘grazing capability’ does not lead to a useful
population estimate for ungulates, and cannot be used for assessing human population
numbers living in region before European influence and trade.
vi) Anthropological documents about varied diet also support the assertion
that the estimate is a maximum rather than a minimum number of
individuals15
Extrapolating from the food habits and cultural accounts, it appears that inhabitants of the
Claim Area would put significant effort into preserving and storing food (Alexander in
Hayden p 129-133). Most of the storage was aimed at evening out food availability
through seasons (particularly winters).
However, there seems only to be some seasonal storage: Salmon, meat and berries were
dried over the summer and fall, used during the winter along with fish caught in lakes;
stored provisions were low or exhausted by late February or March. Some
anthropological sources say that dried salmon could last two years, but most likely in
quantities insufficient to even out poor harvests. Hence hunting ungulates was a necessity
(and would even be pursued during mild days in winter or when the snow had a firm
crust) and became more important at that time (p.69). Thus, although there was some
seasonal overlap in the use of resources, no single type of resource was available for the
entire year; a limit on any single critical resource could therefore serve as a limiting
factor on human carrying capacity (e.g., salmon runs failing required them to engage in
trade with neighboring nations).
15
From Traditional Use Study Volume 1: Report Prepared for the Aboriginal Lands and Resources Branch,
Ministry of Sustainable Resource Management, October 2001, Section 4.4--The Seasonal Round, pp. 69-71

22
It appears that the varied diet was not mainly driven by “food preference” but seasonal
availability. This points to the possibility that none of the food sources were
overabundant, and if they were, that collecting and storing such a food source had also its
limitations. From the accounts it seems that conservation of food was labor intensive and
long term storage problematic as conserved food may attract predators, can be stolen by
neighboring nations, or may be devoured by competitors (from fungi/bacteria to mice to
bears).
With these difficulties, they did not store significant food amounts over several years.
Hence their population size was limited by the worst year – possibly the worst year
within a 25-50 year span, since it takes at least one generation to recover from a famine.
This means that population estimates need to be based on worst year’s supply. This
means that food reserves were limited, and that limits in any key resource put constraints
on the population size. This would also suggest that the above estimates of up to 800 to
900 people (argument i and ii) is a maximum, considering the technology and food
gathering strategy used.
7. References and Documents Reviewed
Alexander, D. “A reconstruction of prehistoric land use in the mid-Fraser river area based
on ethnographic data” in B. Hayden, ed., A Complex Culture of the British Columbia
Plateau. Vancouver: UBC Press, 1992.
Alexander, D., Tyhurst, R., Burnard-Hogarth, L., and R.G. Matson. A Preliminary
Ethnoarchaeological Investigation of the Potato Mountain Range and the Eagle Lake
Area. Report prepared for the Heritage Conservation Branch of British Columbia (Permit
no. 1984-14), the Canadian Ethnic Studies Program, and the Nemiah Valley Indian Band
Council, 1985.
Ashcroft, G. 1997. Furbearer Review for the Nemiah Trapline Area, British Columbia.
DWB Forestry Services Ltd. Draft report 09 July 1997.
Diamond, Jared, 1997. Guns, Germs, and Steel: The Fates of Human Societies. W.W.
Norton, New York.
Feldhamer, G.A., Thompson, B.C., and J.A. Chapman, eds.Wild Mammals of North
America: Biology, Management and Conservation, 2nd
Edition. Baltimore, MD: Johns
Hopkins University Press, 2003.
Flannery, Tim. 2001. The Eternal Frontier: An Ecological History of North America and
its People, Text Publishing, Melbourne.

23
Hamilton, A.N., D.C. Heard, M.A. Austin, British Columbia Grizzly Bear (Ursus arctos)
Population Estimate 2004, Prepared for British Columbia Ministry of Water, Land and
Air Protection.
Hammond, Herb R.P.F., Mackenzie, Evan R.Bio, Tom Bradley. July 2002. Initial
ecosystem-based analysis of the Brittany Triangle and North Trapline Landscapes. Phase
2.
Hayden, B. “Conclusions: ecology and complex hunter/gatherers” in B. Hayden, ed., A
Complex Culture of the British Columbia Plateau. Vancouver: UBC Press, 1992.
Hunn., E., Turner, N., and D. French, “Ethnobiology and Subsistence” in D. Walker, ed.,
Handbook of North American Indians, vol. 12. Washington: Smithsonian Institution,
1998.
McCrory, W.P. 2002. Preliminary conservation assessment of the Rainshadow Wild
Horse Ecosystem, Brittany Triangle, Chilcotin, British Columbia, Canada. A review of
grizzly and black bears, other wildlife, wild horses, and wild salmon. Report for Friends
of Nemaiah Valley (FONV), 1010 Foul Bay Road, Victoria, B.C. V8S 4J1.
Ministry of Sustainable Resource Management , From Traditional Use Study Volume 1:
Report Prepared for the Aboriginal Lands and Resources Branch, Ministry of Sustainable
Resource Management, October 2001, Section 4.4--The Seasonal Round, pp. 69-71
Romanoff, S. “The cultural ecology of hunting and potlatches among the Lillooet
Indians” in B. Hayden, ed., A Complex Culture of the British Columbia Plateau.
Vancouver: UBC Press, 1992.
Silva Forest Foundation. April 2000. Summary report on initial ecosystem based analysis
of the Brittany Triangle. PO Box 9 Slocan Park, BC
Smil, Vaclav. 1999. Energies: An Illustrated Guide to the Biosphere and Civilization,
MIT Press, Boston.
Smil, Vaclav., 2000. Feeding the World: A Challenge for the 21st Century. The MIT
Press.
Smil, Vaclav. Eating meat: evolution, patterns, and consequences. Population and
Development Review 28(4): 559-639, December 2002.
Ministry of Sustainable Resource Management, 2001. Report prepared for the Aboriginal
Lands and Resources Branch, Traditional Use Study, vol. 1. 2001. Ministry of
Sustainable Resource Management, British Columbia.
Wagner, F. "Livestock Grazing and the Livestock Industry," in Wildlife and America:
Contributions to an Understanding of American Wildlife and Its Conservation, edited by
H. P. Brokaw, Washington, D.C.: Council of Environmental Quality, 1978

24
Wright, Ronald. 2004. A Short History of Progress. Massey Lectures, House of Anansi
Press.

25
Animal body weight data
Wild Mammals of North America: Biology, Management, and Conservation, 2nd
edition.
Ed. George A. Feldhamer, Bruce C. Thompson, and Joseph A. Chapman. Baltimore, MD:
Johns Hopkins University Press. 2003. p484 (wolf), 547 (black bear), 559 (grizzly), 744
(mountain lion), 878 (elk), 890 (mule deer), 907 (whitetail deer), 932 (moose), 968
(caribou)
Animal Population Data
“Inventory Methods for Wolf and Cougar: Standards for Components of British
Columbia's Biodiversity No. 34,” prepared by: B.C.’s Ministry of Environment, Lands
and Parks, Resources Inventory Branch for the Terrestrial Ecosystems Task Force,
Resources Inventory Committee, May 12, 1998.
http://srmwww.gov.bc.ca/risc/pubs/tebiodiv/wolfsandcougars/wocoml20-04.htm
“Inventory Methods for Wolf and Cougar: Standards for Components of British
Columbia's Biodiversity No. 34,” which was prepared by: B.C.’s Ministry of
Environment, Lands and Parks, Resources Inventory Branch for the Terrestrial
Ecosystems Task Force, Resources Inventory Committee, May 12, 1998.
http://srmwww.gov.bc.ca/risc/pubs/tebiodiv/wolfsandcougars/wocoml20-04.htm
British Columbia’s Ministry of Environment, Lands and Parks, “Cougar in British
Columbia: Ecology, Conservation, and Management.” 2000.
http://wlapwww.gov.bc.ca/wld/pub/cougar.htm
British Columbia’s Ministry of Environment, Lands and Parks, “Grizzly Bears in British
Columbia: Ecology, Conservation, and Management.” 2000.
http://wlapwww.gov.bc.ca/wld/documents/blackbear.pdf
Report by British Columbia’s Ministry of Environment, Lands and Parks, “Elk in British
Columbia: Ecology, Conservation, and Management.” 2000.
http://wlapwww.gov.bc.ca/wld/documents/elk.pdf
Report by British Columbia’s Ministry of Environment, Lands and Parks, “Whitetail
Deer in British Columbia: Ecology, Conservation, and Management.” 2000.
http://wlapwww.gov.bc.ca/wld/documents/whttail.pdf
Report by British Columbia’s Ministry of Environment, Lands and Parks, “Moose in
British Columbia: Ecology, Conservation, and Management.” 2000.
http://wlapwww.gov.bc.ca/wld/documents/moose.pdf
Report by British Columbia’s Ministry of Environment, Lands and Parks, “Caribou in
British Columbia: Ecology, Conservation, and Management.” 2000.
http://wlapwww.gov.bc.ca/wld/documents/caribou_fs.pdf

26
Report by British Columbia’s Ministry of Environment, Lands and Parks, “Mule and
Black-Tailed Deer in British Columbia: Ecology, Conservation, and Management.” 2000.
http://wlapwww.gov.bc.ca/wld/documents/muledeer.pdf
Report by British Columbia’s Ministry of Environment, Lands and Parks, “Mountain
Goat in British Columbia: Ecology, Conservation, and Management.” 2000.
http://wlapwww.gov.bc.ca/wld/documents/mtngoat.pdf

27
Appendix 1: Facts identified describing Xeni Gwet’in and Tsilhqot’in
lifestyle
1. Diet: salmon, berries, wild game (squirrels?—or marmots? (Section 2, p.28), mule
dear, moose, horses, grizzly bear, black bear?), wild potato? bear teeth plant?
2. Other wildlife includes good populations of hares and rodents. (Section 1, E)
3. Presence of horses was noted in 1808. Wild horses populations in Canada and
British Columbia are much reduced from historic times.
4. Seasonal diet: Spring—salmon; Winter—dried salmon (& other fish?), dried
meat, stored berries
5. Historical diet: May have been few deer or moose
6. Prevalence of wildlife depends on type of habitat.
7. Salmon habitat values for the Brittany are very high. The Chilko River has large
runs of Sockeye, Chinook and Coho, with lesser numbers in the Taseko. There is
an average of 1.7 million Sockeye or 27% of the entire Fraser run. Elkin Creek in
the Brittany is the only tributary of the Chilko/Taskeo Rivers that have salmon.
Runs in Elkin Creek average about 600 Chinook annually.16
8. For large carnivores, a high salmon biomass is available thereby enhancing the
values of adjacent vegetation and “security” habitats. Signs of high bear use were
evident but our surveys were limited. High grizzly bear use of salmon is reported
at the main spawning grounds below the outlet of Chilko Lake.
9. Brittany Triangle appears to support an abundant prey biomass of large and small
species. For top predators such as the wolf, mountain lion, grizzly bear and black
bear, feral horses likely contribute a valuable food resource that supplements their
diet of native species.
10. Both grizzly and black bears are common in the Brittany Triangle and, although
largely vegetarian and salmon-eaters, may prey on weakened or young wild
horses. Other prey species for these predators in the ecosystem would include
small animals, mule deer and moose. Horses and moose winter in the area, while
mule deer migrate to areas with less snow.
11. Claim Area is very cold and dry (other than seasonal wetland), therefore plant
growth of all types is quite limited. (Section 1, B). Short growing season, frost can
occur at all elevations any time of year. Rainshadow, causing summer moisture
deficits. (Section 1, F)
12. Range carrying rates in dry pine forests in the Claim Area are very low, 4-6
hectares/animal unit month, with little wildlife forage. Availability of latter is
primarily in sedge meadows and riparian zones. (Section 1, B, F).
13. Sustenance activities of Xeni Gwet’in include trapping, hunting, medicinal plant
gathering, grazing. But not clear if these apply to pre-1800. (Section 1, E).
14. Mule deer winter critical winter range in study area is limited. (This would help
determine worst case carrying capacity). Grizzly bear and moose require forest
cover. (Section 1, E)
15. Animal hides, furs traded. (Section 2).
16. 60 men plus “many more” observed in 1808. (Section 2)
16
http://www.fonv.ca/BT/Articles/FONVsumm/Summary.htm

28
17. 1808—Moose (?), red deer, chevreau, beaver very numerous, and the natives have
horses. (Section 2)
18. 1822—Beaver furs seem to be an important component of their clothing. (Section
2)
19. 1822—131 families living along the southerly running river. (Section 2)
20. 1824—200 Chilkootin families reported. (Section 2, p.6)
21. 1827—Population of Tsilhqot’in estimated at 130 married men between the ages
of 20 and 40 (Section 2, p.7)
22. 1830—Population of Tsilhqot’in “greatly reduced” since 1825, subsistence
resources extremely scanty, salmon runs said to fail three years out of four forcing
migration to the sea coast for relief. (Section 2, p.8) Useful for establishing worst
case scenario? Although not known if this is due to changes post 1800.
23. Soil is poor for vegetable farming (1831—Section 2, p. 9).
24. 1839—Natives (sic) kill a great number of deer. (Section 2, p.10)
25. 1872—Population of the Chilcotin tribes about 500. (Section 2, p.19)
26. 1875—Indians eat cambium layer under bark of pine trees (Section 2, p.24)
27. Possibly also ate cow parsnip and fireweed (Section 2, p. 25)
28. 1880s—European settlers now outnumber First Nation member in the area.
(Section 2, p.25)
29. 1893—Tsilhqot’in of Chilcotin River pop. estimated at 460.
30. 1925—First registration of traplines with the province. (Section 2, p. 36).
31. See Section 4, A, pp.69-71 for discussion of seasonal resource use by the
Tsilhqot’in in the Claim Area
32. Seasonal use of resources by Tsilhqot’in—see table Section 4, A, p.70. Annual
round of relocations were designed to exploit “seasonally fluctuating abundant
resources.” (p.69)
33. Social organization varied based on season and resource availability: nuclear
family camp of closely related families associated camps working together
on larger projects (fish weirs, game fences) band (all camps wintering together
in one locality) (p.69).
34. Seasonal use of resources reveals different limits at different times of years.
Salmon, meat and berries were dried over the summer and fall, used during the
winter along with fish caught in lakes; stored provisions were low or exhausted
by late Feb or March, so hunting game (which also did go on during mild days in
winter or when the snow had a firm crust) became more important at that time.
(p.69). Thus, although there was some seasonal overlap in use of resources, no
single type of resource was available for the entire year; a limit on any single
critical resource might could therefore serve as a limiting factor on human
carrying capacity (e.g., salmon runs failing 3 years out of four required them to
desert the area and migrate to the coast for a period).
35. Moose were not available as a resource until the 20th
century. (p.69) Fall
migration of caribou and elk were intercepted; dried meat serves as a major
source of winter provisions.
36. European goods first reached the Tsilhqot’in around 1790; first direct contact with
Europeans in 1808. (Section 4, C, p.38). Therefore, EF estimated for before 1800
29
can ignore impact of contact with Europeans—e.g., hunting was without the use
of guns. However, Tsilhqot’in did have horses before then.
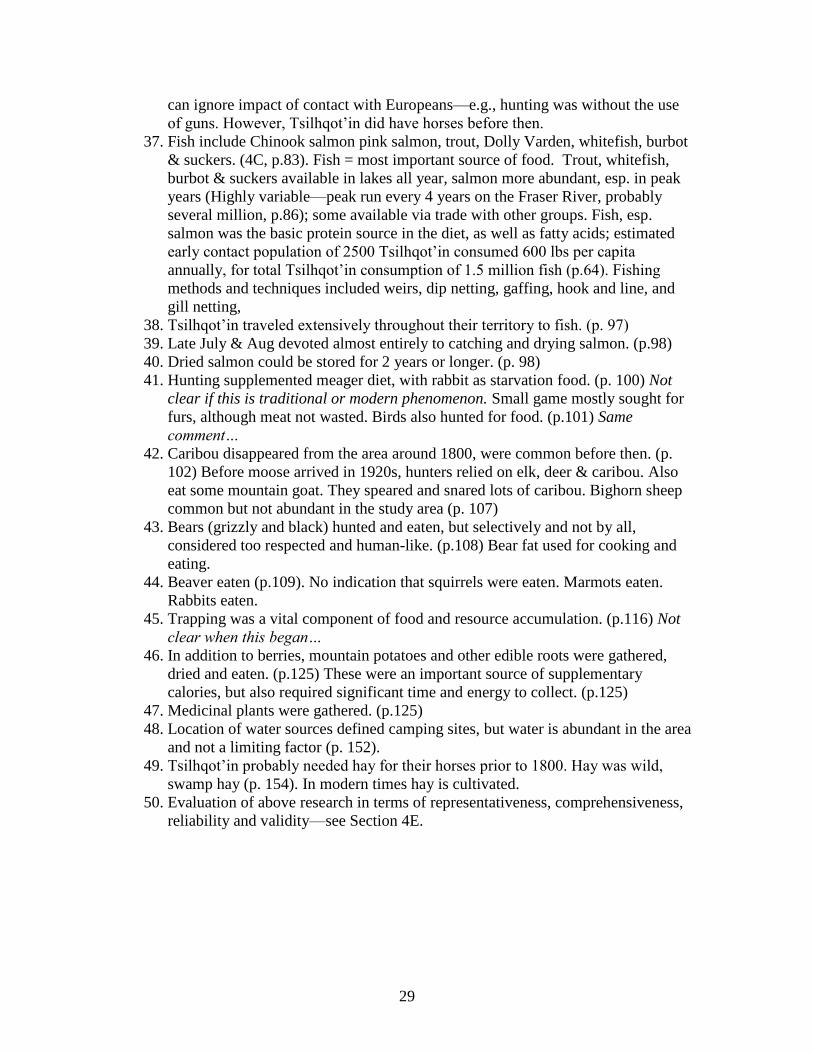
37. Fish include Chinook salmon pink salmon, trout, Dolly Varden, whitefish, burbot
& suckers. (4C, p.83). Fish = most important source of food. Trout, whitefish,
burbot & suckers available in lakes all year, salmon more abundant, esp. in peak
years (Highly variable—peak run every 4 years on the Fraser River, probably
several million, p.86); some available via trade with other groups. Fish, esp.
salmon was the basic protein source in the diet, as well as fatty acids; estimated
early contact population of 2500 Tsilhqot’in consumed 600 lbs per capita
annually, for total Tsilhqot’in consumption of 1.5 million fish (p.64). Fishing
methods and techniques included weirs, dip netting, gaffing, hook and line, and
gill netting,
38. Tsilhqot’in traveled extensively throughout their territory to fish. (p. 97)
39. Late July & Aug devoted almost entirely to catching and drying salmon. (p.98)
40. Dried salmon could be stored for 2 years or longer. (p. 98)
41. Hunting supplemented meager diet, with rabbit as starvation food. (p. 100) Not
clear if this is traditional or modern phenomenon. Small game mostly sought for
furs, although meat not wasted. Birds also hunted for food. (p.101) Same
comment…
42. Caribou disappeared from the area around 1800, were common before then. (p.
102) Before moose arrived in 1920s, hunters relied on elk, deer & caribou. Also
eat some mountain goat. They speared and snared lots of caribou. Bighorn sheep
common but not abundant in the study area (p. 107)
43. Bears (grizzly and black) hunted and eaten, but selectively and not by all,
considered too respected and human-like. (p.108) Bear fat used for cooking and
eating.
44. Beaver eaten (p.109). No indication that squirrels were eaten. Marmots eaten.
Rabbits eaten.
45. Trapping was a vital component of food and resource accumulation. (p.116) Not
clear when this began…
46. In addition to berries, mountain potatoes and other edible roots were gathered,
dried and eaten. (p.125) These were an important source of supplementary
calories, but also required significant time and energy to collect. (p.125)
47. Medicinal plants were gathered. (p.125)
48. Location of water sources defined camping sites, but water is abundant in the area
and not a limiting factor (p. 152).
49. Tsilhqot’in probably needed hay for their horses prior to 1800. Hay was wild,
swamp hay (p. 154). In modern times hay is cultivated.
50. Evaluation of above research in terms of representativeness, comprehensiveness,
reliability and validity—see Section 4E.

30
Acknowledgement
The preparation of this report was assisted by Dr. Steve Goldfinger, Michael Murray, and
Dan Moran, all three with Global Footprint Network. Supporting document research was
done by Lauren Gwin (UC Berkeley) and Wayne McCrory. However, I alone am
responsible for all findings and conclusions I drew from the data sources found or
provided for this analysis.
Related Documents