Assessment of Heavy Metal Pollution in the Sediments of the River Pra and Its Tributaries Albert Ebo Duncan & Nanne de Vries & Kwabena Biritwum Nyarko Received: 22 March 2018 /Accepted: 26 June 2018 /Published online: 6 August 2018 # The Author(s) 2018 Abstract An investigative study was conducted to de- termine the heavy metal pollution in the sediment in the Pra Basin of Ghana from 27 sampling points during the dry and wet seasons using the geo-accumulation index (Igeo), enrichment factor (EF), and pollution load index (PLI). Sediments were acid digested and analyzed for the following selected metals: arsenic (As), lead (Pb), cadmium (Cd), zinc (Zn), manganese (Mn), total chro- mium (Cr), nickel (Ni), and iron (Fe) using the dual atomizer and hydride generator atomic absorption spec- trophotometer (model ASC-7000 No A309654, Shimadzu, Japan). The metal concentrations (mg kg −1 ) in the sediments were as follows: As (0.175) < Cd (3.206) < Ni (79.927) < Zn (118.323) < Cr (216.708) < Mn (234.742) < Pb (335.381) < Fe (1354.513) in the dry season and As (0.002) < Cd (7.279) < Ni (72.663) < Zn (35.622) < Pb (135.863) < Cr (167.604) < Mn (183.904) < Fe (1138.551) for the wet season. The EF which is an indication of whether metal concentrations are due to anthropogenic activities shows enrichment at all site for the metals Cr, Pb, and Cd in the wet seasons. However, only 4 out of the 27 sites showed Ni enrichment in the wet season. Contrary to the wet sea- son, only Pb and Cr recorded enrichment at all sites during the dry season. Fifteen out of the 27 sites record- ed Cd enrichment and 24 out of the 27 sites recorded Ni enriched during the dry season. None of the sites were enriched with Fe, As, Zn, and Mn in either the dry or wet seasons. For both dry and wet seasons, the pollution load index for all the sites except one was at the back- ground levels which is a sign of non-deterioration of the sites studied. In the wet season, the calculated Igeo reveals that the study area is not contaminated with respect to As, Zn, Fe, and Mn; uncontaminated to mod- erately contaminated with Cd; moderately contaminated with Cr; uncontaminated to moderately to heavily con- taminated with Ni; and moderately to heavily contami- nated with Pb. The dry season Igeo results reveal non- contamination of the study area with respect to As, Fe, and Mn; uncontaminated to moderately contaminated with Zn; moderately contaminated with Cr; uncontam- inated to heavily contaminated with Cd; uncontaminat- ed to extremely contaminated with Ni; and moderately to extremely contaminated with Pb. The high levels of Cd, Pb, and Cr in all the sites are due to unregulated illegal mining activities occurring in and around the study area. It is hoped that this study will prompt the basin management board to improve their management strategies in controlling unregulated illegal mining in the basin sediments. Keywords Pollution . Heavy metal . Sediments . Illegal mining . Pra River . Ghana Water Air Soil Pollut (2018) 229: 272 https://doi.org/10.1007/s11270-018-3899-6 A. E. Duncan (*) : N. de Vries Department of Health Promotion, Faculty of Health Medicine and Life Sciences, Maastricht University, B1, 120 Maastricht, Netherlands e-mail: [email protected] K. Nyarko Department of Civil Engineering, Kwame Nkrumah University of Science and Technology, Kumasi, Ghana

Welcome message from author
This document is posted to help you gain knowledge. Please leave a comment to let me know what you think about it! Share it to your friends and learn new things together.
Transcript
Assessment of Heavy Metal Pollution in the Sedimentsof the River Pra and Its Tributaries
Albert Ebo Duncan & Nanne de Vries &Kwabena Biritwum Nyarko
Received: 22 March 2018 /Accepted: 26 June 2018 /Published online: 6 August 2018# The Author(s) 2018
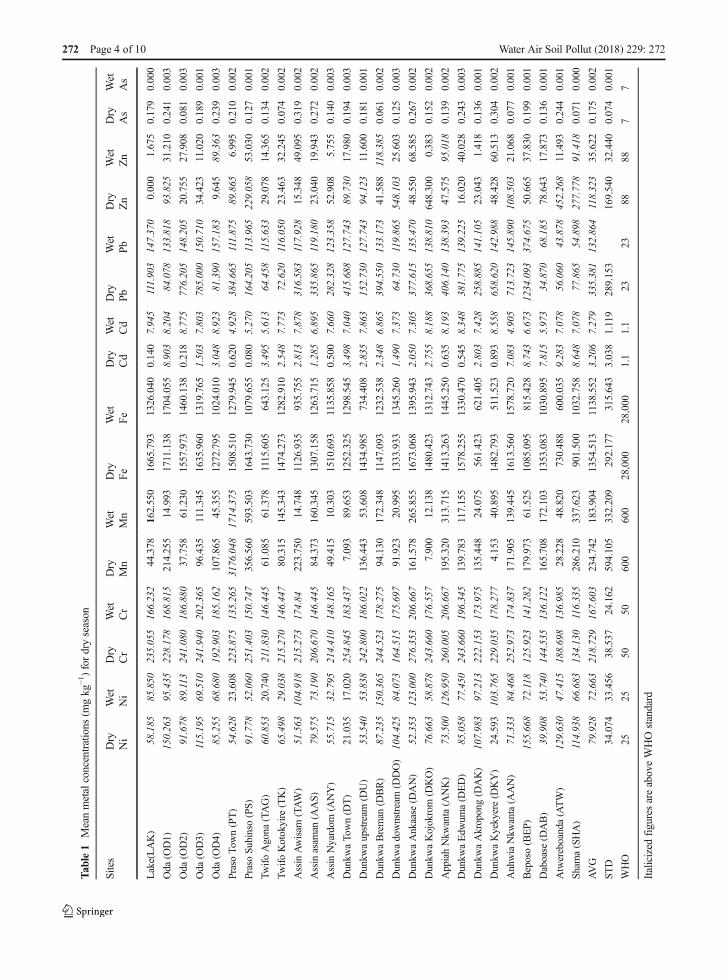
Abstract An investigative study was conducted to de-termine the heavy metal pollution in the sediment in thePra Basin of Ghana from 27 sampling points during thedry and wet seasons using the geo-accumulation index(Igeo), enrichment factor (EF), and pollution load index(PLI). Sediments were acid digested and analyzed forthe following selected metals: arsenic (As), lead (Pb),cadmium (Cd), zinc (Zn), manganese (Mn), total chro-mium (Cr), nickel (Ni), and iron (Fe) using the dualatomizer and hydride generator atomic absorption spec-trophotometer (model ASC-7000 No A309654,Shimadzu, Japan). The metal concentrations (mg kg−1)in the sediments were as follows: As (0.175) < Cd(3.206) < Ni (79.927) < Zn (118.323) < Cr (216.708) <Mn (234.742) < Pb (335.381) < Fe (1354.513) in the dryseason and As (0.002) < Cd (7.279) < Ni (72.663) < Zn(35.622) < Pb (135.863) < Cr (167.604) < Mn(183.904) < Fe (1138.551) for the wet season. The EFwhich is an indication of whether metal concentrationsare due to anthropogenic activities shows enrichment atall site for the metals Cr, Pb, and Cd in the wet seasons.However, only 4 out of the 27 sites showed Ni
enrichment in the wet season. Contrary to the wet sea-son, only Pb and Cr recorded enrichment at all sitesduring the dry season. Fifteen out of the 27 sites record-ed Cd enrichment and 24 out of the 27 sites recorded Nienriched during the dry season. None of the sites wereenrichedwith Fe, As, Zn, andMn in either the dry or wetseasons. For both dry and wet seasons, the pollutionload index for all the sites except one was at the back-ground levels which is a sign of non-deterioration of thesites studied. In the wet season, the calculated Igeoreveals that the study area is not contaminated withrespect to As, Zn, Fe, and Mn; uncontaminated to mod-erately contaminated with Cd; moderately contaminatedwith Cr; uncontaminated to moderately to heavily con-taminated with Ni; and moderately to heavily contami-nated with Pb. The dry season Igeo results reveal non-contamination of the study area with respect to As, Fe,and Mn; uncontaminated to moderately contaminatedwith Zn; moderately contaminated with Cr; uncontam-inated to heavily contaminated with Cd; uncontaminat-ed to extremely contaminated with Ni; and moderatelyto extremely contaminated with Pb. The high levels ofCd, Pb, and Cr in all the sites are due to unregulatedillegal mining activities occurring in and around thestudy area. It is hoped that this study will prompt thebasin management board to improve their managementstrategies in controlling unregulated illegal mining in thebasin sediments.
Keywords Pollution . Heavymetal . Sediments . Illegalmining . Pra River . Ghana
Water Air Soil Pollut (2018) 229: 272https://doi.org/10.1007/s11270-018-3899-6
A. E. Duncan (*) :N. de VriesDepartment of Health Promotion, Faculty of Health Medicine andLife Sciences, Maastricht University, B1, 120 Maastricht,Netherlandse-mail: [email protected]
K. NyarkoDepartment of Civil Engineering, Kwame Nkrumah University ofScience and Technology, Kumasi, Ghana
1 Introduction
Accumulation of heavy metals in the sediments of riverswhich are exposed to mining and industrial waste is acommon phenomenon in most developing countries(Islam et al. 2015). Such river sediments have becomesinks for heavy metals, just like wetlands. The sedi-ments sometimes act as carriers and sources for theheavy metals in the environment (Haiyan et al. 2013).The study of heavy metals in river sediments is veryimportant because sediments serve as habitat for manybenthic organisms like the mudfish. Unfortunately mostof the time, the rivers are monitored without paying anyattention to the sediments which are in constant interac-tion with the river. Studies have shown that rivers havebeen severely contaminated with heavy metals due tohistoric and modern mining and industrial operations(Miller et al. 2004). Heavy metals in river sedimentsenter through different pathways, either from point ornon-point sources (Shazili et al. 2006). Examples ofpoint sources could be the discharges of industrial wastesuch as metal mine wastes through pipes or drains, intorivers. Non-point sources such as silt-laden runoff fromexcavated lands and leachate from landfills also contrib-ute to the levels of heavy metals usually discharged intowater resources. The fate of heavy metals in an aquaticenvironment is affected by processes such as precipita-tion, sorption, and dissolution (Abdel-Ghani andElchaghaby 2007). These processes are also affectedby factors such as pH, temperature, dissolve oxygenconcentration, and the disturbance of the water(Atkinson et al. 2007; Simpson et al. 2004). At higherpH, heavy metals precipitate and get adsorbed ontosediment surfaces. Metals are also released more easilyinto the water at lower pH and higher temperatures.When the dissolved oxygen concentration is low, i.e.,less than 7 mg/L, heavy metals especially those boundto organic matter sediments are released into the over-lying water and vice versa (Haiyan et al. 2013). A studyby Atkinson et al. (2007) shows that physical distur-bance of water releases metals more rapidly into waterthan biological disturbance. The study of heavy metalsin sediments can serve as a guide in predicting the extentof pollution of the overlying water under different envi-ronmental conditions.
The present study assesses the heavy metal pollutionlevel in the main Pra River and two of its tributaries inthe Pra Basin of Ghana. The study area is the largestamong the three southwestern river systems in Ghana
and occupies an area of 23,000 km2 which is about9.64% of the area of Ghana. Sediment pollution byheavy metals in the study area is now graduating into amajor problem with the increased illegal mining activi-ties in and around the rivers in the basin which areincreasing the turbidity and the heavy metal levels,making the rivers physically unstable and chemicallyand biologically toxic. The present state of the riversposes serious problems to the environment and thehealth of those villages which still depend on the riversfor cooking and bathing during water crises. To date, nodetailed scientific analysis of the river sediments hasbeen conducted. The aim of this study is to assess theconcentrations of lead (Pb), cadmium (Cd), arsenic (As),chromium (Cr), iron (Fe), manganese (Mn), zinc (Zn),and nickel (Ni) using the enrichment factor (EF), pollu-tion load index (PLI), and the geo-accumulation index(Igeo). Geo-accumulation index determines the metallevels of contamination or accumulation with referenceto background levels of the same element in the envi-ronment. EF which is also an indication of enrichmentof a selected metal with reference to a background metalsuch as iron complements the Igeo by indicating thesource of enrichment as either natural or anthropogenic.The pollution load index assesses the cumulative pollu-tion effect of the metals at each site by making referenceto the EF of all the metals measured at each site.
2 Materials and Methods
This study was conducted in the Pra Basin of Ghana.The hydrogeology of the Pra Basin is dominated byaquifers of the crystalline basement rocks and theBirimian Province. Sediment texture from the samplingsite spans from sand, sandy loam, loamy sand, silty clayloam, and sandy clay loam. The Basin is located be-tween latitudes 5° N and 7° 30′ N, and longitudes 2° 30′W, and 0° 30′W, in south-central Ghana. It is the largestamong the three southwestern basins in Ghana(Ankobra, Tano, and Pra) and covers an area of238,540 km2. The basin enjoys sub-equatorial wet cli-mate with two raining seasons (May–June and Septem-ber–November). The relative humidity in the basin isaround 70 to 80% throughout the year. The annualrainfall range is between 1300 and 1900 mm with anannual mean value of 1500mm. The only natural lake inGhana, Bosomtwe, which is a major tourist attraction islocated in the basin. The land area is largely dominated
272 Page 2 of 10 Water Air Soil Pollut (2018) 229: 272
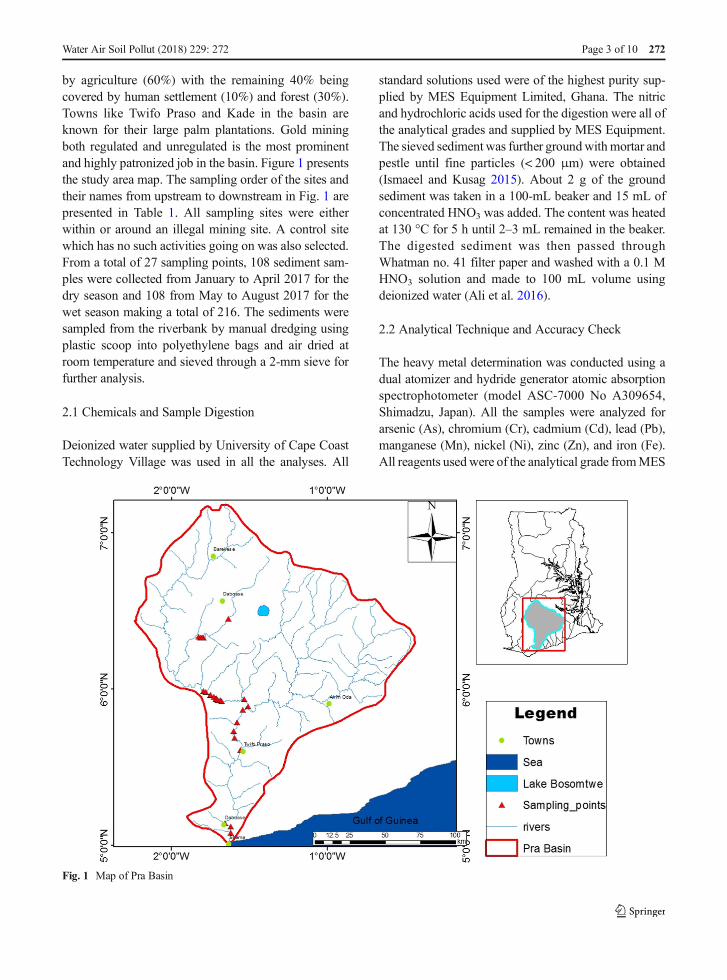
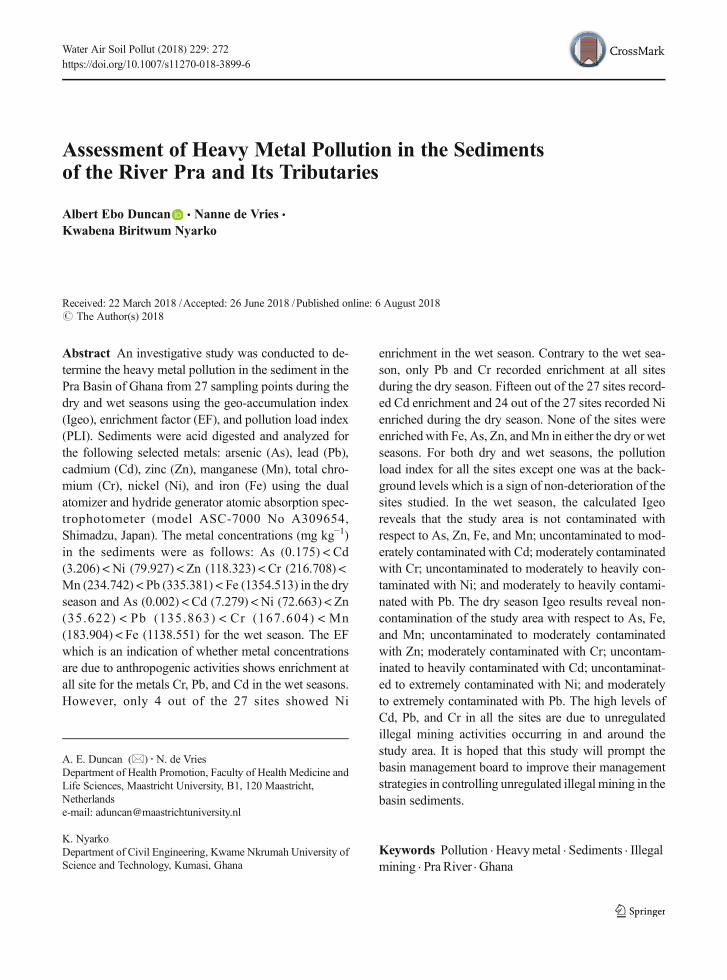
by agriculture (60%) with the remaining 40% beingcovered by human settlement (10%) and forest (30%).Towns like Twifo Praso and Kade in the basin areknown for their large palm plantations. Gold miningboth regulated and unregulated is the most prominentand highly patronized job in the basin. Figure 1 presentsthe study area map. The sampling order of the sites andtheir names from upstream to downstream in Fig. 1 arepresented in Table 1. All sampling sites were eitherwithin or around an illegal mining site. A control sitewhich has no such activities going on was also selected.From a total of 27 sampling points, 108 sediment sam-ples were collected from January to April 2017 for thedry season and 108 from May to August 2017 for thewet season making a total of 216. The sediments weresampled from the riverbank by manual dredging usingplastic scoop into polyethylene bags and air dried atroom temperature and sieved through a 2-mm sieve forfurther analysis.
2.1 Chemicals and Sample Digestion
Deionized water supplied by University of Cape CoastTechnology Village was used in all the analyses. All
standard solutions used were of the highest purity sup-plied by MES Equipment Limited, Ghana. The nitricand hydrochloric acids used for the digestion were all ofthe analytical grades and supplied by MES Equipment.The sieved sediment was further groundwithmortar andpestle until fine particles (< 200 μm) were obtained(Ismaeel and Kusag 2015). About 2 g of the groundsediment was taken in a 100-mL beaker and 15 mL ofconcentrated HNO3 was added. The content was heatedat 130 °C for 5 h until 2–3 mL remained in the beaker.The digested sediment was then passed throughWhatman no. 41 filter paper and washed with a 0.1 MHNO3 solution and made to 100 mL volume usingdeionized water (Ali et al. 2016).
2.2 Analytical Technique and Accuracy Check
The heavy metal determination was conducted using adual atomizer and hydride generator atomic absorptionspectrophotometer (model ASC-7000 No A309654,Shimadzu, Japan). All the samples were analyzed forarsenic (As), chromium (Cr), cadmium (Cd), lead (Pb),manganese (Mn), nickel (Ni), zinc (Zn), and iron (Fe).All reagents usedwere of the analytical grade fromMES
Fig. 1 Map of Pra Basin
Water Air Soil Pollut (2018) 229: 272 Page 3 of 10 272
Tab
le1
Meanmetalconcentrations
(mgkg
−1)fordryseason
Sites
Dry
Wet
Dry
Wet
Dry
Wet
Dry
Wet
Dry
Wet
Dry
Wet
Dry
Wet
Dry
Wet
Ni
Ni
Cr
Cr
Mn
Mn
Fe
Fe
Cd
Cd
Pb
Pb
Zn
Zn
As
As
Lake(LAK)
58.185
85.850
235.055
166.232
44.378
162.550
1665.793
1326.040
0.140
7.945
111.903
147.370
0.000
1.675
0.179
0.000
Oda
(OD1)
150.263
95.435
228.178
168.815
214.255
14.993
1711.138
1704.055
8.903
8.204
84.078
133.818
93.825
31.210
0.241
0.003
Oda
(OD2)
91.678
89.113
241.080
186.880
37.758
61.230
1557.973
1460.138
0.218
8.775
776.205
148.205
20.755
27.908
0.081
0.003
Oda
(OD3)
115.195
69.510
241.940
202.365
96.435
111.345
1635.960
1319.765
1.503
7.803
785.000
150.710
34.423
11.020
0.189
0.001
Oda
(OD4)
85.255
68.680
192.903
185.162
107.865
45.355
1272.795
1024.010
3.048
8.923
81.390
157.183
9.645
89.363
0.239
0.003
PrasoTo
wn(PT)
54.628
23.608
223.875
135.265
3176.048
1714.375
1508.510
1279.945
0.620
4.928
384.665
111.875
89.865
6.995
0.210
0.002
PrasoSu
binso(PS)
91.778
52.060
251.403
150.747
356.560
593.503
1643.730
1079.655
0.080
5.270
164.205
113.965
229.058
53.030
0.127
0.001
TwifoAgona
(TAG)
60.853
20.740
211.830
146.445
61.085
61.378
1115.605
643.125
3.495
5.613
64.458
115.633
29.078
14.365
0.134
0.002
TwifoKotokyire
(TK)
65.498
29.038
215.270
146.447
80.315
145.343
1474.273
1282.910
2.548
7.773
72.620
116.050
23.463
32.245
0.074
0.002
Assin
Awisam
(TAW)
51.563
104.918
215.273
174.84
223.750
14.748
1126.935
935.755
2.813
7.878
316.583
117.928
15.348
49.095
0.319
0.002
Assin
asam
an(A
AS)
79.575
73.190
206.670
146.445
84.373
160.345
1307.158
1263.715
1.285
6.895
335.865
119.180
23.040
19.943
0.272
0.002
Assin
Nyardom
(ANY)
55.715
32.795
214.410
148.165
49.415
10.303
1510.693
1135.858
0.500
7.660
282.328
123.358
52.908
5.755
0.140
0.003
Dunkw
aTo
wn(D
T)
21.035
17.020
254.845
183.437
7.093
89.653
1252.325
1298.545
3.498
7.040
415.688
127.743
89.730
17.980
0.194
0.003
Dunkw
aupstream
(DU)
53.540
53.838
242.800
186.022
136.443
53.608
1434.985
734.408
2.835
7.863
152.730
127.743
94.123
11.600
0.181
0.001
Dunkw
aBreman
(DBR)
87.235
150.365
244.523
178.275
94.130
172.348
1147.093
1232.538
2.348
6.865
394.550
133.173
41.588
118.385
0.061
0.002
Dunkw
adownstream
(DDO)
104.425
84.073
164.515
175.697
91.923
20.995
1333.933
1345.260
1.490
7.373
64.730
119.865
548.103
25.603
0.125
0.003
Dunkw
aAnkaase
(DAN)
52.353
123.000
276.353
206.667
161.578
265.855
1673.068
1395.943
2.050
7.305
377.615
135.470
48.550
68.585
0.267
0.002
Dunkw
aKojokrom
(DKO)
76.663
58.878
243.660
176.557
7.900
12.138
1480.423
1312.743
2.755
8.188
368.655
138.810
648.300
0.383
0.152
0.002
AppiahNkw
anta(A
NK)
73.500
126.950
260.005
206.667
195.320
313.715
1413.263
1445.250
0.635
8.193
406.140
138.393
47.575
95.018
0.139
0.002
Dunkw
aEdw
uma(D
ED)
85.058
77.450
243.660
196.345
139.783
117.155
1578.255
1330.470
0.545
8.348
381.775
139.225
16.020
40.028
0.243
0.003
Dunkw
aAkropong(D
AK)
107.983
97.213
222.153
173.975
135.448
24.075
561.423
621.405
2.803
7.428
258.885
141.105
23.043
1.418
0.136
0.001
Dunkw
aKyekyere(D
KY)
24.593
103.765
229.035
178.277
4.153
40.895
1482.793
511.523
0.893
8.558
658.620
142.988
48.428
60.513
0.304
0.002
AnhwiaNkw
anta(A
AN)
71.333
84.468
252.973
174.837
171.905
139.445
1613.560
1578.720
7.083
4.905
713.723
145.890
108.503
21.068
0.077
0.001
Beposo(BEP)
155.668
72.118
125.923
141.282
179.973
61.525
1085.095
815.428
8.743
6.673
1234.093
374.675
50.665
37.830
0.199
0.001
Daboase
(DAB)
39.908
53.740
144.535
136.122
165.708
172.103
1353.083
1030.895
7.815
5.973
34.870
68.185
78.643
17.873
0.136
0.001
Atwereboanda(ATW)
129.630
47.415
188.698
136.985
28.228
48.820
730.488
600.035
9.283
7.078
56.060
43.878
452.268
11.493
0.244
0.001
Sham
a(SHA)
114.938
66.683
134.130
116.335
286.210
337.623
901.500
1032.758
8.648
7.078
77.865
54.898
277.778
91.418
0.071
0.000
AVG
79.928
72.663
218.729
167.603
234.742
183.904
1354.513
1138.552
3.206
7.279
335.381
132.864
118.323
35.622
0.175
0.002
STD
34.074
33.456
38.537
24.162
594.105
332.209
292.177
315.643
3.038
1.119
289.153
169.540
32.440
0.074
0.001
WHO
2525
5050
600
600
28,000
28,000
1.1
1.1
2323
8888
77
Italicized
figuresareaboveWHOstandard
272 Page 4 of 10 Water Air Soil Pollut (2018) 229: 272
Equipment, Ghana. Ultrapure metal free deionized wa-ter was used for all analyses. All glass and plastic wareswere cleaned by soaking them in warm 5% (V/V) aque-ous nitric acid for 6–7 h and rinsed with ultrapuredeionized water. The standard for the ASS calibrationwas prepared by diluting standard (1000 ppm) suppliedby MES Equipment Limited, Ghana. All measured re-sults were converted from milligram per liter and mi-crogram per liter to milligram per kilogram. MatrixSpike recovery was in the range of 85–100%. Theperformance of the AAS was checked daily to ensurethat the instrument is working according to thespecifications.
2.3 Assessment of Heavy Metal Pollution
The choice of background values plays important rolesin geochemical data interpretation (Ali et al. 2016). Thebackground value is the natural content of a substance inthe soil which is completely dependent on the compo-sition and mineralogical characteristics of the parent/source geological material (Maurizio 2016). The contri-bution of human activities to the levels of heavy metalsin sediments and their pollution can be estimated usingIgeo, EF, and PLI.
2.3.1 Geo-Accumulation Index
This index was first proposed for metal concentrationdetermination in 2-μm fraction and later developed tothe present form (Müller 1979). The method is used todetermine the levels of contamination or accumulationof metals in soil. The formula is mathematicallyexpressed as:
Igeo ¼ log2Cn½ �
1:5Bnð1Þ
Where Cn is the measured concentration of metal n inthe sediment, Bn is the geochemical background valueof element n in the background sample (Yu et al. 2011),and 1.5 is the backgroundmatrix correction factor due tolithogenic effects. Müller (1979) gave seven classes forinterpreting the geo-accumulation index which rangedas follows: Igeo ≤ 0, uncontaminated; 0 < Igeo < 1, un-contaminated to moderately contaminated; 1 < Igeo < 2,moderately contaminated; 2 < Igeo < 3, moderately toheavily contaminated; 3 < Igeo < 4, heavily contaminat-ed; 4 < Igeo < 5, heavily to extremely contaminated; andIgeo ≥ 5, extremely contaminated.
2.3.2 Enrichment Factor and Pollution Load Index
The enrichment factor as proposed by Zoller (1974) isgiven by:
EF ¼ Ai½ �Ao½ � =
Bi½ �Bo½ � ð2Þ
[Ai] and [Bi] are the concentrations of elements A and Bat sampling station i; [Ao] and [Bo] are the backgroundconcentrations of elements A and B. Values estimatedfor EF from Eq. (1) provide the pollution state of thesediment. Values of 0.5 ≤ EF ≤ 1.5 are an indication thatthe metal concentration is a natural weathering process(Zhang and Liu 2002). A value above 1.5 indicates theinfluence of anthropogenic activity (Klerks andLevinton 1989; Taylor et al. 2010; Zhang and Liu2002). There are five classes of contamination withreference to EF: EF < 2, depletion to minimal enrich-ment; EF = 2–5, moderate enrichment; EF = 5–20, sig-nificant enrichment; EF = 20–40, very high enrichment;EF > 40, extremely high enrichment. The pollution loadindex is defined as the nth root of the multiplication ofthe EF of metals involved
PLI ¼ EF1 � EF2 � EF3 � EF4 � EFnð Þ1=n
According to Tomilson (1980), a PLI of 0 indicatesexcellence; a value of 1 indicates baseline levels of theconcerned metals, whereas values above 1 are signs ofprogressive deterioration. Whereas EF gives the indi-vidual effects of the metals at a site, the PLI gives theoverall effect of all metals studied at a site.
3 Results and Discussion
The mean heavy metal concentrations for sediments inthe study sites during the dry and wet seasons arepresented in Table 1. Praso Town (PT) recorded thehighest average metal concentration during the periodunder study. Dunkwa Akropong (DAK) andAtweneboanda (ATW) recorded the lowest metal con-centrations during the dry and wet seasons respectively(Tables 1). The observed high metal concentrations inPT can be attributed to the uncontrolled and scatteredillegal mining activities occurring in and around thearea. The lowest metal concentration found in ATWriver sediments may be due to dilution in the area asthe town is the last point after which the river joins the
Water Air Soil Pollut (2018) 229: 272 Page 5 of 10 272
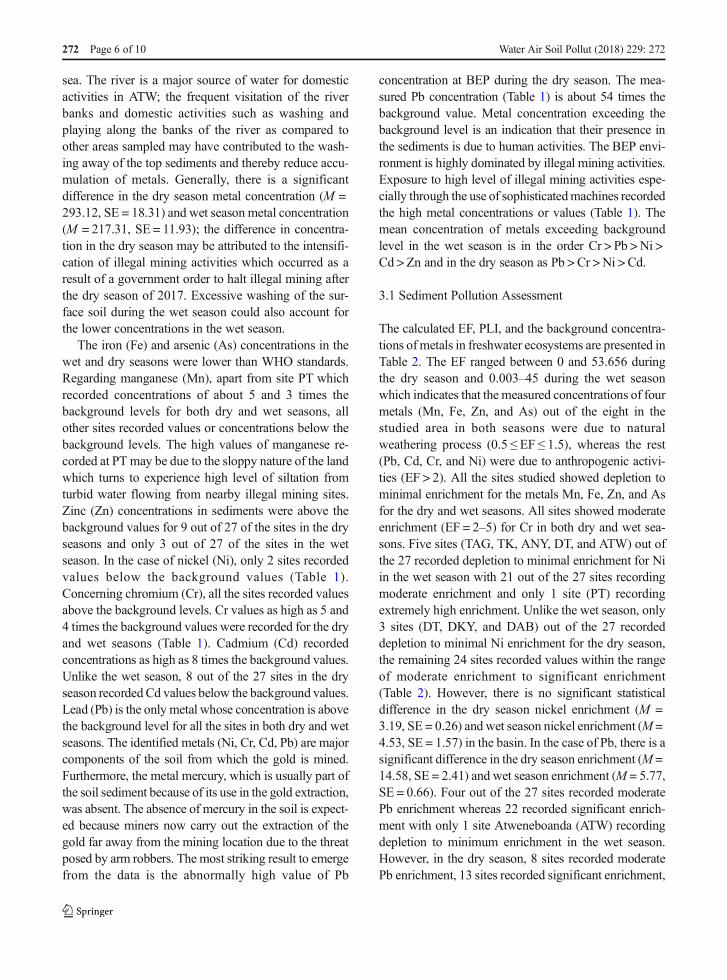
sea. The river is a major source of water for domesticactivities in ATW; the frequent visitation of the riverbanks and domestic activities such as washing andplaying along the banks of the river as compared toother areas sampled may have contributed to the wash-ing away of the top sediments and thereby reduce accu-mulation of metals. Generally, there is a significantdifference in the dry season metal concentration (M =293.12, SE = 18.31) and wet season metal concentration(M = 217.31, SE = 11.93); the difference in concentra-tion in the dry season may be attributed to the intensifi-cation of illegal mining activities which occurred as aresult of a government order to halt illegal mining afterthe dry season of 2017. Excessive washing of the sur-face soil during the wet season could also account forthe lower concentrations in the wet season.
The iron (Fe) and arsenic (As) concentrations in thewet and dry seasons were lower than WHO standards.Regarding manganese (Mn), apart from site PT whichrecorded concentrations of about 5 and 3 times thebackground levels for both dry and wet seasons, allother sites recorded values or concentrations below thebackground levels. The high values of manganese re-corded at PT may be due to the sloppy nature of the landwhich turns to experience high level of siltation fromturbid water flowing from nearby illegal mining sites.Zinc (Zn) concentrations in sediments were above thebackground values for 9 out of 27 of the sites in the dryseasons and only 3 out of 27 of the sites in the wetseason. In the case of nickel (Ni), only 2 sites recordedvalues below the background values (Table 1).Concerning chromium (Cr), all the sites recorded valuesabove the background levels. Cr values as high as 5 and4 times the background values were recorded for the dryand wet seasons (Table 1). Cadmium (Cd) recordedconcentrations as high as 8 times the background values.Unlike the wet season, 8 out of the 27 sites in the dryseason recordedCd values below the background values.Lead (Pb) is the only metal whose concentration is abovethe background level for all the sites in both dry and wetseasons. The identified metals (Ni, Cr, Cd, Pb) are majorcomponents of the soil from which the gold is mined.Furthermore, the metal mercury, which is usually part ofthe soil sediment because of its use in the gold extraction,was absent. The absence of mercury in the soil is expect-ed because miners now carry out the extraction of thegold far away from the mining location due to the threatposed by arm robbers. The most striking result to emergefrom the data is the abnormally high value of Pb
concentration at BEP during the dry season. The mea-sured Pb concentration (Table 1) is about 54 times thebackground value. Metal concentration exceeding thebackground level is an indication that their presence inthe sediments is due to human activities. The BEP envi-ronment is highly dominated by illegal mining activities.Exposure to high level of illegal mining activities espe-cially through the use of sophisticatedmachines recordedthe high metal concentrations or values (Table 1). Themean concentration of metals exceeding backgroundlevel in the wet season is in the order Cr > Pb >Ni >Cd > Zn and in the dry season as Pb > Cr >Ni > Cd.
3.1 Sediment Pollution Assessment
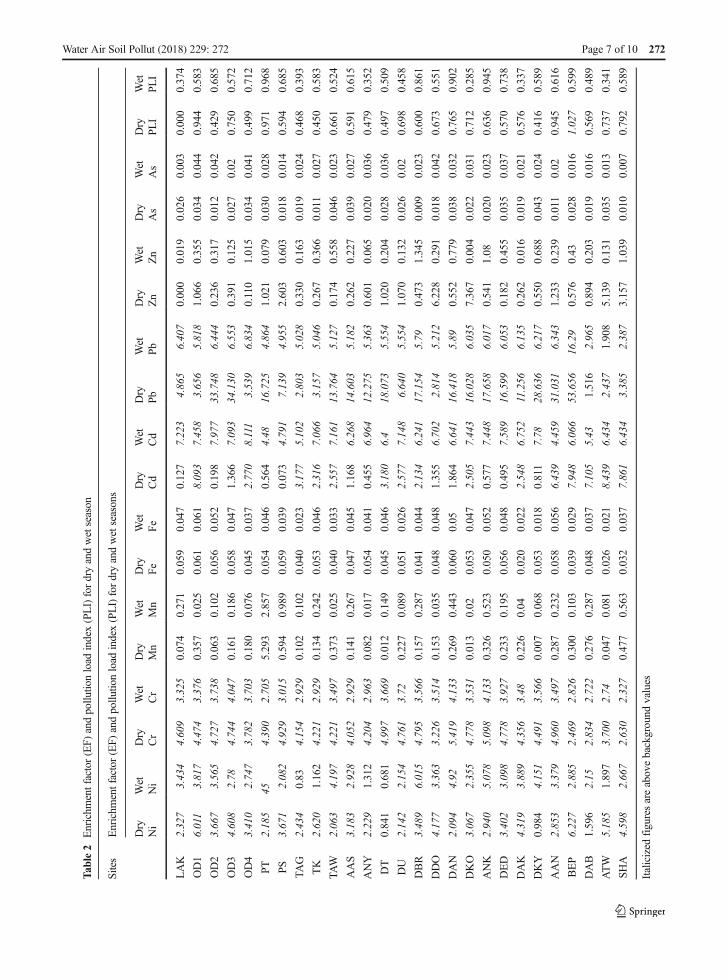
The calculated EF, PLI, and the background concentra-tions of metals in freshwater ecosystems are presented inTable 2. The EF ranged between 0 and 53.656 duringthe dry season and 0.003–45 during the wet seasonwhich indicates that the measured concentrations of fourmetals (Mn, Fe, Zn, and As) out of the eight in thestudied area in both seasons were due to naturalweathering process (0.5 ≤ EF ≤ 1.5), whereas the rest(Pb, Cd, Cr, and Ni) were due to anthropogenic activi-ties (EF > 2). All the sites studied showed depletion tominimal enrichment for the metals Mn, Fe, Zn, and Asfor the dry and wet seasons. All sites showed moderateenrichment (EF = 2–5) for Cr in both dry and wet sea-sons. Five sites (TAG, TK, ANY, DT, and ATW) out ofthe 27 recorded depletion to minimal enrichment for Niin the wet season with 21 out of the 27 sites recordingmoderate enrichment and only 1 site (PT) recordingextremely high enrichment. Unlike the wet season, only3 sites (DT, DKY, and DAB) out of the 27 recordeddepletion to minimal Ni enrichment for the dry season,the remaining 24 sites recorded values within the rangeof moderate enrichment to significant enrichment(Table 2). However, there is no significant statisticaldifference in the dry season nickel enrichment (M =3.19, SE = 0.26) and wet season nickel enrichment (M =4.53, SE = 1.57) in the basin. In the case of Pb, there is asignificant difference in the dry season enrichment (M =14.58, SE = 2.41) and wet season enrichment (M = 5.77,SE = 0.66). Four out of the 27 sites recorded moderatePb enrichment whereas 22 recorded significant enrich-ment with only 1 site Atweneboanda (ATW) recordingdepletion to minimum enrichment in the wet season.However, in the dry season, 8 sites recorded moderatePb enrichment, 13 sites recorded significant enrichment,
272 Page 6 of 10 Water Air Soil Pollut (2018) 229: 272
Tab
le2
Enrichm
entfactor(EF)
andpollu
tionload
index(PLI)fordryandwetseason
Sites
Enrichm
entfactor(EF)
andpollu
tionload
index(PLI)fordryandwetseasons
Dry
Wet
Dry
Wet
Dry
Wet
Dry
Wet
Dry
Wet
Dry
Wet
Dry
Wet
Dry
Wet
Dry
Wet
Ni
Ni
Cr
Cr
Mn
Mn
Fe
Fe
Cd
Cd
Pb
Pb
Zn
Zn
As
As
PLI
PLI
LAK
2.327
3.434
4.609
3.325
0.074
0.271
0.059
0.047
0.127
7.223
4.865
6.407
0.000
0.019
0.026
0.003
0.000
0.374
OD1
6.011
3.817
4.474
3.376
0.357
0.025
0.061
0.061
8.093
7.458
3.656
5.818
1.066
0.355
0.034
0.044
0.944
0.583
OD2
3.667
3.565
4.727
3.738
0.063
0.102
0.056
0.052
0.198
7.977
33.748
6.444
0.236
0.317
0.012
0.042
0.429
0.685
OD3
4.608
2.78
4.744
4.047
0.161
0.186
0.058
0.047
1.366
7.093
34.130
6.553
0.391
0.125
0.027
0.02
0.750
0.572
OD4
3.410
2.747
3.782
3.703
0.180
0.076
0.045
0.037
2.770
8.111
3.539
6.834
0.110
1.015
0.034
0.041
0.499
0.712
PT2.185
454.390
2.705
5.293
2.857
0.054
0.046
0.564
4.48
16.725
4.864
1.021
0.079
0.030
0.028
0.971
0.968
PS3.671
2.082
4.929
3.015
0.594
0.989
0.059
0.039
0.073
4.791
7.139
4.955
2.603
0.603
0.018
0.014
0.594
0.685
TAG
2.434
0.83
4.154
2.929
0.102
0.102
0.040
0.023
3.177
5.102
2.803
5.028
0.330
0.163
0.019
0.024
0.468
0.393
TK
2.620
1.162
4.221
2.929
0.134
0.242
0.053
0.046
2.316
7.066
3.157
5.046
0.267
0.366
0.011
0.027
0.450
0.583
TAW
2.063
4.197
4.221
3.497
0.373
0.025
0.040
0.033
2.557
7.161
13.764
5.127
0.174
0.558
0.046
0.023
0.661
0.524
AAS
3.183
2.928
4.052
2.929
0.141
0.267
0.047
0.045
1.168
6.268
14.603
5.182
0.262
0.227
0.039
0.027
0.591
0.615
ANY
2.229
1.312
4.204
2.963
0.082
0.017
0.054
0.041
0.455
6.964
12.275
5.363
0.601
0.065
0.020
0.036
0.479
0.352
DT
0.841
0.681
4.997
3.669
0.012
0.149
0.045
0.046
3.180
6.4
18.073
5.554
1.020
0.204
0.028
0.036
0.497
0.509
DU
2.142
2.154
4.761
3.72
0.227
0.089
0.051
0.026
2.577
7.148
6.640
5.554
1.070
0.132
0.026
0.02
0.698
0.458
DBR
3.489
6.015
4.795
3.566
0.157
0.287
0.041
0.044
2.134
6.241
17.154
5.79
0.473
1.345
0.009
0.023
0.600
0.861
DDO
4.177
3.363
3.226
3.514
0.153
0.035
0.048
0.048
1.355
6.702
2.814
5.212
6.228
0.291
0.018
0.042
0.673
0.551
DAN
2.094
4.92
5.419
4.133
0.269
0.443
0.060
0.05
1.864
6.641
16.418
5.89
0.552
0.779
0.038
0.032
0.765
0.902
DKO
3.067
2.355
4.778
3.531
0.013
0.02
0.053
0.047
2.505
7.443
16.028
6.035
7.367
0.004
0.022
0.031
0.712
0.285
ANK
2.940
5.078
5.098
4.133
0.326
0.523
0.050
0.052
0.577
7.448
17.658
6.017
0.541
1.08
0.020
0.023
0.636
0.945
DED
3.402
3.098
4.778
3.927
0.233
0.195
0.056
0.048
0.495
7.589
16.599
6.053
0.182
0.455
0.035
0.037
0.570
0.738
DAK
4.319
3.889
4.356
3.48
0.226
0.04
0.020
0.022
2.548
6.752
11.256
6.135
0.262
0.016
0.019
0.021
0.576
0.337
DKY
0.984
4.151
4.491
3.566
0.007
0.068
0.053
0.018
0.811
7.78
28.636
6.217
0.550
0.688
0.043
0.024
0.416
0.589
AAN
2.853
3.379
4.960
3.497
0.287
0.232
0.058
0.056
6.439
4.459
31.031
6.343
1.233
0.239
0.011
0.02
0.945
0.616
BEP
6.227
2.885
2.469
2.826
0.300
0.103
0.039
0.029
7.948
6.066
53.656
16.29
0.576
0.43
0.028
0.016
1.027
0.599
DAB
1.596
2.15
2.834
2.722
0.276
0.287
0.048
0.037
7.105
5.43
1.516
2.965
0.894
0.203
0.019
0.016
0.569
0.489
ATW
5.185
1.897
3.700
2.74
0.047
0.081
0.026
0.021
8.439
6.434
2.437
1.908
5.139
0.131
0.035
0.013
0.737
0.341
SHA
4.598
2.667
2.630
2.327
0.477
0.563
0.032
0.037
7.861
6.434
3.385
2.387
3.157
1.039
0.010
0.007
0.792
0.589
Italicized
figuresareabovebackground
values
Water Air Soil Pollut (2018) 229: 272 Page 7 of 10 272
Tab
le3
Dry
andwetseason
geo-accumulationindex(Igeo)
Sites
Dry
Wet
Dry
Wet
Dry
Wet
Dry
Wet
Dry
Wet
Dry
Wet
Dry
Wet
Dry
Wet
Ni
Ni
Cr
Cr
Mn
Mn
Fe
Fe
Cd
Cd
PbPb
Zn
Zn
As
As
LAK
1.578
0.837
0.607
0.871
−0.23
−0.405
−0.215
−0.201
−0.281
0.441
0.589
0.477
0−0.159
−0.17
−0.113
OD1
0.499
0.742
0.623
0.854
−0.483
−0.169
−0.217
−0.216
0.411
0.432
0.778
0.511
−2.03048
−0.481
−0.184
−0.197
OD2
0.775
0.801
0.594
0.759
−0.219
−0.258
−0.21
−0.206
−0.342
0.415
0.223
0.476
−0.37467
−0.446
−0.142
−0.193
OD3
0.618
1.123
0.592
0.698
−0.31
−0.332
−0.214
−0.2
−7.402
0.446
0.222
0.47
−0.5157
−0.279
−0.173
−0.16
OD4
0.844
1.145
0.734
0.767
−0.327
−0.232
−0.198
−0.187
1.13
0.411
0.808
0.457
−0.26493
−1.777
−0.183
−0.192
PT1.843
−1.498
0.634
1.175
0.55
1.076
−0.208
−0.199
−0.708
0.634
0.287
0.589
−1.80275
−0.236
−0.177
−0.174
P S0.774
2.113
0.573
0.993
−0.749
−1.665
−0.214
−0.189
−0.229
0.597
0.444
0.58
1.25759
−0.76
−0.157
−0.149
TAG
1.432
−1.17
0.668
1.036
−0.258
−0.258
−0.191
−0.166
0.924
0.566
1.109
0.573
−0.45818
−0.313
−0.159
−0.168
TK
1.243
−2.71
0.657
1.036
−0.287
−0.38
−0.207
−0.199
1.596
0.447
0.931
0.571
−0.40127
−0.492
−0.14
−0.172
TAW
2.177
0.674
0.657
0.819
−0.498
−0.169
−0.192
−0.182
1.3
0.443
0.313
0.564
−0.32212
−0.701
−0.198
−0.166
AAS
0.921
1.037
0.684
1.036
−0.293
−0.402
−0.2
−0.198
−2.772
0.485
0.305
0.559
−0.39709
−0.367
−0.19
−0.172
ANY
1.751
−5.17
0.66
1.018
−0.239
−0.155
−0.208
−0.192
−0.581
0.451
0.33
0.544
−0.75815
−0.221
−0.161
−0.186
DT
−1.199
−0.877
0.567
0.775
−0.143
−0.301
−0.197
−0.199
0.923
0.478
0.278
0.53
−1.79573
−0.348
−0.174
−0.186
DU
1.947
1.917
0.59
0.763
−0.367
−0.246
−0.205
−0.171
1.281
0.444
0.466
0.53
−2.04949
−0.285
−0.171
−0.16
DBR
0.821
0.499
0.587
0.801
−0.307
−0.419
−0.193
−0.196
1.966
0.486
0.284
0.513
−0.60013
−6.367
−0.135
−0.167
DDO
0.677
0.859
0.882
0.814
−0.304
−0.184
−0.201
−0.201
−6.796
0.463
1.102
0.557
0.486877
−0.423
−0.156
−0.194
DAN
2.077
0.584
0.531
0.684
−0.404
−0.568
−0.215
−0.204
3.193
0.466
0.29
0.507
−0.693
−1.059
−0.189
−0.18
DKO
0.969
1.537
0.588
0.81
−0.146
−0.161
−0.207
−0.2
1.352
0.433
0.293
0.498
0.435517
−0.119
−0.164
−0.179
ANK
1.03
0.568
0.558
0.684
−0.454
−0.658
−0.204
−0.206
−0.726
0.433
0.281
0.499
−0.67923
−2.108
−0.16
−0.165
DED
0.846
0.956
0.588
0.72
−0.372
−0.34
−0.211
−0.201
−0.626
0.428
0.288
0.497
−0.32867
−0.581
−0.184
−0.188
DAK
0.655
0.728
0.638
0.824
−0.366
−0.191
−0.161
−0.165
1.308
0.461
0.344
0.492
−0.39711
−0.153
−0.16
−0.163
DKY
−1.643
0.681
0.621
0.801
−0.129
−0.224
−0.207
−0.157
−1.128
0.421
0.235
0.488
−0.69126
−0.889
−0.196
−0.168
AAN
1.078
0.854
0.57
0.819
−0.419
−0.372
−0.213
−0.211
0.476
0.636
0.229
0.481
−3.53595
−0.378
−0.141
−0.161
BEP
0.487
1.06
1.338
1.095
−0.431
−0.258
−0.19
−0.176
0.416
0.496
0.194
0.291
−0.72386
−0.555
−0.175
−0.153
DAB
11.14
1.926
1.057
1.163
−0.41
−0.419
−0.202
−0.187
0.446
0.539
64.977
1.017
−1.33841
−0.347
−0.159
−0.152
ATW
0.559
2.955
0.751
1.151
−0.2
−0.238
−0.171
−0.163
0.401
0.476
1.428
2.883
0.562861
−0.284
−0.184
−0.146
SHA
0.619
1.204
1.192
1.579
−0.605
−0.707
−0.18
−0.187
0.418
0.476
0.852
1.492
0.931626
−1.887
−0.139
−0.13
Italicized
figuresareabovebackground
values
272 Page 8 of 10 Water Air Soil Pollut (2018) 229: 272
4 recorded very high enrichment, and 1 recorded ex-tremely high enrichment. In the dry season, Cd recordeddepletion to minimal enrichment in 12 sites, recordedmoderate enrichment in 6 sites, and recorded significantenrichment in 9 sites. However, it recorded moderate tosignificant enrichment for all the sites in the wet season(Table 2). The seasonal influence on Cd enrichment inthe sediment is very significant: dry season Cd enrich-ment (M = 2.76, SE = 0.53) and wet season enrichment(M = 6.61, SE = 0.19) (Table 2). Irrespective of the highenrichment factors recorded for some sites, BEP was theonly site polluted (PLI > 1) (Table 2) in both seasons.LAK which is upstream and served as the control site isthe only sampling point which recorded excellent valuefor pollution (PLI = 0) in the dry season (Table 2).Though LAK did not record 0 in the wet season, thevalue of 0.374 was still within the baseline level. The0.374 is expected because in the wet season, the lakereceives a lot of runoff with high silt content from thesurrounding mountains without any means of exitingsuch inflows. On the contrary, the calculated PLI for theremaining 26 sites though within the baseline level isdue to unregulated illegal mining in the area.
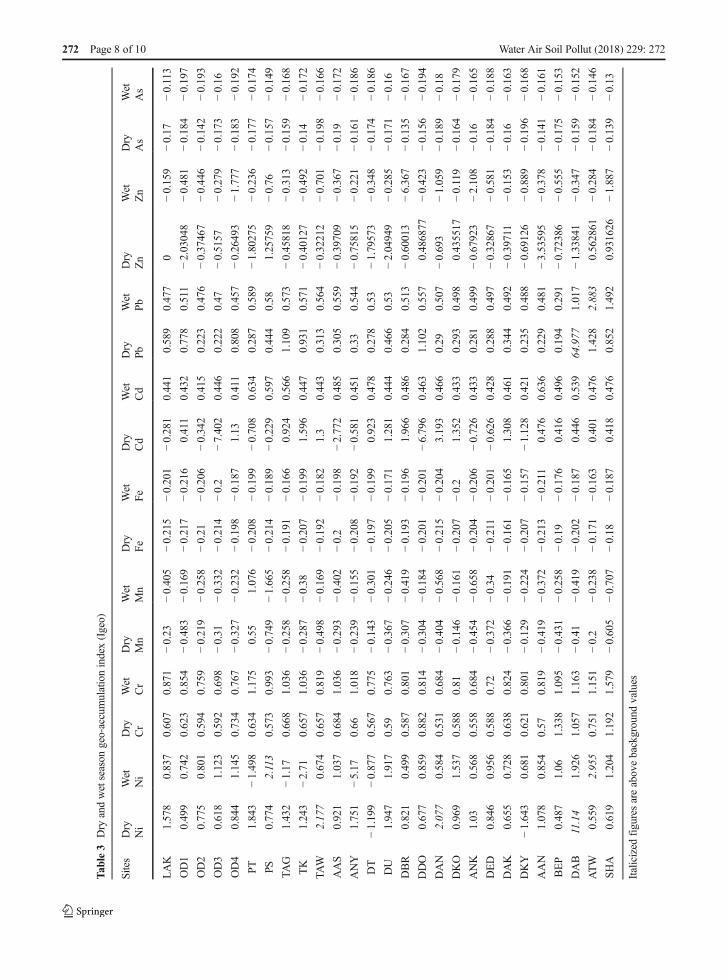
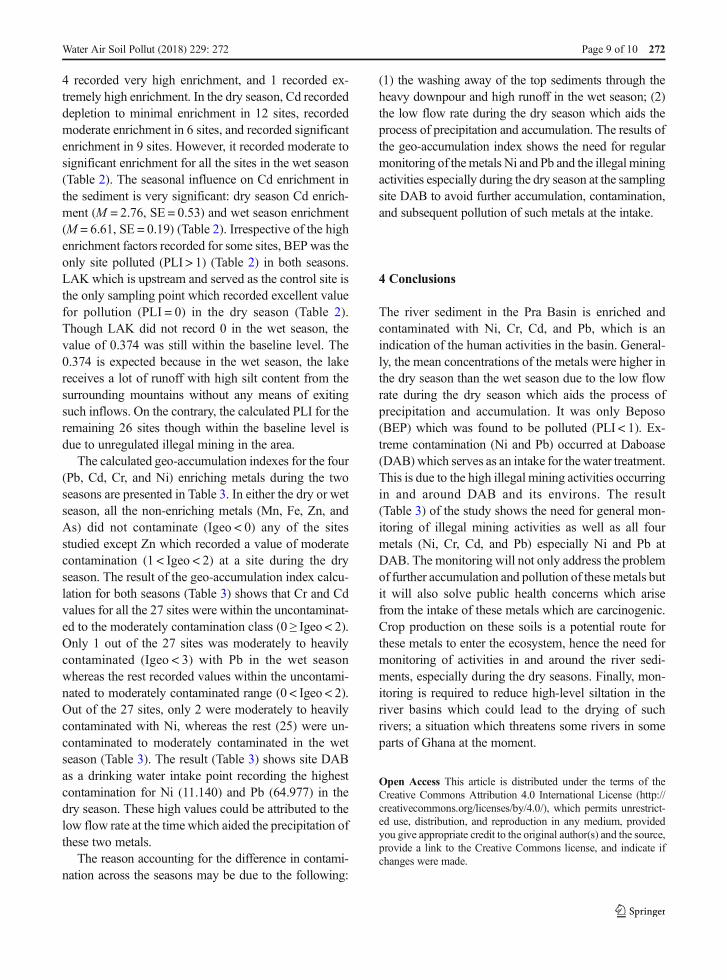
The calculated geo-accumulation indexes for the four(Pb, Cd, Cr, and Ni) enriching metals during the twoseasons are presented in Table 3. In either the dry or wetseason, all the non-enriching metals (Mn, Fe, Zn, andAs) did not contaminate (Igeo < 0) any of the sitesstudied except Zn which recorded a value of moderatecontamination (1 < Igeo < 2) at a site during the dryseason. The result of the geo-accumulation index calcu-lation for both seasons (Table 3) shows that Cr and Cdvalues for all the 27 sites were within the uncontaminat-ed to the moderately contamination class (0 ≥ Igeo < 2).Only 1 out of the 27 sites was moderately to heavilycontaminated (Igeo < 3) with Pb in the wet seasonwhereas the rest recorded values within the uncontami-nated to moderately contaminated range (0 < Igeo < 2).Out of the 27 sites, only 2 were moderately to heavilycontaminated with Ni, whereas the rest (25) were un-contaminated to moderately contaminated in the wetseason (Table 3). The result (Table 3) shows site DABas a drinking water intake point recording the highestcontamination for Ni (11.140) and Pb (64.977) in thedry season. These high values could be attributed to thelow flow rate at the time which aided the precipitation ofthese two metals.
The reason accounting for the difference in contami-nation across the seasons may be due to the following:
(1) the washing away of the top sediments through theheavy downpour and high runoff in the wet season; (2)the low flow rate during the dry season which aids theprocess of precipitation and accumulation. The results ofthe geo-accumulation index shows the need for regularmonitoring of themetals Ni and Pb and the illegal miningactivities especially during the dry season at the samplingsite DAB to avoid further accumulation, contamination,and subsequent pollution of such metals at the intake.
4 Conclusions
The river sediment in the Pra Basin is enriched andcontaminated with Ni, Cr, Cd, and Pb, which is anindication of the human activities in the basin. General-ly, the mean concentrations of the metals were higher inthe dry season than the wet season due to the low flowrate during the dry season which aids the process ofprecipitation and accumulation. It was only Beposo(BEP) which was found to be polluted (PLI < 1). Ex-treme contamination (Ni and Pb) occurred at Daboase(DAB) which serves as an intake for the water treatment.This is due to the high illegal mining activities occurringin and around DAB and its environs. The result(Table 3) of the study shows the need for general mon-itoring of illegal mining activities as well as all fourmetals (Ni, Cr, Cd, and Pb) especially Ni and Pb atDAB. The monitoring will not only address the problemof further accumulation and pollution of thesemetals butit will also solve public health concerns which arisefrom the intake of these metals which are carcinogenic.Crop production on these soils is a potential route forthese metals to enter the ecosystem, hence the need formonitoring of activities in and around the river sedi-ments, especially during the dry seasons. Finally, mon-itoring is required to reduce high-level siltation in theriver basins which could lead to the drying of suchrivers; a situation which threatens some rivers in someparts of Ghana at the moment.
Open Access This article is distributed under the terms of theCreative Commons Attribution 4.0 International License (http://creativecommons.org/licenses/by/4.0/), which permits unrestrict-ed use, distribution, and reproduction in any medium, providedyou give appropriate credit to the original author(s) and the source,provide a link to the Creative Commons license, and indicate ifchanges were made.
Water Air Soil Pollut (2018) 229: 272 Page 9 of 10 272
References
Abdel-Ghani, N. T., & Elchaghaby, G. A. (2007). Influence ofoperating conditions on the removal of Cu, Zn, Cd and Pbions from wastewater by adsorption. International journal ofEnvironmental Science and Technology, 4, 451–456.
Ali, M. M., Ali, M. L., Islam, M. D. S., & Rahman, M. D. Z.(2016). Preliminary assessment of heavy metals in water andsediment of Karnaphuli River, Bangladesh. EnvironmentalNanotechnology, Monitoring & Management, 5, 27–35.
Atkinson, C. A., Jolley, D. F., & Simpson, S. L. (2007). Effect ofoverlying water pH, dissolved oxygen, salinity and sedimentdisturbances onmetal release and sequestration from contam-inated marine sediments. Chemosphere, 69(9), 1428–1437.
Haiyan L., Anbang, S., Mingyi, L., Xiaoran, Z. (2013). Effect ofpH, temperature, dissolved oxygen, and flow rate of overly-ing water on heavy metals release from storm sewer sedi-ments. Journal of Chemistry, 2013, 104316.
Islam, M. S., Ahmed, M. K., Raknuzzaman, M., Habibullah-Al-Mamun,M., & Islam,M. K. (2015). Heavymetal pollution insurface water and sediment: a preliminary assessment of anurban river in a developing country. Ecological Indicators,48, 282–291.
Ismaeel, W., & Kusag, A. (2015). Enrichment factor and geo-accumulation index for heavy metals at industrial zone inIraq. IOSR Journal of Applied Geology and Geophysics, 3,26–32.
Klerks, P. L., & Levinton, J. S. . (1989). Rapid evolution of metalresistance in a benthic oligochaete inhabiting a metal-polluted site. The Biological Bulletin, 176, 135–141.
Maurizio, B. (2016). The importance of enrichment factor (EF)and geoaccumulation index (Igeo) to evaluate the soil con-tamination. Geology and Geophysics, 5(1), 1–4.
Miller, J. R., Hudson-Edwards, K. A., Lechler, P. I., Preston, D., &Macklin, M. G. (2004). Heavy metal contamination of watersoil and produce within riverine communities of the RioPilcomayo Basin. The Science of the Total Environment,320, 189–209.
Müller, G. (1979). Schwermetalle in den sedimenten des RheinseVeranderrungen seitt 1971. Umschau, 79, 778–783.
Shazili, M. N. A., Yunus, K., Ahmad, A. S., Avdullah, N., & AbdRashid, M. K. (2006). Heavy metal pollution in theMalaysian aquatic environment. Aquatic Ecosystem Health& Management, 9(2), 137–145.
Simpson, S. L., Angel, B. M., & Jolley, D. F. . (2004). Metalequilibration in laboratory-contaminated (spiked) sedimentsused for the development of whole-sediment toxicity tests.Chemosphere, 54(5), 597–609.
Taylor, M. P., Mackay, A. K., Hudson-Edwards, K. A., & Holz, E.. (2010). Soil Cd, Cu, Pb and Zn contaminant around, aroundIsa city, Queensland, Australia: Potential sources and risks tohuman health. Applied Geochemistry, 25, 841–855.
Tomilson, M.J. (1980). Foundation design and construction. 4thEdn. Pitman Publishing Inc., London.
Yu, G. B., Liu, Y., Yu, S., Wu, S. C., Leug, A. O. W., Luo, X. S.,Xu, B., Li, H. B., & Wong, M. H. (2011). Inconsistency andcomprehensiveness of risk assessments for heavy metals inurban surface sediments. Chemosphere, 85, 1080–1057.
Zhang, J., & Liu, C. L. . (2002). Riverine composition and estu-arine geochemistry of particulate metals in China-weatheringfeatures, anthropogenic impact and chemical fluxes.Estuarine, Coastal and Shelf Science, 54, 1051–1070.
Zoller, W. H., Gladney, E. S., & Duce, R. A. (1974). Atmosphericconcentrations and sources of trace metals at the South Pole.Science, 183(4121), 198–200
272 Page 10 of 10 Water Air Soil Pollut (2018) 229: 272
Related Documents