© Society for Environment and Development, (India) http://www.sedindia.org Assessment of Groundwater Quality in Different Land Uses in Ghaziabad District of Uttar Pradesh, India Shipra Tyagi # and Kiranmay Sarma * University School of Environment Management, Guru Gobind Singh Indraprastha University, Sector 16C, Dwarka, New Delhi-110078, India # Email: [email protected], * Email: [email protected] Article history: Received 11 April 2018 Received in revised form 17 July 2018 Accepted 28 July 2018 Available online 31 July 2018 Abstract In Ghaziabad district of Uttar Pradesh, groundwater is one of the substantial resources that need great concern as it is consumed by all the sectors of domestic, irrigation and industrial purposes. The present study examined the groundwater quality of the district on the basis of land use types. A total number of 26 sites were identified in the district from residential, industrial and agricultural areas during pre- monsoon (May 2017) season. The groundwater samples were investigated for major physicochemical parameters and heavy metal analysis. The influence of anthropogenic activities on the quality of groundwater showed that iron, cadmium and nickel were predominant heavy metals that were exceeding the permissible limits of BIS 2012 standards. Ground Water Quality Index (GWQI) was applied for evaluating the impact of land use on the overall quality of groundwater and resulted as about 69% of the samples were found unfit for drinking. In accordance with the standards, it was assessed that the quality of the groundwater is deteriorating at an alarming rate due to the improper management of the land use activities in the district. Keywords: Groundwater quality; Ghaziabad district; Land use; Heavy metals; GWQI Introduction Groundwater is a valuable natural resource found beneath the earth surface, which benefits diverse life forms. It not only helps in regulating the annual flowing of the rivers and wetlands but also conserves the quality by diluting the accumulated effluents (Lerner and Harris, 2009). The overlying landscapes influence the groundwater by discharging excess nutrient and toxic chemicals that affect the quality of groundwater to a greater extent (Ouyang, 2011). A numerous anthropogenic and natural sources trigger the Environment & We An International Journal of Science & Technology Available online at www.ewijst.org ISSN: 0975-7112 (Print) ISSN: 0975-7120 (Online) Environ. We Int. J. Sci. Tech. 13 (2018) 99-117

Welcome message from author
This document is posted to help you gain knowledge. Please leave a comment to let me know what you think about it! Share it to your friends and learn new things together.
Transcript

© Society for Environment and Development, (India) http://www.sedindia.org
Assessment of Groundwater Quality in Different
Land Uses in Ghaziabad District of Uttar Pradesh, India
Shipra Tyagi# and Kiranmay Sarma* University School of Environment Management,
Guru Gobind Singh Indraprastha University, Sector 16C, Dwarka, New Delhi-110078, India
#Email: [email protected], *Email: [email protected]
Article history: Received 11 April 2018 Received in revised form 17 July 2018 Accepted 28 July 2018 Available online 31 July 2018
Abstract
In Ghaziabad district of Uttar Pradesh, groundwater is one of the substantial resources that need great concern as it is consumed by all the sectors of domestic, irrigation and industrial purposes. The present study examined the groundwater quality of the district on the basis of land use types. A total number of 26 sites were identified in the district from residential, industrial and agricultural areas during pre-monsoon (May 2017) season. The groundwater samples were investigated for major physicochemical parameters and heavy metal analysis. The influence of anthropogenic activities on the quality of groundwater showed that iron, cadmium and nickel were predominant heavy metals that were exceeding the permissible limits of BIS 2012 standards. Ground Water Quality Index (GWQI) was applied for evaluating the impact of land use on the overall quality of groundwater and resulted as about 69% of the samples were found unfit for drinking. In accordance with the standards, it was assessed that the quality of the groundwater is deteriorating at an alarming rate due to the improper management of the land use activities in the district.
Keywords: Groundwater quality; Ghaziabad district; Land use; Heavy metals; GWQI
Introduction
Groundwater is a valuable natural resource found beneath the earth surface, which benefits diverse life forms. It not only helps in regulating the annual flowing of the rivers and wetlands but also conserves the quality by diluting the accumulated effluents (Lerner and Harris, 2009). The overlying landscapes influence the groundwater by discharging excess nutrient and toxic chemicals that affect the quality of groundwater to a greater extent (Ouyang, 2011). A numerous anthropogenic and natural sources trigger the
Environment & We An International Journal of Science
& Technology
Available online at www.ewijst.org
ISSN: 0975-7112 (Print) ISSN: 0975-7120 (Online)
Environ. We Int. J. Sci. Tech. 13 (2018) 99-117

Tyagi and Sarma / Environ. We Int. J. Sci. Tech. 13 (2018) 99-117
100
groundwater pollution. Land use mismanagement leads to degradation of groundwater quality, which governed, by the type of land use activity. Due to augmented use of groundwater in immense purposes, the availability and quality of groundwater is declining at faster rates.
Ground Water Quality Index (GWQI) is a widely used technique for estimating the suitability of drinking water (Asadi et al., 2007). This technique helps in drawing the relative picture of water quality and enables further appraisal and improvement of the water issues for any area (Bordalo et al., 2006). Sometimes, groundwater quality estimation becomes a complex phenomenon when general groundwater quality is affected by various stress factors (Bodrud-Doza et al., 2016). Numerous researchers studied groundwater quality estimation through several indices methods that are based on the relative parameters weightage and overall categorization and assessment of water quality (Singh et al., 2013; Gupta and Sarma 2013; Vasanthavigar et al., 2010). Thus, these indices ease in estimating the pollution levels by assessing the inclusive water quality and resolving the difficulties for the area managers and decision makers for sustainable management of the groundwater resources. Thus, these indices ease in estimating the pollution levels by assessing the inclusive water quality and resolving the difficulties for the area managers and decision makers for sustainable management of the groundwater resources.
The present study focuses on the assessment of groundwater quality in Ghaziabad district of Uttar Pradesh based on the diverse land use pattern of the region. The district is densely populated and holds various residential, commercial complexes, industrial and agricultural areas. Major industries in the district include food processing, rubber, plastic and petroleum, chemical and chemical products, electric machinery equipment and so on ^(Industries at Ghaziabad). The agricultural activities include the cultivation of major crops such as wheat, mustard, rice, sugarcane etc. The utilization of fertilizers and pesticides and intense land use based pressures on the resources contribute to quality deterioration and decreasing groundwater availability. Moreover, only fragmented studies have been done in and around the Ghaziabad city (Singh et al., 2014, 2012). Recent studies within the district focused on the groundwater pollution related with industrial outlook (Chabukdhara et al., 2017; Kumari et al., 2013). By appraising the quality of groundwater of Ghaziabad district on the basis of land use pattern and integrating the GWQI method would highlight and assess the issues responsible for the contamination in the concerned area in an extensive manner.
Materials and Methods
Study area
Ghaziabad is one of the emerging sub-urban districts of western Uttar Pradesh lies between the longitudes 77º12ʹE to 77º42ʹE and latitudes 28º36ʹN and 28º55ʹN (Figure 1). It shares its proximity to National Capital Territory (NCT) of Delhi, which is situated in the middle of the Ganga-Yamuna doab, i.e., on the old flood plain of river Hindon. The major rivers that flow through the district are Ganga and Yamuna with the tributaries of

Tyagi and Sarma / Environ. We Int. J. Sci. Tech. 13 (2018) 99-117
101
Hindon and Kali rivers. Ganga canal also aids in the irrigation and drinking water supply of the district. The physiographical area can be divided into three major regions viz., i) older alluvial plain, ii) older flood plain and iii) active flood plain. Rainfall is predominantly due to south west-monsoon (CGWB, 2009).
Figure 1 Sampling sites locations in Ghaziabad district
Sample collection and analytical procedures
Based on the land use categorization, 26 sites have been identified which consists have 12 residential, 6 industrial and 8 agricultural sites as outlined in Table 1. Groundwater samples, majorly consumed for the drinking and domestic purposes, were

Tyagi and Sarma / Environ. We Int. J. Sci. Tech. 13 (2018) 99-117
102
collected from India Mark II deep well and local hand pumps (depth ranging from ~40-60 ft.) during pre-monsoon season (May 2017). After flushing out the water for 10-15 minutes, samples were collected in two liter polyethylene bottles so as to remove the standing water.
Table 1. Groundwater samplings sites and coordinate points of Ghaziabad district
Sampling Sites Location of SamplingSites
Sampling Sites Coordinates Land Use Type
Longitude Latitude
R1 Pabhi Sadakpur 77°16'52.64"E 28°46'27.04"N Residential R2 Jawali 77°20'12.12"E 28°44'25.98"N Residential R3 Farukh Nagar 77°22'6.85"E 28°43'44.65"N Residential R4 Niwari Village 77°32'6.97"E 28°52'41.98"N Residential R5 Khindora 77°28'9.94"E 28°53'21.76"N Residential R6 Duhai 77°28'36.40"E 28°43'56.78"N Residential R7 Ghaziabad City 77°26'45.81"E 28°40'22.40"N Residential R8 Nahal 77°33'14.14"E 28°42'59.61"N Residential R9 Santpura 77°35'28.78"E 28°51'21.60"N Residential
R10 Palauta 77°39'5.11"E 28°49'11.71"N Residential R11 SikriKhurd 77°34'8.68"E 28°48'46.76"N Residential R12 Vasundara 77°22'13.98"E 28°40'3.61"N Residential I13 Balram Nagar 77°17'16.51"E 28°44'23.82"N Industrial I14 Muradnagar Ordinance Factory 77°31'7.53"E 28°45'9.072"N Industrial I15 Guldhar 77°27'17.20"E 28°42'23.00"N Industrial I16 Makraida 77°25'59.26"E 28°45'4.93"N Brick Factory I17 Kalchhina 77°35'9.74"E 28°46'39.32"N Gas Factory I18 Surya Nagar 77°19'51.81"E 28°40'9.40"N Industrial A19 Manduala Village 77°15'59.90"E 28°49'2.46"N Agriculture A20 Chirauri 77°20'6"E 28°46'31.90"N Agriculture A21 Didoli 77°30'45.61"E 28°48'42.91"N Agriculture A22 Nekpur 77°24'45.97"E 28°49'32.98"N Agriculture A23 Kakra 77°28'41.05"E 28°48'13.32"N Agriculture A24 Sadikpur 77°29'44.16"E 28°40'3.72"N Agriculture A25 Khanjarpur 77°36'23.90"E 28°48'48.38"N Agriculture A26 Muradabad 77°38'43.94"E 28°50'27.09"N Agriculture
For heavy metal analysis, samples were collected in pre-washed and rinsed with 10% HNO3 acidified polyethylene bottle and preserved with HNO3 to maintain pH below 2. All the samples were collected and preserved for analysis and stored at 40C until analysis was performed and transported to the laboratory conditions. The major physicochemical analysis was performed through the standard protocol mentioned in APHA (2005) as summarized in Table 2.
For determination of heavy metals, samples were digested with 10 ml conc. HNO3 and filtered using Whatman No. 42 filter paper. The heavy metals viz., Fe, Zn, Mn, Cu, Cr, Ni and Cd were analyzed through the standard procedure by using atomic absorption spectrophotometer (AAS) with minimum detection limit range of 0.001-0.020 ppm (Agilent 280 FS AA). All the methods applied were standardized and parameters were analyzed and recorded in the triplicates and average values were reported.
Results and Discussion
The statistical summary and graphical representations of the analytical results for the physicochemical and heavy metals in the groundwater samples based on the land use
Tyagi and Sarma / Environ. We Int. J. Sci. Tech. 13 (2018) 99-117
103
categorization in Ghaziabad district are presented in Table 3, Figure 2(a-l) and Figure 3(i-vii).
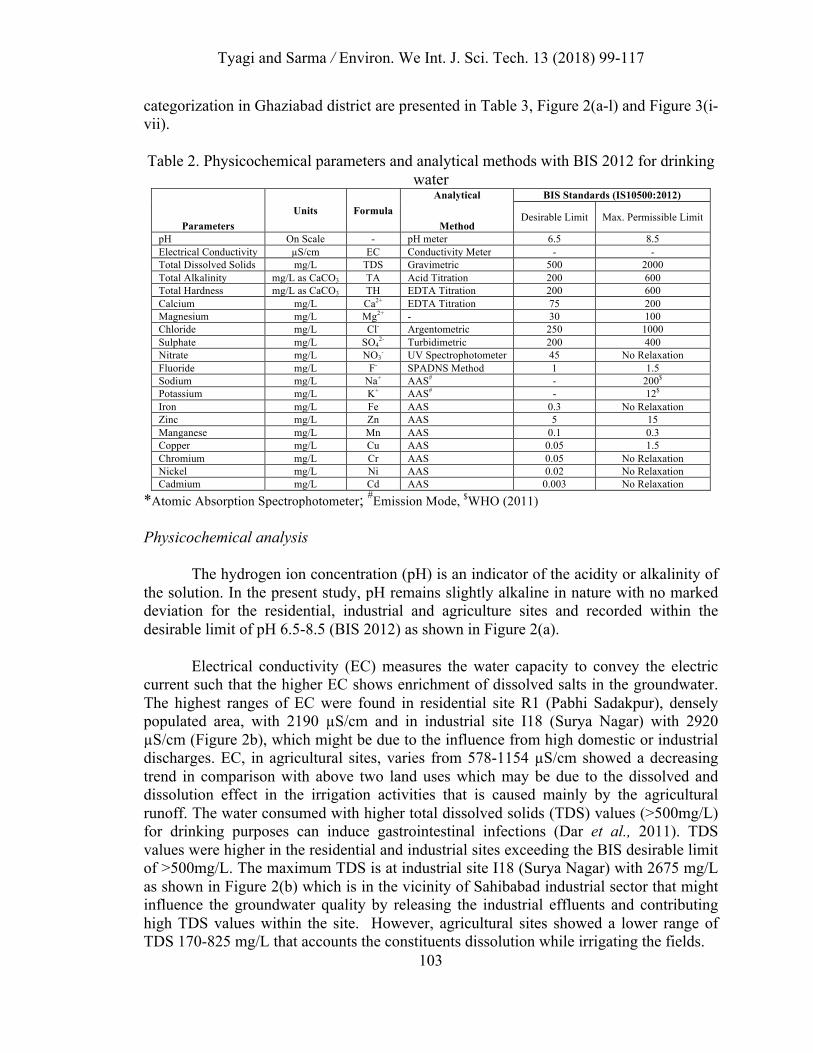
Table 2. Physicochemical parameters and analytical methods with BIS 2012 for drinking water
Parameters Units Formula
Analytical
Method
BIS Standards (IS10500:2012)
Desirable Limit Max. Permissible Limit
pH On Scale - pH meter 6.5 8.5 Electrical Conductivity µS/cm EC Conductivity Meter - - Total Dissolved Solids mg/L TDS Gravimetric 500 2000 Total Alkalinity mg/L as CaCO3 TA Acid Titration 200 600 Total Hardness mg/L as CaCO3 TH EDTA Titration 200 600 Calcium mg/L Ca2+ EDTA Titration 75 200 Magnesium mg/L Mg2+ - 30 100 Chloride mg/L Cl- Argentometric 250 1000 Sulphate mg/L SO4
2- Turbidimetric 200 400
Nitrate mg/L NO3- UV Spectrophotometer 45 No Relaxation
Fluoride mg/L F- SPADNS Method 1 1.5 Sodium mg/L Na+ AAS# - 200$
Potassium mg/L K+ AAS# - 12$
Iron mg/L Fe AAS 0.3 No Relaxation Zinc mg/L Zn AAS 5 15 Manganese mg/L Mn AAS 0.1 0.3 Copper mg/L Cu AAS 0.05 1.5 Chromium mg/L Cr AAS 0.05 No Relaxation Nickel mg/L Ni AAS 0.02 No Relaxation Cadmium mg/L Cd AAS 0.003 No Relaxation
*Atomic Absorption Spectrophotometer; #Emission Mode, $WHO (2011)
Physicochemical analysis
The hydrogen ion concentration (pH) is an indicator of the acidity or alkalinity of the solution. In the present study, pH remains slightly alkaline in nature with no marked deviation for the residential, industrial and agriculture sites and recorded within the desirable limit of pH 6.5-8.5 (BIS 2012) as shown in Figure 2(a).
Electrical conductivity (EC) measures the water capacity to convey the electric current such that the higher EC shows enrichment of dissolved salts in the groundwater. The highest ranges of EC were found in residential site R1 (Pabhi Sadakpur), densely populated area, with 2190 µS/cm and in industrial site I18 (Surya Nagar) with 2920 µS/cm (Figure 2b), which might be due to the influence from high domestic or industrial discharges. EC, in agricultural sites, varies from 578-1154 µS/cm showed a decreasing trend in comparison with above two land uses which may be due to the dissolved and dissolution effect in the irrigation activities that is caused mainly by the agricultural runoff. The water consumed with higher total dissolved solids (TDS) values (>500mg/L) for drinking purposes can induce gastrointestinal infections (Dar et al., 2011). TDS values were higher in the residential and industrial sites exceeding the BIS desirable limit of >500mg/L. The maximum TDS is at industrial site I18 (Surya Nagar) with 2675 mg/L as shown in Figure 2(b) which is in the vicinity of Sahibabad industrial sector that might influence the groundwater quality by releasing the industrial effluents and contributing high TDS values within the site. However, agricultural sites showed a lower range of TDS 170-825 mg/L that accounts the constituents dissolution while irrigating the fields.

Tyagi and Sarma / Environ. We Int. J. Sci. Tech. 13 (2018) 99-117
104
Total Alkalinity (TA) of groundwater rises due to presence of bicarbonate (HCO3), carbonate (CO3
2-) and hydroxide ions (OH-) and forms the acid neutralizing capacity of the water. The desirable limit of TA in water is 200 mg/L. The values of TA were greater in industrial areas with mean value of 390 mg/L as CaCO3 in comparison to residential; 362.5 mg/L as CaCO3 and agricultural sites 343.8 mg/L as CaCO3, but recorded within the permissible limit of 600 mg/L as CaCO3 (BIS, 2012).
Total Hardness (TH) of the groundwater is caused predominantly due to the presence of calcium (Ca2+) and magnesium (Mg2+) cations. The highest value of TH were recorded in the industrial site I18 (Surya Nagar) with 640 mg/L as CaCO3 as shown in Figure 2(d); exceeding the permissible limits of 600 mg/L as CaCO3 due to the industrial wastes discharges. The residential and agricultural sites recorded the values of 148-560 and 188-344 mg/L as CaCO3, respectively.. However, the values were found within the permissible limits (BIS, 2012). The presence of divalent cations such as Ca2+ and Mg2+ influence the hardness of drinking and irrigation water (Kumari et al., 2013). The observed calcium and magnesium ion were ranged between 36.87-112.2 mg/L and 13.66-95.60 mg/L in residential; 44.9-153.9 and 17.5-62.5 mg/L in industrial and 36.9-78.5 and 16.6-45.9 mg/L in agricultural sites, respectively. The values of Ca2+ and Mg2+cations in the three land use types were found within the given permissible limit of 200 mg/L and 100 mg/L respectively (BIS, 2012) as shown in Figure 2 (e) and (f).
Table 3 Statistical descriptions of physicochemical and heavy metals analysis based on land use
All the parameters are in mg/L units except pH (on scale), EC (µS/cm) and Total Hardness and Total Alkalinity (mg/L as CaCO3). SD: Standard deviation *N.D.: Not Detected
The sources of chloride (Cl-) include weathering, leaching from sedimentary rocks and soil; domestic and municipal effluents (Sarath Prasanth et al., 2012). In the study area, the chloride levels were highest at the industrial site I18 with 1053.7 mg/L (Figure 2g) recorded in the industrial vicinity of Surya Nagar which might be due to the
Parameters RESIDENTIAL INDUSTRIAL AGRICULTURE Range Mean SD Range Mean SD Range Mean SD
pH 7.22-7.90 7.48 0.20 7.4-7.7 7.51 0.13 7.4-7.76 7.53 0.13 EC 408-2190 1034.17 545.34 685-2920 1438 927.9 578-1154 762.6 182.9
TDS 280-1450 650.80 341.8 105-2675 886.6 917.3 170-825 451.3 219.5 TA 190-530 362.5 101.27 210-500 390 110.6 300-410 343.8 35.43 TH 148-560 298.33 126.59 232-640 367.3 149.4 188-344 282 62.37 Ca2+ 36.87-112.2 66.13 22.60 44.9-153.9 82.56 37.24 36.9-78.5 60.71 13.19 Mg2+ 13.66-95.60 32.53 23.20 17.5-62.5 39.4 16.02 16.6-45.9 32.09 9.63 Cl- 9.9-426 110.05 132.30 8.52-1053.6 274.2 413.5 7.1-71 31.42 26.48
SO42- 26.9-171.5 51.07 41.87 27.9-179.5 80.23 66 19.23-125.4 41.83 35.22
NO3- 0.32-37.1 6.17 10.05 0.59-3.66 2.05 1.36 0.15-5.9 1.92 1.88
F- 0.12-1.2 0.564 0.36 0.15-1.54 0.82 0.55 0.12-1.03 0.43 0.28 Na+ 21.18-313 134.05 93.89 134.04-528.7 246.03 155.5 80.8-209.3 135.9 37.62 K+ 9.26-25.69 15.15 4.3 12.03-55.9 26.3 17.54 11.63-18.34 15.77 2.34 Fe 0.01-19.49 2.36 5.7 0.03-0.76 0.23 0.28 0.03-3.9 0.77 1.28 Zn *N.D.-1.77 0.48 0.61 0.08-2.93 0.78 1.08 0.06-1.62 0.42 0.50 Mn 0.003-1.31 0.15 0.37 0.05-0.17 0.1 0.05 0.02-0.23 0.12 0.06 Cu 0.01-0.2 0.03 0.05 0.01-0.03 0.02 0.008 0.01-0.026 0.016 0.005 Cr 0.005-0.04 0.02 0.01 0.002-0.06 0.032 0.02 0.002-0.003 0.016 0.012 Ni 0.02-0.10 0.07 0.02 0.033-0.11 0.06 0.03 0.04-0.097 0.078 0.017 Cd N.D.-0.02 0.01 0.01 N.D.-0.016 0.007 0.01 N.D.-0.016 0.013 0.005

Tyagi and Sarma / Environ. We Int. J. Sci. Tech. 13 (2018) 99-117
105
leaching of salts fromanthropogenic industrial based activities as it is majorly occupied by several chemical, food processing, electrical units etc. Higher concentrations of Cl- induce a salty taste in water. The value of Cl- ranges with 9.9-426 mg/L and 7.1-71 mg/L in residential and agriculture, respectively and within the permissible range of 1000 mg/L (BIS 2012).
Sulphate (SO42-) concentrations greater than 400 mg/L leads to laxative effect on
human organs. The three land use types of residential, industrial and agricultural sites having sulphate levels were found within the maximum limits of 400 mg/L (BIS 2012) and varies from 26.9-171.5 mg/L, 27.9-179.5 mg/L and 19.23-125.4mg/L, respectively as shown in Figure 2(h).
Nitrate (NO3-) contamination is a major problem in groundwater systems and
higher concentrations likely to cause diseases such as methemoglobinemia, gastric cancer, thyroid disease and diabetes (Krishna Kumar et al., 2011). Nitrate concentration exceeds in groundwater as the resultant of domestic wastewater discharge and usage of fertilizers. The values of nitrate in the groundwater vary from 0.32-37.1mg/L, 0.59-3.66 mg/L and 0.15-5.9 mg/L for residential, industrial and agriculture, respectively. All the respective samples were within the permissible limits of 45 mg/L as per BIS 2012 (Figure 2i).
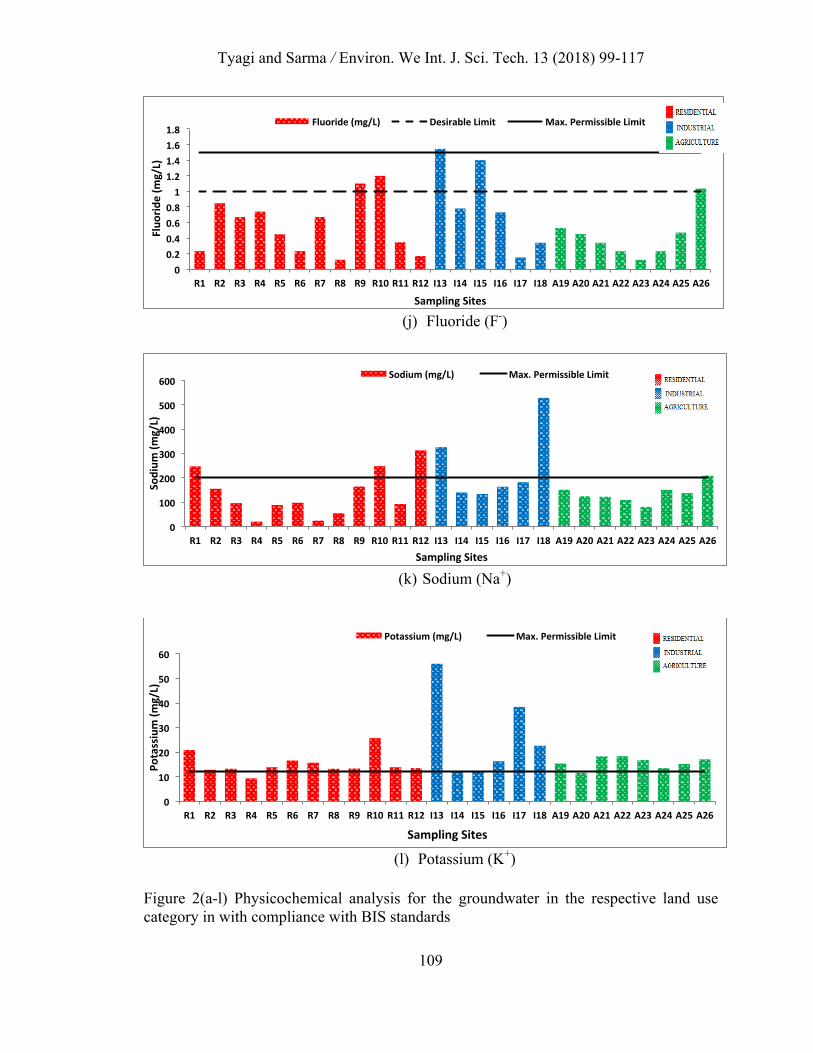
Fluoride (F-) element required in trace amounts for the development of teeth and bones, however, exposure to higher values of F- greater than 1.5 mg/L causes fluorosis. The maximum values of F- found in the industrial sites ranges from 0.15-1.54 mg/L crossing the permissible limits of 1.5 mg/L. The residential (0.12-1.2 mg/L) and agriculture (0.12-1.03 mg/L) sites indicated the values within the permissible limits. Some anthropogenic activities also contribute to the large amount of fluoride. The highest value of fluoride found at site I13 (Balram Nagar) where several stone crushing and steel and iron industrial units prominent (Figure 2j).
Sodium (Na+) cation accounts approximately 53 to 69% of the total cations in the natural water due to the silicate weathering and/or dissolution of salts that are retained by the action of evaporation, human and agricultural activities and poor drainage systems (Krishna Kumar et al., 2015). It also regulates and maintains the fluid balance of the human body and their higher uptakes by the consumer induce physiological changes. The concentration of Na+ varied from 21.18-313 mg/L (residential), 134.04-528.7 mg/L (industrial) and 80.8-209.3 mg/L (agriculture) and these elevated concentrations of Na+
exceeding the permissible limits of 200 mg/L (WHO 2011) for sites R1, R10, R12, I13, I18 and A26 as shown in Figure 2(k). The residential sites of R1(Pabhi Sadakpur) and R10 (Palauta) are densely populated and involves in small agriculture fields that might induce combined effect of salts discharge at higher proportions. For R12 (Vasundara) is a densely populated residential sectors and the improper waste disposal was encountered at the site. As sites I13 and I18 are the prominent industrial locations within the district, releasing the untreated effluents caused the increasing concentration of Na+ other than the natural sources.

Tyagi and Sarma / Environ. We Int. J. Sci. Tech. 13 (2018) 99-117
106
Potassium (K+) is a naturally occurring element that found in lesser quantities as compared to Ca2+, Mg2+ and Na+. It sustains the plant physiology and controls the metabolism in human being. The value of K+ in the study area for residential and agriculture sites were 9.26-25.69 mg/L and 11.63-18.34 mg/L as compared with industrial sites showed higher ranges of the K+ of 12.03-55.60 mg/L. About 84% of the samples crossed the permissible limit of 12 mg/L (WHO, 2011) as shown in Figure 2(l), which indicates the potassium forms of complexes and also found as an important constituent in rocks and fertilizers. Potassium water softeners are being used replacing the sodium water softeners as an insight that potassium is beneficial for the health (Kumari et al., 2013). The higher concentrations of Na+ and K+ in the groundwater may also originate from mineralogical soil, cation-exchange process and particularly from agriculture and industrial activities discharges. Eventually, the higher concentrations of Na+ and K+ in the groundwater increase in the residence time.
In the above land use category, the residential sites showed all the physicochemical water quality parameters within the max. permissible limits except EC that was recorded highest at site R1(Pabhi Sadakpur). Similarly, for the agricultural sites, all the quality parameters were within the range of permissible limits. However, for the industrial areas of the Ghaziabad district, sites I13 (EC and F-) and I18 (EC, TH, Cl-) exceeded the limits, which show the influence of the improper discharging from the industrial units.
(a) pH
(b) Electrical Conductivity (EC) and Total Dissolved Solids (TDS)
0
5
10
R1 R2 R3 R4 R5 R6 R7 R8 R9 R10R11R12 I13 I14 I15 I16 I17 I18 A19A20A21A22A23A24A25A26
pH
SamplingSites
pH DesirableLimit Max.PermissibleLimit
0
1000
2000
3000
4000
R1 R2 R3 R4 R5 R6 R7 R8 R9R10R11R12I13 I14 I15 I16 I17 I18A19A20A21A22A23A24A25A26EC(µ
S/cm
)and
TDS
(mg/L)
SamplingSites
ElectricalConductivity(µS/cm) TotalDissolvedSolids(mg/L)

Tyagi and Sarma / Environ. We Int. J. Sci. Tech. 13 (2018) 99-117
107
(c) Total Alkalinity (TA)
(d) Total Hardness (TH)
(e) Calcium (Ca2+)
(f) Magnesium (Mg2+)
0200400600800
R1 R2 R3 R4 R5 R6 R7 R8 R9R10R11R12I13 I14 I15 I16 I17 I18A19A20A21A22A23A24A25A26
TotalA
lkalinity
(mg/Las
CaCO
3)
SamplingSites
Alkalinity(mg/LasCaCO3) DesirableLimitMax.PermissibleLimit
0
200
400
600
800
R1 R2 R3 R4 R5 R6 R7 R8 R9R10R11R12I13 I14 I15 I16 I17 I18A19A20A21A22A23A24A25A26
TotalH
ardn
ess,(m
g/Las
caCO
3)
SamplingSites
TotalHardness(mg/LasCaCO3) DesirableLimitMax.PermissibleLimit
0
50
100
150
200
250
R1 R2 R3 R4 R5 R6 R7 R8 R9R10R11R12I13 I14 I15 I16 I17 I18A19A20A21A22A23A24A25A26
Calcium(m
g/L)
SamplingSites
Calcium(mg/L) DesirableLimit Max.PermissibleLimit
0
50
100
150
R1 R2 R3 R4 R5 R6 R7 R8 R9 R10R11R12I13 I14 I15 I16 I17 I18A19A20A21A22A23A24A25A26
Magne
sium
(mg/L)
SamplingSites
Magnesium(mg/L) DesirableLimit Max.PermissibleLimit

Tyagi and Sarma / Environ. We Int. J. Sci. Tech. 13 (2018) 99-117
108
(g) Chloride (Cl-)
(h) Sulphate (SO4
2-)
(i) Nitrate (NO3
-)
0
100
200
300
400
500
R1 R2 R3 R4 R5 R6 R7 R8 R9 R10R11R12 I13 I14 I15 I16 I17 I18A19A20A21A22A23A24A25A26
Sulpha
te(m
g/L)
SamplingSites
Sulphate(mg/L) DesirableLimit Max.PermissibleLimit
0
10
20
30
40
50
R1 R2 R3 R4 R5 R6 R7 R8 R9 R10R11R12 I13 I14 I15 I16 I17 I18 A19A20A21A22A23A24A25A26
Nitrate(m
g/L)
SamplingSites
Nitrate(mg/L) PermissibleLimit
0
200
400
600
800
1000
1200
R1 R2 R3 R4 R5 R6 R7 R8 R9 R10R11R12 I13 I14 I15 I16 I17 I18 A19A20A21A22A23A24A25A26
Chlorid
e(m
g/L)
SamplingSites
Chloride(mg/L) DesirableLimit Max.PermissibleLimit
Tyagi and Sarma / Environ. We Int. J. Sci. Tech. 13 (2018) 99-117
109
(j) Fluoride (F-)
(k) Sodium (Na+)
(l) Potassium (K+)
Figure 2(a-l) Physicochemical analysis for the groundwater in the respective land use category in with compliance with BIS standards
00.20.40.60.81
1.21.41.61.8
R1 R2 R3 R4 R5 R6 R7 R8 R9 R10R11R12 I13 I14 I15 I16 I17 I18 A19A20A21A22A23A24A25A26
Fluo
ride(m
g/L)
SamplingSites
Fluoride(mg/L) DesirableLimit Max.PermissibleLimit
0
100
200
300
400
500
600
R1 R2 R3 R4 R5 R6 R7 R8 R9 R10R11R12 I13 I14 I15 I16 I17 I18 A19A20A21A22A23A24A25A26
Sodium
(mg/L)
SamplingSites
Sodium(mg/L) Max.PermissibleLimit
0
10
20
30
40
50
60
R1 R2 R3 R4 R5 R6 R7 R8 R9 R10R11R12 I13 I14 I15 I16 I17 I18 A19A20A21A22A23A24A25A26
Potassium(m
g/L)
SamplingSites
Potassium(mg/L) Max.PermissibleLimit

Tyagi and Sarma / Environ. We Int. J. Sci. Tech. 13 (2018) 99-117
110
Heavy metals analysis
Iron (Fe) is observed as the key metal in groundwater samples and the higher concentration of Fe was found in the residential sites (0.01-19.49 mg/L). Rusting of the pipes and/or hand pumps might contribute to presence of Fe in the groundwater. However, Fe is predominantly found as the natural element in the Earth surface and can be involved as the geogenic in the nature. Moreover, the values of Fe for the industrial sites (0.03-0.76 mg/L) and agricultural areas (0.03-3.9 mg/L) were also exceeding the permissible limit of 0.3 mg/L (BIS 2012). Similar results were reported by Singh et al. (2014). The interaction of oxidized Fe bearing minerals and dissolution of Fe2CO3 might be the reason for iron contamination in the groundwater. About, 34% of the groundwater samples were exceeding the permissible limit (Figure 3i). The mean concentration of Zinc (Zn) in residential with 0.48 mg/L, industrial with 0.78 mg/L and in agricultural sites with 0.42 mg/L; were found within the safe limits of 5 mg/L (BIS 2012) as shown in Figure 3(ii).
The concentration of Manganese (Mn) in residential areas ranging from 0.003-1.31 mg/L was within the permissible limit of 0.3 mg/L. The highest value of Mn was recorded at site R1 (Pabhi Sadakpur) shown in Figure 3(iii) and shows the proximity to major urban disposal sites as it is densely populated area. The levels were safe for industrial (0.05-0.17 mg/L) and agricultural sites (0.02-0.23 mg/L). According to Kumari et al. (2013) Mn stimulates the Fe bearing bacteria in the groundwater.
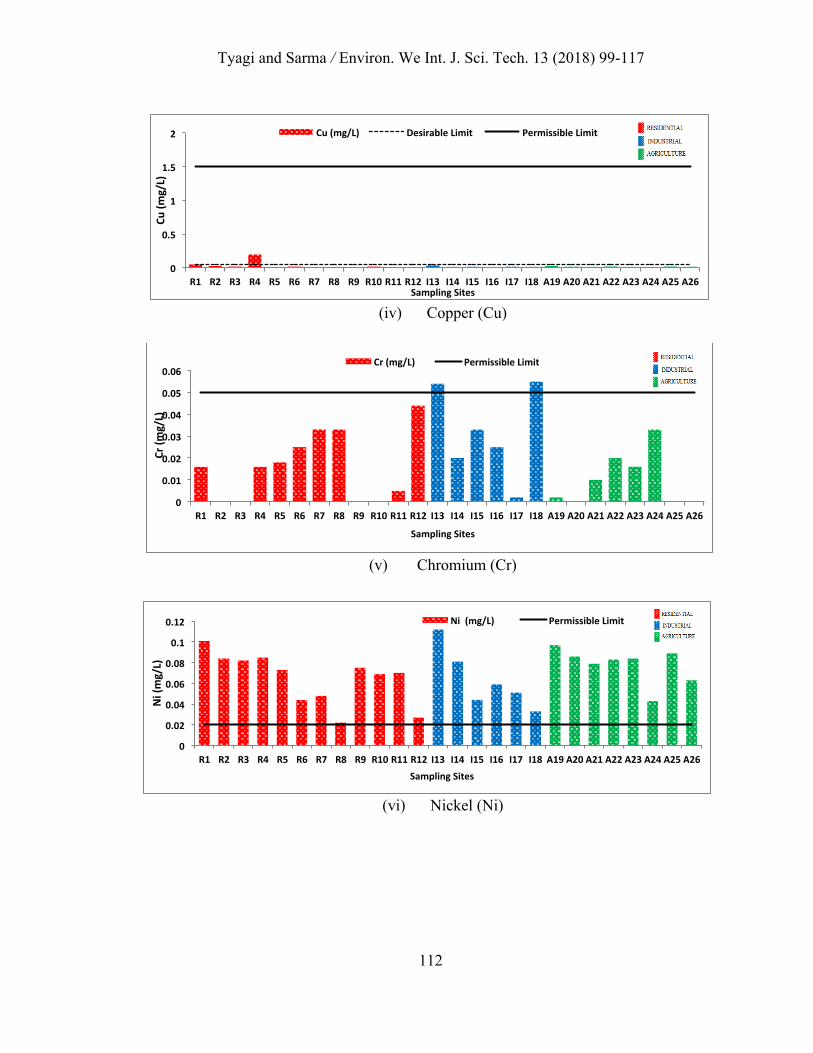
The heavy metals such as copper (Cu) and chromium (Cr) are the essential elements required in trace amounts but in excess amounts, leads to toxicity. However, Cu and Cr are found within their permissible limit of 1.5 mg/L and 0.05 mg/L respectively, (BIS 2012) shown in Figure 3(iv) and 3(v). Cu values range from 0.01-0.2 mg/L, 0.01-0.03 mg/L and 0.01-0.026 mg/L in residential, industrial and agricultural sites, respectively. Similarly, Cr is discharged predominantly from dye and paints pigments, wood preservatives and used in the metal alloys. Cr values vary from 0.005-0.04 mg/L in residential and 0.002-0.003 mg/L in agricultural sitesand were within the safe limits of 0.5 mg/L. However, higher amounts of Cr with 0.06 mg/L were observed in industrial sites I13 (Balram Nagar) and I18 (Surya Nagar), which is due to the improper waste disposal in the proximity of industrial sites.
Nickel (Ni) is mainly used in the production of stainless steel and nickel alloys. The safe limit for Ni concentration is 0.02 mg/L (BIS 2012) and exceeded in residential with mean values of 0.07 mg/L, 0.06 in agricultural 0.078mg/L and industrial sites having 0.06 mg/L. The exceeding values of Ni were found in all the samples for each type of land use (Figure 3vi); which might be due to the dissolution of the Ni bearing rocks and geo-genic process. Similar results were reported by Chabukdhara et al. (2017) for urban and peri-urban sites and Kumari et al. (2013) for industrial sites of Ghaziabad district. Also, leaching of Ni from some hand pumps could be the reason as mainly they are made up of stainless steel.

Tyagi and Sarma / Environ. We Int. J. Sci. Tech. 13 (2018) 99-117
111
Cadmium (Cd) is highly toxic metal if ingested in trace amounts as it gets accumulated mainly in liver and kidneys on exposure (Chabukdhara et al., 2017). The mean concentration of Cd was higher with mean values in residential (0.01mg/L), industrial (0.007 mg/L) and agricultural sites (0.013 mg/L) i.e., about 69% of the samples were exceeding the permissible limits 0.003 mg/L (BIS 2012) as shown in Figure 2(vii). The prominent sources of Cd are steel industries, batteries and plastic industries. Wastewater pollution, fertilizers and local air pollution also cause Cd contamination of groundwater, which could be the reason for the increasing value of Cd in the region.
(i) Iron (Fe)
(ii) Zinc (Zn)
(iii) Manganese (Mn)
0
5
10
15
20
25
R1 R2 R3 R4 R5 R6 R7 R8 R9 R10R11R12 I13 I14 I15 I16 I17 I18 A19A20A21A22A23A24A25A26
Fe(m
g/L)
SamplingSites
Fe(mg/L) PermissibleLimit
0
5
10
15
20
R1 R2 R3 R4 R5 R6 R7 R8 R9 R10R11R12 I13 I14 I15 I16 I17 I18 A19A20A21A22A23A24A25A26
Zn(m
g/L)
SamplingSites
Zn(mg/L) DesirableLimit PermissibleLimit
0
0.2
0.4
0.6
0.8
1
1.2
1.4
R1 R2 R3 R4 R5 R6 R7 R8 R9 R10R11R12 I13 I14 I15 I16 I17 I18 A19A20A21A22A23A24A25A26
Mn(m
g/L)
SamplingSites
Mn(mg/L) DesirableLimit PermissibleLimit
Tyagi and Sarma / Environ. We Int. J. Sci. Tech. 13 (2018) 99-117
112
(iv) Copper (Cu)
(v) Chromium (Cr)
(vi) Nickel (Ni)
0
0.5
1
1.5
2
R1 R2 R3 R4 R5 R6 R7 R8 R9 R10R11R12 I13 I14 I15 I16 I17 I18 A19A20A21A22A23A24A25A26
Cu(m
g/L)
SamplingSites
Cu(mg/L) DesirableLimit PermissibleLimit
0
0.01
0.02
0.03
0.04
0.05
0.06
R1 R2 R3 R4 R5 R6 R7 R8 R9 R10R11R12 I13 I14 I15 I16 I17 I18 A19A20A21A22A23A24A25A26
Cr(m
g/L)
SamplingSites
Cr(mg/L) PermissibleLimit
0
0.02
0.04
0.06
0.08
0.1
0.12
R1 R2 R3 R4 R5 R6 R7 R8 R9 R10R11R12 I13 I14 I15 I16 I17 I18 A19A20A21A22A23A24A25A26
Ni(mg/L)
SamplingSites
Ni(mg/L) PermissibleLimit

Tyagi and Sarma / Environ. We Int. J. Sci. Tech. 13 (2018) 99-117
113
(vii) Cadmium (Cd)
Figure3 (i-vii). Heavy metals analysis for the groundwater samples for the respective land use category in compliance with BIS standards
Evaluation through Ground Water Quality Index (GWQI)
Ground Water Quality Index (GWQI) is one of the effective tools for assessing theinclusive quality of water. In order to determine the suitability for the drinking purposes, GWQI is calculated by the following formula (Asadi et al., 2007).
GWQI = 𝑨𝒏𝒕𝒊𝒍𝒐𝒈[ 𝑾𝒏!𝟏𝒏 𝐥𝐨𝐠𝟏𝟎 𝒒𝒏],
where, Wn = Weightage factor calculated as follow, Wn = K/Sn K = Proportionality constant derived from following equation;
𝐊 = 𝟏/ 𝟏/𝑺𝒊𝒏𝒏!𝟏 ,
where, Si and Snare recommended drinking water standards as per BIS.
Quality rating; qn= [{(Va – Vi) / (Vs – Vi) x 100}],
Where, qni= Quality rating of the ith parameter for total n parameters, Va = Value of the parameter obtained from actual laboratory experiment Vi = Value of the parameter from the standard. The value taken for pH = 7 and for other parameters it is zero. Vs = BIS standard value for the respective parameter (Table 3).
00.0020.0040.0060.0080.010.0120.0140.0160.0180.02
R1 R2 R3 R4 R5 R6 R7 R8 R9 R10R11R12 I13 I14 I15 I16 I17 I18A19A20A21A22A23A24A25A26
Cd(m
g/L)
SamplingSites
Cd(mg/L) PermissibleLimit
Tyagi and Sarma / Environ. We Int. J. Sci. Tech. 13 (2018) 99-117
114
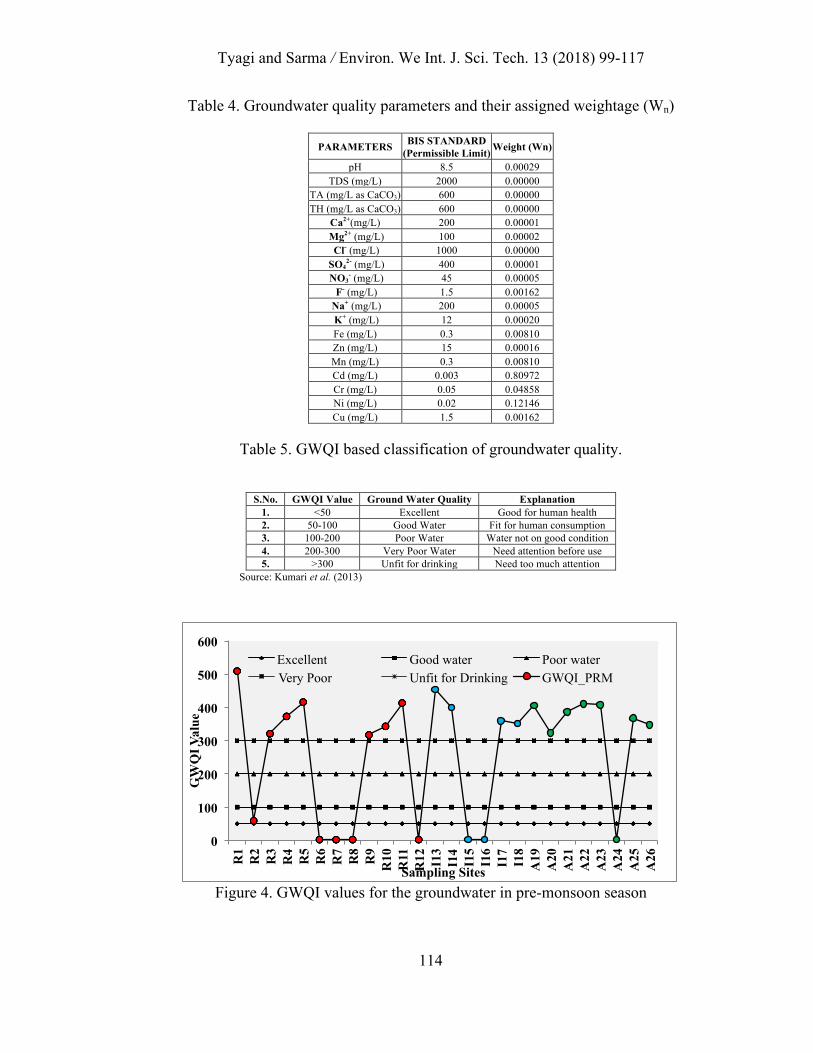
Table 4. Groundwater quality parameters and their assigned weightage (Wn)
PARAMETERS BIS STANDARD (Permissible Limit) Weight (Wn)
pH 8.5 0.00029 TDS (mg/L) 2000 0.00000
TA (mg/L as CaCO3) 600 0.00000 TH (mg/L as CaCO3) 600 0.00000
Ca2+(mg/L) 200 0.00001 Mg2+ (mg/L) 100 0.00002 Cl- (mg/L) 1000 0.00000
SO42- (mg/L) 400 0.00001
NO3- (mg/L) 45 0.00005
F- (mg/L) 1.5 0.00162 Na+ (mg/L) 200 0.00005 K+ (mg/L) 12 0.00020 Fe (mg/L) 0.3 0.00810 Zn (mg/L) 15 0.00016 Mn (mg/L) 0.3 0.00810 Cd (mg/L) 0.003 0.80972 Cr (mg/L) 0.05 0.04858 Ni (mg/L) 0.02 0.12146 Cu (mg/L) 1.5 0.00162
Table 5. GWQI based classification of groundwater quality.
S.No. GWQI Value Ground Water Quality Explanation
1. <50 Excellent Good for human health 2. 50-100 Good Water Fit for human consumption 3. 100-200 Poor Water Water not on good condition 4. 200-300 Very Poor Water Need attention before use 5. >300 Unfit for drinking Need too much attention
Source: Kumari et al. (2013)
Figure 4. GWQI values for the groundwater in pre-monsoon season
0
100
200
300
400
500
600
R1
R2
R3
R4
R5
R6
R7
R8
R9
R10
R
11
R12
I1
3 I1
4 I1
5 I1
6 I1
7 I1
8 A
19
A20
A
21
A22
A
23
A24
A
25
A26
GW
QI V
alue
Sampling Sites
Excellent Good water Poor water Very Poor Unfit for Drinking GWQI_PRM

Tyagi and Sarma / Environ. We Int. J. Sci. Tech. 13 (2018) 99-117
115
The groundwater quality was classified into excellent, good water, poor water, very poor and unfit for drinking categories based on the GWQI values (Table 5). Based on the classification, about 69% of the groundwater samples found unfit for drinking category and overall groundwater quality is not potable (Table 6). The study area of Ghaziabad district is immensely polluted from the industrial and rapid urbanization. The inclusive study of impact of land use based on residential, industrial and agricultural sites influence the groundwater and its quality. Some of the sites within the region showed excellent water, which could be the reason as no respective parameter, is exceeding the limits of BIS 2012. These sites are also affected by the industrial effluent and wastes discharges from densely populated sites.
Table 6. GWQI value for the respective sites in Ghaziabad district
Site Location Name Ground Water Quality Index GWQI VALUE GWI QUALITY
R1 Pabhi Sadakpur 509.33 Unfit for Drinking R2 Jawali 59.33 Good Water R3 Farukh Nagar 321.48 Unfit for Drinking R4 Niwari Village 373.11 Unfit for Drinking R5 Khindora 415.81 Unfit for Drinking R6 Duhai 2.48 Excellent R7 Ghaziabad City 2.51 Excellent R8 Nahal 2.23 Excellent R9 Santpura 316.96 Unfit for Drinking
R10 Palauta 343.64 Unfit for Drinking R11 SikriKhurd 413.71 Unfit for Drinking R12 Vasundara 2.42 Excellent I13 Balram Nagar 453.84 Unfit for Drinking I14 Muradnagar Ordinance Factory 399.58 Unfit for Drinking I15 Guldhar 2.58 Excellent Water I16 Makraida 2.58 Excellent Water I17 Kalchhina 359.66 Unfit For Drinking I18 Surya Nagar 351.44 Unfit For Drinking A19 Manduala Village 405.60 Unfit For Drinking A20 Chirauri 324.04 Unfit for Drinking A21 Didoli 386.81 Unfit For Drinking A22 Nekpur 410.96 Unfit For Drinking A23 Kakra 407.19 Unfit For Drinking A24 Sadikpur 2.50 Excellent A25 Khanjarpur 367.96 Unfit For Drinking A26 Muradabad 347.70 Unfit For Drinking
Conclusion
The present study investigated the status of groundwater quality of Ghaziabad district of Uttar Pradesh based on the land use types. The higher concentrations of the major physicochemical and heavy metals such as EC, TDS, TH, Cl-, F- , major cations (Na+ and K+); Fe, Cd and Ni are degrading the quality of groundwater through the major influence of emerging urbanization and industrialization. The elevated levels of various constituents direct the dominance of anthropogenic activities within the region. The quality of groundwater was examined for the drinking purposes in compliance with BIS 2012 standards by integrating the GWQI, which offers the inclusive property of drinking water quality. Results revealed that about 69% of the samples were in the category of unfit for drinking. An immediate attention should be given in order to reduce the

Tyagi and Sarma / Environ. We Int. J. Sci. Tech. 13 (2018) 99-117
116
contamination through land use activities and heavy metals pollution loading need to be checked especially for Fe, Cd and Ni for the shallow and deep aquifer levels.
Acknowledgement: The authors wish to acknowledge the financial support by providing scholarship and laboratory facility from USEM, GGS Indraprastha University, Delhi.
Authors Contribution: Shipra Tyagi (Ph.D. Scholar) performed the research work, data collection and writing of the manuscript; Kiranmay Sarma (Associate Professor) is the corresponding author of the manuscript and contributed to editing of the manuscript.
Reference
APHA, AWWA and WEF, 2005, Standard Methods for the Examination of Water and Waste water, 21st ed. American Public Health Association, Washington, D.C.
Asadi, S.S., Vuppala, P., Reddy, M.A., 2007. Remote Sensing and GIS Techniques for Evaluation of Groundwater Quality in Municipal Corporation of Hyderabad (Zone-V), India. Public Health, 4, 45–52.
BIS, 2012. Bureau of Indian Standard Specification for Drinking Water. IS:10500:2012. (Second Revision). BIS, New Delhi.
Bodrud-Doza, M., Islam, A.R.M.T., Ahmed, F., Das, S., Saha, N., Rahman, M.S., 2016. Characterization of groundwater quality using water evaluation indices, multivariate statistics and geostatistics in Central Bangladesh. Water Science, 30(1), 19–40.
Bordalo, A.A., Teixeira, R., Wiebe, W.J., 2006. A Water Quality Index Applied to an International Shared River Basin: The Case of the Douro River. Environmental Management, 38(6), 910–920.
CGWB, 2009. Central Groundwater Board, Groundwater Brochure of Ghaziabad District, U.P. Online at: http://cgwb.gov.in/District_Profile/UP/Ghaziabad.pdf. Accessed at: 11 April 2018.
Chabukdhara, M., Gupta, S.K., Kotecha, Y., Nema, A.K., 2017. Groundwater quality in Ghaziabad district, Uttar Pradesh, India: Multivariate and health risk assessment. Chemosphere, 179, 167–178.
Dar, M.A., Shankar, K., Dar, I.A., 2011. Fluoride contamination in ground water: in major challenge. Environmental Monitoring Assessment, 173(1–4), 955–968.
Industries at Ghaziabad. Online at: http://ghaziabad.nic.in/industry.htm. Access at: 11 April 2018 Gupta, P., Sarma, K., 2013. Evaluation of groundwater quality and depth with respect to different land
covers in Delhi, India. International Journal of Applied Sciences and Engineering Research, 2(6), 630-643.
Kumari, S., Singh, A.K., Verma, A.K., Yaduvanshi, N.P.S., 2013. Assessment and spatial distribution of groundwater quality in industrial areas of Ghaziabad, India. Environmental Monitoring Assessment, 186, 501–514.
Krishna Kumar, S., Chandrasekar, N., Seralathan, P., Godson, Prince S., Magesh, N.S., 2011. Hydrogeochemical study of shallow carbonate aquifers, Rameswaram Island, India. Environmental Monitoring Assessment, 184, 4127–4138. .,
Krishna Kumar, S., Logeshkumaran, A., Magesh, N.S., Godson, Prince S., Chandrasekar, N., 2015. Hydro-geochemistry and application of water quality index (WQI) for groundwater quality assessment, Anna Nagar, part of Chennai City, Tamil Nadu, India. Applied Water Science, 5(4), 335-343.
Lerner, D.N., Harris, B., 2009. The relationship between land use and groundwater resources and quality. Land use policy, 26(S1), S265–S273.
Ouyang, Y., 2011. Estimation of shallow groundwater discharge and nutrient load into a river. Ecological Engineering, 38(1), 101–104.
Sarath Prasanth, S.V., Magesh, N.S., Jitheshlal K.V., Chandrasekar, N., 2012. Evaluation of groundwater quality and its suitability for drinking and agricultural use in the coastal stretch of Alappuzha District, Kerala, India. Applied Water Science, 2(3), 165–175.
Singh, P.K., Tiwari, A.K., Panigary, B.P., Mahato, M.K., 2013. Water Quality Indices Used for Water Resources Vulnerability Assessment Using GIS Technique: A Review. International Journal of Earth Sciences and Engineering, 6(1), 1594–1600.
Singh, U.V., Abhishek, A., Singh, K.P., Dhakate, R., Singh, N.P., 2014. Groundwater quality appraisal and

Tyagi and Sarma / Environ. We Int. J. Sci. Tech. 13 (2018) 99-117
117
its hydrochemical characterization in Ghaziabad (a region of indo-gangetic plain), Uttar Pradesh, India. Applied Water Science, 4(2), 145–157.
Singh, V.K., Bikundia, D.S., Sarswat, A., Mohan, D., 2012. Groundwater quality assessment in the village of Lutfullapur Nawada, Loni, District Ghaziabad, Uttar Pradesh, India. Environmental Monitoring Assessment, 184(7), 4473–4488.
Vasanthavigar, M., Srinivasamoorthy, K., Vijayaragavan, K., Rajiv Ganthi, R., Chidambaram, S., Anandhan, P., Manivannan, R., Vasudevan, S., 2010. Application of water quality index for groundwater quality assessment: Thirumanimuttar sub-basin, Tamilnadu, India. Environmental Monitoring Assessment, 171, 595–609.
WHO, 2011. Guidelines for Drinking-water Quality, fourth ed. World Health Organization, Geneva, Switzerland.
Related Documents