Assessment of Future Water Resources Sustainability Based on 4 National Taps of Singapore National University of Singapore Faculty of Engineering Department of Civil & Environmental Engineering Supervisor: Dr. Pat Yeh By: Foo Chiou Looi (A0099005E)

Welcome message from author
This document is posted to help you gain knowledge. Please leave a comment to let me know what you think about it! Share it to your friends and learn new things together.
Transcript
Assessment of Future Water Resources
Sustainability Based on 4 National Taps
of Singapore
National University of Singapore
Faculty of Engineering
Department of Civil & Environmental
Engineering
Supervisor: Dr. Pat Yeh
By: Foo Chiou Looi (A0099005E)
Copyright National University of Singapore
CONTENT
2
1. Introduction
• Water resources situation around the world
• Research motivation
• Methodology
2. Water resources in Singapore
• The first tap: local catchment water
• The second tap: imported water
• The third tap: NEWater
• The fourth tap: desalinated water
• Estimated production costs
• Alternate sources of water
• Potential future water supply
3. Water demand in Singapore
4. Water sustainability
Copyright National University of Singapore
CONTENT
3
5. Estimated future water demand
• Domestic
• Non-domestic
• Estimated future daily demand
6. Estimated future supply
7. Sustainability index
8. Discussion
• Future demand
• Future supply
9. Conclusion
Copyright National University of Singapore
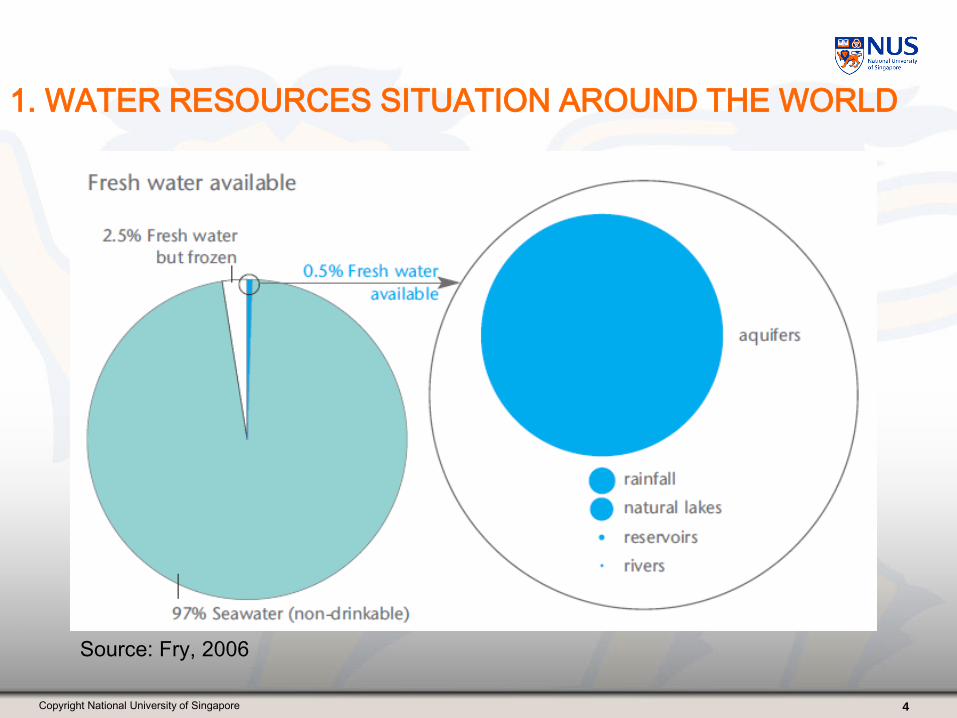
1. WATER RESOURCES SITUATION AROUND THE WORLD
4
Source: Fry, 2006
Copyright National University of Singapore
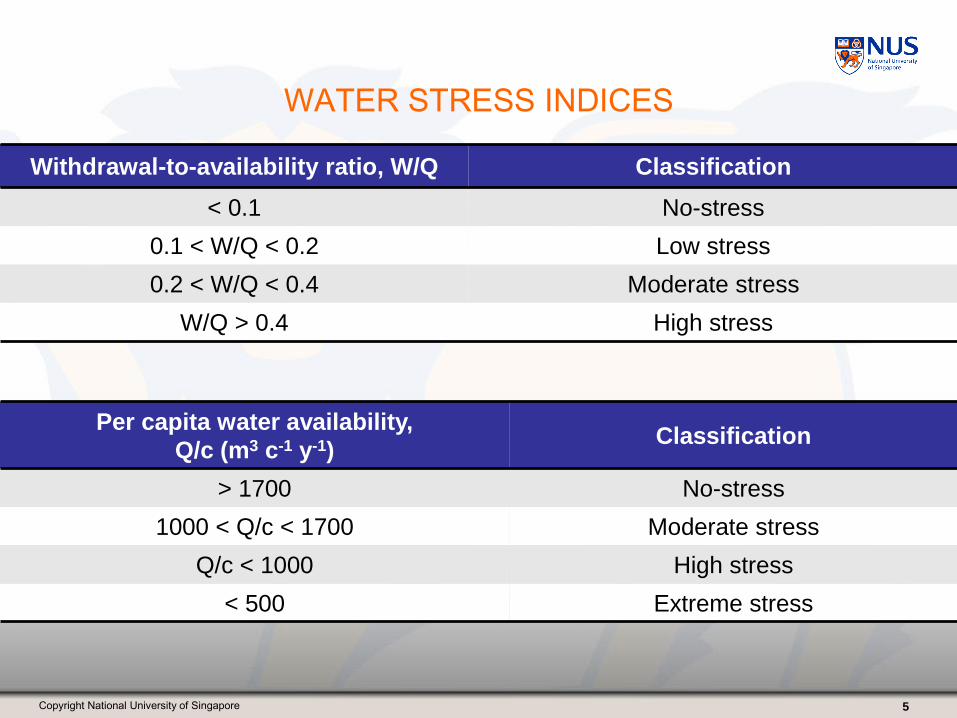
WATER STRESS INDICES
5
Withdrawal-to-availability ratio, W/Q Classification
< 0.1 No-stress
0.1 < W/Q < 0.2 Low stress
0.2 < W/Q < 0.4 Moderate stress
W/Q > 0.4 High stress
Per capita water availability,
Q/c (m3 c-1 y-1)Classification
> 1700 No-stress
1000 < Q/c < 1700 Moderate stress
Q/c < 1000 High stress
< 500 Extreme stress
Copyright National University of Singapore
WATER RESOURCES SITUATION: ASIA AND SINGAPORE
6
• Asia: lowest per capita availability of fresh water
• Central Asia and parts of Southeast Asia: “high water stress”
• Q/c: 110.9m3/year high water stress
• Mean annual rainfall: 2400mm > global average of 1050mm
• Challenges: limited land space, no natural aquifers and lakes to collect
rainwater
• PUB: Four National Taps
Copyright National University of Singapore
RESEARCH MOTIVATION
7
• Sustainability: “development that meets the needs of the present without
compromising the ability of future generations to meet their own needs”
• Dry weather: increase in water demand, affects catchment volume available
• Second tap: not very stable due to the complexity of the relationship
between Singapore and Malaysia
• Third and fourth taps: higher production costs, energy-intensive
Copyright National University of Singapore
METHODOLOGY
8
• Aim: to assess the sustainability of the water resources in Singapore
• Estimated future supply of each tap
• Focus: processes of NEWater and desalination
• Estimated future demand
Copyright National University of Singapore
2. WATER RESOURCES IN SINGAPORE
LOCAL CATCHMENT
9
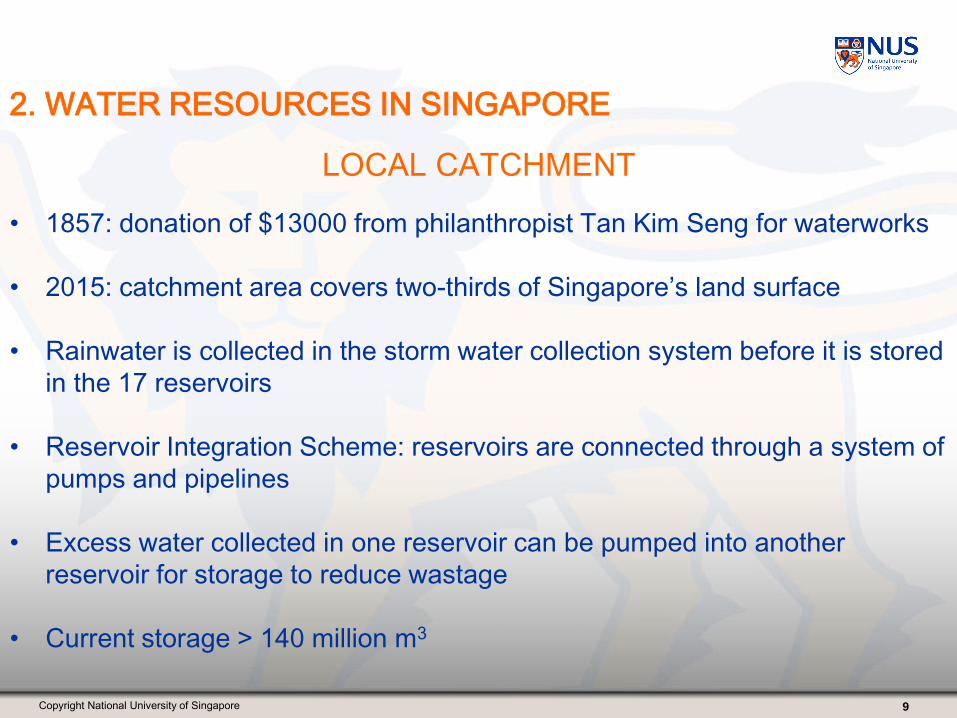
• 1857: donation of $13000 from philanthropist Tan Kim Seng for waterworks
• 2015: catchment area covers two-thirds of Singapore’s land surface
• Rainwater is collected in the storm water collection system before it is stored
in the 17 reservoirs
• Reservoir Integration Scheme: reservoirs are connected through a system of
pumps and pipelines
• Excess water collected in one reservoir can be pumped into another
reservoir for storage to reduce wastage
• Current storage > 140 million m3
Copyright National University of Singapore
IMPORTED WATER
10
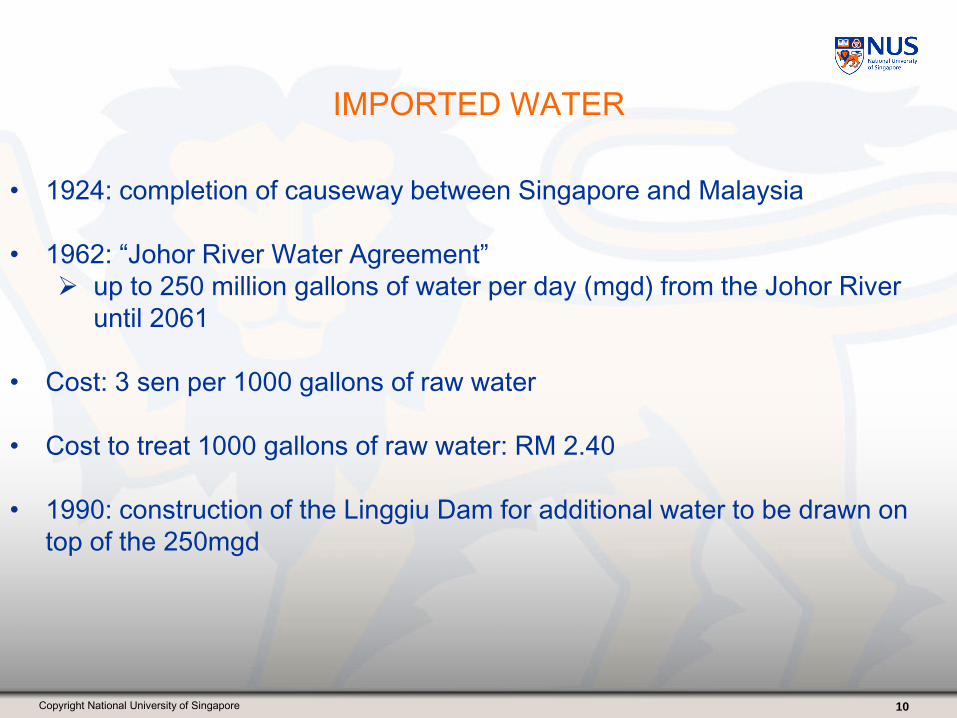
• 1924: completion of causeway between Singapore and Malaysia
• 1962: “Johor River Water Agreement”
up to 250 million gallons of water per day (mgd) from the Johor River
until 2061
• Cost: 3 sen per 1000 gallons of raw water
• Cost to treat 1000 gallons of raw water: RM 2.40
• 1990: construction of the Linggiu Dam for additional water to be drawn on
top of the 250mgd
Copyright National University of Singapore
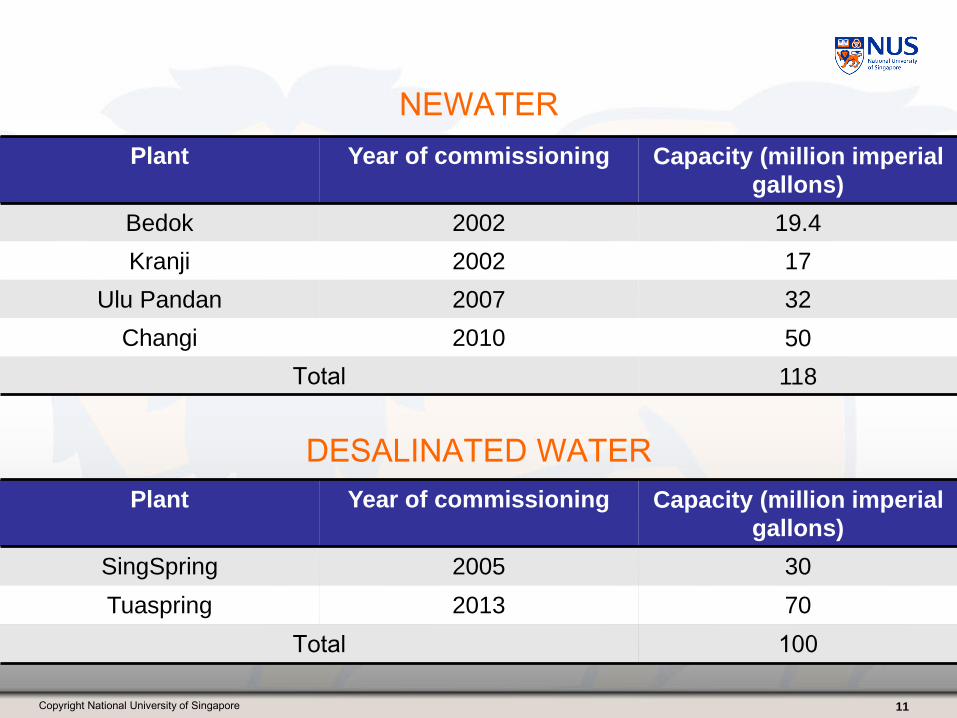
NEWATER
11
Plant Year of commissioning Capacity (million imperial
gallons)
Bedok 2002 19.4
Kranji 2002 17
Ulu Pandan 2007 32
Changi 2010 50
Total 118
DESALINATED WATER
Plant Year of commissioning Capacity (million imperial
gallons)
SingSpring 2005 30
Tuaspring 2013 70
Total 100
Copyright National University of Singapore
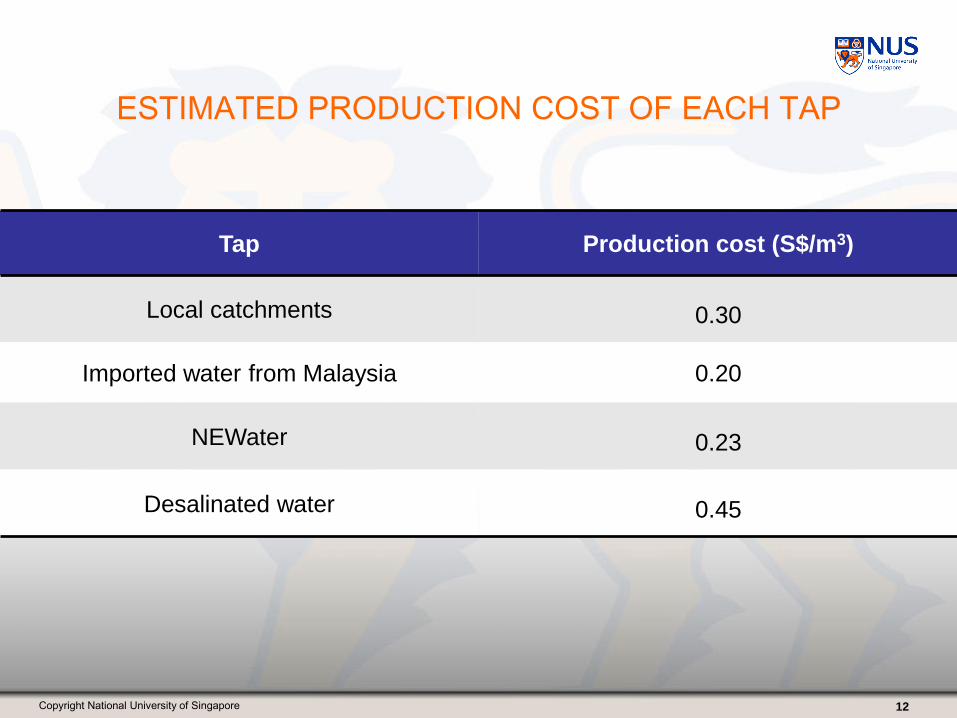
ESTIMATED PRODUCTION COST OF EACH TAP
12
Tap Production cost (S$/m3)
Local catchments 0.30
Imported water from Malaysia 0.20
NEWater 0.23
Desalinated water 0.45
Copyright National University of Singapore
ALTERNATE SOURCES OF WATER
• Rainwater Harvesting
• Greywater Recycling
“Greywater”: untreated used water which has not come into contact with
toilet waste
• Use of Seawater
13
Copyright National University of Singapore
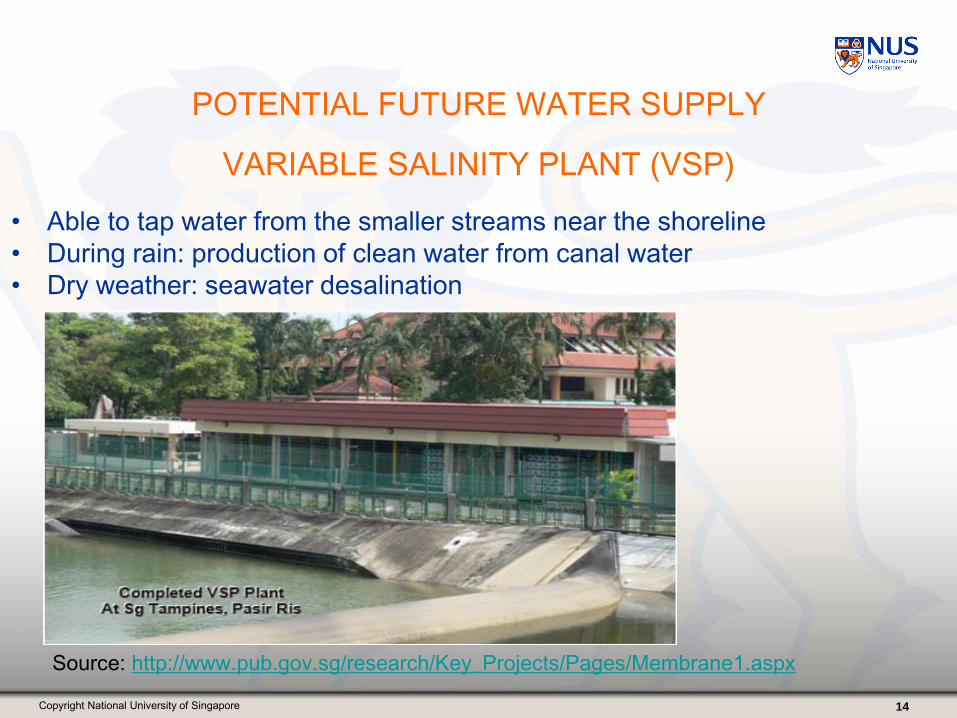
POTENTIAL FUTURE WATER SUPPLY
VARIABLE SALINITY PLANT (VSP)
14
• Able to tap water from the smaller streams near the shoreline
• During rain: production of clean water from canal water
• Dry weather: seawater desalination
Source: http://www.pub.gov.sg/research/Key_Projects/Pages/Membrane1.aspx
Copyright National University of Singapore
GROUNDWATER
15
WATER FROM INDONESIA
• 1991: agreement to provide 1000mgd of water ($0.01/m3) to Singapore from
Riau in Indonesia via undersea pipelines
• 1992: joint venture created to develop supply of water from Bintan and to
Bintan and neighboring Riau Islands but project came to a halt due to
political uncertainty in Indonesia
• Western and Southern parts of the island: Jurong Formation
• Consultancy services:
Development of groundwater flow model of Jurong Formation
Field Investigation Programme
Validation Study
• Jurong island
Copyright National University of Singapore
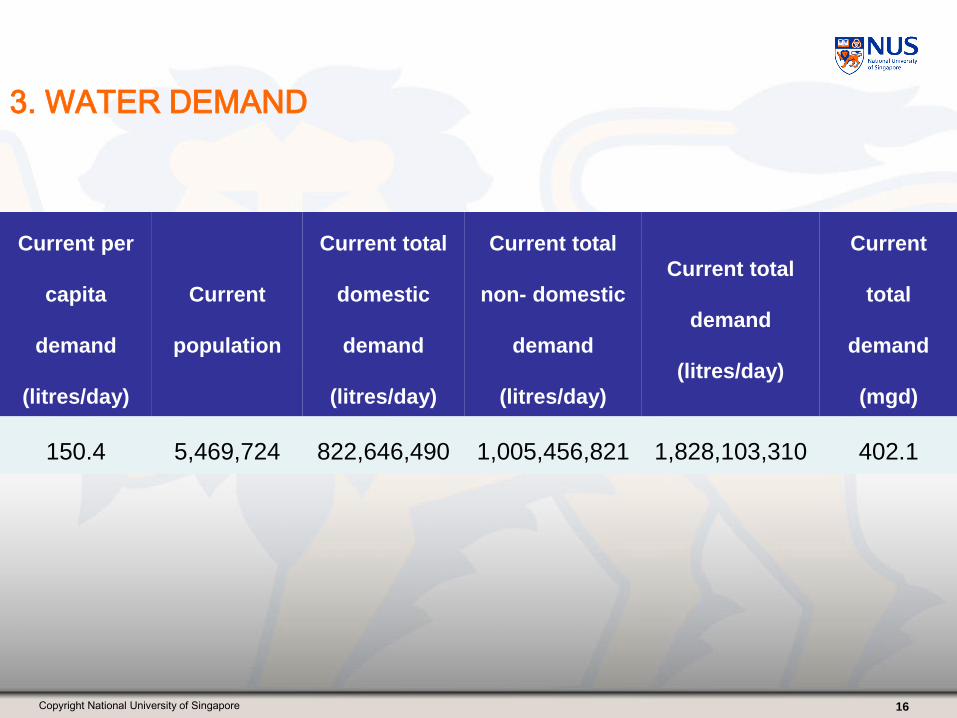
3. WATER DEMAND
16
Current per
capita
demand
(litres/day)
Current
population
Current total
domestic
demand
(litres/day)
Current total
non- domestic
demand
(litres/day)
Current total
demand
(litres/day)
Current
total
demand
(mgd)
150.4 5,469,724 822,646,490 1,005,456,821 1,828,103,310 402.1
Copyright National University of Singapore
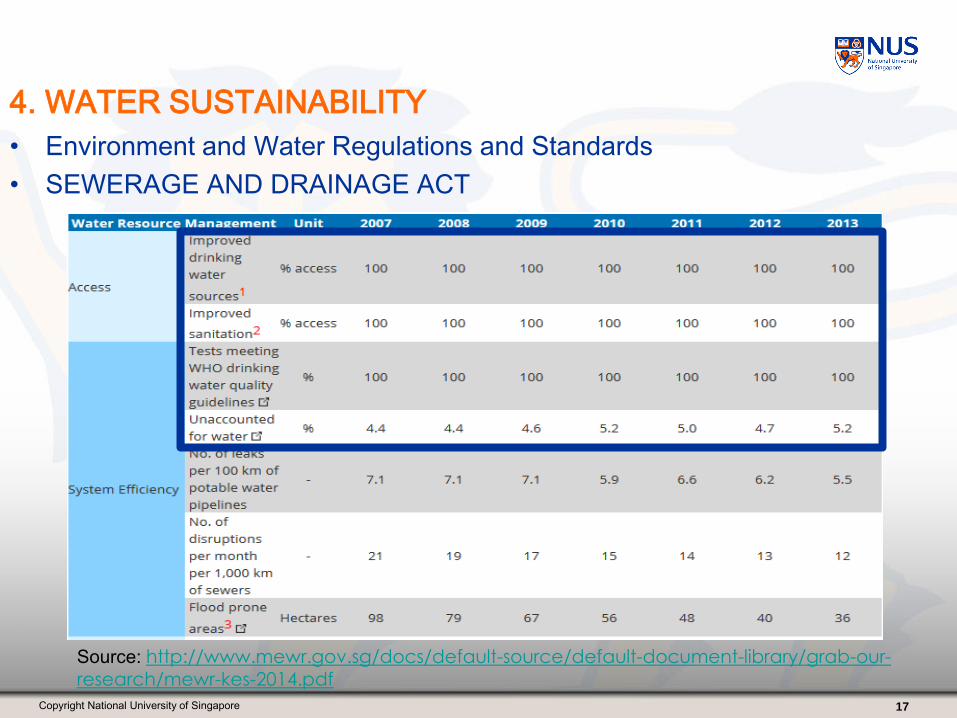
4. WATER SUSTAINABILITY
• Environment and Water Regulations and Standards
• SEWERAGE AND DRAINAGE ACT
17
Source: http://www.mewr.gov.sg/docs/default-source/default-document-library/grab-our-
research/mewr-kes-2014.pdf
Copyright National University of Singapore
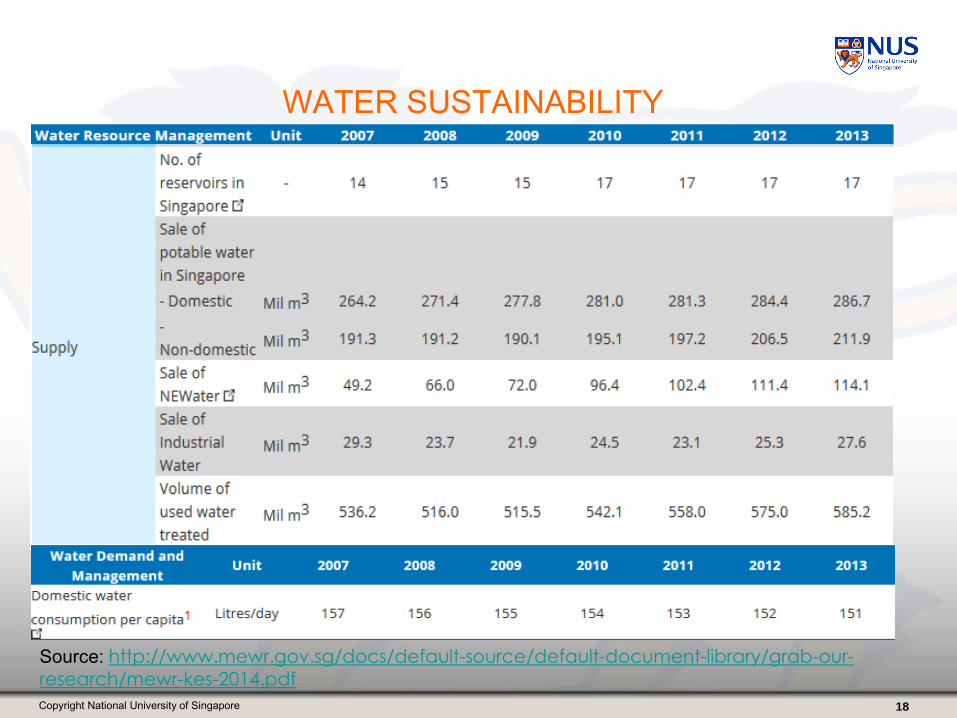
WATER SUSTAINABILITY
18
Source: http://www.mewr.gov.sg/docs/default-source/default-document-library/grab-our-
research/mewr-kes-2014.pdf
Copyright National University of Singapore
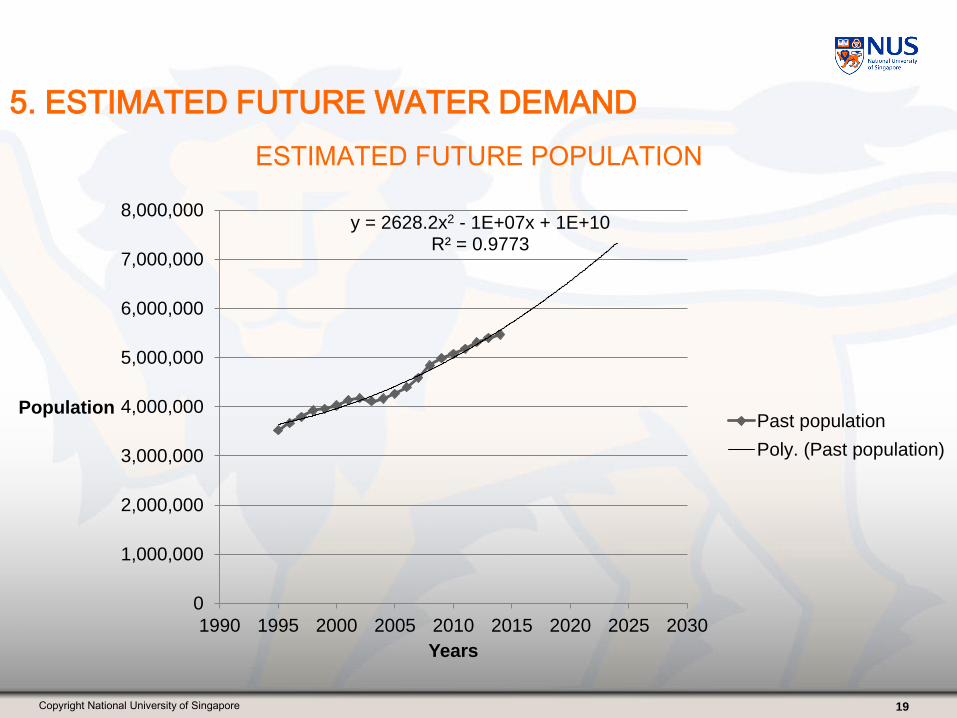
5. ESTIMATED FUTURE WATER DEMAND
19
ESTIMATED FUTURE POPULATION
y = 2628.2x2 - 1E+07x + 1E+10R² = 0.9773
0
1,000,000
2,000,000
3,000,000
4,000,000
5,000,000
6,000,000
7,000,000
8,000,000
1990 1995 2000 2005 2010 2015 2020 2025 2030
Population
Years
Past population
Poly. (Past population)
Copyright National University of Singapore
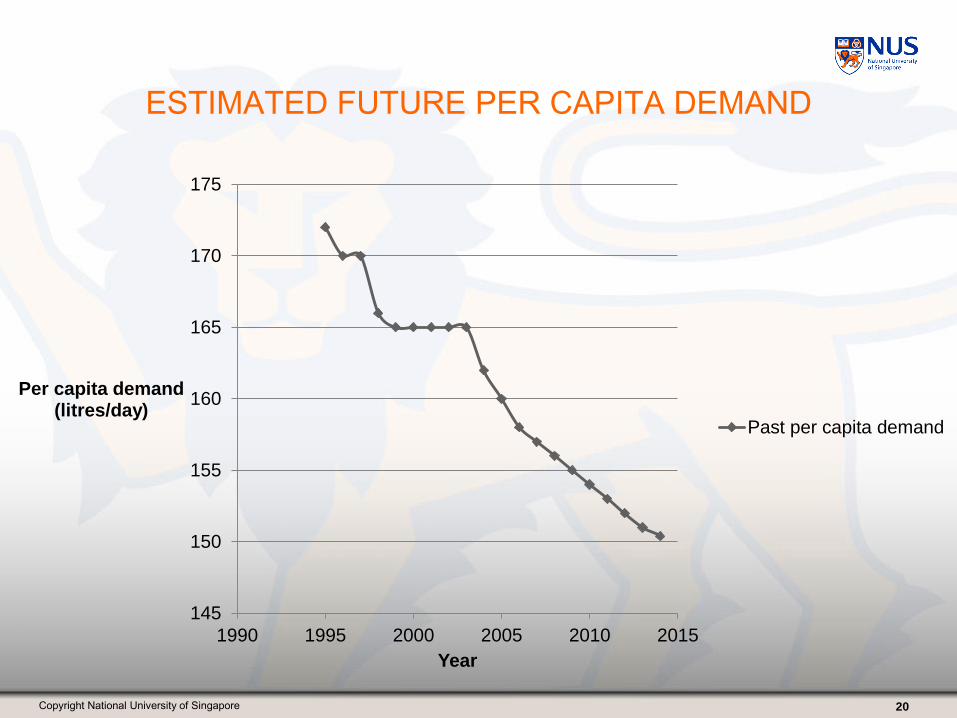
ESTIMATED FUTURE PER CAPITA DEMAND
20
145
150
155
160
165
170
175
1990 1995 2000 2005 2010 2015
Per capita demand (litres/day)
Year
Past per capita demand
Copyright National University of Singapore
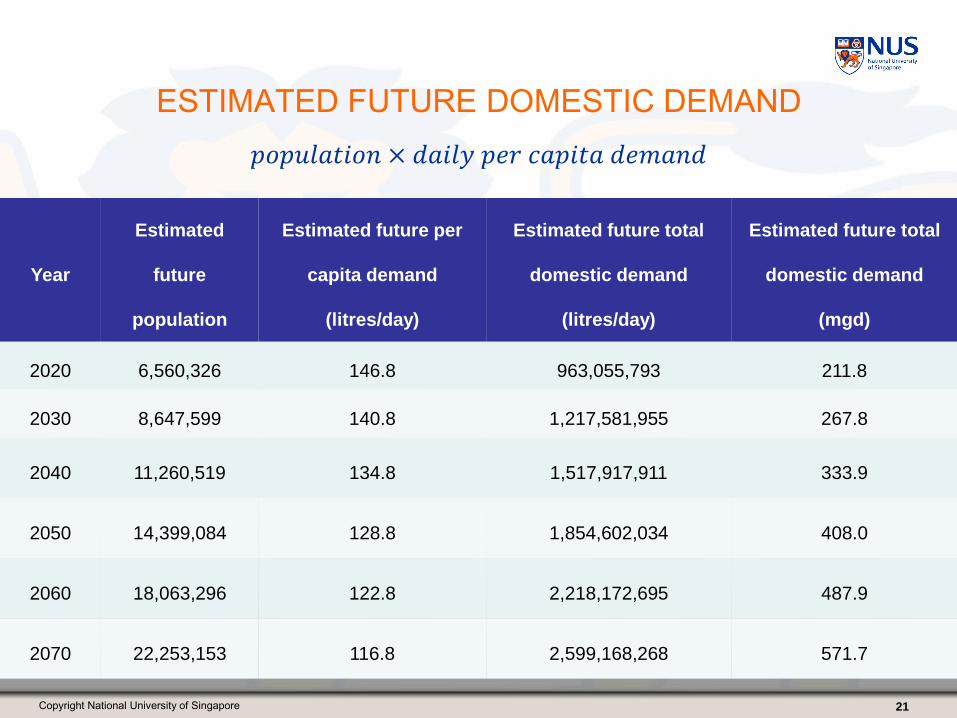
ESTIMATED FUTURE DOMESTIC DEMAND
21
𝑝𝑜𝑝𝑢𝑙𝑎𝑡𝑖𝑜𝑛 × 𝑑𝑎𝑖𝑙𝑦 𝑝𝑒𝑟 𝑐𝑎𝑝𝑖𝑡𝑎 𝑑𝑒𝑚𝑎𝑛𝑑
Year
Estimated
future
population
Estimated future per
capita demand
(litres/day)
Estimated future total
domestic demand
(litres/day)
Estimated future total
domestic demand
(mgd)
2020 6,560,326 146.8 963,055,793 211.8
2030 8,647,599 140.8 1,217,581,955 267.8
2040 11,260,519 134.8 1,517,917,911 333.9
2050 14,399,084 128.8 1,854,602,034 408.0
2060 18,063,296 122.8 2,218,172,695 487.9
2070 22,253,153 116.8 2,599,168,268 571.7
Copyright National University of Singapore
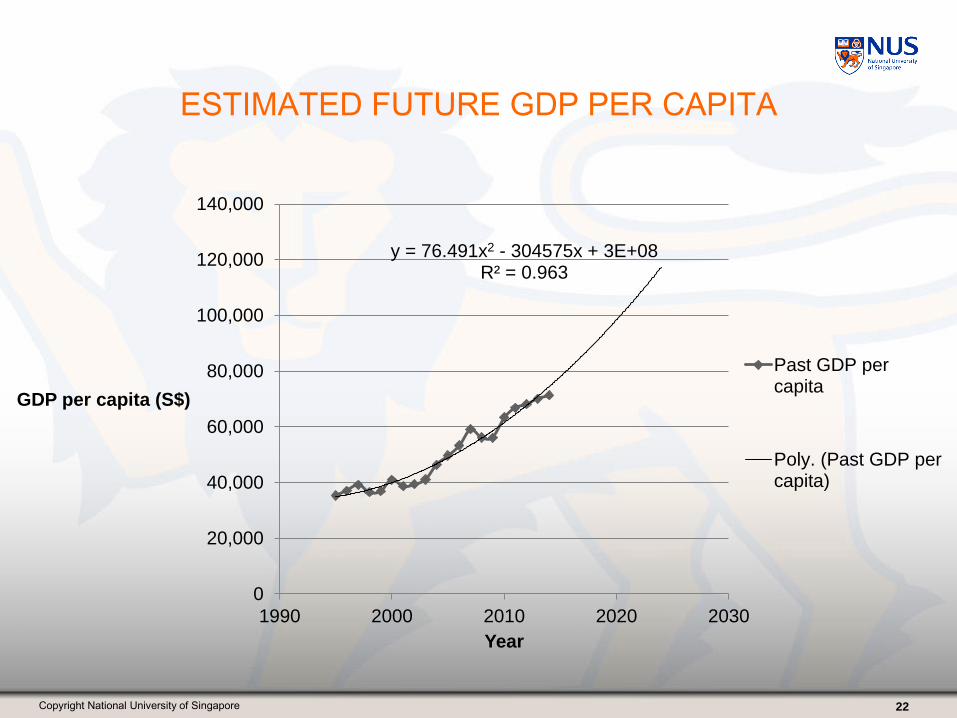
ESTIMATED FUTURE GDP PER CAPITA
22
y = 76.491x2 - 304575x + 3E+08R² = 0.963
0
20,000
40,000
60,000
80,000
100,000
120,000
140,000
1990 2000 2010 2020 2030
GDP per capita (S$)
Year
Past GDP percapita
Poly. (Past GDP percapita)
Copyright National University of Singapore
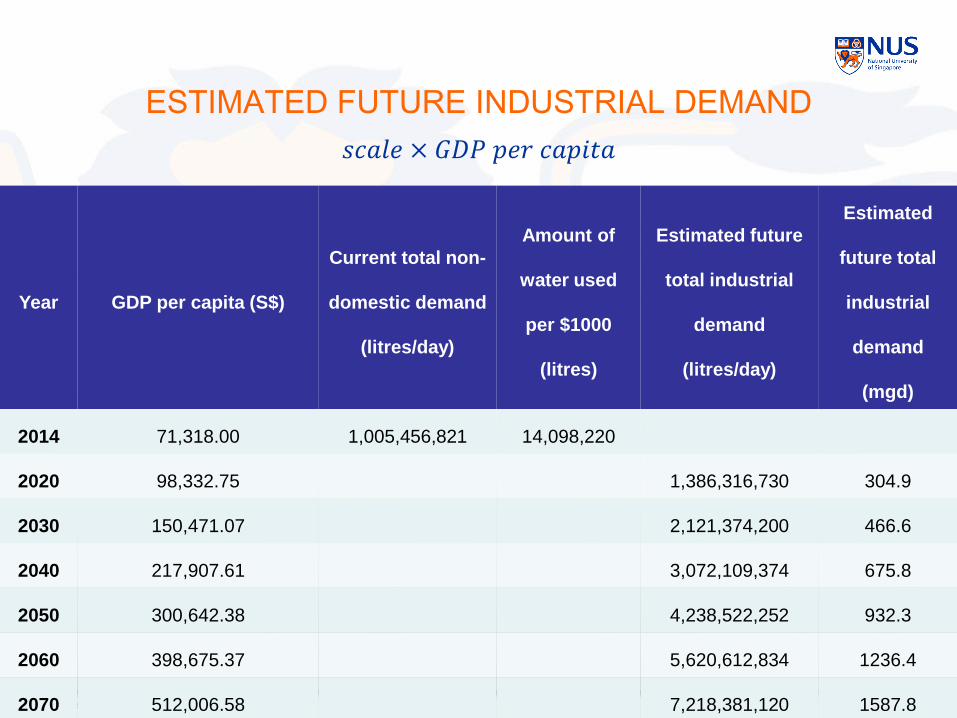
ESTIMATED FUTURE INDUSTRIAL DEMAND
23
Year GDP per capita (S$)
Current total non-
domestic demand
(litres/day)
Amount of
water used
per $1000
(litres)
Estimated future
total industrial
demand
(litres/day)
Estimated
future total
industrial
demand
(mgd)
2014 71,318.00 1,005,456,821 14,098,220
2020 98,332.75 1,386,316,730 304.9
2030 150,471.07 2,121,374,200 466.6
2040 217,907.61 3,072,109,374 675.8
2050 300,642.38 4,238,522,252 932.3
2060 398,675.37 5,620,612,834 1236.4
2070 512,006.58 7,218,381,120 1587.8
𝑠𝑐𝑎𝑙𝑒 × 𝐺𝐷𝑃 𝑝𝑒𝑟 𝑐𝑎𝑝𝑖𝑡𝑎
Copyright National University of Singapore
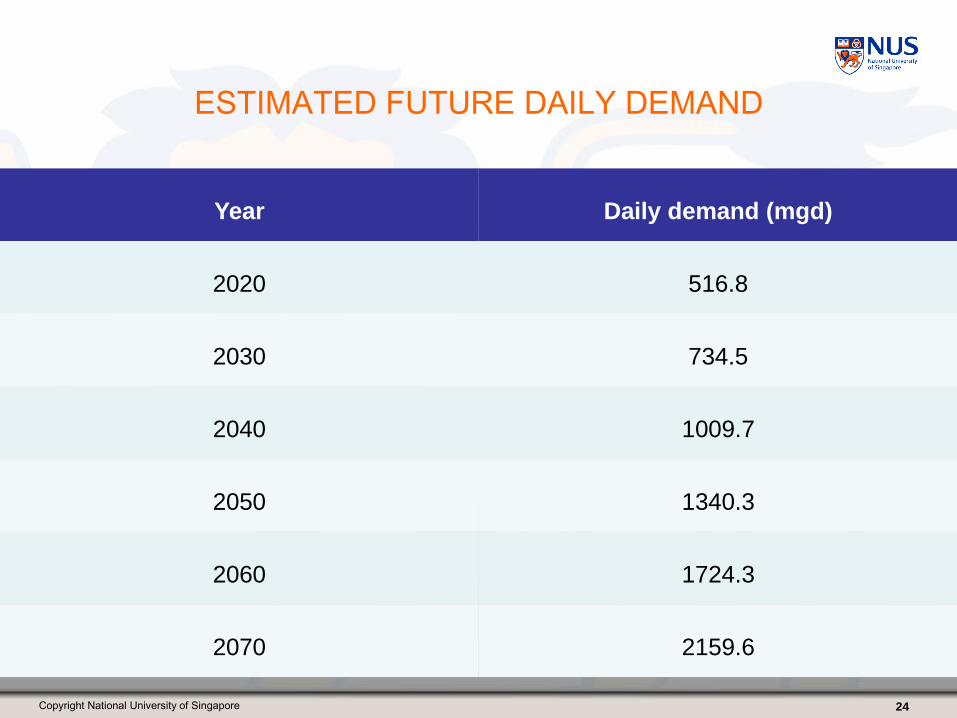
ESTIMATED FUTURE DAILY DEMAND
24
Year Daily demand (mgd)
2020 516.8
2030 734.5
2040 1009.7
2050 1340.3
2060 1724.3
2070 2159.6
Copyright National University of Singapore
6. ESTIMATED FUTURE SUPPLY
25
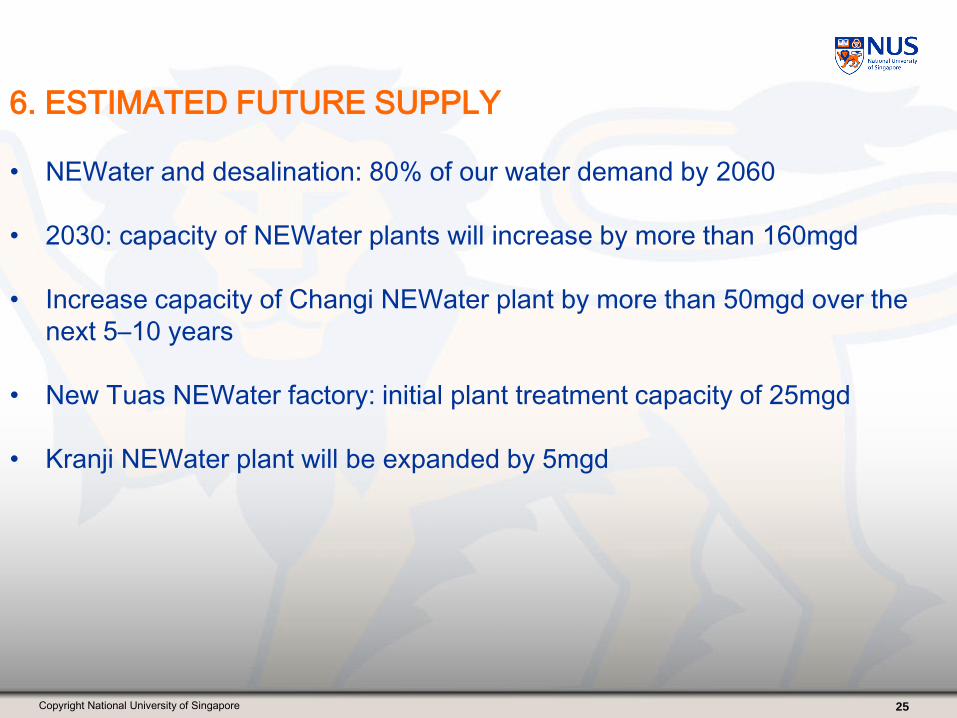
• NEWater and desalination: 80% of our water demand by 2060
• 2030: capacity of NEWater plants will increase by more than 160mgd
• Increase capacity of Changi NEWater plant by more than 50mgd over the
next 5–10 years
• New Tuas NEWater factory: initial plant treatment capacity of 25mgd
• Kranji NEWater plant will be expanded by 5mgd
Copyright National University of Singapore
7. SUSTAINABILITY INDEX
26
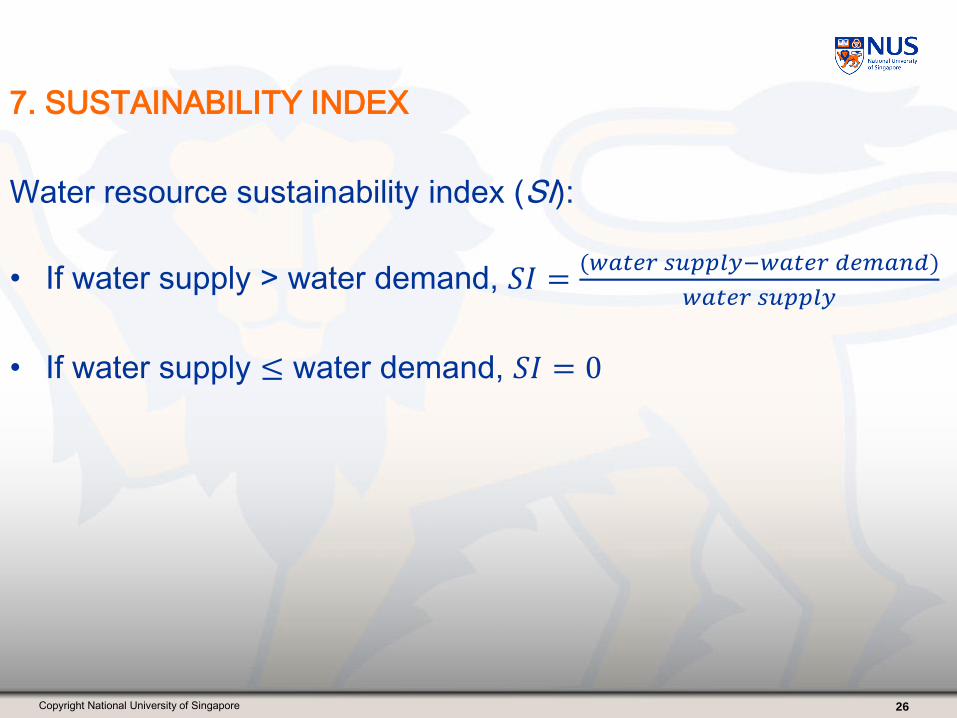
Water resource sustainability index (SI):
• If water supply > water demand, 𝑆𝐼 =(𝑤𝑎𝑡𝑒𝑟 𝑠𝑢𝑝𝑝𝑙𝑦−𝑤𝑎𝑡𝑒𝑟 𝑑𝑒𝑚𝑎𝑛𝑑)
𝑤𝑎𝑡𝑒𝑟 𝑠𝑢𝑝𝑝𝑙𝑦
• If water supply ≤ water demand, 𝑆𝐼 = 0
Copyright National University of Singapore
8. DISCUSSION
27
FUTURE DEMAND
• Actual population dependent on birth/death rates, immigration/emigration
rates
• Future per capita demand may not follow a linear trend; affected by weather
and conservation measures implemented
• GDP: an economic way of forecasting annual growth rate
• Results based on extrapolation: the further the estimated year, the more
uncertainty
Copyright National University of Singapore 28
FUTURE SUPPLY
• Most possible future sources of water supply: local catchment, NEWater and
desalination
• Water import from Malaysia: past unsuccessful negotiations and the
complex relationship between the two countries
• Water import from Indonesia: high construction cost; project delayed for a
long time with no update
Copyright National University of Singapore
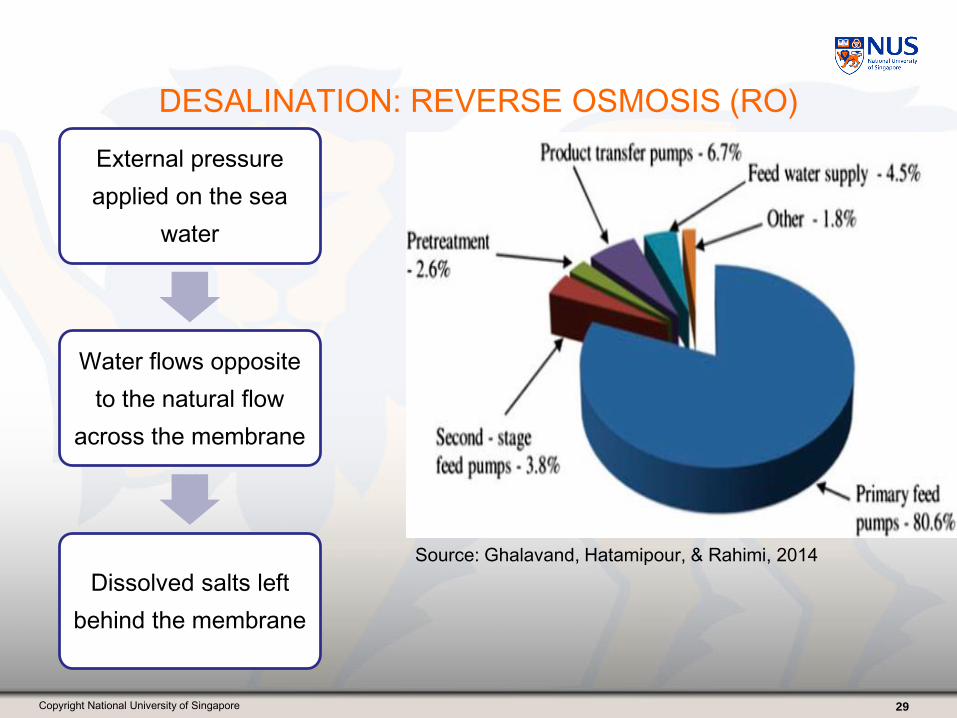
DESALINATION: REVERSE OSMOSIS (RO)
29
External pressure
applied on the sea
water
Water flows opposite
to the natural flow
across the membrane
Dissolved salts left
behind the membrane
Source: Ghalavand, Hatamipour, & Rahimi, 2014
Copyright National University of Singapore
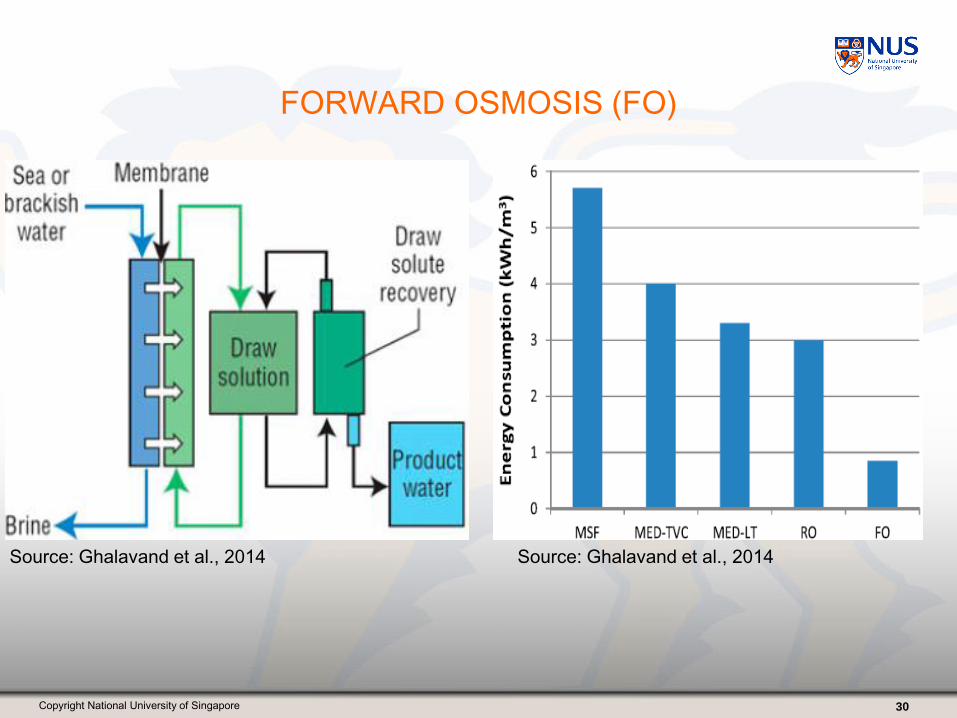
FORWARD OSMOSIS (FO)
30
Source: Ghalavand et al., 2014 Source: Ghalavand et al., 2014
Copyright National University of Singapore
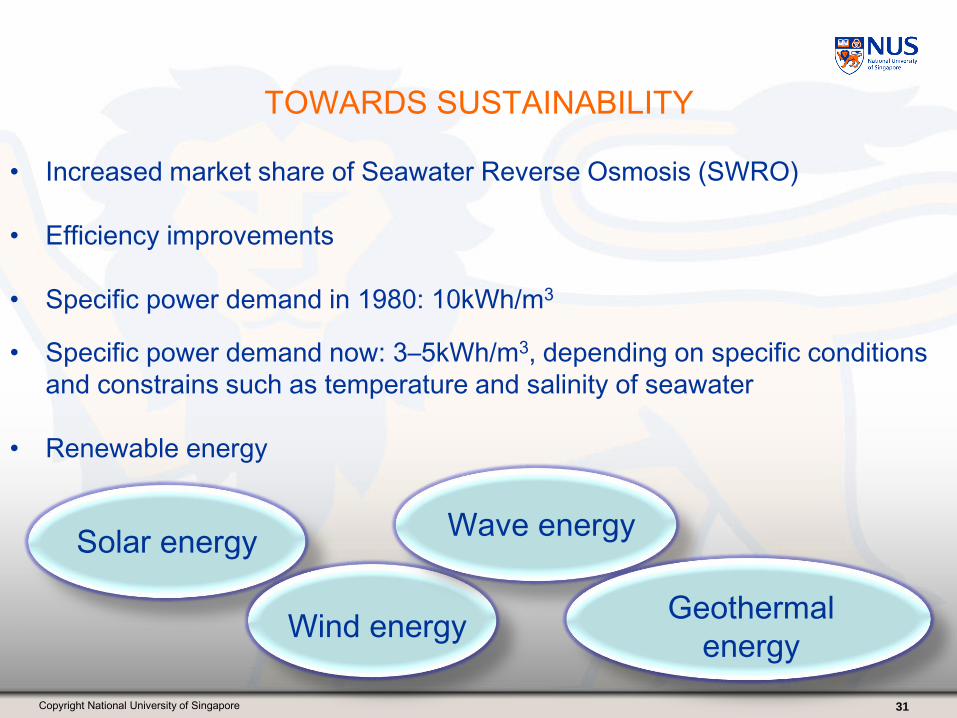
TOWARDS SUSTAINABILITY
31
• Increased market share of Seawater Reverse Osmosis (SWRO)
• Efficiency improvements
• Specific power demand in 1980: 10kWh/m3
• Specific power demand now: 3–5kWh/m3, depending on specific conditions
and constrains such as temperature and salinity of seawater
• Renewable energy
Solar energy
Wind energy
Wave energy
Geothermal
energy
Copyright National University of Singapore
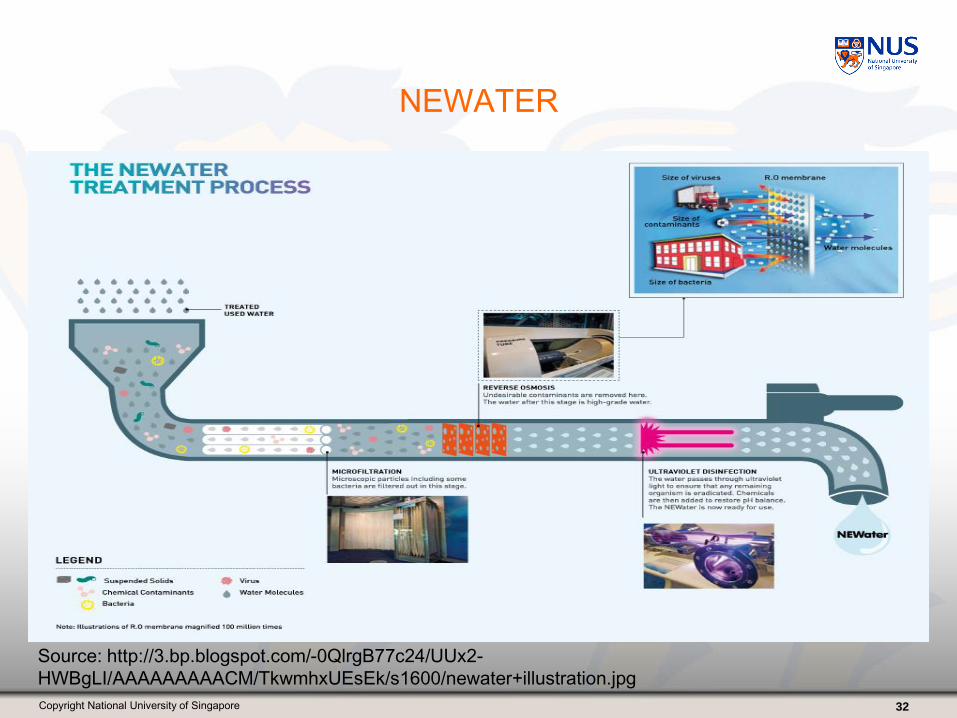
NEWATER
32
Source: http://3.bp.blogspot.com/-0QlrgB77c24/UUx2-
HWBgLI/AAAAAAAAACM/TkwmhxUEsEk/s1600/newater+illustration.jpg
Copyright National University of Singapore
9. CONCLUSION
33
• PUB: water supply and sustainability
• Sustainability of the local catchment depends on the weather
• Desalination and NEWater : researches on decreased energy use
• Extrapolation of data: greater uncertainties for results in the further years
• Comparison of the current demand among different countries to have a
better idea of the water demand situation of Singapore
• System dynamics has been widely used in water resources planning and
management
𝑝𝑜𝑝𝑢𝑙𝑎𝑡𝑖𝑜𝑛 × 𝑑𝑎𝑖𝑙𝑦 𝑝𝑒𝑟 𝑐𝑎𝑝𝑖𝑡𝑎 𝑑𝑒𝑚𝑎𝑛𝑑

Thank You
Q&A
Related Documents